
Cross-Platform Evaluation of Commercially Targeted and Untargeted Metabolomics Approaches to Optimize the Investigation of Psychiatric Disease

 , ,
, ,  ,
,
Abstract
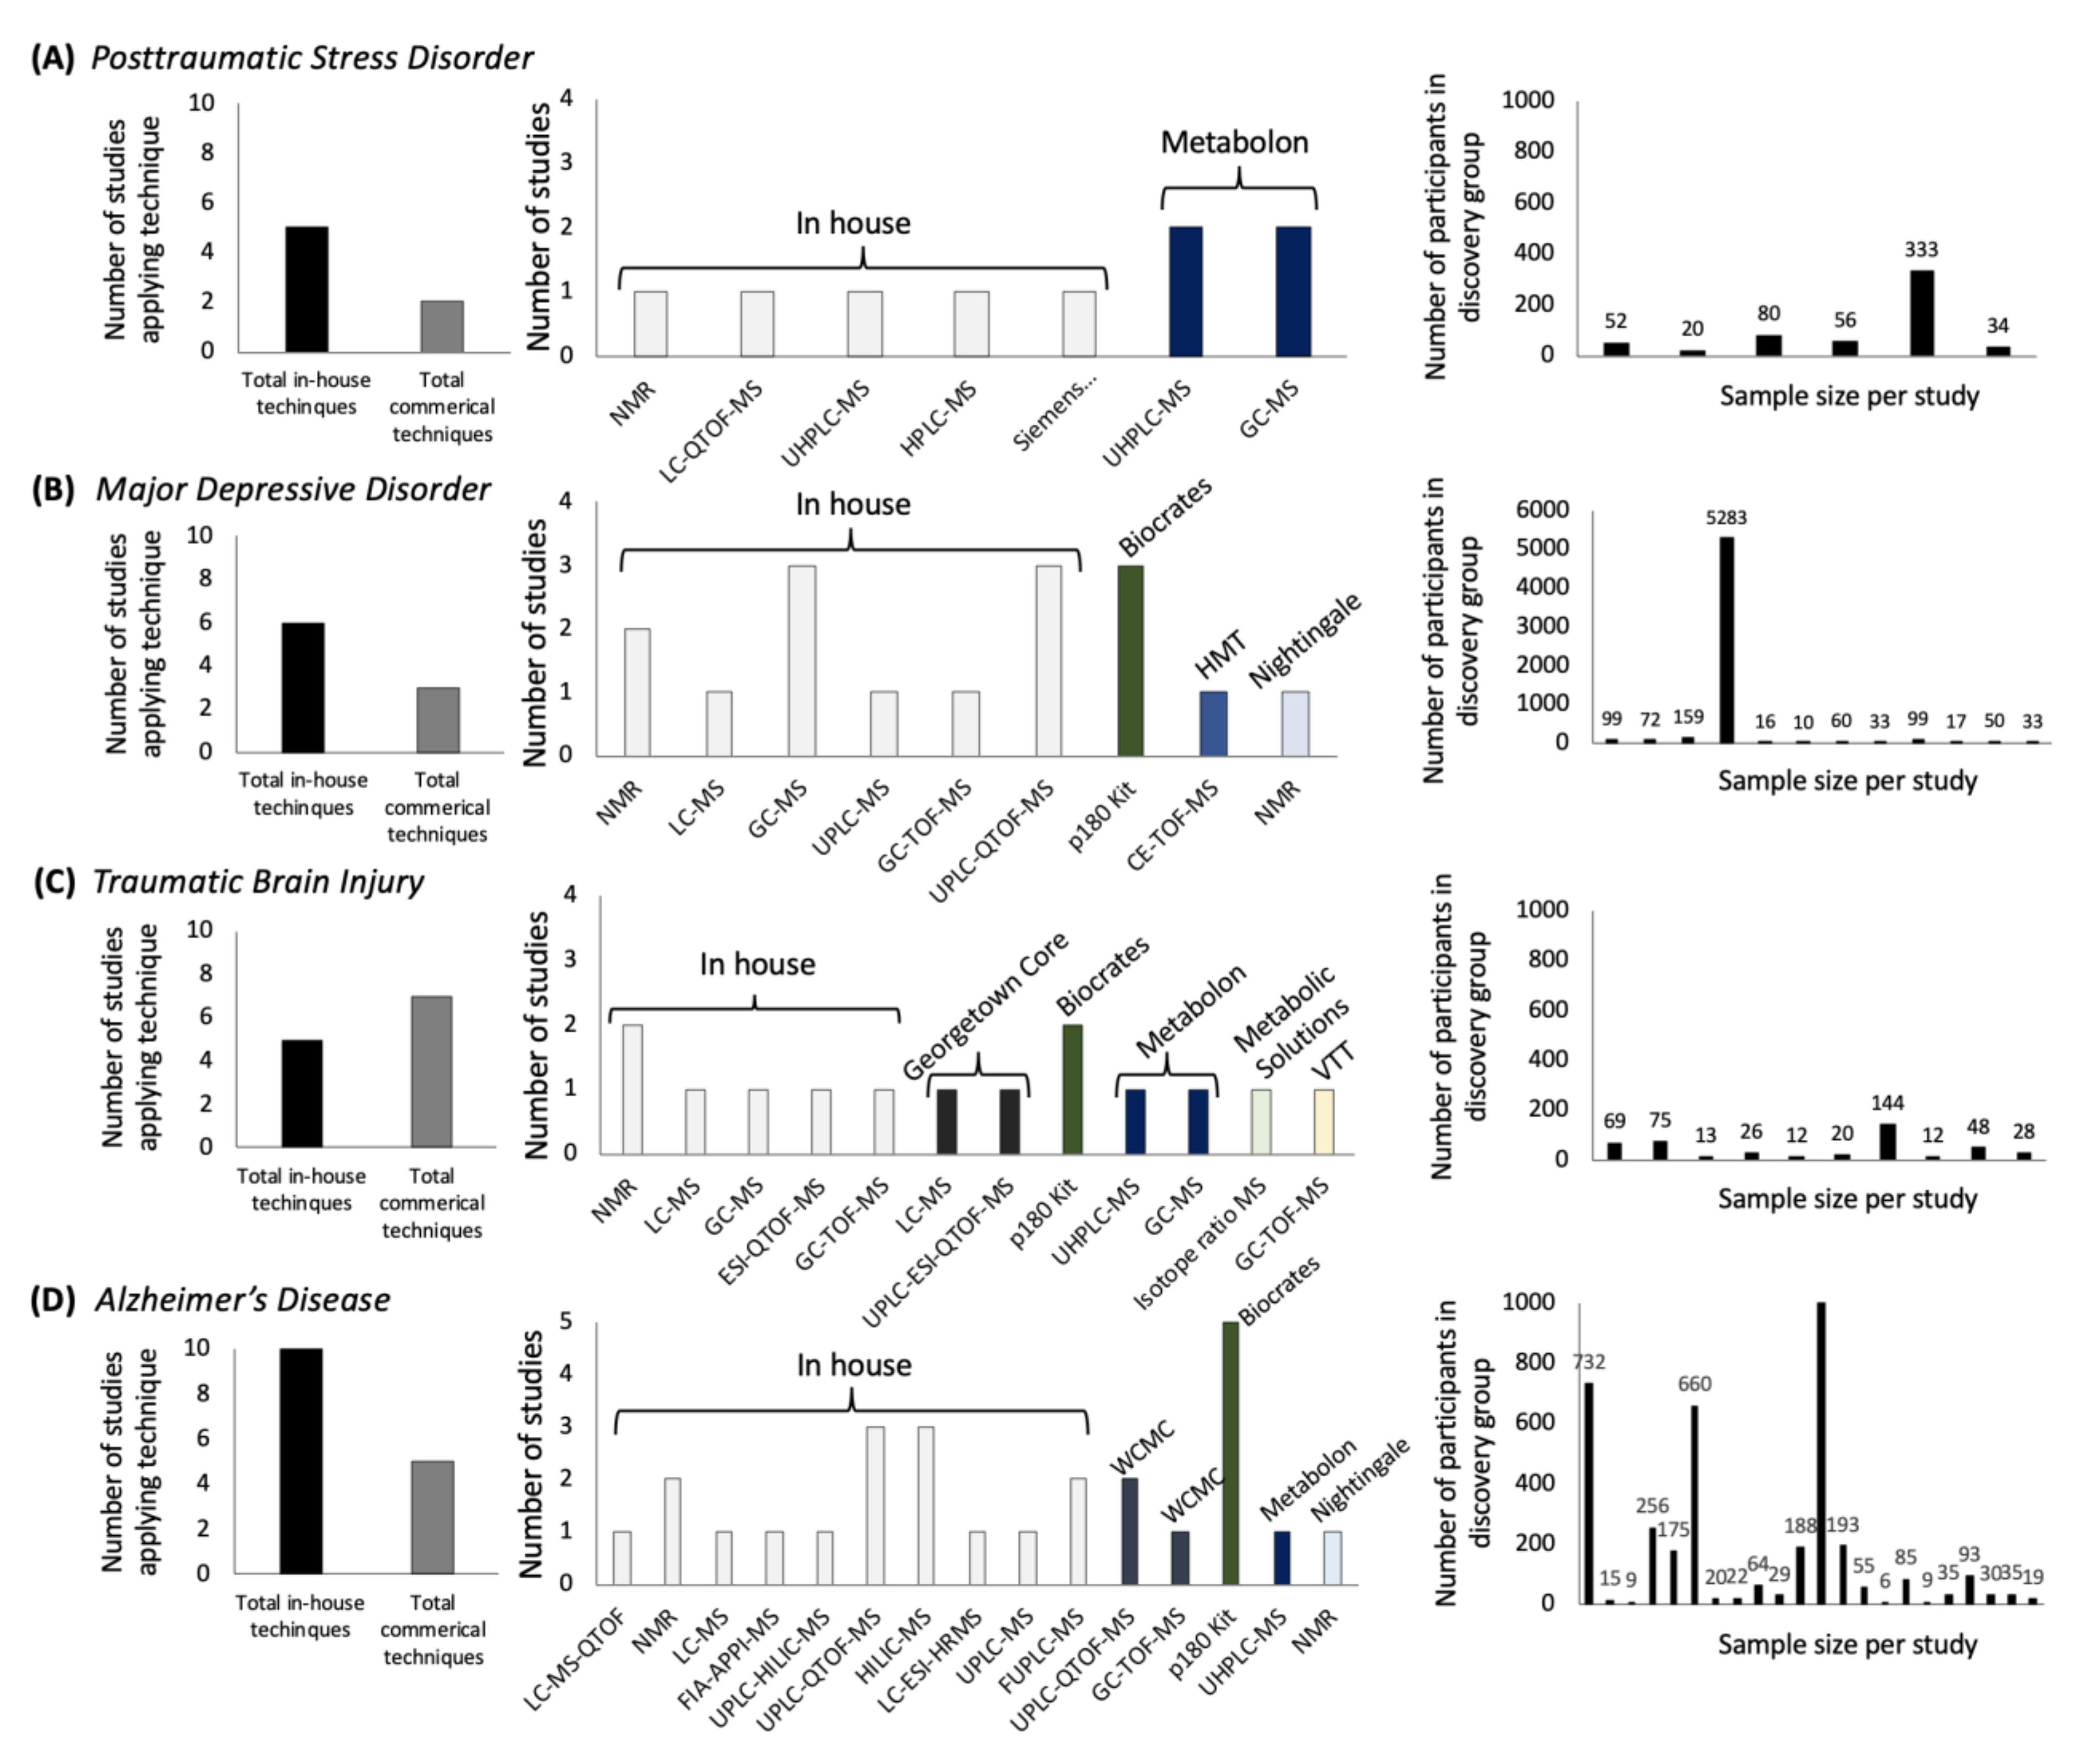
:1. Introduction
2. Results
2.1. Metabolites Affected in PTSD
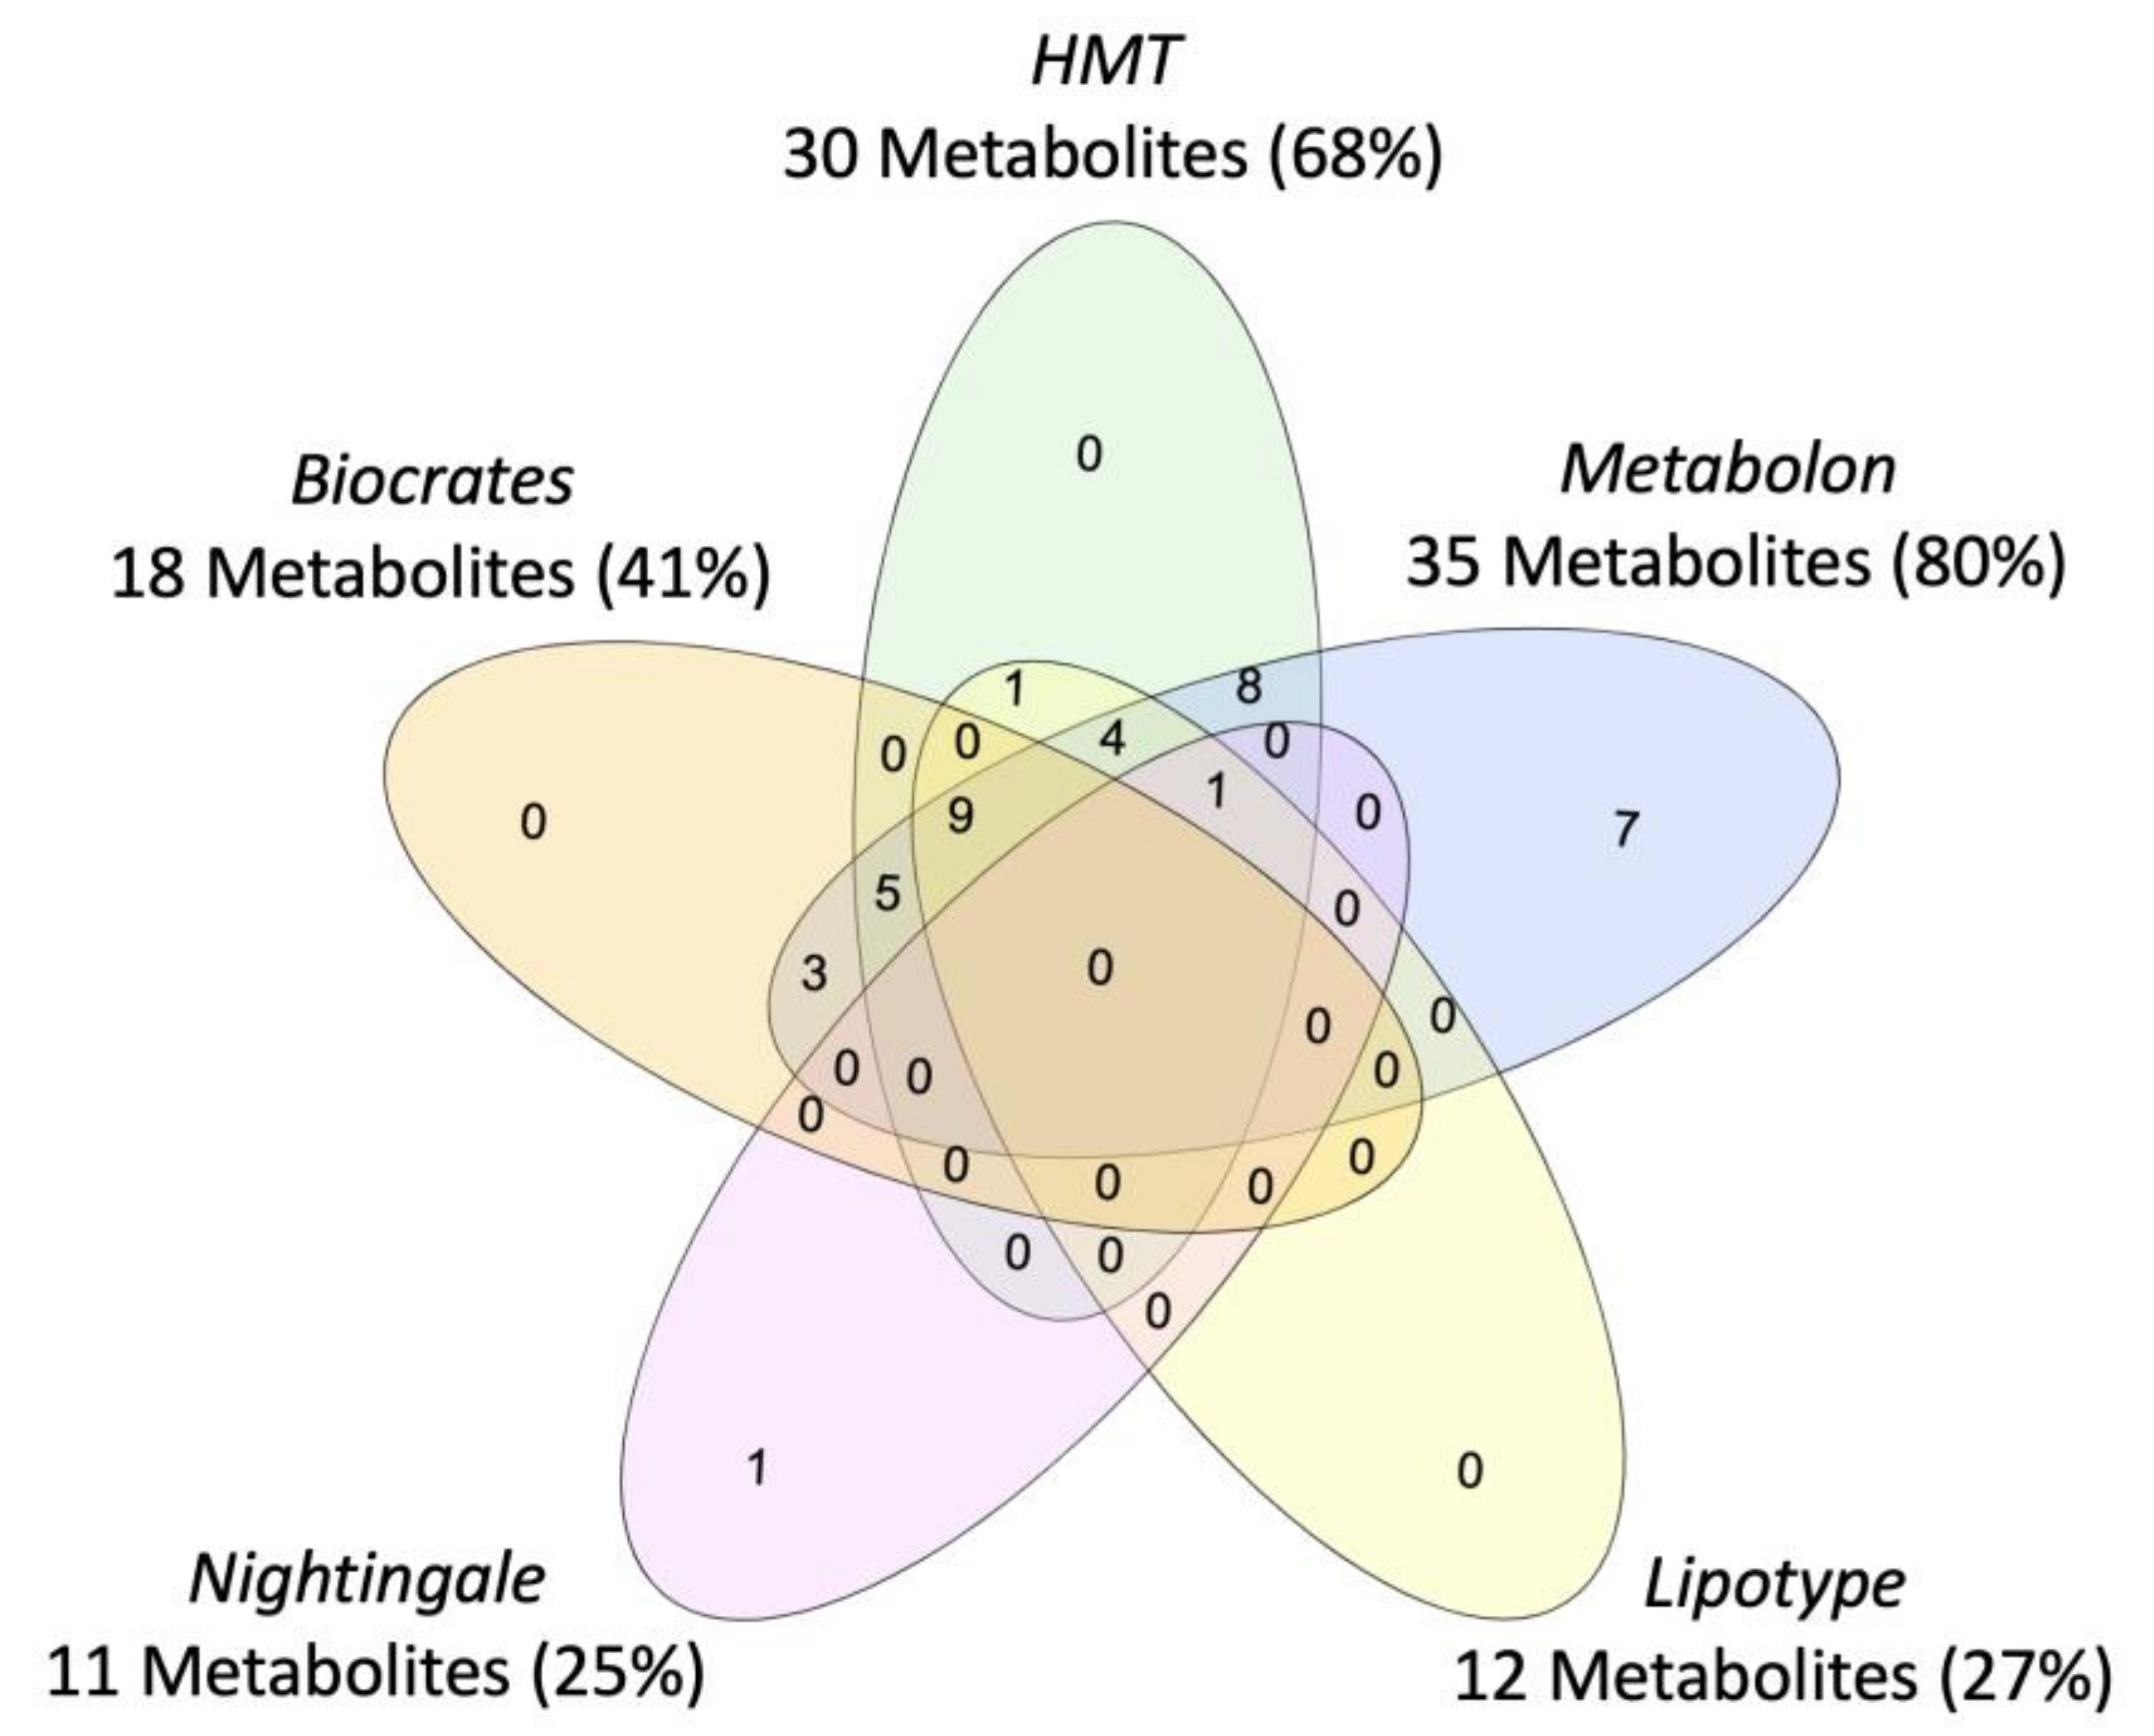
2.2. Metabolite Coverage across Platforms
2.3. Measurement Precision: Intra-Assay and Inter-Assay Coefficients of Variation
2.4. Measurement Accuracy: Comparison to Known Values in NIST Reference Plasma
3. Discussion
4. Methods
4.1. Cross-Platform Comparison Design: Platforms Selected
4.2. Cross-Platform Comparison Design: Clinical, Control, and Pooled Reference Plasma Samples
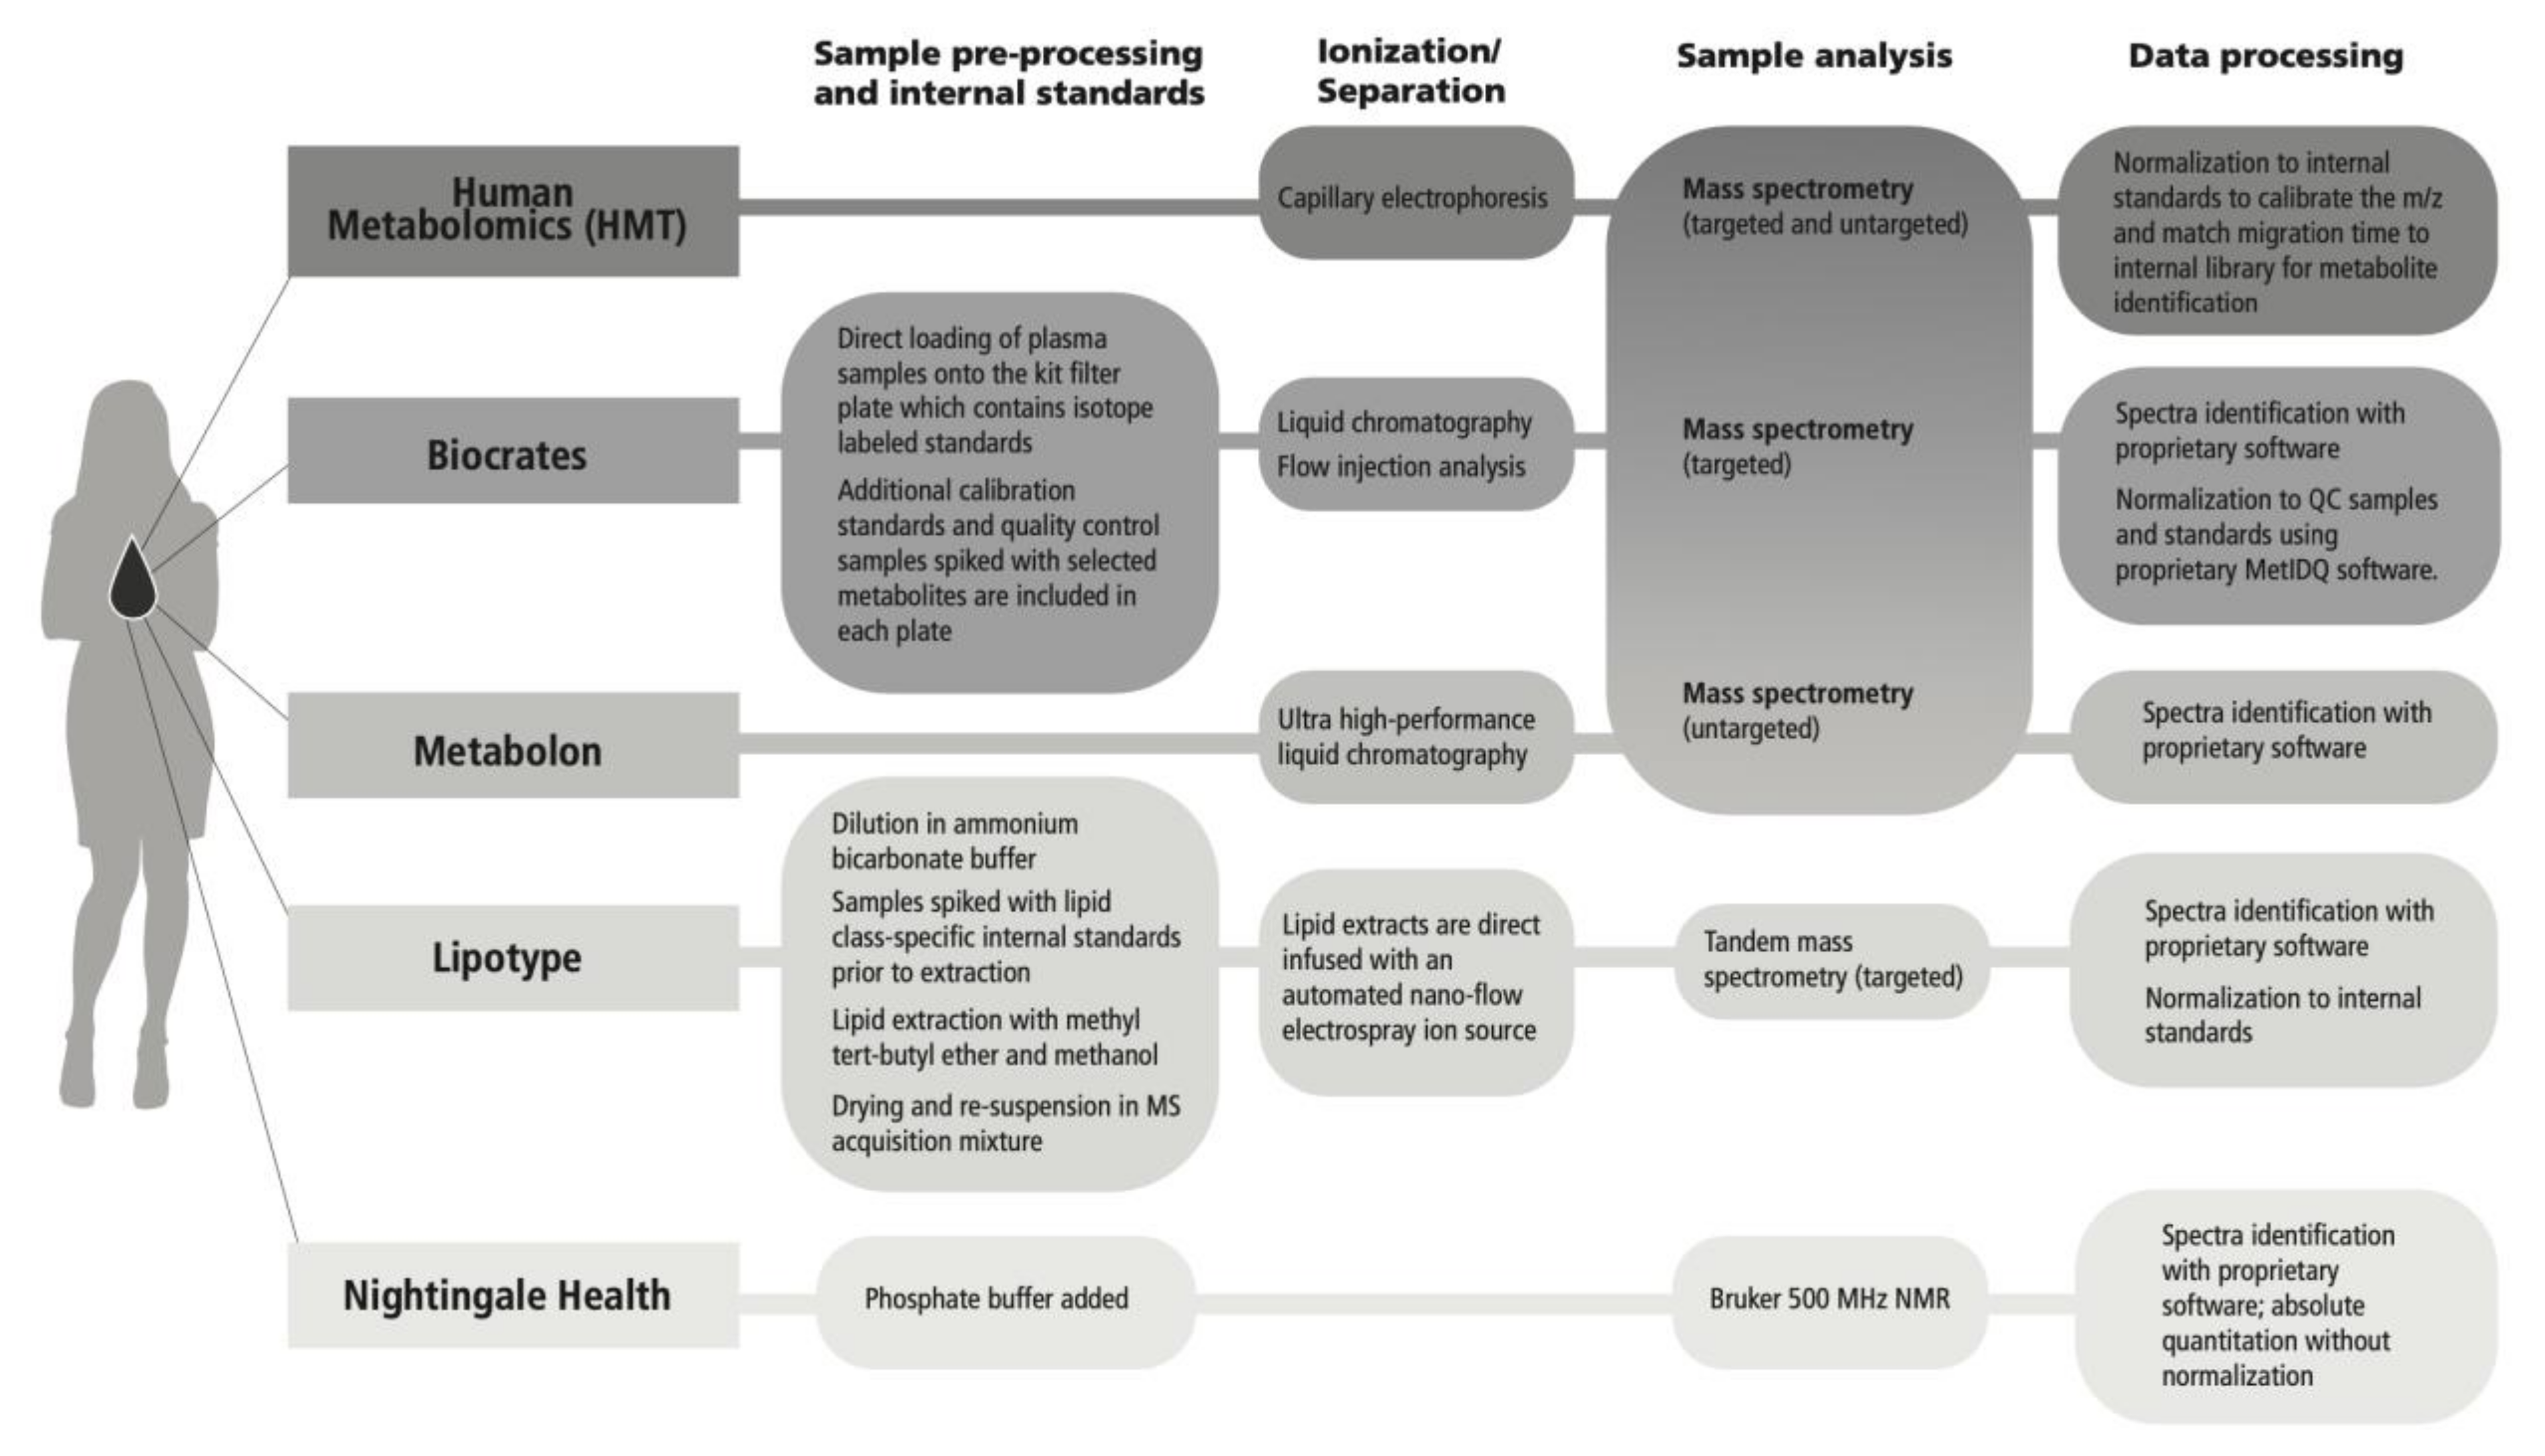
4.3. Metabolomics Analytical Platforms
4.4. Metabolites Affected in Posttraumatic Stress Disorder (PTSD)
4.5. Metabolite Coverage and the Nomenclature across Platforms
4.6. Measurement Precision: Intra-Assay and Inter-Assay Coefficients of Variation
4.7. Measurement Accuracy: Comparison to Known Values in the National Institute of Standards and Technology (NIST) Reference Plasma
4.8. Data Analysis and Visualization
5. Conclusions
Supplementary Materials
Author Contributions
Funding
Institutional Review Board Statement
Informed Consent Statement
Data Availability Statement
Acknowledgments
Conflicts of Interest
Disclaimer
Definitions
References
- Wishart, D.S. Emerging applications of metabolomics in drug discovery and precision medicine. Nat. Rev. Drug Discov. 2016, 15, 473–484. [Google Scholar] [CrossRef] [PubMed]
- Dettmer, K.; Aronov, P.A.; Hammock, B.D. Mass spectrometry-based metabolomics. Mass Spectrom. Rev. 2007, 26, 51–78. [Google Scholar] [CrossRef] [PubMed]
- Howie, H.; Rijal, C.M.; Ressler, K.J. A review of epigenetic contributions to post-traumatic stress disorder. Dialogues Clin. Neurosci. 2019, 21, 417–428. [Google Scholar] [CrossRef] [PubMed]
- Villaseñor, A.; Ramamoorthy, A.; Silva dos Santos, M.; Lorenzo, M.P.; Laje, G.; Zarate, C.; Barbas, C.; Wainer, I.W. A pilot study of plasma metabolomic patterns from patients treated with ketamine for bipolar depression: Evidence for a response-related difference in mitochondrial networks: Metabolomics of ketamine response in depression. Br. J. Pharmacol. 2014, 171, 2230–2242. [Google Scholar] [CrossRef]
- Lusczek, E.R.; Myers, C.; Popovsky, K.; Mulier, K.; Beilman, G.; Sawyer, R. Plasma metabolomics pilot study suggests age and sex-based differences in the metabolic response to traumatic injury. Injury 2018, 49, 2178–2185. [Google Scholar] [CrossRef]
- Monte, A.A.; Brocker, C.; Nebert, D.W.; Gonzalez, F.J.; Thompson, D.C.; Vasiliou, V. Improved drug therapy: Triangulating phenomics with genomics and metabolomics. Hum. Genom. 2014, 8, 16. [Google Scholar] [CrossRef]
- Dean, K.R.; Hammamieh, R.; Mellon, S.H.; Abu-Amara, D.; Flory, J.D.; Guffanti, G.; Wang, K.; Daigle, B.J.; Gautam, A.; Lee, I.; et al. Multi-omic biomarker identification and validation for diagnosing warzone-related post-traumatic stress disorder. Mol. Psychiatry 2020, 25, 3337–3349. [Google Scholar] [CrossRef]
- Contrepois, K.; Mahmoudi, S.; Ubhi, B.K.; Papsdorf, K.; Hornburg, D.; Brunet, A.; Snyder, M. Cross-Platform Comparison of Untargeted and Targeted Lipidomics Approaches on Aging Mouse Plasma. Sci. Rep. 2018, 8, 17747. [Google Scholar] [CrossRef]
- Chen, L.; Zhong, F.; Zhu, J. Bridging Targeted and Untargeted Mass Spectrometry-Based Metabolomics via Hybrid Approaches. Metabolites 2020, 10, 348. [Google Scholar] [CrossRef]
- Ribbenstedt, A.; Ziarrusta, H.; Benskin, J.P. Development, characterization and comparisons of targeted and non-targeted metabolomics methods. PLoS ONE 2018, 13, e0207082. [Google Scholar] [CrossRef]
- Wishart, D.S.; Feunang, Y.D.; Marcu, A.; Guo, A.C.; Liang, K.; Vázquez-Fresno, R.; Sajed, T.; Johnson, D.; Li, C.; Karu, N.; et al. HMDB 4.0: The human metabolome database for 2018. Nucleic Acids Res. 2018, 46, D608–D617. [Google Scholar] [CrossRef] [PubMed]
- Yet, I.; Menni, C.; Shin, S.-Y.; Mangino, M.; Soranzo, N.; Adamski, J.; Suhre, K.; Spector, T.D.; Kastenmüller, G.; Bell, J.T. Genetic Influences on Metabolite Levels: A Comparison across Metabolomic Platforms. PLoS ONE 2016, 11, e0153672. [Google Scholar] [CrossRef]
- Leuthold, P.; Schaeffeler, E.; Winter, S.; Büttner, F.; Hofmann, U.; Mürdter, T.E.; Rausch, S.; Sonntag, D.; Wahrheit, J.; Fend, F.; et al. Comprehensive Metabolomic and Lipidomic Profiling of Human Kidney Tissue: A Platform Comparison. J. Proteome Res. 2017, 16, 933–944. [Google Scholar] [CrossRef]
- Triebl, A.; Burla, B.; Selvalatchmanan, J.; Oh, J.; Tan, S.H.; Chan, M.Y.; Mellet, N.A.; Meikle, P.J.; Torta, F.; Wenk, M.R. Shared reference materials harmonize lipidomics across MS-based detection platforms and laboratories. J. Lipid Res. 2020, 61, 105–115. [Google Scholar] [CrossRef]
- Lu, W.; Su, X.; Klein, M.S.; Lewis, I.A.; Fiehn, O.; Rabinowitz, J.D. Metabolite Measurement: Pitfalls to Avoid and Practices to Follow. Annu. Rev. Biochem. 2017, 86, 277–304. [Google Scholar] [CrossRef] [PubMed]
- Galatzer-Levy, I.R.; Bryant, R.A. 636,120 Ways to Have Posttraumatic Stress Disorder. Perspect. Psychol. Sci. J. Assoc. Psychol. Sci. 2013, 8, 651–662. [Google Scholar] [CrossRef] [PubMed]
- Karabatsiakis, A.; Hamuni, G.; Wilker, S.; Kolassa, S.; Renu, D.; Kadereit, S.; Schauer, M.; Hennessy, T.; Kolassa, I.-T. Metabolite profiling in posttraumatic stress disorder. J. Mol. Psychiatry 2015, 3, 2. [Google Scholar] [CrossRef] [PubMed]
- Huguenard, C.J.C.; Cseresznye, A.; Evans, J.E.; Oberlin, S.; Langlois, H.; Ferguson, S.; Darcey, T.; Nkiliza, A.; Dretsch, M.; Mullan, M.; et al. Plasma Lipidomic Analyses in Cohorts With mTBI and/or PTSD Reveal Lipids Differentially Associated With Diagnosis and APOE ε4 Carrier Status. Front. Physiol. 2020, 11, 12. [Google Scholar] [CrossRef]
- Konjevod, M.; Tudor, L.; Svob Strac, D.; Nedic Erjavec, G.; Barbas, C.; Zarkovic, N.; Nikolac Perkovic, M.; Uzun, S.; Kozumplik, O.; Lauc, G.; et al. Metabolomic and glycomic findings in posttraumatic stress disorder. Prog. Neuropsychopharmacol. Biol. Psychiatry 2019, 88, 181–193. [Google Scholar] [CrossRef] [PubMed]
- Mellon, S.H.; Bersani, F.S.; Lindqvist, D.; Hammamieh, R.; Donohue, D.; Dean, K.; Jett, M.; Yehuda, R.; Flory, J.; Reus, V.I.; et al. Metabolomic analysis of male combat veterans with post traumatic stress disorder. PLoS ONE 2019, 14, e0213839. [Google Scholar] [CrossRef]
- Bot, M.; Milaneschi, Y.; Al-Shehri, T.; Amin, N.; Garmaeva, S.; Onderwater, G.L.J.; Pool, R.; Thesing, C.S.; Vijfhuizen, L.S.; Vogelzangs, N.; et al. Metabolomics Profile in Depression: A Pooled Analysis of 230 Metabolic Markers in 5283 Cases with Depression and 10,145 Controls. Biol. Psychiatry 2020, 87, 409–418. [Google Scholar] [CrossRef] [PubMed]
- Tynkkynen, J.; Chouraki, V.; van der Lee, S.J.; Hernesniemi, J.; Yang, Q.; Li, S.; Beiser, A.; Larson, M.G.; Sääksjärvi, K.; Shipley, M.J.; et al. Association of branched-chain amino acids and other circulating metabolites with risk of incident dementia and Alzheimer’s disease: A prospective study in eight cohorts. Alzheimers Dement. 2018, 14, 723–733. [Google Scholar] [CrossRef] [PubMed]
- Marx, V. Boost that metabolomic confidence. Nat. Methods 2020, 17, 33–36. [Google Scholar] [CrossRef]
- Smith, A.K.; Ratanatharathorn, A.; Maihofer, A.X.; Naviaux, R.K.; Aiello, A.E.; Amstadter, A.B.; Ashley-Koch, A.E.; Baker, D.G.; Beckham, J.C.; Boks, M.P.; et al. Epigenome-wide meta-analysis of PTSD across 10 military and civilian cohorts identifies methylation changes in AHRR. Nat. Commun. 2020, 11, 5965. [Google Scholar] [CrossRef]
- Somvanshi, P.R.; Mellon, S.H.; Flory, J.D.; Abu-Amara, D.; PTSD Systems Biology Consortium; Wolkowitz, O.M.; Yehuda, R.; Jett, M.; Hood, L.; Marmar, C.; et al. Mechanistic inferences on metabolic dysfunction in posttraumatic stress disorder from an integrated model and multiomic analysis: Role of glucocorticoid receptor sensitivity. Am. J. Physiol. Endocrinol. Metab. 2019, 317, E879–E898. [Google Scholar] [CrossRef]
- Konjevod, M.; Nedic Erjavec, G.; Nikolac Perkovic, M.; Sáiz, J.; Tudor, L.; Uzun, S.; Kozumplik, O.; Svob Strac, D.; Zarkovic, N.; Pivac, N. Metabolomics in posttraumatic stress disorder: Untargeted metabolomic analysis of plasma samples from Croatian war veterans. Free Radic. Biol. Med. 2021, 162, 636–641. [Google Scholar] [CrossRef]
- Zoladz, P.R.; Diamond, D.M. Current status on behavioral and biological markers of PTSD: A search for clarity in a conflicting literature. Neurosci. Biobehav. Rev. 2013, 37, 860–895. [Google Scholar] [CrossRef]
- Wang, H.; Muehlbauer, M.J.; O’Neal, S.K.; Newgard, C.B.; Hauser, E.R.; Bain, J.R.; Shah, S.H. Recommendations for Improving Identification and Quantification in Non-Targeted, GC-MS-Based Metabolomic Profiling of Human Plasma. Metabolites 2017, 7, 45. [Google Scholar] [CrossRef]
- Dudzik, D.; Barbas-Bernardos, C.; García, A.; Barbas, C. Quality assurance procedures for mass spectrometry untargeted metabolomics. a review. J. Pharm. Biomed. Anal. 2018, 147, 149–173. [Google Scholar] [CrossRef]
- Evans, A.M.; O’Donovan, C.; Playdon, M.; Beecher, C.; Beger, R.D.; Bowden, J.A.; Broadhurst, D.; Clish, C.B.; Dasari, S.; Dunn, W.B.; et al. Dissemination and analysis of the quality assurance (QA) and quality control (QC) practices of LC-MS based untargeted metabolomics practitioners. Metabolomics 2020, 16, 113. [Google Scholar] [CrossRef] [PubMed]
- Sumner, L.W.; Amberg, A.; Barrett, D.; Beale, M.H.; Beger, R.; Daykin, C.A.; Fan, T.W.-M.; Fiehn, O.; Goodacre, R.; Griffin, J.L.; et al. Proposed minimum reporting standards for chemical analysis Chemical Analysis Working Group (CAWG) Metabolomics Standards Initiative (MSI). Metabolomics 2007, 3, 211–221. [Google Scholar] [CrossRef]
- Spicer, R.A.; Salek, R.; Steinbeck, C. A decade after the metabolomics standards initiative it’s time for a revision. Sci. Data 2017, 4, 170138. [Google Scholar] [CrossRef]
- Salek, R.M.; Steinbeck, C.; Viant, M.R.; Goodacre, R.; Dunn, W.B. The role of reporting standards for metabolite annotation and identification in metabolomic studies. GigaScience 2013, 2. [Google Scholar] [CrossRef]
- Turck, C.W.; Mak, T.D.; Goudarzi, M.; Salek, R.M.; Cheema, A.K. The ABRF Metabolomics Research Group 2016 Exploratory Study: Investigation of Data Analysis Methods for Untargeted Metabolomics. Metabolites 2020, 10, 128. [Google Scholar] [CrossRef] [PubMed]
- Playdon, M.C.; Joshi, A.D.; Tabung, F.K.; Cheng, S.; Henglin, M.; Kim, A.; Lin, T.; van Roekel, E.H.; Huang, J.; Krumsiek, J.; et al. Metabolomics Analytics Workflow for Epidemiological Research: Perspectives from the Consortium of Metabolomics Studies (COMETS). Metabolites 2019, 9, 145. [Google Scholar] [CrossRef]
- Sampson, J.N.; Boca, S.M.; Shu, X.O.; Stolzenberg-Solomon, R.Z.; Matthews, C.E.; Hsing, A.W.; Tan, Y.T.; Ji, B.-T.; Chow, W.-H.; Cai, Q.; et al. Metabolomics in Epidemiology: Sources of Variability in Metabolite Measurements and Implications. Cancer Epidemiol. Biomark. Prev. 2013, 22, 631–640. [Google Scholar] [CrossRef] [PubMed]
- Carayol, M.; Licaj, I.; Achaintre, D.; Sacerdote, C.; Vineis, P.; Key, T.J.; Onland Moret, N.C.; Scalbert, A.; Rinaldi, S.; Ferrari, P. Reliability of Serum Metabolites over a Two-Year Period: A Targeted Metabolomic Approach in Fasting and Non-Fasting Samples from EPIC. PLoS ONE 2015, 10, e0135437. [Google Scholar] [CrossRef] [PubMed]
- Townsend, M.K.; Bao, Y.; Poole, E.M.; Bertrand, K.A.; Kraft, P.; Wolpin, B.M.; Clish, C.B.; Tworoger, S.S. Impact of Pre-analytic Blood Sample Collection Factors on Metabolomics. Cancer Epidemiol. Biomark. Prev. 2016, 25, 823–829. [Google Scholar] [CrossRef]
- Xue, C.; Ge, Y.; Tang, B.; Liu, Y.; Kang, P.; Wang, M.; Zhang, L. A Meta-Analysis of Risk Factors for Combat-Related PTSD among Military Personnel and Veterans. PLoS ONE 2015, 10, e0120270. [Google Scholar] [CrossRef]
- Tang, B.; Deng, Q.; Glik, D.; Dong, J.; Zhang, L. A Meta-Analysis of Risk Factors for Post-Traumatic Stress Disorder (PTSD) in Adults and Children after Earthquakes. Int. J. Environ. Res. Public. Health 2017, 14, 1537. [Google Scholar] [CrossRef]
- Nievergelt, C.M.; Maihofer, A.X.; Klengel, T.; Atkinson, E.G.; Chen, C.-Y.; Choi, K.W.; Coleman, J.R.I.; Dalvie, S.; Duncan, L.E.; Gelernter, J.; et al. International meta-analysis of PTSD genome-wide association studies identifies sex- and ancestry-specific genetic risk loci. Nat. Commun. 2019, 10, 4558. [Google Scholar] [CrossRef]
- Mizuno, Y. More than 20 years of the discovery of Park2. Neurosci. Res. 2020, 159, 3–8. [Google Scholar] [CrossRef]
- Halket, J.M.; Waterman, D.; Przyborowska, A.M.; Patel, R.K.P.; Fraser, P.D.; Bramley, P.M. Chemical derivatization and mass spectral libraries in metabolic profiling by GC/MS and LC/MS/MS. J. Exp. Bot. 2005, 56, 219–243. [Google Scholar] [CrossRef]
- Rotroff, D.M.; Corum, D.G.; Motsinger-Reif, A.; Fiehn, O.; Bottrel, N.; Drevets, W.C.; Singh, J.; Salvadore, G.; Kaddurah-Daouk, R. Metabolomic signatures of drug response phenotypes for ketamine and esketamine in subjects with refractory major depressive disorder: New mechanistic insights for rapid acting antidepressants. Transl. Psychiatry 2016, 6, e894. [Google Scholar] [CrossRef]
- Lasseter, H.C.; Provost, A.C.; Chaby, L.E.; Daskalakis, N.P.; Haas, M.; Jeromin, A. Cross-platform comparison of highly sensitive immunoassay technologies for cytokine markers: Platform performance in post-traumatic stress disorder and Parkinson’s disease. Cytokine X 2020, 2, 100027. [Google Scholar] [CrossRef] [PubMed]
- Emwas, A.-H.; Roy, R.; McKay, R.T.; Tenori, L.; Saccenti, E.; Gowda, G.A.N.; Raftery, D.; Alahmari, F.; Jaremko, L.; Jaremko, M.; et al. NMR Spectroscopy for Metabolomics Research. Metabolites 2019, 9, 123. [Google Scholar] [CrossRef] [PubMed]
- Hinz, C.; Liggi, S.; Griffin, J.L. The potential of Ion Mobility Mass Spectrometry for high-throughput and high-resolution lipidomics. Curr. Opin. Chem. Biol. 2018, 42, 42–50. [Google Scholar] [CrossRef]
- Lísa, M.; Cífková, E.; Khalikova, M.; Ovčačíková, M.; Holčapek, M. Lipidomic analysis of biological samples: Comparison of liquid chromatography, supercritical fluid chromatography and direct infusion mass spectrometry methods. J. Chromatogr. A 2017, 1525, 96–108. [Google Scholar] [CrossRef] [PubMed]
- Harkewicz, R.; Dennis, E.A. Applications of Mass Spectrometry to Lipids and Membranes. Annu. Rev. Biochem. 2011, 80, 301–325. [Google Scholar] [CrossRef] [PubMed]
- Han, X.; Gross, R.W. Shotgun lipidomics: Electrospray ionization mass spectrometric analysis and quantitation of cellular lipidomes directly from crude extracts of biological samples. Mass Spectrom. Rev. 2005, 24, 367–412. [Google Scholar] [CrossRef]
- Heberle, H.; Meirelles, G.; da Silva, F.; Telles, G.; Minghim, R. InteractiVenn: A web-based tool for the analysis of sets through Venn diagrams. BMC Bioinform. 2015, 16, 169. [Google Scholar] [CrossRef] [PubMed]
- Hrydziuszko, O.; Viant, M.R. Missing values in mass spectrometry based metabolomics: An undervalued step in the data processing pipeline. Metabolomics 2012, 8, 161–174. [Google Scholar] [CrossRef]
- Jin, Z.; Kang, J.; Yu, T. Missing value imputation for LC-MS metabolomics data by incorporating metabolic network and adduct ion relations. Bioinformatics 2018, 34, 1555–1561. [Google Scholar] [CrossRef]
- Wei, R.; Wang, J.; Su, M.; Jia, E.; Chen, S.; Chen, T.; Ni, Y. Missing Value Imputation Approach for Mass Spectrometry-based Metabolomics Data. Sci. Rep. 2018, 8, 663. [Google Scholar] [CrossRef] [PubMed]
- Gromski, P.S.; Xu, Y.; Kotze, H.L.; Correa, E.; Ellis, D.I.; Armitage, E.G.; Turner, M.L.; Goodacre, R. Influence of Missing Values Substitutes on Multivariate Analysis of Metabolomics Data. Metabolites 2014, 4, 433–452. [Google Scholar] [CrossRef] [PubMed]
- Di Guida, R.; Engel, J.; Allwood, J.W.; Weber, R.J.M.; Jones, M.R.; Sommer, U.; Viant, M.R.; Dunn, W.B. Non-targeted UHPLC-MS metabolomic data processing methods: A comparative investigation of normalisation, missing value imputation, transformation and scaling. Metabolomics 2016, 12, 93. [Google Scholar] [CrossRef]
- Okuzumi, A.; Hatano, T.; Ueno, S.-I.; Ogawa, T.; Saiki, S.; Mori, A.; Koinuma, T.; Oji, Y.; Ishikawa, K.-I.; Fujimaki, M.; et al. Metabolomics-based identification of metabolic alterations in PARK2. Ann. Clin. Transl. Neurol. 2019, 6, 525–536. [Google Scholar] [CrossRef]
- Bryleva, E.Y.; Brundin, L. Kynurenine pathway metabolites and suicidality. Neuropharmacology 2017, 112, 324–330. [Google Scholar] [CrossRef]


| Intra-Assay Precision: Shipment 1 | |||||||||||||||||||||
|---|---|---|---|---|---|---|---|---|---|---|---|---|---|---|---|---|---|---|---|---|---|
| PTSD Average CV% | Control Average CV% | Count | Range | SD | PTSD Average CV% | Control Average CV% | Count | SD | PTSD Average CV% | Control Average CV% | Count | SD | PTSD Average CV% | Control Average CV% | Count | SD | PTSD Average CV% | Control Average CV% | Count | SD | |
| Metabolite Class | Biocrates | HMT | Nightingale | Lipotype | Metabolon | ||||||||||||||||
| Acylcarnitines | 10.33 | 9.88 | 14 | 2.07–76.09 | 15.67 | 5.66 | 5.81 | 35 | 7.43 | 9.03 | 8.39 | 21 | 7.70 | ||||||||
| Amino Acids | 3.53 | 8.12 | 40 | 0.87–19.01 | 3.14 | 6.85 | 6.93 | 22 | 2.56 | 2.78 | 6.01 | 9 | 3.76 | 8.84 | 9.56 | 52 | 8.22 | ||||
| Amino Acid Related | 3.44 | 8.71 | 1.73–12.88 | 3.21 | |||||||||||||||||
| Carboxylic Acids | 3.85 | 7.20 | 2 | 2.70–8.02 | 2.25 | 5.10 | 5.62 | 8 | 2.83 | 2.99 | 6.66 | 3 | 2.38 | 11.32 | 9.13 | 101 | 13.59 | ||||
| Cholesteryl ester | 8.46 | 14.69 | 18 | 3.42–48.13 | 8.44 | 4.23 | 13.30 | 13 | 6.84 | 4.63 | 4.00 | 26 | 2.20 | ||||||||
| Diglycerides | 8.46 | 12.28 | 14 | 1.95–36.34 | 7.53 | 4.84 | 9.80 | 2 | 3.38 | 4.29 | 4.00 | 19 | 2.73 | ||||||||
| Diazines | 21.00 | 18.45 | 3 | 21.16 | 15.39 | 13.46 | 5 | 12.60 | |||||||||||||
| Organonitrogen compounds | 7.29 | 9.37 | 13 | 5.02 | 15.55 | 11.3 | 14 | 12.61 | |||||||||||||
| Purine nucleotides | 9.69 | 16.16 | 5 | 9.32 | 14.18 | 12.48 | 10 | 8.09 | |||||||||||||
| Organooxygen compounds | 12.03 | 9.63 | 6 | 7.35 | 1.04 | 6.44 | 2 | 4.07 | 9.19 | 9.90 | 6 | 8.38 | |||||||||
| Hydroxy acids and derivatives | 4.04 | 6.79 | 5 | 2.47 | 0.88 | 3.05 | 1 | NA | 11.28 | 11.80 | 16 | 10.81 | |||||||||
| Keto acids and derivatives | 1.62 | 5.52 | 3 | 2.24 | 4.29 | 26.20 | 2 | 18.87 | 8.35 | 8.18 | 13 | 4.94 | |||||||||
| Ceramides | 6.53 | 8.60 | 25 | 0.59–29.33 | 5.33 | 11.36 | 10.43 | 5 | 4.62 | 5.03 | 6.77 | 2 | 3.06 | 7.22 | 7.10 | 11 | 5.55 | ||||
| Lactosylceramide | 19.98 | 15.25 | 13 | 13.62 | 10.15 | 14.99 | 12 | 10.36 | |||||||||||||
| Glucosylceramide | 21.84 | 19.55 | 13 | 11.15 | |||||||||||||||||
| Dihexosylceramides | 10.30 | 9.78 | 10 | 2.45–34.65 | 7.59 | ||||||||||||||||
| Trihexosylceramides | 14.16 | 17.94 | 6 | 4.69–43.82 | 11.60 | ||||||||||||||||
| Dihydroceramide | 19.07 | 17.15 | 12 | 14.73 | |||||||||||||||||
| Hexosylceramide | 9.56 | 11.32 | 19 | 1.33–27.20 | 5.81 | 6.28 | 8.33 | 12 | 4.34 | ||||||||||||
| Triglycerides | 7.33 | 13.27 | 235 | 0.78–38.42 | 3.72 | 4.88 | 6.49 | 32 | 2.46 | 1.92 | 5.96 | 21 | 2.19 | ||||||||
| Hormones/Steroids | 2.53 | 6.43 | 3 | 1.48–7.15 | 2.34 | 5.88 | 6.28 | 9 | 4.77 | 8.65 | 6.18 | 26 | 3.79 | ||||||||
| Fatty Acids | 8.10 | 8.16 | 7 | 3.63–11.43 | 2.60 | 6.92 | 9.11 | 32 | 4.97 | 27.57 | 3.89 | 2 | 15.39 | 3.58 | 3.53 | 29 | 2.15 | ||||
| Fatty Acyls | 28.92 | 29.75 | 4 | 19.76 | 18.17 | 13.20 | 83 | 12.09 | |||||||||||||
| Biogenic Amines | 4.74 | 10.52 | 3 | 3.19–11.69 | 3.47 | ||||||||||||||||
| Bile Acids | 5.84 | 7.73 | 12 | 2.48–12.04 | 2.77 | 4.66 | 6.47 | 4 | 7.22 | 11.42 | 8.94 | 22 | 6.95 | ||||||||
| Indoles and Derivatives | 3.36 | 10.40 | 3 | 2.69–14.21 | 4.56 | 6.51 | 7.37 | 1 | NA | 7.45 | 5.82 | 9 | 3.97 | ||||||||
| Lysophosphatidyl-cholines (LPC) | 13.05 | 11.32 | 14 | 0.91–36.05 | 10.66 | 3.34 | 3.71 | 27 | 1.69 | 4.38 | 14.44 | 6 | 5.36 | 7.28 | 10.10 | 15 | 5.14 | ||||
| Glycerophosphocholines | 7.09 | 7.76 | 19 | 10.79 | |||||||||||||||||
| Phosphatidyl-cholines (PC) | 7.98 | 9.78 | 73 | 1.78–67.84 | 9.56 | 7.96 | 11.15 | 63 | 5.22 | 8.12 | 5.98 | 18 | 4.44 | ||||||||
| Sphingomyelins | 3.89 | 7.68 | 15 | 1.88–11.73 | 2.64 | 5.79 | 8.62 | 12 | 2.89 | 3.45 | 3.05 | 12 | 1.79 | ||||||||
| Sphingolipids | 14.28 | 13.47 | 12 | 10.86 | 6.13 | 7.79 | 2 | 2.11 | |||||||||||||
| Sphinganine | 6 | ||||||||||||||||||||
| Sphingosine | 11.76 | 12.89 | 6 | 9.48 | |||||||||||||||||
| Glycerophospholipids | 10.41 | 9.67 | 15 | 8.70 | 19.61 | 22.64 | 7 | 16.45 | |||||||||||||
| Glycerolipids (Monoacylglycerol) | 21.69 | 26.95 | 25 | 14.48 | |||||||||||||||||
| Carboximidic acids and derivatives | 4.93 | 4.33 | 1 | NA | 15.21 | 17.34 | 4 | 10.22 | |||||||||||||
| lyso-Phosphatidylethanolamine (LPE) | 10.36 | 8.40 | 22 | 7.95 | 8.83 | 15.24 | 9 | 5.24 | 5.18 | 6.38 | 8 | 4.88 | |||||||||
| Phosphatidylcholine (-ether) (LPC-O) | 13.02 | 16.40 | 41 | 8.64 | |||||||||||||||||
| Phosphatidylethanolamine (PE) | 9.22 | 15.06 | 15 | 6.79 | 4.38 | 8.11 | 12 | 6.46 | |||||||||||||
| Phosphatidylethanolamine (-ether) (LPE-O) | 11.54 | 15.20 | 16 | 7.76 | |||||||||||||||||
| Phosphatidylinositol (LPI) | 7.37 | 8.44 | 14 | 6.05 | 8.95 | 16.88 | 15 | 7.62 | 10.83 | 18.82 | 6 | 8.90 | |||||||||
| Lyso-Phosphatidylserine (LPS) | 11.21 | 15.84 | 7 | 8.97 | |||||||||||||||||
| Glycerophosphoglycerols (LPG) | 9.23 | 10.92 | 14 | 6.71 | |||||||||||||||||
| Vitamins and Cofactors | 1.09 | 10.44 | 1 | NA | 2.37 | 5.87 | 1 | NA | |||||||||||||
| Alkaloids | 4.69 | 13.74 | 1 | NA | 3.86 | 2.48 | 2 | 0.80 | |||||||||||||
| Amine (Oxides) | 6.92 | 8.23 | 1 | NA | 45.46 | 12.49 | 1 | NA | |||||||||||||
| Carbohydrates and Related | 2.50 | 6.33 | 1 | NA | 10.81 | 14.37 | 34 | 13.62 | |||||||||||||
| Cresols | 2.07 | 7.14 | 1 | NA | |||||||||||||||||
| Imidazopyrimidines | 11.35 | 5.44 | 1 | NA | 10.32 | 7.60 | 17 | 8.68 | |||||||||||||
| 5′-deoxyribonucleosides | 19.82 | 18.62 | 1 | NA | 7.84 | 8.63 | 1 | NA | |||||||||||||
| Nucleoside and nucleotide analogues | 13.05 | 3.4 | 1 | NA | |||||||||||||||||
| Pyrimidine nucleosides | 1.33 | 7.94 | 1 | NA | 9.24 | 9.59 | 7 | 7.33 | |||||||||||||
| Pyridines and derivatives | 6.69 | 7.90 | 10 | 5.76 | |||||||||||||||||
| Quinolines and derivatives | 11.85 | 13.64 | 3 | 7.42 | |||||||||||||||||
| Phenols | 9.22 | 4.79 | 3 | 5.40 | |||||||||||||||||
| Prenol lipids | 17.87 | 8.77 | 7 | 8.13 | |||||||||||||||||
| Imidazole ribonucleosides and ribonucleotides | 12.17 | 5.5 | 1 | NA | |||||||||||||||||
| Benzene and substituted derivatives | 12.72 | 9.49 | 14 | 10.36 | |||||||||||||||||
| Phenylpropanoic acids | 6.52 | 5.82 | 9 | 8.63 | |||||||||||||||||
| Tetrapyrroles and derivatives | 3.45 | 11.6 | 2 | 5.43 | |||||||||||||||||
| Cholesterol and derivatives | 7.53 | 9.5 | 2 | 4.40 | |||||||||||||||||
| Non-metal oxoanionic compounds | 2.94 | 3.17 | 2 | 1.81 | |||||||||||||||||
| Organic sulfuric acids and derivatives | 6.1 | 4.03 | 22 | 3.49 | |||||||||||||||||
| Organic sulfonic acids and derivatives | 2.47 | 5.59 | 2 | 3.48 | |||||||||||||||||
| Organic carbonic acids and derivatives | 6.33 | 9.48 | 2 | 3.88 | |||||||||||||||||
| Organic phosphoric acids and derivatives | 9.53 | 7.87 | 1 | NA | |||||||||||||||||
| Benzothiazepines | 2.29 | 6.17 | 2 | 5.83 | |||||||||||||||||
| Bilirubins | 9.03 | 5.41 | 2 | 6.66 | |||||||||||||||||
| Dihydrofurans | 6.94 | 3.07 | 2 | 3.68 | |||||||||||||||||
| Alkyl halides | 2.9 | 3.98 | 2 | 1.49 | |||||||||||||||||
| Sulfinic acids and derivatives | 11.13 | 16.04 | 1 | NA | |||||||||||||||||
| Azoles | 11.11 | 10.6 | 7 | 5.90 | |||||||||||||||||
| Azolidines | 4.34 | 6.92 | 1 | NA | |||||||||||||||||
| Cinnamic acids and derivatives | 4.07 | 13.92 | 1 | NA | |||||||||||||||||
| Peptidomimetics | 20.02 | 14.52 | 1 | NA | |||||||||||||||||
| Piperidines | 14.81 | 16.27 | 1 | NA | |||||||||||||||||
| Pyrrolidines | 4.09 | 5.48 | 1 | NA | |||||||||||||||||
| Coumarins and derivatives | 0 | 14.1 | 1 | NA | |||||||||||||||||
| Inter-Assay Precision: Shipment 1 vs. Shipment 2 | |||||||||||||||
|---|---|---|---|---|---|---|---|---|---|---|---|---|---|---|---|
| PTSD Average CV% | Control Average CV% | Standard deviation (SD) | PTSD Average CV% | Control Average CV% | Standard deviation (SD) | PTSD Average CV% | Control Average CV% | Standard deviation (SD) | PTSD Average CV% | Control Average CV% | Standard deviation (SD) | PTSD Average CV% | Control Average CV% | Standard deviation (SD) | |
| Metabolite Class | Biocrates | HMT | Nightingale | Lipotype | Metabolon | ||||||||||
| Acylcarnitines | 7.21 | 11.48 | 2.78 | 12.21 | 12.10 | 8.64 | 15.27 | 13.52 | 9.93 | ||||||
| Amino Acids | 5.88 | 11.95 | 3.57 | 9.10 | 9.79 | 4.02 | 4.80 | 7.37 | 3.48 | 12.84 | 14.21 | 8.03 | |||
| Amino Acid Related | 7.63 | 13.90 | 6.86 | ||||||||||||
| Carboxylic Acids | 7.54 | 13.71 | 4.05 | 10.60 | 8.90 | 5.83 | 5.92 | 7.90 | 1.51 | 15.38 | 13.91 | 12.75 | |||
| Cholesteryl ester | 11.71 | 14.47 | 2.58 | 8.07 | 8.93 | 5.25 | 10.16 | 8.68 | 7.77 | ||||||
| Diglycerides | 17.42 | 22.27 | 10.62 | 9.13 | 13.25 | 6.27 | 10.97 | 10.06 | 4.53 | ||||||
| Diazines | 16.42 | 21.57 | 14.04 | 33.22 | 29.05 | 24.92 | |||||||||
| Organonitrogen compounds | 13.31 | 11.50 | 8.24 | 14.25 | 13.66 | 7.67 | |||||||||
| Purine nucleotides | 30.06 | 38.64 | 18.99 | 11.49 | 11.84 | 5.98 | |||||||||
| Organooxygen compounds | 31.07 | 37.08 | 13.17 | 4.89 | 6.94 | 2.62 | 31.34 | 26.85 | 28.72 | ||||||
| Hydroxy acids and derivatives | 10.88 | 11.10 | 6.05 | 1.88 | 3.57 | NA | 17.76 | 17.90 | 12.03 | ||||||
| Keto acids and derivatives | 14.10 | 16.66 | 2.83 | 10.58 | 19.49 | 9.58 | 15.64 | 13.55 | 8.45 | ||||||
| Ceramides | 16.04 | 19.50 | 8.65 | 11.34 | 15.68 | 4.34 | 6.58 | 6.47 | 0.78 | 10.10 | 7.88 | 4.44 | |||
| Lactosylceramide | 15.32 | 16.79 | 8.06 | 16.61 | 17.51 | 13.28 | |||||||||
| Glucosylceramide | 19.30 | 23.43 | 9.77 | ||||||||||||
| Dihexosylceramides | 11.99 | 17.82 | 5.18 | ||||||||||||
| Trihexosylceramides | 17.08 | 23.39 | 4.52 | ||||||||||||
| Dihydroceramide | 18.63 | 21.21 | 12.20 | ||||||||||||
| Hexosylceramide | 14.23 | 17.72 | 6.01 | 11.44 | 10.57 | 3.49 | |||||||||
| Triglycerides | 15.42 | 19.35 | 7.56 | 8.34 | 6.67 | 2.20 | 9.3 | 7.65 | 2.61 | ||||||
| Hormones/Steroids | 15.59 | 18.54 | 9.04 | 8.08 | 10.35 | 5.86 | 15.39 | 13.53 | 5.84 | ||||||
| Fatty Acids | 13.80 | 18.43 | 7.40 | 24.26 | 27.33 | 33.29 | 53.25 | 9.39 | 26.15 | 6.89 | 6.60 | 3.39 | |||
| Fatty Acyls | 4.21 | 4.99 | NA | 20.94 | 17.94 | 9.44 | |||||||||
| Biogenic Amines | 6.37 | 18.78 | 10.04 | ||||||||||||
| Bile Acids | 21.36 | 23.51 | 28.05 | 5.99 | 10.49 | 10.09 | 21.36 | 20.83 | 11.05 | ||||||
| Indoles and Derivatives | 8.60 | 15.22 | 4.59 | 13.11 | 12.47 | 5.93 | |||||||||
| Lysophosphatidyl-cholines (LPC) | 13.24 | 17.78 | 8.17 | 6.45 | 8.75 | 3.38 | 9.13 | 8.85 | 0.77 | 17.64 | 17.23 | 12.98 | |||
| Glycerophosphocholines | 6.56 | 7.21 | 2.76 | ||||||||||||
| Phosphatidyl-cholines (PC) | 10.11 | 14.43 | 6.97 | 10.24 | 13.18 | 10.69 | 13.65 | 13.98 | 13.68 | ||||||
| Sphingomyelins | 9.34 | 12.99 | 4.28 | 6.16 | 7.19 | 2.09 | 6.51 | 7.58 | 4.35 | ||||||
| Sphingolipids | 20.21 | 20.23 | 10.83 | 9.90 | 12.50 | 1.60 | |||||||||
| Sphinganine | |||||||||||||||
| Sphingosine | 19.34 | 19.49 | 10.01 | ||||||||||||
| Glycerophospholipids | 19.51 | 22.85 | 25.01 | 22.79 | 26.91 | 17.68 | |||||||||
| Glycerolipids (Monoacylglycerol) | 35.32 | 34.69 | 15.53 | ||||||||||||
| Carboximidic acids and derivatives | 23.26 | 3.55 | NA | 12.92 | 17.33 | 5.22 | |||||||||
| lyso-Phosphatidylethanolamine (LPE) | 11.88 | 13.87 | 17.60 | 9.92 | 9.85 | 1.89 | 22.80 | 19.85 | 12.54 | ||||||
| Phosphatidylcholine (-ether) (LPC-O) | 14.35 | 15.00 | 6.39 | ||||||||||||
| Phosphatidylethanolamine (PE) | 12.50 | 14.70 | 6.08 | 12.16 | 12.16 | 8.38 | |||||||||
| Phosphatidylethanolamine (-ether) (LPE-O) | 10.14 | 11.68 | 3.76 | ||||||||||||
| Phosphatidylinositol (LPI) | 9.81 | 10.24 | 6.62 | 13.27 | 13.27 | 7.59 | 39.03 | 49.61 | 11.64 | ||||||
| Lyso-Phosphatidylserine (LPS) | 19.00 | 20.64 | 7.74 | ||||||||||||
| Glycerophosphoglycerols (LPG) | 12.34 | 15.52 | 7.60 | ||||||||||||
| Vitamins and Cofactors | 7.59 | 13.77 | NA | 6.44 | 13.52 | NA | |||||||||
| Alkaloids | 17.05 | 46.83 | 21.81 | ||||||||||||
| Amine (Oxides) | 6.55 | 11.15 | NA | 28.84 | 24.42 | NA | |||||||||
| Carbohydrates and Related | 6.61 | 13.25 | NA | 23.31 | 22.25 | 22.84 | |||||||||
| Cresols | 4.39 | 11.88 | NA | ||||||||||||
| Imidazopyrimidines | 19.81 | 26.41 | 14.25 | ||||||||||||
| 5′-deoxyribonucleosides | 12.33 | 9.07 | 5.31 | 10.04 | 13.25 | NA | |||||||||
| Nucleoside and nucleotide analogues | 44.29 | 15.88 | NA | ||||||||||||
| Pyrimidine nucleosides | 21.49 | 19.06 | 15.04 | ||||||||||||
| Pyridines and derivatives | 11.51 | 11.75 | 5.71 | ||||||||||||
| Quinolines and derivatives | 20.42 | 20.85 | 13.19 | ||||||||||||
| Phenols | 22.06 | 21.35 | 6.87 | ||||||||||||
| Prenol lipids | 16.43 | 13.54 | 6.28 | ||||||||||||
| Imidazole ribonucleosides and ribonucleotides | 7.24 | 7.26 | NA | ||||||||||||
| Benzene and substituted derivatives | 23.37 | 23.26 | 13.29 | ||||||||||||
| Phenylpropanoic acids | 17.47 | 23.77 | 12.32 | ||||||||||||
| Tetrapyrroles and derivatives | 9.73 | 17.57 | 5.40 | ||||||||||||
| Cholesterol and derivatives | 8.27 | 8.43 | 2.92 | ||||||||||||
| Non-metal oxoanionic compounds | 4.07 | 4.04 | 0.41 | ||||||||||||
| Organic sulfuric acids and derivatives | 23.64 | 25.3 | 27.37 | ||||||||||||
| Organic sulfonic acids and derivatives | 7.08 | 10.9 | 6.10 | ||||||||||||
| Organic carbonic acids and derivatives | 7.67 | 9 | 4.39 | ||||||||||||
| Organic phosphoric acids and derivatives | 8.74 | 8.28 | NA | ||||||||||||
| Benzothiazepines | 22.99 | 22.49 | 2.09 | ||||||||||||
| Bilirubins | 10.37 | 13.28 | NA | ||||||||||||
| Dihydrofurans | 10.09 | 6.84 | 2.42 | ||||||||||||
| Alkyl halides | 7.17 | 5.97 | 2.77 | ||||||||||||
| Sulfinic acids and derivatives | 9.57 | 21.87 | NA | ||||||||||||
| Azoles | 17.19 | 12.88 | 7.62 | ||||||||||||
| Azolidines | 14.11 | 17 | NA | ||||||||||||
| Cinnamic acids and derivatives | 48.32 | 49.73 | NA | ||||||||||||
| Peptidomimetics | 22.76 | 21.34 | NA | ||||||||||||
| Piperidines | 53.36 | 63.22 | NA | ||||||||||||
| Pyrrolidines | 10.55 | 13.2 | NA | ||||||||||||
| Coumarins and derivatives | 30.57 | 17.89 | NA | ||||||||||||
| Accuracy (%) | Biocrates | HMT | Nightingale | ||||
|---|---|---|---|---|---|---|---|
| Analyte | NIST Value (uM) | Reported Value (uM) | Percent Difference | Reported Value (uM) | Percent Difference | Reported Value (uM) | Percent Difference |
| Fatty Acids | |||||||
| C18:2 n-6 (Z,Z)-9,12-Octadecadienoic Acid (Linoleic Acid) | 2838 | 2960 | 4.30% | ||||
| C22:6 n-3. (Z,Z,Z,Z,Z,Z)-4,7,10,13,16,19-Docosahexaenoic Acid (DHA) | 118 | 136 | 15.25% | ||||
| Amino Acids | |||||||
| Alanine | 300 | 331 | 10.17% | 211 | −29.61% | 312.246 | 4.08% |
| Glycine | 245 | 288 | 17.72% | 250 | 1.97% | 240.87 | −1.69% |
| Histidine | 72.6 | 80 | 10.08% | 59 | −18.25% | 70.0707 | −3.48% |
| Isoleucine | 55.5 | 66 | 18.92% | 46 | −17.02% | 44.604 | −19.63% |
| Leucine | 100.4 | 114 | 13.05% | 102 | 1.25% | 87.7893 | −12.56% |
| Lysine | 140 | 151 | 7.73% | 129 | −7.60% | ||
| Methionine | 22.3 | 22 | −0.94% | 14 | −38.50% | ||
| Proline | 177 | 199 | 12.30% | 138 | −22.19% | ||
| Serine | 95.9 | 98 | 2.14% | 69 | −27.57% | ||
| Threonine | 119.5 | 127 | 6.10% | 92 | −23.08% | ||
| Tyrosine | 57.3 | 61 | 6.48% | 49 | −13.95% | 61.8318 | 7.91% |
| Valine | 182.2 | 174 | −4.40% | 152 | −16.30% | 185.06 | 1.57% |
| Arginine | 81.4 | 95 | 16.45% | ||||
| Cysteine | 44.3 | 46 | 4.50% | ||||
| Cystine | 7.8 | 8.0 | 2.76% | ||||
| Phenylalanine | 51 | 57 | 12.54% | 47 | −8.27% | 53.0223 | 3.97% |
| Clinical Markers | |||||||
| Creatinine | 60 | 65 | 7.69% | 43 | −28.14% | 58.1642 | −3.06% |
| Glucose | 4560 | 4679.41 | 2.62% | ||||
| Homocysteine | 8.5 | 8.5 | 0.58% | ||||
| Cortisol | 0.23 | 0.19 | −17.92% | ||||
| Cholesterol | 3917 | 3620 | −7.58% | ||||
Publisher’s Note: MDPI stays neutral with regard to jurisdictional claims in published maps and institutional affiliations. |
© 2021 by the authors. Licensee MDPI, Basel, Switzerland. This article is an open access article distributed under the terms and conditions of the Creative Commons Attribution (CC BY) license (https://creativecommons.org/licenses/by/4.0/).
Share and Cite
Chaby, L.E.; Lasseter, H.C.; Contrepois, K.; Salek, R.M.; Turck, C.W.; Thompson, A.; Vaughan, T.; Haas, M.; Jeromin, A. Cross-Platform Evaluation of Commercially Targeted and Untargeted Metabolomics Approaches to Optimize the Investigation of Psychiatric Disease. Metabolites 2021, 11, 609. https://doi.org/10.3390/metabo11090609
Chaby LE, Lasseter HC, Contrepois K, Salek RM, Turck CW, Thompson A, Vaughan T, Haas M, Jeromin A. Cross-Platform Evaluation of Commercially Targeted and Untargeted Metabolomics Approaches to Optimize the Investigation of Psychiatric Disease. Metabolites. 2021; 11(9):609. https://doi.org/10.3390/metabo11090609
Chicago/Turabian StyleChaby, Lauren E., Heather C. Lasseter, Kévin Contrepois, Reza M. Salek, Christoph W. Turck, Andrew Thompson, Timothy Vaughan, Magali Haas, and Andreas Jeromin. 2021. "Cross-Platform Evaluation of Commercially Targeted and Untargeted Metabolomics Approaches to Optimize the Investigation of Psychiatric Disease" Metabolites 11, no. 9: 609. https://doi.org/10.3390/metabo11090609