
Defining Acute Coronary Syndrome through Metabolomics


Abstract
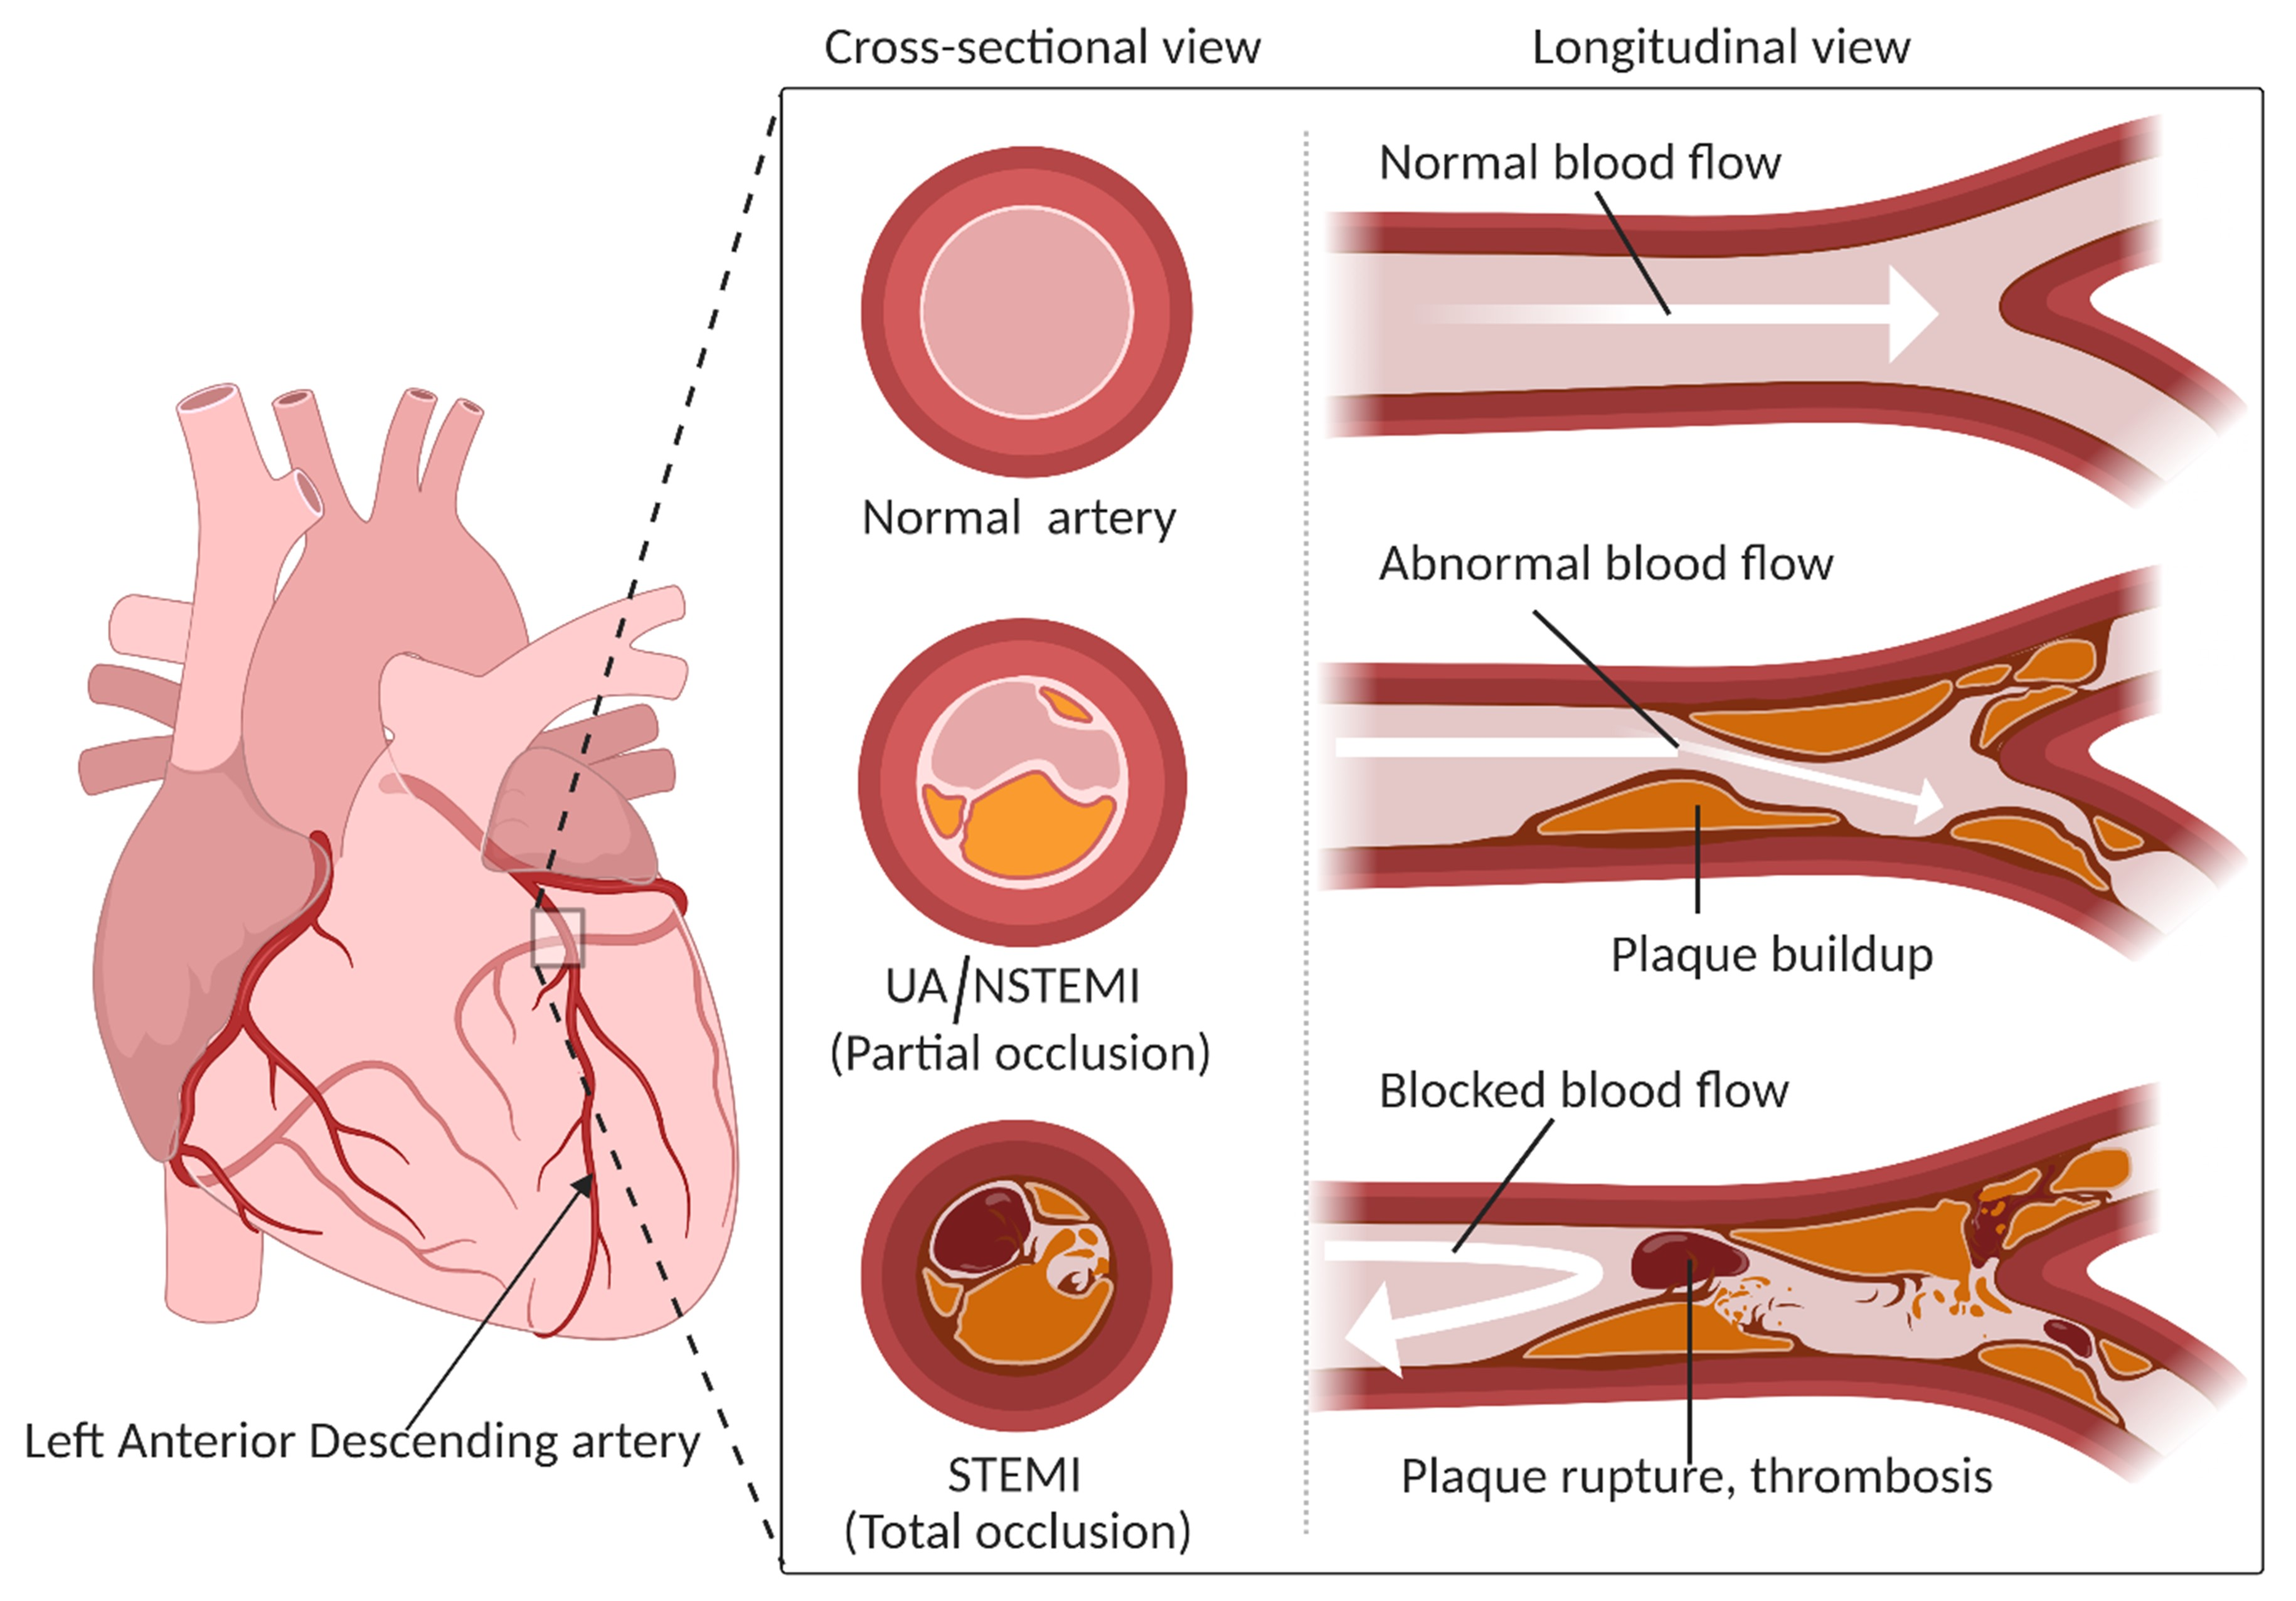
:1. Introduction
2. Analytical Tools in Metabolomics
2.1. NMR Spectroscopy
2.2. Mass Spectrometry
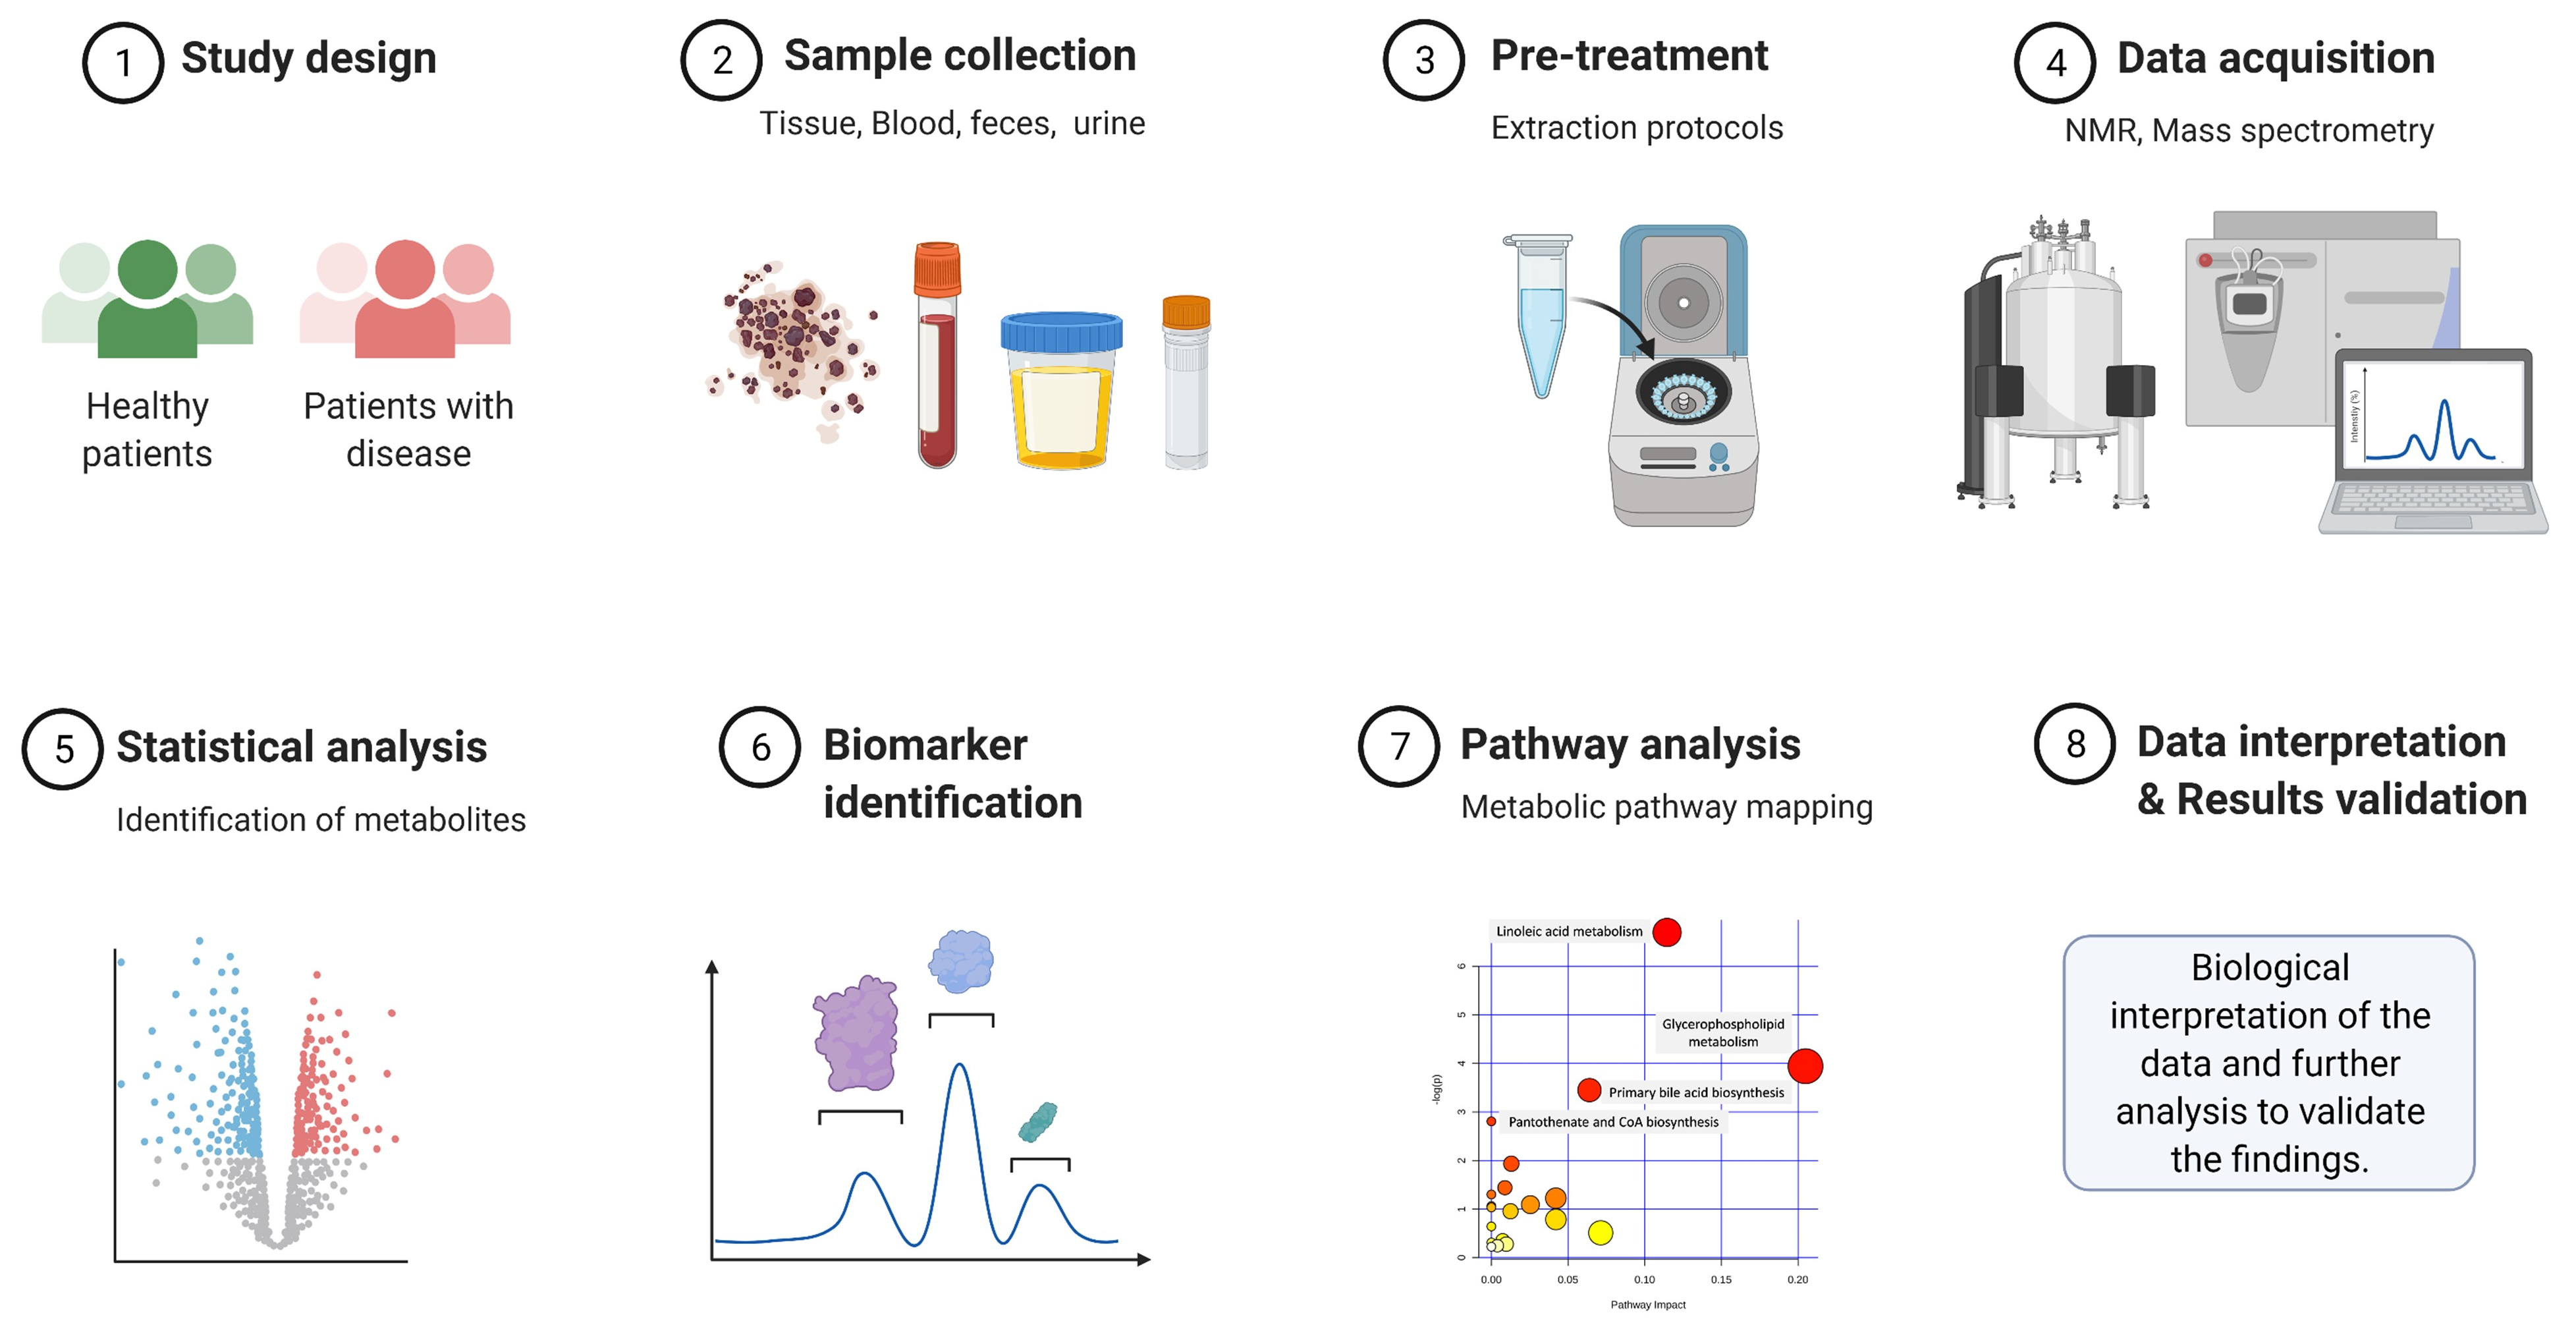
3. Pre-Analytical Considerations in Metabolomics Studies
3.1. Serum vs. Plasma
3.2. Polar vs. Non-Polar Metabolites
4. Extraction Procedures for Metabolomics
5. Data Processing in Metabolomics
5.1. Handling Unwanted Variances in Metabolomics Data
6. Metabolomics in ACS
7. Lipidomics in ACS
8. Metabolomics of Ischemia/Reperfusion Injury
9. Translational Metabolomics and Future Directions
10. Conclusions
Author Contributions
Funding
Acknowledgments
Conflicts of Interest
Abbreviations
References
- Sanchis-Gomar, F.; Perez-Quilis, C.; Leischik, R.; Lucia, A. Epidemiology of coronary heart disease and acute coronary syndrome. Ann. Transl. Med. 2016, 4, 256. [Google Scholar] [CrossRef] [PubMed] [Green Version]
- Virani, S.S.; Alonso, A.; Benjamin, E.J.; Bittencourt, M.S.; Callaway, C.W.; Carson, A.P.; Chamberlain, A.M.; Chang, A.R.; Cheng, S.; Delling, F.N.; et al. Heart disease and stroke statistics-2020 update: A report from the American Heart Association. Circulation 2020, 141, e139–e596. [Google Scholar] [CrossRef] [PubMed]
- Amsterdam, E.A.; Wenger, N.K.; Brindis, R.G.; Casey, D.E., Jr.; Ganiats, T.G.; Holmes, D.R., Jr.; Jaffe, A.S.; Jneid, H.; Kelly, R.F.; Kontos, M.C.; et al. 2014 AHA/ACC guideline for the management of patients with non-ST-elevation acute coronary syndromes: A report of the American College of Cardiology/American Heart Association Task Force on Practice Guidelines. J. Am. Coll. Cardiol. 2014, 64, e139–e228. [Google Scholar] [CrossRef] [PubMed] [Green Version]
- Menzin, J.; Wygant, G.; Hauch, O.; Jackel, J.; Friedman, M. One-year costs of ischemic heart disease among patients with acute coronary syndromes: Findings from a multi-employer claims database. Curr. Med. Res. Opin. 2008, 24, 461–468. [Google Scholar] [CrossRef]
- Anderson, J.L.; Morrow, D.A. Acute myocardial infarction. N. Engl. J. Med. 2017, 376, 2053–2064. [Google Scholar] [CrossRef] [PubMed] [Green Version]
- Moore, A.; Goerne, H.; Rajiah, P.; Tanabe, Y.; Saboo, S.; Abbara, S. Acute myocardial infarct. Radiol. Clin. N. Am. 2019, 57, 45–55. [Google Scholar] [CrossRef] [PubMed]
- Makki, N.; Brennan, T.M.; Girotra, S. Acute coronary syndrome. J. Intensive Care Med. 2015, 30, 186–200. [Google Scholar] [CrossRef]
- Mahajan, V.S.; Jarolim, P. How to interpret elevated cardiac troponin levels. Circulation 2011, 124, 2350–2354. [Google Scholar] [CrossRef] [PubMed] [Green Version]
- Taegtmeyer, H. A Primer on Carbohydrate Metabolism in the Heart; Springer: New York, NY, USA, 2014; Volume 11. [Google Scholar]
- Drosatos, K.; Goldberg, I.J. Lipoproteins: A source of cardiac lipids. In Cardiac Energy Metabolism in Health and Disease; Springer: New York, NY, USA, 2014. [Google Scholar]
- Burnett, J.R. Lipids, lipoproteins, atherosclerosis and cardiovascular disease. Clin. Biochem. Rev. 2004, 25, 2. [Google Scholar]
- Rosano, G.M.; Fini, M.; Caminiti, G.; Barbaro, G. Cardiac metabolism in myocardial ischemia. Curr. Pharm. Des. 2008, 14, 2551–2562. [Google Scholar] [CrossRef]
- Yellon, D.M.; Hausenloy, D.J. Myocardial reperfusion injury. N. Engl. J. Med. 2007, 357, 1121–1135. [Google Scholar] [CrossRef] [PubMed]
- Riehle, C.; Abel, E.D. Insulin signaling and heart failure. Circ. Res. 2016, 118, 1151–1169. [Google Scholar] [CrossRef] [PubMed]
- Griffin, J.L.; Atherton, H.; Shockcor, J.; Atzori, L. Metabolomics as a tool for cardiac research. Nat. Rev. Cardiol. 2011, 8, 630–643. [Google Scholar] [CrossRef] [PubMed]
- Dunn, W.B.; Goodacre, R.; Neyses, L.; Mamas, M. Integration of metabolomics in heart disease and diabetes research: Current achievements and future outlook. Bioanalysis 2011, 3, 2205–2222. [Google Scholar] [CrossRef]
- Li, M.; Zhou, Z.; Nie, H.; Bai, Y.; Liu, H. Recent advances of chromatography and mass spectrometry in lipidomics. Anal. Bioanal. Chem. 2011, 399, 243–249. [Google Scholar] [CrossRef]
- Courant, F.; Antignac, J.P.; Dervilly-Pinel, G.; Le Bizec, B. Basics of mass spectrometry based metabolomics. Proteomics 2014, 14, 2369–2388. [Google Scholar] [CrossRef]
- Cheng, S.; Shah, S.H.; Corwin, E.J.; Fiehn, O.; Fitzgerald, R.L.; Gerszten, R.E.; Illig, T.; Rhee, E.P.; Srinivas, P.R.; Wang, T.J.; et al. Potential impact and study considerations of metabolomics in cardiovascular health and disease: A scientific statement from the American Heart Association. Circ. Cardiovasc. Genet. 2017, 10, e000032. [Google Scholar] [CrossRef] [Green Version]
- Van der Greef, J.; Smilde, A.K. Symbiosis of chemometrics and metabolomics: Past, present, and future. J. Chem. 2005, 19, 376–386. [Google Scholar] [CrossRef]
- Pauling, L. Orthomolecular psychiatry. Varying the concentrations of substances normally present in the human body may control mental disease. Science 1968, 160, 265–271. [Google Scholar] [CrossRef] [PubMed]
- Pauling, L.; Robinson, A.B.; Teranishi, R.; Cary, P. Quantitative analysis of urine vapor and breath by gas-liquid partition chromatography. Proc. Natl. Acad. Sci. USA 1971, 68, 2374–2376. [Google Scholar] [CrossRef] [Green Version]
- Robinson, A.B.; Westall, F.C.; Ellison, G.W. Multiple sclerosis: Urinary amine measurement for orthomolecular diagnosis. Life Sci. 1974, 14, 1747–1753. [Google Scholar] [CrossRef]
- Horning, E.C.; Horning, M.G. Metabolic profiles: Gas-phase methods for analysis of metabolites. Clin. Chem. 1971, 17, 802–809. [Google Scholar] [CrossRef] [PubMed]
- Horning, E.C.; Horning, M.G. Human metabolic profiles obtained by GC and GC/MS. J. Chromatogr. Sci. 1971, 9, 129–140. [Google Scholar] [CrossRef]
- Oliver, S.G.; Winson, M.K.; Kell, D.B.; Baganz, F. Systematic functional analysis of the yeast genome. Trends Biotechnol. 1998, 16, 373–378. [Google Scholar] [CrossRef]
- Burla, B.; Arita, M.; Arita, M.; Bendt, A.K.; Cazenave-Gassiot, A.; Dennis, E.A.; Ekroos, K.; Han, X.; Ikeda, K.; Liebisch, G.; et al. MS-based lipidomics of human blood plasma: A community-initiated position paper to develop accepted guidelines. J. Lipid Res. 2018, 59, 2001–2017. [Google Scholar] [CrossRef] [PubMed] [Green Version]
- Pouralijan Amiri, M.; Khoshkam, M.; Salek, R.M.; Madadi, R.; Ganji, G.F.; Ramazani, A. Metabolomics in early detection and prognosis of acute coronary syndrome. Clin. Chim. Acta 2019, 495, 43–53. [Google Scholar] [CrossRef]
- Gadian, D.G.; Hoult, D.I.; Radda, G.K.; Seeley, P.J.; Chance, B.; Barlow, C. Phosphorus nuclear magnetic resonance studies on normoxic and ischemic cardiac tissue. Proc. Natl. Acad. Sci. USA 1976, 73, 4446–4448. [Google Scholar] [CrossRef] [Green Version]
- Ackerman, J.J.; Bore, P.J.; Gadian, D.G.; Grove, T.H.; Radda, G.K. Nmr studies of metabolism in perfused organs. Philos. Trans. R. Soc. Lond. B Biol. Sci. 1980, 289, 425–436. [Google Scholar] [CrossRef]
- Bailey, I.A.; Williams, S.R.; Radda, G.K.; Gadian, D.G. Activity of phosphorylase in total global ischaemia in the rat heart. A phosphorus-31 nuclear-magnetic-resonance study. Biochem. J. 1981, 196, 171–178. [Google Scholar] [CrossRef] [PubMed] [Green Version]
- Vignoli, A.; Tenori, L.; Giusti, B.; Valente, S.; Carrabba, N.; Balzi, D.; Barchielli, A.; Marchionni, N.; Gensini, G.F.; Marcucci, R.; et al. Differential network analysis reveals metabolic determinants associated with mortality in acute myocardial infarction patients and suggests potential mechanisms underlying different clinical scores used to predict death. J. Proteome Res. 2020, 19, 949–961. [Google Scholar] [CrossRef]
- Yao, W.; Gao, Y.; Wan, Z. Serum metabolomics profiling to identify biomarkers for unstable angina. BioMed Res. Int. 2017, 2017, 7657306. [Google Scholar] [CrossRef] [PubMed] [Green Version]
- Ameta, K.; Gupta, A.; Ameta, D.; Sethi, R.; Kumar, D.; Ahmad, I.; Mahdi, A.A. 1H NMR-derived metabolomics of filtered serum of myocardial ischemia in unstable angina patients. Clin. Chim. Acta 2016, 456, 56–62. [Google Scholar] [CrossRef] [PubMed]
- Pouralijan Amiri, M.; Khoshkam, M.; Madadi, R.; Kamali, K.; Faghanzadeh Ganji, G.; Salek, R.; Ramazani, A. NMR-based plasma metabolic profiling in patients with unstable angina. Iran. J. Basic Med. Sci. 2020, 23, 311–320. [Google Scholar] [CrossRef]
- Li, Z.; Liu, X.; Wang, J.; Gao, J.; Guo, S.; Gao, K.; Man, H.; Wang, Y.; Chen, J.; Wang, W. Analysis of urinary metabolomic profiling for unstable angina pectoris disease based on nuclear magnetic resonance spectroscopy. Mol. Biosyst. 2015, 11, 3387–3396. [Google Scholar] [CrossRef]
- Takis, P.G.; Ghini, V.; Tenori, L.; Turano, P.; Luchinat, C. Uniqueness of the NMR approach to metabolomics. Trac Trends Anal. Chem. 2019, 120, 115300. [Google Scholar] [CrossRef]
- Emwas, A.-H.; Roy, R.; McKay, R.T.; Tenori, L.; Saccenti, E.; Gowda, G.A.N.; Raftery, D.; Alahmari, F.; Jaremko, L.; Jaremko, M.; et al. NMR spectroscopy for metabolomics research. Metabolites 2019, 9, 123. [Google Scholar] [CrossRef] [PubMed] [Green Version]
- Senn, T.; Hazen, S.L.; Tang, W.H. Translating metabolomics to cardiovascular biomarkers. Prog. Cardiovasc. Dis. 2012, 55, 70–76. [Google Scholar] [CrossRef] [PubMed] [Green Version]
- Brindle, J.T.; Antti, H.; Holmes, E.; Tranter, G.; Nicholson, J.K.; Bethell, H.W.; Clarke, S.; Schofield, P.M.; McKilligin, E.; Mosedale, D.E.; et al. Rapid and noninvasive diagnosis of the presence and severity of coronary heart disease using 1H-NMR-based metabonomics. Nat. Med. 2002, 8, 1439–1444. [Google Scholar] [CrossRef] [PubMed]
- Deng, D.; Liu, L.; Xu, G.; Gan, J.; Shen, Y.; Shi, Y.; Zhu, R.; Lin, Y. Epidemiology and serum metabolic characteristics of acute myocardial infarction patients in chest pain centers. Iran. J. Public Health 2018, 47, 1017–1029. [Google Scholar] [PubMed]
- Deidda, M.; Piras, C.; Binaghi, G.; Congia, D.; Pani, A.; Boi, A.; Sanna, F.; Rossi, A.; Loi, B.; Cadeddu Dessalvi, C.; et al. Metabolomic fingerprint of coronary blood in STEMI patients depends on the ischemic time and inflammatory state. Sci. Rep. 2019, 9, 312. [Google Scholar] [CrossRef] [PubMed] [Green Version]
- Zhong, W.; Deng, Q.; Deng, X.; Zhong, Z.; Hou, J. Plasma Metabolomics of Acute Coronary Syndrome Patients Based on Untargeted Liquid Chromatography–Mass Spectrometry. Front. Cardiovasc. Med. 2021, 8. [Google Scholar] [CrossRef]
- Chorell, E.; Olsson, T.; Jansson, J.H.; Wennberg, P. Lysophospholipids as Predictive Markers of ST-Elevation Myocardial Infarction(STEMI) and Non-ST-Elevation Myocardial Infarction(NSTEMI). Metabolites 2020, 11, 25. [Google Scholar] [CrossRef]
- Aa, N.; Lu, Y.; Yu, M.; Tang, H.; Lu, Z.; Sun, R.; Wang, L.; Li, C.; Yang, Z.; Aa, J.; et al. Plasma Metabolites Alert Patients With Chest Pain to Occurrence of Myocardial Infarction. Front. Cardiovasc. Med. 2021, 8, 276. [Google Scholar] [CrossRef] [PubMed]
- Chen, H.; Wang, Z.; Qin, M.; Zhang, B.; Lin, L.; Ma, Q.; Liu, C.; Chen, X.; Li, H.; Lai, W.; et al. Comprehensive Metabolomics Identified the Prominent Role of Glycerophospholipid Metabolism in Coronary Artery Disease Progression. Front. Mol. Biosci. 2021, 8. [Google Scholar] [CrossRef]
- Mehta, A.; Liu, C.; Nayak, A.; Tahhan, A.S.; Ko, Y.A.; Dhindsa, D.S.; Kim, J.H.; Hayek, S.S.; Sperling, L.S.; Mehta, P.K.; et al. Untargeted high-resolution plasma metabolomic profiling predicts outcomes in patients with coronary artery disease. PLoS ONE 2020, 15, e0237579. [Google Scholar] [CrossRef] [PubMed]
- Li, J.; Duan, W.; Wang, L.; Lu, Y.; Shi, Z.; Lu, T. Metabolomics Study Revealing the Potential Risk and Predictive Value of Fragmented QRS for Acute Myocardial Infarction. J. Proteome Res. 2020, 19, 3386–3395. [Google Scholar] [CrossRef] [PubMed]
- Jiang, H.; Jiang, H.; Zhang, J.; Chen, W.; Luo, C.; Li, H.; Hau, W.; Chen, B.; Wang, S. The Serum Metabolic Biomarkers in Early Diagnosis and Risk Stratification of Acute Coronary Syndrome. Front. Physiol. 2020, 11, 776. [Google Scholar] [CrossRef] [PubMed]
- Khan, A.; Choi, Y.; Back, J.H.; Lee, S.; Jee, S.H.; Park, Y.H. High-resolution metabolomics study revealing l-homocysteine sulfinic acid, cysteic acid, and carnitine as novel biomarkers for high acute myocardial infarction risk. Metabolism 2020, 104, 154051. [Google Scholar] [CrossRef] [PubMed]
- Gundogdu, G.; Senol, O.; Demirkaya Miloglu, F.; Koza, Y.; Gundogdu, F.; Hacımüftüoğlu, A.; Abd El-Aty, A.M. Serum metabolite profiling of ST-segment elevation myocardial infarction using liquid chromatography quadrupole time-of-flight mass spectrometry. Biomed. Chromatogr. 2020, 34, e4738. [Google Scholar] [CrossRef]
- Surendran, A.; Aliani, M.; Ravandi, A. Metabolomic characterization of myocardial ischemia-reperfusion injury in ST-segment elevation myocardial infarction patients undergoing percutaneous coronary intervention. Sci. Rep. 2019, 9, 11742. [Google Scholar] [CrossRef] [Green Version]
- Wang, J.; Xu, W.; Zhao, H.; Chen, J.; Zhu, B.; Li, X.; Deng, D.; Wang, J.; Liu, J.; Yu, Y.; et al. Identification of potential plasma biomarkers and metabolic dysfunction for unstable angina pectoris and its complication based on global metabolomics. Biosci. Rep. 2019, 39, BSR20181658. [Google Scholar] [CrossRef]
- Vignoli, A.; Tenori, L.; Giusti, B.; Takis, P.G.; Valente, S.; Carrabba, N.; Balzi, D.; Barchielli, A.; Marchionni, N.; Gensini, G.F.; et al. NMR-based metabolomics identifies patients at high risk of death within two years after acute myocardial infarction in the AMI-Florence II cohort. BMC Med. 2019, 17, 3. [Google Scholar] [CrossRef] [PubMed] [Green Version]
- Goulart, V.A.M.; Santos, A.K.; Sandrim, V.C.; Batista, J.M.; Pinto, M.C.X.; Cameron, L.C.; Resende, R.R. Metabolic Disturbances Identified in Plasma Samples from ST-Segment Elevation Myocardial Infarction Patients. Dis. Markers 2019, 2019, 7676189. [Google Scholar] [CrossRef] [PubMed] [Green Version]
- Wang, Y.; Sun, W.; Zheng, J.; Xu, C.; Wang, X.; Li, T.; Tang, Y.; Li, Z. Urinary metabonomic study of patients with acute coronary syndrome using UPLC-QTOF/MS. J. Chromatogr. B Anal. Technol. Biomed. Life Sci. 2018, 1100, 122–130. [Google Scholar] [CrossRef]
- Du, X.; You, H.; Li, Y.; Wang, Y.; Hui, P.; Qiao, B.; Lu, J.; Zhang, W.; Zhou, S.; Zheng, Y. Relationships between circulating branched chain amino acid concentrations and risk of adverse cardiovascular events in patients with STEMI treated with PCI. Sci. Rep. 2018, 8, 15809. [Google Scholar] [CrossRef]
- Du, X.; Li, Y.; Wang, Y.; You, H.; Hui, P.; Zheng, Y.; Du, J. Increased branched-chain amino acid levels are associated with long-term adverse cardiovascular events in patients with STEMI and acute heart failure. Life Sci. 2018, 209, 167–172. [Google Scholar] [CrossRef]
- Huang, L.; Zhang, L.; Li, T.; Liu, Y.-W.; Wang, Y.; Liu, B.-j. Human Plasma Metabolomics Implicates Modified 9-cis-Retinoic Acid in the Phenotype of Left Main Artery Lesions in Acute ST-Segment Elevated Myocardial Infarction. Sci. Rep. 2018, 8, 12958. [Google Scholar] [CrossRef]
- Kohlhauer, M.; Dawkins, S.; Costa, A.S.H.; Lee, R.; Young, T.; Pell, V.R.; Choudhury, R.P.; Banning, A.P.; Kharbanda, R.K.; Saeb-Parsy, K.; et al. Metabolomic Profiling in Acute ST-Segment-Elevation Myocardial Infarction Identifies Succinate as an Early Marker of Human Ischemia-Reperfusion Injury. J. Am. Heart Assoc. 2018, 7, e007546. [Google Scholar] [CrossRef] [PubMed]
- Zhang, L.; Wei, T.T.; Li, Y.; Li, J.; Fan, Y.; Huang, F.Q.; Cai, Y.Y.; Ma, G.; Liu, J.F.; Chen, Q.Q.; et al. Functional Metabolomics Characterizes a Key Role for N-Acetylneuraminic Acid in Coronary Artery Diseases. Circulation 2018, 137, 1374–1390. [Google Scholar] [CrossRef] [PubMed]
- Yin, X.; de Carvalho, L.P.; Chan, M.Y.; Li, S.F.Y. Integrated metabolomics and metallomics analyses in acute coronary syndrome patients. Metallomics 2017, 9, 734–743. [Google Scholar] [CrossRef] [Green Version]
- Ali, S.E.; Farag, M.A.; Holvoet, P.; Hanafi, R.S.; Gad, M.Z. A Comparative Metabolomics Approach Reveals Early Biomarkers for Metabolic Response to Acute Myocardial Infarction. Sci. Rep. 2016, 6, 36359. [Google Scholar] [CrossRef] [PubMed] [Green Version]
- Fan, Y.; Li, Y.; Chen, Y.; Zhao, Y.J.; Liu, L.W.; Li, J.; Wang, S.L.; Alolga, R.N.; Yin, Y.; Wang, X.M.; et al. Comprehensive Metabolomic Characterization of Coronary Artery Diseases. J. Am. Coll. Cardiol. 2016, 68, 1281–1293. [Google Scholar] [CrossRef] [PubMed]
- Xu, X.; Gao, B.; Guan, Q.; Zhang, D.; Ye, X.; Zhou, L.; Tong, G.; Li, H.; Zhang, L.; Tian, J.; et al. Metabolomic profile for the early detection of coronary artery disease by using UPLC-QTOF/MS. J. Pharm Biomed. Anal. 2016, 129, 34–42. [Google Scholar] [CrossRef] [PubMed] [Green Version]
- Huang, L.; Li, T.; Liu, Y.W.; Zhang, L.; Dong, Z.H.; Liu, S.Y.; Gao, Y.T. Plasma Metabolic Profile Determination in Young ST-segment Elevation Myocardial Infarction Patients with Ischemia and Reperfusion: Ultra-performance Liquid Chromatography and Mass Spectrometry for Pathway Analysis. Chin. Med. J. 2016, 129, 1078–1086. [Google Scholar] [CrossRef] [PubMed]
- Naz, S.; Calderón, Á.A.; García, A.; Gallafrio, J.; Mestre, R.T.; González, E.G.; de Cabo, C.M.; Delgado, M.C.M.; Balanza, J.Á.L.; Simionato, A.V.C.; et al. Unveiling differences between patients with acute coronary syndrome with and without ST elevation through fingerprinting with CE-MS and HILIC-MS targeted analysis. Electrophoresis 2015, 36, 2303–2313. [Google Scholar] [CrossRef]
- Laborde, C.M.; Mourino-Alvarez, L.; Posada-Ayala, M.; Alvarez-Llamas, G.; Serranillos-Reus, M.G.; Moreu, J.; Vivanco, F.; Padial, L.R.; Barderas, M.G. Plasma metabolomics reveals a potential panel of biomarkers for early diagnosis in acute coronary syndrome. Metabolomics 2014, 10, 414–424. [Google Scholar] [CrossRef] [Green Version]
- Sun, M.; Gao, X.; Zhang, D.; Ke, C.; Hou, Y.; Fan, L.; Zhang, R.; Liu, H.; Li, K.; Yu, B. Identification of biomarkers for unstable angina by plasma metabolomic profiling. Mol. Biosyst. 2013, 9, 3059–3067. [Google Scholar] [CrossRef]
- Teul, J.; Garcia, A.; Tuñón, J.; Martin-Ventura, J.L.; Tarín, N.; Bescós, L.L.; Egido, J.; Barbas, C.; Rupérez, F.J. Targeted and non-targeted metabolic time trajectory in plasma of patients after acute coronary syndrome. J. Pharm Biomed. Anal. 2011, 56, 343–351. [Google Scholar] [CrossRef] [PubMed]
- Vallejo, M.; García, A.; Tuñón, J.; García-Martínez, D.; Angulo, S.; Martin-Ventura, J.L.; Blanco-Colio, L.M.; Almeida, P.; Egido, J.; Barbas, C. Plasma fingerprinting with GC-MS in acute coronary syndrome. Anal. Bioanal Chem 2009, 394, 1517–1524. [Google Scholar] [CrossRef] [Green Version]
- Griffiths, W.J.; Wang, Y. Mass spectrometry: From proteomics to metabolomics and lipidomics. Chem. Soc. Rev. 2009, 38, 1882–1896. [Google Scholar] [CrossRef] [PubMed]
- Griffiths, J. A Brief History of Mass Spectrometry. Anal. Chem. 2008, 80, 5678–5683. [Google Scholar] [CrossRef] [Green Version]
- Haag, A.M. Mass Analyzers and Mass Spectrometers. In Modern Proteomics—Sample Preparation, Analysis and Practical Applications; Mirzaei, H., Carrasco, M., Eds.; Springer International Publishing: Cham, Switzerland, 2016; pp. 157–169. [Google Scholar] [CrossRef]
- Siuzdak, G. An Introduction to Mass Spectrometry Ionization: An Excerpt from The Expanding Role of Mass Spectrometry in Biotechnology, 2nd ed.; MCC Press: San Diego, 2005. J. Assoc. Lab. Autom. 2004, 9, 50–63. [Google Scholar] [CrossRef] [Green Version]
- Wilm, M. Principles of electrospray ionization. Mol. Cell. Proteom. 2011, 10, M111.009407. [Google Scholar] [CrossRef] [PubMed] [Green Version]
- Peterson, D.S. Matrix-free methods for laser desorption/ionization mass spectrometry. Mass Spectrom. Rev. 2007, 26, 19–34. [Google Scholar] [CrossRef]
- Nordström, A.; Want, E.; Northen, T.; Lehtiö, J.; Siuzdak, G. Multiple ionization mass spectrometry strategy used to reveal the complexity of metabolomics. Anal. Chem. 2008, 80, 421–429. [Google Scholar] [CrossRef] [PubMed]
- Gowda, G.A.; Djukovic, D. Overview of mass spectrometry-based metabolomics: Opportunities and challenges. Methods Mol. Biol 2014, 1198, 3–12. [Google Scholar] [CrossRef] [PubMed] [Green Version]
- Ding, M.; Rexrode, K.M. A Review of Lipidomics of Cardiovascular Disease Highlights the Importance of Isolating Lipoproteins. Metabolites 2020, 10, 163. [Google Scholar] [CrossRef] [Green Version]
- Chekmeneva, E.; Dos Santos Correia, G.; Chan, Q.; Wijeyesekera, A.; Tin, A.; Young, J.H.; Elliott, P.; Nicholson, J.K.; Holmes, E. Optimization and Application of Direct Infusion Nanoelectrospray HRMS Method for Large-Scale Urinary Metabolic Phenotyping in Molecular Epidemiology. J. Proteome Res. 2017, 16, 1646–1658. [Google Scholar] [CrossRef]
- Ren, J.-L.; Zhang, A.-H.; Kong, L.; Wang, X.-J. Advances in mass spectrometry-based metabolomics for investigation of metabolites. RSC Adv. 2018, 8, 22335–22350. [Google Scholar] [CrossRef] [Green Version]
- Kapron, J.T.; Pace, E.; Van Pelt, C.K.; Henion, J. Quantitation of midazolam in human plasma by automated chip-based infusion nanoelectrospray tandem mass spectrometry. Rapid Commun. Mass Spectrom. 2003, 17, 2019–2026. [Google Scholar] [CrossRef]
- Li, H.; Bendiak, B.; Siems, W.F.; Gang, D.R.; Hill, H.H., Jr. Ion mobility mass spectrometry analysis of isomeric disaccharide precursor, product and cluster ions. Rapid Commun. Mass Spectrom. 2013, 27, 2699–2709. [Google Scholar] [CrossRef] [Green Version]
- Sutter, I.; Velagapudi, S.; Othman, A.; Riwanto, M.; Manz, J.; Rohrer, L.; Rentsch, K.; Hornemann, T.; Landmesser, U.; von Eckardstein, A. Plasmalogens of high-density lipoproteins(HDL) are associated with coronary artery disease and anti-apoptotic activity of HDL. Atherosclerosis 2015, 241, 539–546. [Google Scholar] [CrossRef] [PubMed]
- Rached, F.; Lhomme, M.; Camont, L.; Gomes, F.; Dauteuille, C.; Robillard, P.; Santos, R.D.; Lesnik, P.; Serrano, C.V., Jr.; Chapman, M.J.; et al. Defective functionality of small, dense HDL3 subpopulations in ST segment elevation myocardial infarction: Relevance of enrichment in lysophosphatidylcholine, phosphatidic acid and serum amyloid A. Biochim. Biophys. Acta 2015, 1851, 1254–1261. [Google Scholar] [CrossRef] [PubMed]
- Lee, J.H.; Yang, J.S.; Lee, S.H.; Moon, M.H. Analysis of lipoprotein-specific lipids in patients with acute coronary syndrome by asymmetrical flow field-flow fractionation and nanoflow liquid chromatography-tandem mass spectrometry. J. Chromatogr. B Anal. Technol. Biomed. Life Sci. 2018, 1099, 56–63. [Google Scholar] [CrossRef]
- Zhang, L.; Dai, Z.; Guo, R.; Wang, X.; Gong, W.; Duan, J.; He, Z.; Ding, R.; Zhang, X.; Nie, S.; et al. Metabolomics reveal dynamic changes in eicosanoid profile in patients with ST-elevation myocardial infarction after percutaneous coronary intervention. Clin. Exp. Pharm. Physiol. 2021, 48, 463–470. [Google Scholar] [CrossRef] [PubMed]
- Burrello, J.; Biemmi, V.; Dei Cas, M.; Amongero, M.; Bolis, S.; Lazzarini, E.; Bollini, S.; Vassalli, G.; Paroni, R.; Barile, L. Sphingolipid composition of circulating extracellular vesicles after myocardial ischemia. Sci. Rep. 2020, 10, 16182. [Google Scholar] [CrossRef] [PubMed]
- Meikle, P.J.; Formosa, M.F.; Mellett, N.A.; Jayawardana, K.S.; Giles, C.; Bertovic, D.A.; Jennings, G.L.; Childs, W.; Reddy, M.; Carey, A.L.; et al. HDL Phospholipids, but Not Cholesterol Distinguish Acute Coronary Syndrome from Stable Coronary Artery Disease. J. Am. Heart Assoc. 2019, 8, e011792. [Google Scholar] [CrossRef] [PubMed]
- Gerl, M.J.; Vaz, W.L.C.; Domingues, N.; Klose, C.; Surma, M.A.; Sampaio, J.L.; Almeida, M.S.; Rodrigues, G.; Araújo-Gonçalves, P.; Ferreira, J.; et al. Cholesterol is Inefficiently Converted to Cholesteryl Esters in the Blood of Cardiovascular Disease Patients. Sci. Rep. 2018, 8, 14764. [Google Scholar] [CrossRef] [PubMed]
- Anroedh, S.; Hilvo, M.; Akkerhuis, K.M.; Kauhanen, D.; Koistinen, K.; Oemrawsingh, R.; Serruys, P.; van Geuns, R.J.; Boersma, E.; Laaksonen, R.; et al. Plasma concentrations of molecular lipid species predict long-term clinical outcome in coronary artery disease patients. J. Lipid Res. 2018, 59, 1729–1737. [Google Scholar] [CrossRef]
- Feng, L.; Yang, J.; Liu, W.; Wang, Q.; Wang, H.; Shi, L.; Fu, L.; Xu, Q.; Wang, B.; Li, T. Lipid Biomarkers in Acute Myocardial Infarction Before and After Percutaneous Coronary Intervention by Lipidomics Analysis. Med. Sci. Monit. 2018, 24, 4175–4182. [Google Scholar] [CrossRef] [PubMed]
- Garcia, C.; Montée, N.; Faccini, J.; Series, J.; Meilhac, O.; Cantero, A.V.; Le Faouder, P.; Elbaz, M.; Payrastre, B.; Vindis, C. Acute coronary syndrome remodels the antiplatelet aggregation properties of HDL particle subclasses. J. Thromb. Haemost. 2018, 16, 933–945. [Google Scholar] [CrossRef] [Green Version]
- De Carvalho, L.P.; Tan, S.H.; Ow, G.-S.; Tang, Z.; Ching, J.; Kovalik, J.-P.; Poh, S.C.; Chin, C.-T.; Richards, A.M.; Martinez, E.C.; et al. Plasma Ceramides as Prognostic Biomarkers and Their Arterial and Myocardial Tissue Correlates in Acute Myocardial Infarction. Jacc Basic Transl. Sci. 2018, 3, 163–175. [Google Scholar] [CrossRef]
- Chatterjee, M.; Rath, D.; Schlotterbeck, J.; Rheinlaender, J.; Walker-Allgaier, B.; Alnaggar, N.; Zdanyte, M.; Müller, I.; Borst, O.; Geisler, T.; et al. Regulation of oxidized platelet lipidome: Implications for coronary artery disease. Eur. Heart J. 2017, 38, 1993–2005. [Google Scholar] [CrossRef] [PubMed]
- Zu, L.; Guo, G.; Zhou, B.; Gao, W. Relationship between metabolites of arachidonic acid and prognosis in patients with acute coronary syndrome. Thromb. Res. 2016, 144, 192–201. [Google Scholar] [CrossRef]
- Cheng, J.M.; Suoniemi, M.; Kardys, I.; Vihervaara, T.; de Boer, S.P.; Akkerhuis, K.M.; Sysi-Aho, M.; Ekroos, K.; Garcia-Garcia, H.M.; Oemrawsingh, R.M.; et al. Plasma concentrations of molecular lipid species in relation to coronary plaque characteristics and cardiovascular outcome: Results of the ATHEROREMO-IVUS study. Atherosclerosis 2015, 243, 560–566. [Google Scholar] [CrossRef]
- Park, J.Y.; Lee, S.H.; Shin, M.J.; Hwang, G.S. Alteration in metabolic signature and lipid metabolism in patients with angina pectoris and myocardial infarction. PLoS ONE 2015, 10, e0135228. [Google Scholar] [CrossRef] [PubMed] [Green Version]
- Meikle, P.J.; Wong, G.; Tsorotes, D.; Barlow, C.K.; Weir, J.M.; Christopher, M.J.; MacIntosh, G.L.; Goudey, B.; Stern, L.; Kowalczyk, A.; et al. Plasma Lipidomic Analysis of Stable and Unstable Coronary Artery Disease. Arterioscler. Thromb. Vasc. Biol. 2011, 31, 2723–2732. [Google Scholar] [CrossRef] [Green Version]
- Au, A. Metabolomics and Lipidomics of Ischemic Stroke. Adv. Clin. Chem 2018, 85, 31–69. [Google Scholar] [CrossRef]
- Dunn, W.B.; Broadhurst, D.I.; Atherton, H.J.; Goodacre, R.; Griffin, J.L. Systems level studies of mammalian metabolomes: The roles of mass spectrometry and nuclear magnetic resonance spectroscopy. Chem. Soc. Rev. 2011, 40, 387–426. [Google Scholar] [CrossRef]
- Wishart, D.S. Metabolomics for Investigating Physiological and Pathophysiological Processes. Physiol. Rev. 2019, 99, 1819–1875. [Google Scholar] [CrossRef] [PubMed]
- Stevens, V.L.; Hoover, E.; Wang, Y.; Zanetti, K.A. Pre-Analytical Factors that Affect Metabolite Stability in Human Urine, Plasma, and Serum: A Review. Metabolites 2019, 9, 156. [Google Scholar] [CrossRef] [PubMed] [Green Version]
- Kamlage, B.; Maldonado, S.G.; Bethan, B.; Peter, E.; Schmitz, O.; Liebenberg, V.; Schatz, P. Quality markers addressing preanalytical variations of blood and plasma processing identified by broad and targeted metabolite profiling. Clin. Chem 2014, 60, 399–412. [Google Scholar] [CrossRef] [PubMed]
- Liu, X.; Yin, P.; Shao, Y.; Wang, Z.; Wang, B.; Lehmann, R.; Xu, G. Which is the urine sample material of choice for metabolomics-driven biomarker studies? Anal. Chim. Acta 2020, 1105, 120–127. [Google Scholar] [CrossRef] [PubMed]
- Giskeødegård, G.F.; Andreassen, T.; Bertilsson, H.; Tessem, M.B.; Bathen, T.F. The effect of sampling procedures and day-to-day variations in metabolomics studies of biofluids. Anal. Chim. Acta 2019, 1081, 93–102. [Google Scholar] [CrossRef] [PubMed]
- Van de Merbel, N.C. Quantitative determination of endogenous compounds in biological samples using chromatographic techniques. Trac Trends Anal. Chem. 2008, 27, 924–933. [Google Scholar] [CrossRef]
- Siegel, D.; Permentier, H.; Reijngoud, D.J.; Bischoff, R. Chemical and technical challenges in the analysis of central carbon metabolites by liquid-chromatography mass spectrometry. J. Chromatogr. B Anal. Technol. Biomed. Life Sci. 2014, 966, 21–33. [Google Scholar] [CrossRef]
- Zivkovic, A.M.; Wiest, M.M.; Nguyen, U.T.; Davis, R.; Watkins, S.M.; German, J.B. Effects of sample handling and storage on quantitative lipid analysis in human serum. Metabolomics 2009, 5, 507–516. [Google Scholar] [CrossRef] [PubMed] [Green Version]
- Jobard, E.; Trédan, O.; Postoly, D.; André, F.; Martin, A.L.; Elena-Herrmann, B.; Boyault, S. A Systematic Evaluation of Blood Serum and Plasma Pre-Analytics for Metabolomics Cohort Studies. Int J. Mol. Sci 2016, 17, 2035. [Google Scholar] [CrossRef] [PubMed] [Green Version]
- Vuckovic, D. Current trends and challenges in sample preparation for global metabolomics using liquid chromatography-mass spectrometry. Anal. Bioanal. Chem. 2012, 403, 1523–1548. [Google Scholar] [CrossRef]
- Bowen, R.A.; Chan, Y.; Cohen, J.; Rehak, N.N.; Hortin, G.L.; Csako, G.; Remaley, A.T. Effect of blood collection tubes on total triiodothyronine and other laboratory assays. Clin. Chem 2005, 51, 424–433. [Google Scholar] [CrossRef] [Green Version]
- Clark, S.; Youngman, L.D.; Palmer, A.; Parish, S.; Peto, R.; Collins, R. Stability of plasma analytes after delayed separation of whole blood: Implications for epidemiological studies. Int. J. Epidemiol. 2003, 32, 125–130. [Google Scholar] [CrossRef] [PubMed] [Green Version]
- Teahan, O.; Gamble, S.; Holmes, E.; Waxman, J.; Nicholson, J.K.; Bevan, C.; Keun, H.C. Impact of analytical bias in metabonomic studies of human blood serum and plasma. Anal. Chem. 2006, 78, 4307–4318. [Google Scholar] [CrossRef] [PubMed]
- Liu, X.; Hoene, M.; Wang, X.; Yin, P.; Häring, H.U.; Xu, G.; Lehmann, R. Serum or plasma, what is the difference? Investigations to facilitate the sample material selection decision making process for metabolomics studies and beyond. Anal. Chim. Acta 2018, 1037, 293–300. [Google Scholar] [CrossRef] [Green Version]
- Wedge, D.C.; Allwood, J.W.; Dunn, W.; Vaughan, A.A.; Simpson, K.; Brown, M.; Priest, L.; Blackhall, F.H.; Whetton, A.D.; Dive, C.; et al. Is serum or plasma more appropriate for intersubject comparisons in metabolomic studies? An assessment in patients with small-cell lung cancer. Anal. Chem 2011, 83, 6689–6697. [Google Scholar] [CrossRef]
- Yu, Z.; Kastenmüller, G.; He, Y.; Belcredi, P.; Möller, G.; Prehn, C.; Mendes, J.; Wahl, S.; Roemisch-Margl, W.; Ceglarek, U.; et al. Differences between human plasma and serum metabolite profiles. PLoS ONE 2011, 6, e21230. [Google Scholar] [CrossRef]
- Malik, D.M.; Rhoades, S.; Weljie, A. Extraction and Analysis of Pan-metabolome Polar Metabolites by Ultra Performance Liquid Chromatography-Tandem Mass Spectrometry(UPLC-MS/MS). Bio-Protoc. 2018, 8, e2715. [Google Scholar] [CrossRef] [PubMed]
- Tambellini, N.P.; Zaremberg, V.; Turner, R.J.; Weljie, A.M. Evaluation of extraction protocols for simultaneous polar and non-polar yeast metabolite analysis using multivariate projection methods. Metabolites 2013, 3, 592–605. [Google Scholar] [CrossRef]
- Hyötyläinen, T. Critical evaluation of sample pretreatment techniques. Anal. Bioanal. Chem. 2009, 394, 743–758. [Google Scholar] [CrossRef]
- Panuwet, P.; Hunter, R.E., Jr.; D’Souza, P.E.; Chen, X.; Radford, S.A.; Cohen, J.R.; Marder, M.E.; Kartavenka, K.; Ryan, P.B.; Barr, D.B. Biological Matrix Effects in Quantitative Tandem Mass Spectrometry-Based Analytical Methods: Advancing Biomonitoring. Crit. Rev. Anal. Chem. 2016, 46, 93–105. [Google Scholar] [CrossRef] [PubMed] [Green Version]
- Tsakelidou, E.; Virgiliou, C.; Valianou, L.; Gika, H.G.; Raikos, N.; Theodoridis, G. Sample Preparation Strategies for the Effective Quantitation of Hydrophilic Metabolites in Serum by Multi-Targeted HILIC-MS/MS. Metabolites 2017, 7, 13. [Google Scholar] [CrossRef] [PubMed] [Green Version]
- Kole, P.L.; Venkatesh, G.; Kotecha, J.; Sheshala, R. Recent advances in sample preparation techniques for effective bioanalytical methods. Biomed. Chromatogr. 2011, 25, 199–217. [Google Scholar] [CrossRef] [PubMed]
- Alshammari, T.M.; Al-Hassan, A.A.; Hadda, T.B.; Aljofan, M. Comparison of different serum sample extraction methods and their suitability for mass spectrometry analysis. Saudi Pharm. J. 2015, 23, 689–697. [Google Scholar] [CrossRef] [PubMed] [Green Version]
- Rico, E.; González, O.; Blanco, M.E.; Alonso, R.M. Evaluation of human plasma sample preparation protocols for untargeted metabolic profiles analyzed by UHPLC-ESI-TOF-MS. Anal. Bioanal. Chem. 2014, 406, 7641–7652. [Google Scholar] [CrossRef] [PubMed]
- Heather, L.C.; Wang, X.; West, J.A.; Griffin, J.L. A practical guide to metabolomic profiling as a discovery tool for human heart disease. J. Mol. Cell. Cardiol. 2013, 55, 2–11. [Google Scholar] [CrossRef]
- Chang, M.S.; Ji, Q.; Zhang, J.; El-Shourbagy, T.A. Historical review of sample preparation for chromatographic bioanalysis: Pros and cons. Drug Dev. Res. 2007, 68, 107–133. [Google Scholar] [CrossRef]
- Biddlecombe, R.A.; Pleasance, S. Automated protein precipitation by filtration in the 96-well format. J. Chromatogr. B Biomed. Sci. Appl. 1999, 734, 257–265. [Google Scholar] [CrossRef]
- Ma, J.; Shi, J.; Le, H.; Cho, R.; Huang, J.C.; Miao, S.; Wong, B.K. A fully automated plasma protein precipitation sample preparation method for LC-MS/MS bioanalysis. J. Chromatogr. B Anal. Technol. Biomed. Life Sci. 2008, 862, 219–226. [Google Scholar] [CrossRef]
- Li, M.; Yang, L.; Bai, Y.; Liu, H. Analytical methods in lipidomics and their applications. Anal. Chem 2014, 86, 161–175. [Google Scholar] [CrossRef] [PubMed]
- Folch, J.; Lees, M.; Sloane Stanley, G.H. A simple method for the isolation and purification of total lipides from animal tissues. J. Biol. Chem. 1957, 226, 497–509. [Google Scholar] [CrossRef]
- Bligh, E.G.; Dyer, W.J. A rapid method of total lipid extraction and purification. Can. J. Biochem. Physiol. 1959, 37, 911–917. [Google Scholar] [CrossRef] [Green Version]
- Matyash, V.; Liebisch, G.; Kurzchalia, T.V.; Shevchenko, A.; Schwudke, D. Lipid extraction by methyl-tert-butyl ether for high-throughput lipidomics. J. Lipid Res. 2008, 49, 1137–1146. [Google Scholar] [CrossRef] [PubMed] [Green Version]
- Löfgren, L.; Ståhlman, M.; Forsberg, G.B.; Saarinen, S.; Nilsson, R.; Hansson, G.I. The BUME method: A novel automated chloroform-free 96-well total lipid extraction method for blood plasma. J. Lipid Res. 2012, 53, 1690–1700. [Google Scholar] [CrossRef] [PubMed] [Green Version]
- Barnes, B.B.; Snow, N.H. 3.44—Recent Advances in Sample Preparation for Explosives. In Comprehensive Sampling and Sample Preparation; Pawliszyn, J., Ed.; Academic Press: Oxford, UK, 2012; pp. 893–926. [Google Scholar] [CrossRef]
- Poole, C.F. Chapter 12 Principles and practice of solid-phase extraction. In Comprehensive Analytical Chemistry; Elsevier: Amsterdam, The Netherlands, 2002; Volume 37, pp. 341–387. [Google Scholar] [CrossRef]
- Sitnikov, D.G.; Monnin, C.S.; Vuckovic, D. Systematic Assessment of Seven Solvent and Solid-Phase Extraction Methods for Metabolomics Analysis of Human Plasma by LC-MS. Sci. Rep. 2016, 6, 38885. [Google Scholar] [CrossRef]
- Michopoulos, F.; Lai, L.; Gika, H.; Theodoridis, G.; Wilson, I. UPLC-MS-Based Analysis of Human Plasma for Metabonomics Using Solvent Precipitation or Solid Phase Extraction. J. Proteome Res. 2009, 8, 2114–2121. [Google Scholar] [CrossRef]
- Kordalewska, M.; Markuszewski, M.J. Metabolomics in cardiovascular diseases. J. Pharm. Biomed. Anal. 2015, 113, 121–136. [Google Scholar] [CrossRef]
- Xia, J.; Psychogios, N.; Young, N.; Wishart, D.S. MetaboAnalyst: A web server for metabolomic data analysis and interpretation. Nucleic Acids Res. 2009, 37, W652–W660. [Google Scholar] [CrossRef] [Green Version]
- Forsberg, E.M.; Huan, T.; Rinehart, D.; Benton, H.P.; Warth, B.; Hilmers, B.; Siuzdak, G. Data processing, multi-omic pathway mapping, and metabolite activity analysis using XCMS Online. Nat. Protoc. 2018, 13, 633–651. [Google Scholar] [CrossRef]
- Zhang, X.; Dong, J.; Raftery, D. Five Easy Metrics of Data Quality for LC-MS-Based Global Metabolomics. Anal. Chem. 2020, 92, 12925–12933. [Google Scholar] [CrossRef] [PubMed]
- Livera, A.M.D.; Sysi-Aho, M.; Jacob, L.; Gagnon-Bartsch, J.A.; Castillo, S.; Simpson, J.A.; Speed, T.P. Statistical Methods for Handling Unwanted Variation in Metabolomics Data. Anal. Chem. 2015, 87, 3606–3615. [Google Scholar] [CrossRef] [Green Version]
- Fan, S.; Kind, T.; Cajka, T.; Hazen, S.L.; Tang, W.H.W.; Kaddurah-Daouk, R.; Irvin, M.R.; Arnett, D.K.; Barupal, D.K.; Fiehn, O. Systematic Error Removal Using Random Forest for Normalizing Large-Scale Untargeted Lipidomics Data. Anal. Chem. 2019, 91, 3590–3596. [Google Scholar] [CrossRef] [PubMed]
- Kamleh, M.A.; Ebbels, T.M.D.; Spagou, K.; Masson, P.; Want, E.J. Optimizing the Use of Quality Control Samples for Signal Drift Correction in Large-Scale Urine Metabolic Profiling Studies. Anal. Chem. 2012, 84, 2670–2677. [Google Scholar] [CrossRef] [PubMed]
- Wang, S.Y.; Kuo, C.H.; Tseng, Y.J. Batch Normalizer: A fast total abundance regression calibration method to simultaneously adjust batch and injection order effects in liquid chromatography/time-of-flight mass spectrometry-based metabolomics data and comparison with current calibration methods. Anal. Chem 2013, 85, 1037–1046. [Google Scholar] [CrossRef] [PubMed]
- Cleveland, W.S.; Devlin, S.J. Locally Weighted Regression: An Approach to Regression Analysis by Local Fitting. J. Am. Stat. Assoc. 1988, 83, 596–610. [Google Scholar] [CrossRef]
- McGarrah, R.W.; Crown, S.B.; Zhang, G.-F.; Shah, S.H.; Newgard, C.B. Cardiovascular Metabolomics. Circ. Res. 2018, 122, 1238–1258. [Google Scholar] [CrossRef] [PubMed]
- De Livera, A.M.; Dias, D.A.; De Souza, D.; Rupasinghe, T.; Pyke, J.; Tull, D.; Roessner, U.; McConville, M.; Speed, T.P. Normalizing and Integrating Metabolomics Data. Anal. Chem. 2012, 84, 10768–10776. [Google Scholar] [CrossRef]
- Sabatine, M.S.; Liu, E.; Morrow, D.A.; Heller, E.; McCarroll, R.; Wiegand, R.; Berriz, G.F.; Roth, F.P.; Gerszten, R.E. Metabolomic Identification of Novel Biomarkers of Myocardial Ischemia. Circulation 2005, 112, 3868–3875. [Google Scholar] [CrossRef] [Green Version]
- Lewis, G.D.; Wei, R.; Liu, E.; Yang, E.; Shi, X.; Martinovic, M.; Farrell, L.; Asnani, A.; Cyrille, M.; Ramanathan, A.; et al. Metabolite profiling of blood from individuals undergoing planned myocardial infarction reveals early markers of myocardial injury. J. Clin. Invest. 2008, 118, 3503–3512. [Google Scholar] [CrossRef] [PubMed]
- Cao, B.; Wang, D.; Pan, Z.; Brietzke, E.; McIntyre, R.S.; Musial, N.; Mansur, R.B.; Subramanieapillai, M.; Zeng, J.; Huang, N.; et al. Characterizing acyl-carnitine biosignatures for schizophrenia: A longitudinal pre- and post-treatment study. Transl. Psychiatry 2019, 9, 19. [Google Scholar] [CrossRef] [PubMed] [Green Version]
- Diamanti, K.; Cavalli, M.; Pan, G.; Pereira, M.J.; Kumar, C.; Skrtic, S.; Grabherr, M.; Risérus, U.; Eriksson, J.W.; Komorowski, J.; et al. Intra- and inter-individual metabolic profiling highlights carnitine and lysophosphatidylcholine pathways as key molecular defects in type 2 diabetes. Sci. Rep. 2019, 9, 9653. [Google Scholar] [CrossRef] [Green Version]
- Guasch-Ferré, M.; Zheng, Y.; Ruiz-Canela, M.; Hruby, A.; Martínez-González, M.A.; Clish, C.B.; Corella, D.; Estruch, R.; Ros, E.; Fitó, M.; et al. Plasma acylcarnitines and risk of cardiovascular disease: Effect of Mediterranean diet interventions. Am. J. Clin. Nutr. 2016, 103, 1408–1416. [Google Scholar] [CrossRef]
- Makrecka-Kuka, M.; Sevostjanovs, E.; Vilks, K.; Volska, K.; Antone, U.; Kuka, J.; Makarova, E.; Pugovics, O.; Dambrova, M.; Liepinsh, E. Plasma acylcarnitine concentrations reflect the acylcarnitine profile in cardiac tissues. Sci. Rep. 2017, 7, 17528. [Google Scholar] [CrossRef] [Green Version]
- Law, S.-H.; Chan, M.-L.; Marathe, G.K.; Parveen, F.; Chen, C.-H.; Ke, L.-Y. An Updated Review of Lysophosphatidylcholine Metabolism in Human Diseases. Int. J. Mol. Sci. 2019, 20, 1149. [Google Scholar] [CrossRef] [Green Version]
- Sasagawa, T.; Suzuki, K.; Shiota, T.; Kondo, T.; Okita, M. The significance of plasma lysophospholipids in patients with renal failure on hemodialysis. J. Nutr. Sci. Vitam. 1998, 44, 809–818. [Google Scholar] [CrossRef] [PubMed]
- Okita, M.; Gaudette, D.C.; Mills, G.B.; Holub, B.J. Elevated levels and altered fatty acid composition of plasma lysophosphatidylcholine(lysoPC) in ovarian cancer patients. Int. J. Cancer 1997, 71, 31–34. [Google Scholar] [CrossRef]
- Rabini, R.A.; Galassi, R.; Fumelli, P.; Dousset, N.; Solera, M.L.; Valdiguie, P.; Curatola, G.; Ferretti, G.; Taus, M.; Mazzanti, L. Reduced Na(+)-K(+)-ATPase activity and plasma lysophosphatidylcholine concentrations in diabetic patients. Diabetes 1994, 43, 915–919. [Google Scholar] [CrossRef] [PubMed]
- Tan, S.T.; Ramesh, T.; Toh, X.R.; Nguyen, L.N. Emerging roles of lysophospholipids in health and disease. Prog. Lipid Res. 2020, 80, 101068. [Google Scholar] [CrossRef]
- Carneiro, A.V.; Costa, J.; Borges, M. Statins for primary and secondary prevention of coronary heart disease. A scientific review. Rev. Port. Cardiol. 2004, 23, 95–122. [Google Scholar] [PubMed]
- Hausenloy, D.J.; Yellon, D.M. Myocardial ischemia-reperfusion injury: A neglected therapeutic target. J. Clin. Invest. 2013, 123, 92–100. [Google Scholar] [CrossRef]
- Keeley, E.C.; Boura, J.A.; Grines, C.L. Primary angioplasty versus intravenous thrombolytic therapy for acute myocardial infarction: A quantitative review of 23 randomised trials. Lancet 2003, 361, 13–20. [Google Scholar] [CrossRef]
- Kalogeris, T.; Baines, C.P.; Krenz, M.; Korthuis, R.J. Cell biology of ischemia/reperfusion injury. Int. Rev. Cell Mol. Biol. 2012, 298, 229–317. [Google Scholar] [CrossRef] [Green Version]
- Chouchani, E.T.; Pell, V.R.; Gaude, E.; Aksentijević, D.; Sundier, S.Y.; Robb, E.L.; Logan, A.; Nadtochiy, S.M.; Ord, E.N.J.; Smith, A.C.; et al. Ischaemic accumulation of succinate controls reperfusion injury through mitochondrial ROS. Nature 2014, 515, 431–435. [Google Scholar] [CrossRef] [PubMed] [Green Version]
- Li, T.; Zhang, Z.; Kolwicz, S.C., Jr.; Abell, L.; Roe, N.D.; Kim, M.; Zhou, B.; Cao, Y.; Ritterhoff, J.; Gu, H.; et al. Defective Branched-Chain Amino Acid Catabolism Disrupts Glucose Metabolism and Sensitizes the Heart to Ischemia-Reperfusion Injury. Cell Metab 2017, 25, 374–385. [Google Scholar] [CrossRef] [Green Version]
- Dennis, E.A.; Norris, P.C. Eicosanoid storm in infection and inflammation. Nat. Rev. Immunol. 2015, 15, 511–523. [Google Scholar] [CrossRef] [Green Version]
- Li-Gao, R.; Hughes, D.A.; le Cessie, S.; de Mutsert, R.; den Heijer, M.; Rosendaal, F.R.; Willems van Dijk, K.; Timpson, N.J.; Mook-Kanamori, D.O. Assessment of reproducibility and biological variability of fasting and postprandial plasma metabolite concentrations using 1H NMR spectroscopy. PLoS ONE 2019, 14, e0218549. [Google Scholar] [CrossRef] [Green Version]
- Sampson, J.N.; Boca, S.M.; Shu, X.O.; Stolzenberg-Solomon, R.Z.; Matthews, C.E.; Hsing, A.W.; Tan, Y.T.; Ji, B.-T.; Chow, W.-H.; Cai, Q.; et al. Metabolomics in epidemiology: Sources of variability in metabolite measurements and implications. Cancer Epidemiol. Biomark. Prev. 2013, 22, 631–640. [Google Scholar] [CrossRef] [PubMed] [Green Version]
- Johnson, C.H.; Ivanisevic, J.; Siuzdak, G. Metabolomics: Beyond biomarkers and towards mechanisms. Nat. Rev. Mol. Cell Biol. 2016, 17, 451–459. [Google Scholar] [CrossRef] [PubMed] [Green Version]
- Pinu, F.R.; Goldansaz, S.A.; Jaine, J. Translational Metabolomics: Current Challenges and Future Opportunities. Metabolites 2019, 9, 108. [Google Scholar] [CrossRef] [Green Version]


| Technique | Advantages | Disadvantages |
|---|---|---|
| NMR | Highly reproducible results | Relatively low sensitivity compared to MS |
| Provides structural information about the compounds | Only suited for medium to high abundant metabolites (micro-molar range) | |
| Minimal requirement for sample preparation | Relatively longer data acquisition times compared to MS | |
| Non-destructive in nature and suitable for multiple analyses of the same sample | Highly pH-sensitive | |
| Allows investigation of tissue energetics and in vivo metabolism | ||
| Suitable for compounds which are otherwise difficult to ionize or derivatize | ||
| Appropriate to use with samples with high salt content, including urine | ||
| Well-established NMR spectra library to aid data analysis | ||
| Ability to detect different isomeric products | ||
| GC/MS | Method of choice for the analysis of volatile/non-polar metabolites | Detection of polar metabolites is difficult and needs chemical derivatization. |
| Increased signal-to-noise (S/N) ratios and relatively better resolution | Limited metabolome coverage | |
| Publicly available spectral libraries for compound identification | The high temperature applied in GC/MS can cause degradation or transformation of compounds. | |
| LC/MS | Ability to analyze metabolites with a wide range of polarity, including thermally unstable ones | Not suitable for the analysis of gaseous mixtures |
| Quicker and less extensive sample extraction procedures | Decreased sensitivity due to ion suppression | |
| Suitable for measurement of compounds of lower volatility | Difficulty in distinguishing isomers (both structural and positional) of molecules | |
| Requires little sample volume |
| No. | First Author, Year | Sample Size | Sampling Time | Specimen/ Technique | Main Findings |
|---|---|---|---|---|---|
| 1 | W Zhong [43], 2021 | 284 ACS; 130 HC | At the time of hospital admission | Plasma LC/MS | Phenylalanine, arginine, and proline metabolism and synthesis and degradation of ketone bodies are involved in ACS pathogenesis. |
| 2 | E Chorell [44], 2021 | 50 STEMI; 50 NSTEMI; 100 HC | After fasting for 4 h | Plasma GC/MS, LC/MS | Plasma lysophospholipids ratio (LPC:LPE) could predict future risk in STEMI and NSTEMI patients. |
| 3 | N Aa [45], 2021 | 85 MI; 61 non-MI chest pain; 84 HC | Within 6 h of the initial symptom attack | Plasma GC/MS, LC/MS | Patients with MI had elevated plasma levels of deoxyuridine, methionine, and homoserine. |
| 4 | H Chen [46], 2021 | Discovery: 942 Validation: 493 | After fasting for 8 h | Plasma LC/MS | Perturbations in cysteine and methionine metabolism and glycerophospholipid metabolism are associated with CAD severity. |
| 5 | A Mehta [47], 2020 | Discovery: 454 Validation: 322 | After overnight fasting | Plasma LC/MS | Perturbations in tryptophan, lysine, tyrosine, asparagine/aspartate, urea cycle, and the carnitine shuttle metabolism are associated with mortality in CAD patients. |
| 6 | J Li [48], 2020 | 136 NOCAD; 118 AMI | After overnight fasting | Serum LC/MS | 23 differential metabolites were identified between AMI and NOCAD, including 12 acylcarnitines, 7 fatty acids, 3 glycerophospholipids, and L-tryptophan. |
| 7 | H Jiang [49], 2020 | 252 ACS | After initial diagnosis of ACS | Serum LC/MS | A total of four metabolites including isoundecylic acid, betaine, 1-heptadecanoyl-sn-glycero-3-phosphocholine, and acetylcarnitine could discriminate stable and vulnerable plaques. |
| 8 | A Khan [50], 2020 | 112 patients at AMI risk; 89 HC | During routine blood collection after overnight fasting | Serum LC/MS | L-homocysteine sulfinic acid, cysteic acid, and carnitine could serve as predictive markers for AMI risk. |
| 9 | M Pouralijan Amiri [35], 2020 | 94 UA; 32 controls (angina, but no CAD) | After coronary angiography | Plasma H-NMR | 17 metabolites involved in pathways such as steroid hormone biosynthesis, aminoacyl-tRNA biosynthesis, and lysine degradation could serve as promising biomarkers for UA diagnosis. |
| 10 | A Vignoli [32], 2020 | 825 total, 702 survivors and 123 deceased | 24–48 h after the PCI and overnight fasting | Serum H-NMR | Characterization of metabolite–metabolite association, can be used as a potential tool to predict mortality in AMI patients. |
| 11 | G Gundogdu [51], 2020 | 20 STEMI; 15 HC | Within an hour of the initial symptom attack | Serum LC/MS | Malonic acid, maleic acid, fumaric acid, and palmitic acid could be used for the diagnosis of STEMI. |
| 12 | A Surendran [52], 2019 | 27 STEMI | Pre-PCI, 2, 24, and 48 h post-PCI | Plasma LC/MS | Identified lipids and lipid-derived molecules as the major constituents of the altered metabolomic profile prior to PCI and in the follow-up time intervals post-PCI. |
| 13 | J Wang [53], 2019 | 40 UA; 39 HC | Blood samples taken at the same day of inclusion in the study | Plasma LC/MS | 27 metabolites, including free fatty acids, amino acids, LPE, LPC, and organic acids, can be used to diagnose UA patients. |
| 14 | M Deidda [42], 2019 | 15 STEMI | Coronary artery blood sampling during PCI | Plasma H-NMR | Coronary blood fingerprint in STEMI patients was represented by choline, phosphocholine, myo-inositol, lysine, ornithine, and 2-phosphoglycerate metabolites. |
| 15 | A Vignoli [54], 2019 | Training: 80 survivors and 40 deceased Validation: 752 survivors and 106 deceased | 24–48 h after the PCI and overnight fasting | Serum H-NMR | Mortality in AMI patients was associated with elevated serum levels of acetone, 3-hydroxybutyrate, mannose, creatinine, acetate, formate, proline, and lower serum levels of valine and histidine. |
| 16 | VAM Goulart [55], 2019 | 15 STEMI; 19 HC | Within 7 h after hospitalization | Plasma LC/MS | STEMI metabolic fingerprint includes perturbations associated with phosphatidylcholines, lysophosphatidylcholines, sphingomyelins, and biogenic amine species. |
| 17 | Y Wang [56], 2018 | 36 ACS; 30 HC | Not specified | Urine LC/MS | Identified fatty acid metabolism, fatty acid β-oxidation, amino acid metabolism, and TCA cycle as critical pathways associated with ACS pathogenesis |
| 18 | X Du [57], 2018 | 96 STEMI with post-PCI AEs; 96 without AEs | Arterial blood before coronary angiography | Plasma LC/MS | Circulating levels of branched-chain amino acids (BCAAs) were associated with the risk of adverse cardiovascular events in STEMI patients. |
| 19 | X Du [58], 2018 | 138 STEMI with AHF; 138 STEMI without AHF | At the time of hospital admission | Plasma LC/MS | Elevated plasma BCAA levels were associated with long-term adverse cardiovascular events in patients with STEMI and AHF. |
| 20 | L Huang [59], 2018 | 44 STEMI (22 LMCAD and 22 non-LMCAD); 22 HC | At the time of hospital admission | Plasma LC/MS | Retinol metabolism was the most perturbed metabolic pathway for the LMCAD phenotype. |
| 21 | D Dazhi [41], 2018 | 45 AMI; 45 chest pain controls (CPCS) | At the time of hospital admission and prior to any medication | Serum H-NMR | Multiple altered metabolic pathways, including the TCA cycle, lipoprotein changes, anaerobic glycolysis, gluconeogenesis, and fatty acid metabolism, characterize AMI patients compared to CPCS. |
| 22 | M Kohlhauer [60], 2018 | 115 STEMI; 26 control patients (SA/NSTEMI) | Immediately after stent deployment | Plasma LC/MS | Increased levels of myocardial succinate are found in STEMI patients. |
| 23 | L Zhang [61], 2018 | 2,324 patients who underwent coronary angiography | Before coronary angiography | Plasma LC/MS | N-acetylneuraminic acid plays a key role during CAD progression. |
| 24 | X Yin [62], 2018 | 20 STEMI; 20 non-ACS patients | Pre-PCI | Plasma LC/MS, ICP/MS | ACS patients are characterized by disturbances in LPC, caffeine, glycolysis, tryptophan, and sphingomyelin metabolism. |
| 25 | W Yao [33], 2017 | 22 UA; 22 HC | Within 24 h after overnight fasting | Serum H-NMR | UA patients are characterized by perturbations in phospholipid and amino acid metabolism. |
| 26 | SE Ali [63], 2016 | 30 STEMI; 15 UA; 15 HC | 1–2 h post-chest pain for STEMI patients, before and after angioplasty for UA patients | Serum GC/MS, SPME-GC/MS, H-NMR | Elevated levels of serum hydrogen sulfide could discriminate STEMI patients from UA patients. |
| 27 | Y Fan [64], 2016 | Discovery: 1086 Validation: 933 | Before coronary angiography | Plasma LC/MS | 89 differential metabolites were identified between and within different CAD subtypes. |
| 28 | X Xu [65], 2015 | 38 SA; 34 AMI; 71 HC | After overnight fasting | Serum LC/MS | Different lipid classes, including fatty acids, steroids, phospholipids, sphingolipids, and glycerolipids, are associated with CAD progression. |
| 29 | L Huang [66], 2016 | 47 STEMI (23 youth, 24 elderly), 48 healthy controls (24 youth, 24 elderly) | Post-PCI | Plasma LC/MS | The most perturbed metabolic pathway in young STEMI patients was sphingolipid metabolism. |
| 30 | K Ameta [34], 2016 | 65 UA; 62 HC | Within 4 h of onset of angina | Serum H-NMR | Five significantly altered metabolites, namely valine, alanine, glutamine, inosine, and adenine, differentiate UA patients from HC. |
| 31 | Z Li [36], 2015 | 27 UA; 20 HC | In the morning after fasting for 12 h | Urine H-NMR | 20 metabolites, including energy metabolism-related metabolites and amino acids, could discriminate UA patients from HC. |
| 32 | S Naz [67], 2015 | Discovery: 16 STEMI; 16 NSTEMI Validation: 20 STEMI; 28 NSTEMI | Pre-PCI | Serum LC/MS | Carnitine-related compounds and amino acids were differentially present in STEMI and NSTEMI conditions. |
| 33 | CM Laborde [68], 2013 | Discovery: 35 NSTEACS; 35 HC Validation: 15 NSTEACS; 15 HC | At the onset of the syndrome | Plasma GC/MS, LC/MS | A panel of metabolites consisting of 5-OH-tryptophan, 2-OH-butyric acid, and 3-OH-butyric acid could serve as markers for the early diagnosis of ACS. |
| 34 | M Sun [69], 2013 | 45 UA; 43 atherosclerosis controls | In the morning after overnight fasting | Plasma LC/MS | 16 potential endogenous biomarkers for UA were identified including kynurenine. |
| 35 | J Teul [70], 2011 | 19 NSTEACS; 6 HC | Immediately before coronary angiography, day 4, 2 months and 6 months after diagnosis | Plasma GC/MS | 27 metabolites including glucose, fructose, myoinositol, pyruvate, lactate, and succinate varied with time following an ACS event. |
| 36 | M Vallejo [71], 2009 | 9 NSTEACS; 10 stable atherosclerosis; 10 HC | In the morning after fasting on the 4th day of hospital stay | Plasma GC/MS | Plasma fingerprinting characterizes a key role for 4-hydroxyproline in ACS. |
| No | First Author, Year | Sample Size | Sampling Time | Specimen/ Technique | Main Findings |
|---|---|---|---|---|---|
| 1 | L Zhang [88], 2021 | 20 STEMI | 30 min before PCI; 6, 12, 24, and 72 h after PCI; 1 day before discharge; and 28 days after PCI | Plasma LC/MS | The circulating levels of PGE2, PGD2, and TXA2 were significantly lower at 6 h post-PCI in STEMI patients. The levels of 20-HETE content were significantly higher at 12–72 h post-PCI. |
| 2 | J Burrello [89], 2020 | 7 STEMI; 9 controls | Pre-PCI, and 24 h post-PCI | Isolated EV Plasma LC/MS | The levels of ceramides, dihydroceramides, and sphingomyelins in extracellular vesicles increased in STEMI compared to matched controls and decreased post-PCI. |
| 3 | PJ Meikle [90], 2019 | 47 ACS; 83 stable CAD | Before coronary catheterization | Plasma LC/MS | Venous plasma lipid species was better than traditional risk factors in discriminating ACS from stable CAD. |
| 4 | JH Lee [87], 2018 | 30 CAD, 10 ACS, 10 with stable CAD without ACS | Not specified | Plasma LC/MS | Two LPC species (16:0 and 18:0) were significantly elevated only in the HDL of the ACS group vs. the stable CAD group, whereas PE species (38:5 and 40:5) were elevated in ACS by >2-fold in both HDL and LDL. |
| 5 | MJ Gerl [91], 2018 | 74 ACS, 78 SA, 21 IS, 52 HC | Within the first 24 h of hospital admission | Plasma LC/MS | The levels of LPC and ratios of CE to free cholesterol were decreased in the CVD subjects compared to control subjects. |
| 6 | S Anroedh [92], 2018 | 581 ACS; 155 MACEs | Prior to coronary angiography or PCI | Plasma LC/MS | The circulating ceramides were associated with MACEs independent of clinical risk factors in CAD patients. |
| 7 | L Feng [93], 2018 | 40 STEMI | Pre-PCI, 2 h and 24 h post-PCI | Plasma LC/MS | 16 circulating fatty acids were associated with myocardial reperfusion injury. |
| 8 | C Garcia [94], 2018 | 30 ACS; 30 No CAD | Before hospital discharge | Plasma LC/MS | HDL2 subclass from ACS patients was enriched with oxidized polyunsaturated fatty acids. |
| 9 | LP de Carvalho [95], 2018 | Discovery: 337 Validation: 119 | Pre-angiography and within 24 h post-angiography | Tissue, Plasma LC/MS | 11 ceramides (C14 to C26) and 1 dihydroceramide (C16) were associated with MACEs in patients with AMI. |
| 10 | M Chatterjee [96], 2017 | 175 symptomatic CAD; 15 HC | During coronary angiography | Platelet LC/MS | Symptomatic CAD patients were characterized by a perturbed platelet lipidome. |
| 11 | L Zu [97], 2016 | 39 MACE; 39 Non-MACE; 39 controls | During coronary angiography | Plasma LC/MS | The plasma level of 19-HETE is useful for the prognosis of ACS after adjustment for clinical risk factors. |
| 12 | JM Cheng [98], 2015 | 162 STEMI; 151 NSTEACS; 261 stable CAD | Prior to coronary angiography | Plasma LC/MS | Plasma ceramide (d18:1/16:0) was associated with vulnerable plaque and 1-year MACE. |
| 13 | F Rached [86], 2015 | 16 STEMI; 10 controls | Within 24 h after diagnosis | Plasma LC/MS | The lipidome of HDL particles were markedly altered in STEMI. |
| 14 | I Sutter [85], 2015 | 23 stable CAD; 22 ACS; 22 HC | Within 12 h of the initial symptom attack | Plasma LC/MS | HDL-plasmalogen levels were inversely associated with both stable and acute CAD. |
| 15 | JY Park [99], 2015 | 140 CAD; 70 HC | After fasting for 12 h | Serum LC/MS | PC containing palmitic acid, DG, SM, and Cer were associated with an increased risk of MI, whereas PE-plasmalogen and PI were associated with a decreased risk. |
| 16 | PJ Meikle [100], 2011 | 60 SA; 80 UA; 80 HC | Not specified | Plasma LC/MS | The study showed that multivariate models using multiple lipid species can stratify unstable and stable CAD patients with improved accuracy compared to traditional risk factors. |
Publisher’s Note: MDPI stays neutral with regard to jurisdictional claims in published maps and institutional affiliations. |
© 2021 by the authors. Licensee MDPI, Basel, Switzerland. This article is an open access article distributed under the terms and conditions of the Creative Commons Attribution (CC BY) license (https://creativecommons.org/licenses/by/4.0/).
Share and Cite
Surendran, A.; Atefi, N.; Zhang, H.; Aliani, M.; Ravandi, A. Defining Acute Coronary Syndrome through Metabolomics. Metabolites 2021, 11, 685. https://doi.org/10.3390/metabo11100685
Surendran A, Atefi N, Zhang H, Aliani M, Ravandi A. Defining Acute Coronary Syndrome through Metabolomics. Metabolites. 2021; 11(10):685. https://doi.org/10.3390/metabo11100685
Chicago/Turabian StyleSurendran, Arun, Negar Atefi, Hannah Zhang, Michel Aliani, and Amir Ravandi. 2021. "Defining Acute Coronary Syndrome through Metabolomics" Metabolites 11, no. 10: 685. https://doi.org/10.3390/metabo11100685