1. Introduction
Real-time data analytics usually involve both obtaining streams of live data and analyzing all data consistently [
1]. This kind of analytics has been widely used for business intelligence in a wide range of applications.
To begin with, some works have proposed real-time processing frameworks for social media analytics (SMA). For instance, Hammou et al. [
2] proposed a real-time processing framework for analyzing social big data based on a distributed recurrent neural network. This framework used deep learning techniques for supporting decision-making processes based on SMA. They applied sentiment analysis. SMA is usually related with customer engagement and business performance [
3]. SMA usually enhances customer engagement and consequently business performance, as revealed in a study with senior and mid-level managers and consultants in industries about retail and information technology from India.
In the context of healthcare, some applications analyze real-time data. For example, Vankipuram et al. [
4] presented a mobile application that supported both collection and analysis of real-time critical care data. They focused on advanced trauma life support, and their app tracked activities during a trauma phase in patients. It also provided real-time feedback of deviations from guidelines and protocol. Physicians highly rated this app.
In the cryptocurrency field, real-time analytics and prediction can be really useful for investors. In particular, Shu and Zhu [
5] proposed a real-time mechanism for predicting Bitcoin bubble crashes. They presented an adaptive multilevel time series detection methodology based on the log-periodic power law singularity confidence indicators. Their approach was useful when analyzing time series with frequencies of 1 h or 30 min of price data.
In the analysis of wireless sensor data, one of the key aspects is the temporal constraints for processing all the data [
6]. In warehousing approaches, data are stored in a central database, and in distributed approaches, sensor devices contain local databases and manage them locally so they need handling real-time storage and querying.
The Internet-of-Things (IoT) has helped to improve the monitoring of smart cities. In particular, behavior-based learning can help to understand the circumstances of smart city environments [
7]. Information about smart cities can be useful for taking decisions concerning the usage of IoT sensor frequency as well as taking business decisions on where to publicize some services. In fact, smart cities have contributed to tourism in some regions as Mediterranean coast [
8].
Works about data collection focus on different aspects. Some works focus on the reliability of data. For instance, Lv and Zhu [
9] focused on the filtering process for only collecting reliable data.
In particular, they proposed a trust evaluation scheme based on a fuzzy algorithm and considering
measures such as direct trust, recommendation trust and link trust. Other works aim at achieving a high
performance in data collection. For example, Luo et al. [
10] presented and analyzed different algorithms
for data collection in unmanned aerial vehicles (UAVs) especially considering and comparing efficiency,
as this was critical due to the restrictions of batteries in UAVs.
Regarding data analytics, works apply different mechanisms. Some works perform sentiment
analysis from online sources. For instance, Ireland and Liu [
11] conducted sentiment analysis on
online product reviews for designing products. Their proposed framework was aimed at automatically
identifying customer needs. It quantified the sentiments about product features so designers could
take informed decisions.
Many other data analytics works use machine learning classification. In these cases, the systems
are trained from existing data that are labeled. Then, the system can classify non-labeled data into
different categories. For example, Gupta et al. [
12] applied machine learning for identifying security
threats. Their system was firstly trained with known threats, so the system learned to identify
unknown threats.
Among many other machine learning techniques, neural networks are inspired in the biological
neurons to provide a system that can learn from datasets by adjusting weights of each artificial
neuron in these networks. One of the most common neural networks is multi-layer perceptron, and
this usually uses backpropagation algorithm for training. Multi-layer perceptron networks have
been widely used for learning analytics. For instance, Malalur and Manry [
13] analyzed the optimal
learning factors on each neuron of hidden layers for providing an improved version of the batch
training algorithms. For instance, multi-layer perceptron networks were used for online phoneme
recognition [
14] illustrating this with a classification of Portuguese phonemes into one of the groups
of phonemes.
Nevertheless, none of the aforementioned related works proposed a technique for analyzing online sources in real-time covering from online data collection to the implementation of the decision support systems (DSSs) with human-centric artificial intelligence (HAI) applied over time series,
considering several completely different domains. The current work covers this gap of the literature by proposing a novel technique for implementing DSSs with HAI based on the analysis of time series from online sources, experimented in two different scenarios.
In this line of research, the proposed technique covers both common phases of real-time data analytics. Firstly, it provides a framework for supporting collection of real-time data. Secondly, it provides a mechanism for storing summarized data and performing different strategies based on the streams of data. This technique has been illustrated firstly with the Bitcoin field, due to the interest of some business-intelligence investor companies, thanks to the possible high benefit profits. Secondly, this approach has been illustrated with information from IoT sensors from smart cities, since some decisions based on this information usually need to be taken in real time.
Readers can benefit from this work by adopting this framework to incorporate software that supports real-time data management for being alerted of real-time opportunities in order to improve their business or their support to citizens of smart cities as some examples. This approach has been applied to two different fields (i.e., cryptocurrency investments and analysis of smart city sensors), so that readers can be aware that this approach is fairly general and can be applied to different fields. This work encourages scientific community and engineers to apply this approach to other fields.
We have applied our approach to such different domains to show the versatility of the proposed approach. The first application domain of cryptocurrency highlights the importance of taking decisions in very short time intervals (i.e., within hours). The second case study shows the importance of taking decisions based on information perceived by sensors (in this particular case with energy consumption). We have used datasets to prove the concept of the proposed approach with a reasonable amount of data, but we have also developed the tools for extracting real-time data.
The remainder of the paper is organized as follows. The next section presents the material and methods, presenting the system for supporting real-time decisions, introducing our framework and indicating the method for evaluating this research.
Section 3 presents the results of the experimentation in the fields of Bitcoins and IoT sensors in smart cities.
Section 4 discusses the main findings observed in the results, and
Section 5 mentions the most relevant conclusions.
2. Materials and Methods
2.1. Framework for Supporting Real-Time Decisions
We have developed a novel framework for facilitating the extraction of real-time information from online websites and supporting real-time decisions with an updated warehouse.
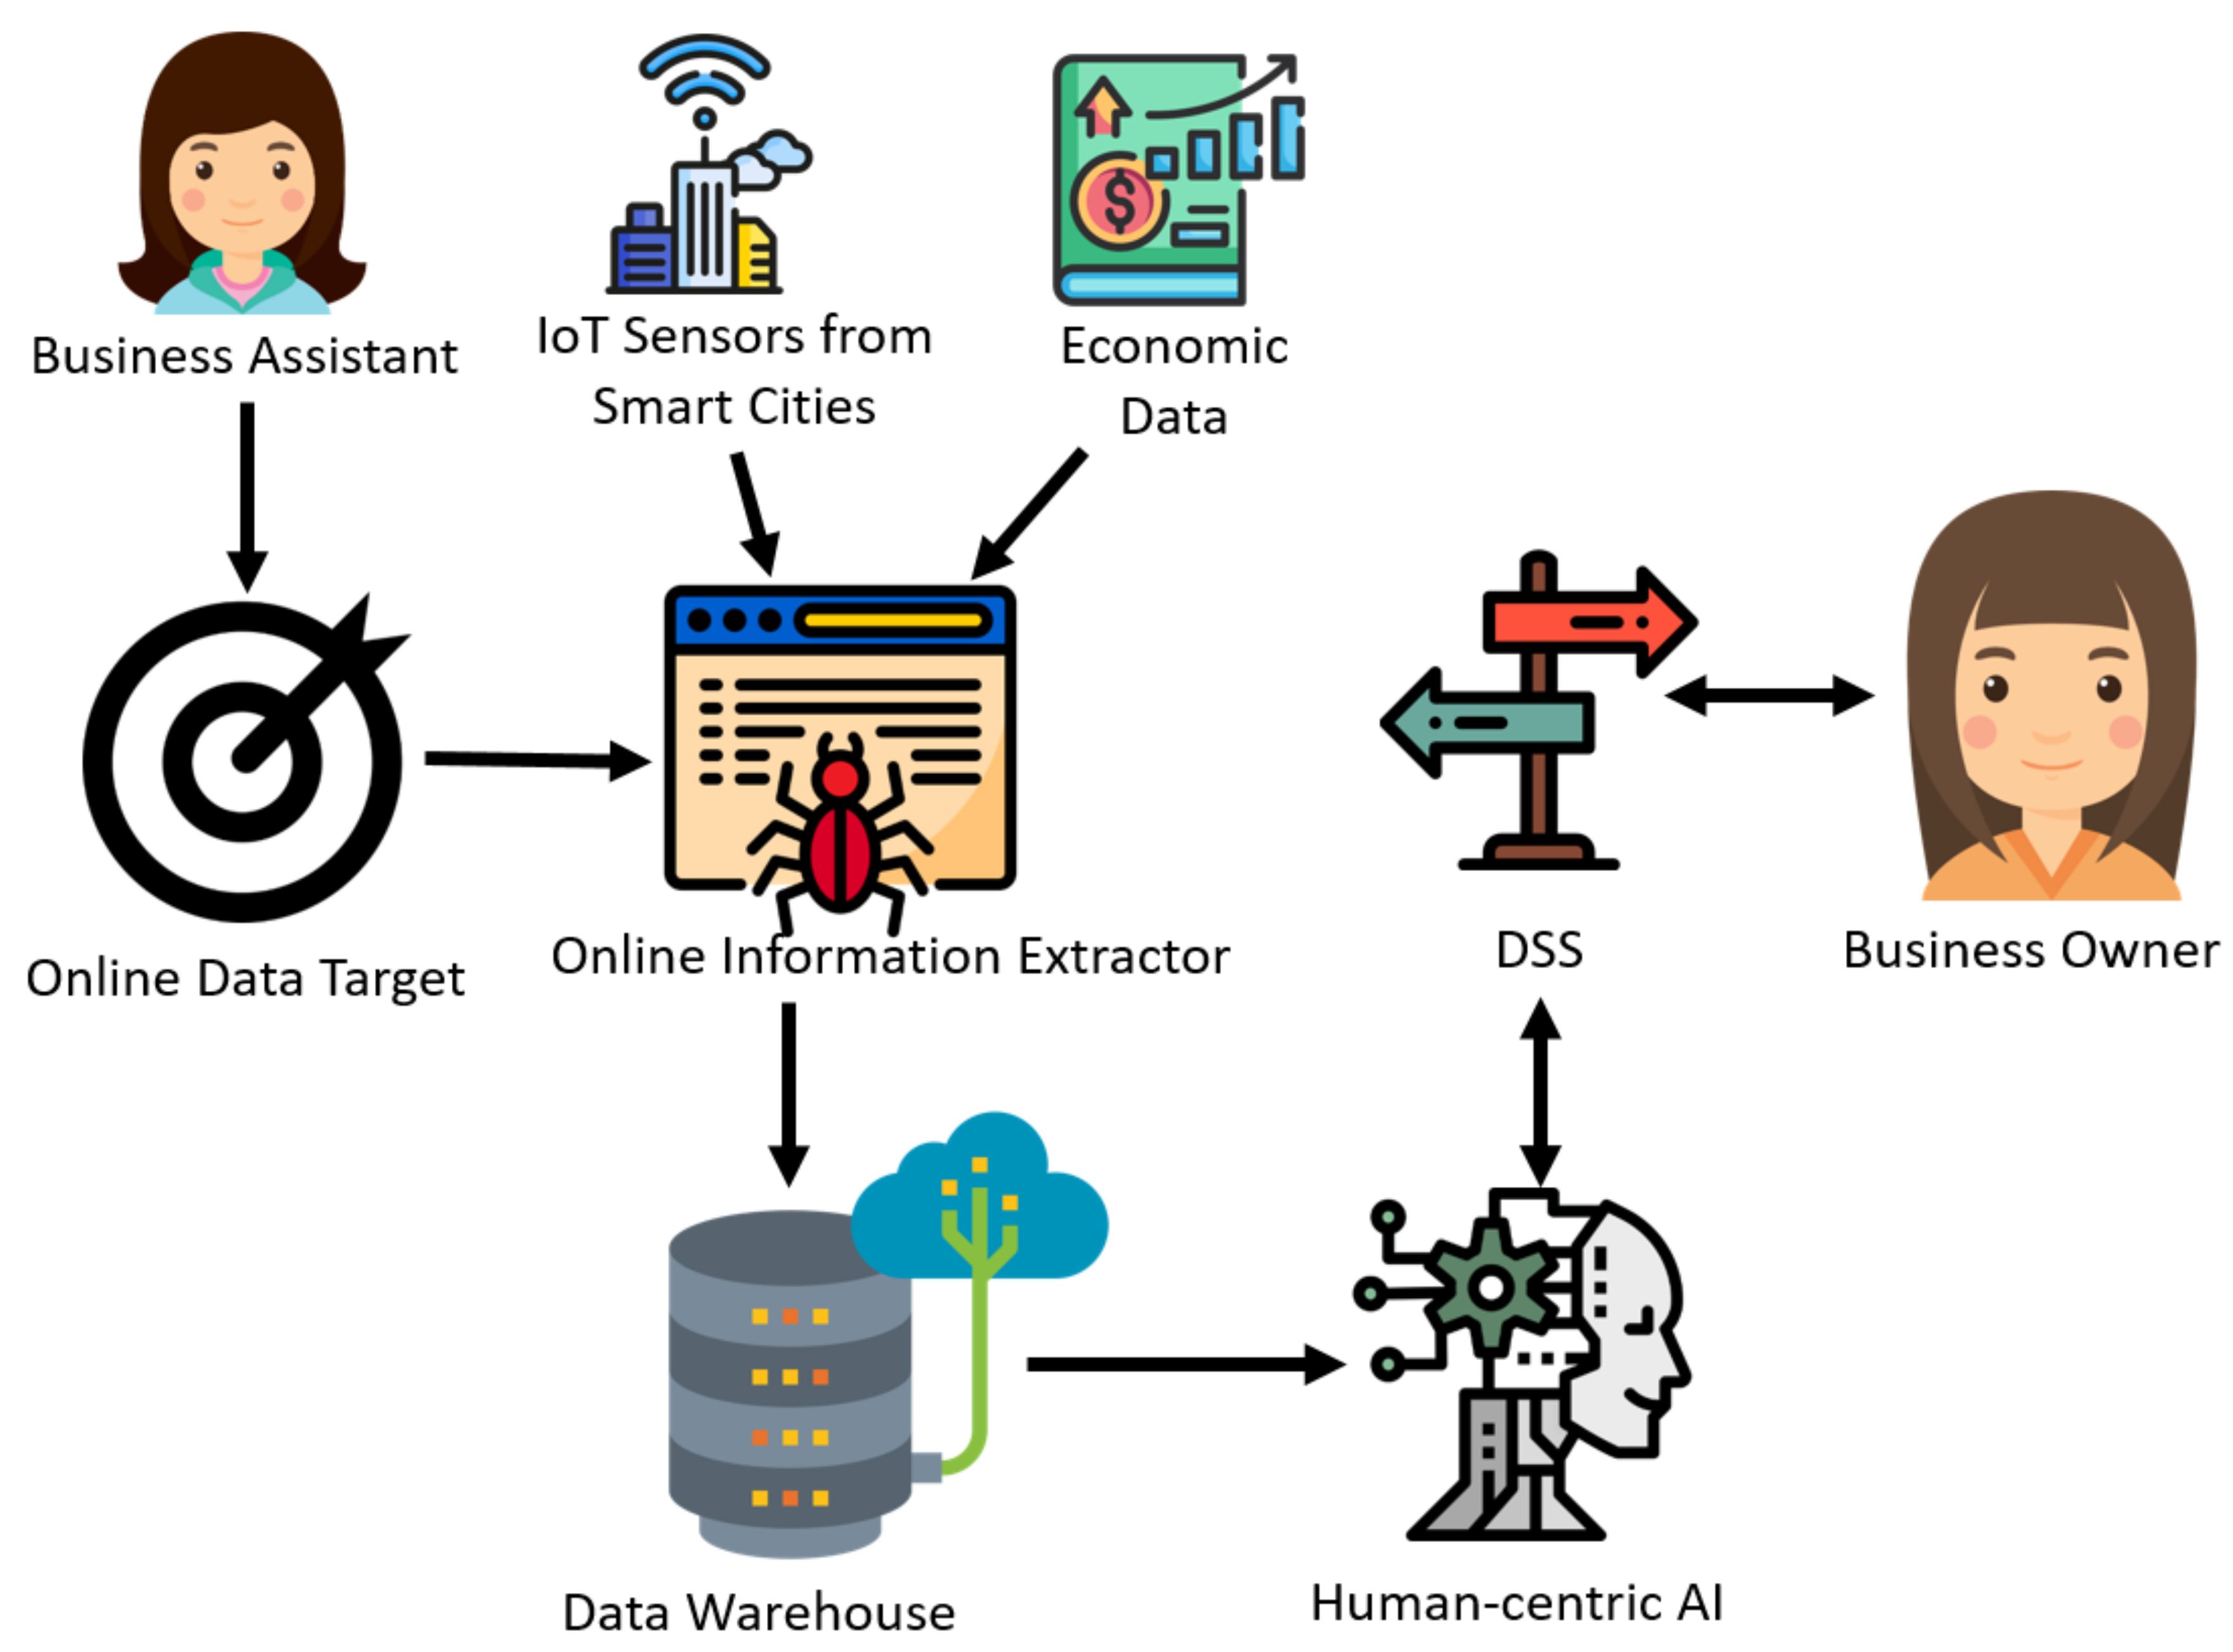
Figure 1 presents an overview of the main components.
In the proposed approach, the business owner decides the field to invest. The business assistant searches the most reliable websites with real-time data, and selects the online data target, indicating the website and the necessary information for retrieving the data (e.g., ID of HTML element, XPATH expression or element class and its relative position). Then the online information extractor (also referred as crawler) is configured with this information thanks to the proposed framework. This crawler receives input from the online data target and feeds a data warehouse. Different investor strategies can be applied to implement the DSS for assisting the business owner in their decision.
This approach recommends the inclusion of HAI when appropriate. The goal of HAI is to automatically solve problems or suggest decisions providing explanations to human beings, so that these can better understand and validate these solutions or suggestions. HAI supports the generation of explanations so humans can understand the suggestions of artificial intelligence (AI). HAI can generate these explanations based on statistics of data (generally retrieved from the training dataset) or by interpreting the values of a learned model in machine learning [
15]. In particular, this approach proposes to generate HAI explanations based on the incremental calculation of features or real-time data. Between obtaining data and calculations, the system extracts the time series of moving means (MMs). MMs are average values calculated from a certain number of last samples for each moment. In this way, MMs reduce short-time fluctuations, as these are softened by the calculation of the average of a representative number of the last samples. It compares the time series with other time series used in the learning phase. Given the most similar one, the system applies a rule for generating a template-based explanation given the category of the most similar case from learning phase. This template is filled with some value calculated by concatenating strings. For example, in most common cases, it calculates whether MM differences have surpassed certain thresholds for certain time durations, and prints the relevant percentage difference and its duration. For example, in the field of Bitcoin investor strategies, the proposed approach is based on the generation of explanations about the incrementally and efficiently calculated MMs such as “the moving mean has decreased X.X% since X hours ago, so we recommend you to sell your Bitcoins assets immediately”. In the proposed approach, the moving mean is obtained with constant computational complexity, since the sum of moving mean is updated by just summing the last price value and subtracting the first element of the moving window.
In the case that the information is read from some smart IoT sensors in smart cities, the proposed approach could take this information through the available website displaying this data. In fact, the proposed frameworks based on IoT for smart sustainable cities [
16] can provide online information, so citizens are more aware of the situation of the city, in aspects such as traffic or air pollution. The proposed approach can be applied in this context by using this online information for supporting business intelligence decisions such as where to publicize services and when to increasing the frequency of data collection in certain IoT sensors with noticeable energy consumption. In these cases, HAI explanations will be generated based on the analysis of MMs.
For implementing the DSS, this approach recommends to apply either a rule-based system or machine-learning system departing from the analysis of time series. In the illustration of our approach, we have developed this software in Python with the Scikit-learn library for the case of machine learning.
Machine learning is used to learn from pairs of situations and expert recommendations. Then, when a new situation comes up, a new recommendation is generated for the given situation based on the common machine learning algorithm called nearest neighbor. Our goal is to provide recommendations that are useful for a given scenario in real-time without needing people working all day long.
In the case of machine learning, the generation of HAI explanations uses our previously developed software for generating explanations from learned Scikit-learn neural network models [
15]. In the case of a rule-based system, this approach uses explanation templates associated with the rules filled with some numeric data.
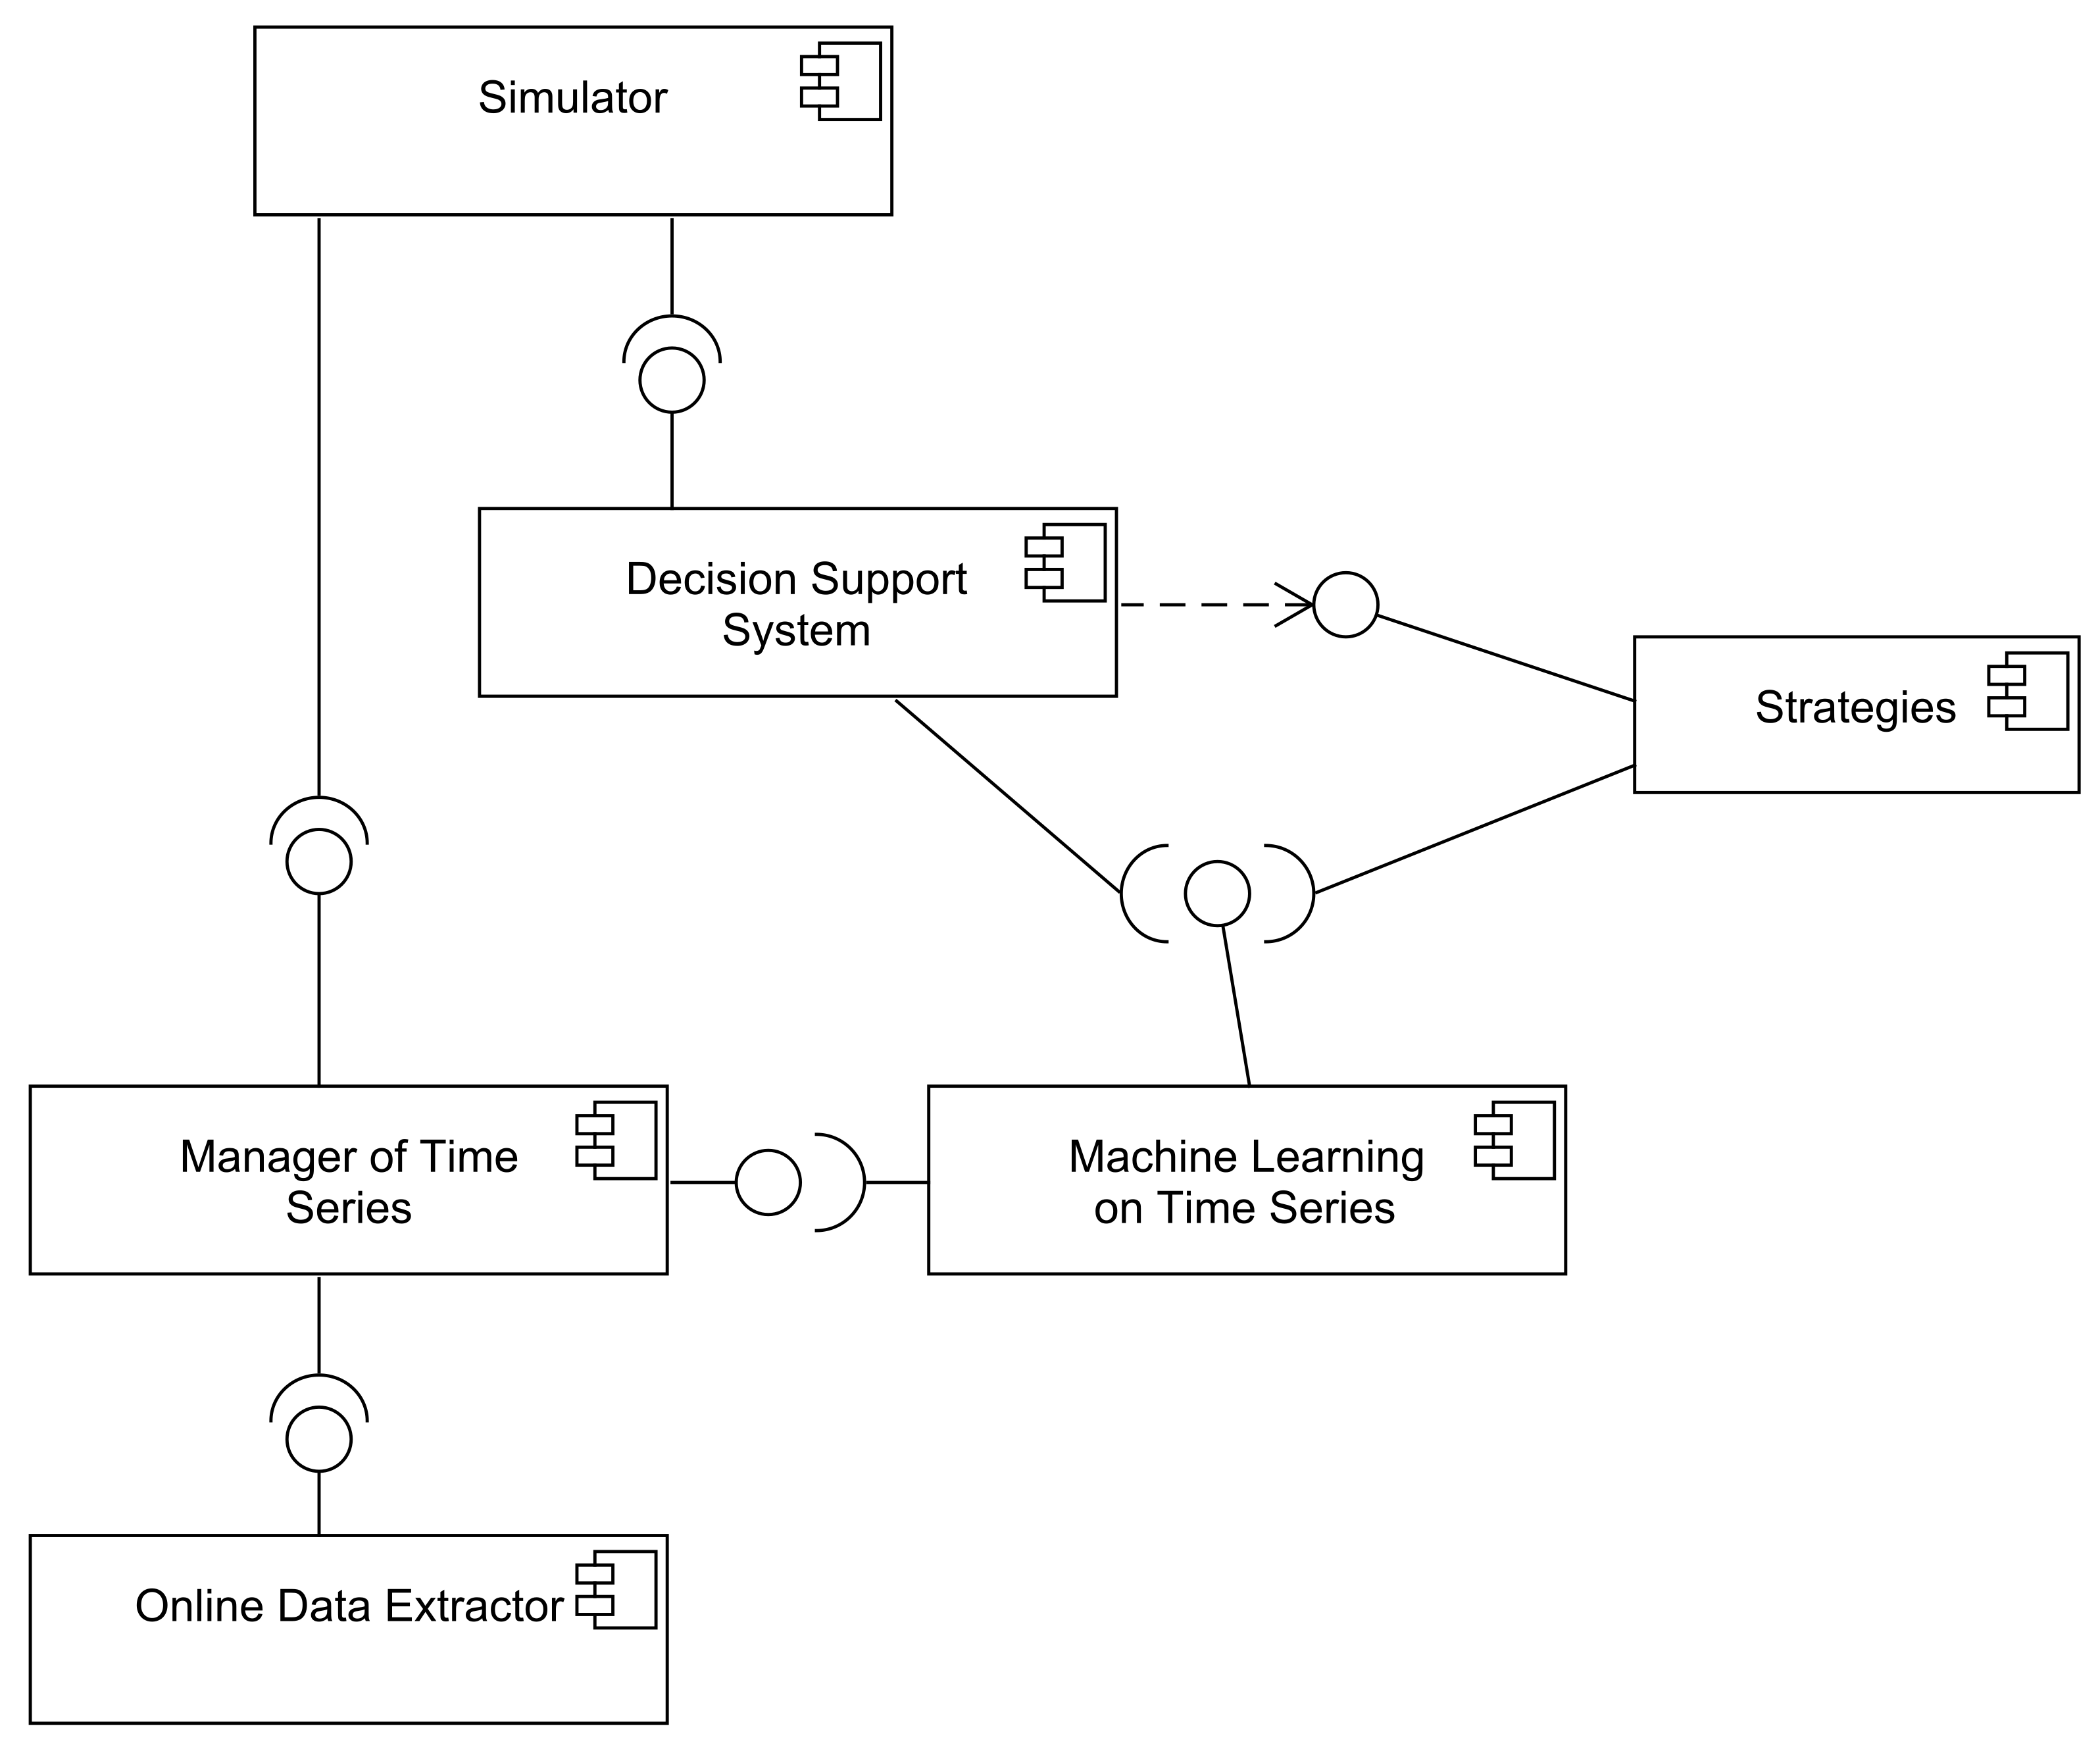
Figure 2 presents the component diagram of the proposed framework. The “online data extractor”
component interacts with online resources and provides real-time information. The “manager of time
series” component stores the information retrieved online by the previous component. It also has the
possibility of using historic data retrieved from a dataset. The component of “machine learning of time
series” uses the previous component and provides an interface that facilitates training and predicting
values. The “strategies” component is the most specific one. In this component, the designer indicates
the strategies for the specific domain. The DSS component uses the strategies and machine-learning
components to support decisions. The “simulator” component allows simulating the performance of a
DSS with certain strategies, generally using random ranges from certain historic data, to evaluate the
DSS and its strategies. This simulator can help in determining proper strategies in a given domain.
The DSS can be tested over offline data by running it on historical data.
Figure 3 shows the dataflow diagram for testing the DSS with offline datasets. In this way, practitioners can test the DSS before deploying it with online data, to determine whether they trust the system for actually using it on real investments, business decisions or actual actions from data of IoT sensor data or smart cities.
The new developed software is available online from its website (
http://grasia.fdi.ucm.es/ivan/rtaf/ (last accessed 17 June 2020)), with the name of Real-Time Analysis Framework (RTAF), for the sake of reproducibility of the experiments of this work and to allow other researchers and practitioners benefit from this software and extend it.
2.2. Python Framework for Getting Real-Time Online Information
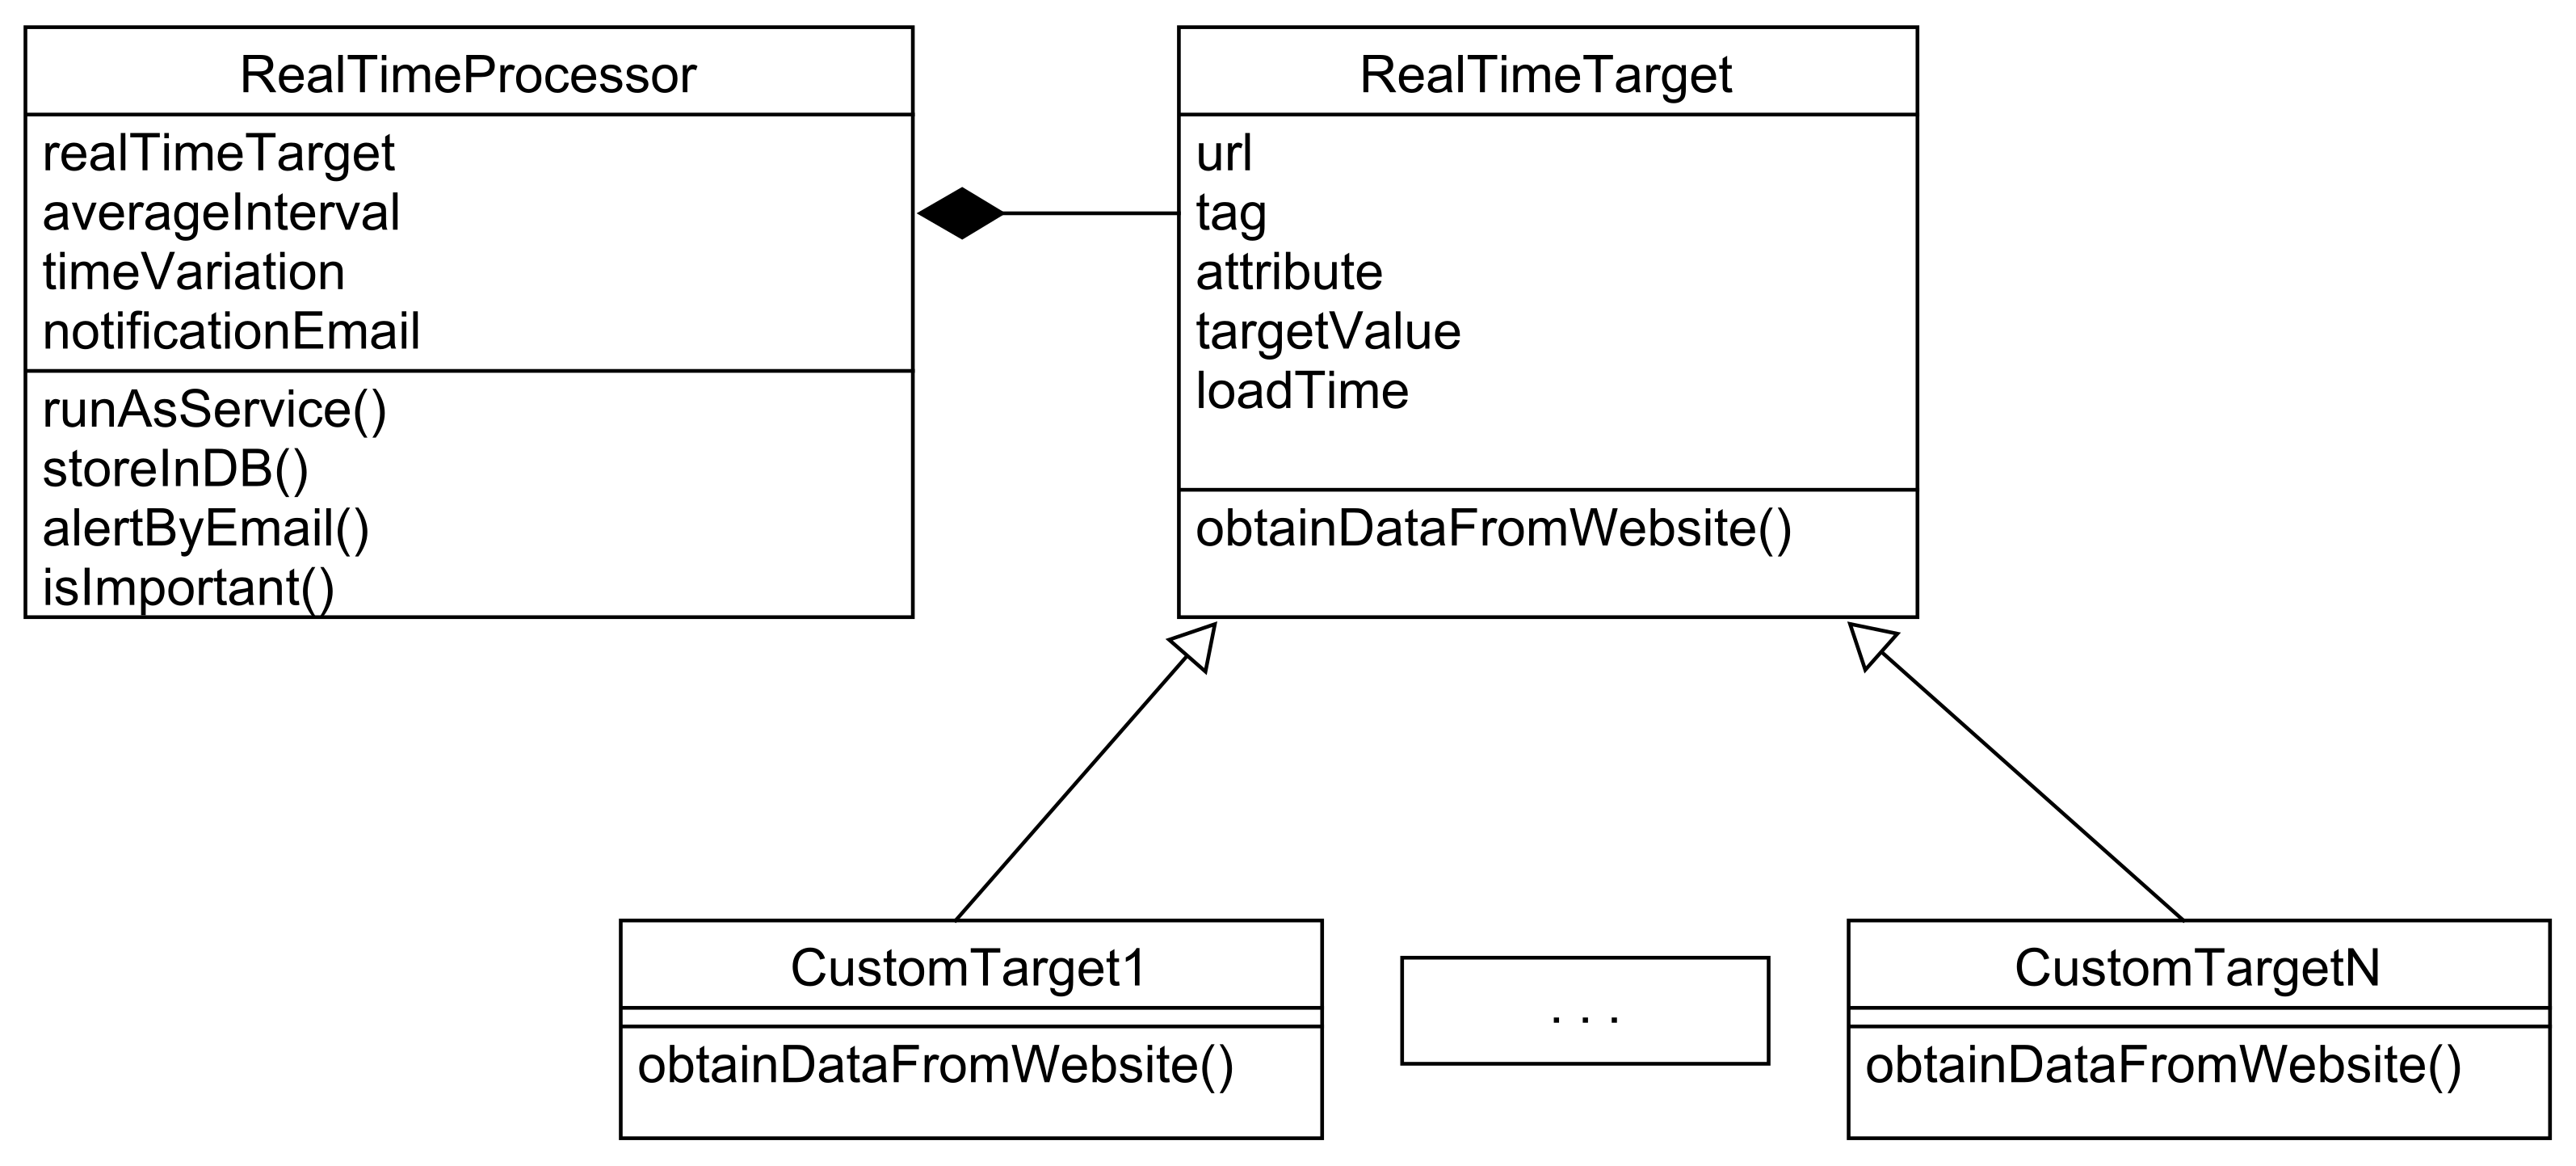
We have developed a software component for getting customized real-time information.
Figure 4 shows a class diagram of the most important components of this framework.
This framework uses Selenium library for getting data so it can automatically control a browser. Selenium library is well known for its existing applications in data driven testing [
17]. We selected this library instead of other alternatives such as Beautiful Soup [
18], since the former one allows properly extracting information from dynamic pages, for example partially loaded with JavaScript or with any login mechanism before entering.
The expert should indicate the website address and which information is extracted. The place of the information should be indicated by observing the HTML code and indicating the relevant element identifiers, so the developer needs to configure this the first time. From this point forward, the framework tracks the evolution of this numeric information to analyze time series, and supports real-time decisions.
We used this framework for extracting data from different domains. In particular, this framework was preliminary tested for extracting the cheapest housing-unit considering the ratio between the price and area of the property, retrieved from the Idealista website (a major real-estate website in Spain). We started with this application domain as this information was particularly useful for real-estate companies. This real-time information alongside our simulator of real-estate buying/selling strategies [
19] can support companies in this sector.
We also applied this framework for Bitcoin domain. In particular, we extracted the information from the “Bitcointicker.co” website, and we extracted the current price from the HTML element with id “LastTrade”. We stored this information using the same relevant information as the historic data series of Kaggle [
20], so that later we were able to simulate strategies over the historic data.
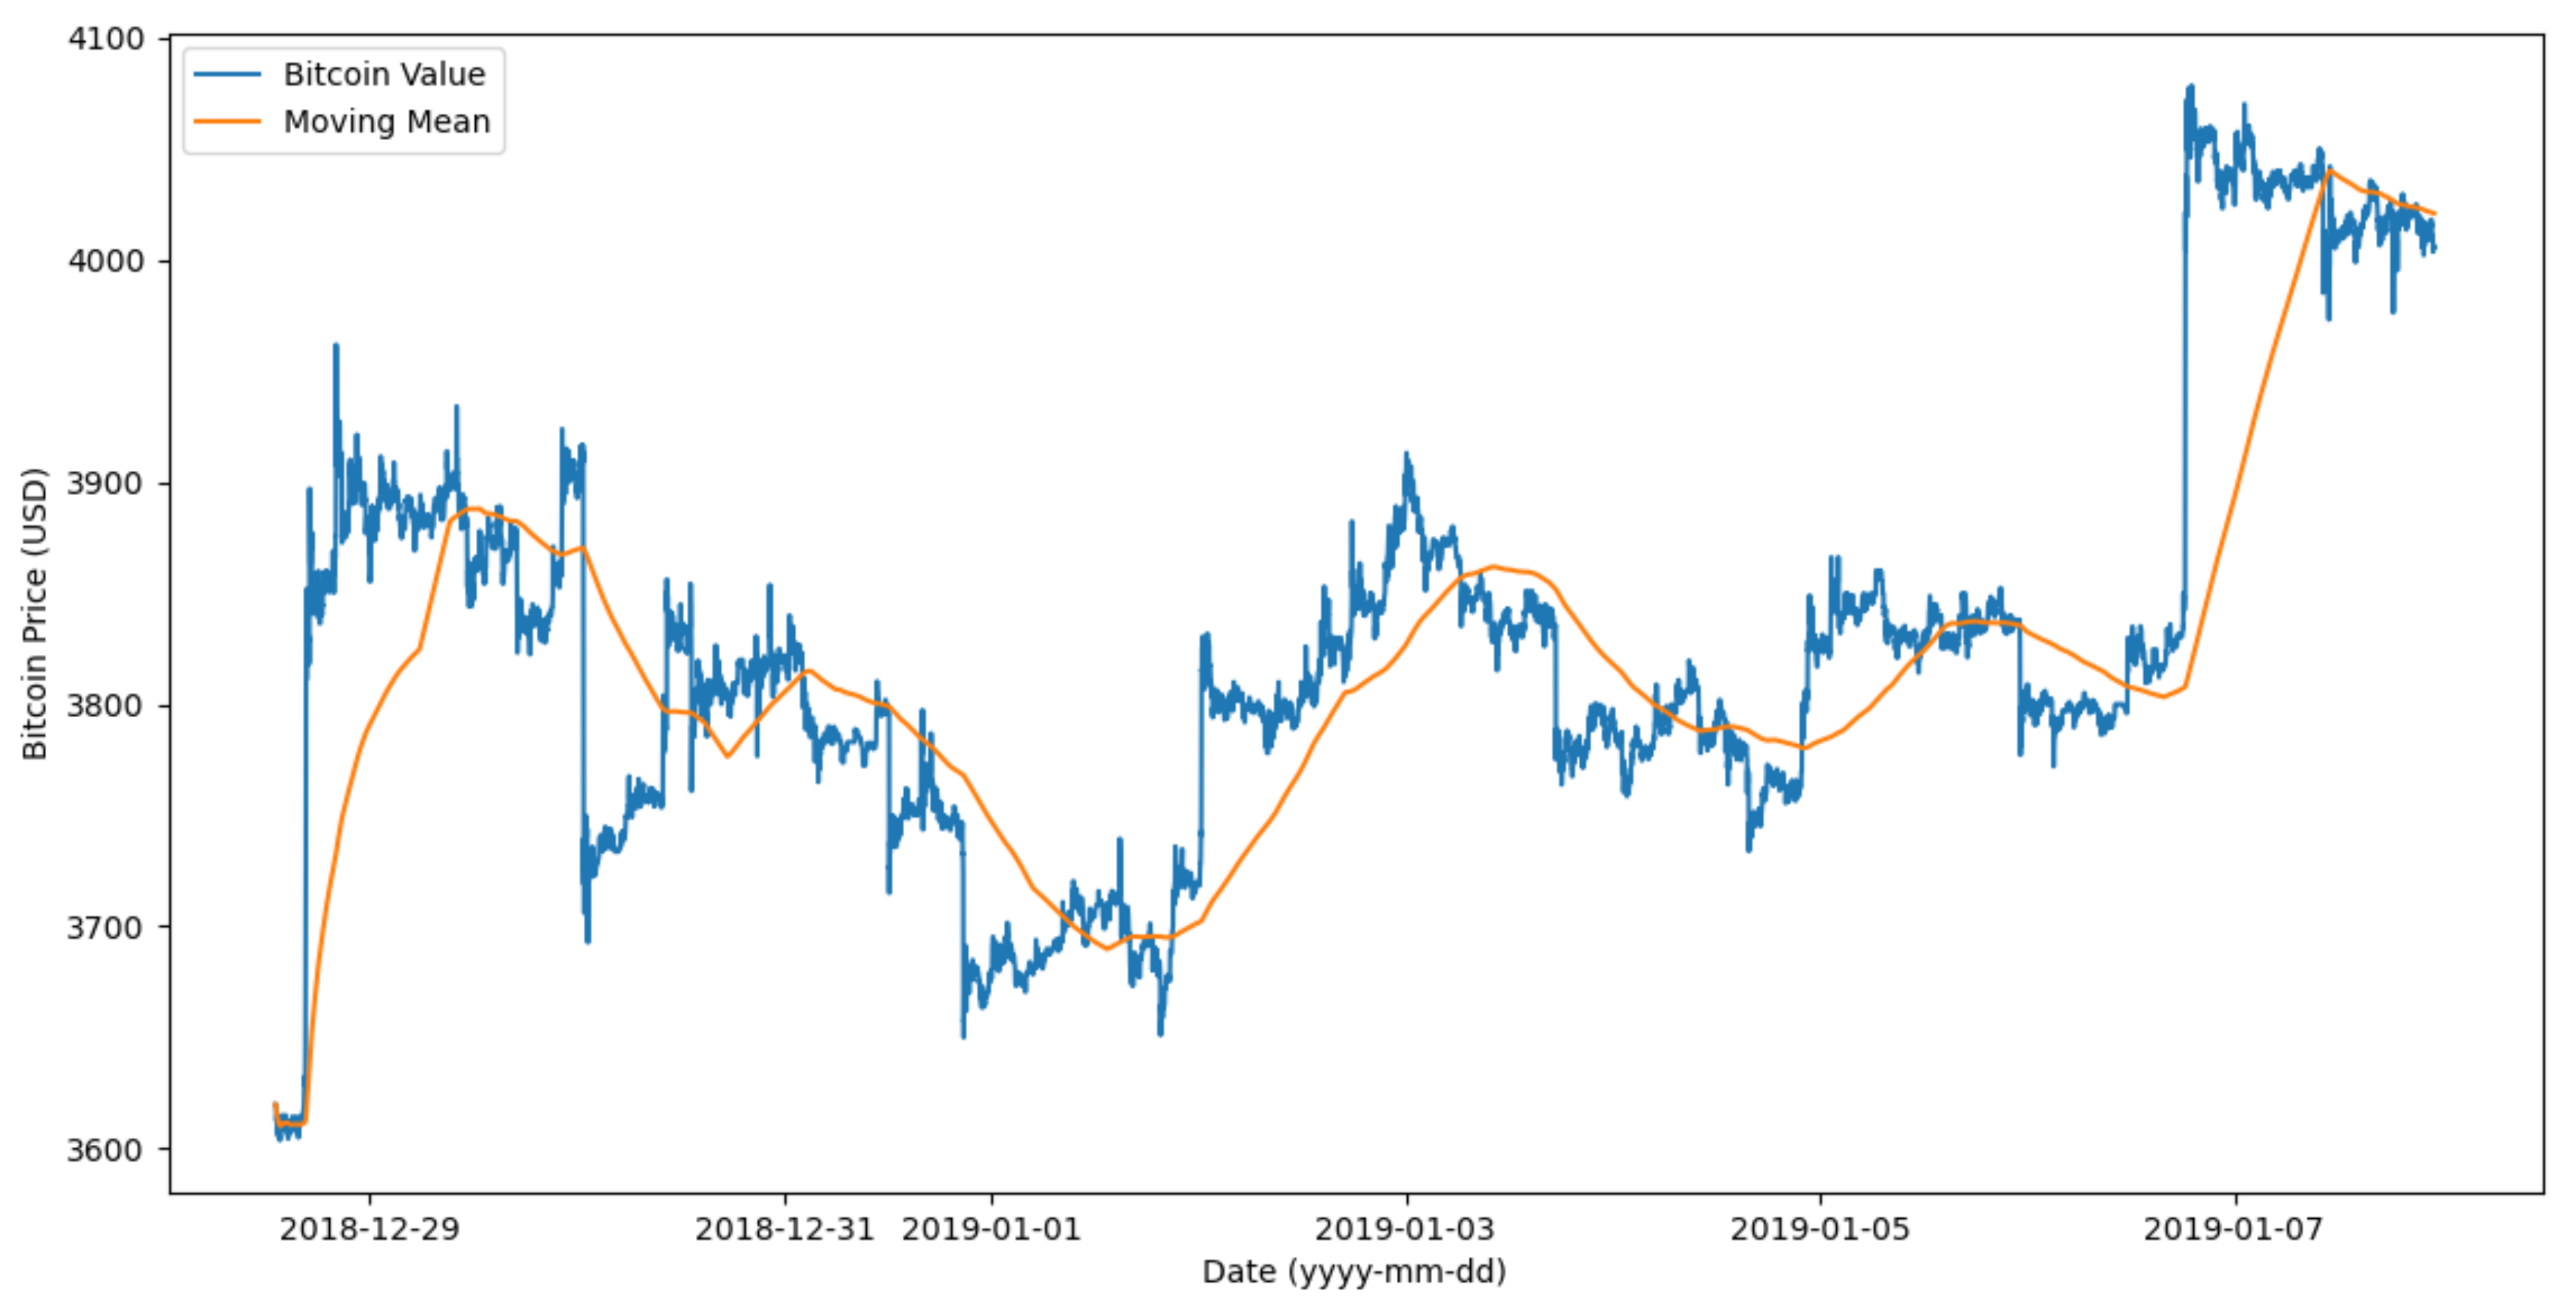
In order to feed the investor strategies and the DSS, the system updates the MM of the series in an efficient way (i.e., with constant complexity cost for new data).
Figure 5 shows an example of the MM over some days of the historic data from Kaggle, presented by the proposed software framework. The MM is calculated from the last 1000 samples of Bitcoin values taken every minute.
The proposed approach removes the short-term variations in the different scenarios by calculating MMs. These MMs consider a window of certain duration, and calculate the means. These means smooth short-term variations, as these means are calculated from a representative number of recent measurements.
Although the IoT sensors usually provide a direct mechanism of communication to different algorithms, this usually requires to own the IoT sensors. In business intelligence, a higher and representative sample of data from sensors is usually more useful for taking decisions such as in which smart city to invest, publicize or spend resources for intensive tracking. In this context, this approach proposes to use the information from online sources based on data from IoT sensors, such as the ones provided by the Spanish meteorological agency [
21], which is well-known for providing open information gathered from IoT sensors in smart cities. The proposed approach can get this information directly from online real-time resources to keep a track of the evolution for calculating MM and its variations.
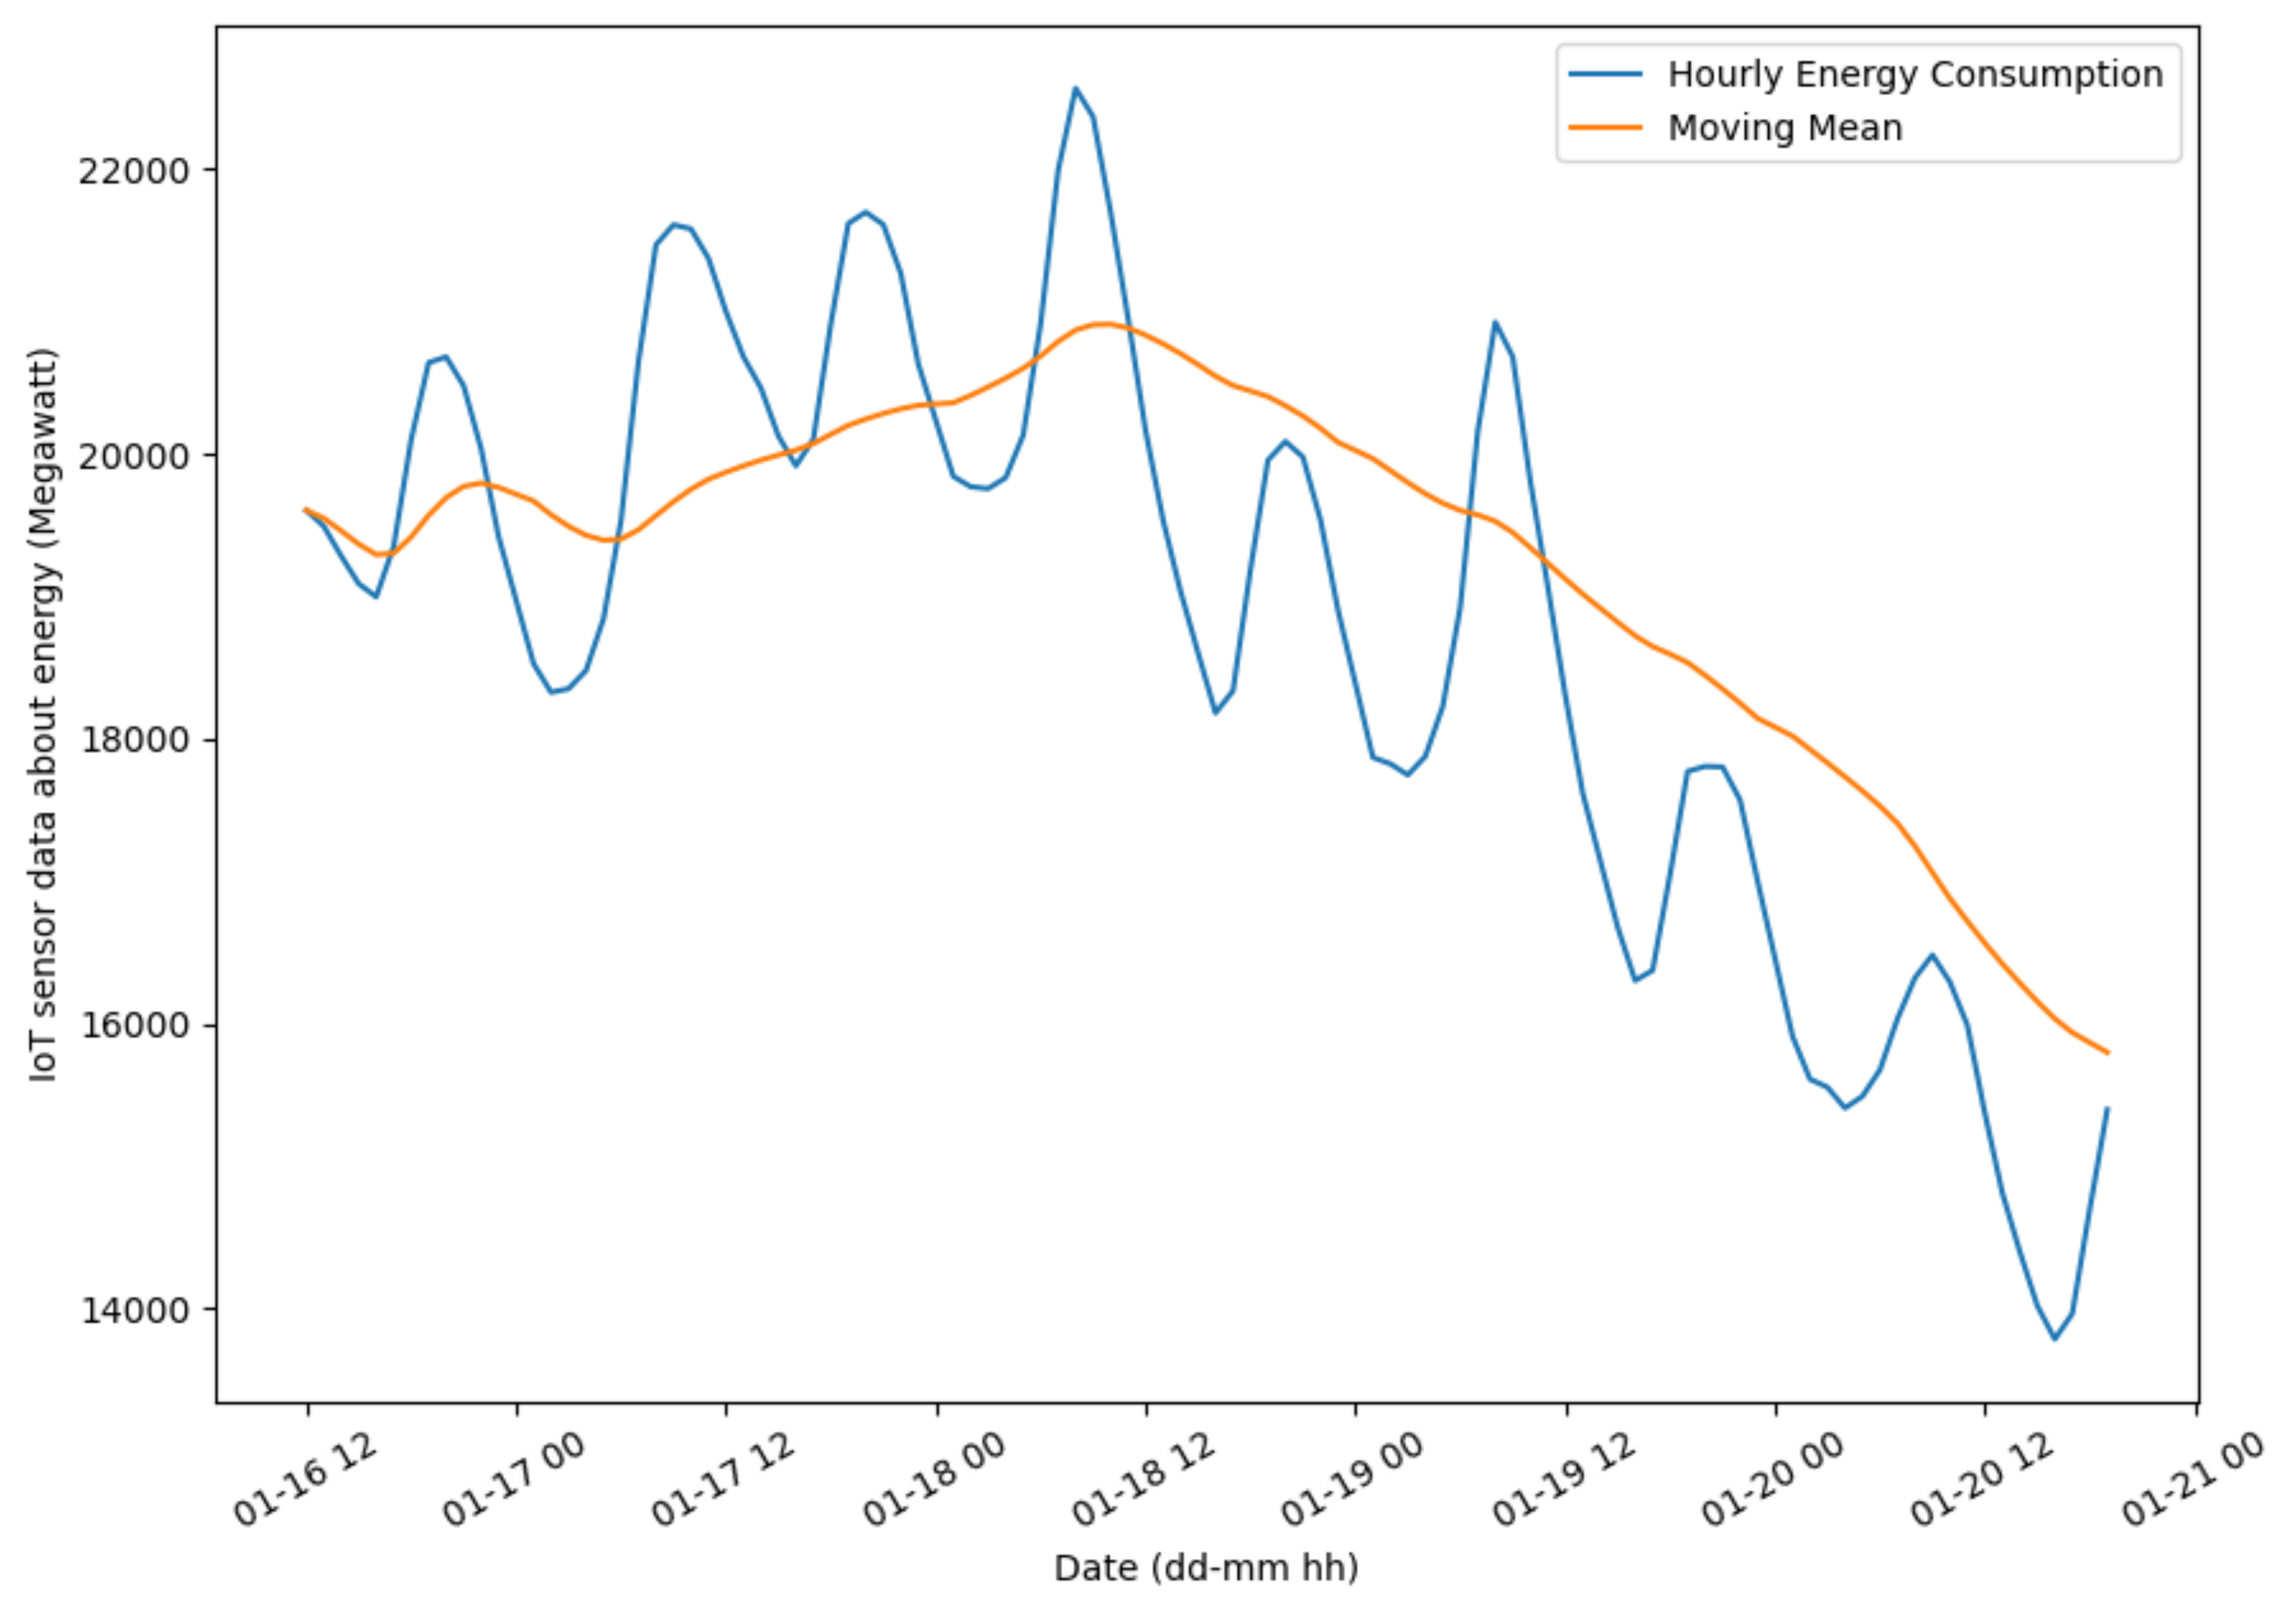
The same procedure can be used for analyzing the data from other IoT sensors in smart cities. In particular,
Figure 6 shows the analysis of MM of sensor data retrieved from smart grids of smart cities. The MM is calculated from the last 1000 samples taken every hour. We used the Kaggle dataset about PJM hourly energy consumption data [
22]. The type of smart grids was Wide Area Network (WAN), in which smart meters were outside homes. Some of the studied cities were Philadelphia and Jersey.
2.3. Experimentation Protocol
In order to evaluate the current approach, we have used the historic data about Bitcoin from Kaggle repository [
20], a well-known and recognized repository in machine learning field. This dataset contained the Bitcoin values every minute from 1 December 2014 to 9 September 2019. In each sample, the dataset reported the opening value, the highest value, the lowest value and the closing value. We used the opening values for calculating the MMs.
We used two investor strategies. The Simple investor strategy focuses on short-time investments based on whether the current price is higher or lower than the MM. This strategy buys Bitcoins when the price is lower than the MM, and sells them when the price is higher than the MM. It considers a certain minimum threshold of difference to avoid loss of money due to the commissions of frequent interchanges of currency.
The Trend MM strategy is based on the trend of MM. If the MM is increasing considering certain time and price thresholds, the strategy buys Bitcoins. If the MM is decreasing considering certain time and price threshold, the strategy sells Bitcoin.
In particular, we used a simulator that automatically took decisions with a simulated initial investment of 3600 USD. In the simulation, each investor automatically followed the recommendations of each strategy, changing the currency between USD and Bitcoin when appropriate.
We randomly took sequences of 10,000 min in random intervals with several strategies for estimating the best investor strategies. We performed 40 simulations of each investor strategies, and we used the same historic time interval in each simulation of both compared strategies so the comparisons are fair.
We also performed simulations with different time interval sizes from 5000 min to 100,000 min with steps of 5000 min (i.e., 5000 min; 10,000 min; 15,000 min; …; 100,000 min). We executed five simulations in each time interval size. The beginning of each time series was selected randomly, and was used for both strategies.
In general, we compared the results considering averages, standard deviations, histograms and the statistical Paired t-test, where appropriate.
In the field of IoT sensors in smart cities, we have selected the information from IoT sensors for measuring energy consumption in smart cities. In particular, for the experimentation we used the historic information reported by regional transmission organization of United States from regions such as Delaware, Illinois, Kentucky, Maryland, New Jersey, North California, and provided by the corresponding Kaggle repository about energy consumption data [
22]. Each row contained the date and time in one column and the energy consumption in another column. This dataset reported this information taken every hour. We applied the proposed approach with HAI auto-generated explanations in this context to suggest the best dates to apply the different business decisions, based on the variations of MMs of energy consumption.
3. Results
This approach is illustrated in the domains of cryptocurrency investment and energy consumption in smart cities. The experimentation covers two different domains to show the generality of the proposed approach. The proposed framework uses a common notation for extracting online information with specific attributes of the RealTimeTarget class. In addition, all the analyses depart from the MMs as a key concept for detecting patterns in time series. This approach automatically generates HAI-based explanations by using templates associated with a set of patterns, and each template is filled with certain calculated data. All these features are common in both case studies. The only methodological difference between these two case studies is the mechanism for associating time series with patterns. The former uses a rule-based system, while the latter uses machine learning from previous recommendations. In the rule-based system, we used the comparison of certain MM differences with certain thresholds to take decisions based on expert knowledge. In the case of
machine learning, the difference is that we took cases from a time interval in the past and labeled
them with certain categories regarding the type of messages considering two different classifications.
The multi-layer perceptron neural networks were trained with a subset of this labeled information in a
given time interval, and then the system was tested in a different time interval for evaluation. In this is pattern-series association, our framework suggests both mechanisms and let developers select the most appropriate one for the corresponding domain.
3.1. Investments in Cryptocurrency
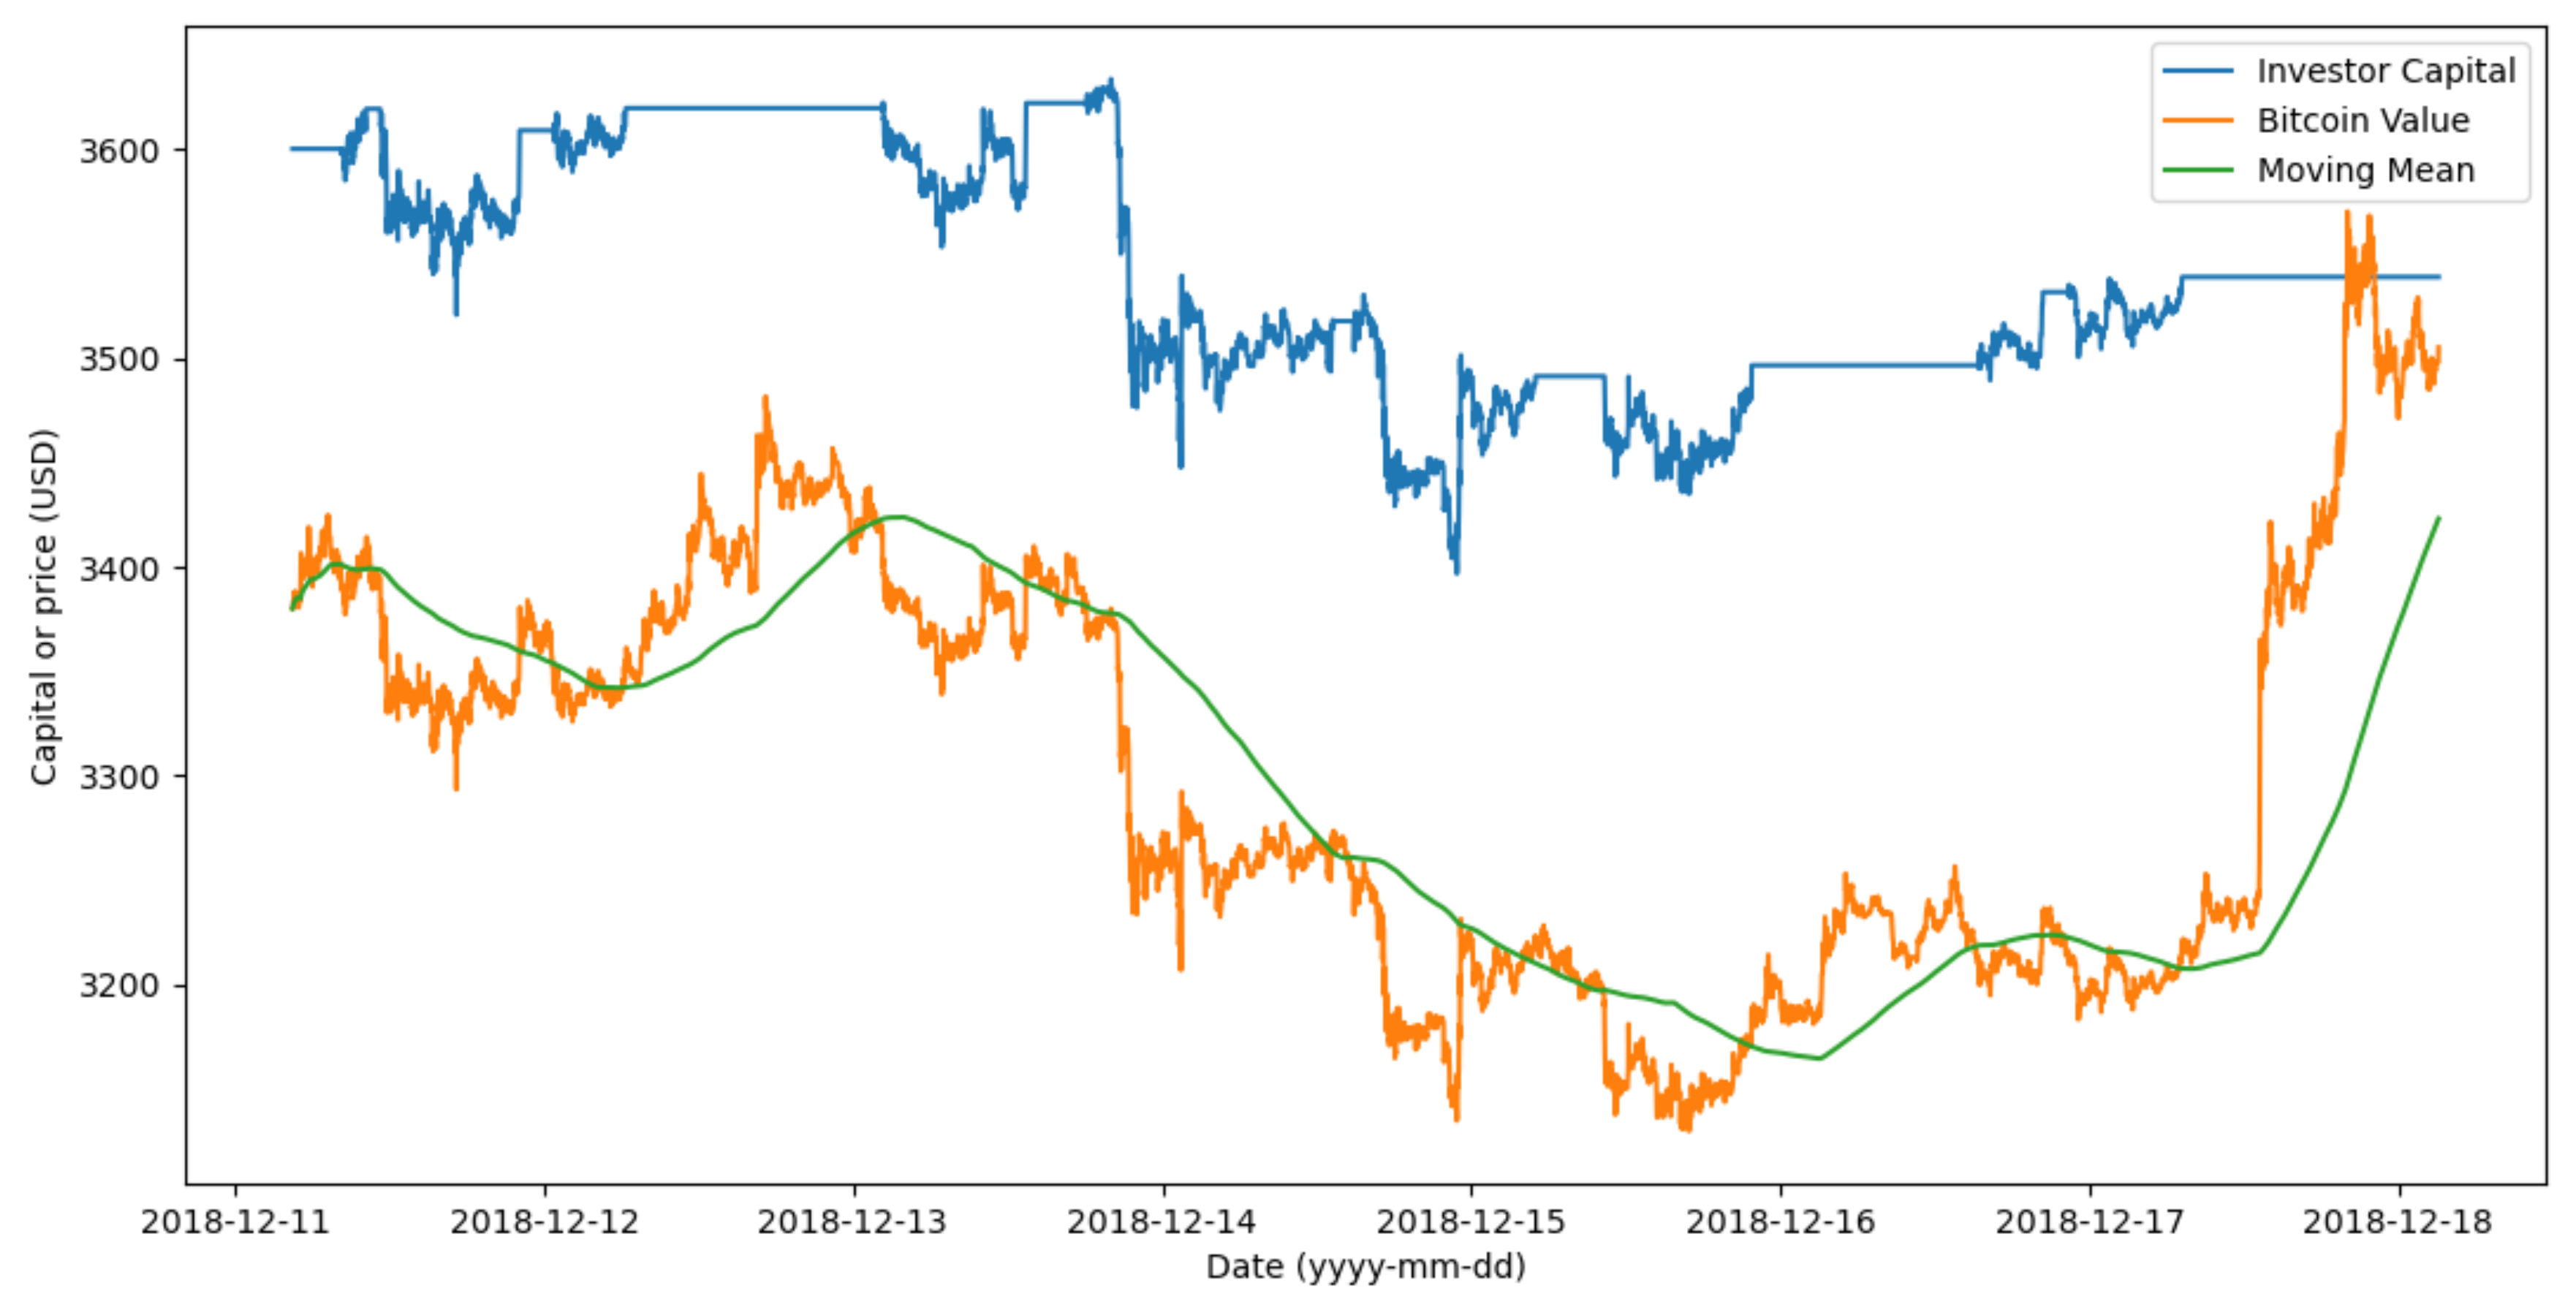
Figure 7 shows the results of the simulator with the Simple investor strategy that buys Bitcoins when its current price is lower than the MM with a difference greater than 10 USD, and sells Bitcoin when its price is more than MM plus 10 USD. The goal of this strategy is to take advantage of small variations around the same value. In all the experimentation about Bitcoin, MMs used the last 1000 samples taken every minute.
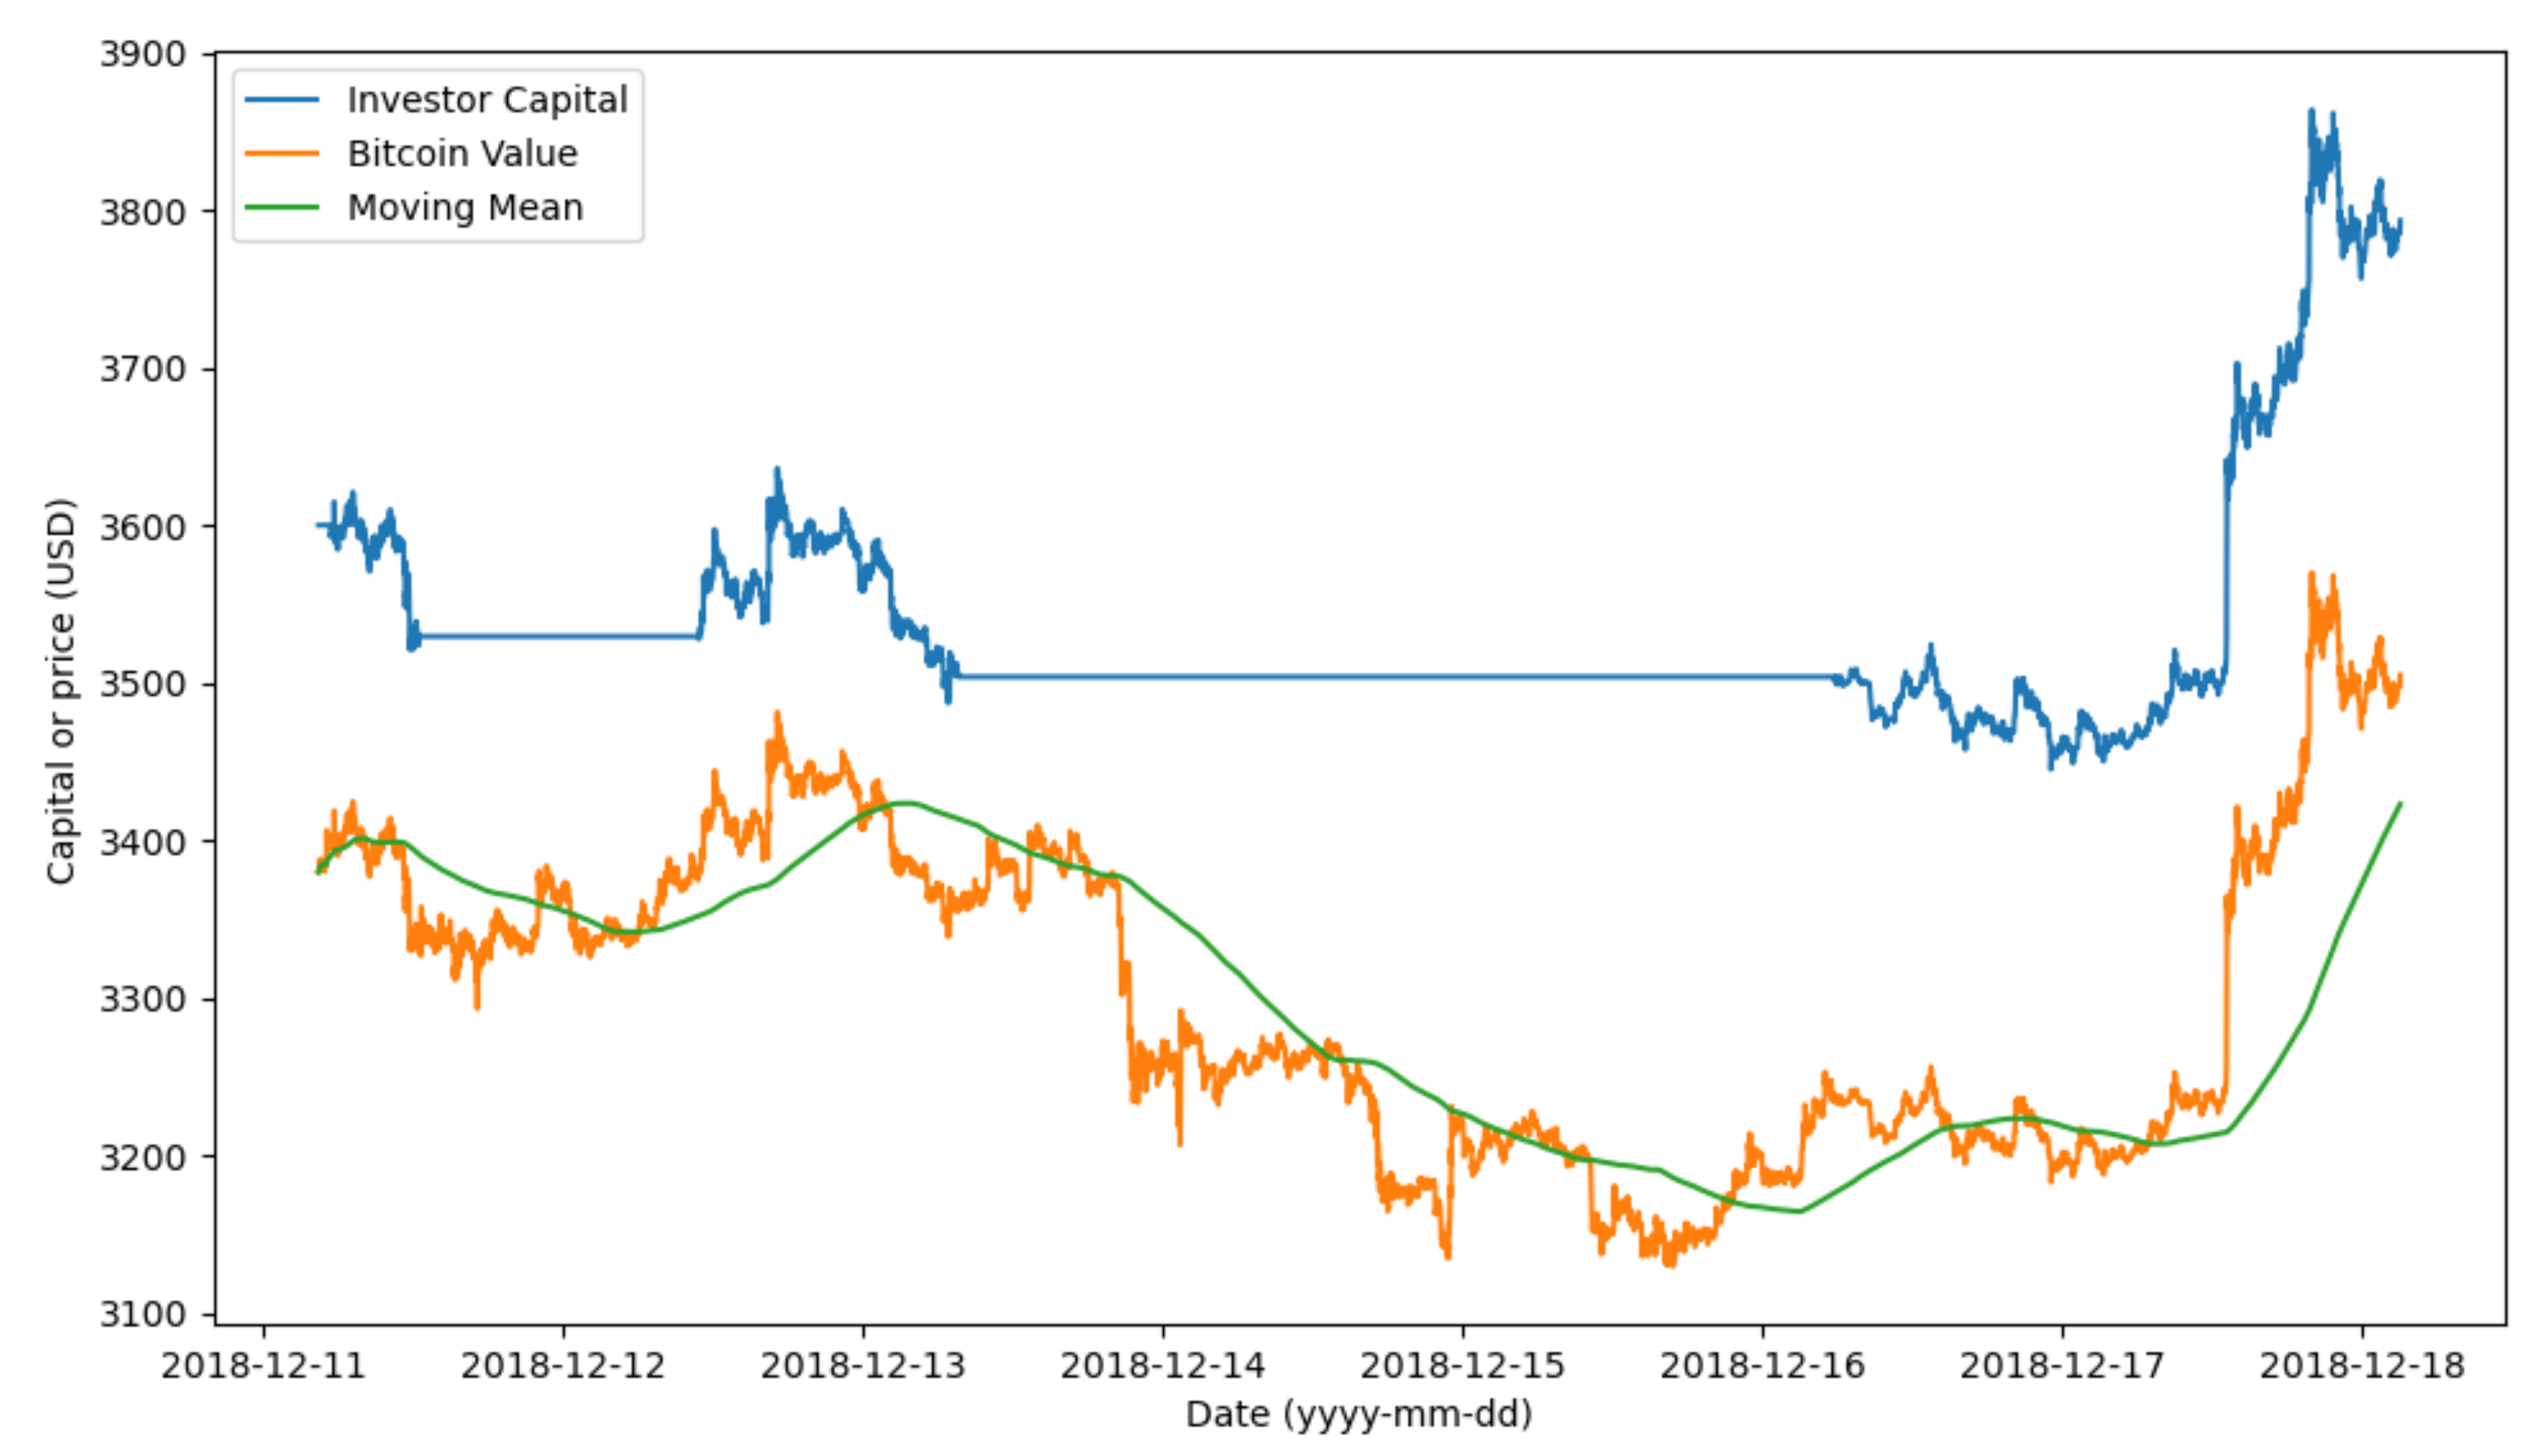
Another investor is based on observing whether MM is increasing or decreasing.
Figure 8 shows a simulation with this investor. In particular in this simulation, it used an interval of observation of 5 h (i.e., 300 min) and a difference threshold of 10 USD in the price of Bitcoin.
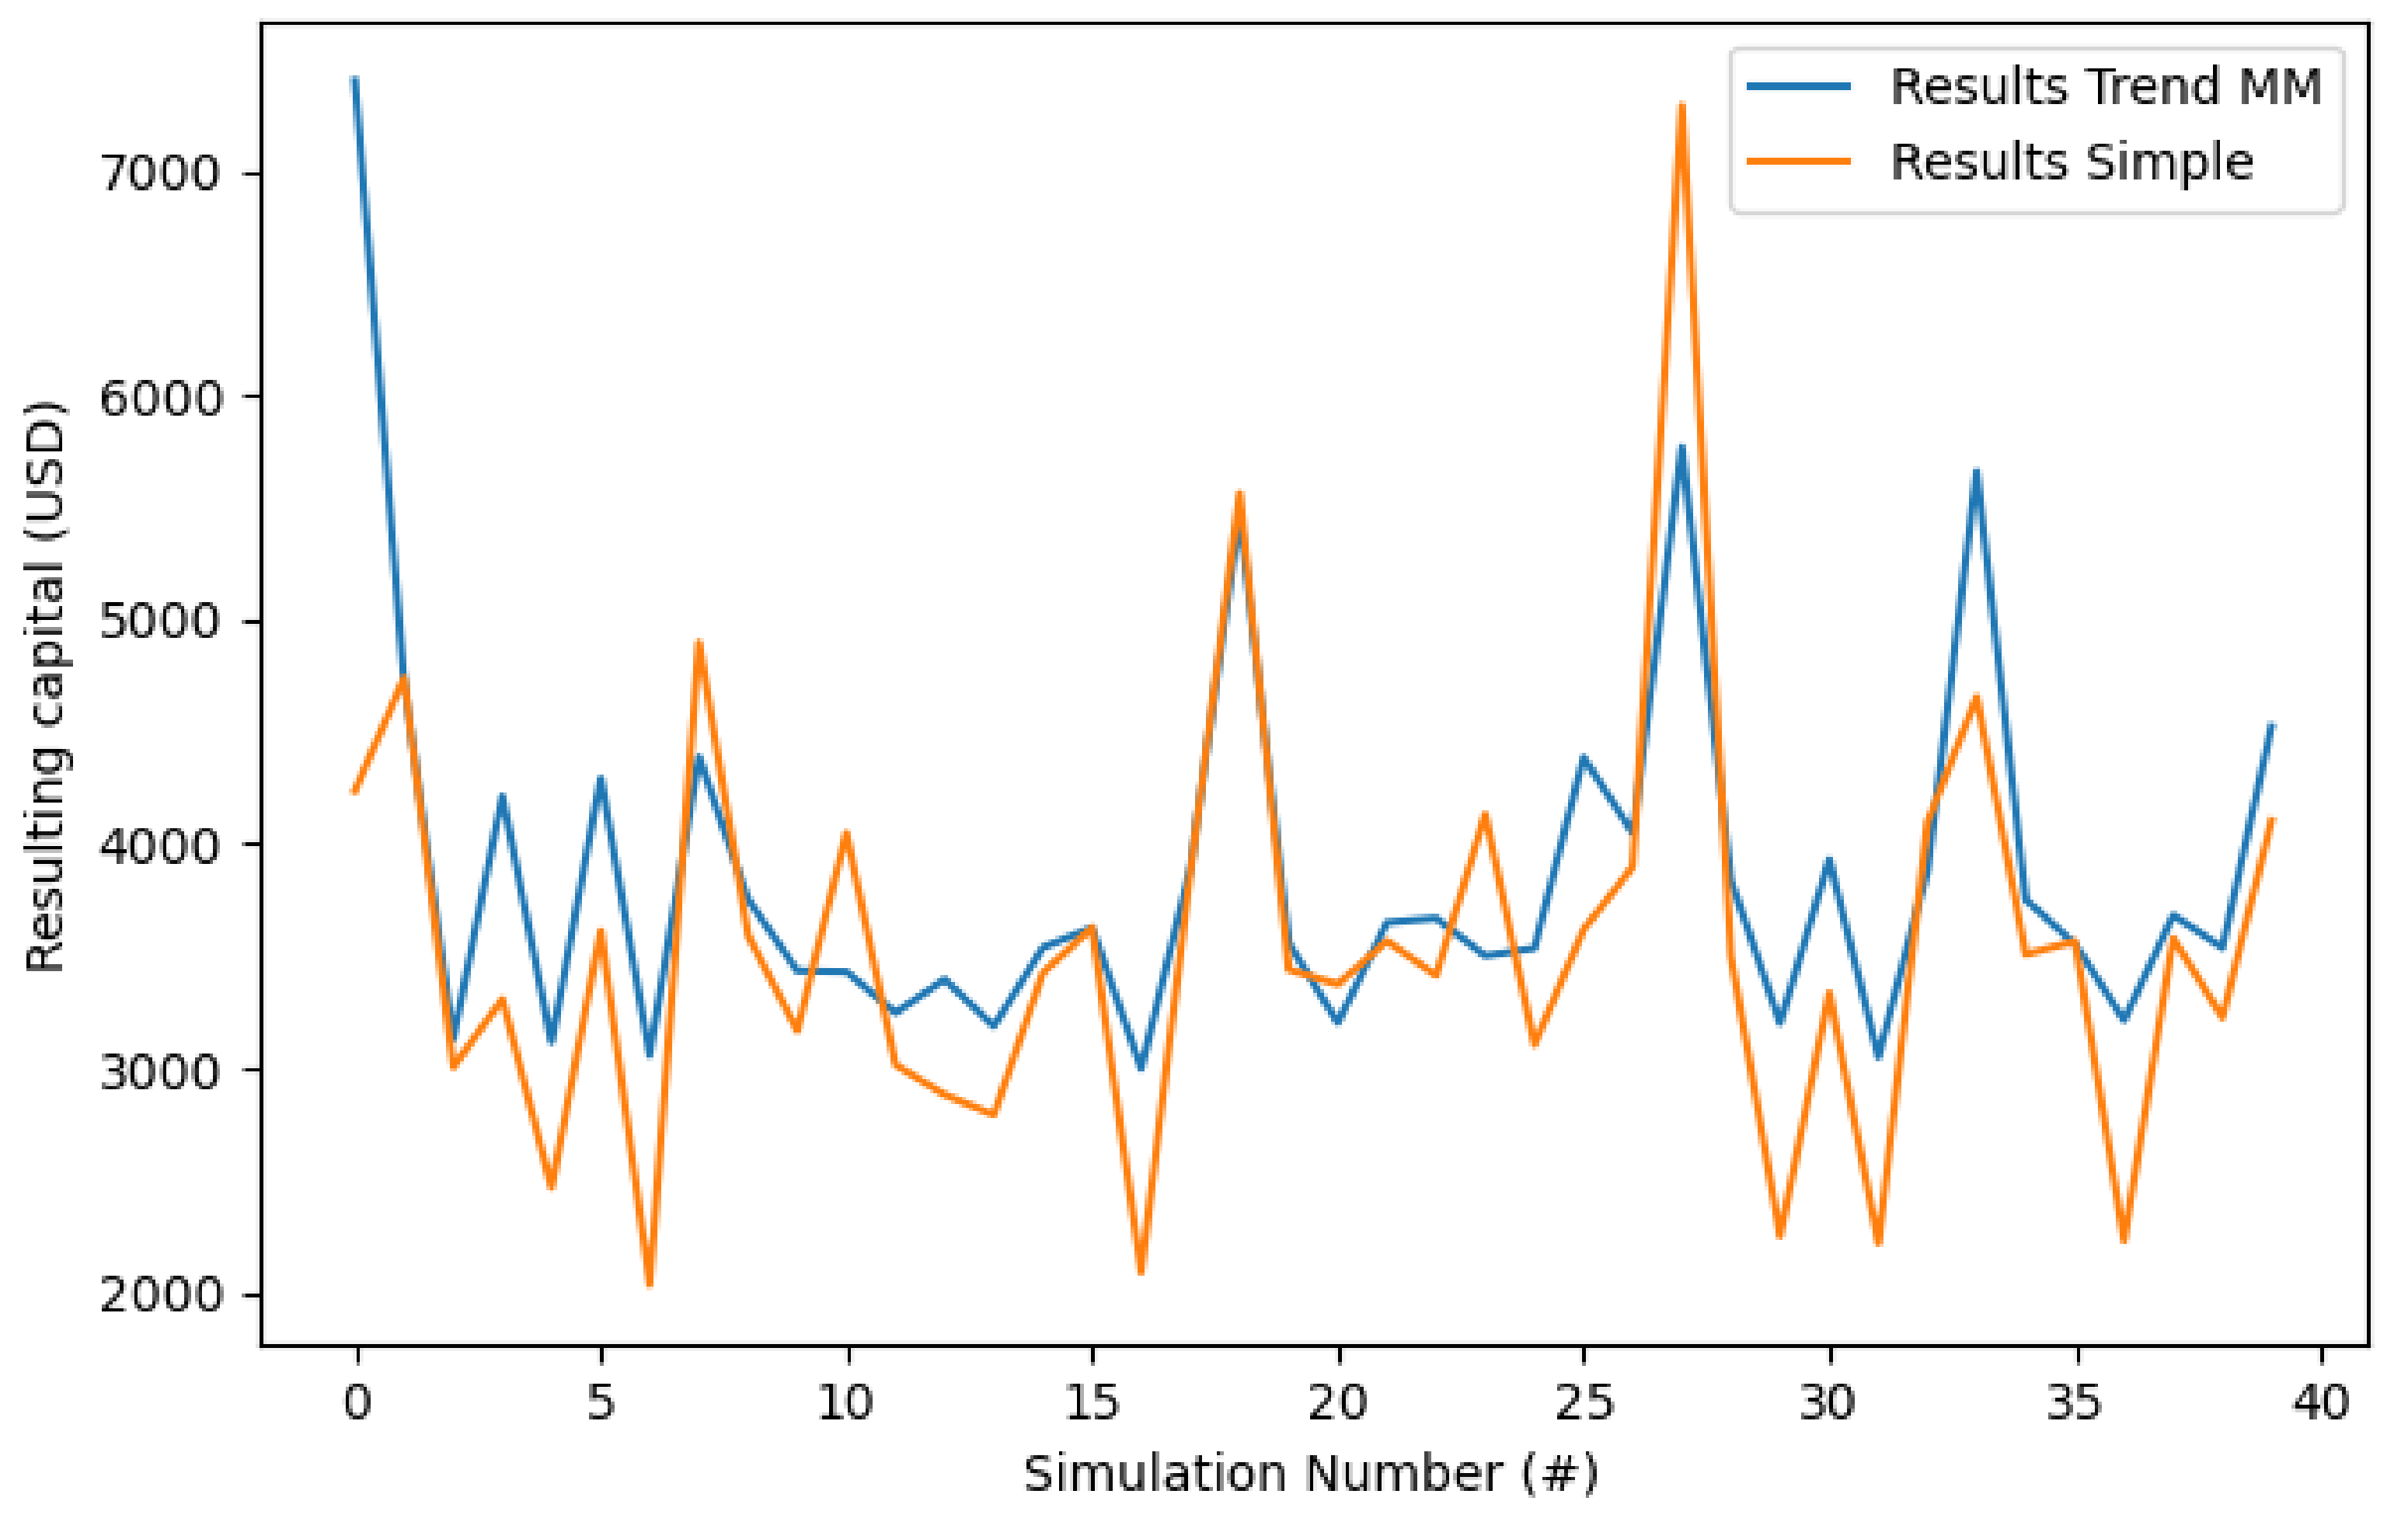
Figure 9 presents the comparison of 40 simulations with each investor strategy with random starting times between 25,000 min and 1,000,000 min before the last datum from the corresponding Kaggle dataset. Each execution simulated 20,000 min for each simulation (about 13 days and 21 h). They used MMs based on windows of 1000 min. Both investors started each simulation with 3600 USD.
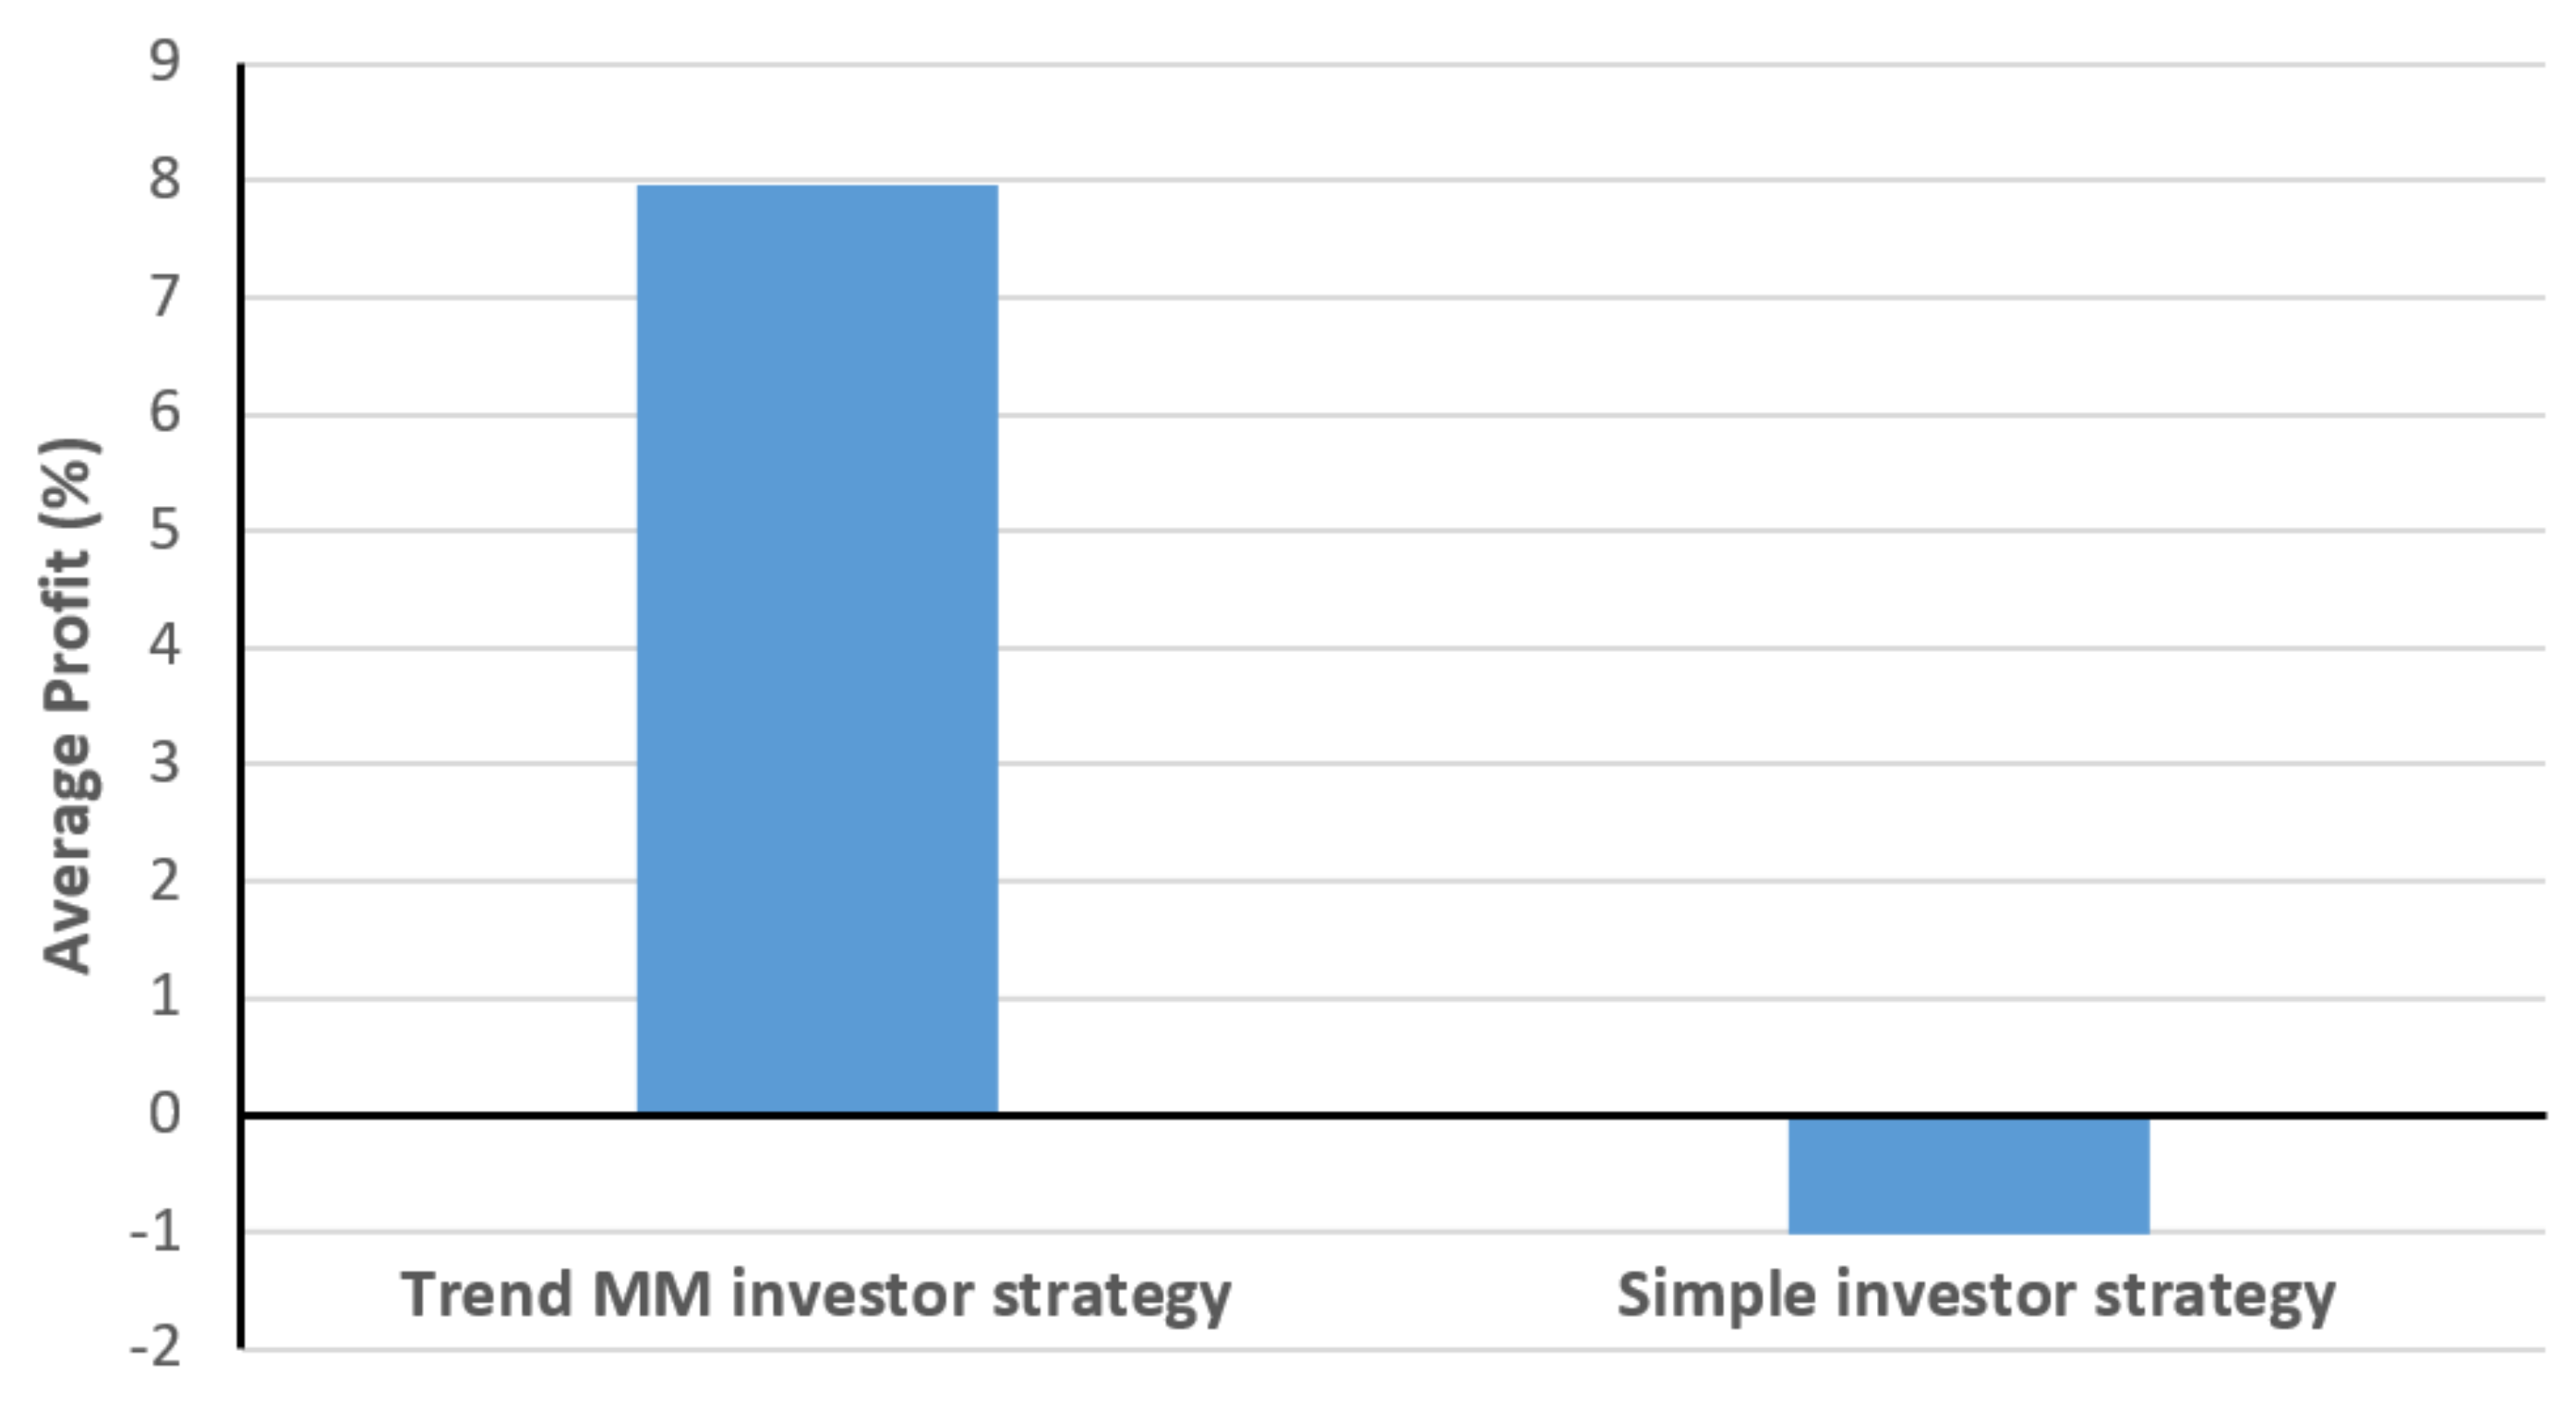
Figure 10 compares the average profit percentages of the investor strategies in this experimentation. One can observe that the profit is much higher in Trend MM investor strategy with a value of 7.96% than the profits of Simple investor strategy with a value of −1.02%. Notice that the latter is a negative value, meaning that in average the Simple strategy resulted in losses. The standard deviation (SD) was respectively 24.6% and 27.2% for these two strategies.
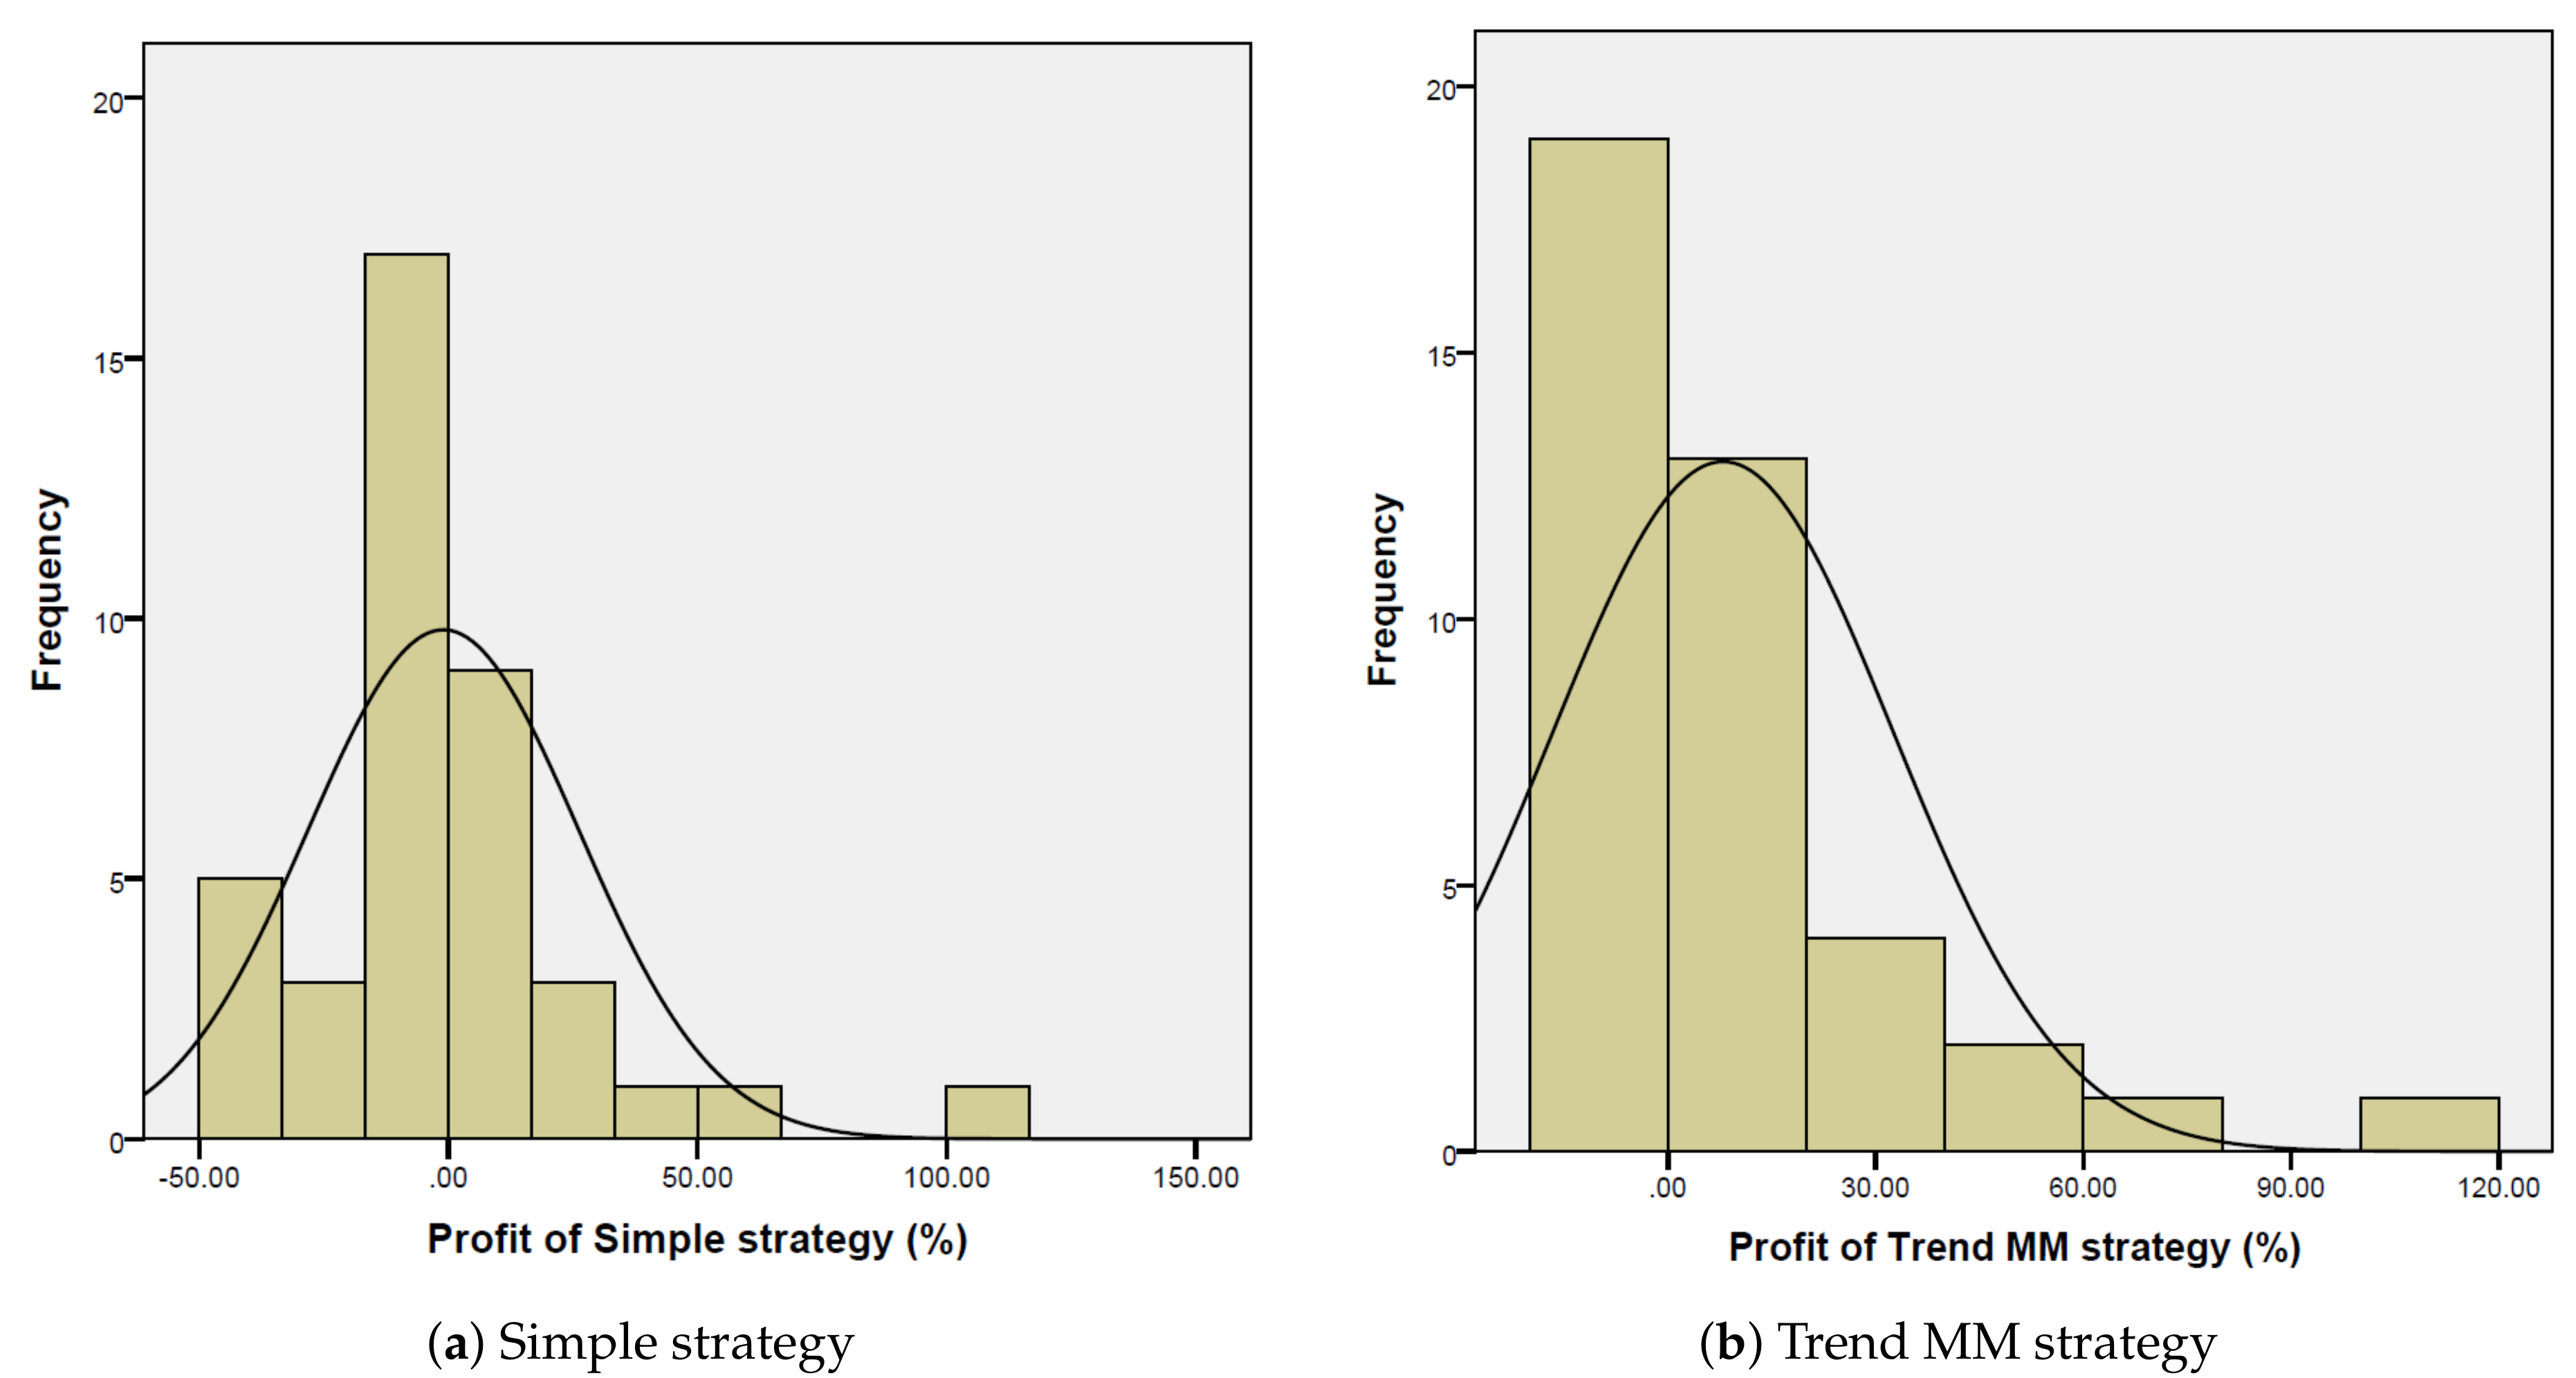
Figure 11 compares the histograms of profit percentages of respectively Simple investor strategy and Trend MM investor strategy. The latter restricted the losses to the interval between 0 and 20%, while the Simple strategy obtained losses from 0 to 50%. The histograms also display Gaussian distributions for providing additional graphical information about the average and standard deviation. In this way, one can also observe how different the data were from normal distributions. The average profit of Trend MM strategy was higher than the Simple strategy. Notice that these averages are the x-value of the maximum frequencies of the Gaussian curves displayed over the histograms.
In order to further compare both strategies, we performed the paired
t-test in these results to determine the statistically significant differences. We have applied the statistical tests with the IBM SPSS Statistics (v24) software for analyzing the results of this experimentation.
Table 1 presents the paired samples statistics.
Table 2 indicates the paired samples correlations. The results of both strategies were correlated with a significance level of 0.001 and a positive correlation factor of 0.729. Notice that we removed autocorrelation, and this correlation result represents the correlation between the two different strategies.
In order to further confirm the correlation, we applied Pearson’s correlation test, and
Table 3 presents the results. We also calculated Kendall’s Tau and Spearman’ Rho correlation coefficients, and
Table 4 indicates the results. As one can observe, all correlation coefficients were 0.67 or higher, and all of them had a significance level of 0.01. Thus, all the results were similar showing a strong correlation between the profits of both strategies.
This strong correlation makes sense as both strategies used the same interval of Bitcoin in the timeline in each simulation, and consequently both strategies could get better benefits in USD currency in periods with increasing values of Bitcoin. Notice that these strategies did not use the possibility of buying future Bitcoins. This experimentation has only used buying and selling Bitcoins and we have used USD as value of reference. Thus, profits can only be obtained when the value of Bitcoin raises in comparison with USD. In real life, investors seek decreasing values of Bitcoins by buying and selling bitcoins taking future values into account, but this possibility was not considered in our strategies for the sake of simplicity and for making it easy to understand by a wide range of readers.
Table 5 shows the paired differences of paired
t-test. One can observe that the differences were statistically significant with a two-tailed significance of 0.005. The effect size had an absolute value of 8.94% in favor of Trend MM strategy.
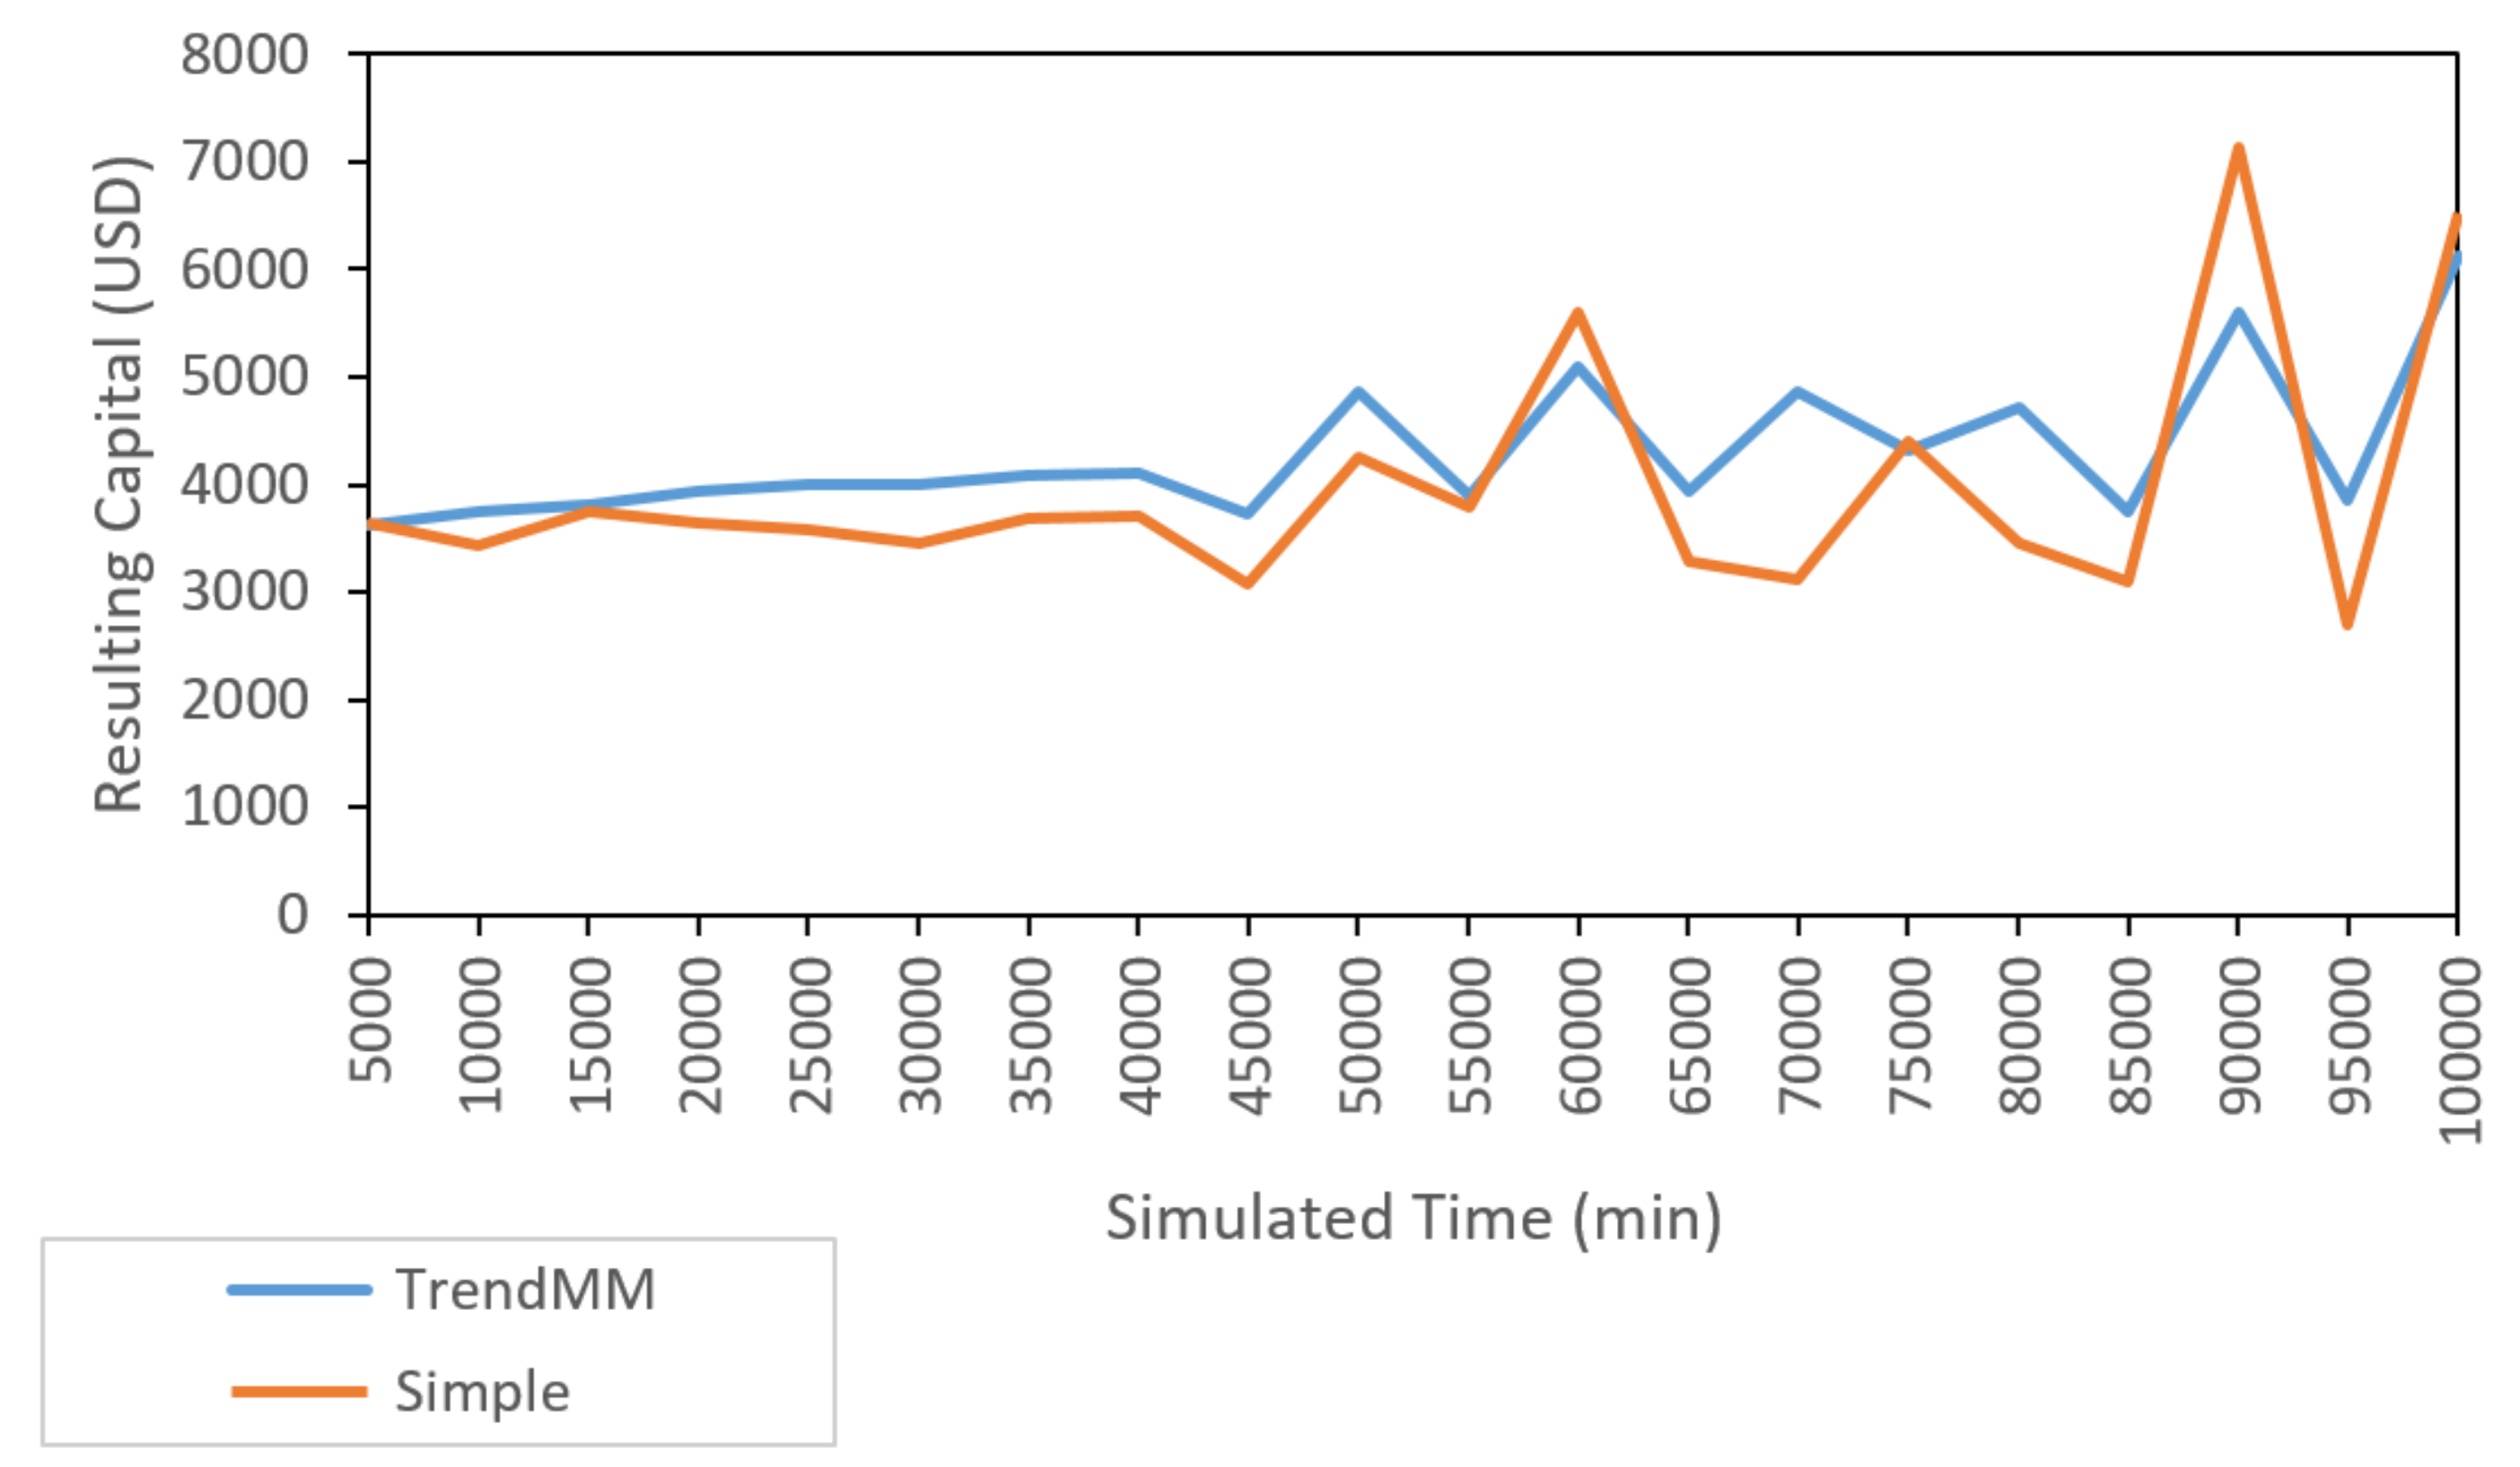
In order to estimate the influence of the simulation durations on the percentage profits, we performed simulations of different durations from 5000 min (i.e., about 3 days and 11 h) to 100,000 min (i.e., about 69 days and 11 h) increasing in steps of 5000 min. We performed five simulations for each simulation duration to ameliorate the bias due to the random selection of initial dates from all the historical data. We used the same paired dates for comparisons between investor strategies.
Figure 12 shows the results of these simulations. The variability increased for larger durations. In total, SD was 19.2% in the results of Trend MM strategy and 32.1% in Simple strategy. The average profit was 19.6% for Trend MM strategy and 10.2% for Simple strategy. Thus, these simulations showed that Trend MM had a higher profit in average, and involved less risks as its variation was lower.
3.2. Energy Consumption in IoT Sensors in Smart Cities
In order to conduct the experiments regarding energy consumption, we used two different classifications related to the message types for labeling the energy-consumption time-series patterns. The first classification had the recommendation categories of (1) “Increase sensors activity”, (2) “decrease sensors activity” and (3) “no recommendations”. The second classification had the suggestion categories of (a) “increase advertisement”, (b) “decrease advertisement” and (c) “no recommendations”. A different multi-layer perceptron neural network was trained for each classification. Then, the two corresponding multi-layer perceptron networks were used for the evaluation with data different from the ones used in the training.
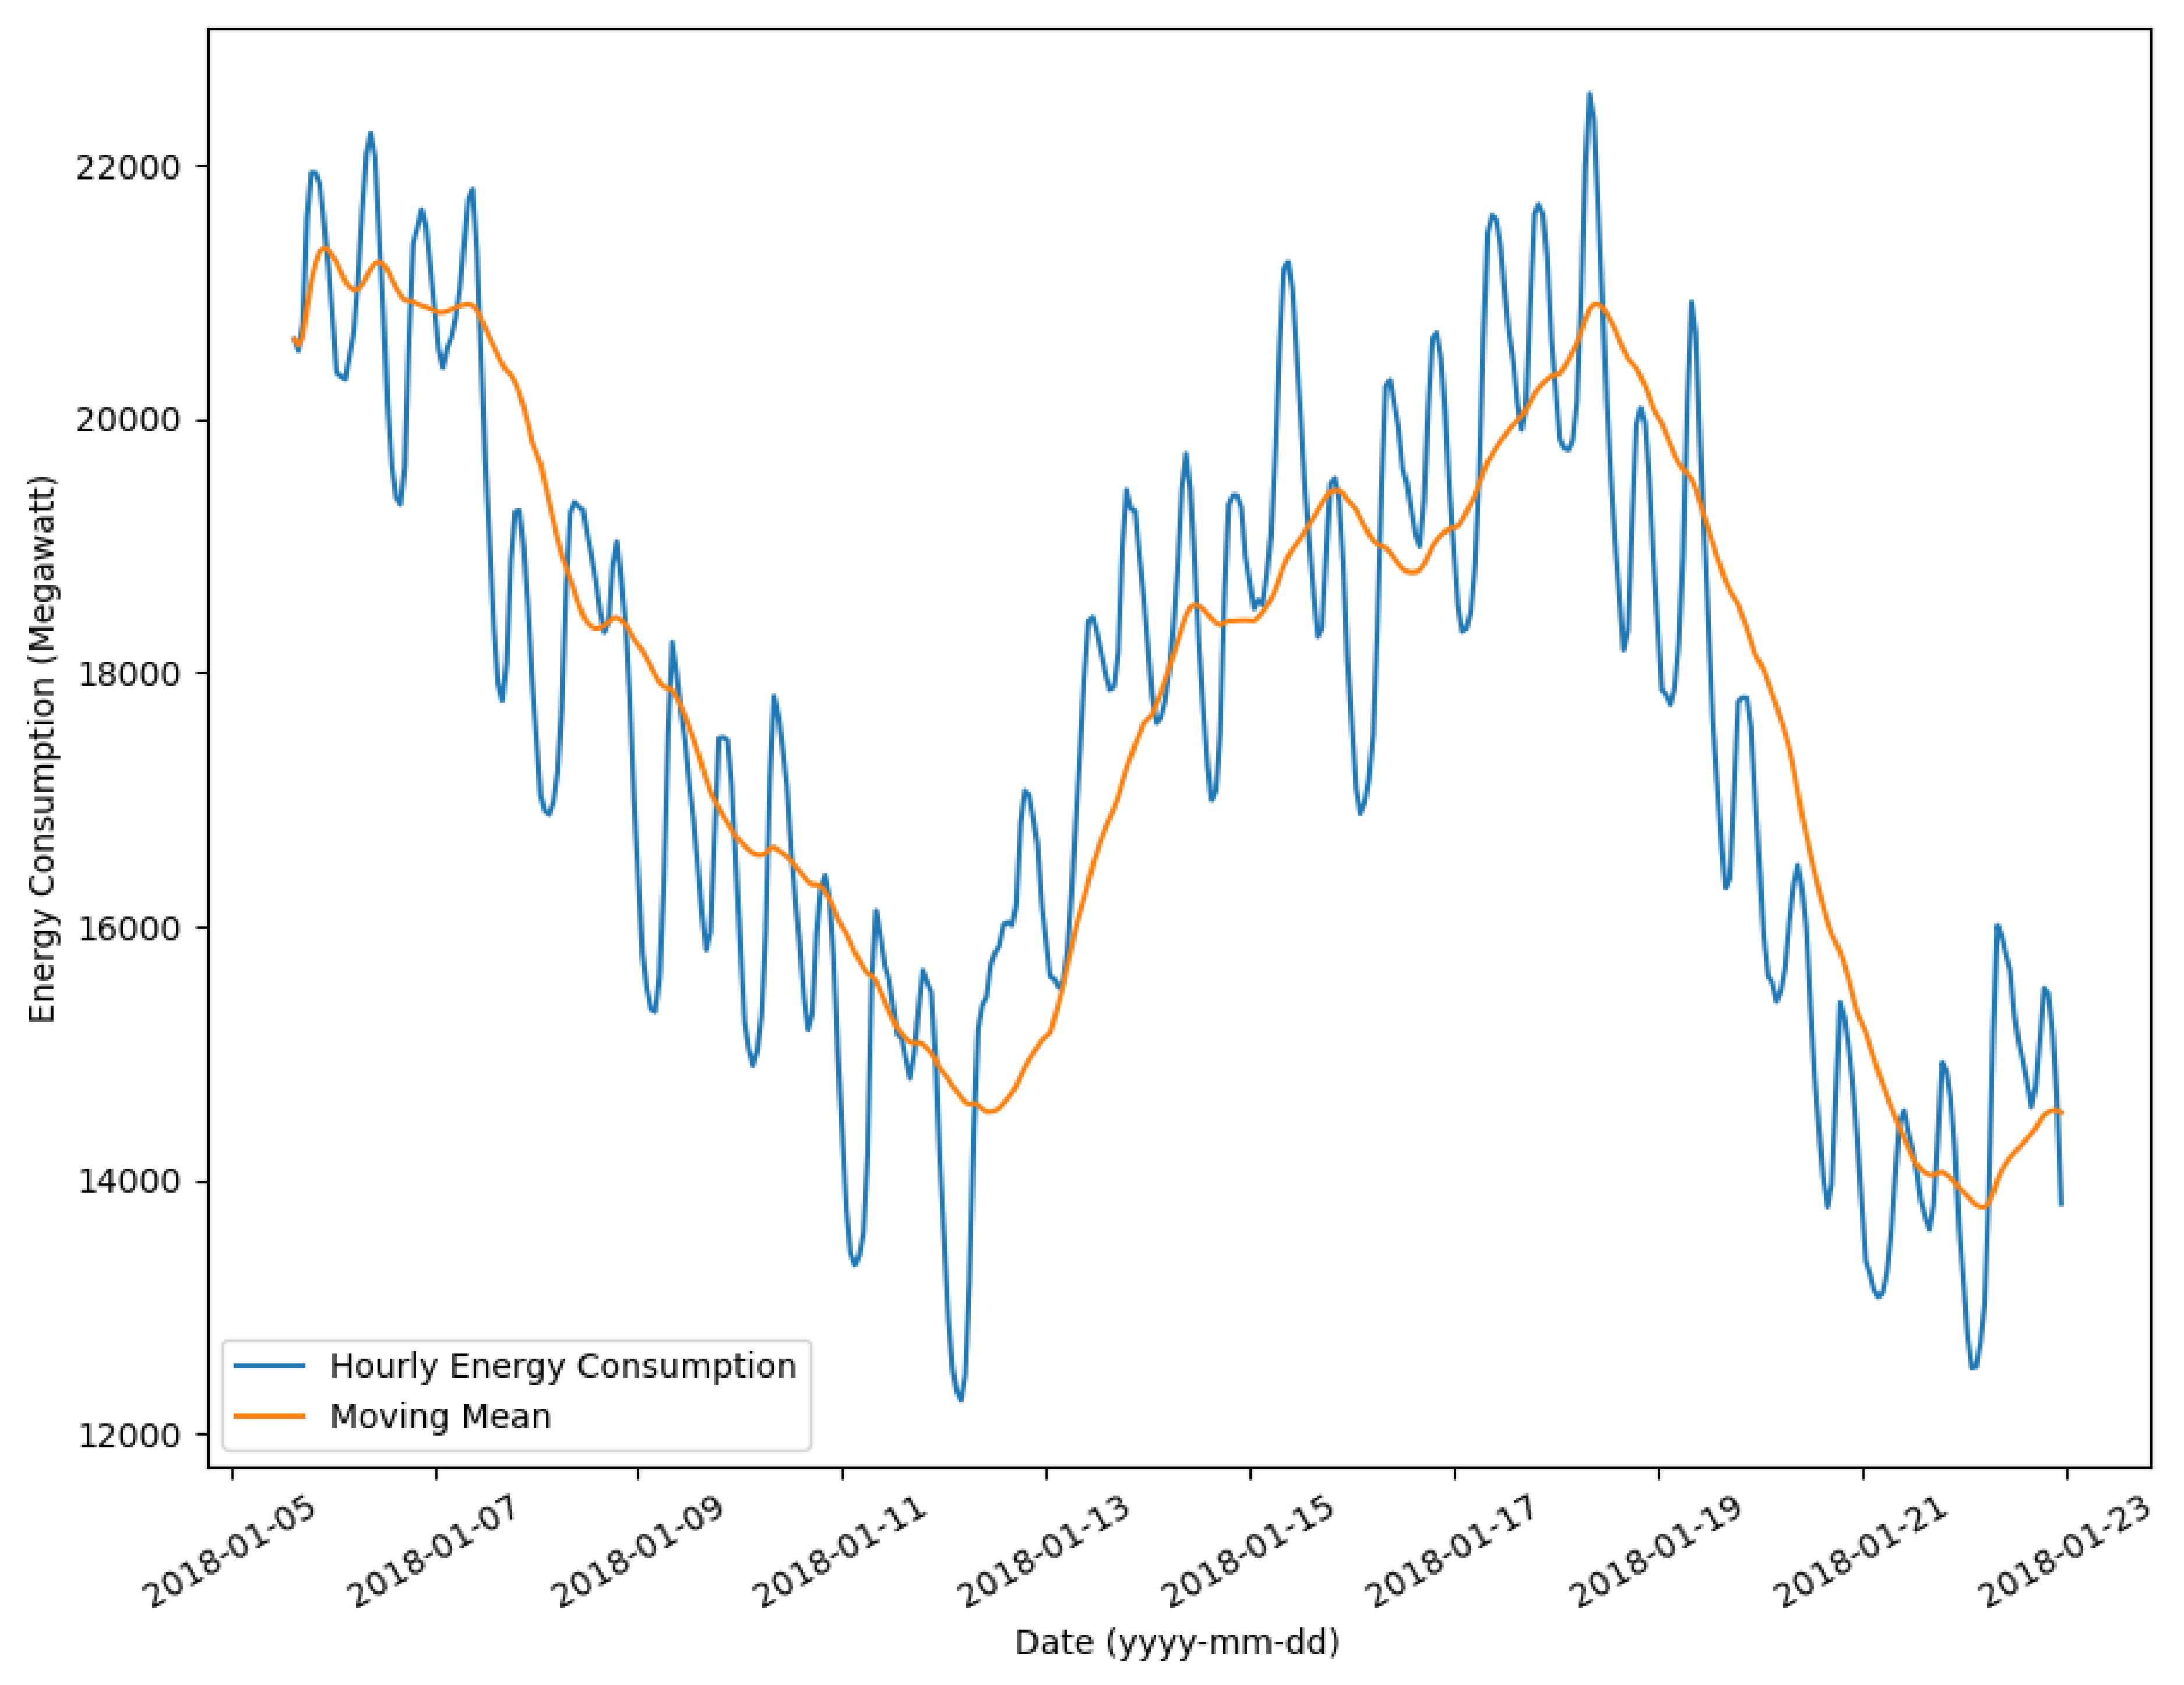
Figure 13 shows the chart about the MM of energy consumption for supporting business decisions in the context of IoT sensors in smart cities, based on the historic data from the corresponding Kaggle repository [
22]. In the evaluation experimentation about energy consumption, MMs used the last 1000 samples, taken every hour. In the simulation in this historic data, the system provided the following recommendations:
8 January 2018: “The system recommends to now fully run IoT sensors in smart cities as the energy is probably getting cheaper based on the continuous decrease in moving mean in energy consumption for 3 days”.
16 January 2018: “The system recommends to now provide offers to citizens based on their increasing activity based on the continuous increase of moving mean in energy consumption for 3 days”.
In the previous auto-generated explanations “offers” refer to customized advertisement. For example, if the system detects that many people are around, then it can advertise social events.
These generated explanations were achieved by using HAI principles. In this particular example, we used machine learning to associate time-series windows with different patterns. Then, we associated these patterns with certain text templates that were filled with some numeric data (e.g., the number of days).
These kinds of automatically generated explanations were the ones that we expected according to the criteria that we chose for this practical application. In addition, the dates properly matched situations in which these recommendations were reasonable. This experimentation has focused only in the energy consumption to explain the variations of energy price, although more realistic explanations could take more factors into account.
4. Discussion
Real-time data management requires streaming of trusty and reliable information and properly analyzing this in real time. For monitoring streaming of reliable information, one can either own the corresponding data source or take it from other public available information. In heterogeneous multi-disciplinary business and specially start-ups usually use third-party public information [
23]. In our methodology, we proposed using web crawler for this purpose. In particular, we selected Selenium since this library can collect information from dynamically loaded content. In our preliminary experiments, websites like Idealista (
https://www.idealista.com/ (last accessed 17 June 2020)) provided dynamically-loaded content which was not available by just analyzing the static source code. After testing our methodology in the contexts of real-state and cryptocurrency, we realized that an important risk of the proposed approach was the banning from websites by the measures for anti-crawlers. This was the case of Idealista, in which after a few calls to the website, they asked us to fill as some CAPTCHA (completely automated public Turing test to tell computers and humans apart). CAPTCHA are specially designed for avoiding automated bots on websites and are very hard to break by algorithms [
24]. We passed these tests manually through the open browser (i.e., with human assistance), and then our algorithm continued crawling for us. We did not have this problem in the Bitcoin website, so we kept going with the application in this field.
In this experimentation, we observed that the evaluation of decision-making support with real-time data management needs to be performed considering the context. In the particular case of cryptocurrency, the possibility of success may depend on the variability of the sequence, and whether Bitcoin was increasing their value. We observed this on the strong correlation among substantially different strategies. Thus, this methodology recommends to compare different real-time data management strategies on the same data intervals to assess which strategies may be the most appropriate.
It is worth highlighting that we observed that the variability of profits increased for long periods. We observed this on 5-samples averages for simulations from 45,000 min of time interval sizes (i.e., 31 days and 6 h) forward. This may be affected by the small sample for each time-interval size, but the experiments still revealed the volatility of Bitcoin and consequently the variability of possible results. This aligns with the finance literature that also highlights the volatility of Bitcoin [
25]. In fact, their findings advocated that safe asset withdrawal was really important in investor strategies in Bitcoin. This highlights the importance of our work, since real-time monitoring is essential for safely withdrawing Bitcoin assets when MM steeply decreases.
Concerning the second case study, IoT sensors data usually provided high variations. In particular, in the presented experimentation in smart grids of smart cities, the energy consumption varied periodically regarding the hour of the day (e.g., between night and day hours). In general, the variations in IoT data sensors regarding energies has also been observed in practical applications such as the work about the greenhouse micro-climate using IoT sensor data for efficient crop production [
26]. In addition, other studies have processed IoT data as time series. More concretely, Reference [
27] proposed a robust classification with data compression in time series from IoT sensor data. As a result, they were able to keep the accuracy with 93% with their first level of approximation in both UWave and Har datasets. In general, thanks to their compression technique, they improved the devices’ lifetime in 16% after 2 h. In this context, our proposed approach has provided reasonable results for detecting changes of trends in MMs, generating customized explanations based on this trend. We plan to improve this HAI generation of explanation by (a) using machine learning to classify into a higher number IoT sensor data pattern, (b) retrieving the real human-like explanation usually associated with this pattern, and (c) adapting the explanation by integrating the appropriate numeric values in the explanations.
Although our approach was based on numeric online data for supporting business intelligence, we acknowledge that the analysis of natural-language sources could also be really useful. For example, investor sentiment has proven to be related with the Bitcoin volatility [
28]. In addition, the sentiment analysis have proven to be useful understanding the needs and satisfaction of customers [
29], which are usually key for business success. As future work, we plan to include natural-language procession in the proposed framework.


