1. Introduction
The development and growth of academic and enterprise projects, which include the usage of Big Data processing technologies and intelligent systems, contribute to the spread of distributed computing, complex architectures construction for data storage and processing, and clusters creation. Despite this, it is difficult for key decision-makers to find the right solution and qualitatively evaluate infrastructure needs, develop and deploy certain IT processes, and implement monitoring solutions to acquire operational insights. The purpose of this article is to facilitate data-driven IT Operations management decisions based on BDA, Machine learning and Operational Intelligence.
Identifying the key tools and indicators for data workflow, infrastructure, user satisfaction monitoring in order to increase user experience, team-working, and project success level is equally important. Additionally, the study and monitoring methods will help to correctly implement techniques and ways of collaboration within the organization on the basis of successful use-cases and correct development of the IT solution implementation strategy.
Research goals are to identify suitable algorithms, methods, and indicators based on a solution requirements analysis, architectures and clusters development for logs data collection and load measurement, support decision-making on IT operations based on data-driven operational insights. The research objectives are to describe the most commonly used existing metrics for analyzing information technology project activities; their ability to predict and/or identify certain patterns, tools and methods to improve metrics calculation processes and obtain the best possible result; and to develop a machine learning model to predict transactional request results to identify defects or possible system errors of a particular information product and perform further root-cause analysis.
The application of Big Data and Machine learning technologies to a variety of data projects has always been challenging, as it required an architecture development capable of withstanding high loads through huge real-time datasets and complex computing processes used for intelligent systems and other functions. However, the successful application of these technologies can lead to successful data mining, certain patterns identification and bring new information to organizations. The study of Gloria J. Miller [
1] investigates Big Data and Business Intelligence (BI) projects classification paying attention to similarities and differences between project types, success factors identification using quantitative methods, which is quite crucial for making correct decisions and inferences. This research allows us to observe what factors might increase productivity, accelerate a project and how real-time monitoring practices, intelligent systems usage can increase all of the above.
Additionally, Papadaki D., Bakas D.N., Karamitsos D., and Kirkham D. [
2] were able to identify relationships between project success criteria and risk and project management using Big Data technologies, scientific literature databases, and social media data. This study helps classify potential uncertainties that can minimize the overall performance of a technology project, and it an important point to take into account when doing research and development activities, including monitoring implementation.
A study conducted by Gunasekaran A., Papadopoulos T. [
3] showed that Big Data and Predictive Analytics technologies usage correlated with successful decision-making of organization management, and described an algorithm for successful implementation of a data-driven decision. Key business decisions and support for operations using data-driven methods is an efficient way to increase productivity, embedding analytics and requirements analysis to help assess project needs and deal with risks [
4,
5,
6]. The study of Pugna, I. B., Duțescu, A., and Stănilă, O. G. [
7] researches the organizational challenges raised by Big Data technologies, its impact on the business environment and performance management. The most crucial set of skills to develop a data-driven culture in the organization are as follows: goal setting, assessing benefits and limitations, learning to trust data and commitment to data discovery [
8].
Machine Learning and Business Intelligence [
9] has been successfully used to make the best decisions for organizations. New trends and specific solutions for the complementary application of Business Intelligence practices with machine learning are being developed. A combination of these two techniques helps reveal valuable patterns and bring value to the organization. The trend for using machine learning to augment and improve existing techniques’ performance is increasing.
The practical applications of Machine Learning for Operations Management and Digital Marketing are well-studied in the research of Wang Q. [
10], who presents approaches to four real-world academic/industrial problems and their data-driven solution using Machine learning. Specifically, methods for Credit Debt Collection and contact center staffing are described, namely, the use of machine learning to predict the likelihood that a person will be able to repay a debt if a bank employee communicates with him or her on a particular day of the week, which has allowed for a 14% increase in debt repayments and improvements management operations in an organization. Using data mining to analyze a large number of log files and application/transaction data is very useful for gaining key knowledge about the infrastructure, understanding its data flow and service architecture, and identifying and predicting the effects of each data pipeline in real-time.
In particular, Stephany S., Strauss C., James A., Calheiros P. [
11] developed a new data mining approach for near-real-time weather monitoring for such countries as Brazil, which lacks weather radar coverage. Data analysis and insights extraction from information arrays can cut down costs and increase productivity if the measures are accurate.
Wang Y. [
12] and others proposed a data mining method based on unsupervised learning for unlabeled sheath current data monitoring that leads to effective earlier unknown patterns revealing. Therefore, applying data analysis and statistical methods for monitoring are discovered and used to solve problems related to infrastructure and hardware.
Abghari S., Boeva V., Brage J., and Johansson C. [
13] and others describe higher-order mining to monitor heating substations operations and behavior. The proposed solution allows performing data mining over patterns rather than raw data using cluster analysis, sequential pattern mining, minimum spanning tree (MST) and other methods. This method shows use-cases of applying analysis to gain real-time insights as well as collect historical heating substations data to improve industrial processes. Because of the various technologies for data mining usage [
14,
15], different visualization types and analytics help domain specialists in understanding a substation’s operational data. Machine learning models used for prediction pupils’ successfulness level at educational institutions helped reveal new insights about the difference between various student/pupil groups and how it affects studying processes and results. Therefore, creating a mathematical and statistical model for this gives new knowledge to a particular field of science.
Operational Intelligence is well-suited to interact with Big Data, as it is also a kind of a large information amount analytics but is more focused on working with real-time data than traditional Business Intelligence. The tools used for Operational Intelligence can be successfully applied to BDA, one of which is Splunk [
16]. Splunk offers ingesting data from multiple sources, performs analysis and monitoring directly in the application itself. Custom add-ons bring more insights and help define the strategy for operational intelligence application. In particular, many use-cases have been already developed and even successfully implemented with Splunk Enterprise and its Add-on for Machine Learning (Machine learning Toolkit) that allows a statistician or a data scientist to execute all necessary steps for statistical/machine learning model development.
Therefore, we claim that a successful combination of Operational Intelligence, Big Data, and Machine learning is capable of delivering many benefits with a reliable and correct application.
IT operations are one of the most crucial technology project success components, which is why the correct implementation of these processes will allow an organization to achieve the best result and create a reliable technology basis and infrastructure for further action. Thus, this research leads to IT operations optimization by defining the project goal implementation strategy, building the right software architecture solutions, using BDA, Operational Intelligence, and Machine Learning to monitor and compute key indicators. Developing successful use-cases will help guide organizations to the right path and successful project implementation, research, task completion, and more. Operational Intelligence including the use of Machine Learning is only just gaining its popularity and emerging as an integral component of IT operations management; consequently, many institutions are unable to use these technologies properly due to lack of experience and expertise in this field.
Many research and industrial projects that use analytics and Big Data are incapable of implementing the solutions qualitatively due to lack of experience and inability to find usage of the acquired insights. For example, in the medical field, about 84% of healthcare providers using Big Data technologies do not receive any benefit from this technology because of a lack of experience in implementing data-driven decisions and scarcity of analytic across a wide range of functions experience. In addition, 85% of institutions [
17,
18], regardless of the type of activity involved in Big Data projects, fail to apply Big Data solutions and use all the benefits of it.
Thus, organizations that have not been able to take full advantage of Big Data through an improper approach are immediately moving to other modern technologies. This creates a temporary mainstream benefit from which has only a small number of institutions and departments.
Most of the studies referenced are primarily focused on historical data, high-level/overview monitoring practices without the application of mathematical modeling and machine learning, which can help to solve a huge range of problems related to industrial data projects. A need for site reliability practices is needed to augment APM (application performance monitoring) and analytics. The novelty of the study is to obtain a highly accurate model for transactions tracing in a real-time distributed environment based on machine learning and mathematical modeling techniques together with Operational intelligence and SRE to enhance technology, especially data-based projects’ success levels, get extra insights into what is actually happening in a particular tier/layer of a data/IT operation process. A proper way of implementing an Operational Intelligence solution within a technology project is proposed and described. This allows project members to maintain a system availability at a high level, monitor particular operations, and identify particular problems early. Real-time monitoring practices are crucial and do not only focus on historical data, which is valuable, but also on real-time insights to perform well-arranged two-level (historical and current datasets) analysis. The rest of the paper is structured as follows:
Section 2 contains materials and methods for the correct implementation of Operational Intelligence best-practices, data preprocessing and processing methods used, and key metrics used for APM and management;
Section 3 contains the results with a proposed machine learning model for real-time transactions tracing, dataset and environment specifications and challenges;
Section 4 highlights the main characteristics that the research is based on, requirement analysis for real-time monitoring solution including Splunk, a novelty approach for dealing with huge amounts of real-time data;
Section 5 contains a conclusion of the main study focus and findings, and states a specific aspect that needs to be studied more within further researches.
2. Materials and Methods
2.1. Main Research Methods Used
The main focus in the study is done on real-time data and ingesting logs to obtain operational intelligence insights with the application of machine learning and mathematical modeling to the continuous data stream, performing data-preprocessing on the fly, and making use of site reliability metrics to predict about 10 classes of transaction output. The methods include traditional data processing (statistical analysis, feature engineering, data ranges, ratios calculation) as well as the one with more focus on APM and service level objectives.
Particular methods include traditional data preprocessing: data ranges of certain features; normalization as a way to improve model accuracy, PCA (principal component analysis) used to select the best features and reduce dataset dimension, imputation, and removal of missing data; the research benefited from statistical analysis and feature engineering; and application performance monitoring has been conducted to get a more accurate view of the system functionality. SRE techniques were used to define and enhance service level indicators, calculate them thoroughly and make modifications with the metrics, for example, showing the remaining budget for errors, downtimes not only as standard quantity but also as a percentage or in minutes. Applying real-time monitoring for system observability enhanced data pipeline functionality and transaction workflow. Use-cases study of applying machine learning models to improve and accelerate real-time monitoring has been studied to develop a strategy for certain technology implementation; quantitative methods have been processed to get an overview of data projects in industry; qualitative analysis of steps to meet project requirements through monitoring, and transactions tracing has been done.
To conduct the study, Splunk as data ingestion and storage, and the its Add-on for Machine learning has been used. It is beneficial because data pre-processing is made quite carefully with Splunk search processing language; real-time monitoring dashboards inside Splunk allow the observation of the needed metrics and conduct all the steps in a single product. Additionally, Splunk has a good data compression algorithm which allows it to quickly process huge volumes of data. Nonetheless, there are other options to be used for the above-described methods and steps—for example, Elasticsearch or a specific programming language with the ability to process real-time data stream, and using machine learning/data modeling—but it depends on the amount of data to be indexed and requirements.
The problems that have been encountered during the research are getting a lot of messy data with missing values, ingesting huge amounts of data in real-time, selecting not only the best features but also the proper for model training data, and giving detailed attention to dataset collection because it should include various transaction outputs with a certain ratio.
2.2. Operational Intelligence Analytics and Engineering in a Technology Data-Based Project
Data analysis projects have specific specifications and requirements, such as the ability to collect and store data, information security, environment for data storage availability, data quality and data manipulation engineering [
19,
20], a strategy for data usage (which includes goals and aims that are related to the business problem), tools and software for data processing. [
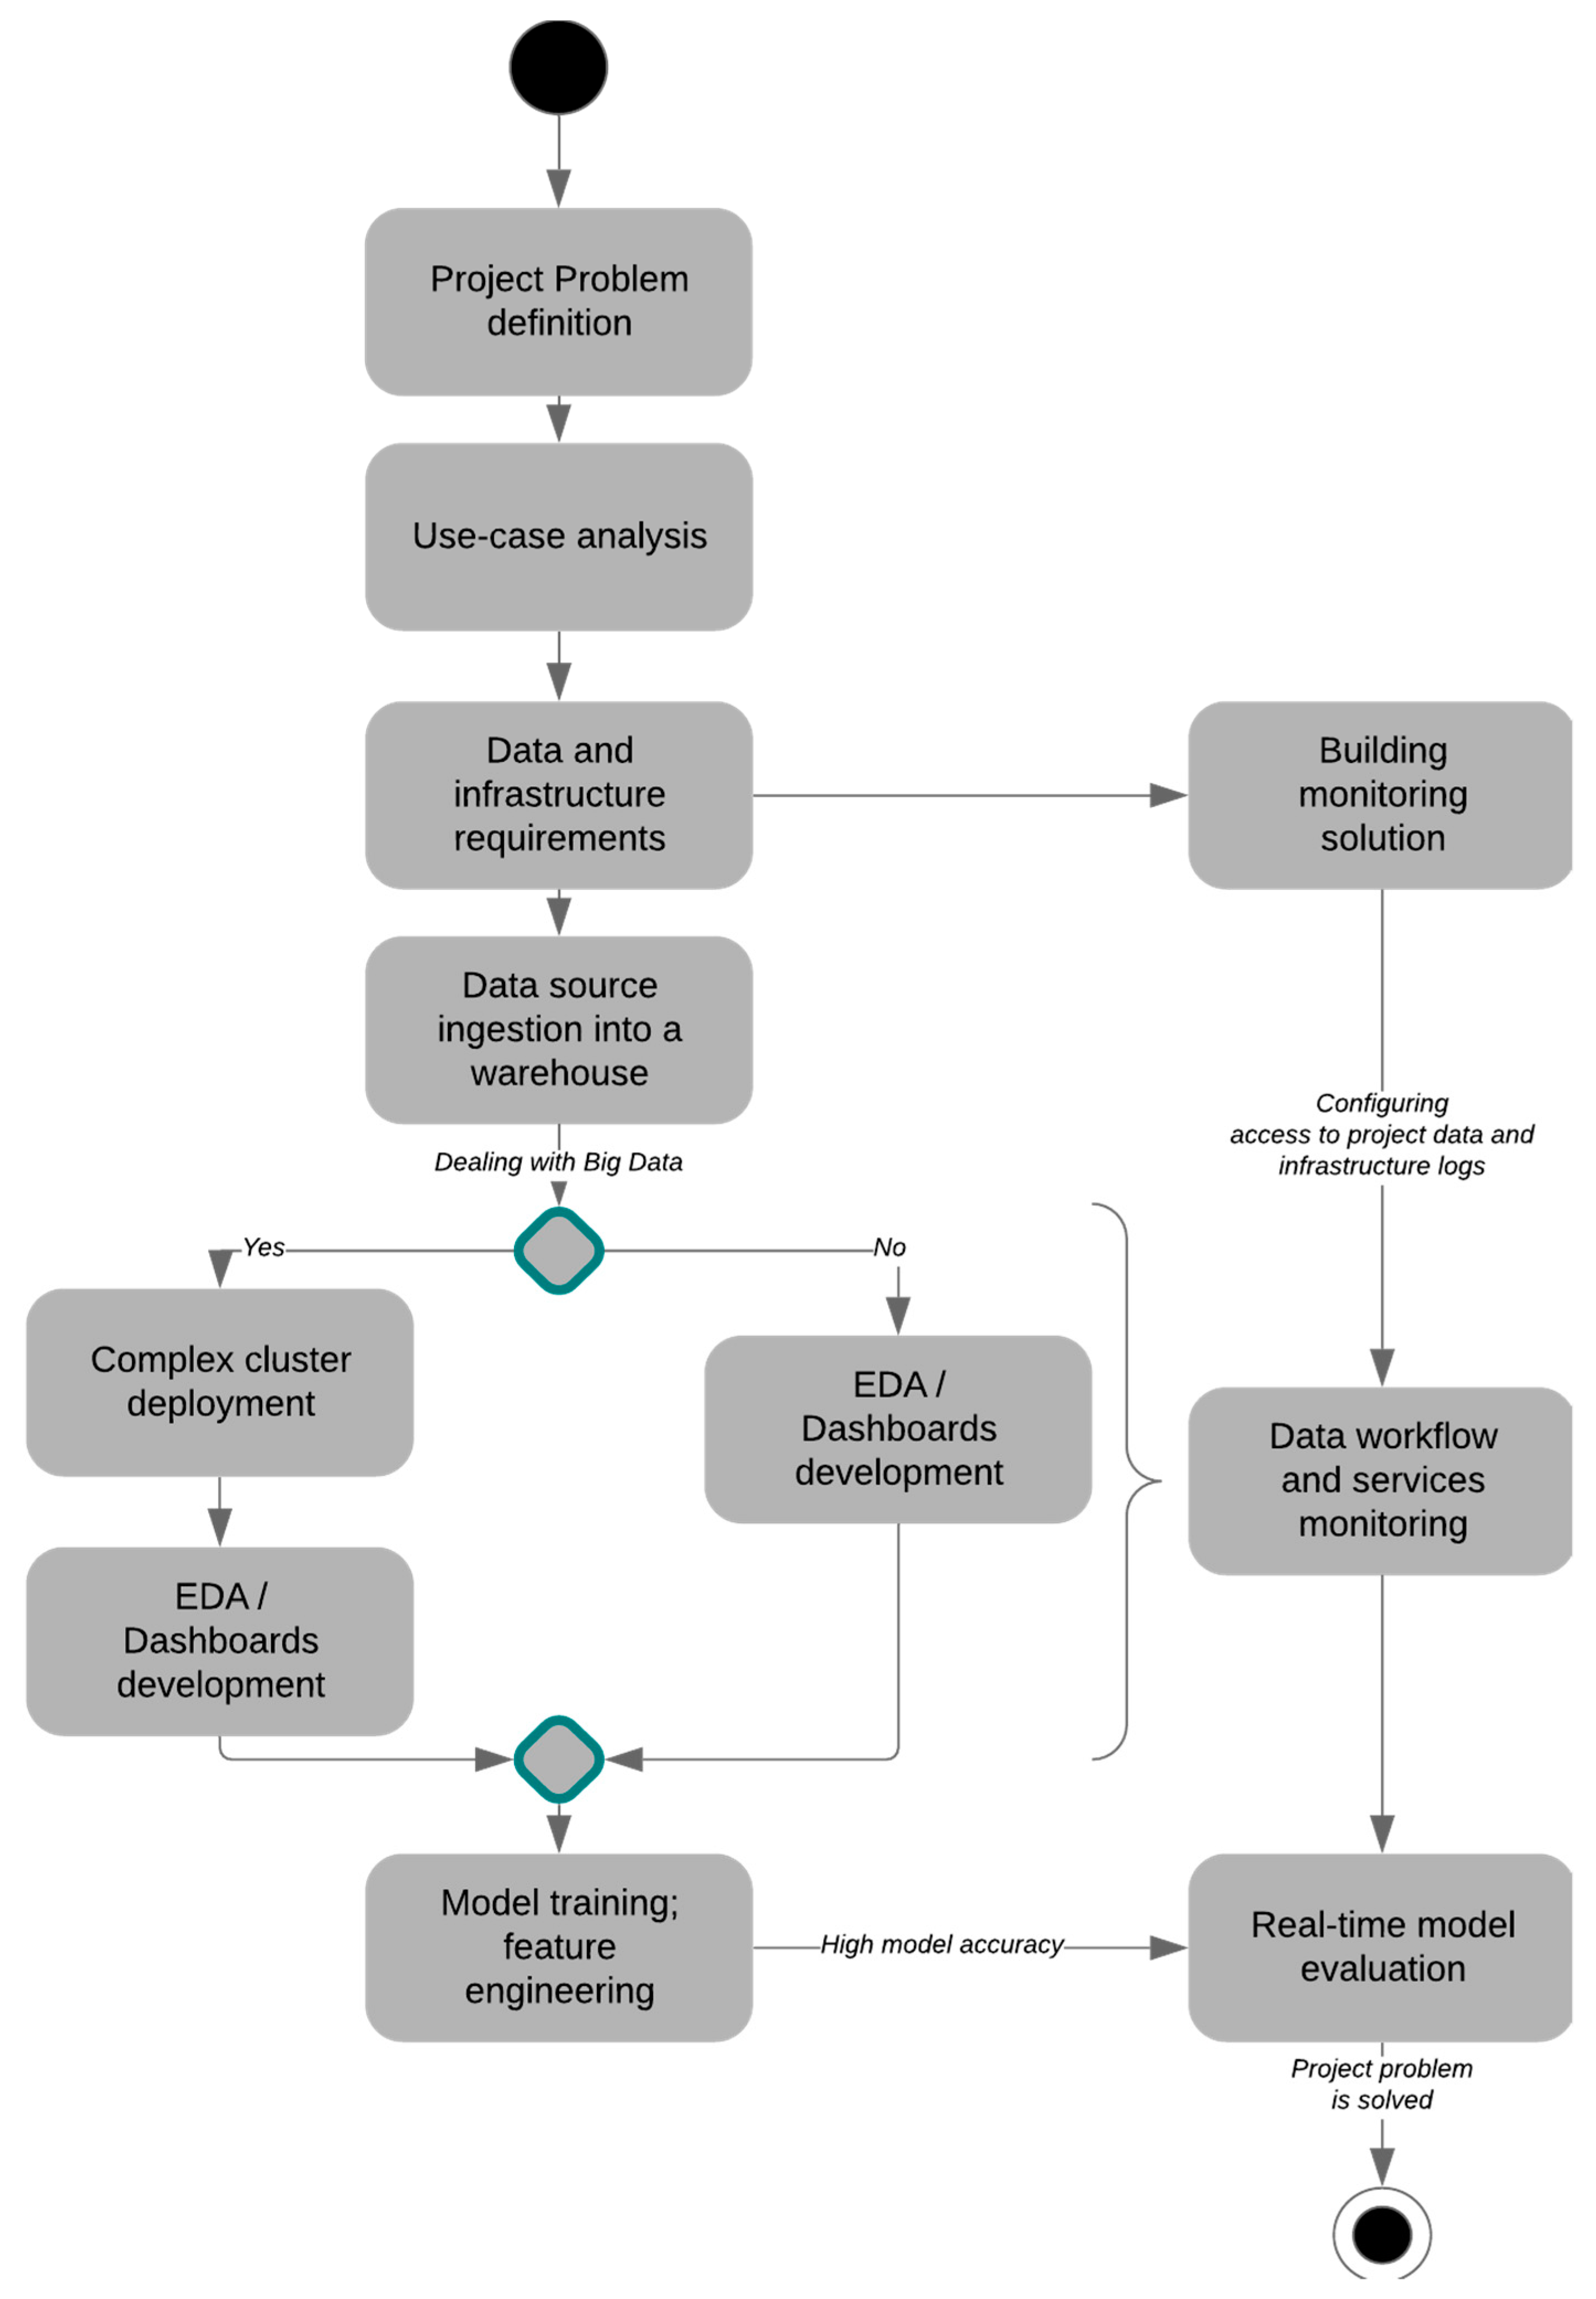
21]. In order to meet all the above requirements, the article proposes to apply Operational Intelligence Monitoring using machine learning and BDA. As shown in
Figure 1, the initial stage of any Data project is to identify a problem that needs to be solved with data and information technology and requires the use of root–cause analysis to identify, discuss, and determine the severity of the business problems. After that, in certain projects due to lack of time and experience, they often miss the second and third steps and immediately move on to data collection and analytics. However, the article argues that existing or similar solutions analysis needs to be done, an effort to successfully implement a similar data-project may have already been done at a certain institution and find out what benefits it has brought to those organizations, whether it is able to deliver it to those who have encountered a particular business problem. After conducting a detailed use-case analysis, it ought to be found out what information is needed, how to collect it, and where to store it. The next key step is Data Engineering. In case it is enough to be limited to a small dataset, a single-cluster environment will be deployed that will allow data storage and collection and making its analytics. Very often, in this case, open-source solutions are used.
If it is needed to collect huge amounts of data but also with the use of real-time data stream mining, a complex architecture solution for data ingestion and distributed computing is developed. In such cases, special attention is paid to the usage of cloud technologies capable of processing and storing large amounts of data or local data centers [
22]. In parallel, the processes of building an Operational Intelligence solution must occur. This is required in order to provide data workflow monitoring, avoiding missing data and gaps [
23], service reliability monitoring, and predict service downtime, information security, data privacy, quality and integrity checking; compute application performance specific metrics; implement system reliability engineering practices; and to prevent data and infrastructure issues. The next step after completing data engineering is analytics, data science, especially exploratory data analysis, statistical models’ development and selecting the most accurate one that will be used.
A model that is trained on a pre-collected and refined dataset is deployed on a production environment and Operational Intelligence is used again not only to monitor all the above but also to validate and evaluate the model’s accuracy during its usage. Additionally, some mathematical modeling and machine learning tasks for various industry purposes are likely to be shown on real-time dashboards, which can be a good way to monitor model performance as well as show its output to the users. If accuracy does not meet the minimum threshold, project members responsible for the model training and data science get notifications and alerts for accuracy which is not high enough to meet project requirements. If all is well and the data project has allowed resolving the initial task, monitoring continues until the completion of data engineering and data science parts.
Thus, the use of Operational Intelligence occurs in a way that monitors the system and research and development processes and depends on the amount of data collected and processed, as well as the load on the infrastructure to prevent its failure or incorrect functionality.
To measure the infrastructure load level, specific metrics help to do this possible. In order to implement an operational intelligence solution inside a technology/data-based project, some indicators, especially those that are shown in the
Table 1, need to be calculated or event ingested with the data itself. Those metrics help get insightful statistics about each component of a system, detect vulnerabilities and transform raw data into knowledge and business intelligence. Monitoring availability and performance increases user-satisfaction level. Thus, the metrics can potentially help observe the most vulnerable and weak application components, perform system analysis, and accomplish a service. The metrics are also related to the field of SRE and defining service level objectives, which is another deep topic for research. These metrics are very log/application-specific because they show transaction/request output and describe human–computer interaction with the system. That is what makes them valuable for an analyst to be processed and project members to monitor, get knowledge and valuable information. Additionally, machine learning can enhance this experience through intelligent forecasting of these metrics, applying them as features during data modeling. In other words, a machine learning model for application performance specific tasks might be improve one of those metrics or get more accurate than it has been using them. For a detailed description of the indicators used in application performance monitoring and management, see
Table 1.
These metrics allow Operational Intelligence engineers to do high-quality and reliable system and infrastructure monitoring on which data will be stored and processed, user interaction, and data collection and integrity verification should be checked. Very often, not only management but ordinary engineers or technology project developers are devoid of operational insights, not always able to observe infrastructure load and due to this cannot observe and prevent possible downtimes. That is why the implementation of operational intelligence methods and metrics calculation for application performance monitoring will allow project members to collect application logs, queries, perform their analytics in specialized software, perform security enhancement operations, service troubleshooting and root-cause analysis.
Each of these metrics and indicators provides user interaction with the infrastructure, data flow monitoring and certain vulnerabilities and malware detection. For example, response time for operational intelligence engineering is a very crucial factor to have because it allows complex indicators computation. Keeping an eye on them for a management level helps make new decisions and leads to their proper implementation. Application performance management is one of the key components of Operational Intelligence that corresponds to determining infrastructure load, user satisfaction level, calculating various ratios, collecting log files and query information in real-time. It is used for site/service reliability engineering, alerting and monitoring purposes.
A no less important indicator of an application stable operation is downtime. The metric displays the amount of time when a service component (node, cluster) or even the entire service was unavailable to users or did not perform its functions as expected. It is identified by receiving the 5XX HTTP response status code, which means that there is a server-side error in an application. Downtime might not allow a service to index information, conduct analytics, cause service unavailability for users. It should be thought of its prevention in the early stages of application architecture development, since downtime itself causes a lot of damage to the project, suspending the transactions, data flow and more. In addition to using standard HTTP status codes, we recommend that a system owner uses custom system status codes to help easily identify issues and their causes.
Therefore, using Operational Intelligence will allow it to be identified and minimized. The effect of downtimes on the information system in healthcare is studied in the research by Wang Y. and others [
24]. Network downtime minimization techniques are being developed for future use in data centers and data warehouses [
25].
4. Discussion
In total, 77% of the analyzed literature in this research apply historical data for certain academic or industrial projects and research activities, make little use of complex monitoring using operational intelligence tools and, in rare cases, are not able to analyze and interpret insights, apply the best practices for data project processes and implementation, which are very crucial to meet certain requirements. The remaining 23% of the analyzed literature does not make use of machine learning and SRE in a real-time data stream, applying monitoring solutions for advanced transactions tracing and defining service level objectives. Whereas our research is focused on combining historical data analysis as well as continuous real-time monitoring with specific interest and application performance monitoring, Big Data-related processes improvements through continuous monitoring, and combining machine learning, mathematical modeling practices.
The research is based on working with real-time data, applying machine learning models for a tabular dataset using the Operational intelligence tool Splunk and SRE methods for application performance monitoring. The developed machine learning model has made a difference to improve transaction tracing. It helps identify errors, enhance operations, data pipelines to make a project requirement precise, identify use-cases and apply monitoring for project improvement. Continuous real-time monitoring combined with machine learning for a certain industrial operational use-case allows a system to increase availability which is one the factors that lead to higher user satisfaction levels.
As mentioned above, Splunk has been used to conduct the research. It offers multiple license types for ingesting a needed amount of data. Free development/research licenses for a non-production environment that allows ingesting up to 50 GB data per day for six months, and has been used for research and development activities. For small enterprises and organizations, there is also a free license with limitations to ingest less than 500 MB of data per day. The exact costs need to be clarified in the Splunk itself and they may be different for various regions.
Multiple calculators are available online to measure how much storage is required and what number of nodes is needed for ingesting a certain amount of data in a real-time monitoring tool. The Splunk Sizing calculator has been used to conduct requirement analysis for this research [
27]. For Splunk, in our research, a daily data volume is met with the development license. Up to 50 GB of data has been ingested regularly, the total retention size is set to 45 days (the data is stored up to 45 days). For using Splunk Machine learning toolkit, it is recommended to have a separate node. Therefore, the total number of nodes suggested is two but might be decreased to only one. As an outcome, a total storage equaling 300 GB is recommended considering the specified above requirements. One of the most important steps to implement operational intelligence practices and meet project requirements is to have a clear strategy of what should be done in the scope of a certain data project, collect insights from operational intelligence to meet a technology project requirements, and even enhance it with Machine learning.
The current limitation is that the model has been trained on a collected and previously cleaned data set, missing data has been removed. In further researches, we will focus on the possibility to select proper data entities for model training in real-time. The main issue is that not all data is clean enough and dealing with noisy data entities is important as well. Additionally, time-series analysis, forecasting for application performance purposes needs to be considered for application performance purposes. Using cases of applying machine learning in infrastructure monitoring is advantageous to identify successful BDA project patterns.


