The Sentiment Analysis Model of Services Providers’ Feedback


1
Artificial Intelligence Department, Lviv Polytechnic National University, 79013 Lviv, Ukraine
2
Department of Information Systems, Comenius University in Bratislava, 81499 Bratislava, Slovakia
*
Author to whom correspondence should be addressed.
Electronics 2020, 9(11), 1922; https://doi.org/10.3390/electronics9111922
Submission received: 14 October 2020
/
Revised: 1 November 2020
/
Accepted: 6 November 2020
/
Published: 16 November 2020
(This article belongs to the Special Issue Electronization of Businesses - Systems Engineering and Analytics)
Abstract
:The purpose of this paper is to develop a hybrid model Ukrainian language sentiment analyzer, which should improve the accuracy of the mood definition to expand the Ukrainian language among the instruments on the market. The object of research is the processes of determining the language of the text and predicting its sentiment score. The subject of the study is Ukrainian comments posted by Google Maps users. The following text categories are taken into account: food, hotels, museums, and shops. The new method was built as an ensemble of support vector machine, logistic regression, and XGBoost, in combination with a rule-based algorithm. The practical use of the algorithm makes it possible to analyze the Ukrainian text in accordance with the category with the visualization of the research results. The accuracy of the proposed method is bigger than 0.88 in the worst case. The mining procedure of the positive and negative sides of service providers based on users’ feedback is developed. It allows electronics business to make improvements based on frequent positive and negative words.
1. Introduction
Emotions are an integral part of our mental activity and play a key role in communication and decision-making processes. Emotions constitute a chain of events consisting of feedback cycles. Feelings and behavior can affect cognition, the same as cognition can affect feelings. In addition to being important for the advancement of artificial intelligence, the detection and interpretation of emotional information are key in many areas of computer science, such as human–computer interaction, e-learning, e-health, automotive, security, user profiling, and personalization. Text sentiment analysis is one of the popular methods in computational linguistics. Its main task is to mark emotional words in the texts and their sentiment score. The sentiment is the commentator’s emotional attitude to the subject/event expressed in the text [1].
With the development of modern technologies, communication with customers is increasingly moving from live to virtual, e.g., calls, video calls, chats, e-mail, etc. [2]. However, it has significant advantages, as it allows us to analyze the services provided, both with the participation of the user (surveys, feedback) and without (analysis of correspondence in the chat). In addition to analyzing customer sentiment, the system owners can check the work of their employees, for instance, in support or call centers.
Processing knowledge from such a large amount of unstructured information is an extremely difficult task, because the content of today’s Internet is quite suitable for human perception, but remains difficult to access for machines. The opportunity to capture the views of the general public on social events, political movements, company strategies, marketing campaigns, and product preferences has triggered a growing interest of both the scientific community, leading to many exciting open challenges, and the business world, because of the excellent benefits of marketing and forecasting the financial market.
Currently, there are many analogs of sentiment analyzers, but they are not universal, each has its advantages and disadvantages, and are not effective in all cases [3,4]. For example, despite a large number of text processing and analysis tools, there are only a few which support Ukrainian text analysis. Mostly, these are just small projects with created libraries, which can be used only by developers, not by ordinary users.
The aim of the paper is to develop a method of sentimental analysis of Ukrainian text due to the problem with corpus absent, poor libraries and tools for this language. The proposed method is built as an ensemble of support vector machine, logistic regression and XGBoost, in combination with a rule-based algorithm. The software is developed in the Python programming language. The dataset consists of location feedbacks (hotels, shops, etc.) from Google maps. Google Maps is chosen because it is one of the most popular tools for obtaining location information (in this case, location feedback). The hybrid algorithm was checked for accuracy in both cases: correct and mistaken choice of category. The accuracy of the model was in the range of 89–98%.
While developing model main obstacle was lack of tools for Ukrainian language preprocessing. After the research, the authors found two packages which support Ukrainian, but unfortunately did not include full functionality. As a result, only word normalization is used. The same issue arose with the polarity of words: available tools provide only −1, 0, 1 which is not enough for deeper analysis. Existing polarity dataset of Ukrainian words consists only with “literature words” and shows low prediction quality when using it on live review comments. Therefore, it was decided to create independent sentiment dictionaries for analysis. Moreover, dictionaries were provided for different categories, which increases the accuracy of a model. These dictionaries are used in rule-based model combining with TF-IDF method.
The main contribution consists of the following:
- The new ensemble of sentimental analysis in a combination of productive rules shows the accuracy more than 89%.
- The estimation of the quality of “poor” classifiers and its ensembles allows finding the best solution not only for feedback analysis but also for each category of text evaluation.
The developed system can be used for increasing the business opportunities and improving the clients’ services in tourism and public domains.
This paper consists of several sections. In Section 2, the analogs are given. The sentimental analysis models are analyzed. The next section presents the independent method for sentimental analysis. The experimentation and results are covered too. The last section concludes this paper, containing the probable decision of the appraisal technique.
2. Related Works
The software market proposes a lot of software tools and solutions for text analysis. However, only part of these solutions can be used for the quality evaluation of the services providers. Moreover, only a few of them can process the Ukrainian language. The biggest part of ready-made tools supports different sentimental analysis models and techniques, but it is impossible to evaluate the quality of the separated model. The following analogs are analyzed in detail:
- MonkeyLearn [5] is a convenient machine learning platform for text analysis. MonkeyLearn also integrates with applications (such as, Excel, Google Sheets, Zapier, or Zendesk). In addition to the ready-made model, the user can learn their own model of sentimental analysis by choosing the algorithm and parameters. Benefits include a great user interface and well-documented Application Programming Interface (API), which is also very user-friendly with tutorials, and easy to use. Cons: There is a limit to the number of requests that can be made according to the current plan.
- IBM Watson [6] is a multi-cloud platform that offers many APIs for analyzing natural language processing (NLP)-based moods. The Watson Tone Analyzer, for example, focuses on checking support staff by analyzing whether they are polite and whether they have really solved a customer problem. Pros: User-friendly interface; intelligent guidance functions; impressively fast analytics; powerful for queries in natural language. Cons: It is impossible to perform real-time analytics.
- Lexalytics [7] is a tool that focuses on customer moods and word processing (breaking them down into sentences to evaluate elements such as semantics and syntax) and then analyzes moods. After the analysis, the tool provides a set of visual results. The user can customize the tool in different ways, although this option is aimed at specialists in the field of Data Science. Pros: Determines the assessment of mood, and there is the ability to categorize data, many languages, and good visualization. Cons: Additional payment for more languages, limited transactions for the base license, and crashes with large data sets in Excel.
- MeaningCloud [8] is a tool for multilingual mood analysis using the API. Moreover, it can detect irony and polarity. In addition, the user can include any dictionary for work. One of the best features of MeaningCloud is the detection of global attitudes (the general impression of the client in a particular text), the identification of opinions against the fact and the detection of attitudes in each sentence of the text. Pros: many languages, good support and learning opportunities, a large selection of functionality. Cons: no visualization, supports only Cloud, SaaS, Web.
- Rosette [9] is an API that uses artificial intelligence (AI) to analyze natural language. It was originally used to analyze moods on social media, but eventually branched out to analyze entire documents and individual organizations mentioned in the text, such as the moods expressed by customers when they mention a particular product, company, or person. Rosette is able to identify parts of speech through morphological analysis and lemmatization. Pros: Many languages, categorization, automatic ordering of documents. Cons: Maximum download size of 600 KB and the maximum number of characters is 50,000.
- Repustate [10] is an online mood analysis tool that offers an understanding of 23 different languages. This software can even rate moods by slang, such as FYI, btw, and emojis, to determine if the mood of the message is negative or positive. In addition, it gives an opportunity to configure the API to detect a specific language and help recognize alternate word meanings, giving a lot of control over how this mood analysis tool scans texts. Pros: Restrictions on requests per month, not per day. It provides an ability to create one’s own rules and sub-accounts for them. Cons: User data can fall into the “neutral mood” category.
- Clarabridge [11] has a customer experience management solution that includes a tool that creates customers’ mood metrics by analyzing their emails, chats, and surveys. It also combines lexical and grammatical approaches to analyze the mood of each sentence. Unlike the tools mentioned above, Clarabridge also focuses on analyzing the mood of audio data. This is especially useful for companies that rely on call centers as a sales channel or customer support. It not only analyzes the subscriber’s speech, but also their tone. Pros: The functionality of voice-to-text transformation is extremely accurate, and the alert system for current topics is very useful, and it is easy to customize for specific areas. Cons: The user interface could be more intuitive. Improvements are needed for the accuracy of comments based on sarcasm.
- Aylien [12] is another online tool that unlocks the hidden meaning of texts, analyzing moods and classifying them into positive or negative, or subjective and objective. The user does not need to be an expert to use the tool, but needs to know how to program to use the API. The text analysis platform also allows creating own model. Pros: Clears HTML documents from ads, tags, navigation elements, and everything that prevents the understanding of the text, getting keywords from the text, leaving only the most important concepts, automatic hashtag suggestion helps to get more categories of content on social networks. Cons: No functionality for business intelligence.
- SYSTRAN.io [13] is a set of APIs for: translation, multilingual dictionary search, natural language processing (entity recognition, morphological analysis, part of language tags, language identification…) and text extraction (from documents, audio files or images). The SYSTRAN platform allows using and analyzing both structured and unstructured multilingual content, such as user-created content, social media, web content, and more. Supports languages: depending on the task, supports a maximum of about 100 languages. Pros: Many languages, a large selection of languages for translation. Cons: Supports only ios and web, no mood definition.
- Twinword Text Analysis Bundle [14] is one API for all user text analysis needs (mood analysis, topic labeling, lemmatizer and much more). Pros: Fast keyword filter, simple user interface, LSI keyword graph, most common keywords. Cons: Supports only English.
The analogs described above contain different types of functionality. Therefore, to reduce their analysis to the type of developed system, the following main points were identified: analysis of “live” comments, support for Ukrainian, visualization and free plan. The comparison is collected in Table 1. “Live text” in Table 1 means text with slang, ambiguity, uncertainty, jargon, etc.
So, the main requirements to the developed method, algorithms and tool are the following:
- data processing in the real-time,
- possibility of visualization,
- possibility of adding the new dictionaries or extend an existing one,
- possibility of find added value for business.
Next, models of sentimental analysis are analyzed.
Authors in [15] used a new and improved Adaboost approach for sentiment analysis with different base learners for Baggin. Li [16] present a gradient boosting algorithm, an ensemble learning technique, to implement the prediction task in sentimental analysis. Park [17] investigate the customers’ hotel revisiting behavior using association between users.
The sentimental score algorithm is proposed based on NTU Sentiment Dictionary by Zhang [18]. This algorithm is developed as hierarchical classifier. Liang [19] describe distribution linguistic information algorithm based on developed dictionary and ensemble of Bayes and SVM classifiers.
Latent aspect rating analysis (LARA) with latent ratings on different aspects is proposed in [20]. However, the accuracy of proposed method is not high.
Papers [21,22,23] present different ensembles of classification models and approach for features selection. Abbas [22] propose ensemble majority vote classifier based on support vector machine (SVM). Sangam and Shinde in [23] develop new ensemble based on SVM and artificial neural network (ANN).
As result of the study, we would like to underline that most of the researches in sentimental analysis is based on different ensembles of machine learning algorithms.
3. Construction of Model
In this section, the new model of sentimental analysis based on ensemble of machine learning algorithms and proposed rule-based classifier is developed. The advantages and disadvantages of machine learning algorithms for sentimental analysis are given.
This dataset consists of the following categories taken from Google maps reviews: hotels, food, museum, and shops.
3.1. The Classifiers Choosing
First, the “poor” classifiers are chosen.
The support vector machine method [24] is a linear model for classification and regression problems. The idea of sentimental analysis implementation using SVM is the following: the algorithm creates a line or hyperplane that divides the data into positive and negative classes. A hyperplane is an (n−1)-dimensional subspace for n-dimensional space. An example of a linear hyperplane (x) is given below:
.
The distance between the hyperplane and the nearest data point from any set is known as the boundary. The goal is to choose a hyperplane with the maximum possible margin between the hyperplane and any point in the training set, which gives more chances for the correct classification of new data. LinearSVC module, implemented in terms of LibLinear (A Library for Large Linear Classification) was used for SVM classification.
K nearest neighbor (knn) [25]. To classify each of the objects of the test sample, the following operations are performed: calculate the distance to each of the objects in the training sample; select k objects of the training sample, the distance to which is minimal; the class of the classified object is the class most often found among the k nearest neighbors. The distance calculation based on TF-IDF is done using Euclidean distance. The best K on KNN will be searched for by 10-fold cross validation. K-closest distance will be voted. Most results will be the class of the data being tested.
Logistic regression [26] is an appropriate regression analysis that should be performed when the dependent variable is dichotomous (binary). The probabilities describing outcome of a trial is modeled using logistic regression. To control emissions, logistic regression uses the sigmoid function:
Next, the ensemble technics for methods given above is chosen.
Boosting is an ensemble technique where new models are added to correct mistakes made by existing models. Models are added sequentially until further improvements can be made. A popular example is an AdaBoost algorithm, which weighs data points that are difficult to predict [27].
Gradient boosting is an approach where new models are created that predict the residuals or errors of previous models and then added together for final prediction. It is called gradient boosting because it uses a gradient descent algorithm to minimize losses when adding new models. This approach supports both regression and predictive modeling classification problems.
Bootstrap samples are not created during boot implementation, but instead each tree is built on a data set X, r at each step is modified in a certain way. In the first iteration, a tree is built based on the values of the original predictors f1(x) and there is a residue vector r1. The next step is a new regression tree where f2(x) is no longer built on educational data X, but built on residuals r1 of the previous model. The linear combination of the forecast on the constructed trees gives us new residuals:
and this iterative process is repeated B times. Due to the construction of not deep trees on the residuals, the response forecast is slowly improving in areas where one tree does not work very well. Such trees can be quite small, with only a few end nodes. Compression parameter λ regulates the speed of this process, allowing to create combinations of trees of more complex shapes to “attack” the remains. The final model of boosting is an ensemble [28]:
r2 ← r1 + λf2(x),
The extension of gradient boosting is XGBoost. The improvements of the algorithm are the following [29]:
- Regularization: It penalizes complex models using both LASSO regularization (L1) and Ridge regularization (L2) in order to avoid overfitting.
- Working with sparse data: The algorithm simplifies working with sparse data by filling in the missing values during training depending on the loss value. In addition, it allows you to work with various sparsity patterns.
- Weighted quantile method: XGBoost uses this to most efficiently find the optimal split points when working with a weighted dataset.
- Cross-validation: The algorithm uses its own cross-validation method at each iteration. That is, we do not need to separately program this search and determine the number of boosting iterations for each launch.
Two reasons to use XGBoost are execution speed, model accuracy.
The next step is to choose the best “poor” classifiers and its ensembles for the ensemble of the models. The results are given in Table 2. Table 2 shows the accuracy of the analyzed classifiers for different categories of text.
Therefore, the ensemble of logistic regression, decision tree and knn shown the good accuracy, but not the best. The ensemble of logistic regression and decision tree is much worse. The accuracy of all classifiers is better for Museum-category, because the input data quality here is the best of 4 categories. Input data quality depends on the target audience. Thus, museums have less spam-comments, because amount of museum visitors are significant less than restaurants for example.
Logistic regression, Support vector machine and XGBoost show the best results for all categories. Therefore, they are chosen for ensemble development.
3.2. The Hybrid Model Development
To improve the accuracy of text analysis, it is proposed to create a hybrid model as a combination of machine learning models with a rule-based algorithm.
The rule-based algorithm for determining the tonality, as input, receives the vector of words x based on the comment. The knowledge base of the algorithm is dictionaries of tonal words and weight of words in these dictionaries.
The measure TF-IDF [30] will be used as weights, where the selected word is the word found in the dictionary, and the documents are all comments.
The specified algorithm works as follows (Algorithm 1).
| Algorithm 1. Rules based classifier rule |
Input: x—vectorized text of Google maps review, dic—set of dictionaries (positive and negative dictionaries for each category of text). Output: y—class value ().
|
The new dictionary can be added manually or using TF-IDF to the text of Google maps reviews.
Therefore, the final algorithm will be a combination of the above algorithm and an ensemble of support vector machine, logistic regression, and XGBoost (Algorithm 2).
| Algorithm 2. The ensemble of classifiers |
Input: x—vectorized text of Google maps review, dic—set of dictionaries (positive and negative dictionaries for each category of text). Output: —voted class value ().
|
Hard voting [31] is the simplest case of a majority vote. In this case, the class with the highest number of votes will be selected Nc (yt). Predicting the class mark by a majority vote of each classifier.
Thus, the proposed mathematical model of hybrid sentimental analysis is as follows:
where sigmoid(x), тa defined in formulas (1)–(3), respectively.
4. Results
4.1. Dataset Preparing
Data was gathered from Google Maps comments. The comments were collected for Ukrainian hotels, shops, museums, and restaurants. Totally, 32,007 feedbacks were analyzed. The shortest feedback consists of five words. The biggest feedback has 178 words.
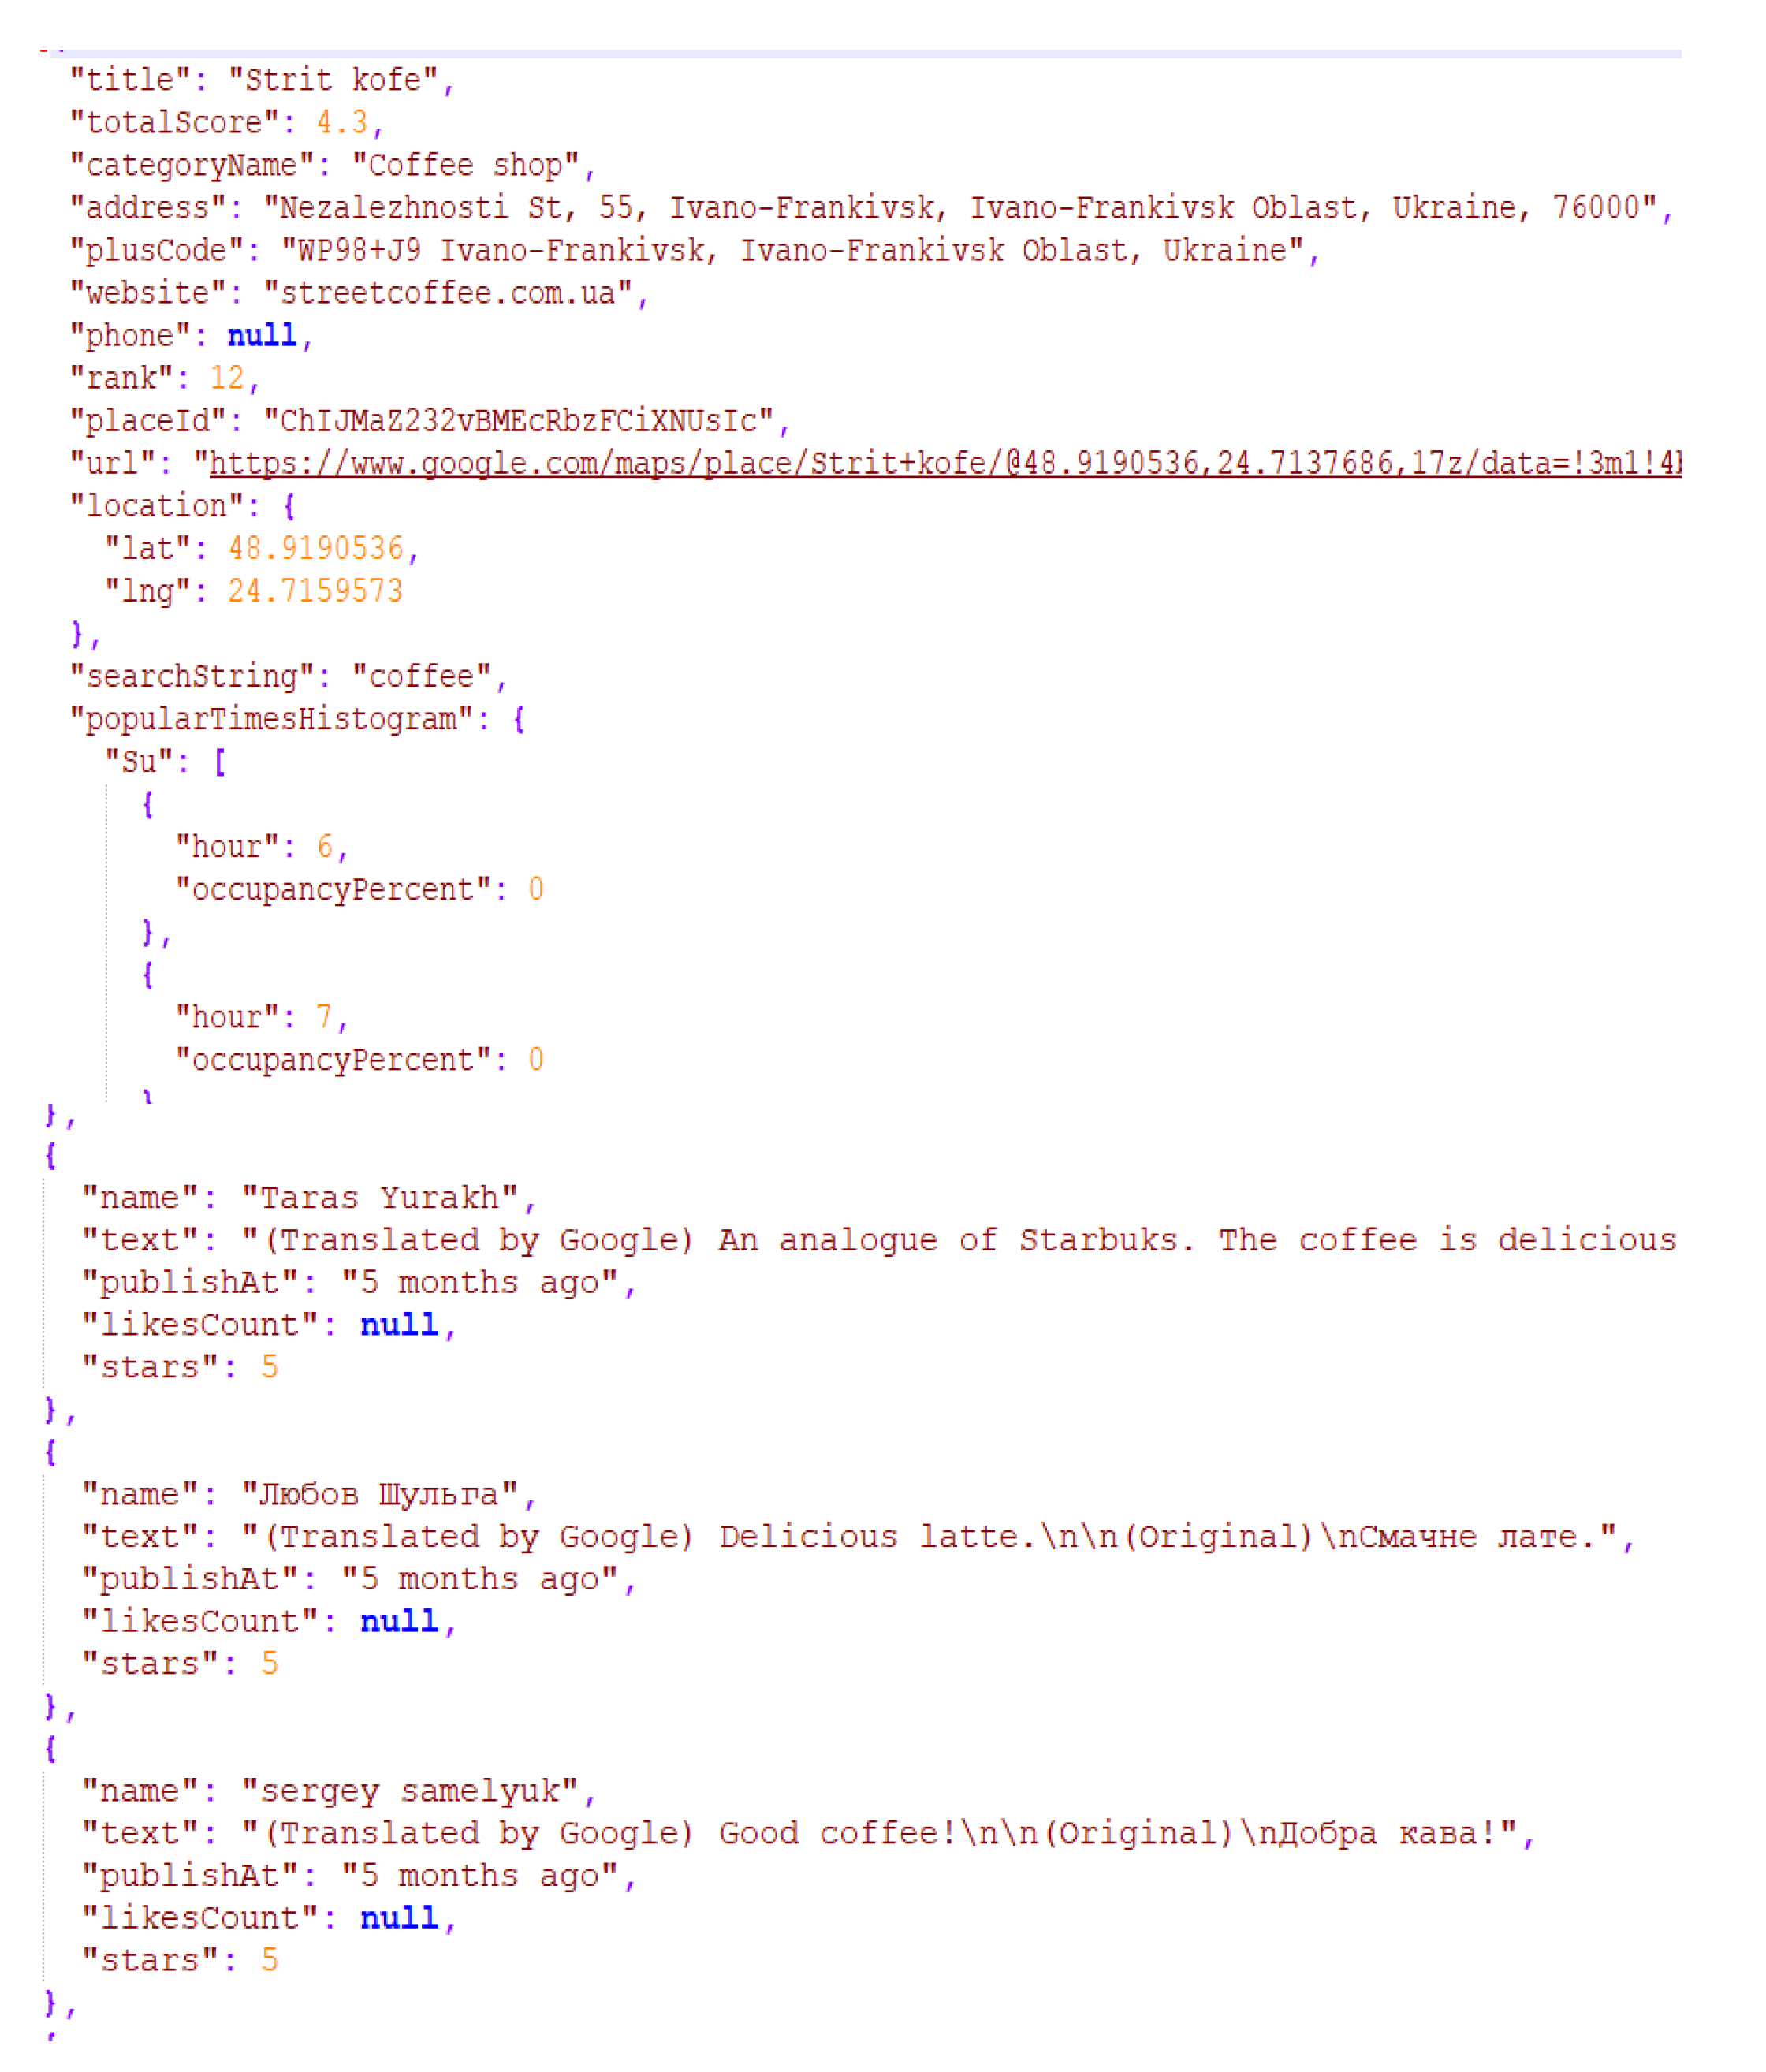
The program is developed in Python 3.6. An example of input data in json format is given in Figure 1.
This is a list of restaurants with geolocations. However, there is a lot of data that will not be used for sentimental analysis, such as the operating time of the institution. Only category “placeId” and the feedback section will be processed.
In order to receive feedback, an empty dataframe has been created, in which the required data will be written. After going through the file, all the data is saved and, if necessary, cleared (for example, the component of the text is separated from the assessment, leaving only a numerical value). The last step in this function is to save the data frame to a text file in csv format.
Then, looping through the folder, all created files are saved in one. The next step is to filter the Ukrainian text. It is possible to automatically translate into Ukrainian language using GoogleTranslate API. Thus, the dataset for training is formed.
The next step is data preprocessing. The developed function takes a text variable, then sequentially performs the operations, namely: removing punctuation, lowering to lowercase, reduction to normal form. The text field is separated into the target variable. It also uses the function of clearing the text. In addition to this function, the text will be processed in a pipeline using a frequency-based CountVectorizer () and an inverse frequency-based TfidfTransformer ().
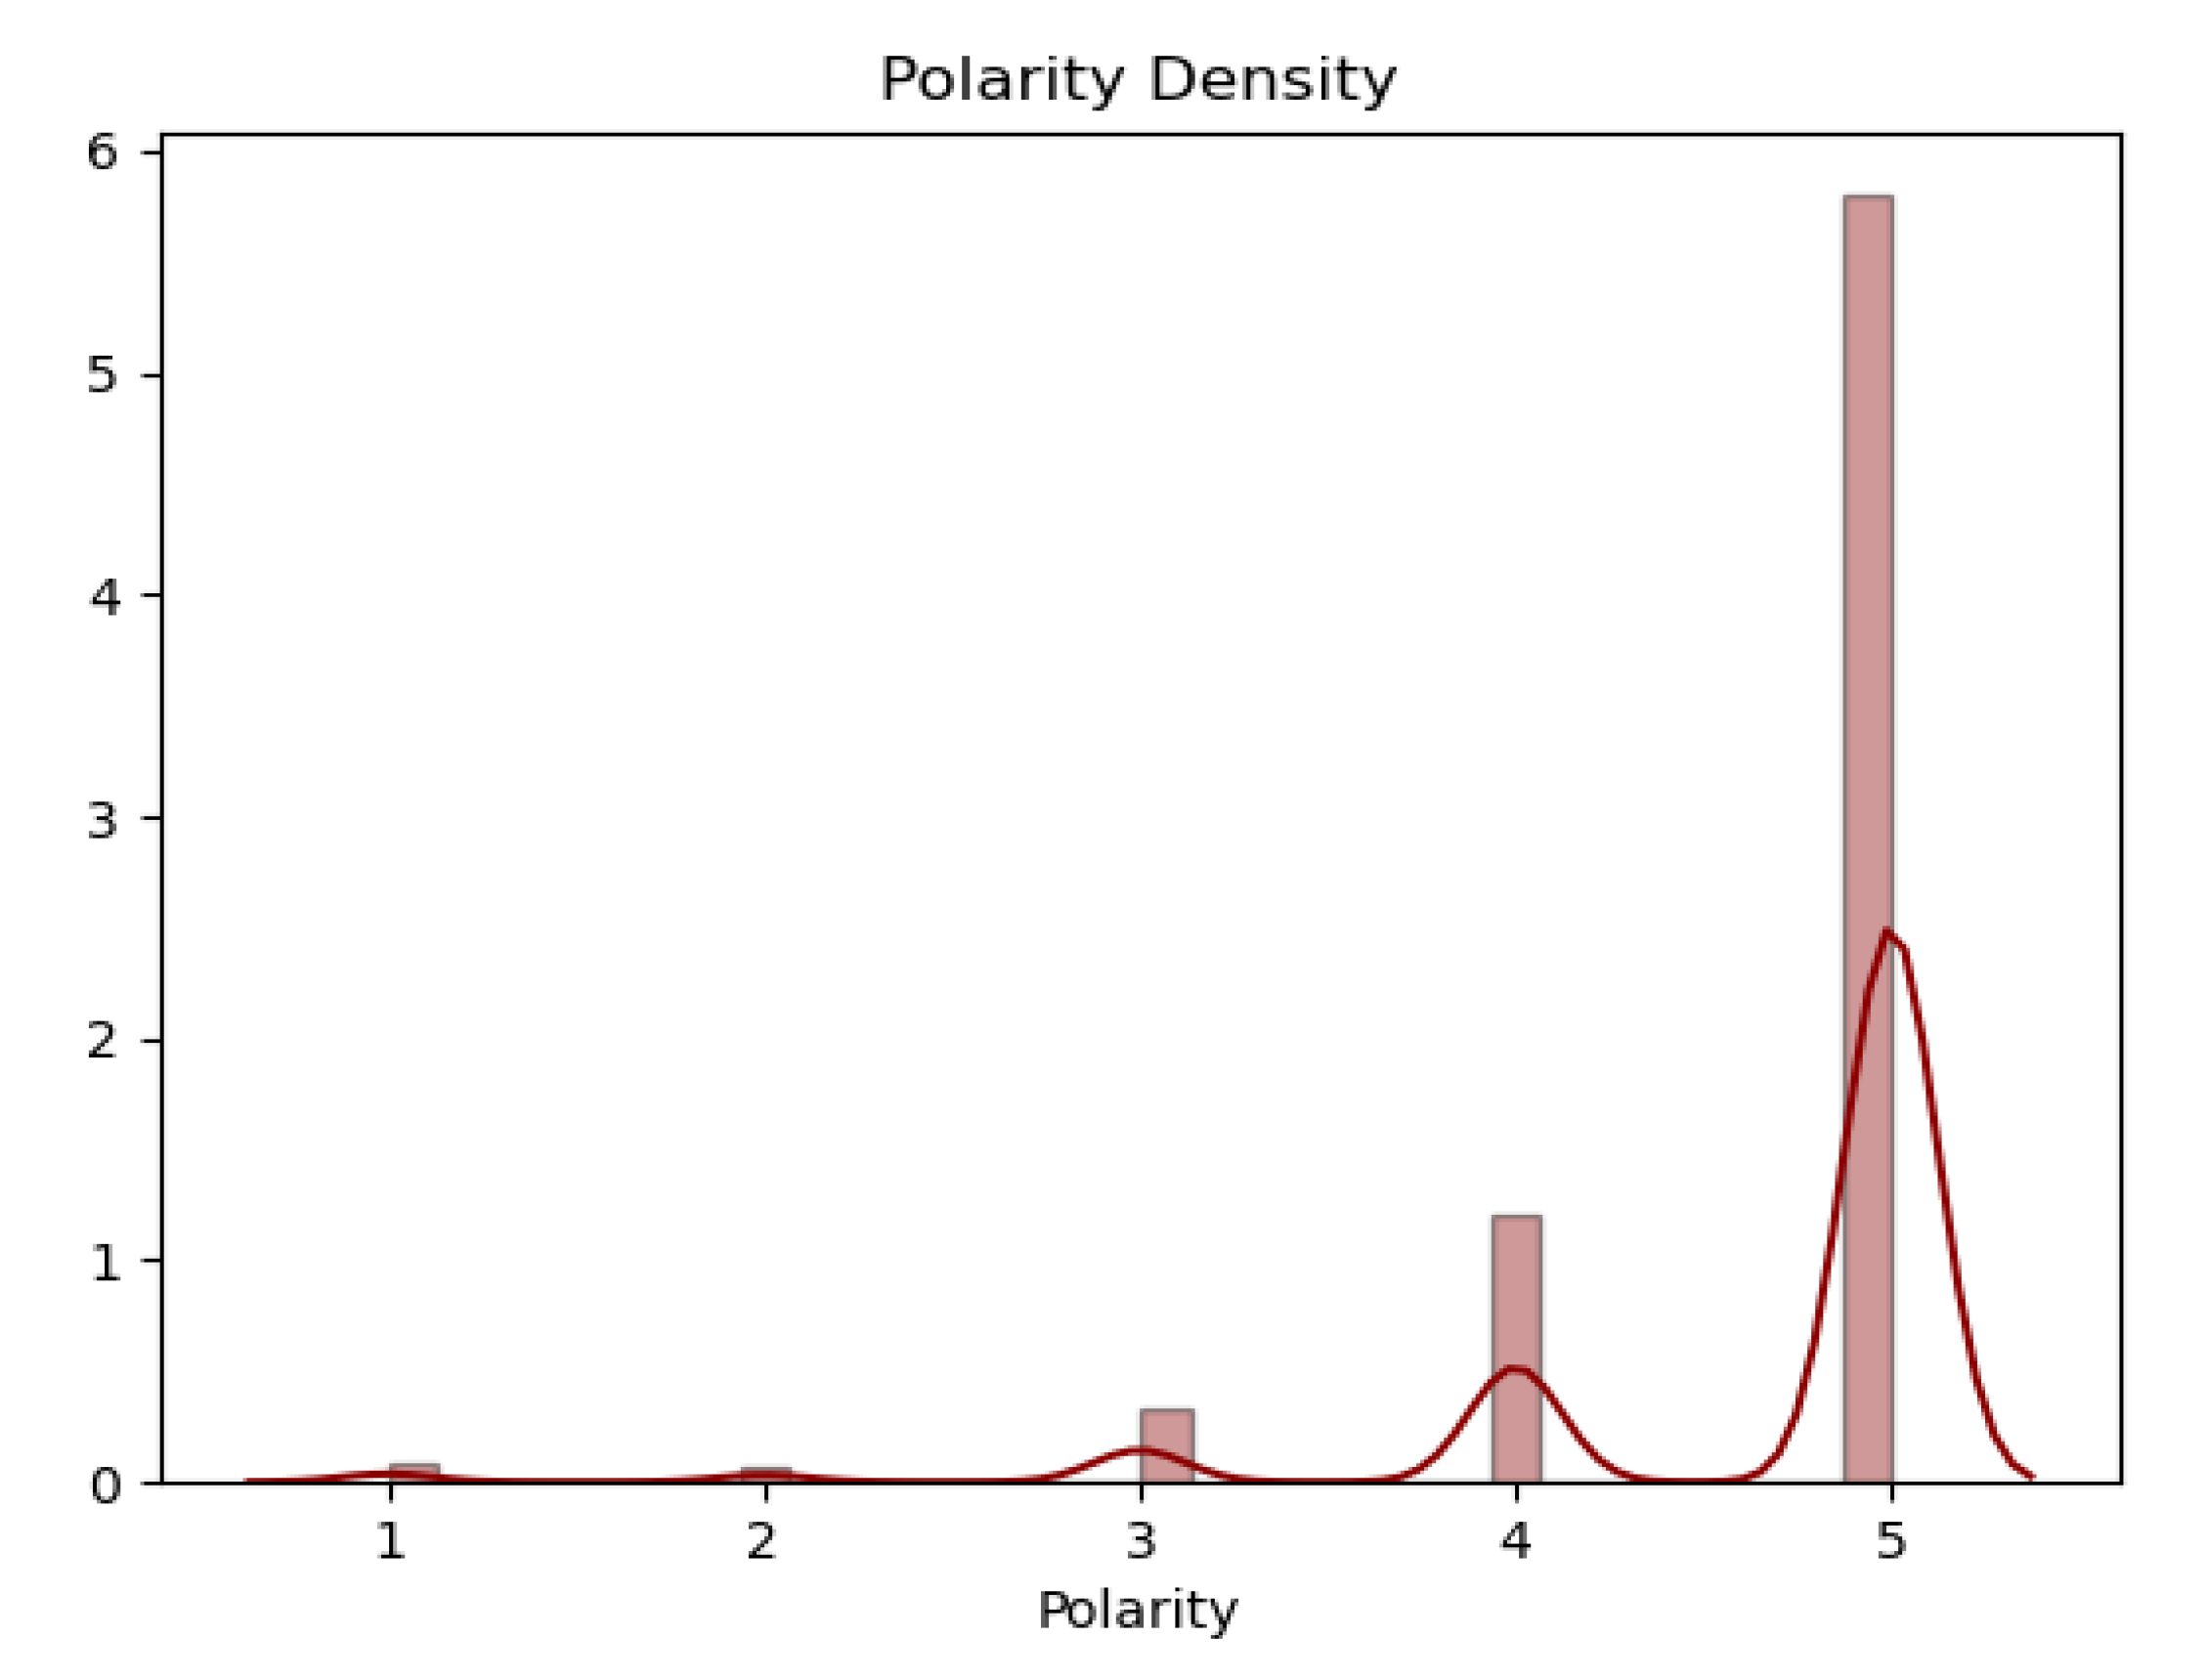
The variation of the mood of the comments is shown in Figure 2. The normalized histogram of the distribution of evaluations is shown, where on the y-axis the normalized value of the number of evaluation meetings, and on the x-axis the evaluation of the mood of comments.
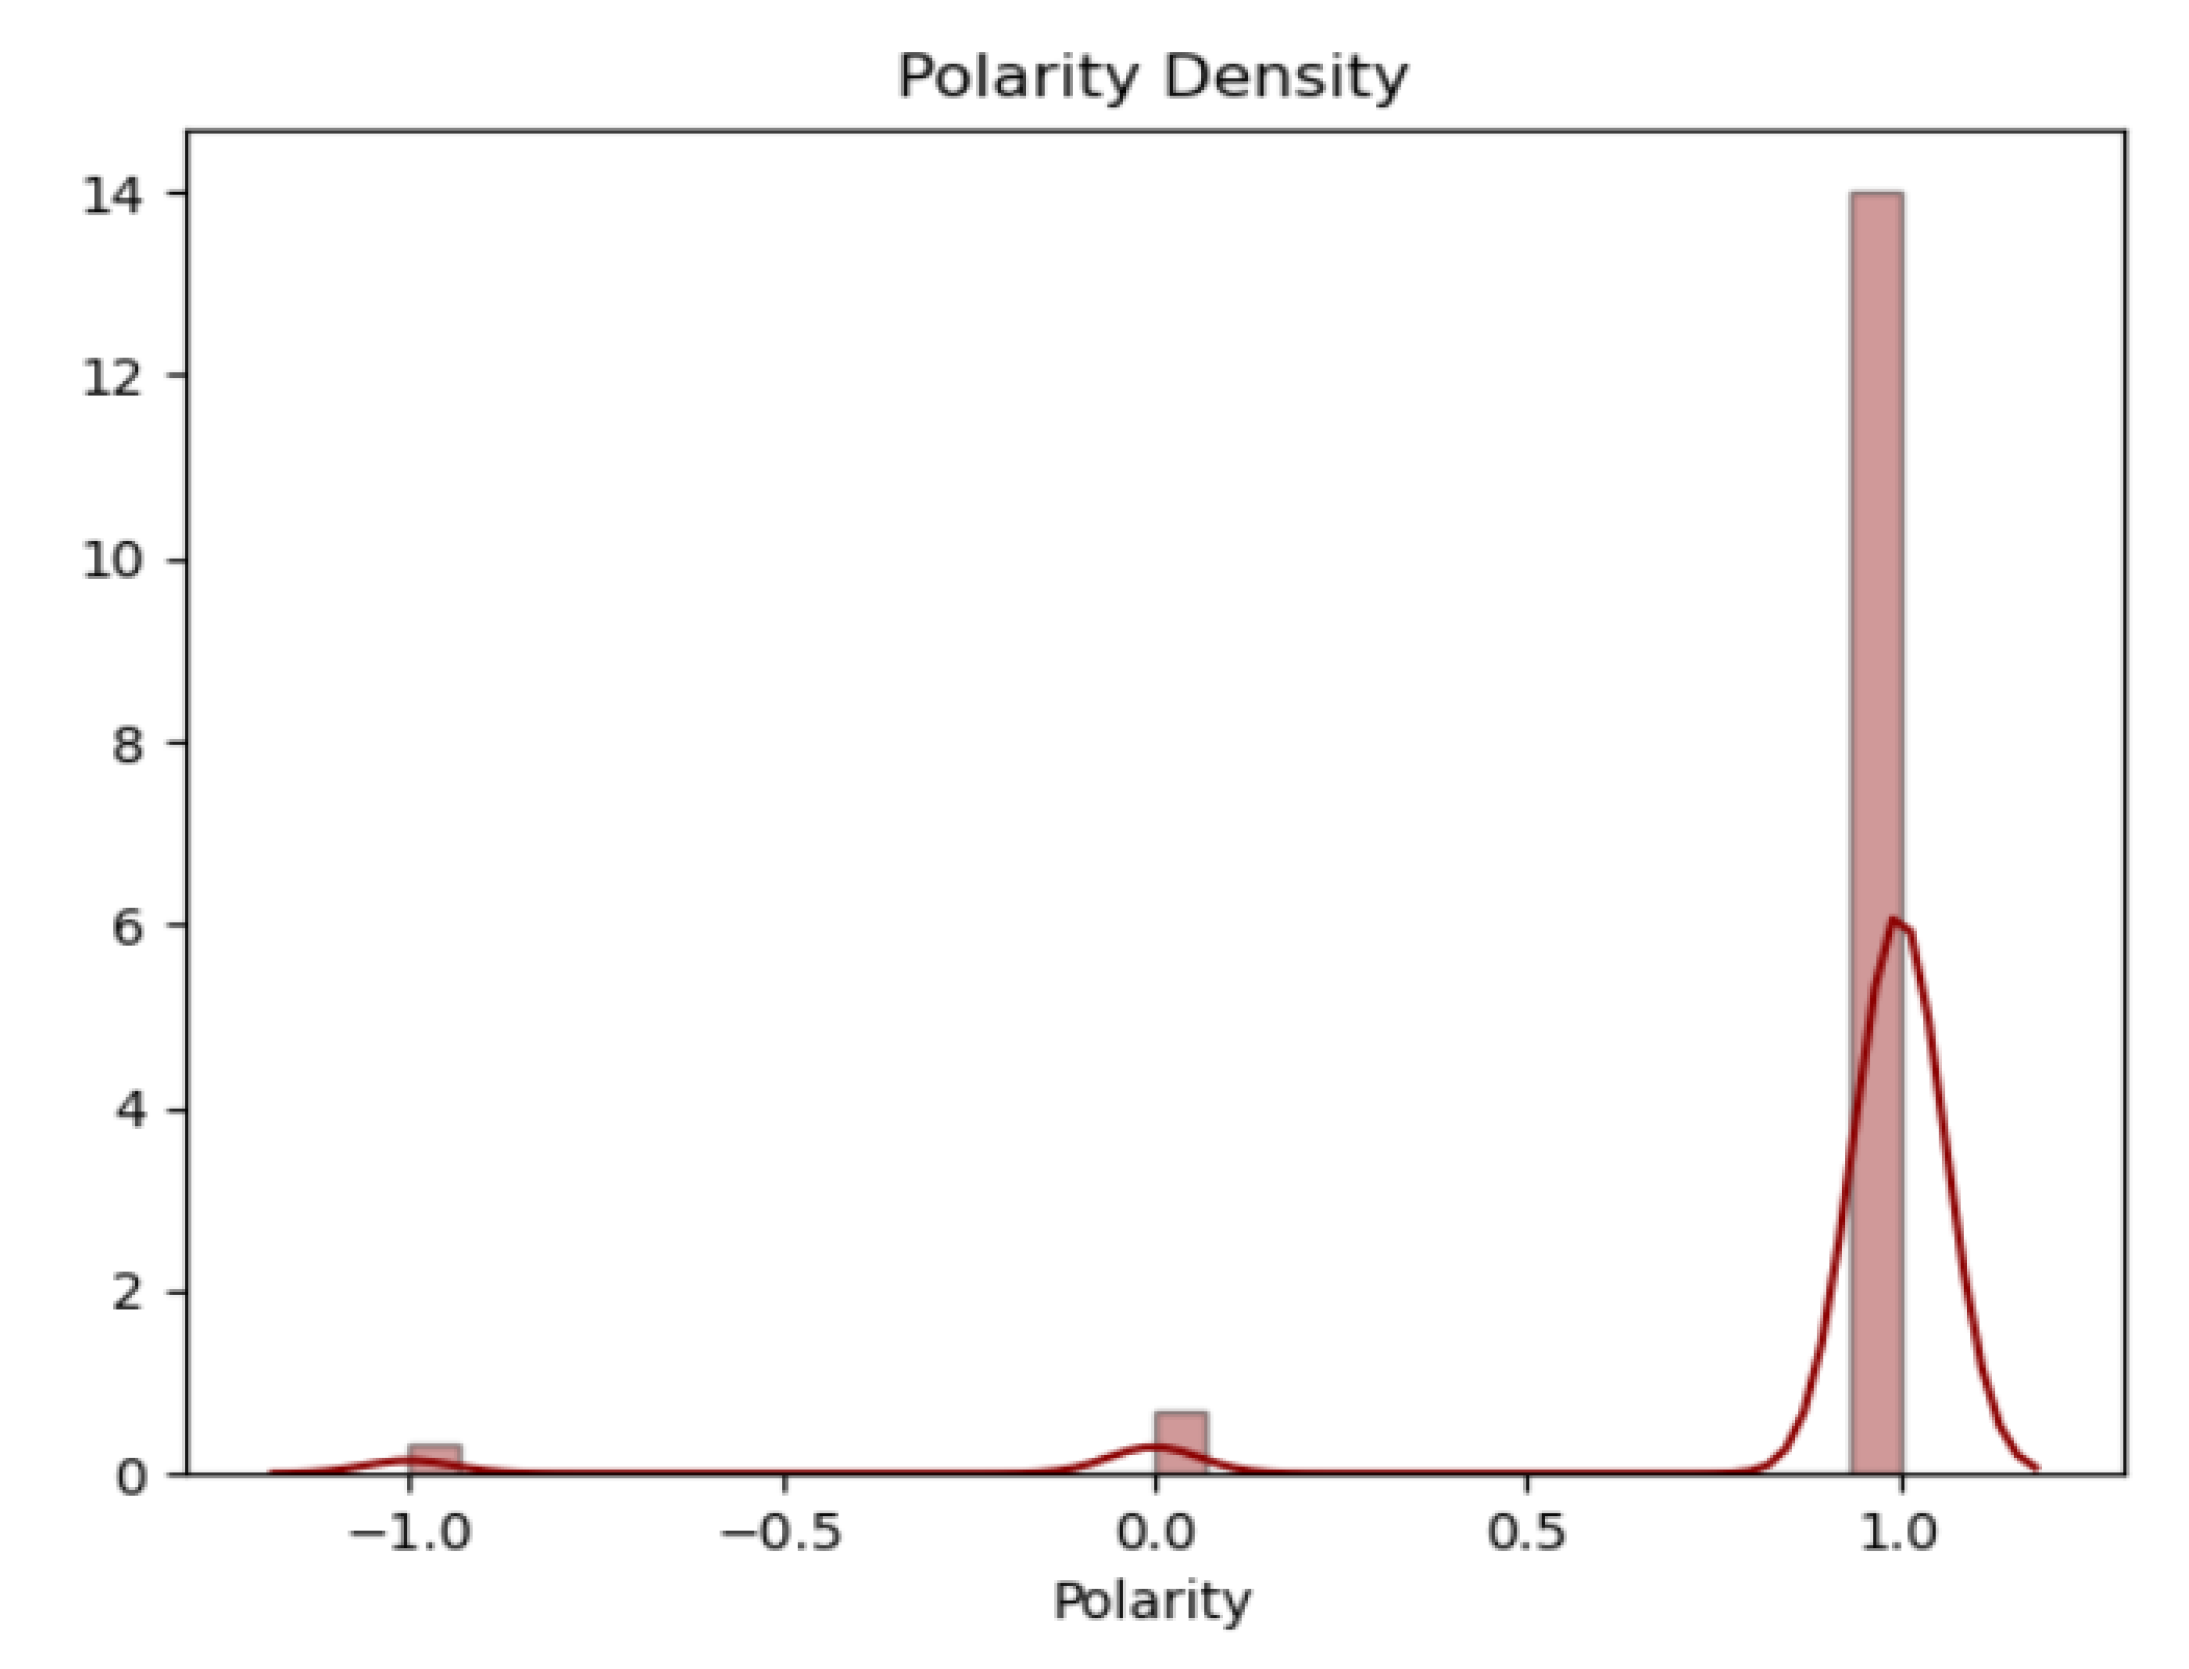
It was reduced to the ternary model (see Figure 3), because text will be analyzed in this form.
4.2. Training of Machine Learning Models
The input data is dataframe in text format. Initially, the target variables were selected: text and assessment, the text was processed and divided into training (80%) and testing (20%) data. The model is trained on the built data on the built pipeline. After that, the model is saved in pkl format, which allows training the model once, instead of every call. Thus, three models were trained: logistic regression, support vector machine, and XGBoost.
Next, the hybrid model is estimated.
The hybrid model consists of two methods: estimation and prediction. A rule-based algorithm is implemented in the estimation method. Further, based on the category, dictionaries of positive and negative words were obtained. As a result, depending on the dictionary and the received text returns 1, −1 or 0, i.e., positive, negative, and neutral, respectively.
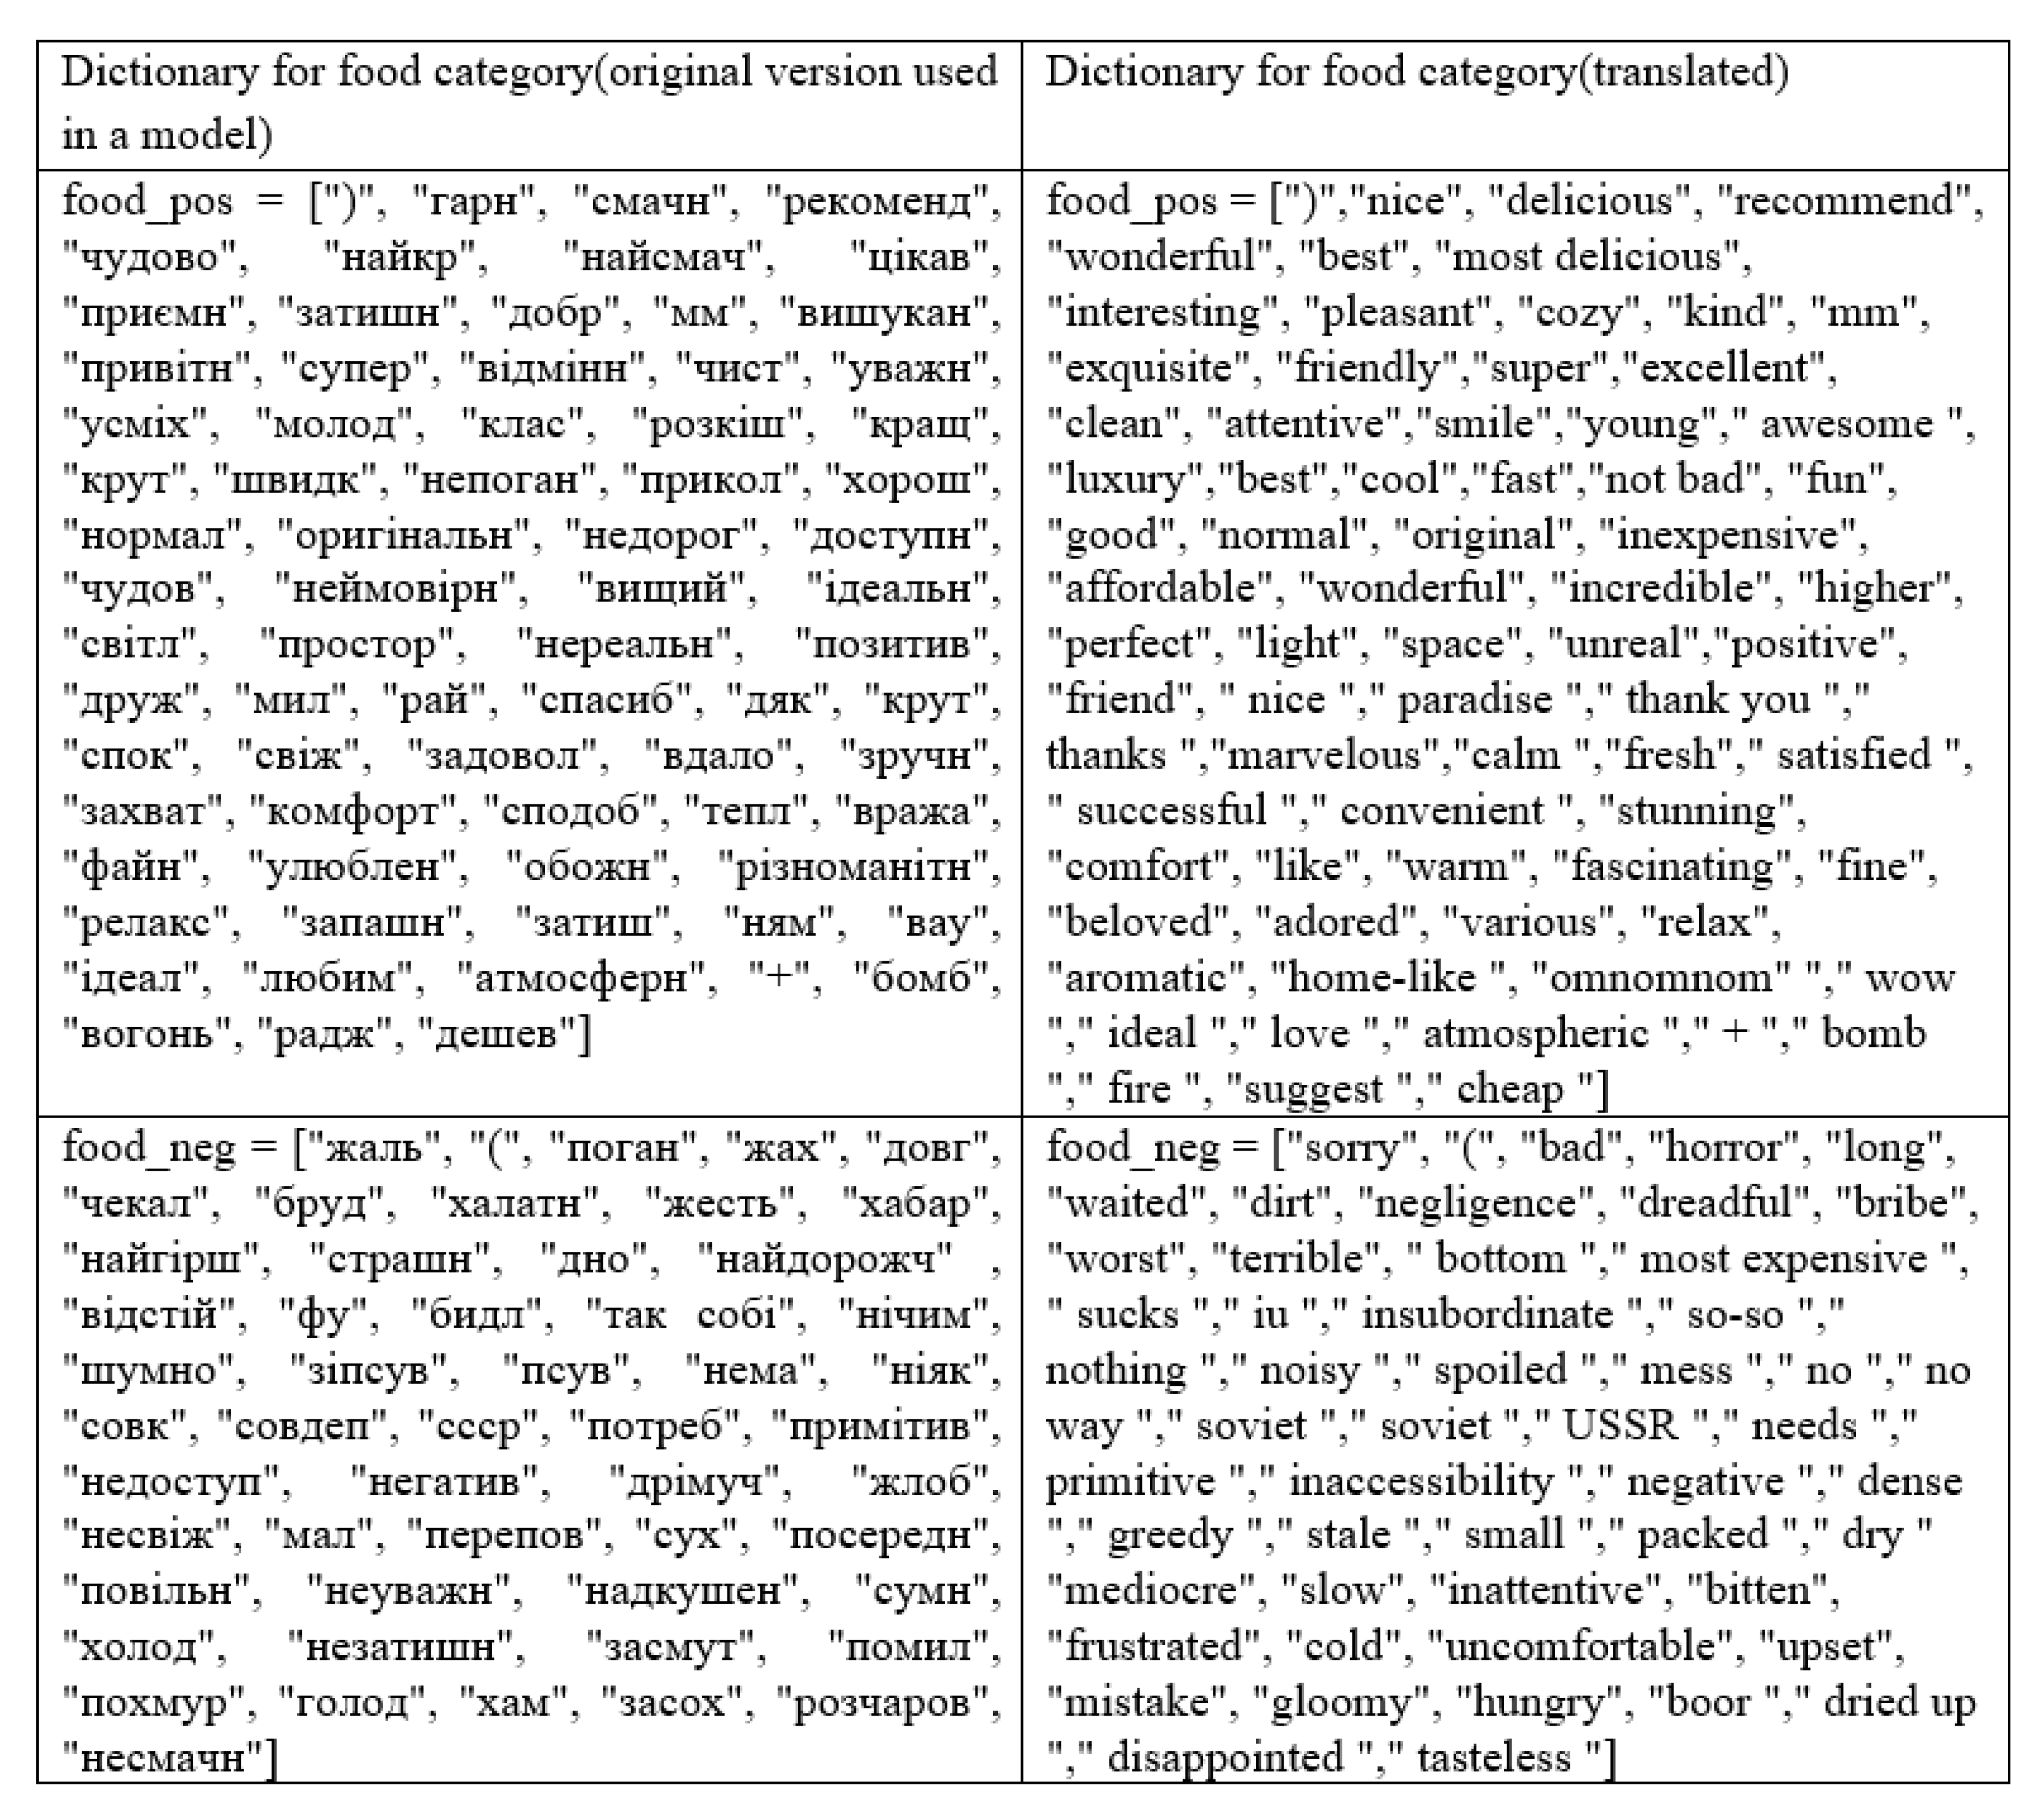
Table 3 shows the approximate content of dictionaries for each category:
The basic dictionary is collected manually based on peculiarities of Ukrainian language. The remaining words are added based on TF-IDF. Dictionary example displayed in Figure 4.
The prediction method involves calling three trained models and a rule-based algorithm. The results are stored in an empty data frame. The mode from the previous values is stored in a variable, which function returns.
As a result, the hybrid model has the performance parameters shown in Table 4. Precision score is used with the parameter “weighted”. It means the metrics calculation for each label, and find their average weighted by support (the number of true instances for each label). This alters ‘macro’ to account for label imbalance; it can result in an F-score that is not between precision and recall.
The proposed hybrid model shows the better results as analyzed classifiers form Table 2. Similarly, the worst accuracy is for the hotel category. It depends on the quality of input data.
However, the user may make a mistake when choosing a category, thus necessitating an additional analysis of the accuracy of the model on the selected not correct category (see Table 5).
Thus, the quality of the proposed hybrid model is not worse than the rest of classifiers from Table 2, despite the selected not correct category. The average accuracy of hybrid model is equal to 0.93525. This is better than the best average accuracy 0.909725 for “poor” classifiers.
Next, the performance parameters for translated reviews into English are given in Table 6.
The given parameters for automatically translated text are not much less then for original test. Google maps presents all reviews in English automatically. This fact can explain the high parameters of translated text.
4.3. The Decision Support of Services Providers and Data Visualization
The developed model can be used for services provider’s decision support. The main tasks of the analysis are the following: to find positive and negative aspect of business providers based on reviews analysis; to find the frequency of negative comments; to build the recommendation for the managers [32,33,34].
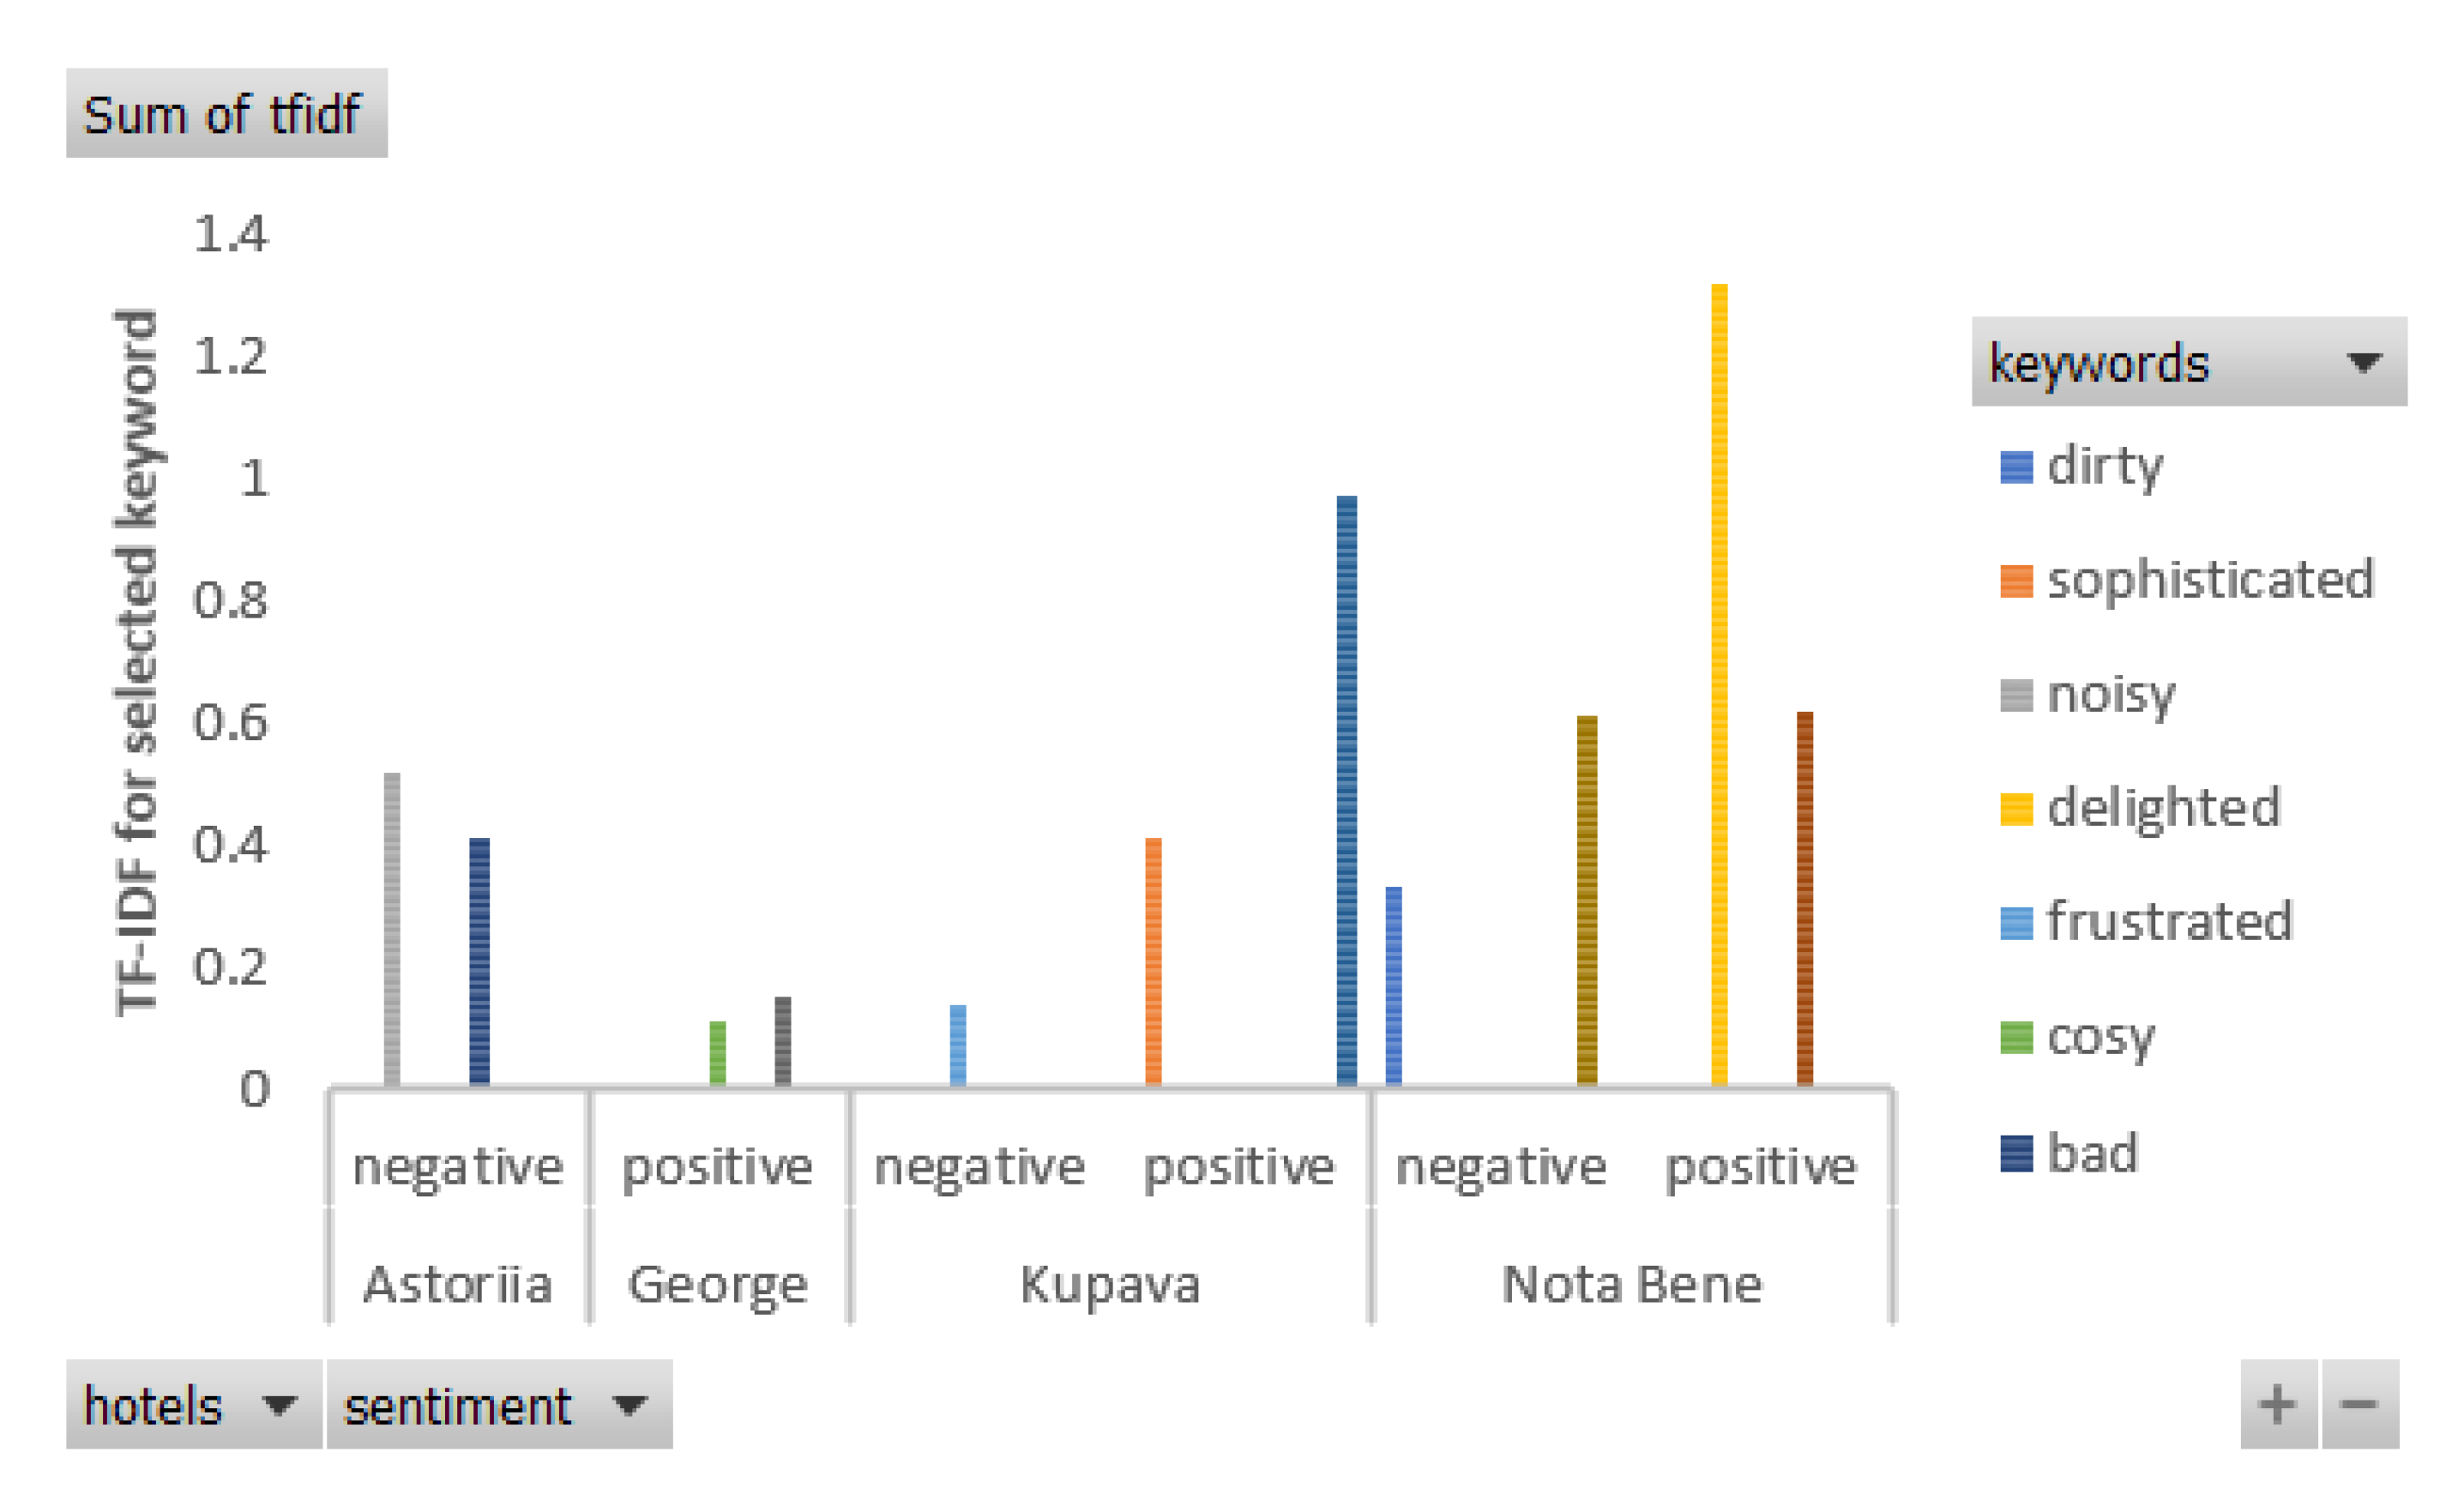
First, the most common positive and negative keywords can be presented for each provider (Figure 5). Figure 5 below presents the results of analysis for four Ukrainian hotels.
Next, the pivot table as part of On-line analytical processing (OLAP) is presented (Table 7). The sum of weighted keywords for each services provider is calculated. It is useful not only for data analysis, but also for data visualization.
The average weight of positive and negative feedbacks is presented in Table 8. The result of clients’ feedback shows the problems with sound insulation in hotel Astoriia.
5. Discussions and Conclusions
Thus, it is shown that the study of the sentimental analysis of the text is now in high demand. The subject of the study is the comments of Google Maps users. At the output, the user receives the following labeling options: positive, neutral, and negative.
After conducting a competitive analysis, it was found that products can perform the functionality of the system. However, the goal is to expand systems with the Ukrainian language functionality, whereas out of ten programs, only two are compatible with the Ukrainian language.
The peculiarities of the Ukrainian language (there are no restrictions on the order of words in the sentence, the luck of libraries and tools for text analysis in Ukrainian, the corpora of Ukrainian text under development [35], etc.) are cause for the specific preprocessing stage and dictionaries developed during the research. The developed system can be used for other feedback given in other languages, but reduction to normal form stage and sensitive words dictionaries should be changed.
In order to reduce the error of the created model, the training data for the project are divided into four categories: food, shops, museums, and hotels. Comments related to cafes and restaurants are gathered in food types, and comments related to shopping malls users in the shops’ type respectively. This improves the result due to the different sets of keywords for each category.
The following tasks were set: analysis and developing algorithms for analysis of the Ukrainian-language content using hybrid models; creating models for all categories and providing translation functionality into Ukrainian; graphical display of statistics of markings to the user.
As an input, the system receives a text that must be in Ukrainian. However, if it contains not only Ukrainian, the text will be automatically translated. The functionality of the system is defined:
- text processing,
- model transmitting,
- result displaying in visual and file form.
During the model creation, the algorithms were analyzed and checked for accuracy on the basis of training data. The three best ones were chosen: the support vector machine method, logistic regression and XGBoost. In addition to machine learning models, the custom rule-based algorithm has been created. To do this, for each category dictionaries of positive and negative words must be created. The volume of each is about 80 words. As a result, a model was created that combines the method of support vector machine, logistic regression and XGBoost and a rule-based algorithm.
The developed rule-based model allows to choose the class based lexical approach or on collected dictionaries. In combination with machine learning models this classifier presents stacking ensemble. The average accuracy of hybrid model is equal to 93.5%. This is better than the best average accuracy 90.97% for “poor” classifiers. The hybrid algorithm was checked for accuracy in both cases: correct and mistaken choice of category. The accuracy of the model was in the range of 89–98%.
As a result of the research, a system that is ready for use was created. The user is provided with high model accuracy. Automatic text translation into the Ukrainian language helps to omit the language limitations of the input data. At the output, in addition to the marked file, the visual display of results shows the general users’ sentiment.
The mining procedure of the positive and negative sides of services providers based on users’ feedback is developed. This allows electronics business to make improvements based on frequent positive and negative words.
Author Contributions
Conceptualization, K.S.; methodology, K.S.; software, K.S.; validation, N.S; formal analysis, N.S. and P.V.; investigation, N.S.; resources, P.V.; data curation, K.S.; writing—original draft preparation, K.S. and N.S.; writing—review and editing, P.V.; visualization, K.S.; supervision, N.S.; project administration, P.V.; funding acquisition, P.V. All authors have read and agreed to the published version of the manuscript.
Funding
This research was partially supported by the Ukrainian Ministry of Science and Innovation, through the Information technology of psychophysical portrait formation in stressful situations, project No. 0120U102194.
Conflicts of Interest
The authors declare no conflict of interest. The funders had no role in the design of the study; in the collection, analyses, or interpretation of data; in the writing of the manuscript, or in the decision to publish the results.
References
- Cambria, E.; Poria, S.; Hussain, A.; Liu, B. Computational intelligence for affective computing and sentiment analysis [guest editorial]. IEEE Comput. Intell. Mag. 2019, 14, 16–17. [Google Scholar] [CrossRef]
- Khomytska, I.; Teslyuk, V.; Kryvinska, N.; Bazylevych, I. Software-based approach towards automated authorship acknowledgement—Chi-square test on one consonant group. Electronics 2020, 9, 1138. [Google Scholar] [CrossRef]
- Jamal, N.; Xianqiao, C.; Aldabbas, H. Deep learning-based sentimental analysis for large-scale imbalanced twitter data. Future Internet 2019, 11, 190. [Google Scholar] [CrossRef] [Green Version]
- Alonso-Almeida, M.D.M.; Borrajo-Millán, F.; Yi, L. Are social media data pushing overtourism? The case of Barcelona and Chinese tourists. Sustainability 2019, 11, 3356. [Google Scholar] [CrossRef] [Green Version]
- Monkeylearn. Available online: https://monkeylearn.com/ (accessed on 20 July 2020).
- IBM Watson. Available online: https://www.ibm.com/cloud/machine-learning (accessed on 25 July 2020).
- Lexalytic. Available online: https://www.lexalytics.com/ (accessed on 19 July 2020).
- Meaningcloud. Available online: https://www.meaningcloud.com/ (accessed on 23 July 2020).
- Rosette. Available online: https://www.rosette.com/ (accessed on 30 July 2020).
- Repustate. Available online: https://www.repustate.com/sentiment-analysis/ (accessed on 1 July 2020).
- Clarabridge. Available online: https://www.clarabridge.com/ (accessed on 2 August 2020).
- Aylien. Available online: https://aylien.com/text-api/sentiment-analysis/ (accessed on 17 July 2020).
- SYSTRAN.io. Available online: https://platform.systran.net/index (accessed on 19 July 2020).
- Twinword Text Analysis Bundle. Available online: https://www.twinword.com/api/ (accessed on 22 July 2020).
- Prabhakar, E. Sentiment analysis of US airline twitter data using new adaboost approach. Int. J. Eng. Res. Technol. 2019, 7, 1–6. [Google Scholar]
- Li, L.; Goh, T.-T.; Jin, D. How textual quality of online reviews affect classification performance: A case of deep learning sentiment analysis. Neural Comput. Appl. 2020, 32, 4387–4415. [Google Scholar] [CrossRef]
- Park, E.; Kang, J.; Choi, D.; Han, J. Understanding customers’ hotel revisiting behaviour: A sentiment analysis of online feedback reviews. Curr. Issues Tour. 2020, 23, 605–611. [Google Scholar] [CrossRef]
- Zhang, C.; Tian, Y.X.; Fan, Z.P.; Liu, Y.; Fan, L.W. Product sales forecasting using macroeconomic indicators and online reviews: A method combining prospect theory and sentiment analysis. Soft Comput. 2020, 24, 6213–6226. [Google Scholar] [CrossRef]
- Liang, X.; Liu, P.; Wang, Z. Hotel selection utilizing online reviews: A novel decision support model based on sentiment analysis and DL-VIKOR method. Technol. Econ. Dev. Econ. 2019, 25, 1139–1161. [Google Scholar] [CrossRef]
- Cambria, E.; Li, Y.; Xing, F.Z.; Poria, S.; Kwok, K. SenticNet 6: Ensemble application of symbolic and subsymbolic AI for sentiment analysis. In Proceedings of the 29th ACM International Conference on Information & Knowledge Management, Galway, Ireland, 9–23 October 2020; pp. 105–114. [Google Scholar]
- Abbas, A.K.; Salih, A.K.; Hussein, H.A.; Hussein, Q.M.; Abdulwahhab, S.A. Twitter sentiment analysis using an ensemble majority vote classifier. J. Southwest Jiaotong Univ. 2020, 55. [Google Scholar] [CrossRef]
- Sangam, S.; Shinde, S. Sentiment classification of social media reviews using an ensemble classifier. Indones. J. Electr. Eng. Comput. Sci. 2019, 16, 355–363. [Google Scholar] [CrossRef]
- Bird, J.J.; Ekart, A.; Buckingham, C.D.; Faria, D.R. High resolution sentiment analysis by ensemble classification. In Intelligent Computing, Proceedings of the Computing Conference, London, UK, 16–17 July 2019; Springer: Cham, Switzerland, 2019; pp. 593–606. [Google Scholar]
- Suthaharan, S. Support vector machine. In Machine Learning Models and Algorithms for Big Data Classification; Springer: Boston, MA, USA, 2016; pp. 207–235. [Google Scholar]
- Shaban, W.M.; Rabie, A.H.; Saleh, A.I.; Abo-Elsoud, M.A. A new COVID-19 Patients Detection Strategy (CPDS) based on hybrid feature selection and enhanced KNN classifier. Knowl. Based Syst. 2020, 205, 106270. [Google Scholar] [CrossRef] [PubMed]
- Jiang, W.; Josse, J.; Lavielle, M. Logistic regression with missing covariates—Parameter estimation, model selection and prediction within a joint-modeling framework. Comput. Stat. Data Anal. 2020, 145, 106907. [Google Scholar] [CrossRef] [Green Version]
- Chen, T.; Guestrin, C. Xgboost: A scalable tree boosting system. In Proceedings of the 22nd ACM SIGKDD International Conference on Knowledge Discovery and Data Mining, San Francisco, CA, USA, 13–17 August 2016; pp. 785–794. [Google Scholar]
- Allahyari, M.; Pouriyeh, S.; Assefi, M.; Safaei, S.; Trippe, E.D.; Gutierrez, J.B.; Kochut, K. A brief survey of text mining: Classification, clustering and extraction techniques. arXiv 2017, arXiv:1707.02919. [Google Scholar]
- Le, N.Q.K.; Do, D.T.; Chiu, F.-Y.; Yapp, E.K.Y.; Yeh, H.-Y.; Chen, C.-Y. XGBoost improves classification of MGMT promoter methylation status in IDH1 wildtype glioblastoma. J. Pers. Med. 2020, 10, 128. [Google Scholar] [CrossRef] [PubMed]
- Polyakov, E.; Polyakov, S.; Abramov, P. Research of heuristic approaches for determining the tonality of text messages in natural language processing problems. In Proceedings of the 2019 XVI International Symposium “Problems of Redundancy in Information and Control Systems” (REDUNDANCY), Moscow, Russia, 21–25 October 2019; pp. 159–164. [Google Scholar]
- Onan, A.; Korukoğlu, S.; Bulut, H. A multiobjective weighted voting ensemble classifier based on differential evolution algorithm for text sentiment classification. Expert Syst. Appl. 2016, 62, 1–16. [Google Scholar] [CrossRef]
- Gregus, M.; Kryvinska, N. Service Orientation of Enterprises—Aspects, Dimensions, Technologies; Comenius University in Bratislava: Bratislava, Slovakia, 2015; 110p, ISBN 9788022339780. [Google Scholar]
- Kryvinska, N.; Gregus, M. SOA and Its Business Value in Requirements, Features, Practices and Methodologies; Comenius University in Bratislava: Bratislava, Slovakia, 2014; ISBN 9788022337649. [Google Scholar]
- Molnár, E.; Molnár, R.; Kryvinska, N.; Greguš, M. Web Intelligence in practice. J. Serv. Sci. Res. 2014, 6, 149–172. [Google Scholar] [CrossRef]
- Tools to Work with Ukrainian Text Corpora. Available online: https://www.sketchengine.eu/corpora-and-languages/ukrainian-text-corpora/ (accessed on 1 November 2020).
Figure 1.
The example of dataset.

Figure 2.
Initial data distribution.

Figure 3.
Consolidated data distribution.

Figure 4.
Dictionary example.

Figure 5.
The overall services providers’ evaluation graph.


Table 1.
Analogs comparison results.
| Name | Analyze “Live” Text | Support Ukrainian | Free Plan | Visualization |
|---|---|---|---|---|
| MonkeyLearn | No | No | Yes | No |
| IBM Watson | Yes | No | Yes | No |
| Lexalytics | Yes | No | No | Yes |
| MeaningCloud | Yes | No | Yes | No |
| Rosette | Yes | Yes | No | No |
| Repustate | Yes | No | Yes | No |
| Clarabridge | No | No | No | No |
| Aylien | Yes | No | No | No |
| SYSTRAN.io | Yes | Yes | Unknown | No |
| Twinword Text Analysis Bundle | Yes | No | Yes | Yes |
Table 2.
Models’ accuracy.
| Model | Food | Shops | Hotels | Museums |
|---|---|---|---|---|
| Logistic regression | 0.9106 | 0.93 | 0.873 | 0.9384 |
| Support vector machine | 0.9168 | 0.926 | 0.884 | 0.9459 |
| Bayesian network | 0.9106 | 0.92 | 0.874 | 0.9343 |
| XGBoost | 0.8982 | 0.93 | 0.860 | 0.9424 |
| RandomForest | 0.8976 | 0.924 | 0.859 | 0.9404 |
| Ensemble of logistic regression and decision tree | 0.8804 | 0.899 | 0.828 | 0.9106 |
| Decision tree | 0.8714 | 0.899 | 0.823 | 0.9116 |
| AdaBoost | 0.9003 | 0.928 | 0.850 | 0.9343 |
| Ensemble of logistic regression, decision tree and knn | 0.9047 | 0.929 | 0.871 | 0.9353 |
Table 3.
Dimension of data dictionaries.
| Category | Food | Museums | Hotels | Shops |
|---|---|---|---|---|
| Positive | 80 | 90 | 110 | 120 |
| Negative | 50 | 50 | 120 | 25 |
Table 4.
Hybrid model performance parameters.
| Category/Parameter | Food | Shops | Museums | Hotels |
|---|---|---|---|---|
| Accuracy | 0.9213 | 0.9534 | 0.9769 | 0.8894 |
| Precision | 0.9006 | 0.9211 | 0.9366 | 0.8815 |
| Recall | 0.9213 | 0.9534 | 0.9677 | 0.8894 |
| F-score | 0.9103 | 0.9050 | 0.9103 | 0.8545 |
Table 5.
Accuracy of the hybrid model on the selected not correct category.
| Data\Category | Food | Shops | Museums | Shops |
|---|---|---|---|---|
| Food | 0.9113 | 0.8849 | 0.8861 | 0.8921 |
| Shops | 0.9262 | 0.933 | 0.9274 | 0.9264 |
| Museums | 0.9298 | 0.9316 | 0.9369 | 0.9298 |
| Hotels | 0.8485 | 0.8395 | 0.8394 | 0.8824 |
Table 6.
Hybrid model performance parameters for Google-translated reviews.
| Category/Parameter | Food | Shops | Museums | Hotels |
|---|---|---|---|---|
| Accuracy | 0.9042 | 0.9246 | 0.9631 | 0.8782 |
| Precision | 0.8686 | 0.9042 | 0.9103 | 0.8653 |
| Recall | 0.8925 | 0.9463 | 0.9435 | 0.8803 |
| F-score | 0.9073 | 0.8987 | 0.9062 | 0.8423 |
Table 7.
The pivot table for services providers analysis.
| Sum of Tfidf | Column Labels | - | - | - | - | - | - | - | - | - | - | - |
|---|---|---|---|---|---|---|---|---|---|---|---|---|
| Row Labels | Dirty | Sophisticated | Noisy | Delighted | Frustrated | Cosy | Bad | Clean | Best | Worst | Original | Grand Total |
| Astoriia | 0.52 | 0.41 | 0.93 | |||||||||
| negative | 0.52 | 0.41 | 0.93 | |||||||||
| George | 0.11 | 0.15 | 0.26 | |||||||||
| positive | 0.11 | 0.15 | 0.26 | |||||||||
| Kupava | 0.41 | 0.14 | 0.98 | 1.53 | ||||||||
| negative | 0.14 | 0.14 | ||||||||||
| positive | 0.41 | 0.98 | 1.39 | |||||||||
| Nota Bene | 0.33 | 1.32 | 0.62 | 0.61 | 2.88 | |||||||
| negative | 0.33 | 0.61 | 0.94 | |||||||||
| positive | 1.32 | 0.62 | 1.94 | |||||||||
| Grand Total | 0.33 | 0.41 | 0.52 | 1.32 | 0.14 | 0.11 | 0.41 | 0.62 | 0.15 | 0.61 | 0.98 | 5.60 |
Table 8.
The average weight of positive and negative feedbacks.
| Row Labels | Average of Tfidf |
|---|---|
| Astoriia | 0.464770075 |
| negative | 0.464770075 |
| George | 0.13015847 |
| positive | 0.13015847 |
| Kupava | 0.509451826 |
| negative | 0.138377556 |
| positive | 0.694988962 |
| Nota Bene | 0.721217405 |
| negative | 0.47144863 |
| positive | 0.97098618 |
| Grand Total | 0.509371108 |
Publisher’s Note: MDPI stays neutral with regard to jurisdictional claims in published maps and institutional affiliations. |
© 2020 by the authors. Licensee MDPI, Basel, Switzerland. This article is an open access article distributed under the terms and conditions of the Creative Commons Attribution (CC BY) license (http://creativecommons.org/licenses/by/4.0/).
Share and Cite
MDPI and ACS Style
Shakhovska, K.; Shakhovska, N.; Veselý, P. The Sentiment Analysis Model of Services Providers’ Feedback. Electronics 2020, 9, 1922. https://doi.org/10.3390/electronics9111922
AMA Style
Shakhovska K, Shakhovska N, Veselý P. The Sentiment Analysis Model of Services Providers’ Feedback. Electronics. 2020; 9(11):1922. https://doi.org/10.3390/electronics9111922
Chicago/Turabian StyleShakhovska, Khrystyna, Nataliya Shakhovska, and Peter Veselý. 2020. "The Sentiment Analysis Model of Services Providers’ Feedback" Electronics 9, no. 11: 1922. https://doi.org/10.3390/electronics9111922
Note that from the first issue of 2016, this journal uses article numbers instead of page numbers. See further details here.