Safety Risk Assessment of a Pb-Zn Mine Based on Fuzzy-Grey Correlation Analysis


Abstract
:1. Introduction
2. Methods
2.1. Preliminaries
- , setto a positive fuzzy number, indicated by;
- , setto a negative fuzzy number, indicated by;
- , setto a zero fuzzy number, indicated byor;
- and, setto a zero fuzzy number, indicated by.
2.2. Fuzzy-Grey Relation Ranking Method Based on the Structured Element Method
2.3. Fuzzy-Grey Correlation Ranking Method Based on the Structured Element Method
3. Comprehensive Risk Evaluation Model Based on Fuzzy-Grey Correlation
Index and Weight Data for Application Analysis of the Comprehensive Risk Evaluation Model
4. Results of Fuzzy-Grey Correlation Risk Rating Assessment
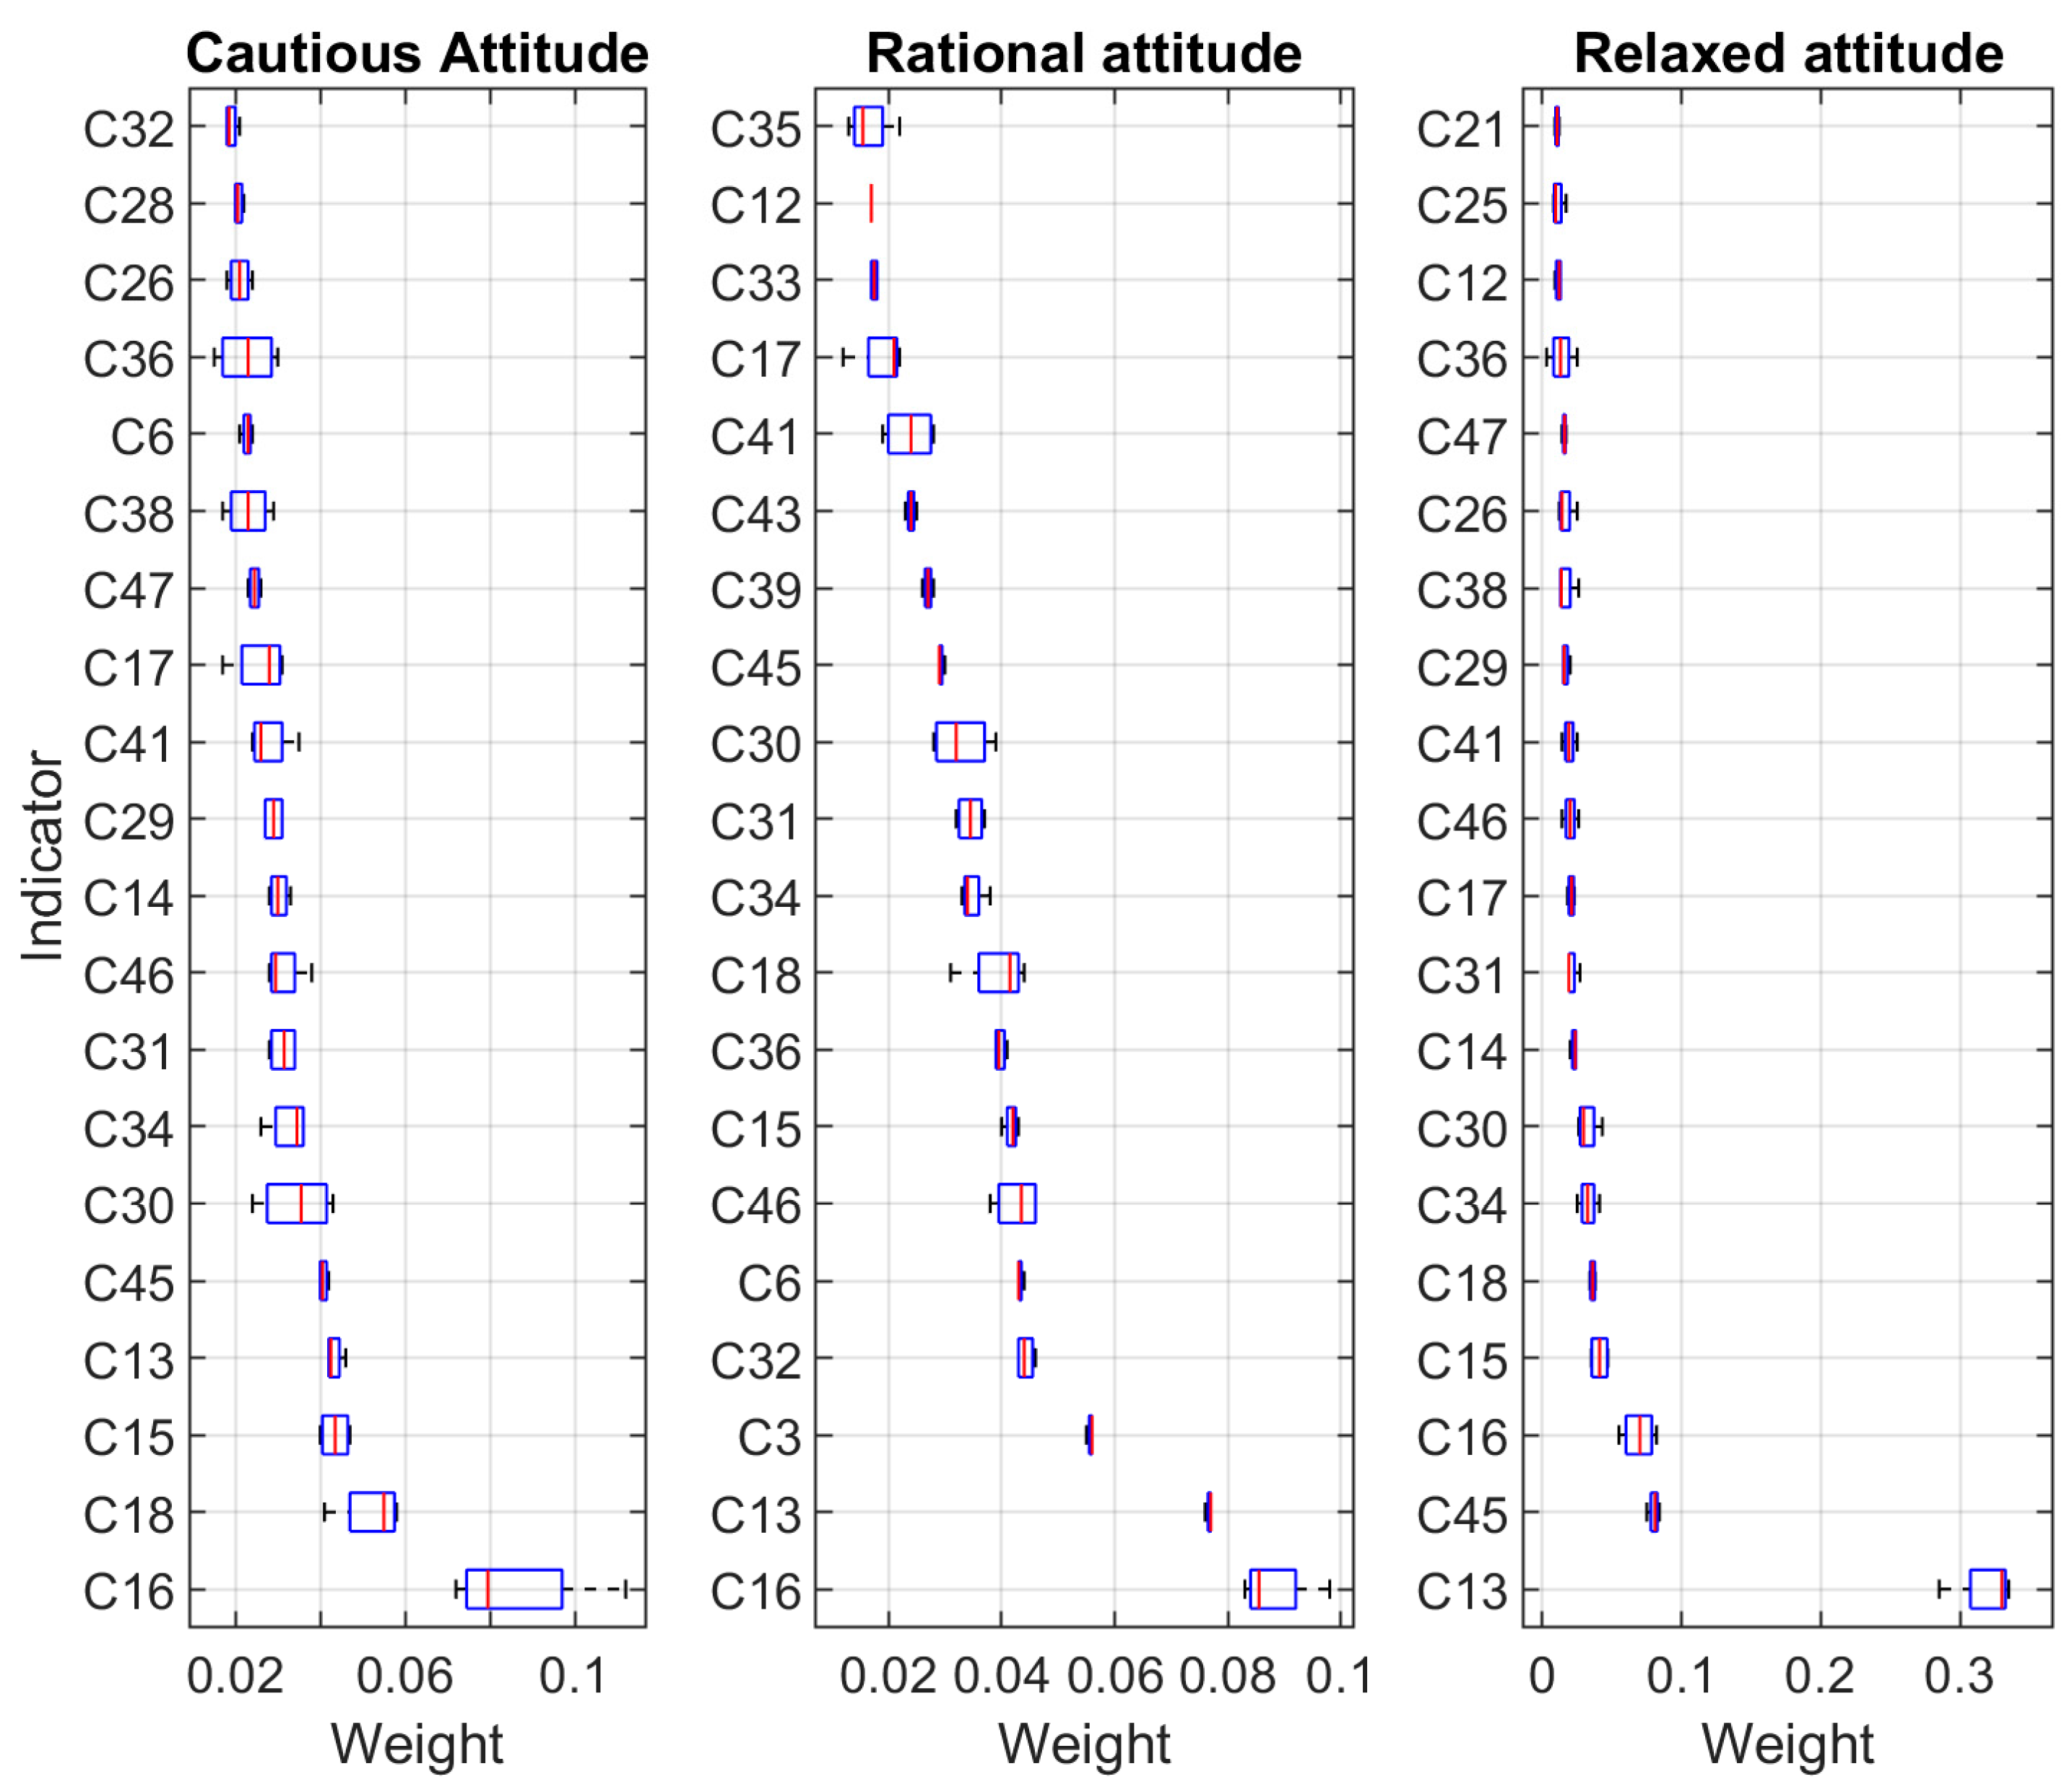
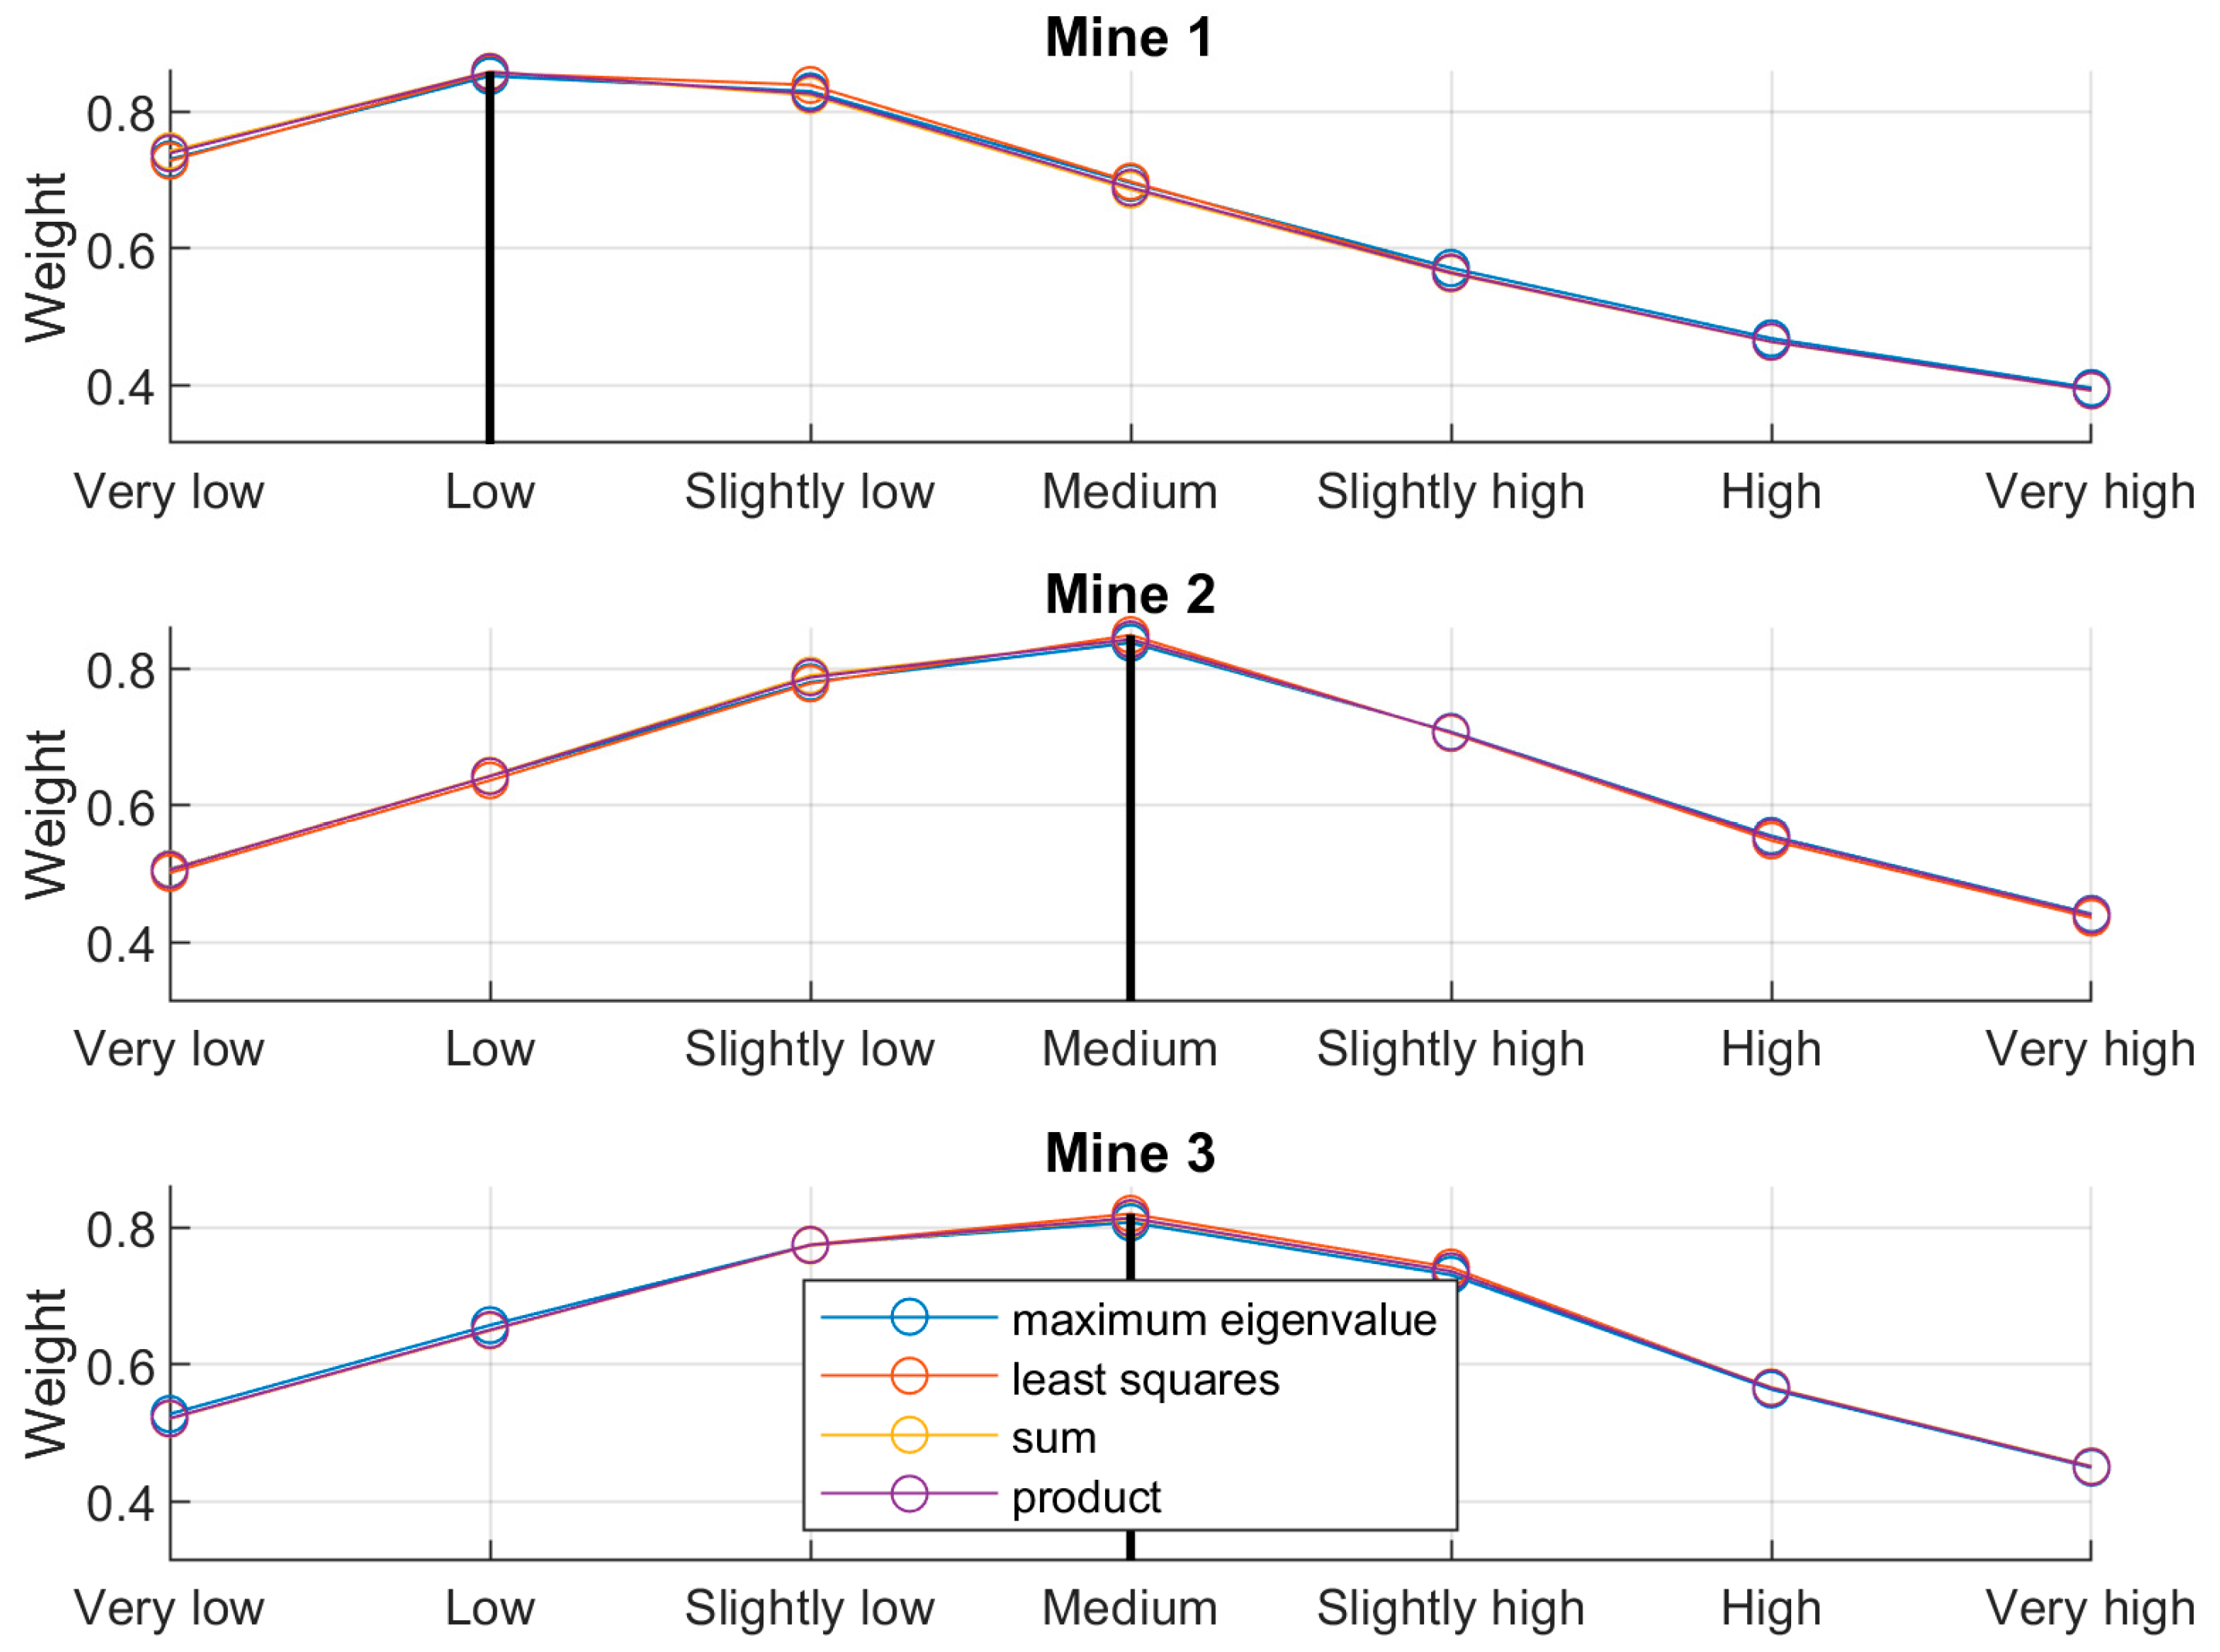
4.1. Fuzzy-Grey Correlation Risk Rating Based on Cautious Comprehensive Weight
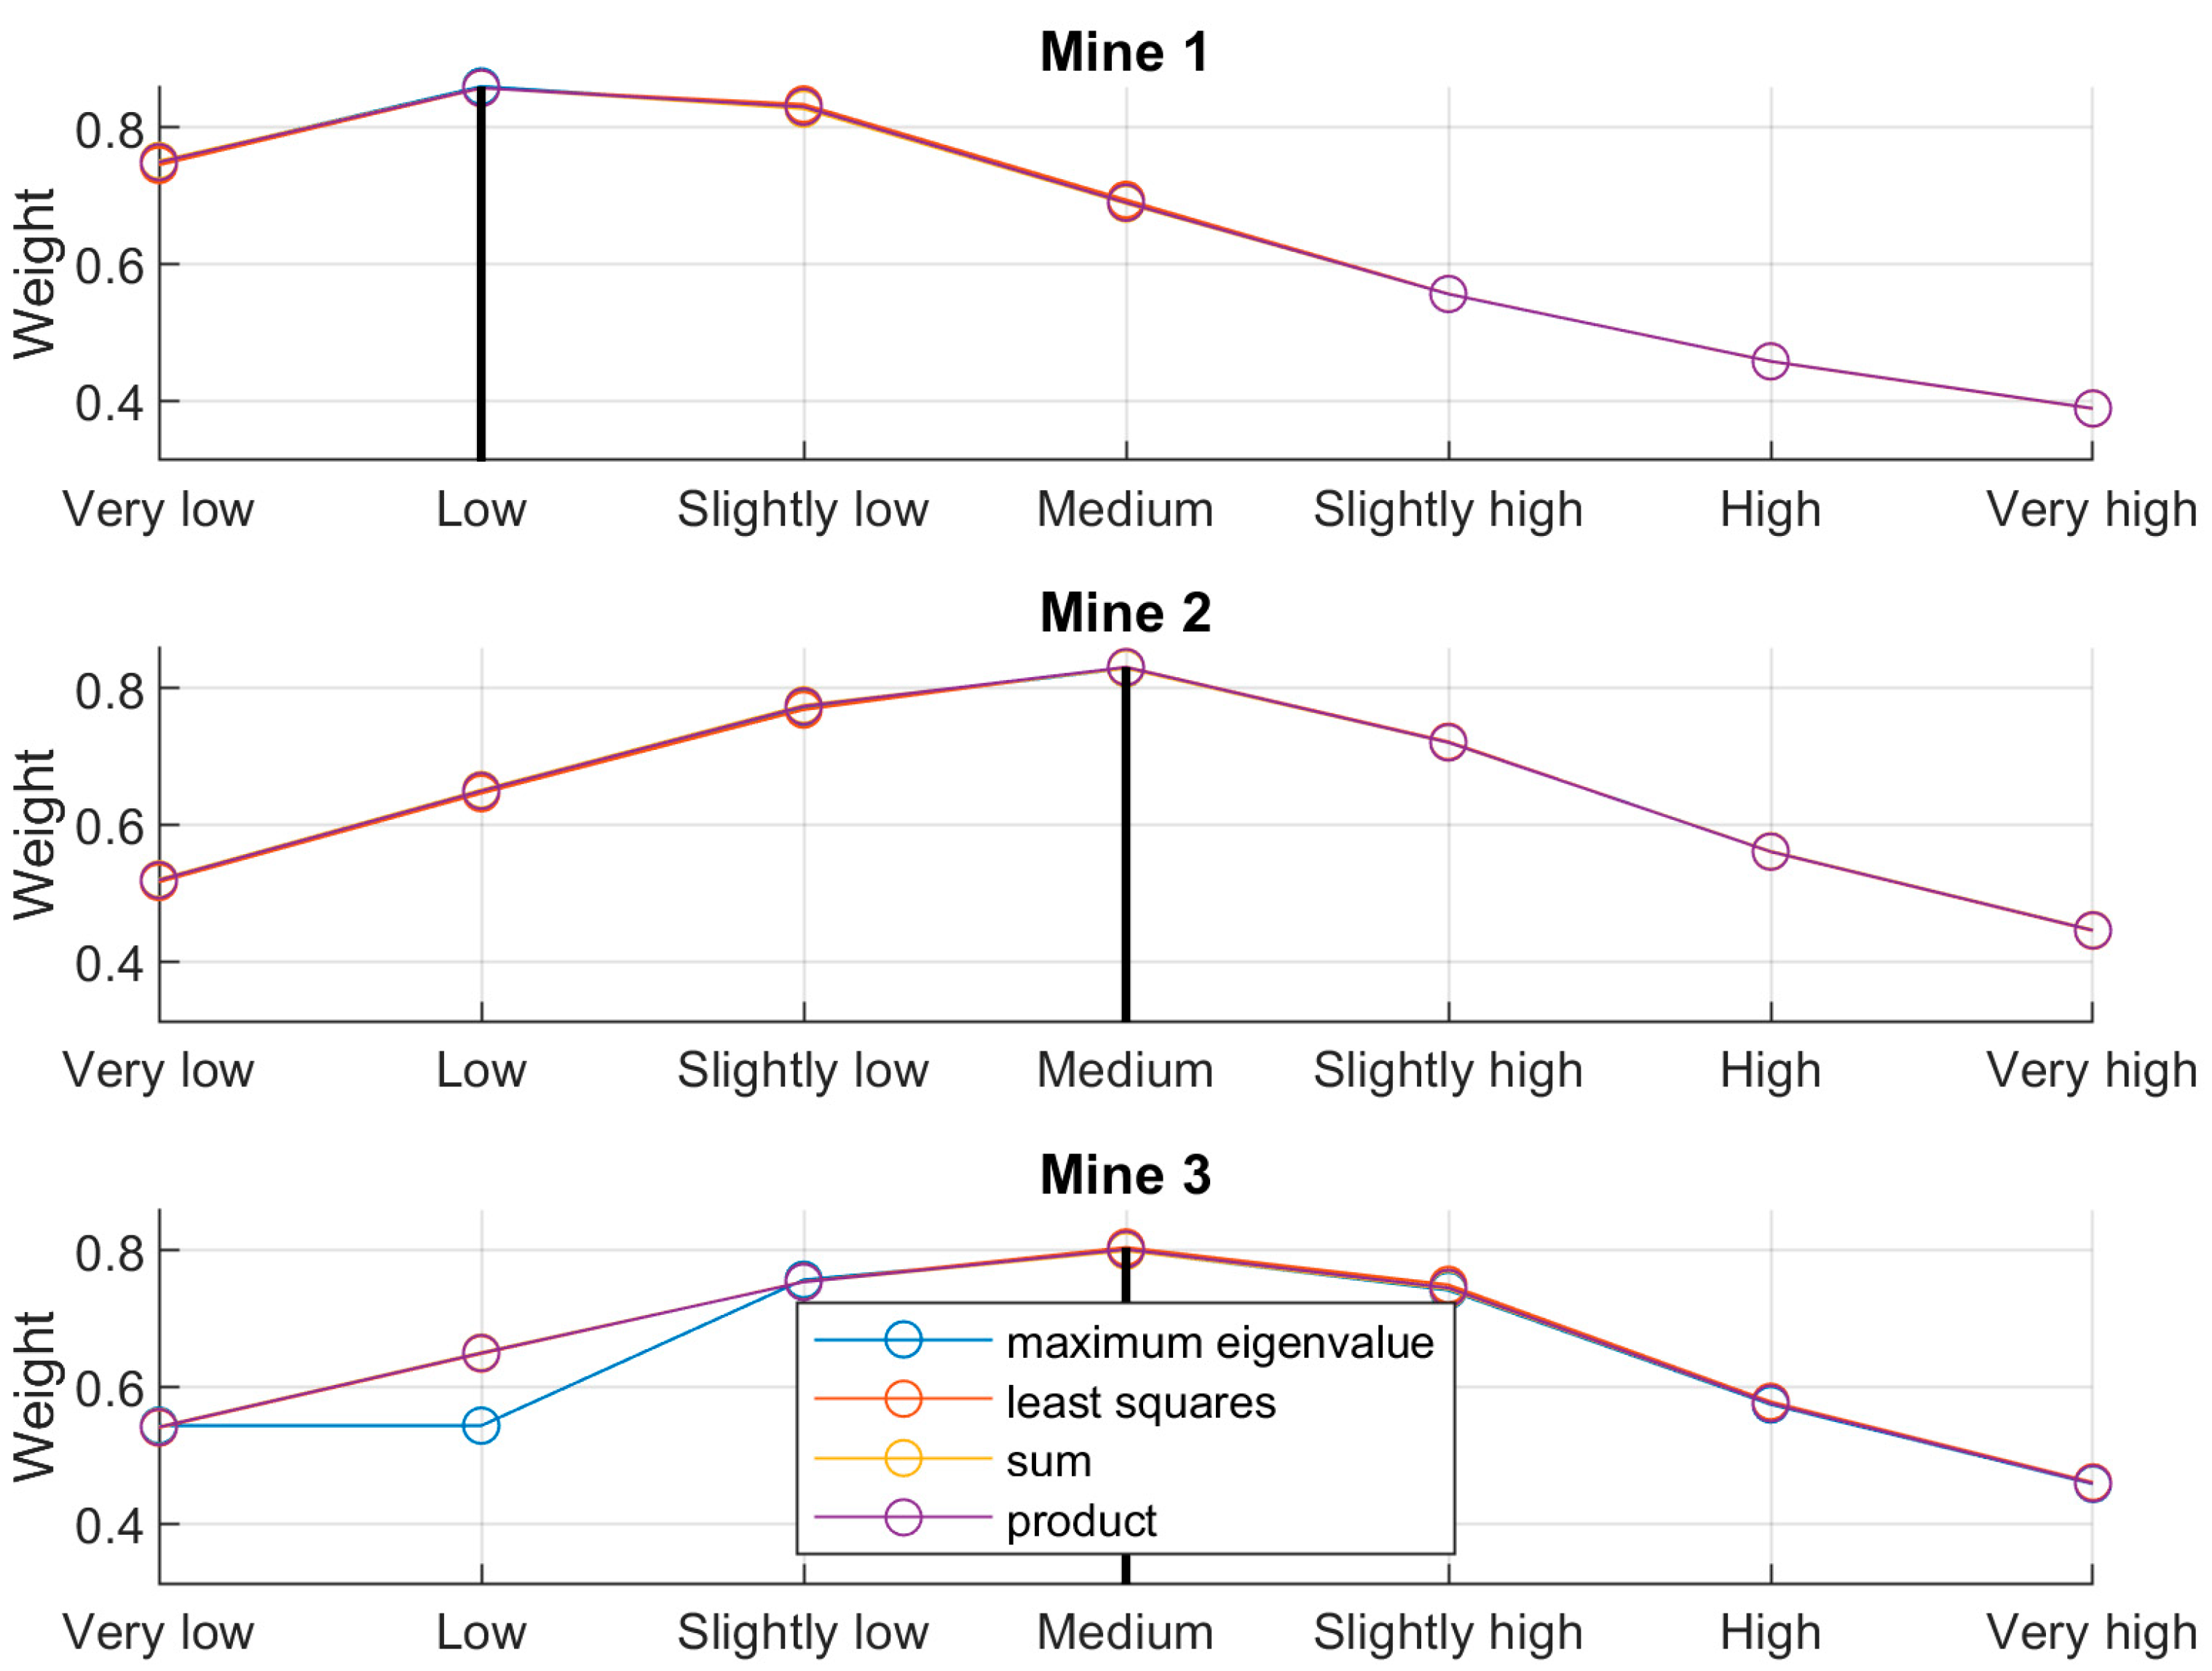
4.2. Fuzzy TOPSIS Risk Rating Based on Rational Comprehensive Weight
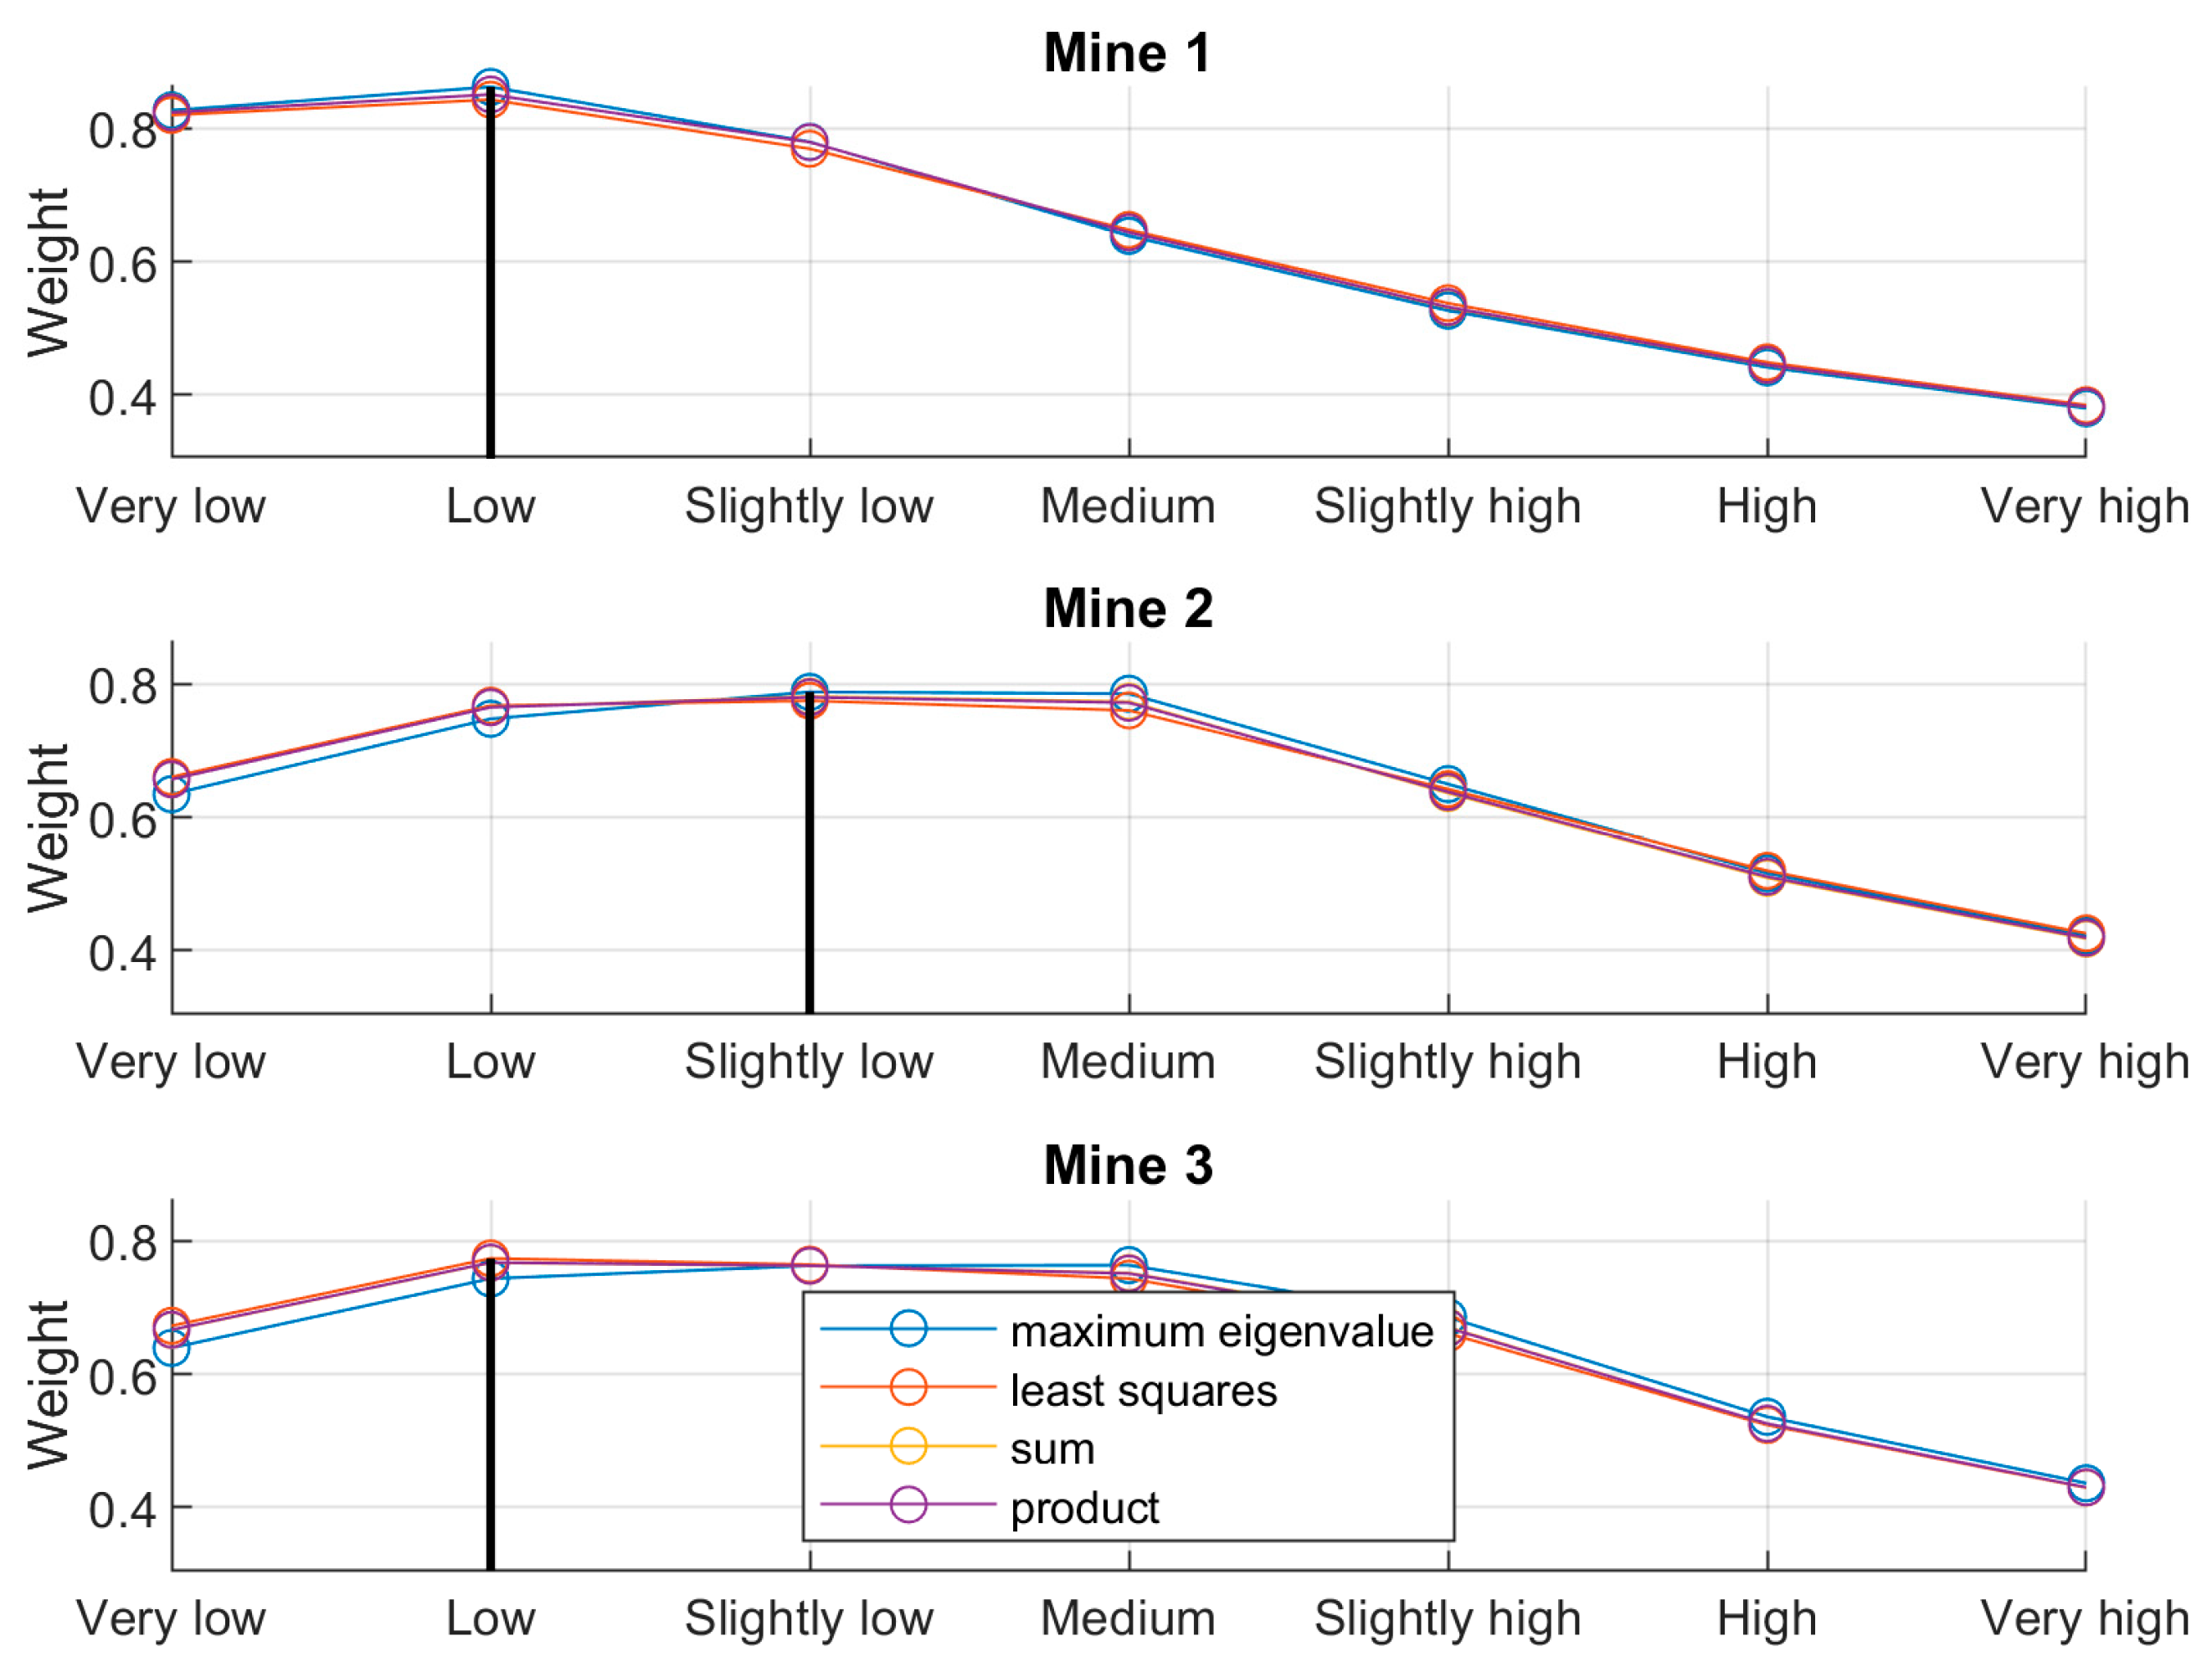
4.3. Fuzzy TOPSIS Risk Rating Based on Relaxed Comprehensive Weight
5. Discussion
- The proposed model was more sensitive to risk because the overall risk rating was generally one level higher.
- The proposed model had little change in rating results under different scoring attitudes, so different scoring attitudes had less influence on the fuzzy-grey correlation model.
- The proposed model did not distinguish the judgment of some adjacent ranks, because there was no strict limit to the risk assessment.
6. Conclusions
Author Contributions
Funding
Conflicts of Interest
References
- Azapagic, A. Developing a framework for sustainable development indicators for the mining and minerals industry. J. Clean. Prod. 2004, 12, 639–662. [Google Scholar] [CrossRef]
- Cao, Q.G.; Li, K.; Liu, Y.J.; Sun, Q.H.; Zhang, J. Risk management and workers’ safety behavior control in coal mine. Saf. Sci. 2012, 50, 909–913. [Google Scholar]
- Pidgeon, N.F. Safety culture and risk management in organizations. J. Cross-Cult. Psychol. 1991, 22, 129–140. [Google Scholar] [CrossRef]
- Zadeh, L.A. Fuzzy sets. Inf. Control 1965, 8, 338–353. [Google Scholar] [CrossRef] [Green Version]
- Camastra, F.; Ciaramella, A.; Giovannelli, V.; Lener, M.; Rastelli, V.; Staiano, A.; Staiano, G.; Starace, A. A fuzzy decision system for genetically modified plant environmental risk assessment using Mamdani inference. Expert Syst. Appl. 2015, 42, 1710–1716. [Google Scholar] [CrossRef]
- Wang, W.-L.; Dong, C.-L.; Dong, W.-P.; Yang, C.-X.; Ju, T.-T.; Huang, L.-H.; Ren, Z.-M. The design and implementation of risk assessment model for hazard installations based on AHP–FCE method: A case study of Nansi Lake Basin. Ecol. Inform. 2016, 36, 162–171. [Google Scholar] [CrossRef]
- Gul, M.; Guneri, A.F. A fuzzy multi criteria risk assessment based on decision matrix technique: A case study for aluminum industry. J. Loss Prev. Process Ind. 2016, 40, 89–100. [Google Scholar] [CrossRef]
- Ji, Y.; Huang, G.-H.; Sun, W. Risk assessment of hydropower stations through an integrated fuzzy entropy-weight multiple criteria decision making method: A case study of the Xiangxi River. Expert Syst. Appl. 2015, 42, 5380–5389. [Google Scholar] [CrossRef]
- Wang, J.-S.; Li, M.-C.; Liu, Y.-X.; Zhang, H.-X.; Zou, W.; Cheng, L. Safety assessment of shipping routes in the South China Sea based on the fuzzy analytic hierarchy process. Saf. Sci. 2014, 62, 46–57. [Google Scholar] [CrossRef]
- Aqlan, F.; Lam, S.S. A fuzzy-based integrated framework for supply chain risk assessment. Int. J. Prod. Econ. 2015, 161, 54–63. [Google Scholar] [CrossRef]
- Gul, M.; Celik, E. Fuzzy rule-based Fine—Kinney risk assessment approach for rail transportation systems. Hum. Ecol. Risk Assess. Int. J. 2018, 24, 1786–1812. [Google Scholar] [CrossRef]
- Taylan, O.; Bafail, A.O.; Abdulaal, R.M.S.; Kabli, M.R. Construction projects selection and risk assessment by fuzzy AHP and fuzzy TOPSIS methodologies. Appl. Soft Comput. 2014, 17, 105–116. [Google Scholar] [CrossRef]
- Zhao, X.-B.; Hwang, B.-G.; Gao, Y. A fuzzy synthetic evaluation approach for risk assessment: A case of Singapore’s green projects. J. Clean. Prod. 2016, 115, 203–213. [Google Scholar] [CrossRef]
- Ilbahar, E.; Karaşan, A.; Cebi, S.; Kahraman, C. A novel approach to risk assessment for occupational health and safety using Pythagorean fuzzy AHP & fuzzy inference system. Saf. Sci. 2018, 103, 124–136. [Google Scholar]
- Amiri, M.; Ardeshir, A.; Zarandi, M.H.F. Fuzzy probabilistic expert system for occupational hazard assessment in construction. Saf. Sci. 2017, 93, 16–28. [Google Scholar] [CrossRef]
- Li, Q.; Zhou, J.Z.; Liu, D.H.; Jiang, X.W. Research on flood risk analysis and evaluation method based on variable fuzzy sets and information diffusion. Saf. Sci. 2012, 50, 1275–1283. [Google Scholar] [CrossRef]
- Chu, H.D.; Xu, G.L.; Yasufuku, N.; Yu, Z.; Liu, P.; Wang, J.F. Risk assessment of water inrush in karst tunnels based on two-class fuzzy comprehensive evaluation method. Arab. J. Geosci. 2017, 10, 179. [Google Scholar] [CrossRef]
- Basu, S.; Pramanik, S.; Dey, S.; Panigrahi, G.; Jana, D.K. Fire monitoring in coal mines using wireless underground sensor network and interval type-2 fuzzy logic controller. Int. J. Coal Sci. Technol. 2019, 6, 274–285. [Google Scholar] [CrossRef] [Green Version]
- Chen, P.; Xie, Y.; Jin, P.; Zhang, D. A wireless sensor data-based coal mine gas monitoring algorithm with least squares support vector machines optimized by swarm intelligence techniques. Int. J. Distrib. Sens. Netw. 2018, 14. [Google Scholar] [CrossRef]
- Lian, J.; Pu, H.T.; Liu, Q.X. Rough set and neural network based risk evaluation under coalmine with detect mobile robot. In Proceedings of the 2011 IEEE International Symposium on IT in Medicine and Education, Guangzhou, China, 9–11 December 2011; pp. 738–741. [Google Scholar]
- Zhang, Y.; Lu, W.X.; Guo, J.Y.; Zhao, H.Q.; Yang, Q.C.; Chen, M. Geo-environmental impact assessment and management information system for the mining area, northeast China. Environ. Earth Sci. 2015, 74, 7173–7185. [Google Scholar] [CrossRef]
- Wang, Y.C.; Jing, H.W.; Yu, L.Y.; Su, H.J.; Luo, N. Set pair analysis for risk assessment of water inrush in karst tunnels. Bull. Eng. Geol. Environ. 2016, 76, 1199–1207. [Google Scholar] [CrossRef]
- Tao, J.; Fu, M.C.; Sun, J.J.; Zheng, X.Q.; Zhang, J.J.; Zhang, D.X. Multifunctional assessment and zoning of crop production system based on set pair analysis-a comparative study of 31 provincial regions in mainland China. Commun. Nonlinear Sci. Numer. Simul. 2014, 19, 1400–1416. [Google Scholar] [CrossRef]
- Liu, Z.B.; Shao, J.F.; Xu, W.Y.; Xu, F. Comprehensive stability evaluation of rock slope using the cloud model-based approach. Rock Mech. Rock Eng. 2013, 47, 2239–2252. [Google Scholar] [CrossRef]
- Zhang, L.M.; Wu, X.G.; Chen, Q.Q.; Skibniewski, M.J.; Zhong, J.B. Developing a cloud model based risk assessment methodology for tunnel-induced damage to existing pipelines. Stoch. Environ. Res. Risk Assess. 2015, 29, 513–526. [Google Scholar] [CrossRef]
- Strbac Savic, S.; Nedeljkovic Ostojic, J.; Gligoric, Z.; Cvijovic, C.; Aleksandrovic, S. Operational efficiency forecasting model of an existing underground mine using grey system theory and stochastic diffusion processes. Math. Probl. Eng. 2015. [Google Scholar] [CrossRef] [Green Version]
- Kokangül, A.; Polat, U.; Dağsuyu, C. A new approximation for risk assessment using the AHP and Fine Kinney methodologies. Saf. Sci. 2017, 91, 24–32. [Google Scholar] [CrossRef]
- Shi, Q.; Lu, Z.; Liu, Z.; Miao, Y.; Xia, M. Evaluation model of the grey fuzzy on eco-environment vulnerability. J. For. Res. 2007, 18, 187–192. [Google Scholar] [CrossRef]
- Shi, H. A grey fuzzy comprehensive model for evaluation of teaching quality. In Proceedings of the 2009 International Conference on Test and Measurement, Hong Kong, China, 5–6 December 2009. [Google Scholar]
- Wang, W.; Zhao, Q.; Guo, R. A Hybrid Approach Based on Grey Correlation Analysis and Fuzzy Comprehensive Judgment for Evaluating Service Quality of Passenger Train. Adv. Mech. Eng. 2014. [Google Scholar] [CrossRef] [Green Version]
- Mahdevari, S.; Shahriar, K.; Esfahanipour, A. Human health and safety risks management in underground coal mines using fuzzy TOPSIS. Sci. Total Environ. 2014, 488, 85–99. [Google Scholar] [CrossRef]
- Verma, S.; Chaudhri, S. Integration of fuzzy reasoning approach (FRA) and fuzzy analytic hierarchy process (FAHP) for risk assessment in mining industry. J. Ind. Eng. Manag. 2014, 7, 1347–1367. [Google Scholar] [CrossRef] [Green Version]
- Petrović, D.V.; Tanasijević, M.; Milić, V.; Lilić, N.; Stojadinović, S.; Svrkota, I. Risk assessment model of mining equipment failure based on fuzzy logic. Expert Syst. Appl. 2014, 41, 8157–8164. [Google Scholar] [CrossRef]
- Wang, Q.-X.; Wang, H.; Qi, Z.-Q. An application of nonlinear fuzzy analytic hierarchy process in safety evaluation of coal mine. Saf. Sci. 2016, 86, 78–87. [Google Scholar] [CrossRef]
- Nawrocki, T.L.; Jonek-Kowalska, I. Assessing operational risk in coal mining enterprises—Internal, industrial and international perspectives. Resour. Policy 2016, 48, 50–67. [Google Scholar] [CrossRef]
- Verma, S.; Chaudhari, S. Highlights from the literature on risk assessment techniques adopted in the mining industry: A review of past contributions, recent developments and future scope. Int. J. Min. Sci. Technol. 2016, 26, 691–702. [Google Scholar] [CrossRef]
- Yang, W.-F.; Xia, X.-H.; Pan, B.-L.; Gu, C.-S.; Yue, J.-G. The fuzzy comprehensive evaluation of water and sand inrush risk during underground mining. J. Intell. Fuzzy Syst. 2016, 30, 2289–2295. [Google Scholar] [CrossRef]
- Ghasemi, E.; Ataei, M.; Shahriar, K. Improving the method of roof fall susceptibility assessment based on fuzzy approach. Arch. Min. Sci. 2017, 62, 13–32. [Google Scholar] [CrossRef] [Green Version]
- Wang, H.-T.; Li, J.; Wang, D.-M.; Huang, Z.-H. A novel method of fuzzy fault tree analysis combined with VB program to identify and assess the risk of coal dust explosions. PLoS ONE 2017, 12, e0182453. [Google Scholar] [CrossRef] [Green Version]
- Samantra, C.; Datta, S.; Mahapatra, S.S. A risk-based decision support framework for selection of appropriate safety measure system for underground coal mines. Int. J. Inj. Control Saf. Promot. 2015, 24, 54–68. [Google Scholar] [CrossRef]
- Bao, J.; Johansson, J.; Zhang, J. An Occupational Disease Assessment of the Mining Industry’s Occupational Health and Safety Management System Based on FMEA and an Improved AHP Model. Sustainability 2017, 9, 94. [Google Scholar] [CrossRef] [Green Version]
- Samantra, C.; Datta, S.; Mahapatra, S.S. Analysis of occupational health hazards and associated risks in fuzzy environment: A case research in an Indian underground coal mine. Int. J. Inj. Control Saf. Promot. 2016, 24, 311–327. [Google Scholar] [CrossRef]
- Qiu, M.; Shi, L.-Q.; Teng, C.; Zhou, Y. Assessment of water inrush risk using the fuzzy delphi analytic hierarchy process and grey relational analysis in the Liangzhuang coal mine, China. Mine Water Environ. 2017, 36, 39–50. [Google Scholar] [CrossRef]
- Han, S.; Che, H.; Long, R.-Y.; Qi, H.; Cui, X.-T. Evaluation of the derivative environment in coal mine safety production systems: Case study in China. J. Clean. Prod. 2017, 143, 377–387. [Google Scholar] [CrossRef]
- Deng, J.L. Control problems of grey systems. Syst. Control Lett. 1982, 1, 288–294. [Google Scholar]
- Deng, J.L. Introduction to grey theory system. J. Grey Syst. 1989, 1, 1–24. [Google Scholar]
- Sun, G.; Guan, X.; Yi, X.; Zhou, Z. Grey relational analysis between hesitant fuzzy sets with applications to pattern recognition. Expert Syst. Appl. 2018, 92, 521–532. [Google Scholar] [CrossRef]
- Wojciechowski, S.; Maruda, R.W.; Krolczyk, G.M.; Niesłony, P. Application of signal to noise ratio and grey relational analysis to minimize forces and vibrations during precise ball end milling. Precis. Eng. 2018, 51, 582–596. [Google Scholar] [CrossRef]
- Xu, Q.; Xu, K. Mine safety assessment using gray relational analysis and bow tie model. PLoS ONE 2018, 13, e0193576. [Google Scholar] [CrossRef] [Green Version]
- Liou, T.S.; Wang, M.J.J. Ranking fuzzy numbers with integral value. Fuzzy Sets Syst. 1992, 50, 247–255. [Google Scholar] [CrossRef]
- Dubois, D.; Prade, H. Fuzzy real algebra: Some results. Fuzzy Sets Syst. 1979, 2, 327–348. [Google Scholar] [CrossRef]
- Goetschel, R.; Voxman, W. Elementary fuzzy calculus. Fuzzy Sets Syst. 1986, 18, 31–43. [Google Scholar] [CrossRef]
- Deng, S.-Y.; Zhou, L.-Q.; Wang, X.-F. Solving the fuzzy bilevel linear programming with multiple followers through structured element method. Math. Probl. Eng. 2014. [Google Scholar] [CrossRef] [Green Version]
- Kóczy, L.T. Ordering, distance and closeness of fuzzy sets. Fuzzy Sets Syst. 1983, 59, 281–293. [Google Scholar] [CrossRef]
- Dubois, D.J. Fuzzy Sets and Systems: Theory and Applications; Academic Press: New York, NY, USA, 1980. [Google Scholar]
- Chen, H.-M.; Ning, Y.-C.; Sun, X.-D. Production safety evaluation model based on principal component analysis. Procedia Eng. 2011, 26, 1949–1955. [Google Scholar] [CrossRef] [Green Version]
- Fayaz, M.; Ullah, I.; Park, D.-H.; Kim, K.; Kim, D. An Integrated Risk Index Model Based on Hierarchical Fuzzy Logic for Underground Risk Assessment. Appl. Sci. 2017, 7, 1037. [Google Scholar] [CrossRef] [Green Version]
- Ullah, I.; Fayaz, M.; Kim, D. Analytical Modeling for Underground Risk Assessment in Smart Cities. Appl. Sci. 2018, 8, 921. [Google Scholar] [CrossRef] [Green Version]
- Fayaz, M.; Ahmad, S.; Hang, L.; Kim, D. Water Supply Pipeline Risk Index Assessment Based on Cohesive Hierarchical Fuzzy Inference System. Processes 2019, 7, 182. [Google Scholar] [CrossRef] [Green Version]


| Primary Indicator | Secondary Indicators | Three Level Indicators |
|---|---|---|
| Natural conditions A1 | Safe production capacity B1 | Satisfaction of safety production capacity C1 |
| Hydrogeological conditions B2 | Water rich C2 of the formation | |
| Rock mass water rich C3 | ||
| Fold, fracture structure of the water rich C4 | ||
| Rock top floor conditions B3 | Rock formation management ease C5 | |
| Engineering geological conditions B4 | Soil thickness C6 | |
| Rock mass hardness C7 | ||
| Dust explosion conditions B6 | Probability of dust explosion C8 | |
| Mining situation B7 | Mining depth C9 | |
| Personnel quality A2 | Cultural quality B8 | The average level of education C10 |
| Professional quality B9 | Senior technician ratio C11 | |
| Senior management ratio C12 | ||
| Certified staff ratio C13 | ||
| Physical fitness B10 | Medical examination pass rate C14 | |
| Safety awareness B11 | Safety training attendance C15 | |
| Personnel insecure behavior B12 | “Three violations” incidence of C16 | |
| Equipment Situation A3 | Equipment advanced level B13 | Million tons Pb-Zn mine production equipment total value C17 |
| Equipment mechanization B14 | Tons of Pb-Zn ore production equipment total value C18 | |
| Equipment failure B15 | Production equipment failure rate C19 | |
| Equipment maintenance B16 | Production equipment maintenance rate C20 | |
| Equipment renovation B17 | Production equipment update rate C21 | |
| Production process A4 | Temperature B18 | General face temperature conditions C22 |
| Wind speed B19 | Average wind speed C23 | |
| Noise B20 | Average noise decibel C24 | |
| Harmful gases B21 | The average concentration of harmful gases C25 | |
| Dust B22 | The average dust concentration C26 | |
| Lighting B23 | The average illuminance C27 | |
| Workplace B24 | Roadway pass rate C28 | |
| Safety Management A5 | Safety management system B25 | Safety management system improvement rate C29 |
| Safety risk management B26 | Hidden rectification pass rate C30 | |
| Safety and quality standardization management B27 | The average score of safety and quality standardization examination C31 | |
| Safety information management B28 | Per capita information management input ratio C32 | |
| Security information office rate C33 | ||
| Security input B29 | Security input ratio C34 | |
| Safety education and training B30 | Training funding ratio C35 | |
| Staff training rate C36 | ||
| Certified growth ratio training C37 | ||
| Safety incident management B31 | Pb-Zn mine million tons mortality rate C38 | |
| The number of serious injuries throughout the year C39 | ||
| Percentage of minor injuries C40 | ||
| Major disaster management B32 | Million tons of ore explosion alarm rate C41 | |
| Million tons of ore production flood alarm rate C42 | ||
| Million tons of ore fire alarm rate C43 | ||
| Tons of ore hit the ground pressure alarm rate C44 | ||
| Occupational health management B33 | The proportion of occupational patients C45 | |
| Emergency management B34 | “Safe hedging six systems” complete rate C46 |
| Three Level Indicator | Mine 1 | Mine 2 | Mine 3 | ||||||
|---|---|---|---|---|---|---|---|---|---|
| a | b | c | a | b | c | a | b | c | |
| C1 | 0.9867 | 1.32 | 1.6533 | 1.91 | 2.2433 | 2.5767 | 1.2233 | 1.5567 | 1.89 |
| C2 | 0.8413 | 1.008 | 1.3413 | 1.0953 | 1.262 | 1.5953 | 1.0593 | 1.226 | 1.5593 |
| C3 | 0.8111 | 1.1445 | 1.4778 | 0.3778 | 0.5444 | 0.8778 | 0.1 | 0.1 | 0.4333 |
| C4 | 0.66 | 0.9933 | 1.3267 | 1.0733 | 1.4067 | 1.74 | 0.68 | 1.0133 | 1.3467 |
| C5 | 2 | 2.5 | 2.8333 | 2 | 2.5 | 2.8333 | 1.3333 | 1.8333 | 2.3333 |
| C6 | 0.039 | 0.2057 | 0.539 | 1.4523 | 1.7857 | 1.9523 | 0.587 | 0.9203 | 1.2537 |
| C7 | 0.3333 | 0.8333 | 1.3333 | 1.6667 | 2.1667 | 2.6667 | 1.8333 | 2.3333 | 2.6667 |
| C8 | 1.3333 | 1.8333 | 2.3333 | 1 | 1.5 | 2 | 1.1667 | 1.6667 | 2.1667 |
| C9 | 1.356 | 1.6893 | 2.0227 | 0.5593 | 0.8927 | 1.226 | 1.523 | 1.8563 | 2.1897 |
| C10 | 0.4517 | 0.6183 | 0.9517 | 0.6405 | 0.8072 | 1.1405 | 0.5799 | 0.7465 | 1.0799 |
| C11 | 0.74 | 0.74 | 1.0733 | 1.35 | 1.5167 | 1.85 | 1.1433 | 1.31 | 1.6433 |
| C12 | 0.82 | 0.82 | 1.1533 | 1.5867 | 1.7533 | 2.0867 | 1.5967 | 1.7633 | 2.0967 |
| C13 | 0 | 0 | 0.3333 | 0.02 | 0.1867 | 0.52 | 0.02 | 0.1867 | 0.52 |
| C14 | 0.02 | 0.1867 | 0.52 | 0.1967 | 0.53 | 0.8633 | 0.2067 | 0.54 | 0.8733 |
| C15 | 0.2767 | 0.61 | 0.9433 | 0.8867 | 1.22 | 1.5533 | 1.1233 | 1.4567 | 1.79 |
| C16 | 0.6983 | 1.0317 | 1.365 | 1.065 | 1.3983 | 1.7317 | 1.365 | 1.6983 | 2.0317 |
| C17 | 0.8543 | 1.021 | 1.3543 | 1.488 | 1.8213 | 2.1547 | 1.5097 | 1.8431 | 2.1764 |
| C18 | 0.0461 | 0.2127 | 0.5461 | 0.7599 | 1.0933 | 1.4266 | 0.4055 | 0.7388 | 1.0721 |
| C19 | 0.5033 | 0.8367 | 1.17 | 0.71 | 1.0433 | 1.3767 | 0.5233 | 0.8567 | 1.19 |
| C20 | 0.02 | 0.3533 | 0.6867 | 0.03 | 0.3633 | 0.6967 | 0.03 | 0.3633 | 0.6967 |
| C21 | 1.5967 | 1.93 | 2.2633 | 1.97 | 2.3033 | 2.6367 | 1.98 | 2.3133 | 2.6467 |
| C22 | 0.5 | 0.6667 | 1 | 1.0417 | 1.375 | 1.7083 | 0.75 | 1.0833 | 1.4167 |
| C23 | 0.8658 | 1.1992 | 1.5325 | 1.2242 | 1.5575 | 1.8908 | 1.0825 | 1.4158 | 1.7492 |
| C24 | 0.5167 | 0.85 | 1.1833 | 0.7833 | 1.1167 | 1.45 | 0.7583 | 1.0917 | 1.425 |
| C25 | 1.2708 | 1.6042 | 1.9375 | 1.5833 | 1.9167 | 2.25 | 1.2917 | 1.625 | 1.9583 |
| C26 | 0.998 | 1.3313 | 1.6647 | 1.7527 | 2.086 | 2.4193 | 1.3033 | 1.6967 | 2.03 |
| C27 | 0.5733 | 0.74 | 1.0733 | 0.9733 | 1.3067 | 1.64 | 0.5133 | 0.8467 | 1.18 |
| C28 | 0.06 | 0.3933 | 0.7267 | 0.62 | 0.9533 | 1.2867 | 0.61 | 0.9433 | 1.2767 |
| C29 | 0.02 | 0.1867 | 0.52 | 0.7167 | 1.05 | 1.3833 | 1.07 | 1.4033 | 1.7367 |
| C30 | 0.03 | 0.3633 | 0.6967 | 0.8367 | 1.17 | 1.5033 | 1.24 | 1.5733 | 1.9067 |
| C31 | 0.0266 | 0.1933 | 0.5266 | 0.4177 | 0.7511 | 1.0844 | 0.6088 | 0.9421 | 1.2755 |
| C32 | 0.11 | 0.2767 | 0.61 | 1.4433 | 1.7767 | 2.11 | 1.6033 | 1.9367 | 2.27 |
| C33 | 0.15 | 0.4833 | 0.8167 | 1.3267 | 1.66 | 1.9933 | 1.71 | 2.0433 | 2.3767 |
| C34 | 0.72 | 0.8867 | 1.22 | 1.1033 | 1.4967 | 1.83 | 1.39 | 1.7233 | 2.0567 |
| C35 | 0.63 | 0.63 | 0.9633 | 1.5267 | 1.86 | 2.1933 | 1.7633 | 2.0967 | 2.2633 |
| C36 | 0.01 | 0.01 | 0.3433 | 0.77 | 1.1033 | 1.4367 | 1.4133 | 1.7467 | 1.9133 |
| C37 | 0.89 | 0.89 | 1.2233 | 1.1367 | 1.3033 | 1.6367 | 1.48 | 1.6467 | 1.98 |
| C38 | 0 | 0 | 0.3333 | 0.6677 | 1.001 | 1.3343 | 0.6667 | 1 | 1.3333 |
| C39 | 0.2027 | 0.3693 | 0.7027 | 1.2593 | 1.5927 | 1.926 | 0.9627 | 1.296 | 1.6293 |
| C40 | 0.686 | 1.0193 | 1.3527 | 1.986 | 2.3193 | 2.6527 | 2.3527 | 2.686 | 2.8527 |
| C41 | 0.2967 | 0.63 | 0.9633 | 1.21 | 1.5433 | 1.8767 | 0.67 | 1.0033 | 1.3367 |
| C42 | 0.03 | 0.3633 | 0.6967 | 0.55 | 0.8833 | 1.2167 | 1.3567 | 1.69 | 2.0233 |
| C43 | 0.5133 | 0.8467 | 1.18 | 1.7133 | 2.0467 | 2.2133 | 0.2767 | 0.61 | 0.9433 |
| C44 | 1.3603 | 1.6937 | 2.027 | 1.1997 | 1.533 | 1.8663 | 0.3423 | 0.6757 | 1.009 |
| C45 | 0.005 | 0.1717 | 0.505 | 0.1727 | 0.506 | 0.8393 | 0.004 | 0.3373 | 0.6707 |
| C46 | 0.1867 | 0.3533 | 0.6867 | 0.4633 | 0.7967 | 1.13 | 0.8367 | 1.17 | 1.5033 |
| C47 | 0.1767 | 0.51 | 0.8433 | 1.07 | 1.4033 | 1.7367 | 0.7167 | 1.05 | 1.3833 |
| C48 | 0.01 | 0.1767 | 0.51 | 0.9167 | 1.25 | 1.5833 | 1.1433 | 1.4767 | 1.81 |
| Three-Level Indicator | Comprehensive Weight 1 | Comprehensive Weight 2 | Comprehensive Weight 3 | Comprehensive Weight 4 | ||||||||
|---|---|---|---|---|---|---|---|---|---|---|---|---|
| Cautious Attitude | Rational Attitude | Relaxed Attitude | Cautious Attitude | Rational Attitude | Relaxed Attitude | Cautious Attitude | Rational Attitude | Relaxed Attitude | Cautious Attitude | Rational Attitude | Relaxed Attitude | |
| C1 | 0.005 | 0.004 | 0.001 | 0.005 | 0.004 | 0.002 | 0.005 | 0.004 | 0.001 | 0.005 | 0.004 | 0.001 |
| C2 | 0.007 | 0.006 | 0.001 | 0.006 | 0.006 | 0.002 | 0.006 | 0.006 | 0.001 | 0.006 | 0.006 | 0.001 |
| C3 | 0.02 | 0.056 | 0.004 | 0.017 | 0.055 | 0.005 | 0.017 | 0.056 | 0.005 | 0.018 | 0.056 | 0.005 |
| C4 | 0.014 | 0.006 | 0.003 | 0.012 | 0.005 | 0.005 | 0.012 | 0.006 | 0.004 | 0.012 | 0.006 | 0.004 |
| C5 | 0.009 | 0.005 | 0.004 | 0.007 | 0.005 | 0.007 | 0.007 | 0.005 | 0.005 | 0.008 | 0.005 | 0.005 |
| C6 | 0.024 | 0.043 | 0.008 | 0.023 | 0.043 | 0.012 | 0.021 | 0.044 | 0.01 | 0.023 | 0.043 | 0.009 |
| C7 | 0.012 | 0.014 | 0.002 | 0.011 | 0.014 | 0.005 | 0.011 | 0.014 | 0.003 | 0.011 | 0.014 | 0.003 |
| C8 | 0.014 | 0.004 | 0.005 | 0.012 | 0.004 | 0.008 | 0.012 | 0.004 | 0.006 | 0.012 | 0.004 | 0.006 |
| C9 | 0.011 | 0.009 | 0.004 | 0.009 | 0.009 | 0.007 | 0.009 | 0.009 | 0.005 | 0.01 | 0.009 | 0.005 |
| C10 | 0.016 | 0.013 | 0.007 | 0.016 | 0.016 | 0.012 | 0.013 | 0.013 | 0.009 | 0.013 | 0.013 | 0.009 |
| C11 | 0.008 | 0.006 | 0.005 | 0.006 | 0.006 | 0.006 | 0.007 | 0.007 | 0.006 | 0.007 | 0.007 | 0.007 |
| C12 | 0.014 | 0.017 | 0.011 | 0.016 | 0.017 | 0.009 | 0.012 | 0.017 | 0.013 | 0.013 | 0.017 | 0.013 |
| C13 | 0.046 | 0.077 | 0.285 | 0.043 | 0.076 | 0.335 | 0.042 | 0.077 | 0.33 | 0.042 | 0.077 | 0.33 |
| C14 | 0.033 | 0.014 | 0.02 | 0.031 | 0.015 | 0.023 | 0.028 | 0.015 | 0.024 | 0.029 | 0.014 | 0.024 |
| C15 | 0.047 | 0.042 | 0.036 | 0.046 | 0.04 | 0.035 | 0.04 | 0.042 | 0.046 | 0.041 | 0.043 | 0.047 |
| C16 | 0.082 | 0.085 | 0.065 | 0.112 | 0.098 | 0.055 | 0.072 | 0.083 | 0.082 | 0.077 | 0.086 | 0.075 |
| C17 | 0.031 | 0.021 | 0.018 | 0.017 | 0.012 | 0.022 | 0.03 | 0.022 | 0.02 | 0.026 | 0.021 | 0.023 |
| C18 | 0.058 | 0.042 | 0.034 | 0.041 | 0.031 | 0.035 | 0.057 | 0.044 | 0.038 | 0.053 | 0.041 | 0.037 |
| C19 | 0.015 | 0.005 | 0.005 | 0.011 | 0.003 | 0.008 | 0.014 | 0.005 | 0.006 | 0.013 | 0.004 | 0.007 |
| C20 | 0.019 | 0.002 | 0.007 | 0.017 | 0.002 | 0.002 | 0.018 | 0.002 | 0.007 | 0.018 | 0.002 | 0.008 |
| C21 | 0.015 | 0.01 | 0.009 | 0.008 | 0.006 | 0.012 | 0.015 | 0.011 | 0.01 | 0.013 | 0.01 | 0.011 |
| C22 | 0.013 | 0.005 | 0.005 | 0.01 | 0.005 | 0.01 | 0.011 | 0.006 | 0.006 | 0.012 | 0.006 | 0.007 |
| C23 | 0.007 | 0.002 | 0.002 | 0.006 | 0.002 | 0.005 | 0.006 | 0.002 | 0.003 | 0.006 | 0.002 | 0.003 |
| C24 | 0.007 | 0.001 | 0.001 | 0.006 | 0.001 | 0.004 | 0.006 | 0.001 | 0.002 | 0.006 | 0.001 | 0.002 |
| C25 | 0.017 | 0.009 | 0.008 | 0.014 | 0.01 | 0.017 | 0.014 | 0.01 | 0.009 | 0.015 | 0.01 | 0.01 |
| C26 | 0.022 | 0.013 | 0.012 | 0.024 | 0.019 | 0.025 | 0.018 | 0.014 | 0.014 | 0.02 | 0.014 | 0.014 |
| C27 | 0.008 | 0.002 | 0.002 | 0.008 | 0.002 | 0.004 | 0.007 | 0.002 | 0.002 | 0.007 | 0.002 | 0.002 |
| C28 | 0.022 | 0.008 | 0.008 | 0.021 | 0.009 | 0.011 | 0.02 | 0.008 | 0.009 | 0.02 | 0.008 | 0.009 |
| C29 | 0.027 | 0.014 | 0.02 | 0.027 | 0.013 | 0.016 | 0.031 | 0.015 | 0.015 | 0.031 | 0.015 | 0.015 |
| C30 | 0.024 | 0.029 | 0.043 | 0.031 | 0.028 | 0.026 | 0.043 | 0.039 | 0.031 | 0.04 | 0.035 | 0.028 |
| C31 | 0.028 | 0.033 | 0.027 | 0.029 | 0.032 | 0.019 | 0.034 | 0.037 | 0.019 | 0.034 | 0.036 | 0.019 |
| C32 | 0.019 | 0.046 | 0.014 | 0.021 | 0.045 | 0.008 | 0.018 | 0.043 | 0.004 | 0.018 | 0.043 | 0.004 |
| C33 | 0.012 | 0.018 | 0.006 | 0.012 | 0.018 | 0.006 | 0.011 | 0.017 | 0.002 | 0.011 | 0.017 | 0.002 |
| C34 | 0.026 | 0.034 | 0.041 | 0.036 | 0.033 | 0.025 | 0.033 | 0.034 | 0.032 | 0.036 | 0.038 | 0.033 |
| C35 | 0.008 | 0.013 | 0.012 | 0.009 | 0.022 | 0.003 | 0.012 | 0.016 | 0.006 | 0.011 | 0.015 | 0.006 |
| C36 | 0.019 | 0.039 | 0.025 | 0.015 | 0.039 | 0.003 | 0.03 | 0.041 | 0.013 | 0.027 | 0.04 | 0.013 |
| C37 | 0.005 | 0.004 | 0.005 | 0.009 | 0.012 | 0.004 | 0.007 | 0.005 | 0.002 | 0.007 | 0.005 | 0.002 |
| C38 | 0.017 | 0.015 | 0.026 | 0.021 | 0.015 | 0.014 | 0.029 | 0.017 | 0.013 | 0.025 | 0.016 | 0.013 |
| C39 | 0.015 | 0.027 | 0.013 | 0.015 | 0.026 | 0.01 | 0.019 | 0.028 | 0.007 | 0.018 | 0.027 | 0.008 |
| C40 | 0.005 | 0.007 | 0.005 | 0.005 | 0.008 | 0.004 | 0.007 | 0.008 | 0.002 | 0.006 | 0.008 | 0.002 |
| C41 | 0.024 | 0.027 | 0.025 | 0.035 | 0.028 | 0.014 | 0.025 | 0.019 | 0.019 | 0.027 | 0.021 | 0.019 |
| C42 | 0.014 | 0.014 | 0.009 | 0.014 | 0.012 | 0.006 | 0.014 | 0.012 | 0.007 | 0.014 | 0.012 | 0.007 |
| C43 | 0.016 | 0.025 | 0.009 | 0.016 | 0.024 | 0.006 | 0.016 | 0.023 | 0.007 | 0.016 | 0.024 | 0.007 |
| C44 | 0.009 | 0.006 | 0.003 | 0.01 | 0.006 | 0.003 | 0.009 | 0.005 | 0.002 | 0.009 | 0.005 | 0.002 |
| C45 | 0.042 | 0.03 | 0.075 | 0.04 | 0.029 | 0.084 | 0.04 | 0.029 | 0.081 | 0.041 | 0.029 | 0.081 |
| C46 | 0.028 | 0.046 | 0.026 | 0.038 | 0.046 | 0.014 | 0.029 | 0.038 | 0.02 | 0.03 | 0.041 | 0.02 |
| C47 | 0.025 | 0.013 | 0.017 | 0.026 | 0.012 | 0.014 | 0.023 | 0.01 | 0.016 | 0.024 | 0.011 | 0.016 |
| C48 | 0.017 | 0.016 | 0.007 | 0.017 | 0.017 | 0.006 | 0.016 | 0.015 | 0.005 | 0.016 | 0.015 | 0.006 |
| Security Risk Rating | Risk Implications | Security Management Advice |
|---|---|---|
| Very low | No risk | To ensure safety |
| Slightly low | Basically no risk | Safer |
| Low | Less risky | Safe, but hidden |
| Medium | Average risk | Basic security, need to deal with hidden dangers |
| Slightly high | Should pay attention to risk | As soon as possible to eliminate the risk, which is not safe to be rectified |
| High | Higher risk | Should stop production for rectification |
| Very high | High risk | After rectification and acceptance can start |
| Weight Categories | Evaluation Object | Correlation | Grey Related Rating | TOPSIS Rating [51] | ||||||
|---|---|---|---|---|---|---|---|---|---|---|
| Very Low | Low | Slightly Low | Medium | Slightly High | High | Very High | ||||
| CW1 | Mine 1 | 0.7305 | 0.8524 | 0.8298 | 0.6962 | 0.5715 | 0.4686 | 0.3959 | Low | Slightly low |
| Mine 2 | 0.5072 | 0.6429 | 0.7804 | 0.8382 | 0.7078 | 0.5556 | 0.4417 | Medium | Slightly low | |
| Mine 3 | 0.5279 | 0.6577 | 0.7753 | 0.8079 | 0.7312 | 0.5639 | 0.4494 | Medium | Slightly low | |
| CW2 | Mine 1 | 0.7283 | 0.8567 | 0.8393 | 0.6979 | 0.5654 | 0.4635 | 0.3921 | Low | Slightly low |
| Mine 2 | 0.5015 | 0.6368 | 0.7786 | 0.8494 | 0.7060 | 0.5488 | 0.4361 | Medium | Medium | |
| Mine 3 | 0.5208 | 0.6497 | 0.7754 | 0.8205 | 0.7421 | 0.5661 | 0.4505 | Medium | Medium | |
| CW3 | Mine 1 | 0.7425 | 0.8590 | 0.8240 | 0.6860 | 0.5632 | 0.4632 | 0.3924 | Low | Slightly low |
| Mine 2 | 0.5068 | 0.6439 | 0.7904 | 0.8426 | 0.7068 | 0.5537 | 0.4404 | Medium | Slightly low | |
| Mine 3 | 0.5211 | 0.6502 | 0.7740 | 0.8131 | 0.7364 | 0.5671 | 0.4517 | Medium | Slightly low | |
| CW4 | Mine 1 | 0.7394 | 0.8583 | 0.8267 | 0.6891 | 0.5644 | 0.4638 | 0.3928 | Low | Slightly low |
| Mine 2 | 0.5061 | 0.6429 | 0.7875 | 0.8433 | 0.7072 | 0.5536 | 0.4403 | Medium | Slightly low | |
| Mine 3 | 0.5216 | 0.6508 | 0.7748 | 0.8143 | 0.7365 | 0.5661 | 0.4509 | Medium | Slightly low | |
| Weight Categories | Evaluation Object | Correlation | Grey Related Rating | TOPSIS Rating [51] | ||||||
|---|---|---|---|---|---|---|---|---|---|---|
| Very Low | Low | Slightly Low | Medium | Slightly High | High | Very High | ||||
| CW1 | Mine 1 | 0.7501 | 0.8601 | 0.8301 | 0.6895 | 0.5559 | 0.4575 | 0.3886 | Low | Low |
| Mine 2 | 0.5189 | 0.6494 | 0.7722 | 0.8290 | 0.7212 | 0.5611 | 0.4456 | Medium | Slightly low | |
| Mine 3 | 0.5433 | 0.5433 | 0.7570 | 0.7996 | 0.7417 | 0.5743 | 0.4578 | Medium | Slightly low | |
| CW2 | Mine 1 | 0.7449 | 0.8575 | 0.8339 | 0.6941 | 0.5563 | 0.4572 | 0.3881 | Low | Low |
| Mine 2 | 0.5161 | 0.6460 | 0.7685 | 0.8312 | 0.7218 | 0.5603 | 0.4447 | Medium | Slightly low | |
| Mine 3 | 0.5403 | 0.6487 | 0.7543 | 0.8045 | 0.7497 | 0.5784 | 0.4604 | Medium | Slightly low | |
| CW3 | Mine 1 | 0.7511 | 0.8581 | 0.8273 | 0.6884 | 0.5560 | 0.4577 | 0.3887 | Low | Low |
| Mine 2 | 0.5202 | 0.6512 | 0.7753 | 0.8291 | 0.7202 | 0.5614 | 0.4461 | Medium | Slightly low | |
| Mine 3 | 0.5419 | 0.6506 | 0.7537 | 0.7994 | 0.7434 | 0.5757 | 0.4586 | Medium | Slightly low | |
| CW4 | Mine 1 | 0.7493 | 0.8579 | 0.8301 | 0.6898 | 0.5560 | 0.4575 | 0.3885 | Low | Low |
| Mine 2 | 0.5190 | 0.6497 | 0.7737 | 0.8308 | 0.7205 | 0.5607 | 0.4454 | Medium | Slightly low | |
| Mine 3 | 0.5413 | 0.6497 | 0.7537 | 0.8014 | 0.7450 | 0.5758 | 0.4587 | Medium | Slightly low | |
| Weight Categories | Evaluation Object | Correlation | Grey Related Rating | TOPSIS Rating [51] | ||||||
|---|---|---|---|---|---|---|---|---|---|---|
| Very Low | Low | Slightly Low | Medium | Slightly High | High | Very High | ||||
| CW1 | Mine 1 | 0.827 | 0.8625 | 0.7799 | 0.6386 | 0.5263 | 0.4411 | 0.3795 | Lower | Very low |
| Mine 2 | 0.6346 | 0.7479 | 0.7883 | 0.7856 | 0.6498 | 0.5158 | 0.4210 | Slightly low | Low | |
| Mine 3 | 0.6392 | 0.7435 | 0.7628 | 0.7637 | 0.6855 | 0.5357 | 0.4358 | Slightly low | Low | |
| CW2 | Mine 1 | 0.8202 | 0.8433 | 0.7695 | 0.6476 | 0.5374 | 0.4485 | 0.3843 | Low | Very low |
| Mine 2 | 0.6606 | 0.7677 | 0.7750 | 0.7605 | 0.6423 | 0.5195 | 0.4254 | Slightly low | Very low | |
| Mine 3 | 0.6726 | 0.7739 | 0.7646 | 0.7436 | 0.6612 | 0.5233 | 0.4291 | Low | Very low | |
| CW3 | Mine 1 | 0.8246 | 0.8511 | 0.7793 | 0.6439 | 0.5309 | 0.4443 | 0.3816 | Low | Very low |
| Mine 2 | 0.6568 | 0.7654 | 0.7814 | 0.7737 | 0.6362 | 0.5088 | 0.4174 | Slightly low | Low | |
| Mine 3 | 0.6662 | 0.7673 | 0.7626 | 0.7520 | 0.6704 | 0.5250 | 0.4293 | Low | Low | |
| CW4 | Mine 1 | 0.8243 | 0.8511 | 0.7794 | 0.6438 | 0.5317 | 0.4447 | 0.3819 | Low | Very low |
| Mine 2 | 0.6569 | 0.7652 | 0.7804 | 0.7721 | 0.6379 | 0.5106 | 0.4187 | Slightly low | Low | |
| Mine 3 | 0.6666 | 0.7677 | 0.7628 | 0.7512 | 0.6694 | 0.5254 | 0.4296 | Low | Low | |
© 2020 by the authors. Licensee MDPI, Basel, Switzerland. This article is an open access article distributed under the terms and conditions of the Creative Commons Attribution (CC BY) license (http://creativecommons.org/licenses/by/4.0/).
Share and Cite
Dong, G.; Wei, W.; Xia, X.; Woźniak, M.; Damaševičius, R. Safety Risk Assessment of a Pb-Zn Mine Based on Fuzzy-Grey Correlation Analysis. Electronics 2020, 9, 130. https://doi.org/10.3390/electronics9010130
Dong G, Wei W, Xia X, Woźniak M, Damaševičius R. Safety Risk Assessment of a Pb-Zn Mine Based on Fuzzy-Grey Correlation Analysis. Electronics. 2020; 9(1):130. https://doi.org/10.3390/electronics9010130
Chicago/Turabian StyleDong, Guofang, Wei Wei, Xu Xia, Marcin Woźniak, and Robertas Damaševičius. 2020. "Safety Risk Assessment of a Pb-Zn Mine Based on Fuzzy-Grey Correlation Analysis" Electronics 9, no. 1: 130. https://doi.org/10.3390/electronics9010130