Article

The Design of Intelligent Building Lighting Control System Based on CNN in Embedded Microprocessor

1
School of Civil Engineering, Xi’an University of Architecture and Technology, Xi’an 710055, China
2
School of Information and Control Engineering, Xi’an University of Architecture and Technology, Xi’an 710055, China
*
Author to whom correspondence should be addressed.
Electronics 2023, 12(7), 1671; https://doi.org/10.3390/electronics12071671
Submission received: 12 January 2023 / Revised: 25 February 2023 / Accepted: 26 February 2023 / Published: 31 March 2023
(This article belongs to the Special Issue Heterogeneous and Parallel Computing for Cyber Physical Systems)

Abstract

:
A convolutional neural network (CNN) was designed and built on an embedded building lighting control system to determine whether the application of CNN could increase the accuracy of image recognition and reduce energy consumption. Currently, lighting control systems rely mainly on information technology, with sensors to detect people’s existence or absence in an environment. However, due to the deviation of this perception, the accuracy of image detection is not high. In order to validate the effectiveness of the new system based on CNN, an experiment was designed and operated. The importance of the research lies in the fact that high image detection would bring in less energy consumption. The result of the experiment indicated that, when comparing the actual position with the positioning position, the difference was between 0.01 to 0.20 m, indicating that the image recognition accuracy of the CNN-based embedded control system was very high. Moreover, comparing the luminous flux of the designed system with natural light and the designed system without natural light with the system without intelligent control, the energy savings is about 40%.

1. Introduction

With the development of the Internet of Things technology, the demand for energy savings and comfortable lighting environments has become stronger. Currently, lighting control systems rely mainly on information technology, with sensors to detect people’s existence or absence in an environment. However, due to the deviation of this perception, the accuracy of image detection is not high, and the recognition failure would cause operation errors and energy waste. The present research attempted to solve the problem by designing an intelligent lighting control system based on the CNN software built into an embedded lighting system.
The concept of CNN is relatively new, especially in the field of building lighting control. In machine learning, CNN is a type of artificial neural network where the individual neurons are tiled with the overlapping regions in the visual field to recognize images and objects and thus classify the input, such as biological processes. An embedded system is an intelligent micro-control platform embedded with a specific chip in a computer to deal with various control tasks. The embedded system is selected because it is comparatively small and convenient to control the lighting system, either manually or automatically, in a remote area.
An experiment was constructed based on the design to validate the effectiveness of the CNN-based system. The article started by introducing background information and related work, followed by a detailed description of the design. Some underlined principles and calculations were made in the design to serve as a modest spur for further research. Then, the experiment was constructed to find out how the designed system worked. Data analysis and discussion were made before concluding.

2. The Background and Related Work

2.1. Background

2.1.1. Embedded System

An embedded system is an intelligent micro-control platform embedded with a specific chip in a computer to deal with various detective tasks. Since 2014, NVIDIA has developed a series of embedded modules, such as Jeston TK1 and TK2, Nano and so on, and currently, Jesto is the most widely used embedded intelligent processor to recognize human faces and behavior.

2.1.2. CNN

In machine learning, CNN is a type of deep learning artificial neural network where the individual neurons are tiled with the overlapping regions in the visual field to recognize images and objects and classify the input, such as real biological processes. The purpose of applying CNN to recognize images is to extract a minutia of input pictures to replace the traditional extraction methods that rely on the human-designed minutia operator. The problem with traditional operators is that it is very complicated and almost impossible to consider endless scenes for an operator designer, whereas CNN can learn to extract features of an image automatically through sample training. Moreover, with its special shared weight structure, CNN can simplify the complexity of multi-layer perceptron, as each neuron can perceive a part of an image area and transmit it to the higher layer to make a complete picture. As a result, the accuracy of recognition has greatly increased.

2.2. The Related Work

2.2.1. The Development of Building Lighting Control Methods

Building lighting control is not an area that developed quickly. Nowadays, the manual control of “on and off ” switches are still widely used at home, in offices, classrooms and many other places. The motivation for change came from two urgent demands: (1) energy savings and (2) people’s pursuit of a more comfortable lighting environment. Therefore, the control methods moved gradually from manual to automatic mode.

2.2.2. Manual Control

There are different types of manual control. Aside from the on and off switches used in daily life, industrial fields and high-rise buildings, bus control, wireless control and mobile control are the main control methods. Bus control is often used in industry because of its high transmission safety, strong anti-interference ability and fast transmission speed [1]. However, there are various problems with bus control, such as more complicated circuits, more difficult installation and more future maintenance and improvement [2]. Wireless control solves complicated wiring problems, troublesome installation and its difficulty in maintenance and improvement in bus control, but only to a certain extent [3]. Given that the number of lines, layout and controller location can be placed at will, wireless control has greater flexibility and arbitrariness and solves the trouble of entangled wires in the control system [4]. With the widespread use of mobile phones, lighting control systems based on mobile internet connections have become increasingly popular and are gradually recognized by the market. The advantages of mobile phone control lie in the convenient remote control of lighting equipment in different regions via a connection to the internet and the view of a monitor at any time on the mobile phone [5].

2.2.3. Automatic Control

Automatic control can be used almost anywhere. The development of automatic control is owed to the application of sensors, a device that can receive a signal or stimulus, such as light, heat, pressure etc., and transmit the corresponding output as an electric or optical signal to the light control system to recognize images. Now, sensors are widely used in automatic lighting control systems to regulate monitoring operations and free people’s monitoring and viewing [6]. Obviously, this is a very common and basic use of sensors. The disadvantage is that the degree of automation is not high, and errors occur from time to time due to the limitation of sensors [7]. There is a great diversity of sensors. For example, a far infrared sensor can be used to detect movement inside an object [8]. Sound sensors can detect the frequency and vibration of the received sound by induction [9]. However, this induction has great uncertainty; thus, it cannot realize the automatic lighting control, such as when people are inside, the light is on, and when people leave the light off [10].
With artificial intelligence technology and convolutional neural network, modeling recognition can be realized first so that the model can fully conform to the image characteristics of the objects in the recognition area [11]. Then, according to the characteristics of the model, it can search engines for the recognized images [12]. After a comprehensive analysis of the search situation, the identification situation is obtained [13].

2.2.4. Modeling Recognition Technology

Modeling recognition technology is most widely used to recognize relatively simple images. If the image is more complex, this recognition method will cause recognition failure or error [14]. Additionally, it is very difficult to analyze the time cost in the model manually [15]. This is because when the target object shows different sizes in the image, it will be more difficult to search for the target object; therefore, more time will be needed, and the energy consumption will be greater [16]. The problem in manual modeling can be solved by feature matching, for it can reduce the time cost of manual modeling and greatly decrease the technical difficulties. At the same time, this recognition technology can detect a relatively small impact on the size of the target object [17]. However, if the shape of the target object is relatively ordinary and the features are not relatively enough, the recognition effect of feature matching is not good enough [18].

2.2.5. Deep Learning Technology

Deep learning technology is a relatively advanced artificial intelligence technology and has developed rapidly in recent years. CNN was developed from deep learning [19]. It has become more popular, and manually calculating digital information has become unnecessary. This is because computer-backed propagation algorithms can better match the data parameters and the characteristics of the target images in the model.
With the development of a deep convolution neural network, many researchers have successfully applied deep convolution neural networks to face recognition, and the best recognition rate exceeds 99.47%, surpassing the performance of traditional algorithms and human eyes [20]. As more network layers can obtain the image information of the target object from different angles, the image information of the target object becomes complete, and the sound, accuracy and searching effect for images is improved. However, it is still under development, and the desire for more research and experiments to validate its effectiveness and efficiency exists [21]. In applying a deep convolution neural network to face recognition, the training of a deep convolution neural network requires a large amount of data because it has strong robustness to the changes of face illumination, posture and expression. Therefore, more experiments on large database images should be conducted for further verification.

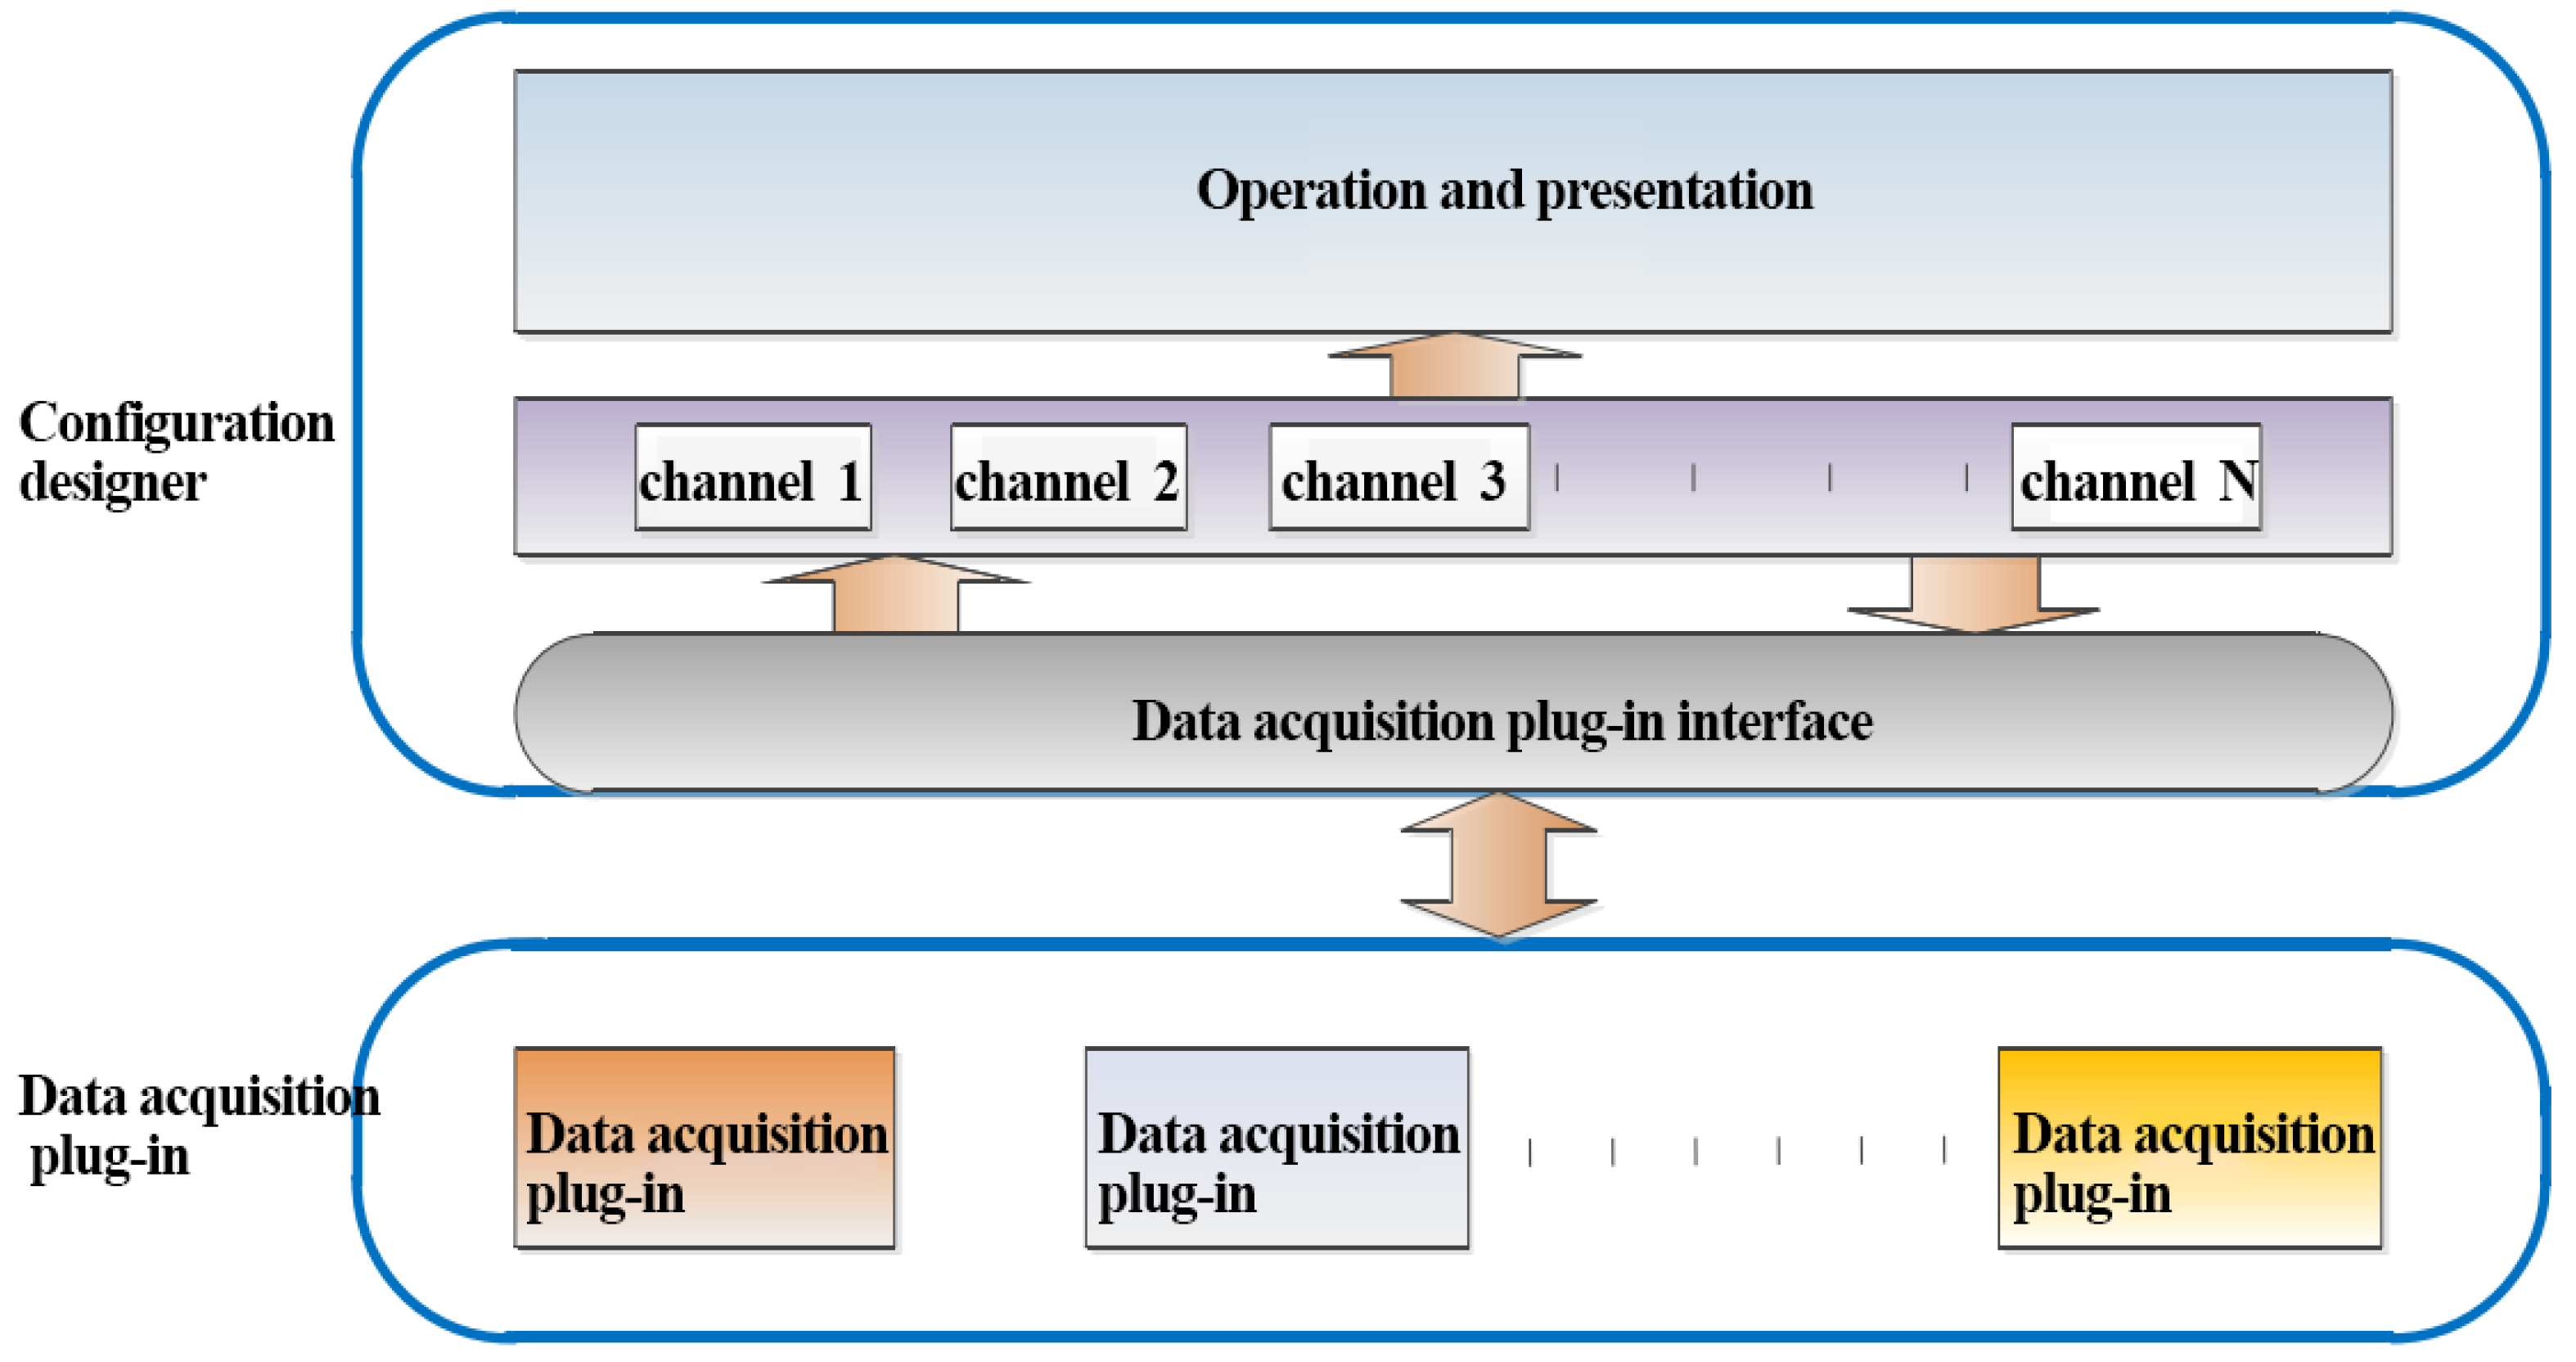
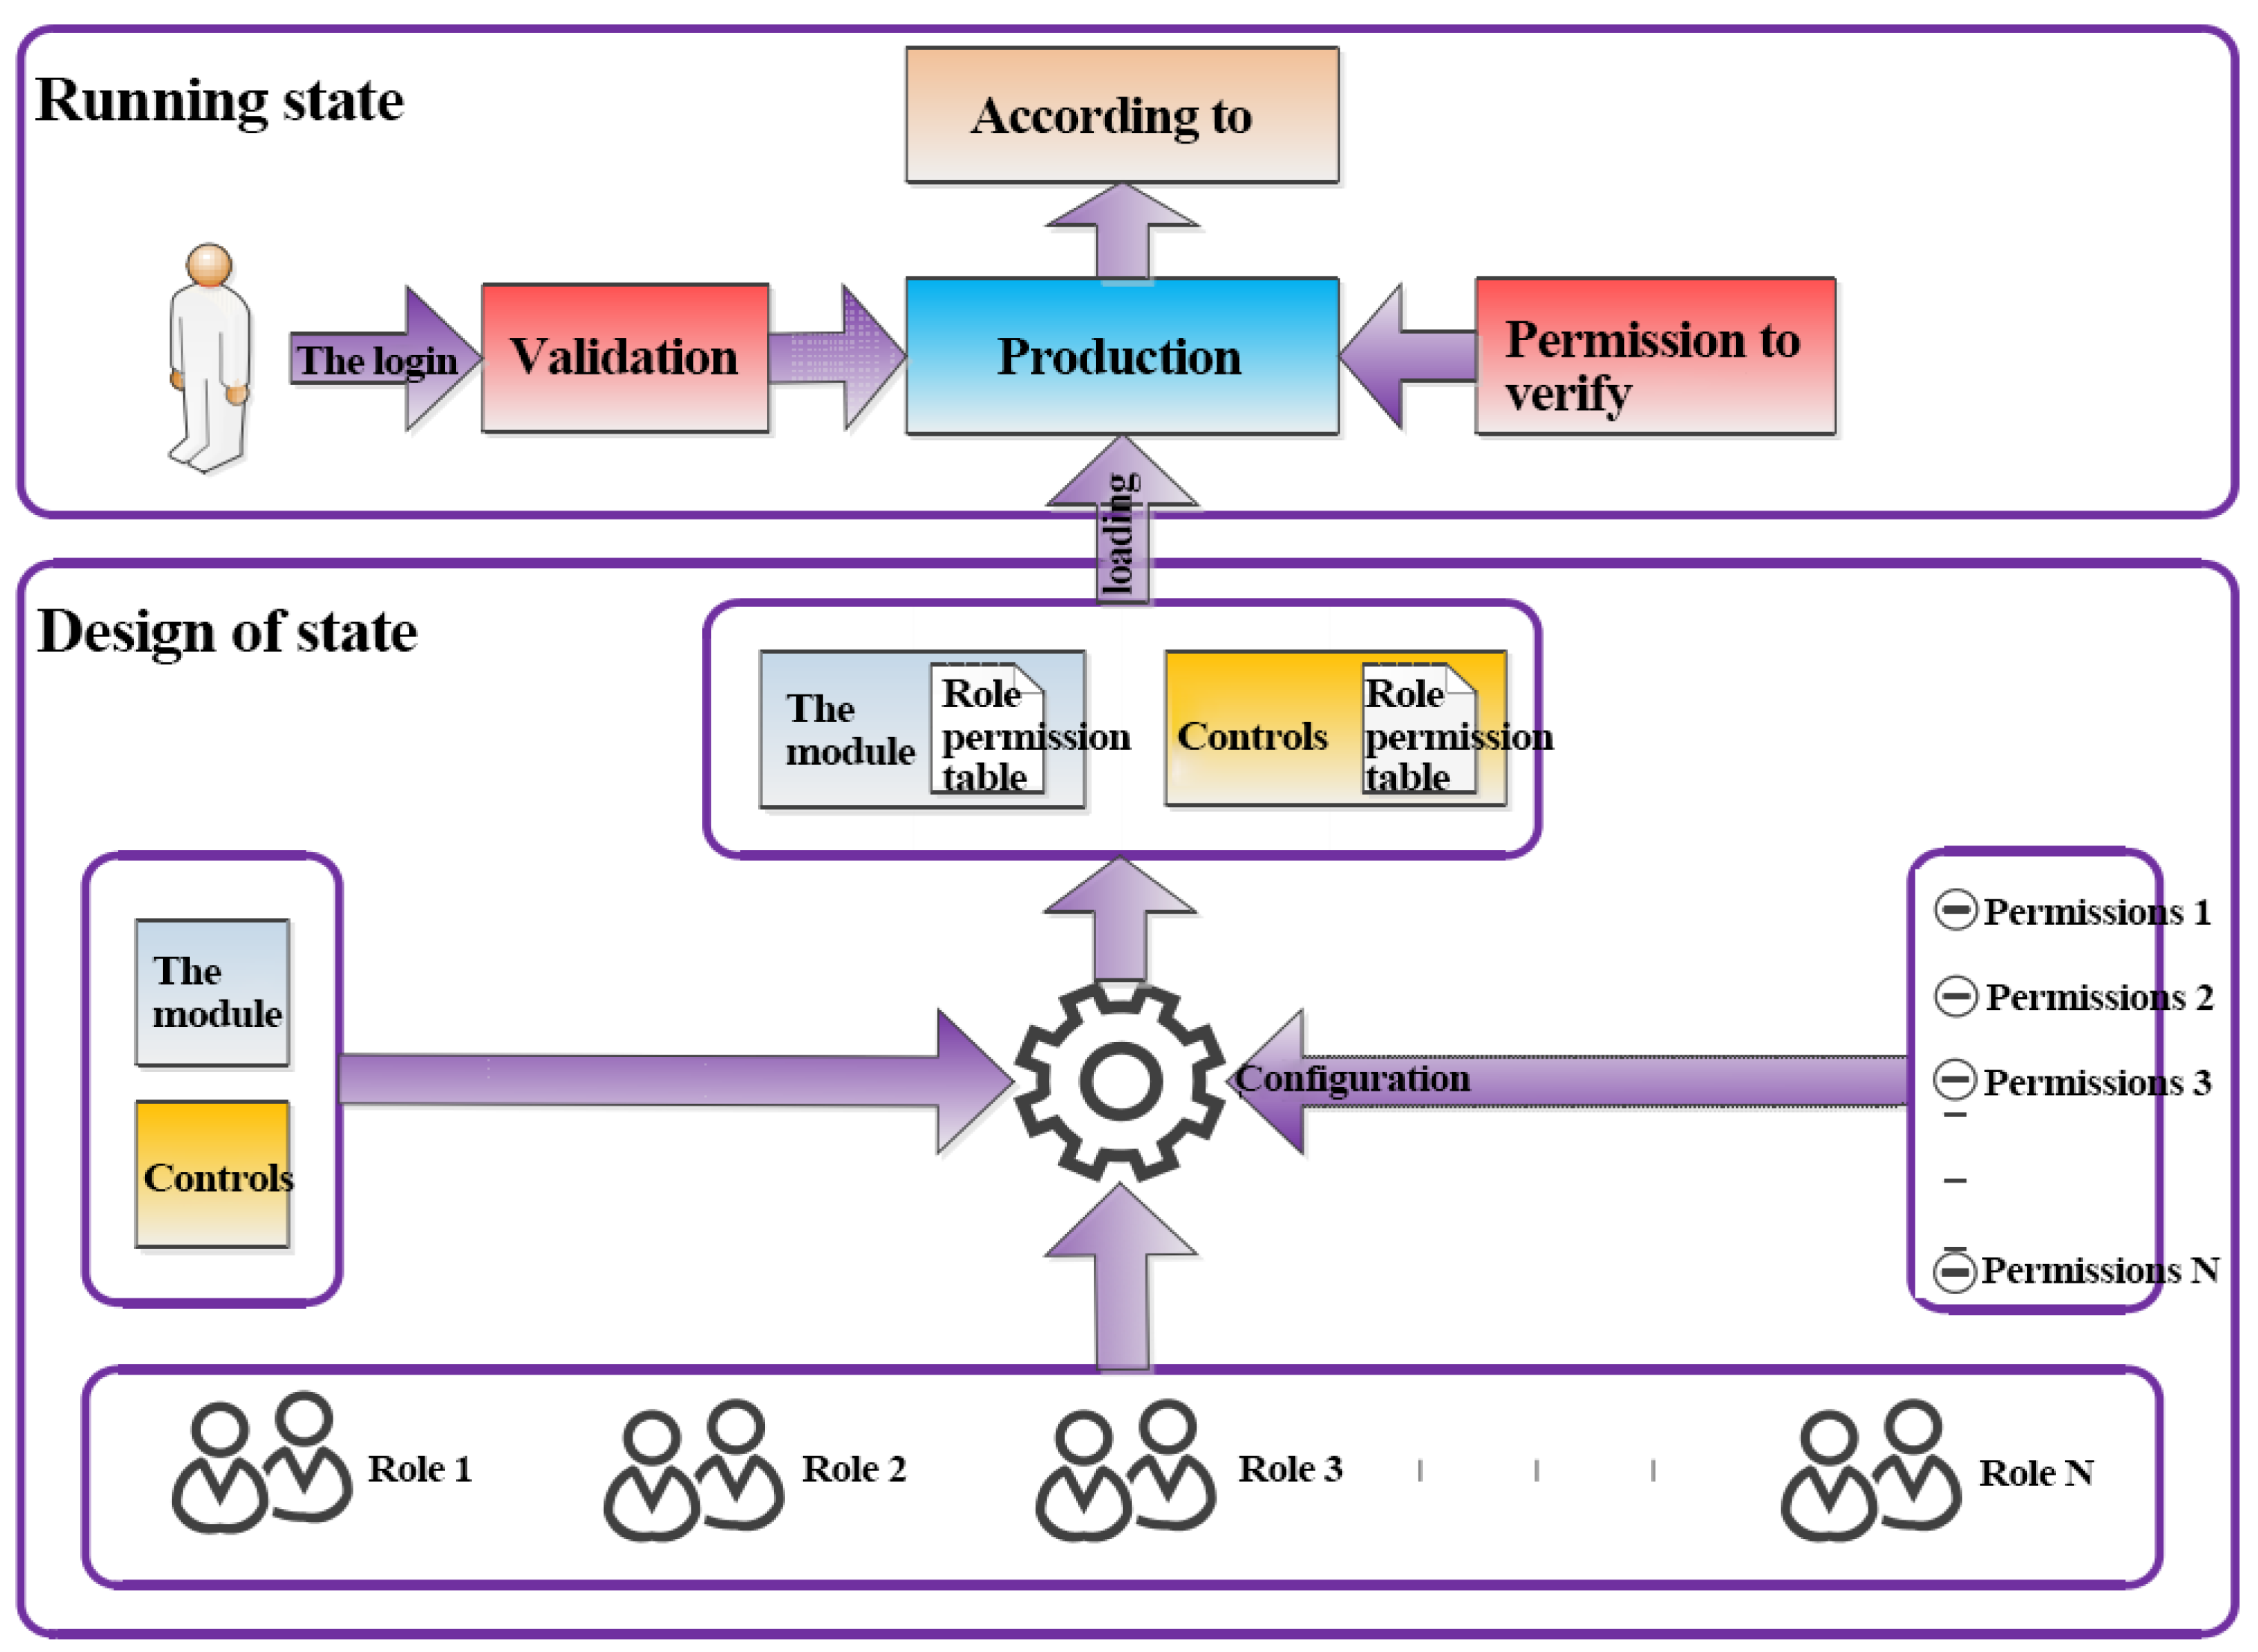
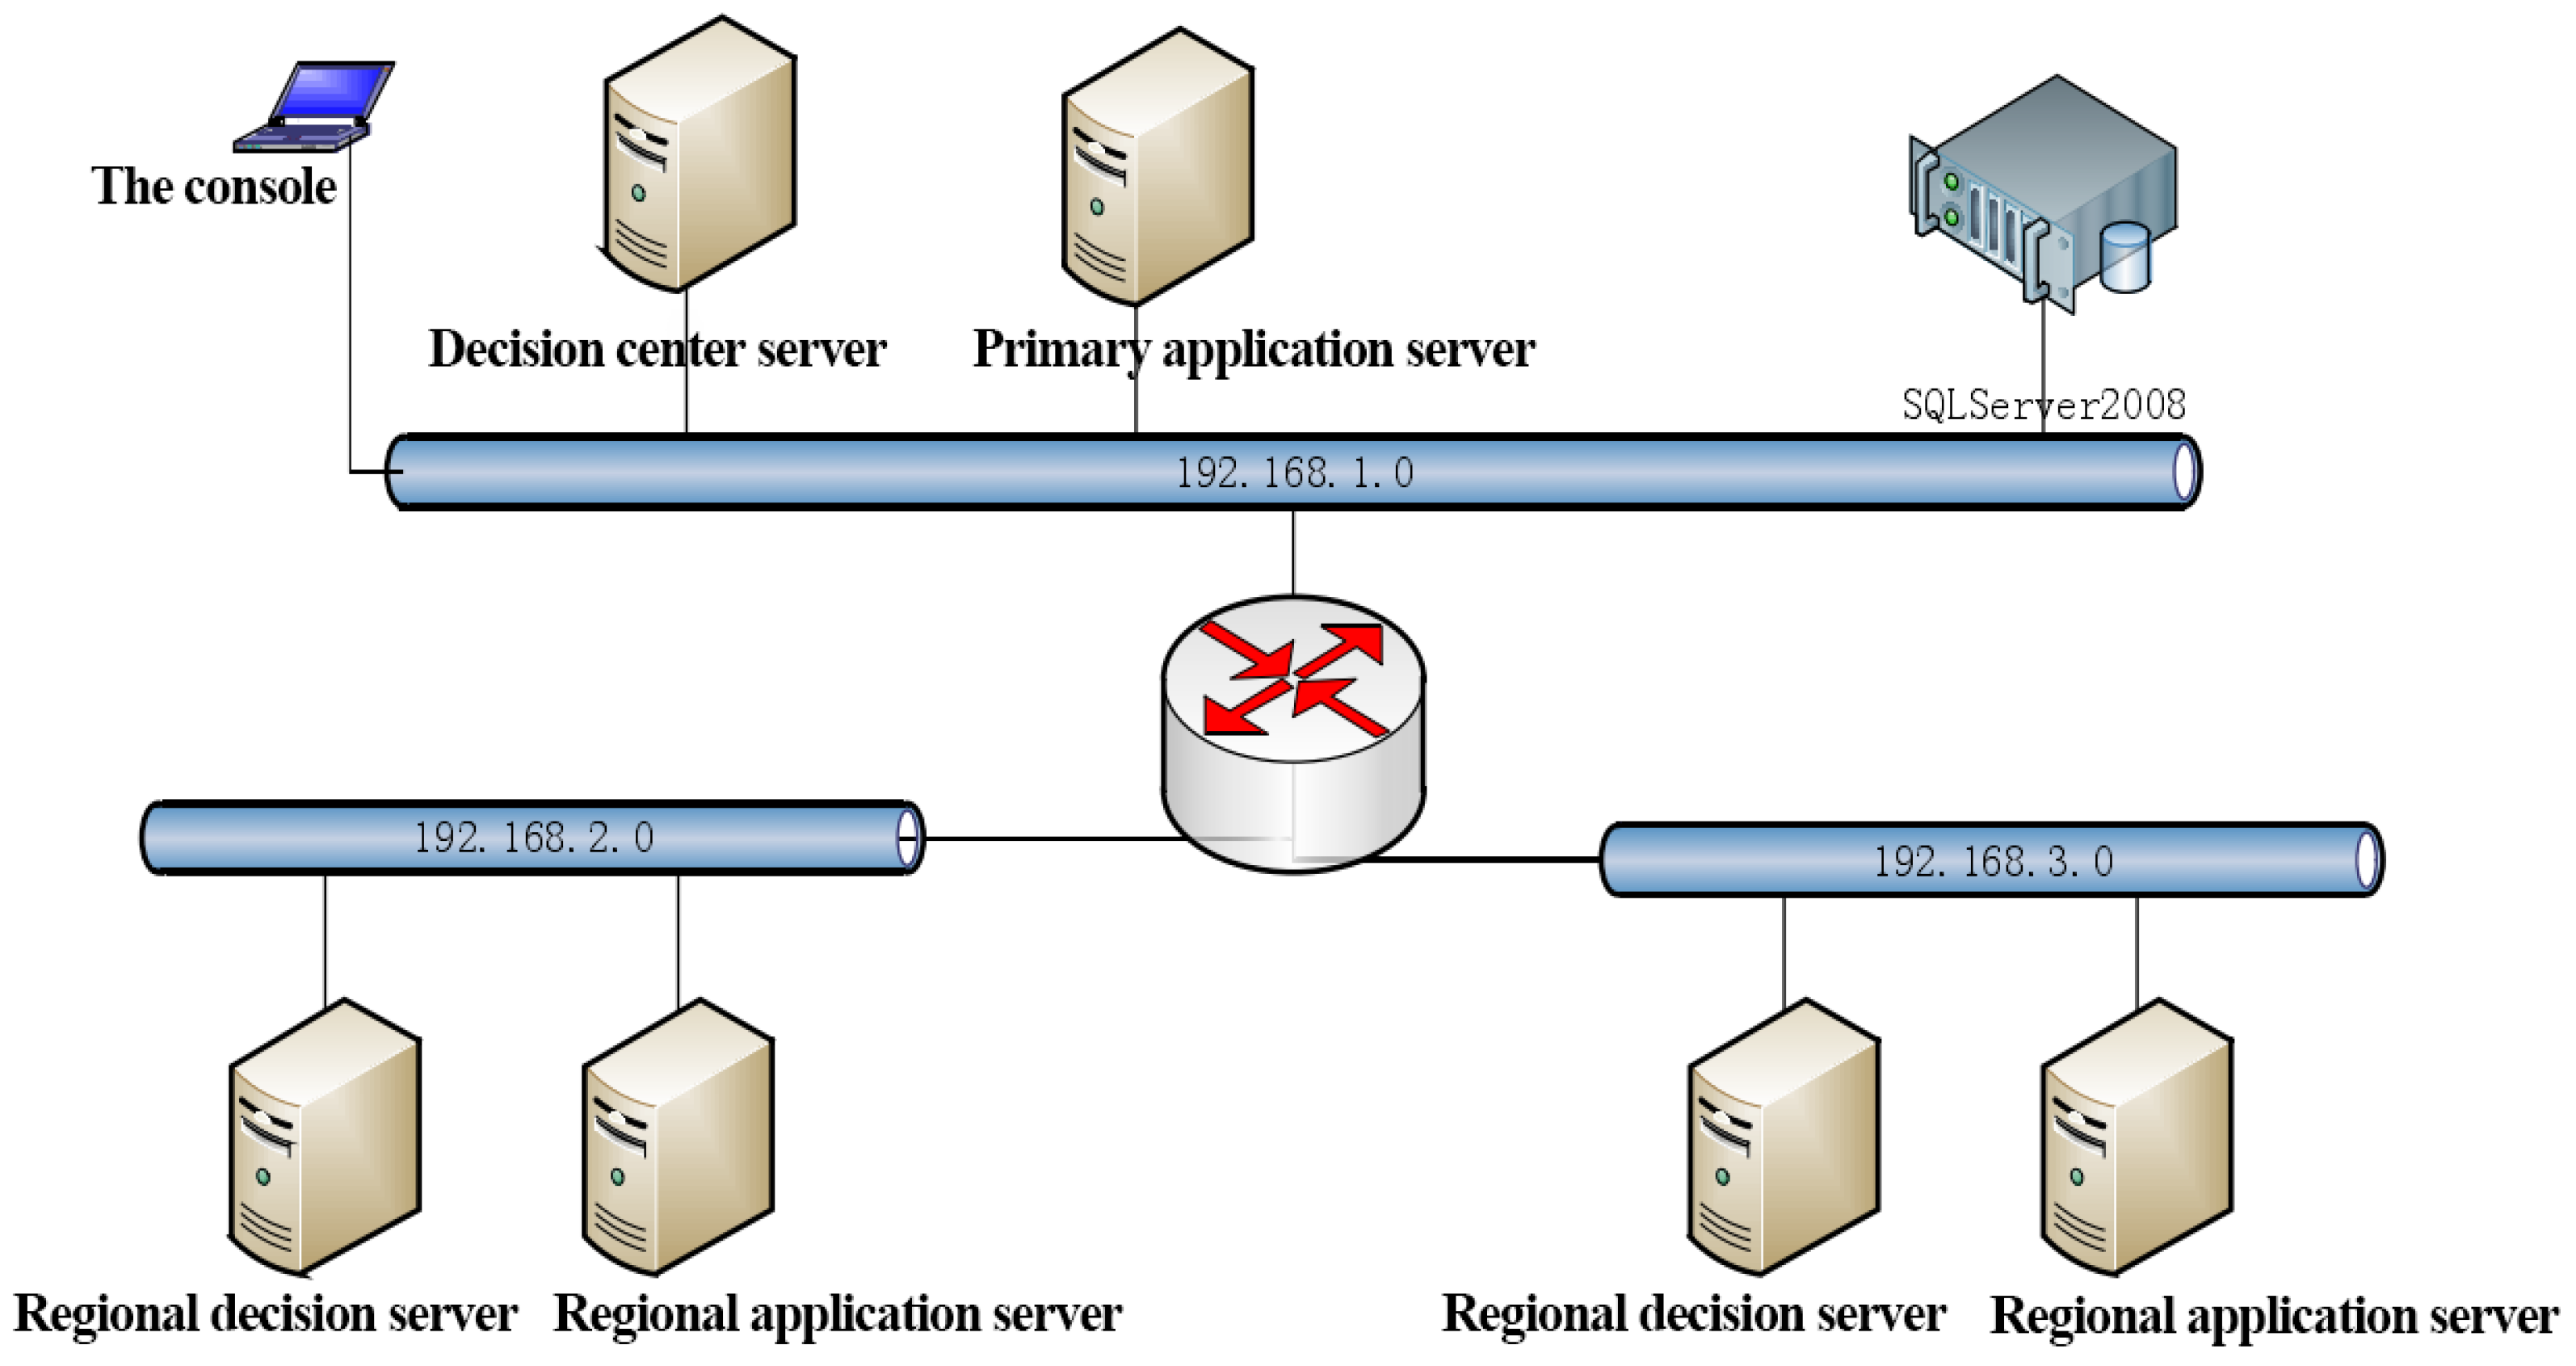
3. Design Details of the Embedded Lighting Control System

Our design proposes an intelligent lighting control system based on CNN within an embedded platform to realize photoelectric image recognition, with the aim of improving the accuracy of image detection with the sensor-based system. The details of the design are explained by considering three aspects: (1) a basic lighting control system; (2) the model of the distributed system; (3) basic working principles.

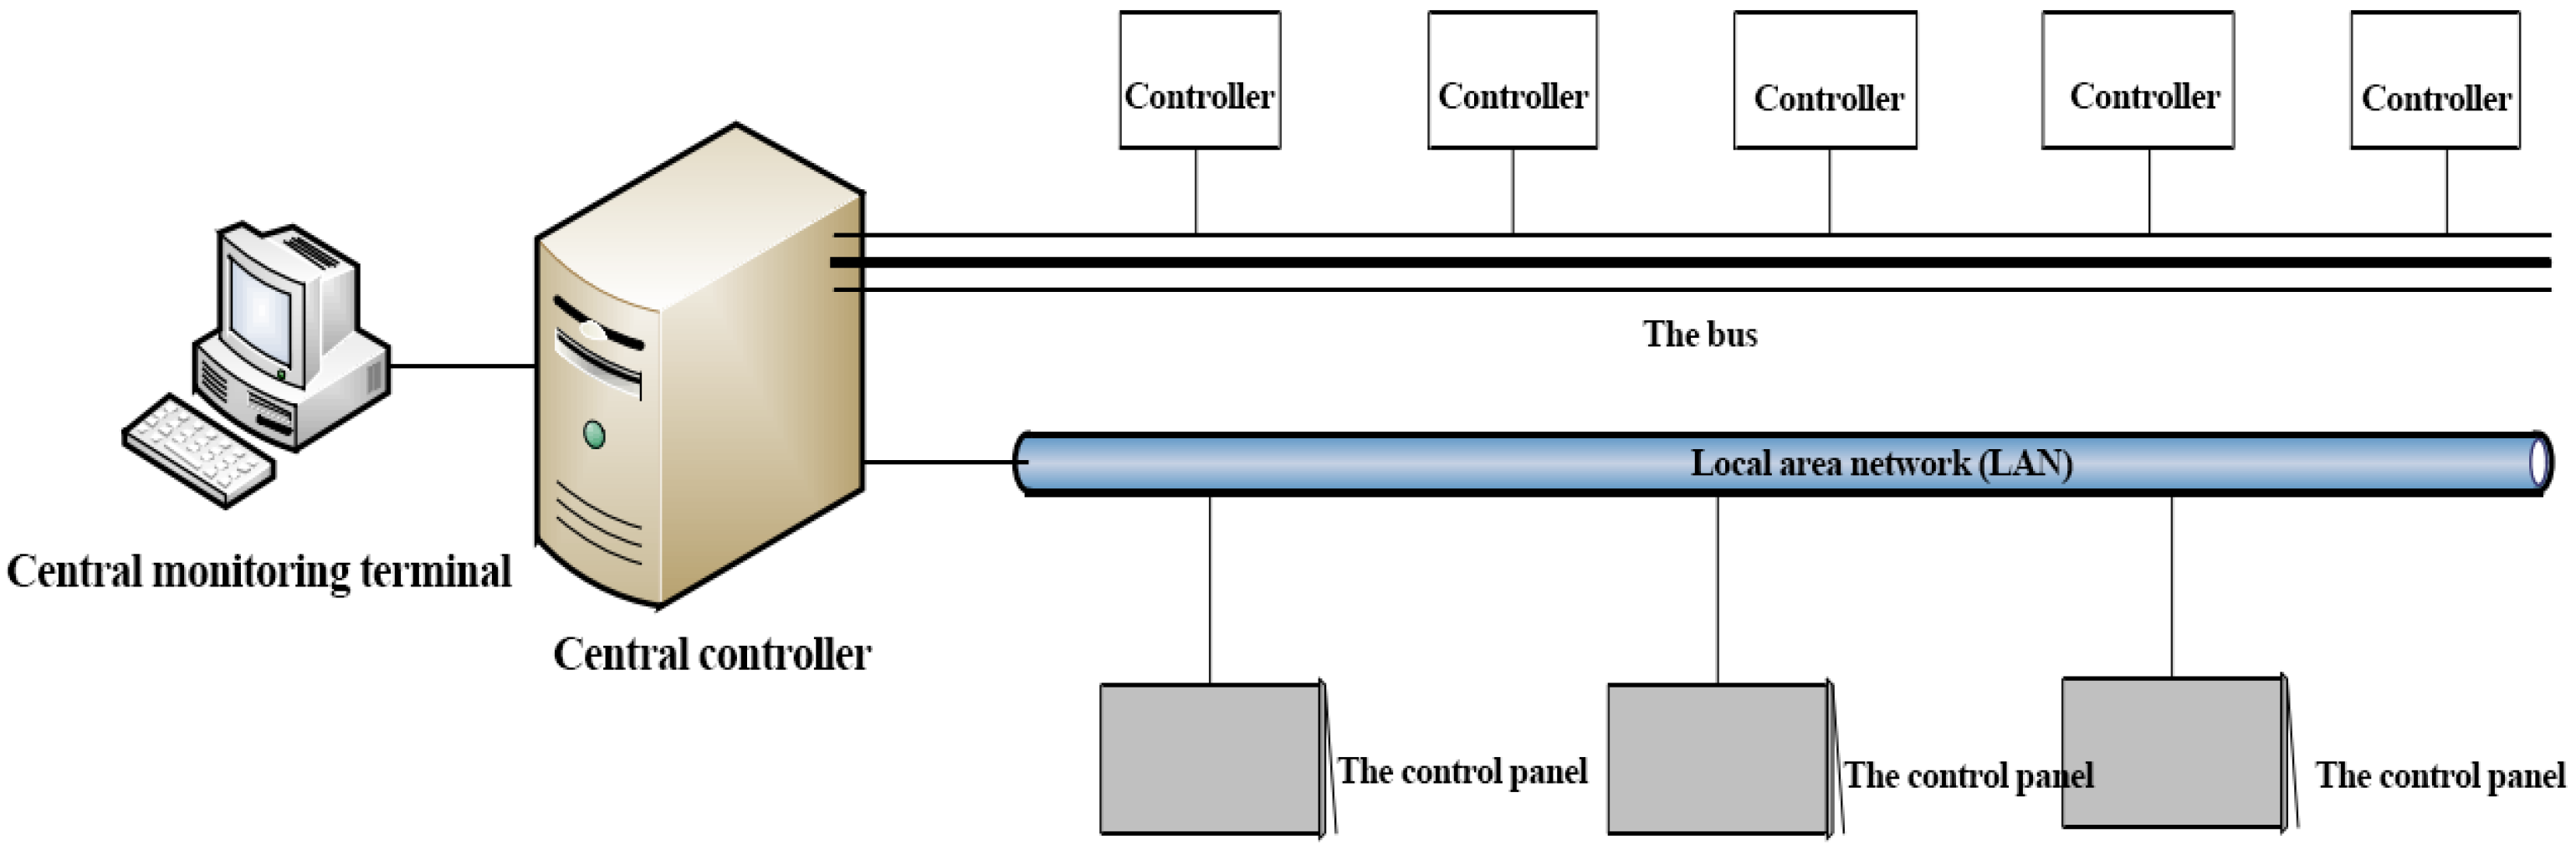
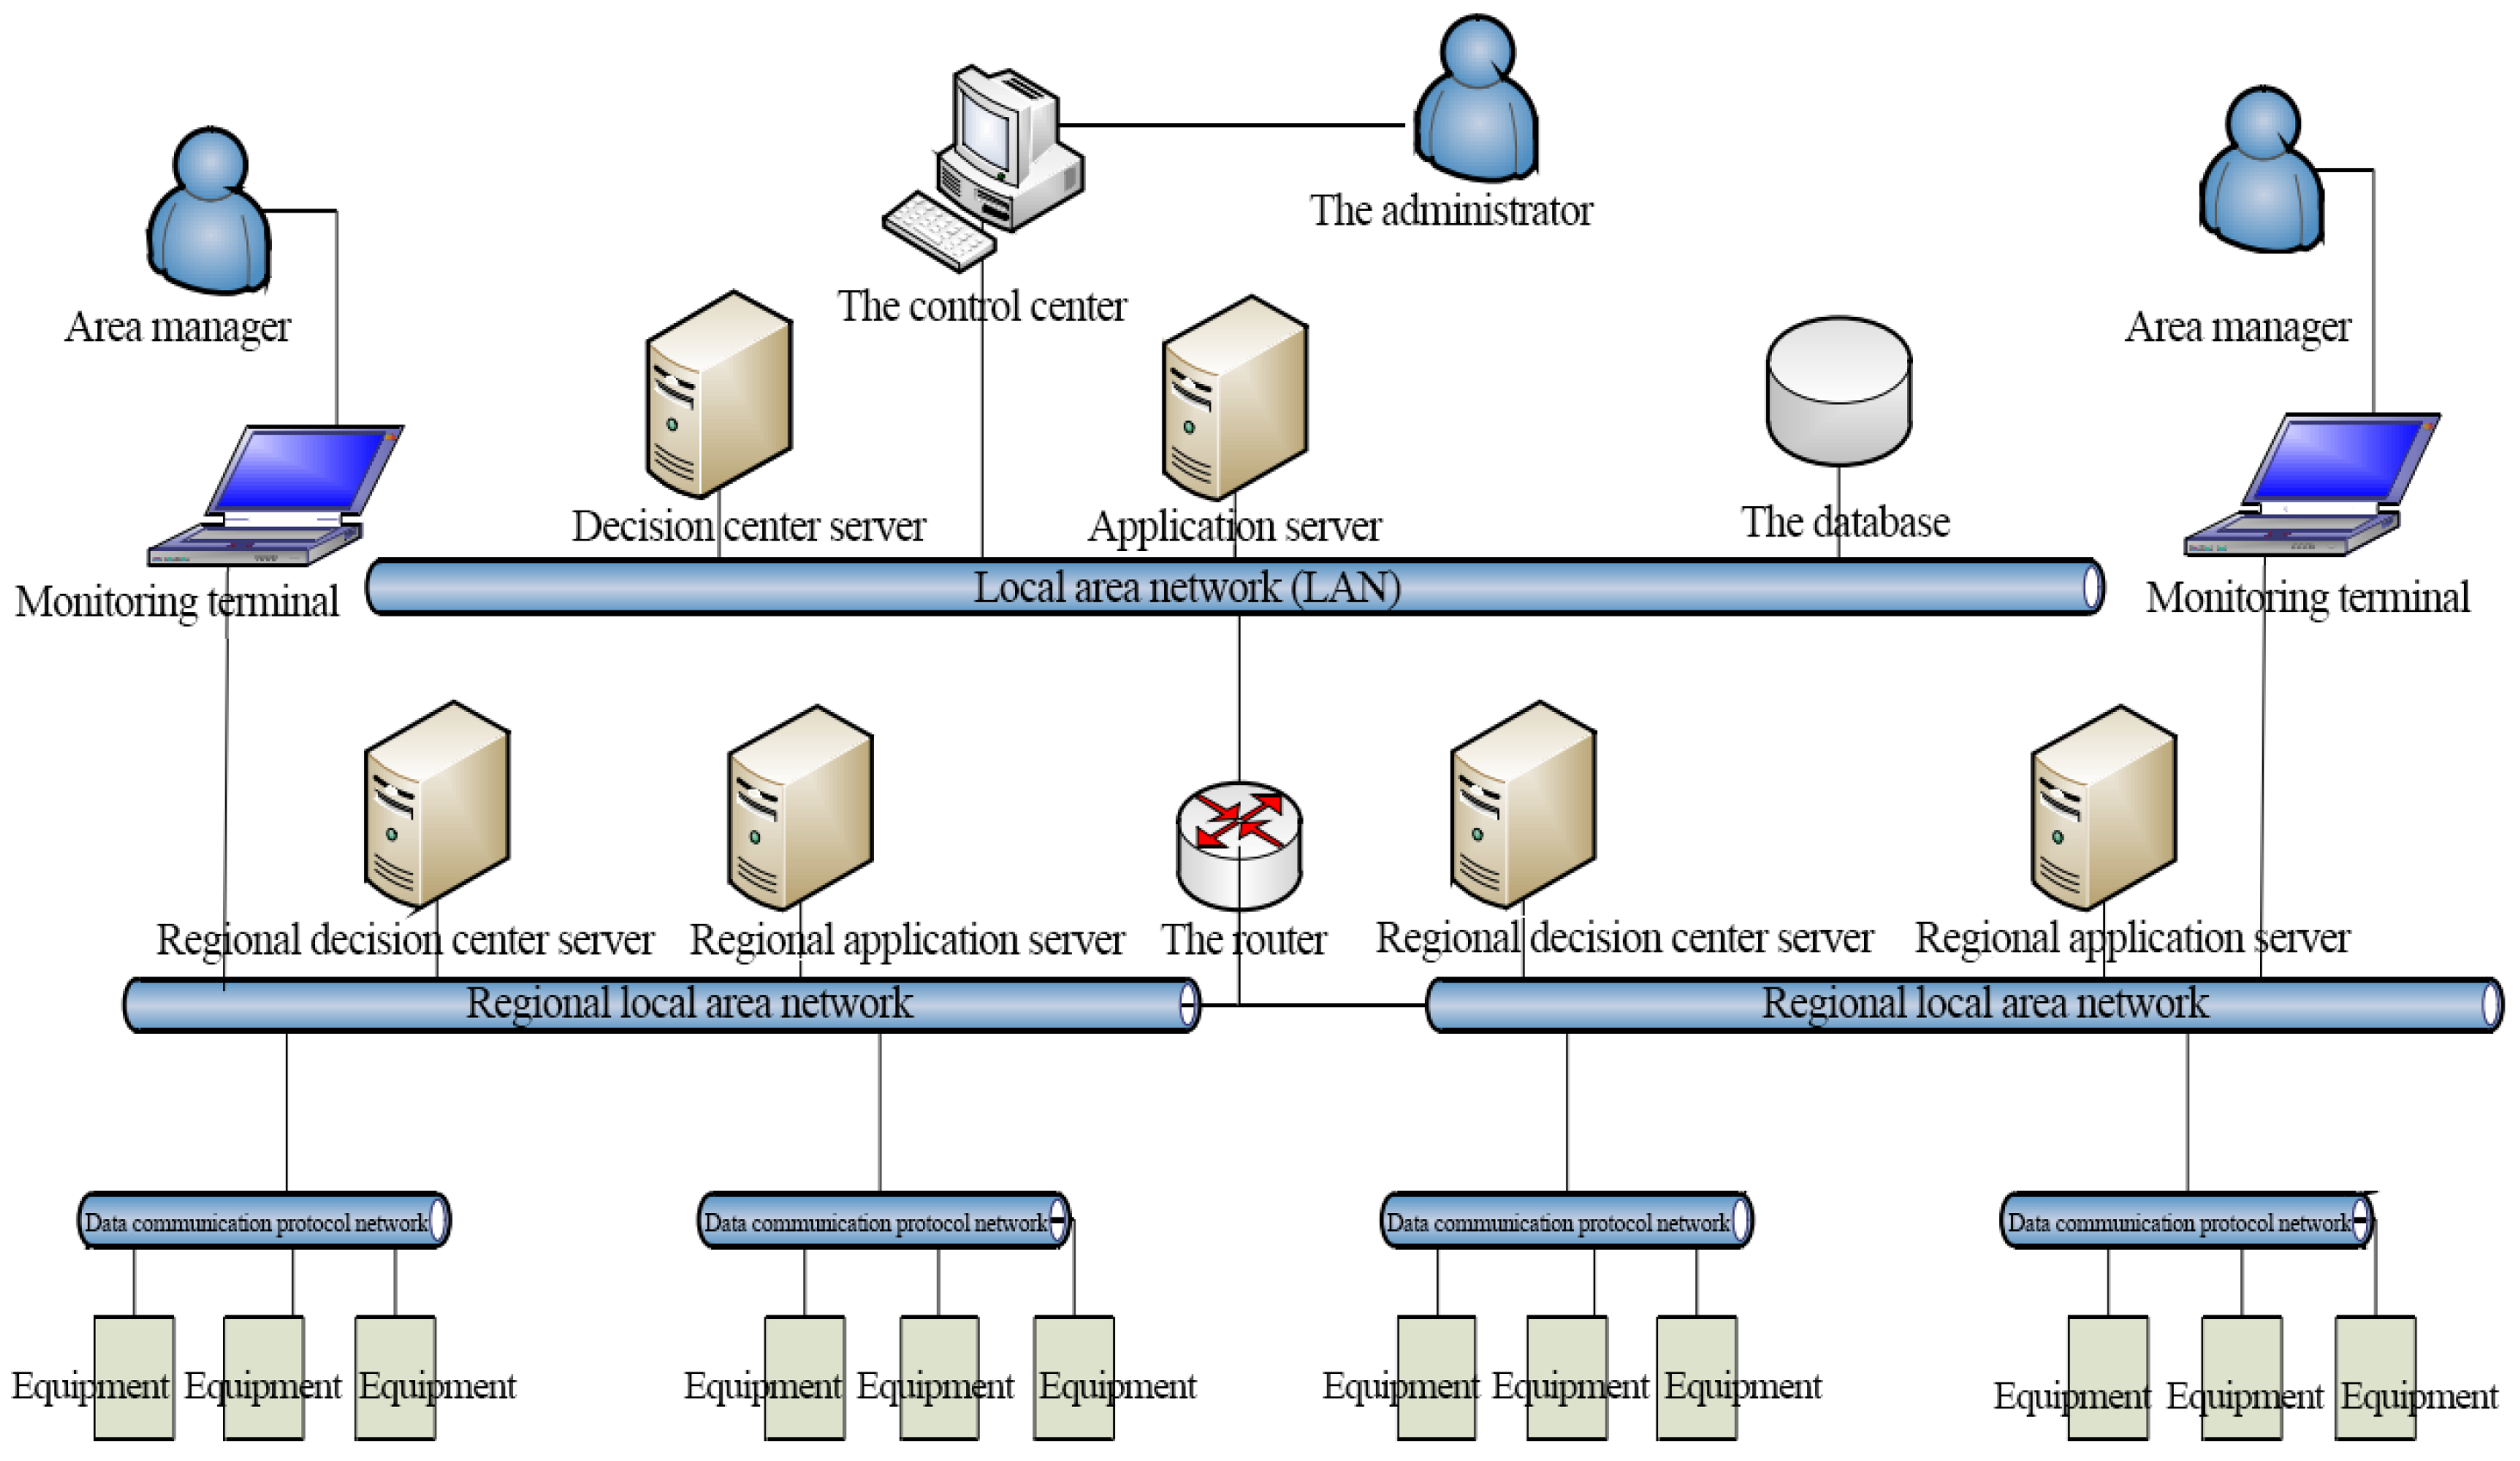
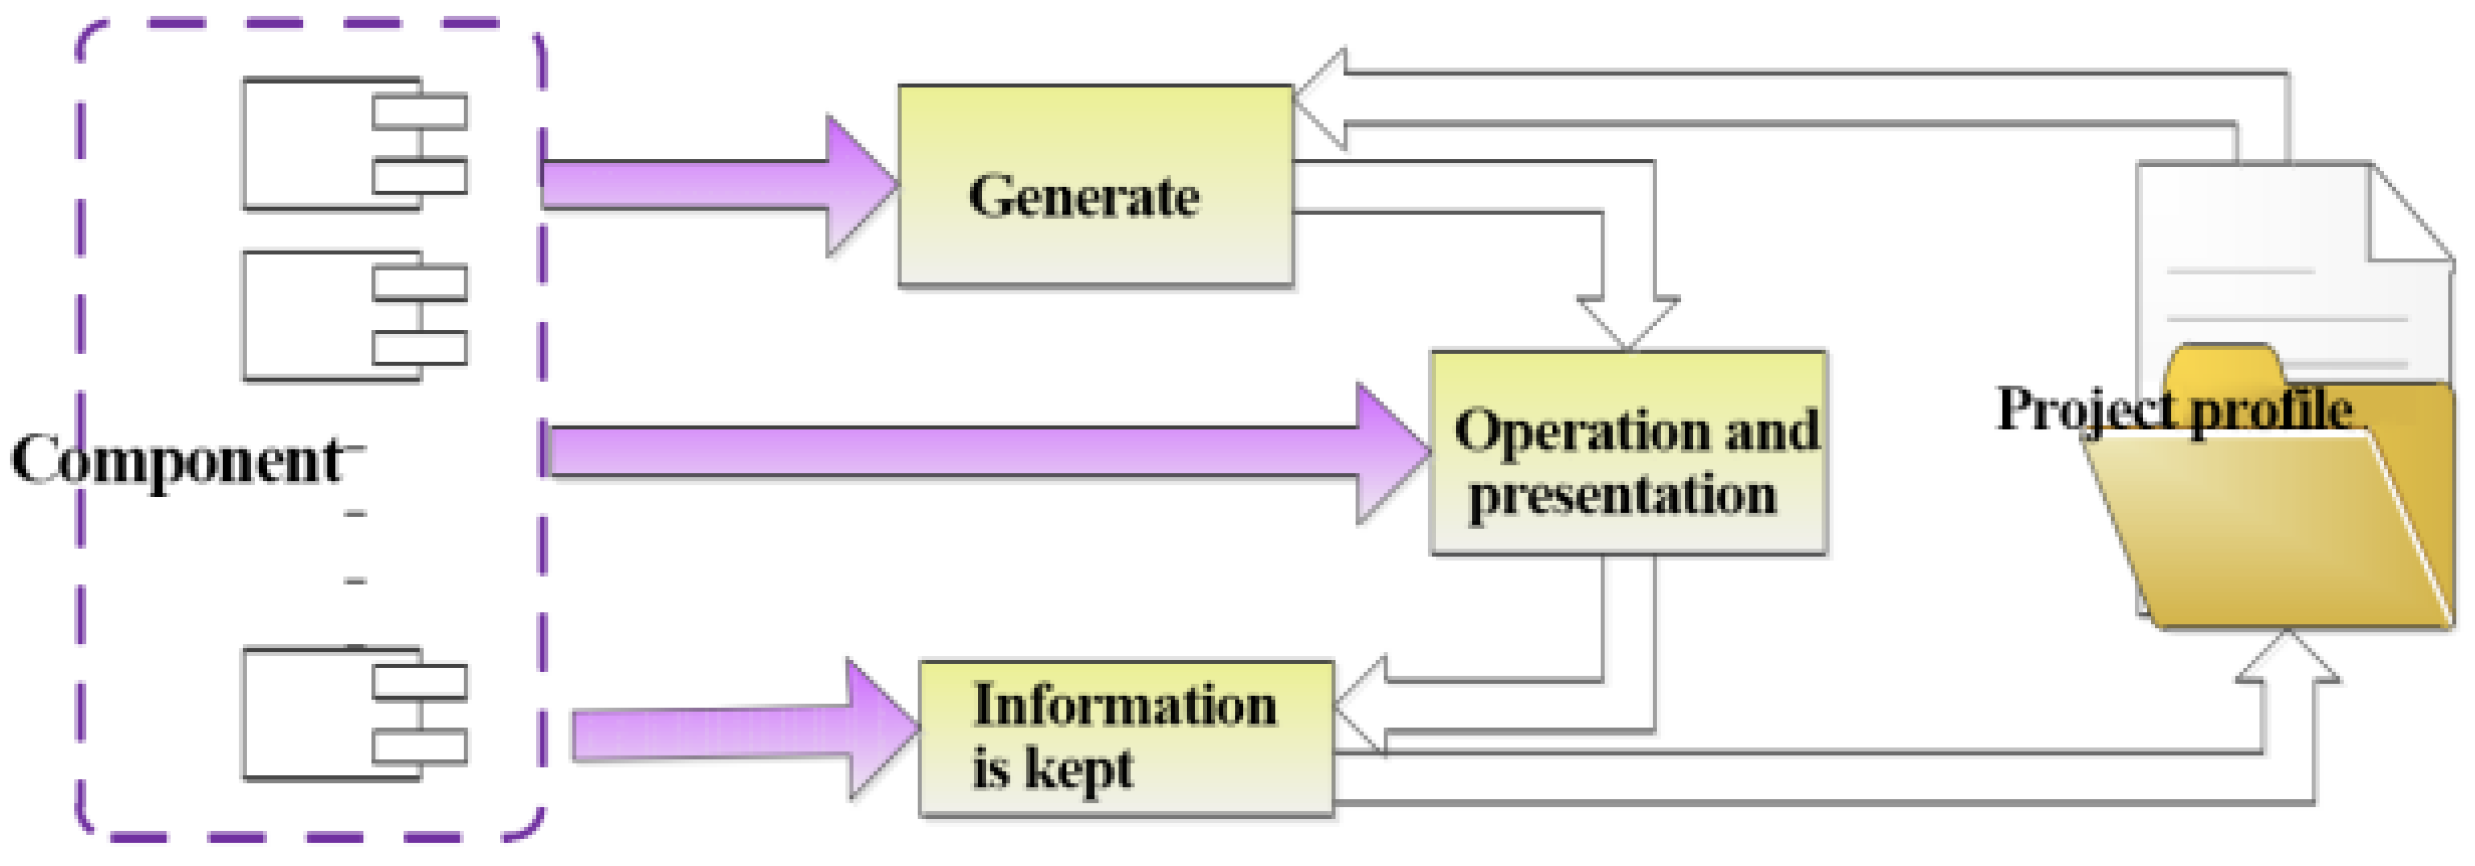
3.1. Basic Lighting Control Structure

An intelligent lighting control system is usually used to communicate between the medium and the network topology. There are mainly five types of topology: (1) bus structure, (2) star structure, (3) circle structure, (4) tree-type structure and (5) net-type structure. The star topology was selected for the present research, as it is more suitable for the intelligent lighting control system with a central and distributed system. The structure of the central control system is based on the central processing unit, combined with the central control node through the network connection of multiple nodes, and then the central control node issues its commands to the control panel and other equipment in the lighting control system [22]. Each node then executes it. The specific structure is shown in Figure 1.
The control system of this structure has the advantages of high control efficiency, simple problem detection and strong transmission capability. The disadvantage is that because the control system of this structure mainly relies on the central controller, if the quality and resources of the central controller cannot be guaranteed, the stability of the system will be significantly reduced, and the expansion will also be affected to a certain extent.
The other system is a distributed system, which is mainly composed of a lighting controller, control panel and monitoring center. In this control system, both the lighting controller and the control panel have independent units that can process various information separately. The control center is the main component of the entire system [23]. The lighting controller and the control panel process the information and send it to the control center. The control center interactively converts the information obtained by each node. The specific structure is shown in Figure 2. Because each node can be operated separately from the central controller, interactive communication between each node can be carried out so that the detection and control between the nodes have been strengthened and the scalability of the control system is significantly enhanced. Therefore, the present design adopted the distributed system.

3.2. The Model of Distributed System

The specific feature of the distributed control system is that it is built on a model in which the independence between the various components of the intelligent lighting control system is relatively strong, while the multiple servers are managed by the system management platform. At the same time, the nodes of each server can work either independently or together. As each node is connected through the state network, data can exchange through a distributed communication protocol. In this way, each individual node can be controlled, and it is convenient for the platform to manage. The specific model of the system is shown in Figure 3.

3.3. Basic Working Principle

As an energy-saving centralized control platform in a building has a large number of accessible devices, good practicability and a simple operation interface can be achieved. It is usually separated from other functions, such as equipment. In this way, the platform is divided into three parts: client, server and design. When users enter the platform, they need to set the device information through the designer. The client and server can read the system’s file information and then run it. The system process is shown in Figure 4.

3.4. The Process of the System

Figure 4 shows the project creation and loading. As demonstrated, a computer user creates a project profile based on the configuration information to form the loading, where an occupancy (client) could send his request to the service side. When the equipment receives the control command, it transfers data to the service to respond to the requirement of an occupancy.
Figure 5 explains the principle of data collection. A dual collection scheme is set up to collect data. The first layer acquires data by three agreement types of equipment, the Modbus, OPC and Zigbee modules, and caches data through data standardization. The second layer acquires data through a data acquisition interface and acquisitions channel data to channel data cache. There is an interface and buffer for data to move up and down.
Figure 6 shows the working principle of an embedded platform. The upper part displays how the set control platform takes requests from an occupant and processes data to respond. The lower part displays how the RFID (radio frequency identification device) tag detects images of occupancy and delivers them to data collection for processing. Suppose an occupant prefers different light intensity, temperatures and humidity in the environment. In that case, he could place his request or information on the tag and onto the platform to adjust the control system for personal comfort or energy savings.
Figure 7 is a diagram of the configuration software scheme, including the components of generation, operation and information storage. The kept information can be sent to the project profile and then from the profile for generation.
Figure 8 is a schematic diagram of the data acquisition configuration. It can be seen that there are two parts, i.e., configuration designer and data acquisition plug-in. The designer will form channels during data collection from the data acquisition plug-in, and there is a unified interface in the middle of the platform to connect the designer and data acquisition plug-in. When the lighting equipment is different, data collection is also different. When data collection is different, communication protocols are also different. Therefore, the occupant could adjust the channel according to his needs.
Figure 9 presents the principle of privilege configuration that permits individual occupants to delete or add roles in the system. The system has set up the operation authority of each role. After logging into the system, the occupant can perform the operation authority according to the authority verification and setting of the system.

4. Application of Artificial Intelligence Technology in Intelligent Building Lighting Control

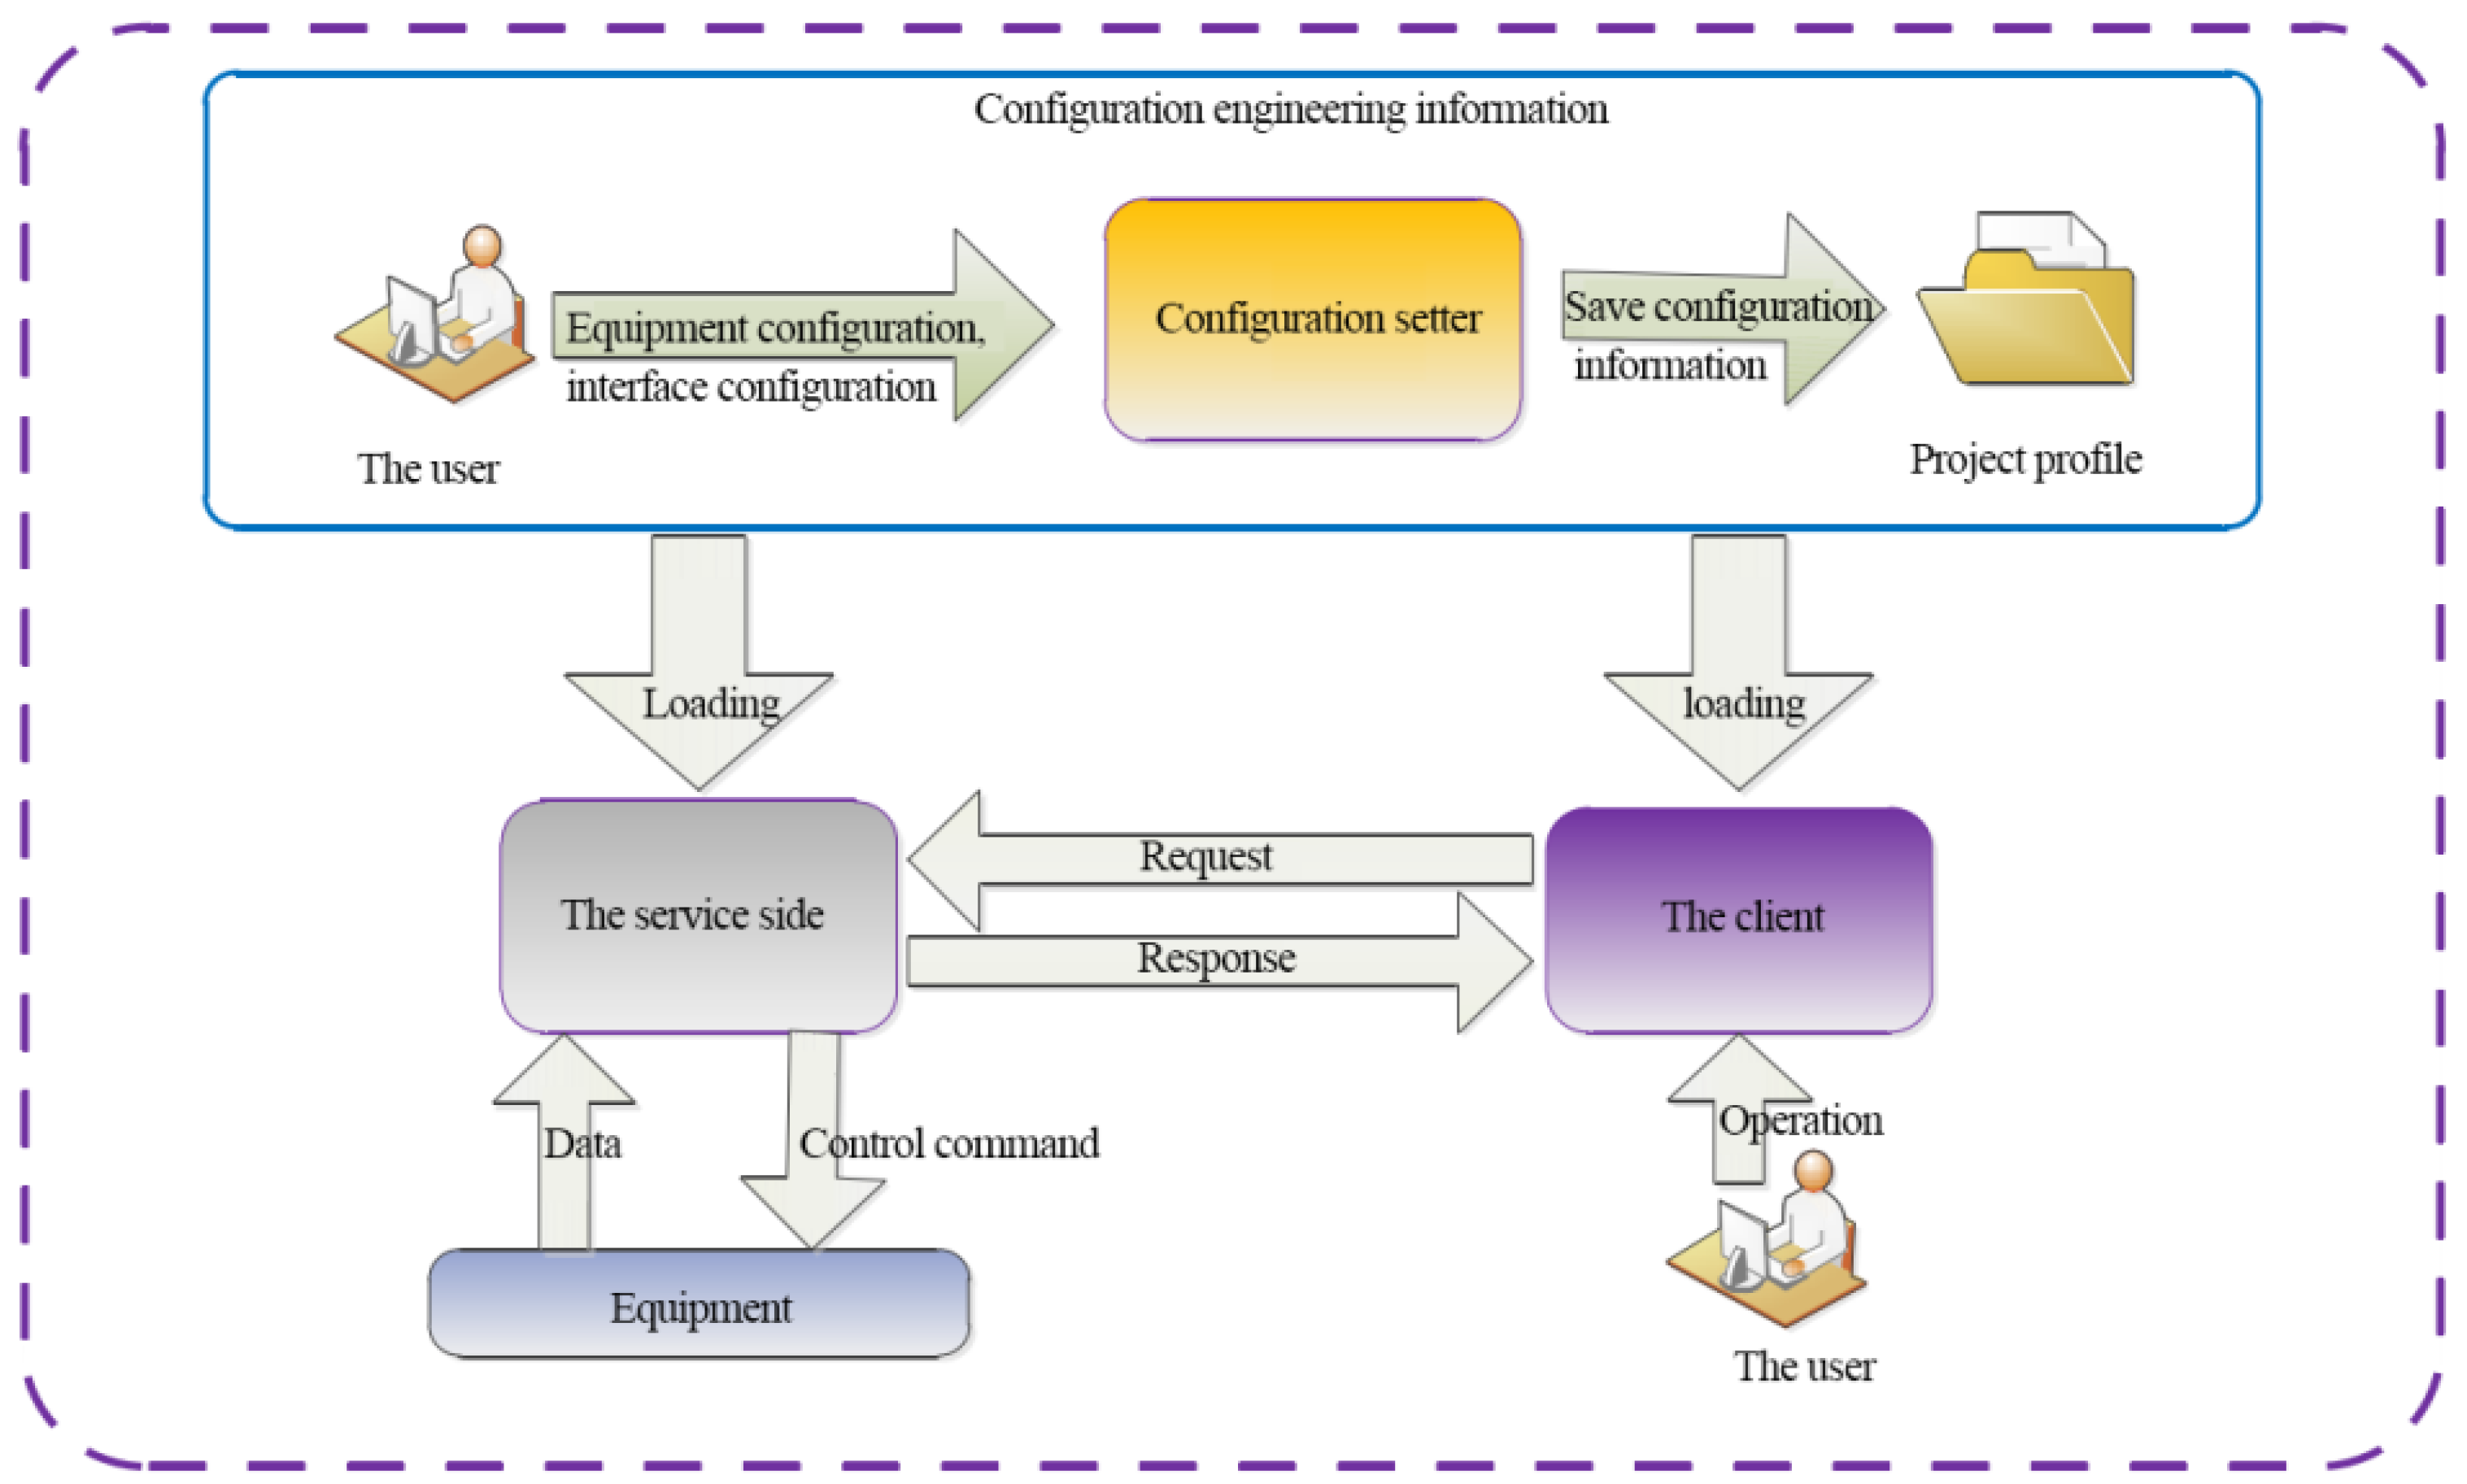
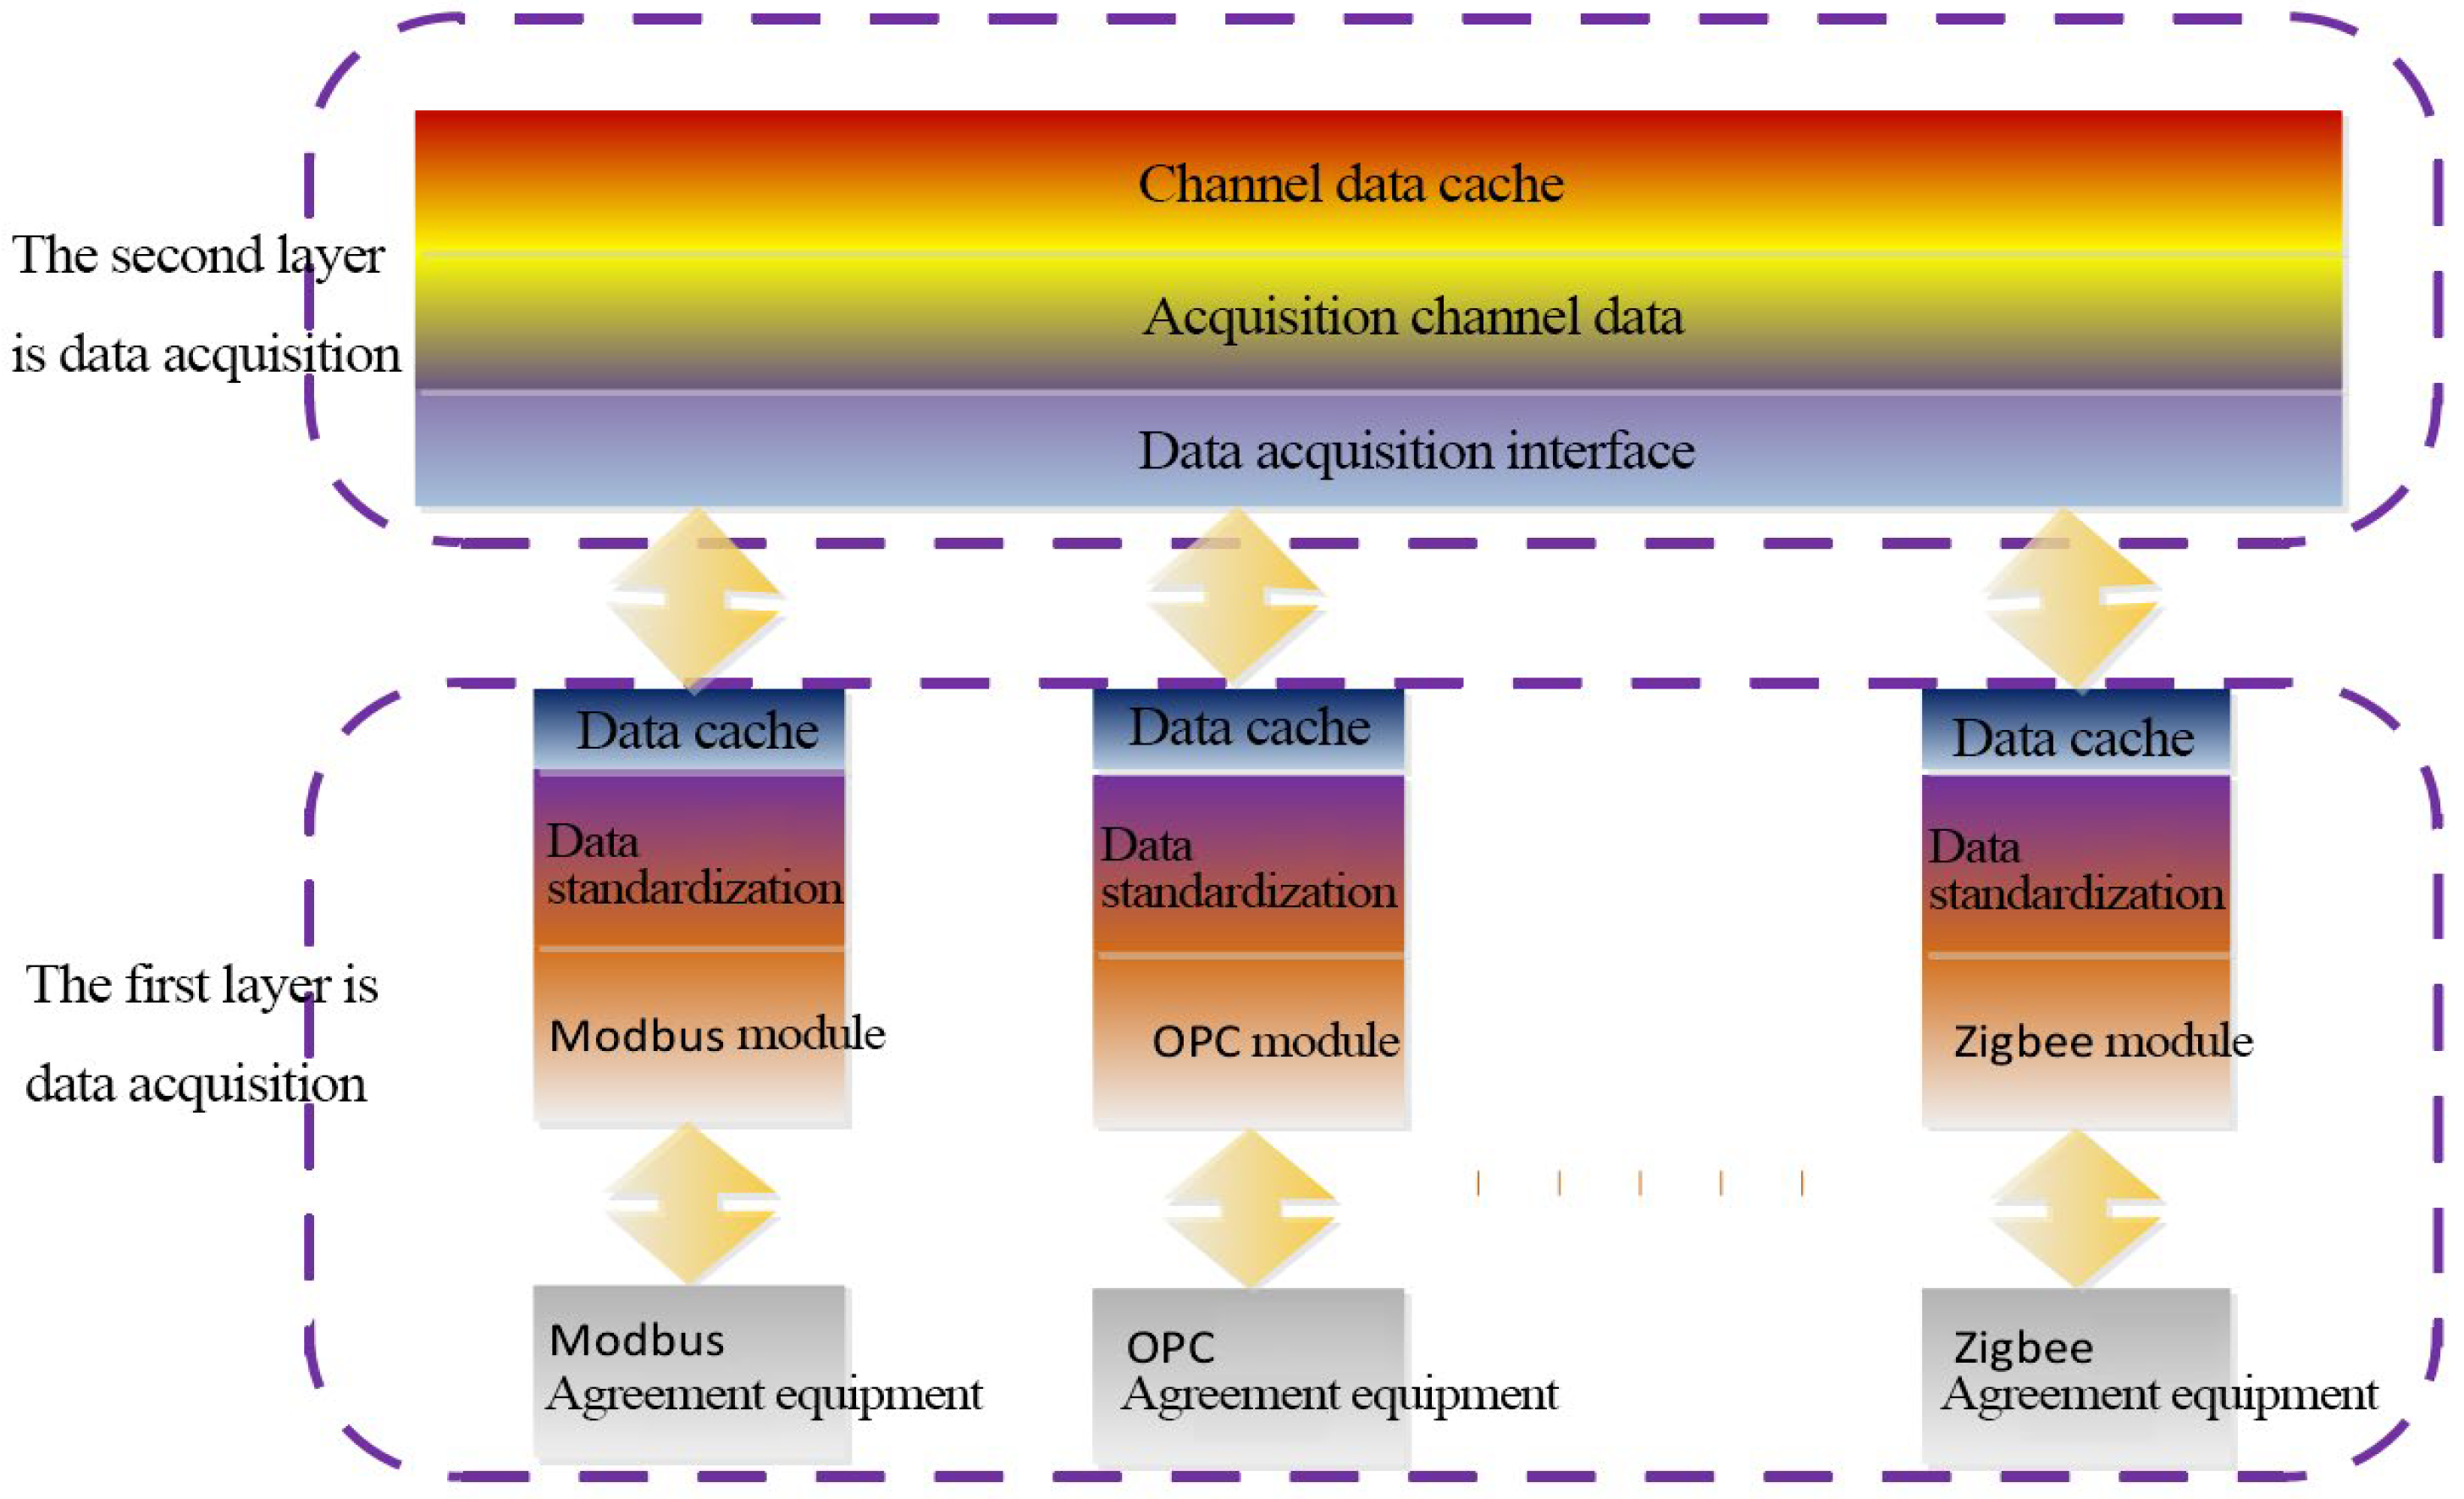
4.1. The Pre-Processing Steps

Decompose the image by convolving the image function f(x, Y) with the neighborhood sub-function h(m, n). If the filter function expression is g(x, Y)—the neighborhood sub-function and the original image volume—the mathematical expression formula of the product can be expressed as a formula:
g ( x , y ) = m , n f ( x + m , y + n ) h ( m , n )
where g represents the output of the convolution operation, and h represents the convolution kernel.
The formula of convolution can be expressed as
g = f h
The average and variance formulas of the image can be expressed as
μ = i = 1 I j = 1 J p i j I J
δ 2 = i = 1 I j = 1 J ( p i j μ ) 2 I J
where μ represents the average of an image and δ 2 represents the variance of an image.
Based on the calculation of the average and variance formulas, the image is adjusted, and the output image g(x, y) formula can be expressed as
g ( x , y ) = p i j μ δ
The image expansion operation is a convolution operation. Given the image f(x, y), the convolution p(m, n), and the expansion of the output function is g(x, y), the expansion calculation formula can be expressed as
g ( x , y ) = m , n f ( x + m , y + n ) p ( m , n )
The convolution expression formula can be
g = f p
The image erosion operation is also a convolution operation, which is similar to the image expansion expression. If the image function expression is f(x, y), the convolution is (m, n), and the corrosion output function is g(x, y). The corrosion calculation formula can be expressed as
g ( x , y ) = m , n f ( x + m , y + n ) s ( m , n )
The expression formula of convolution can be
g = f s
Moreover, edge detection technology is adopted to optimize an image area, i.e., the boundary between the background of the edge image and the target object or between regions. Accurate edge detection is an important pre-processing step for identifying the target region. Edge detection technology realizes edge detection and extraction by distinguishing the differences between the background and target (gray, color, texture). In short, edge detection is used to detect the parts with significant changes in image characteristics. Firstly, the edge points with significant changes in the gray level are extracted, and then the boundary discontinuity points are filled, and the edge points are connected to form a complete line. Most of the edges occur in the part where the gray level of the image changes significantly, i.e., where the gradient of the image is large. Therefore, the edge detection of an image is often carried out with the help of derivative operators. Common edge detection operators include the Sobel operator, Prewitt operator, Robert operator, Canny operator, and so on. The pixel that is located at the boundary line is located in the gray-scale change zone. At this time, the edge detector can be used to check the pixel neighborhood, calculate the gray-scale change rate and determine the gradient direction so as to realize edge detection.
In this experiment, Canny is used for image edge extraction when performing edge detection on images. Canny is an edge detection operator. Because this operator can complete the detection of the edge of an image, it can also control the repetitive superposition of the edge line; therefore, the method can be regarded as the best edge operator in the current experiment. In order to reduce the noise interference, when performing Canny edge detection, the image should be filtered. Then, the gradient direction of the image can be calculated, and the convolution calculation formula can be expressed as
G x = 1 0 1 2 0 2 1 0 1
G y = 1 2 1 0 0 0 + 1 + 2 + 1
The formula for the magnitude G and direction of the pixel gradient can be expressed as
G = G x 2 + G y 2
θ = tan 1 ( G y G x )

4.2. Convolutional Neural Network

The convolutional neural network model is a part of the deep learning model. In this paper, the convolutional neural network model is used to construct the lighting control system [24]. It includes a set of convolution layers and pooling layers. A convolutional neural network can directly identify objects from the original image and realize the invariance of displacement, scaling and distortion by three methods: the local receptive field, weight sharing and subsampling. At present, the convolutional neural network has become a research hotspot in academic and engineering circles and is widely used in image and video processing. In the multi-layer convolutional neural network model, the output of one neuron usually becomes the input of the next neuron, which is also the activation of the function. If it is a two-layer neural network structure, the input matrix of the first layer is X, the weight is W1, the offset is B1, and the output matrix is Y; the input matrix of the second layer is Y, the weight is W2, the offset is B2, and the output matrix is Z; then, the following situations can occur:
Y = W 1 X + B 1
Z = W 2 X + B 2
The relationship between the output matrix z and the input matrix X can be expressed as
Z = W 2 ( W 1 X + B 1 ) + B 2 = W 2 W 1 X + ( W 2 B 1 + B 2 )
Then:
Z = W 3 X + B 3
The rectified linear unit (ReLU) is an activation function that introduces the property of non-linearity to a deep learning model and solves the vanishing gradients issue, which is widely used in convolutional neural networks. The mathematical expression formula of the Relu function can be expressed as
Re l u ( x ) = max ( 0 , x )
The cross-entropy loss function is also a commonly used component. In general, according to a certain algorithm, the output is expressed as a vector P, and the first column pi of P represents the probability value of the input data. If the probability value of the input data is qi, then the mathematical expression formula of the intersection can be
L = i = 1 n q i log 1 p i
where L represents the loss function.
The cross-entropy loss function can react to the error between the probability value and the true value, so in the multi-layer neural network model, the true probability distribution q vector value is 1, and the other values are 0. If the qi value of the jth column of the true value is 1, then the cross-dimension can be expressed as
L = log p j
The mathematical expression formula of softmax can be expressed as
S i = e y i k = 1 n e y k

5. Design and Implementation of CNN-Based Building Lighting Control System

5.1. System Structure Design

Because the building energy-saving control system requires the characteristics of safety, practicability and mutuality, it is required to transmit these data in real-time by using the C/S structure. This structure processes data through a collection of servers, and the data processing machine and the display screen machine are required to be different machines so that the system’s normal operation can be guaranteed and the system has strong scalability [25]. The system mainly includes three main parts: the client, the server and the designer. The client receives the customer’s requirements, recognizes and parses the received information and then sends it to the server; the server makes the received information perform analysis, collects device information, and sends commands to the controller; the designer customizes the system according to the customer’s requirements to change background management on the server and client [26]. The three parts are independent of each other and interfere with each other.

5.2. System Communication Protocol Design

The system communication protocol design is shown in Table 1, Table 2, Table 3, Table 4, Table 5 and Table 6.
Table 1 shows the communication protocol between the platform and the controller. The data header is 0 × 54; the control type is 0 multiplied by 1; 0 multiplied by 2 and 0 multiplied by 3; area number refers to the number of specific areas; device address refers to the font size of the device; data symbol refers to the device location Data command issued.
Table 2 shows the control command packet (a message fragment) sent by the client to the server according to the client’s command.
Table 2. Control command packet.
Command TypeProject NumberArea NumberChannel NumberControl Commands
2 byte5 bytes5 bytes5 bytes17 bytes
Table 3 shows the specific situation of the command type.
Table 3. Command type.
CommandCommand NameDescription
0 × 0SavDataSave the data in the database
0 × 1InserteInsert data into the database
0 × 2DeletDelete data to the database
0 × 3GetFroDataBaseGet data into the database
0 × 4ModferModify data to the database
0 × 5RealTmeShow real-time data
0 × 6RemoveeDo not display real-time data
0 × 7ChannlInfoChannel data information
0 × 8CkepLiveNotification packet
0 × 9CMDInfoeClient command control
0 × AGetRalDataGet instant data
0 × BAlarmnfoAlarm data information
0 × CAlaremOFFAlarm system closed
0 × DUseerLoginUser login
Table 4 shows the data packet obtained after searching the server’s data. The command type is 0 multiplied by 4, which is the information collected in the database.
Table 4. Client data query returns data packet.
Command TypeData
lbyteLength
0 × 4Data
Table 5 shows the data packets sent and analyzed by the server. The command type is 0 multiplied by 8, which is the data information sent.
Table 5. Channel data packet.
Command TypeData
lbyteLength
0 × 8Data
Table 6 shows the alarm data obtained by the server. The command type is O multiplied by D, which is the alarm data.
Table 6. Event return packet.
Command TypeData
lbyteLength
0 × DData

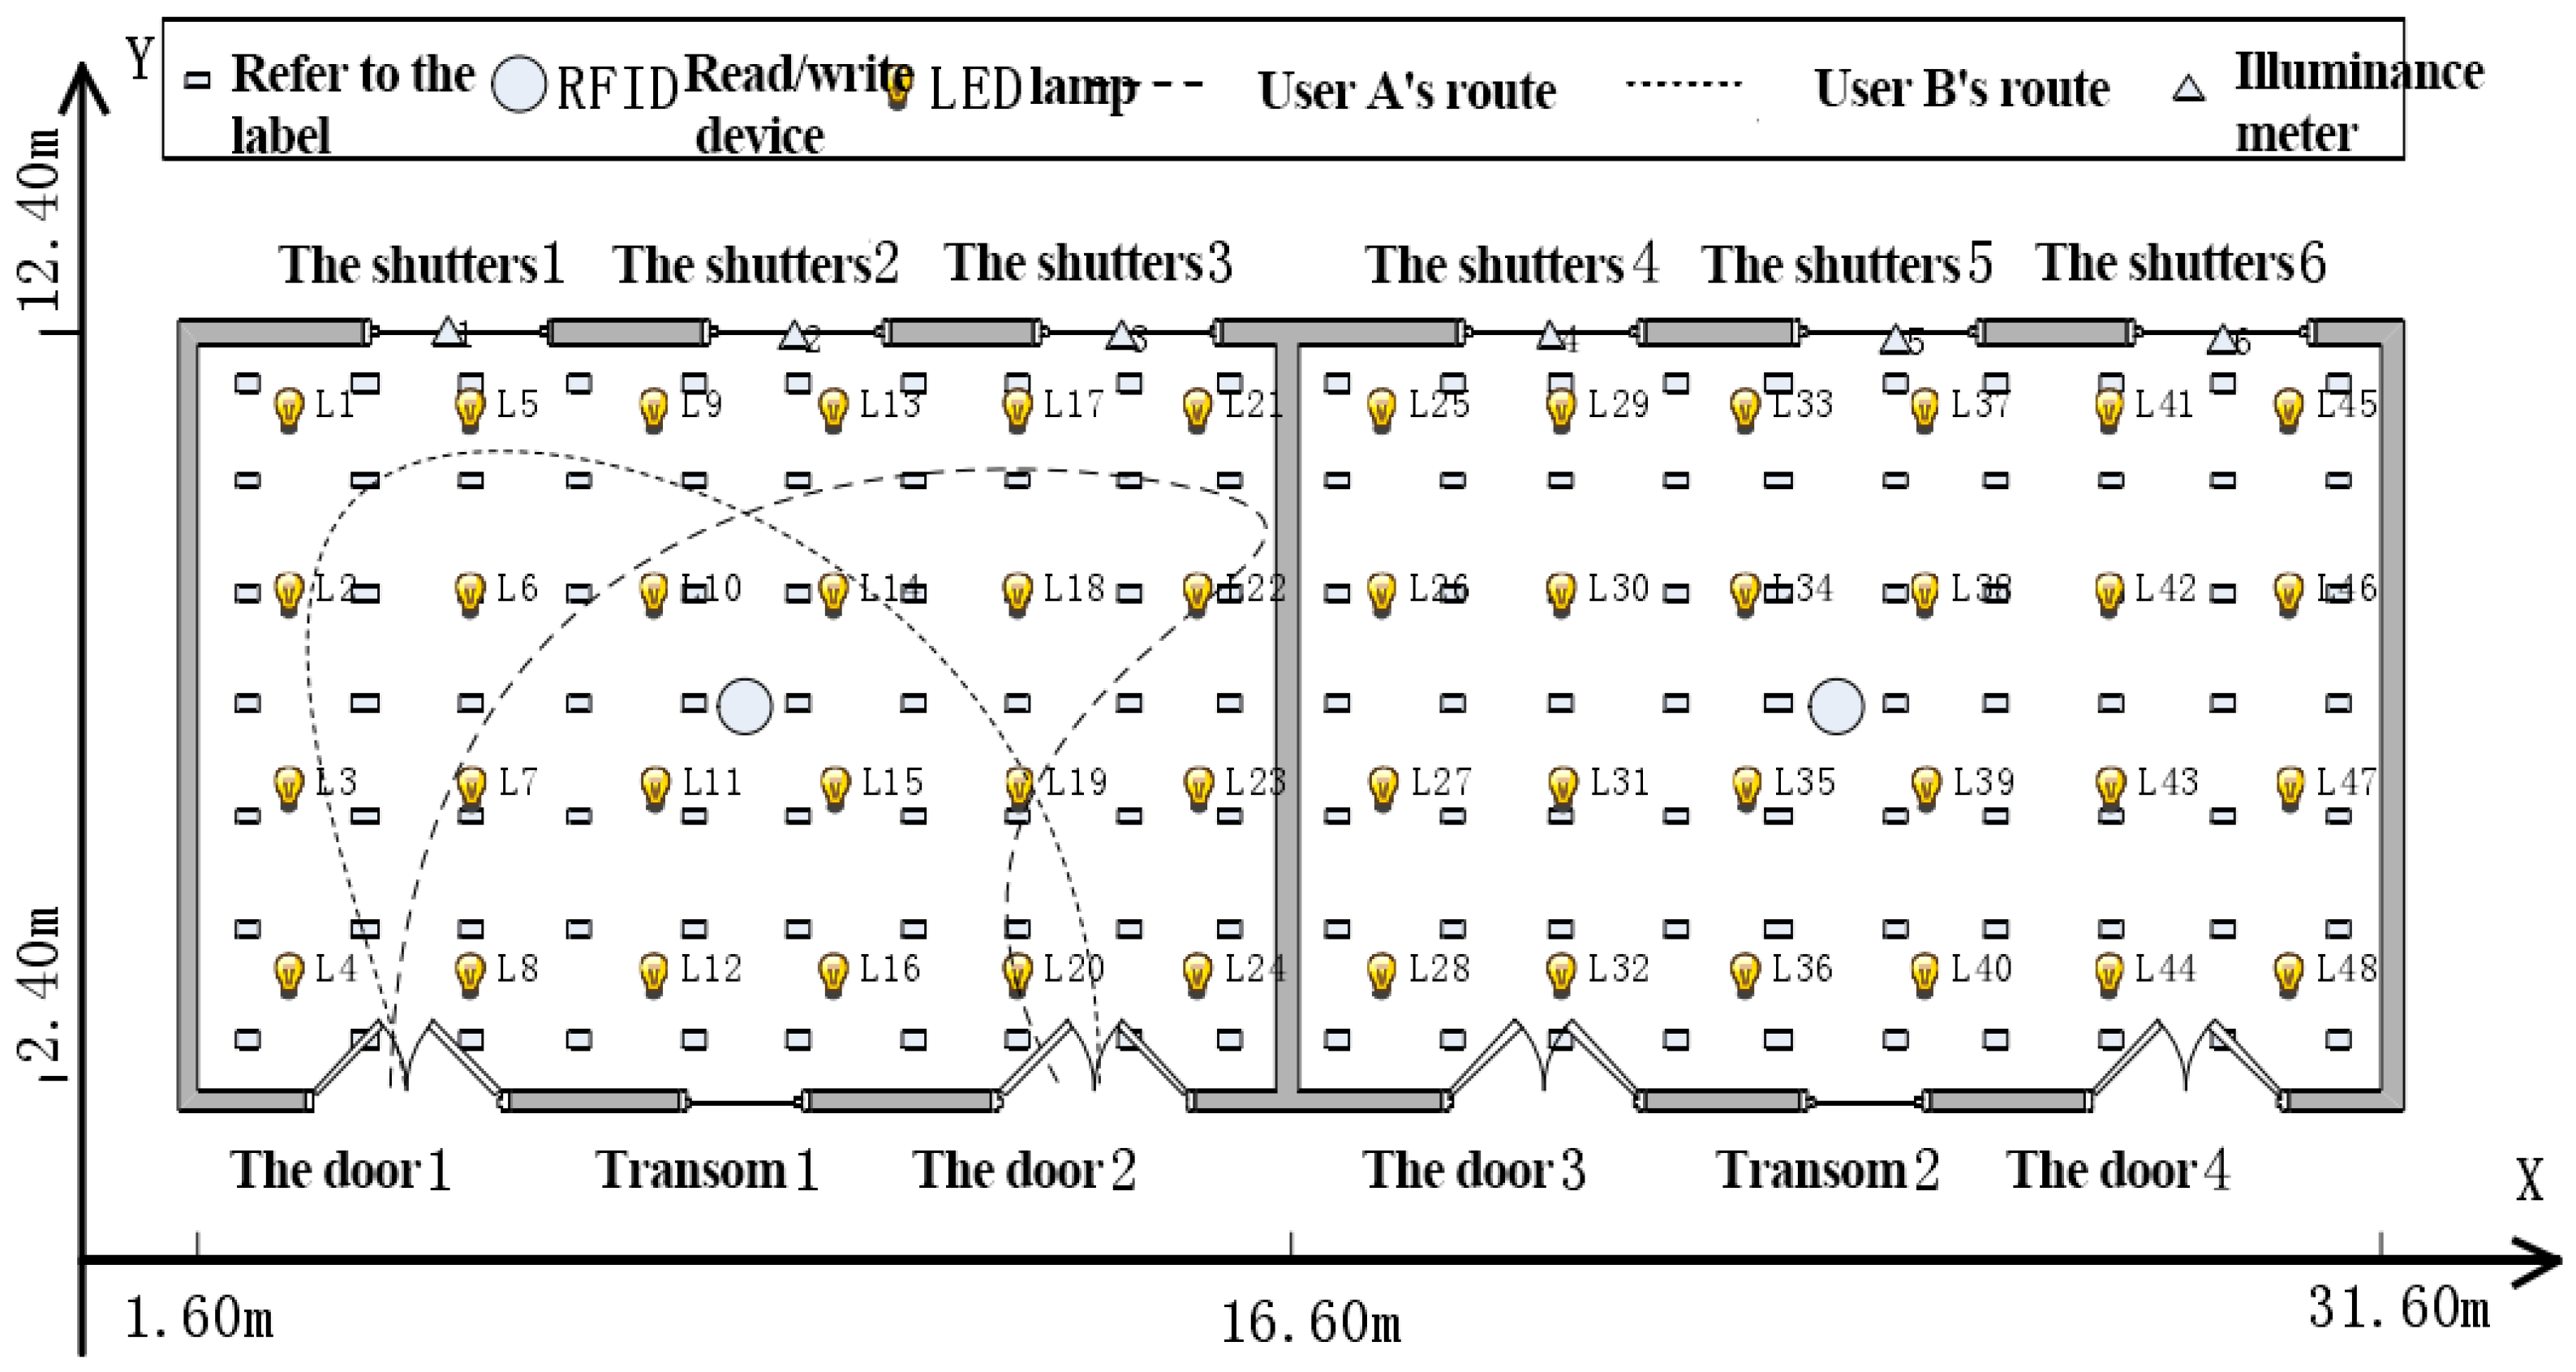
5.3. Equipment Selection and System Layout

LED bulbs were selected as lighting equipment, and the brightness of the bulbs could be adjusted. The color of the bulbs was yellow [27]. Two rooms were selected for the experiment, and the area and height of the rooms were exactly the same (12.40 M*15 M for one room), as can be seen in Figure 10. All the walls were not transparent, and the shutters and vents in the rooms were closed to prevent natural light from entering the rooms. The RFID readers were positioned on the ceilings of the two rooms. CC25302.4G and RFID development software, based on CNN on the embedded microprocessor, was applied to detect and collect the signals of the movement and behavior of occupancy. The power consumed was less than 400 mW, and the period of the signal delivered could be adjusted.
Figure 10 indicates the experiment equipment and the layout. It can be seen that the rectangle on the very left in the figure refers to the labels, the circle refers to the RFID read/write device, the icon of the lamp refers to LED light, the dotted line (---) refers to user/occupant A’s route, the dots (.....) refer to user/occupant B’s route, and the triangle refers to the illuminance meter hidden at Doors 2 and 4.
The system must identify the location of the equipment in order to operate the lighting control schemes. Therefore, the specific location of each device must be placed into the system in advance [28]. In the experiment, six laptop computers were used as client servers with double dual-core processors. Among them, two worked as regional decision servers, and the other two were regional application servers. The other two laptops were the decision center and primary application servers. The laptops adopted the Windows 7 operation system, with 4 G of memory and a 500 G hard disk. The server deployment positions can be seen in Figure 11.

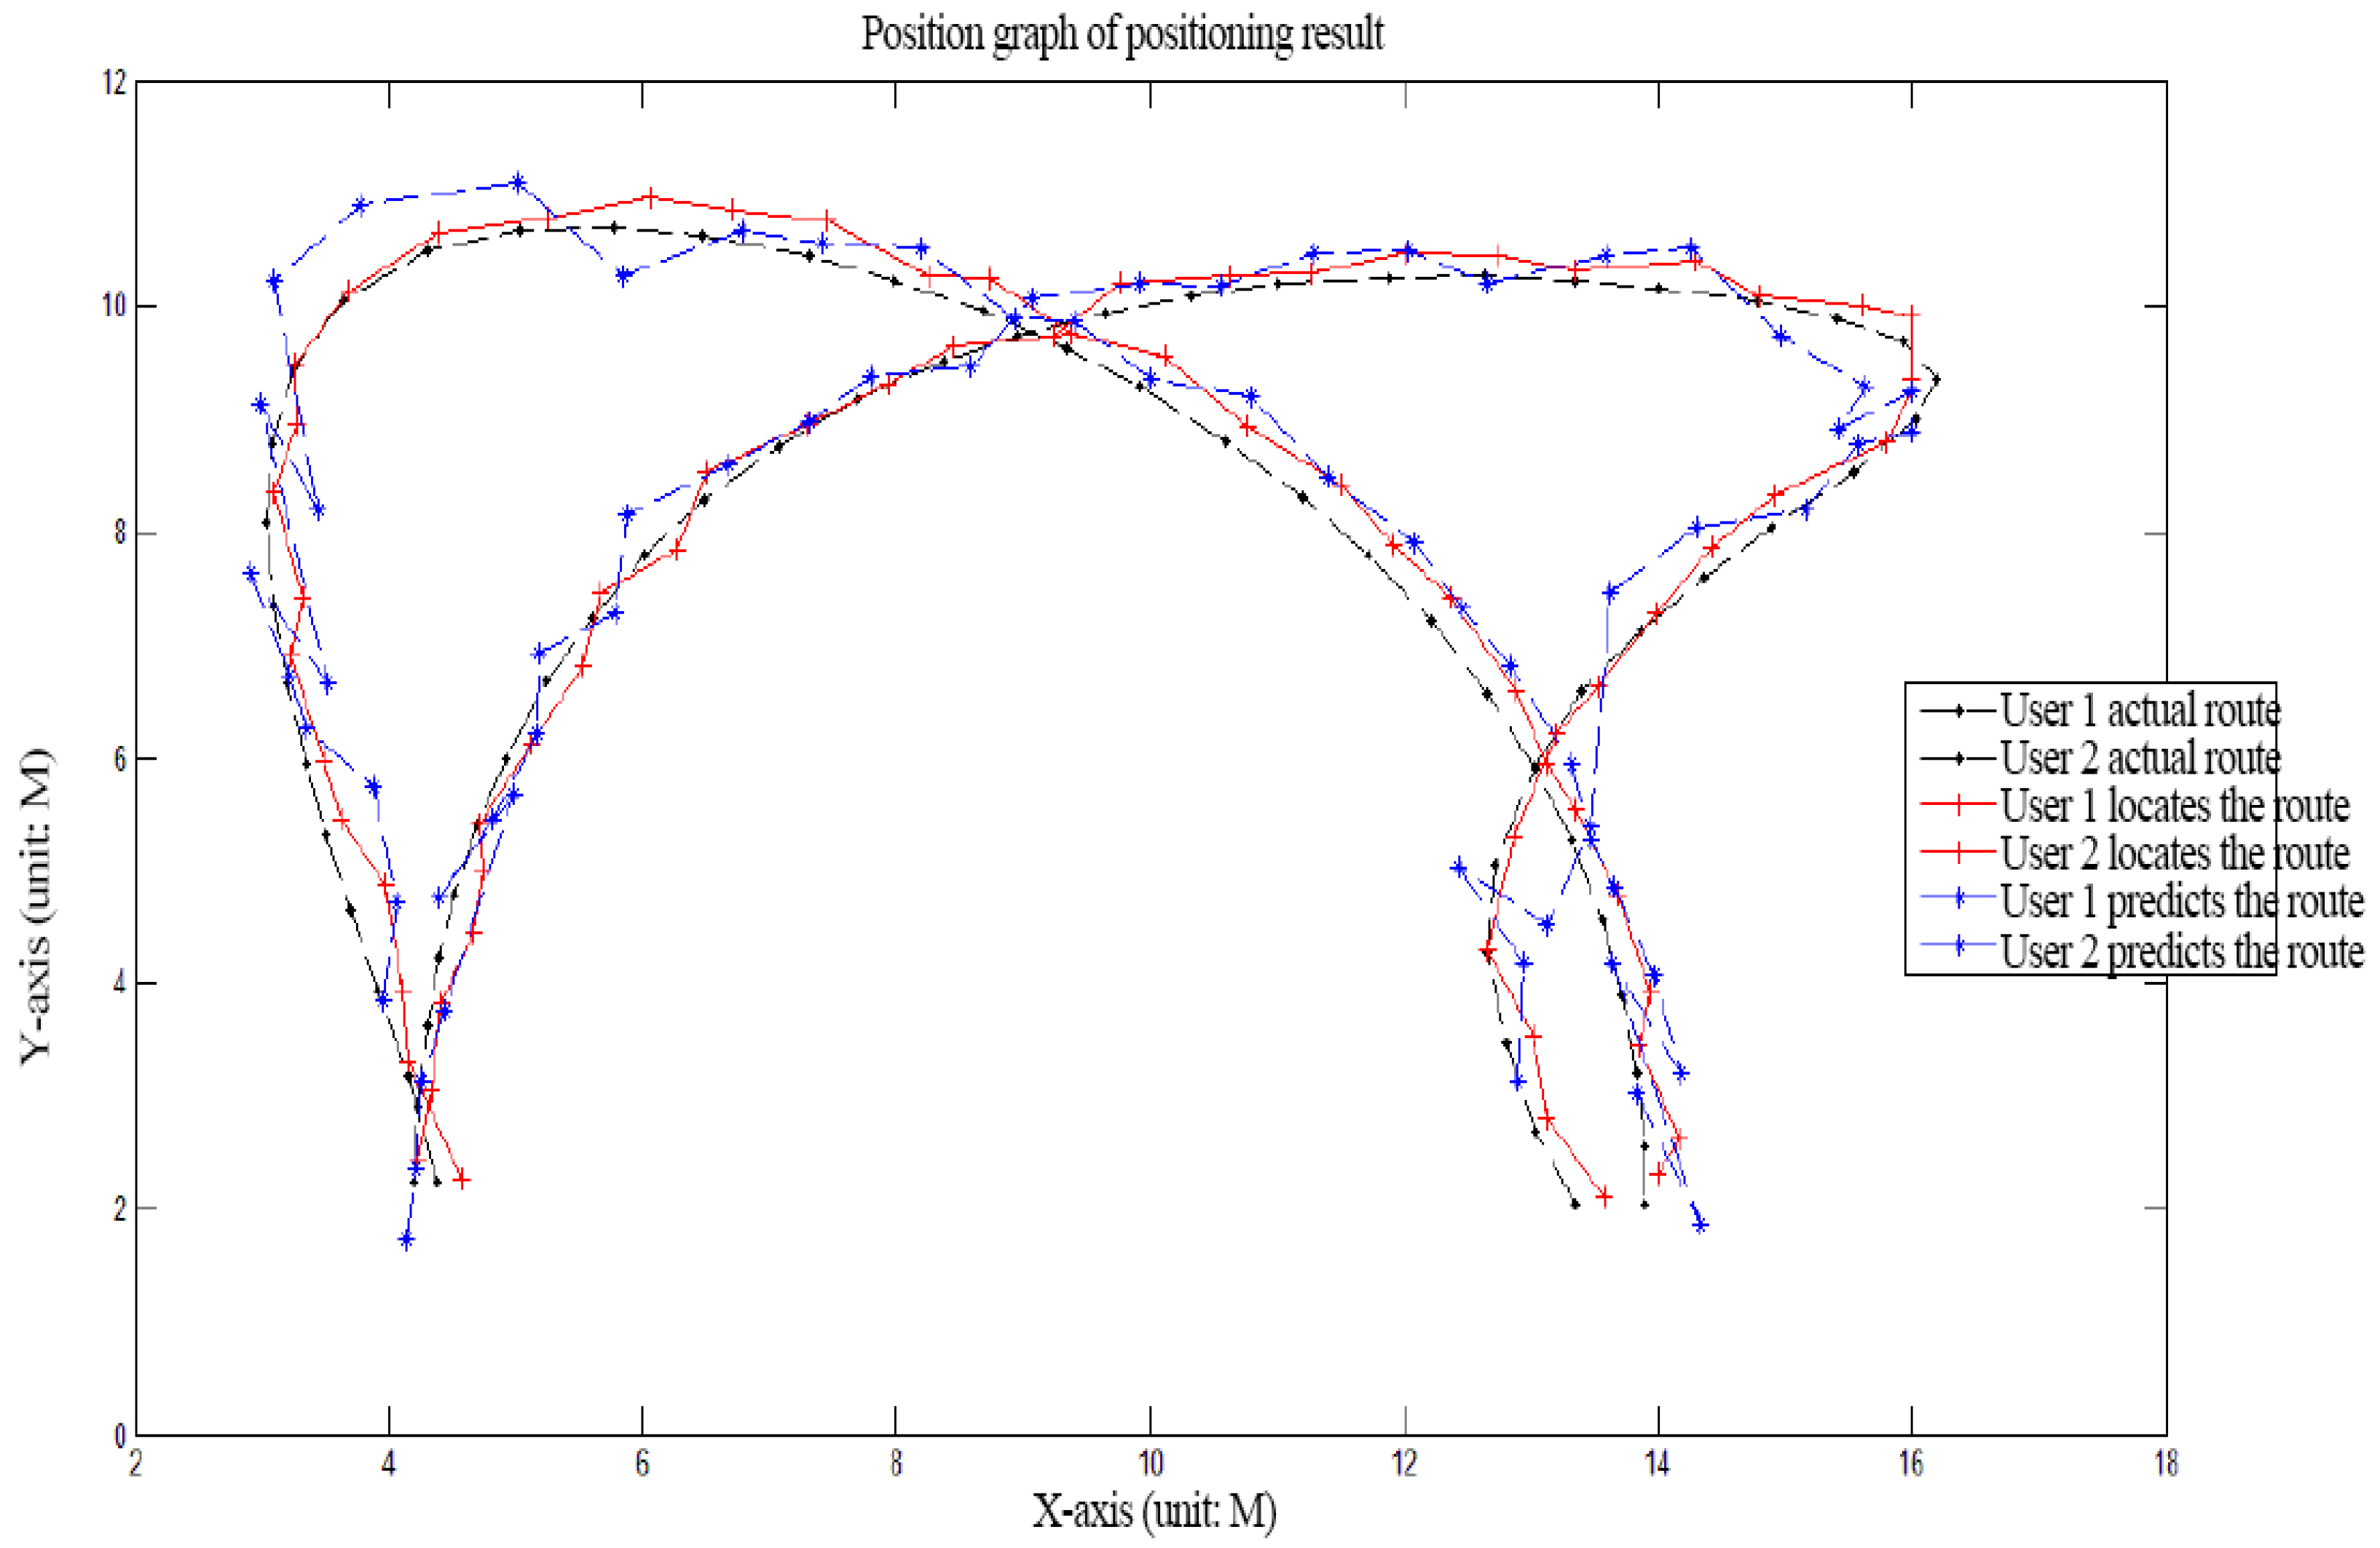
5.4. The Implementation of the Experiment

When the experiment began, user A was asked to walk in and around the room from Door 1 and walk out of the room from Door 2, as can be seen from the direction of the arrow. User B was supposed to walk in from Door 3 and out from Door 4. Unfortunately, he followed A and walked in from Door 1 and out from Door 2. The system collected the signals of both of them, as shown in Figure 10.

6. The Analysis and Discussion

6.1. About the Accuracy of the Recognition

Figure 12 indicates the way that users A and B walked from the system. As mentioned above, there are three routes for each user. The black line indicates the actual route that users A and B walked, the red line indicates the positioning route obtained from the designed system on the computer, and the blue line indicates the computer-predicted route. Obviously, the three routes from both A and B were very close and even tangled with each other throughout the room, proving that the recognition accuracy of the designed system was very high.
The high accuracy can also be demonstrated by Table 7, in which the exact number of the actual locations, positioning positions and forecast locations of A and B at nine time nodes, i.e., 2, 5, 9, 13, 17, 21, 25, 27, 33, was provided. It can be seen that two numbers were collected at each point for the three positions of A and B. Take the first line of data, for example: at node 2, user A’s actual locations were 4.16 and 3.18, positioning positions were 4.17 and 3.32, and forecast locations were 3.97 and 3.85. The same is true for user B. If a comparison was made to the actual positions (4.16 and 3.18) and positioning positions (4.17 and 3.32), it becomes very obvious that the numbers’ differences between them were as small as 0.01 and 0.14. Therefore, it could double prove that the recognition accuracy of the designed system is very high and the deviation of accuracy is very small.

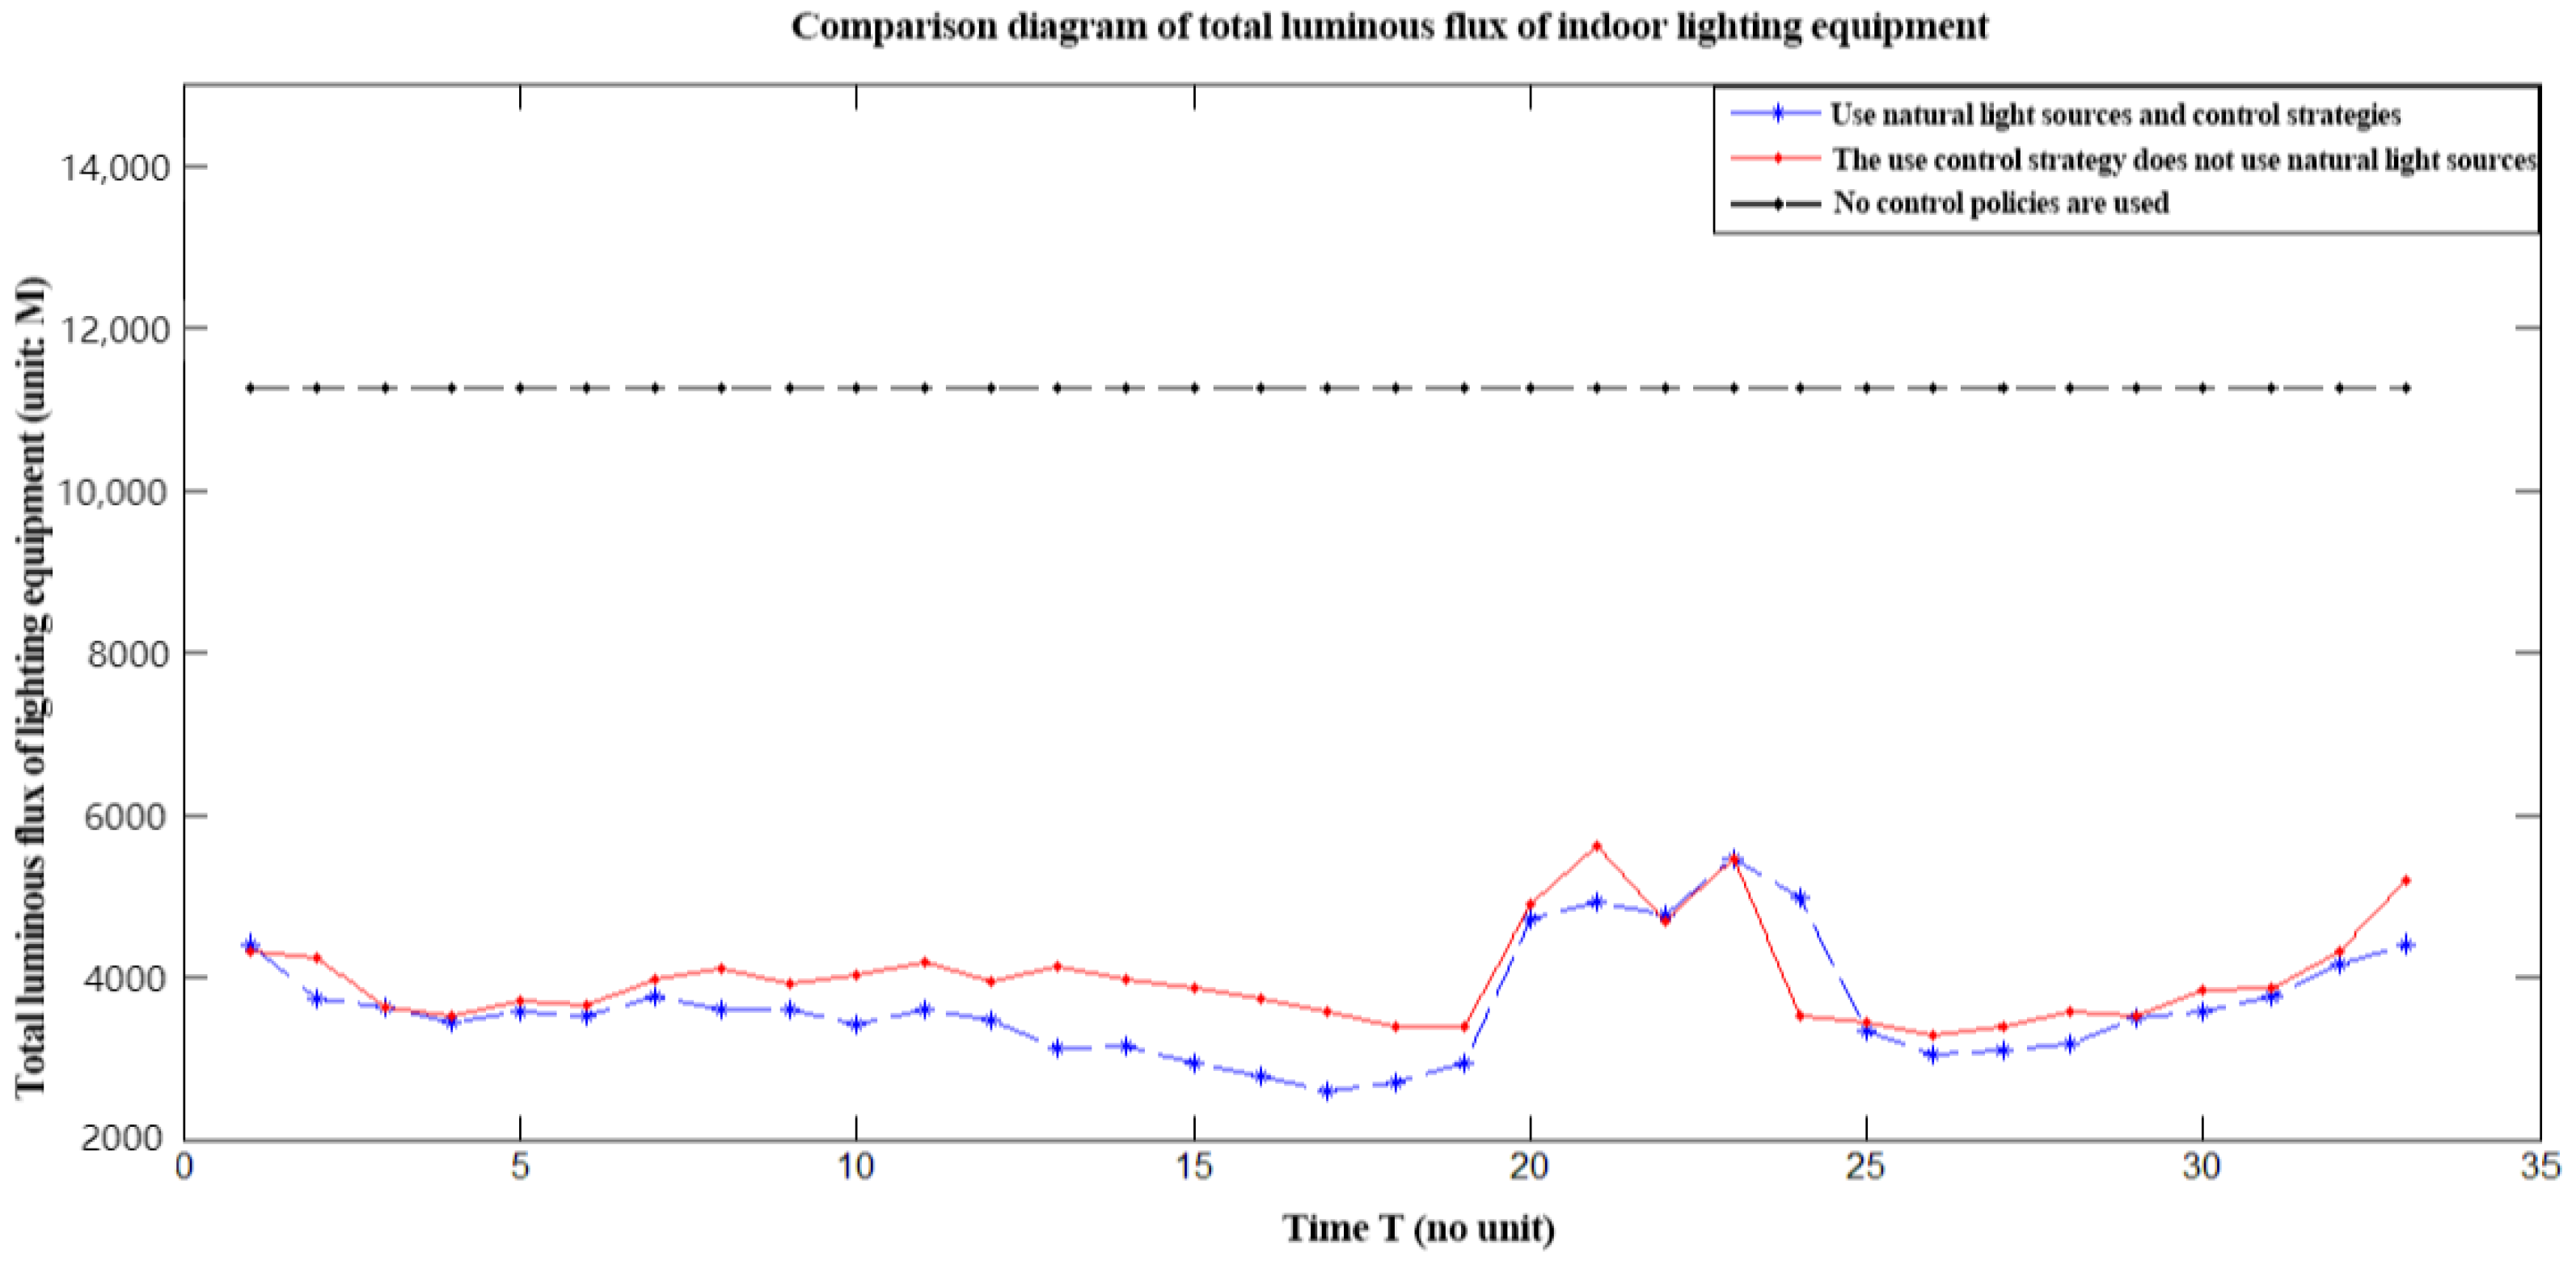
6.2. About the Energy Saving

After the analysis of accuracy, energy savings is the other purpose of the present research. Table 8 presents the illuminance and luminous flux of the lamp at nine time nodes, mentioned in Table 7. Again, take the first line as an example for an explanation. When A and B appeared at node 2, the actual position illuminance was 61.4 lux for A and 41.4 lux for B, and the predicted position illuminance was 60.8 lux for A and 40.7 lux. In order to compare the actual position illuminance (61.4 lux) and the predicted position illuminance (60.8 lux) for A, it can be seen that the numbers are very close. Then, the luminous flux of L2 was 191.2 Im; L3, 286.8 Im; L4, 429.2, and so on. The total luminous flux was 3862.3 Im. Although luminous flux is different, with different qualities and efficiency in LED lamps, generally speaking, luminous flux ranges from 140–120/W. With 130/w as the divisor, the energy consumption for 24 lamps was less than 30W. Moreover, the difference in luminous flux with different lamps meant that the lamps could adjust their brightness automatically according to the lighting environments. It also means that the occupant could adjust the brightness of the lighting for his personal needs and comfort.
Figure 13 provides more detailed information on energy consumption. There are three lines with three colors. The blue line indicates the energy consumption with a combination of natural light and the designed system, the red line indicates the use of the designed system without natural light, and the black line indicates no use of the designed system. The longitudinal axis shows the total luminous flux of the equipment (lamps), and the horizontal axis shows the time. It can be seen that the black line stands still, with a total luminous flux of about 11,000 M all the time, while the blue and red lines are very close to each other, with the blue line slightly lower than the red one, indicating that the combination of natural light and the designed system consumed the least power. The highest point of the red line was about 5800 m, appearing at 22 min, and the lowest point of the blue line was 2300 m at 17 min. For most of the time, the luminous flux stayed at 4500 m. Therefore, roughly speaking, energy savings is about 40%.

7. Conclusions

7.1. The Summary of the Design Work

In this research, a convolutional neural network (CNN) was designed and built into an embedded building’s lighting control system. Currently, lighting control systems rely mainly on information technology, with sensors to detect people’s existence or absence in an environment. However, due to the deviation of the perception, the accuracy of image recognition is not high. The present research aimed at increasing the accuracy of image recognition and reducing energy consumption.
A review was conducted in Section 2 about previous research and the work done in building lighting control in order to discover gaps in the design. The process of the design was described from both theory and practice in Section 3, and the application of the control system was described in Section 4. In order to validate the effectiveness of the designed system based on a CNN, an experiment was established, and the process of the experiment was explained in Section 5. The results of the experiment were analyzed and discussed in Section 6.

7.2. The Performance of the Experiment

It can be said that the performance of the experiment was satisfactory, as it testified that the design realized the aims that were established before the work began. It can be concluded that the outcome of the experiment revealed that, when comparing the actual position with the positioning position, the difference was between 0.01 to 0.20 m, indicating that the image recognition accuracy of the CNN-based embedded control system was very high. Moreover, when comparing the luminous flux of the designed system with natural light and the designed system without natural light with the system without intelligent control, the energy savings is about 40%. As the brightness of the light can be adjusted automatically or manually, clients can adjust the light according to their preference, and lights can be turned on or off, depending on the existence or absence of people.

7.3. The Shortcomings of the Research

It has been realized that a single experiment may not prove the authenticity and reliability of the design and the research due to limited time and the experiment method. Moreover, a comparison should be made with data from other embedded lighting control systems to establish the differences between the currently used embedded system and the CNN-based embedded system.

7.4. The Perspectives for Future Work

  • The design and experiment desired more research, as more data is needed to prove and develop them.
  • More comparative research should be conducted with various building lighting control methods, including manual, automatic intelligent and pure manual methods.
  • Further research and experiments can be considered regarding the following aspects:
    (1)
    In constructing a convolutional neural network, a slightly more complex network model could be chosen, and the lightweight and operation efficiency of the software system should be considered so that the system’s recognition and anti-interference abilities can be further improved.
    (2)
    In order to improve the reliability of image sensing, multi-camera and mutual verification methods are suggested to evaluate multiple detection results in the overlapping area of the long-distance field of vision more comprehensively for the distributed detection from one point to many points.
    (3)
    In order to ensure the recognition accuracy of an image in the presence of a large occlusion of human activities, the image processing module can be used to reduce a certain degree of information processing in future research work.
    (4)
    As there is not much low-level development mentioned for the industrial embedded microprocessor, more effort should be made to optimize the operating system to realize the transplantation of the software system for current mainstream industrial development.

Author Contributions

The original idea was suggested by X.D. and conceptualized by J.Y. and X.D., with the supervision of J.Y., X.D. designed the methodology based on the resources collected, carried out the experiment and calculated data from the experiment. The original draft was written by X.D. and reviewed and edited by J.Y. All authors have read and agreed to the published version of the manuscript.

Funding

This research received no external funding.

Data Availability Statement

Data presented in this paper are available from the corresponding author upon request.

Conflicts of Interest

The authors declare no conflict of interest.

References

  1. Leira, F.; Johansen, T.; Fossen, T. Automatic detection, classification and tracking of objects in the ocean surface from UAVs using a thermal camera. In Proceedings of the Aerospace Conference, Big Sky, MT, USA, 7–14 March 2015; pp. 1–10. [Google Scholar]
  2. Tiwari, M.; Singhai, R. A review of detection and tracking of object from image and video sequences. Int. J. Comput. Intell. Res. 2017, 13, 745–765. [Google Scholar]
  3. Wang, Y.; Luo, X.; Fu, S.; Hu, S. Context multi-task visual object tracking via guided filter. Signal Process. Image Commun. 2018, 62, 117–128. [Google Scholar] [CrossRef]
  4. Dehghan, A.; Shah, M. Binary quadratic programing for online tracking of hundreds of people in extremely crowded scenes. IEEE Trans. Pattern Anal. Mach. Intell. 2018, 40, 568–581. [Google Scholar] [CrossRef] [PubMed]
  5. Sahbani, B.; Adiprawita, W. Kalman filter and iterative-hungarian algorithm implementation for low complexity point tracking as part of fast multiple object tracking system. In Proceedings of the 2016 6th International Conference on System Engineering and Technology (ICSET), Bandung, Indonesia, 3–4 October 2016; pp. 109–115. [Google Scholar]
  6. Medina-Quero, J.; Shewell, C.; Cleland, I.; Rafferty, J.; Nugent, C.; Estévez, M.E. Computer vision-based gait velocity from non-obtrusive thermal vision sensors. In Proceedings of the 2018 IEEE International Conference on Pervasive Computing and Communications Workshops (PerCom Workshops), Athens, Greece, 19–23 March 2018; pp. 391–396. [Google Scholar]
  7. Zeng, M.; Nguyen, L.T.; Yu, B.; Mengshoel, O.J.; Zhu, J.; Wu, P.; Zhang, J. Convolutional neural networks for human activity recognition using mobile sensors. In Proceedings of the 2014 6th International Conference on Mobile Computing, Applications and Services (MobiCASE), Austin, TX, USA, 6–7 November 2014; pp. 197–205. [Google Scholar]
  8. Ordóñez, F.; Roggen, D. Deep convolutional and lstm recurrent neural networks for multimodal wearable activity recognition. Sensors 2016, 16, 115. [Google Scholar] [CrossRef] [PubMed]
  9. Albelwi, S.; Mahmood, A. A framework for designing the architectures of deep convolutional neural networks. Entropy 2017, 19, 242. [Google Scholar] [CrossRef]
  10. Gao, Z. Object-Based Image Classification and Retrieval with Deep Feature Representations. Ph.D. Thesis, School of Computing and Information Technology, University of Wollongong, New South Wales, Australia, 2018; pp. 724–735. [Google Scholar]
  11. Teow, M.T. Understanding convolutional neural networks using a minimal model for handwritten digit recognition. In Proceedings of the 2017 IEEE 2nd International Conference on Automatic Control and Intelligent Systems (I2CACIS), Kota Kinabalu, Malaysia, 21 October 2017; pp. 167–172. [Google Scholar]
  12. Kristan, M.; Matas, J.; Leonardis, A.; Vojir, T.; Pflugfelder, R.; Fernandez, G.; Nebehay, G.; Porikli, F.; Cehovin, L. A novel performance evaluation methodology for single-target trackers. IEEE Trans. Pattern Anal. Mach. Intell. 2016, 38, 2137–2155. [Google Scholar] [CrossRef] [PubMed]
  13. Mishkin, D.; Sergievskiy, N.; Matas, J. Systematic evaluation of convolution neural network advances on the imagenet. Comput. Vis. Image Underst. 2017, 161, 11–19. [Google Scholar] [CrossRef]
  14. Manohar, V.; Soundararajan, P.; Raju, H.; Goldgof, D.; Kasturi, R.; Garofolo, J. Performance evaluation of object detection and tracking in video. In Asian Conference on Computer Vision; Springer: Berlin, Heidelberg, 2006; pp. 151–161. [Google Scholar]
  15. Gade, R.; Moeslund, T. Thermal tracking of sports players. Sensors 2014, 14, 13679–13691. [Google Scholar] [CrossRef] [PubMed]
  16. Bernardin, K.; Stiefelhagen, R. Evaluating multiple object tracking performance: The clear mot metrics. EURASIP J. Image Video Process. 2008, 2008, 246309. [Google Scholar] [CrossRef]
  17. Bochinski, E.; Eiselein, V.; Sikora, T. High-speed tracking-by-detection without using image information. In Proceedings of the 2017 14th IEEE International Conference on Advanced Video and Signal Based Surveillance (AVSS), Lecce, Italy, 29 August–1 September 2017; pp. 1–6. [Google Scholar]
  18. Wan, X.; Wang, J.; Zhou, S. An online and flexible multi-object tracking framework using long short-term memory. In Proceedings of the IEEE Conference on Computer Vision and Pattern Recognition Workshops, Salt Lake City, UT, USA, 18–22 June 2018; pp. 1230–1238. [Google Scholar]
  19. Bewley, A.; Ge, Z.; Ott, L.; Ramos, F.; Upcroft, B. Simple online and realtime tracking. In Proceedings of the 2016 IEEE International Conference on Image Processing (ICIP), Phoenix, AZ, USA, 25–28 September 2016; pp. 3464–3468. [Google Scholar]
  20. Wu, Y.; Lim, J.; Yang, M. Object tracking benchmark. IEEE Trans. Pattern Anal. Mach. Intell. 2015, 37, 1834–1848. [Google Scholar] [CrossRef] [PubMed]
  21. Čehovin, L.; Kristan, M.; Leonardis, A. Is my new tracker really better than yours? In Proceedings of the IEEE Winter Conference on Applications of Computer Vision, Steamboat Springs, CO, USA, 24–26 March 2014; pp. 540–547. [Google Scholar]
  22. Čehovin, L.; Leonardis, A.; Kristan, M. Visual object tracking performance measures revisited. IEEE Trans. Image Process. 2016, 25, 1261–1274. [Google Scholar] [PubMed]
  23. Wang, Q.; Gong, D.; Qi, M.; Shen, Y.; Lei, Y. Temporal sparse feature auto-combination deep network for video action recognition. Concurr. Comput. Pract. Exp. 2018, 30, e4487. [Google Scholar] [CrossRef]
  24. Jiang, X.; Xiao, Z.; Zhang, B.; Zhen, X.; Cao, X.; Doermann, D.; Shao, L. Crowd counting and density estimation by trellis encoder-decoder networks. In Proceedings of the IEEE Computer Society Conference on Computer Vision and Pattern Recognition, Long Beach, CA, USA, 15–20 June 2019; pp. 6126–6135. [Google Scholar]
  25. Chen, X.; Lai, J. Detecting abnormal crowd behaviors based on the div-curl characteristics of flow fields. Pattern Recognit. 2019, 88, 342–355. [Google Scholar] [CrossRef]
  26. Wei, X.; Du, J.; Xue, Z.; Liang, M.; Geng, Y.; Xu, X.; Lee, J. A very deep two-stream network for crowd type recognition. Neurocomputing 2019, 396, 106–112. [Google Scholar] [CrossRef]
  27. Vahora, S.; Chauhan, N. Deep neural network model for group activity recognition using contextual relationship. Eng. Sci. Technol. Int. J. 2019, 22, 47–54. [Google Scholar] [CrossRef]
  28. Jing, S.; Chen, C.; Kang, X.K. Slicing convolutional neural network for crowd video understanding. In Proceedings of the IEEE Conf Comput Vis Pattern Recognition, Las Vegas, NV, USA, 27–30 June 2016; pp. 5620–5628. [Google Scholar]
Figure 1. The structure of the centralized lighting control system.
Electronics 12 01671 g001
Figure 2. The structure of the distributed lighting control system.
Electronics 12 01671 g002
Figure 3. The model of the distributed system.
Electronics 12 01671 g003
Figure 4. Project creation and loading.
Electronics 12 01671 g004
Figure 5. Principles of data collection.
Electronics 12 01671 g005
Figure 6. Personalized control principle.
Electronics 12 01671 g006
Figure 7. Configuration software schematic diagram.
Electronics 12 01671 g007
Figure 8. Schematic diagram of data acquisition configuration.
Electronics 12 01671 g008
Figure 9. Privilege configuration principle.
Electronics 12 01671 g009
Figure 10. Experimental equipment and layout.
Electronics 12 01671 g010
Figure 11. Server deployment.
Electronics 12 01671 g011
Figure 12. Users’ positioning results.
Electronics 12 01671 g012
Figure 13. Comparison of the total luminous flux of indoor lighting equipment.
Electronics 12 01671 g013
Table 1. Platform and controller communication protocol.
Buf [1]Buf [2]Buf [3]Buf [4]Buf [Lenth]Buf [2]
Data headerControl typeArea numberDevice IPData symbolEnd instruction
lbytelbytelbytelbytelengthbyteslbyte
Table 7. Comparison table of user’s actual location and measurement location.
TimeUser A LocationUser B Location
Actual LocationPositioning PositionForecast LocationActual LocationPositioning PositionForecast Location
2(4.16, 3.18)(4.17, 3.32)(3.97, 3.85)(13.04, 2.68)(13.14, 2.78)(12.91, 3.14)
5(3.52, 5.32)(3.64, 5.46)(3.37, 6.27)(12.72, 5.07)(12.87, 5.32)(13.14, 4.52)
9(3.05, 8.08)(3.11, 8.35)(2.98, 9.14)(14.37, 7.61)(14.43, 7.88)(15.17, 8.18)
13(4.32, 10.51)(4.41, 10.66)(5.02, 11.09)(16.21, 9.36)(16.01, 9.37)(15.64, 9.28)
17(7.24, 10.47)(7.47, 10.76)(8.19, 10.52)(14.01, 10.18)(14.29, 10.41)(13.58, 10.46)
21(9.93, 9.28)(10.13, 9.56)(10.81, 9.22)(11.01, 10.21)(11.27, 10.31)(10.57, 10.19)
25(12.22, 7.22)(12.37, 7.43)(12.85, 6.83)(8.38, 9.52)(8.47, 9.66)(7.78, 9.38)
29(13.57, 4.58)(13.68, 4.78)(13.97, 4.09)(6.03, 7.78)(6.28, 7.84)(5.78, 7.28)
33(13.88, 2.04)(14.01, 2.31)(13.85, 3.04)(4.71, 5.41)(4.72, 5.42)(4.38, 4.77)
Table 8. Experimental lighting control data.
TimeActual Position Illuminance (Unit: lux)Predicted Position Illuminance (Unit: lux)The Luminous Flux of the Lamp (Unit: lm)Total Luminous Flux (Unit lm)
2A: 61.4A: 60.8L2: 191.2, L3: 286.8, L4: 429.2, L6: 192.8,
L7: 453.3, L8: 463.7, Ll1: 417.9, Ll2: 439.3,
L15: 264.4, L16: 337.6, L19: 99.3, L24: 286.8
3862.3
B: 41.1B: 40.7
5A: 60.6A: 60.4L2: 374.2, L3: 465.8, L4: 434.3, L6: 439.7,
L7: 462.8, L8: 226.6, L10: 108.7, L12: 186.3,
Ll6: 163.8, L18: 96.3, L20: 464.1, L24: 229.1
3650.8
B: 41.3B: 40.6
9A: 61.2A: 59.8L1: 470.1, L2: 470.1, L3: 468.5, L5: 291.6,
L6: 448.4, L7: 294.6, Ll3: 137.6, L14: 355.2,
L21: 206.5, L22: 470.1
3611.8
B: 40.8B: 40.7
13A: 60.2A: 59.6Ll: 462.8, L2: 231.2, L5: 456.4, L6: 424.5,
L10: 277.3, Ll3: 350.8, Ll6: 138.1, L17: 287.5, L18: 335.8, L21: 459.6
3423.8
B: 40.8B: 40.9
17A: 60.8A: 60.5L2: 170.2, L3: 237.4, L5: 461.3, L6: 93.7, L9: 463.5, L10: 461.3, L13: 469.3, L14: 126.1, L21: 302.42784.4
B: 41.1B: 40.7
21A: 57.9A: 58.6Ll: 112.9, L2: 199.4, L3: 310.8, L4: 287.9
L5: 124.5, L6: 106.4, L7: 271.44, L8: 50, 9, L9: 318.8L10: 136.1, Ll1: 193.1, L12: 226.8, L13: 324.4, Ll4: 154.8, L15: 277.3, L16: 357.3, Ll7: 28.3, Ll8: 15.1, L19: 97.8, L20: 212.5, L21: 30.8, L22: 199.4, L23: 56.5L24: 97.5
4188.5
B: 43.3B: 41.6
25A: 61.8A: 60.3L17: 38.8, L3: 408.7, L15: 456.2, L16: 350.9, Ll8: 459.3, L19: 467.4, L20: 460.4, L22: 321.3, L23: 321.5, L24: 70.43354.3
B: 40.8B: 40.2
29A: 60.8A: 60.6Ll4: 31.2, L7: 348.4, L12: 462.4, Ll3: l1.1, L18: 157.8, L19: 463.6, L15: 415.4, Ll6: 196.5, L20: 454.3, L21: 28.4, L23: 460.8, L24: 464.9L1: 106.5, L2: 310.8, L4: 191.5, L3: l10.6,3493.8
B: 40.8B: 40.3
33A: 60.2A: 60.1L7: 104.5, L8: 280.8, L5: 216.6, L6: 159.7, L10: 123.4, Ll1: 210.2, L9: 281.5, Ll2: 150.5, L14: 237.7, L15: 271.6, L16: 99.8,
L13: 345.3, L17: 227.8, Ll8: 181.6, L19: 3747, L20: 446.3, L24: 276.3L21: 359.1
L22: 96.3, L23: 254.4,
5414.6
Disclaimer/Publisher’s Note: The statements, opinions and data contained in all publications are solely those of the individual author(s) and contributor(s) and not of MDPI and/or the editor(s). MDPI and/or the editor(s) disclaim responsibility for any injury to people or property resulting from any ideas, methods, instructions or products referred to in the content.

