Article

Thermal Runaway Characteristics and Gas Composition Analysis of Lithium-Ion Batteries with Different LFP and NCM Cathode Materials under Inert Atmosphere

1
College of Locomotive and Rolling Stock Engineering, Dalian Jiaotong University, Dalian 116028, China
2
State Key Laboratory of Automotive Safety and Energy, Tsinghua University, Beijing 100084, China
*
Authors to whom correspondence should be addressed.
Electronics 2023, 12(7), 1603; https://doi.org/10.3390/electronics12071603
Submission received: 28 February 2023 / Revised: 23 March 2023 / Accepted: 28 March 2023 / Published: 29 March 2023
(This article belongs to the Special Issue Energy Storage, Analysis and Battery Usage)

Abstract

:
During thermal runaway (TR), lithium-ion batteries (LIBs) produce a large amount of gas, which can cause unimaginable disasters in electric vehicles and electrochemical energy storage systems when the batteries fail and subsequently combust or explode. Therefore, to systematically analyze the post-thermal runaway characteristics of commonly used LIBs with LiFePO 4 (LFP) and LiNi x C o y M n z O 2 (NCM) cathode materials and to maximize the in situ gas generation during battery thermal runaway, we designed experiments using an adiabatic explosion chamber (AEC) under an inert atmosphere to test LIBs. Additionally, we conducted in situ analysis of the gas components produced during thermal runaway. Our research findings indicate that after thermal runaway, NCM batteries produce more gas than LFP batteries. Based on battery gas production, the degree of harm caused by TR can be ranked as follows: NCM9 0.5 0.5 > NCM811 > NCM622 > NCM523 > LFP. The primary gas components during thermal runaway for both NCM and LFP batteries include H 2 , C O , C O 2 , C 2 H 4 , and C H 4 . The gas produced by LFP batteries contains a high proportion of H 2 . The high concentration of H 2 results in a lower flammability limit (LFL) for the gas generated by LFP batteries during TR compared to the mixed gas produced by NCM batteries. Therefore, in terms of battery TR gas composition, the order of hazard level is LFP > NCM811 > NCM622 > NCM523 > NCM9 0.5 0.5 0.5. Although experimental results show that LFP batteries have superior thermal stability and lower gas production during large-scale battery thermal runaway events, considering gas generation composition and thermal runaway products, the thermal runaway risk of LFP batteries may be higher than that of NCM batteries. Although LFP batteries are considered very safe, our research results have once again drawn researchers’ attention to LFP batteries. These gases can also serve as detection signals for battery thermal runaway warnings, providing a cautionary note for the future development of electrochemical energy storage and the renewable energy sector.

1. Introduction

In order to mitigate carbon dioxide emissions and combat global warming, LIBs have gained widespread use in the fields of electric vehicles and energy storage due to their high energy density, good cycle stability, and low self-discharge rate [1,2]. In recent years, TR has emerged as a major safety hazard for batteries in electric vehicles and energy storage applications. As a result, the demand for improvements in the driving range of electric vehicles and the reduction of vehicle weight [3] has led to the development of cathode materials such as LiFePO 4 and high-energy density cathode materials such as LiNi X C o y M n z O 2 [4,5].
TR is a major cause of energy failure in batteries and is primarily caused by a series of exothermic reactions that occur after the exothermic chemical reaction of the high-oxidizing positive electrode and high-reducing negative electrode [6,7,8,9]. As the temperature of the battery increases, the SEI (solid electrolyte interphase) film between the solid electrolyte breaks, leading to a reaction between the anode and electrolyte. This electrolyte decomposition results in toxic gases ( H F , C O ) and combustible gases ( H 2 and alkane gases) [10,11,12]. TR results in the generation of increasing amounts of gas within the battery. When the internal pressure reaches a critical point, the vent valve of the square shell battery opens, while the soft-pack battery may experience cracks in areas of low surface pressure, leading to battery rupture [13,14]. The gas injection leads to the discharge of both solid and liquid from the battery, and the emitted gas is a primary combustion substance in a fire [15]. High temperature particles can also act as ignition sources during fires [16]. In recent years, incidents of TR accidents involving batteries have been frequently reported [17]. Therefore, it is necessary for scholars to study the characteristics of TR and address the safety concerns related to TR as a matter of urgency.
Currently, the primary research methods for investigating TR include the ARC [18,19] and DSC [20,21]. For instance, Kupper and colleagues [22] conducted an experimental and numerical analysis of the TR behavior of cylindrical lithium iron phosphate batteries by combining ARC and DSC. They discovered that the SEI film produces heat when heated, but this heat alone is insufficient to cause TR. Researchers often combine gas production experiments with calorimetry to study the mechanism of TR in batteries. For example, Yuan et al. [23] collected the gas emitted during TR of batteries following ARC testing and analyzed its composition using GC. The results indicate that TR produces combustible gases such as H 2 , C H 4 , C 2 H 2 , C 2 H 4 , C 2 H 6 and C O , which could lead to fire or explosion. Similarly, Gachot [24], Spinner [25], Golubkov [26] and others have also investigated the gas composition emitted during TR of batteries, revealing no release of oxygen. Fu et al. [27] used a cone calorimeter to investigate how the peak heat release rate and gas production concentration during TR of cylindrical batteries increase with an increase in SOC.
Currently, experimental environments for studying battery TR can be categorized into three methods:
Method 1: Open environment experiments. For example, Ping et al. [28] conducted an experiment by connecting five 10 Ah lithium iron phosphate batteries in series and arranging temperature sensors above to study the TR fire phenomenon of LIBs in an open environment. The experimental results showed that the peak value of the ignition flame temperature of the battery differed with varying state of charge (SOC). At 100%, 50%, and 0% SOC, the corresponding flame temperatures were 1500 °C, 1020 °C, and 1091 °C, respectively. Other studies, such as those by Fu et al., Ribiere et al. [29], and Wang et al. [30], have also employed similar open experimental environments in investigating battery TR fire and battery module thermal spread experiments.
Method 2: Semi-open environment experiments. For example, Liu et al. [31]. set up a semi-open lithium-ion battery combustion device to explore the TR ignition behavior of lithium iron phosphate batteries. In this method, the TR of the battery is triggered by side heating of a heating plate, and the gas produced by the TR battery is ignited with an ignition trigger. The experimental results showed that the TR trigger temperatures corresponding to 50% SOC and 100% SOC were 198.6 °C and 184.6 °C, respectively. Other studies, such as those by Zhou et al. [32] and Larsson et al. [33], also employed similar semi-open-air experimental devices to study battery combustion flame characteristics, and tested the gas composition through exhaust pipes. The main representative instruments used in these experiments are ARC and DSC.
Method 3: Closed space experiments. For example, Vijay Somandepalli et al. [34] designed a long cylindrical stainless steel battery test airtight container in an N 2 inert research environment to study the TR of a lithium cobalt oxide (LCO) cathode lithium ion battery in a closed container at 100% SOC. Through the surface arrangement of temperature sensors, the maximum ambient temperature of the battery TR was measured to be 150 °C, and the peak temperature of the battery surface can reach 700 °C.
The three research methods described above have unique requirements for the experimental environment due to their distinct test objectives and requirements. Method 1 primarily focuses on studying the TR combustion and temperature characteristics of LIBs in ambient air. However, it is not able to collect and measure the gas production characteristics of batteries during TR. Method 2 utilizes a semi-closed test environment that allows for the measurement of the combustion gases produced by the battery during TR. However, compared to Method 1, the combustion atmosphere in a semi-closed environment is real-time air, and the test gas may be mixed with other gases in the air. Method 3, in contrast to the first two methods, is unable to observe the combustion characteristics of the battery during TR. However, since it employs a closed test environment, it allows for the complete retention of the battery TR products, which can lead to better analysis results.
Table 1 illustrates the current research status of the lithium-ion battery TR process for the aforementioned three research methods.
Currently, there are many studies on the TR characteristics of different batteries, but most of the research is relatively independent and focused on battery systems. Most studies on battery gas production are conducted in an air atmosphere to achieve in situ measurement of battery TR gas production. This study utilized an AEC device and GC. Prior to the experiment, the interior was filled with inert gas ( N 2 ), resulting in an oxygen content of less than 1% in the oxygen chamber. Battery TR was triggered by lateral heating. The battery was fixed in the AEC chamber with a custom fixture, and the product of the battery TR was completely stored in the container to achieve in situ measurement of gas production.

2. Battery Samples and Experimental Methods

2.1. Battery Samples and Experimental Pretreatment

In this study, the test subjects were selected based on the battery-specific information provided by the manufacturer, as shown in Table 2. The charge–discharge machine used in the experiment had the following parameters: (Neware, CT-4002-5V100A-NA, 2 channels, voltage/current accuracy ± 0.1% FS, power accuracy ± 0.2% FS). All test batteries were discharged to the corresponding lower limit cut-off voltage using a 1/3C rate constant current and then charged to the upper limit cut-off voltage of the corresponding battery using a 1/3 constant current constant voltage. The battery samples were subjected to three charge and discharge cycles.
The test subjects of this study according to the manufacturer’s data battery specific information are shown in Table 2. The parameters of the charge–discharge machine used in the experiment are as follows: (Neware, CT-4002-5V100A-NA, 2 channels, voltage/current accuracy ± 0.1% FS, power accuracy ± 0.2% FS). All test batteries were discharged to the corresponding lower limit cut-off voltage using 1/3C rate constant current and then charged to the upper limit cut-off voltage of the corresponding battery using 1/3 constant current constant voltage. Battery sample charge and discharge cycle three times.

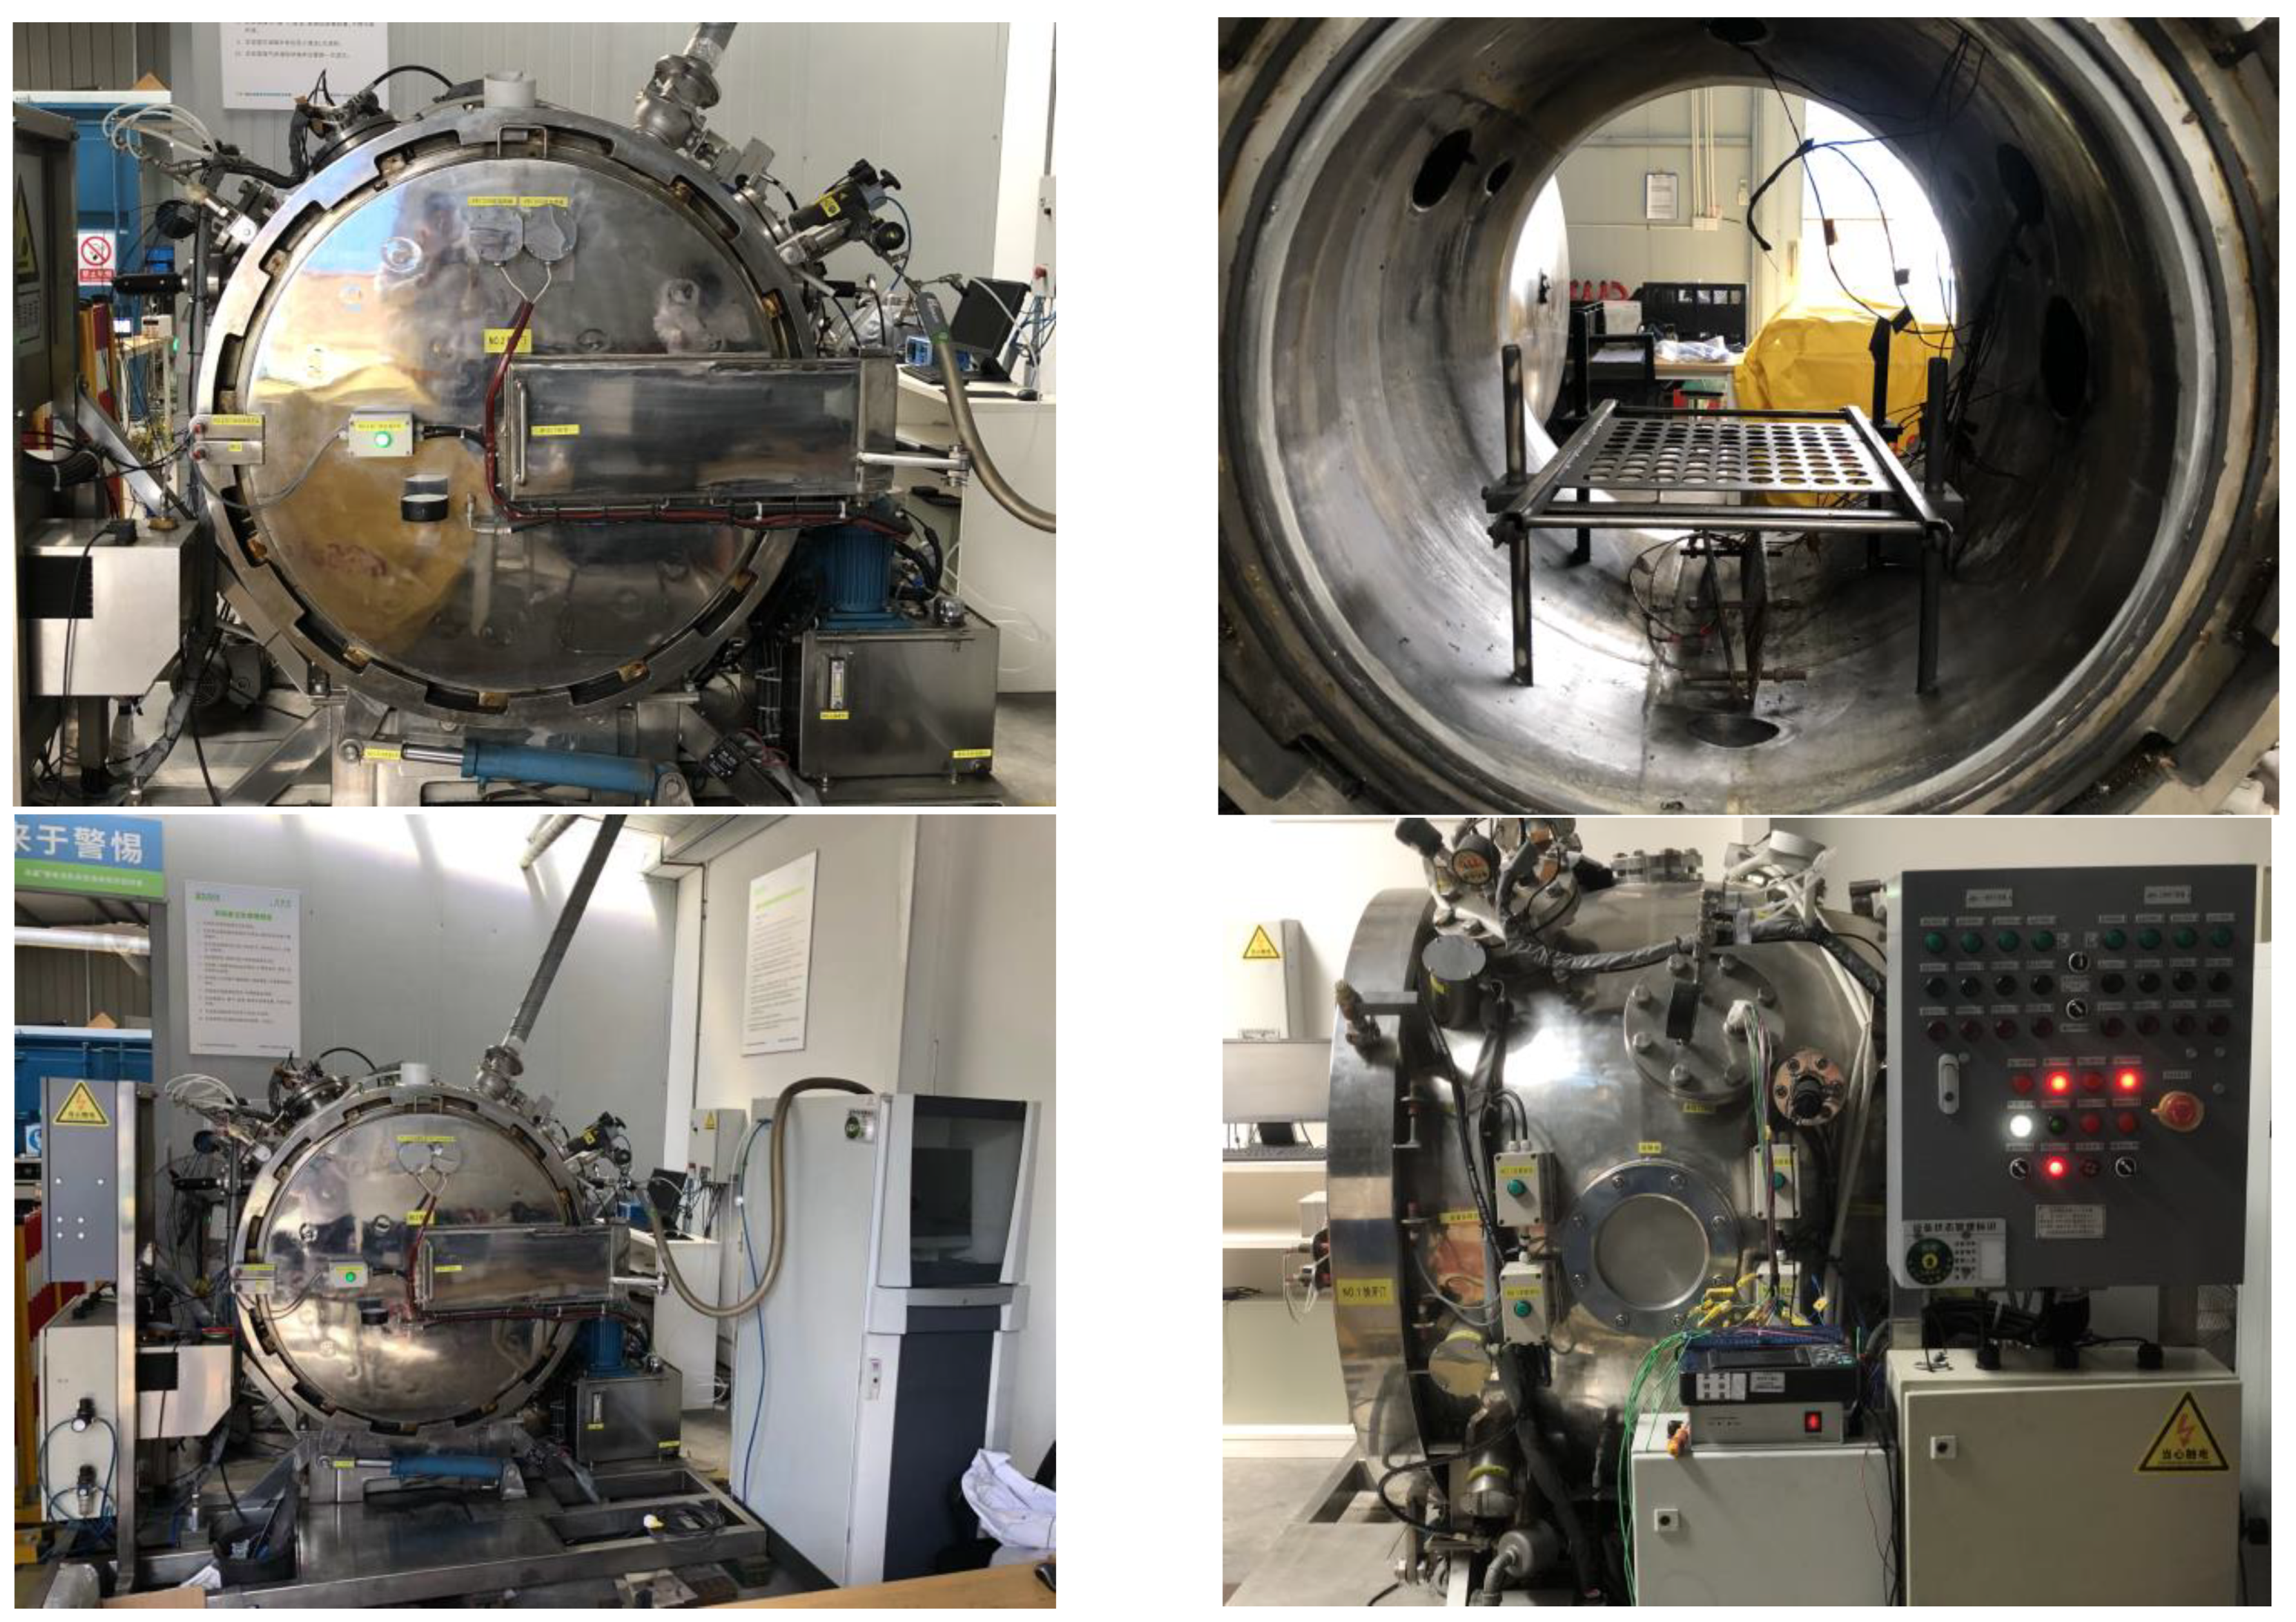
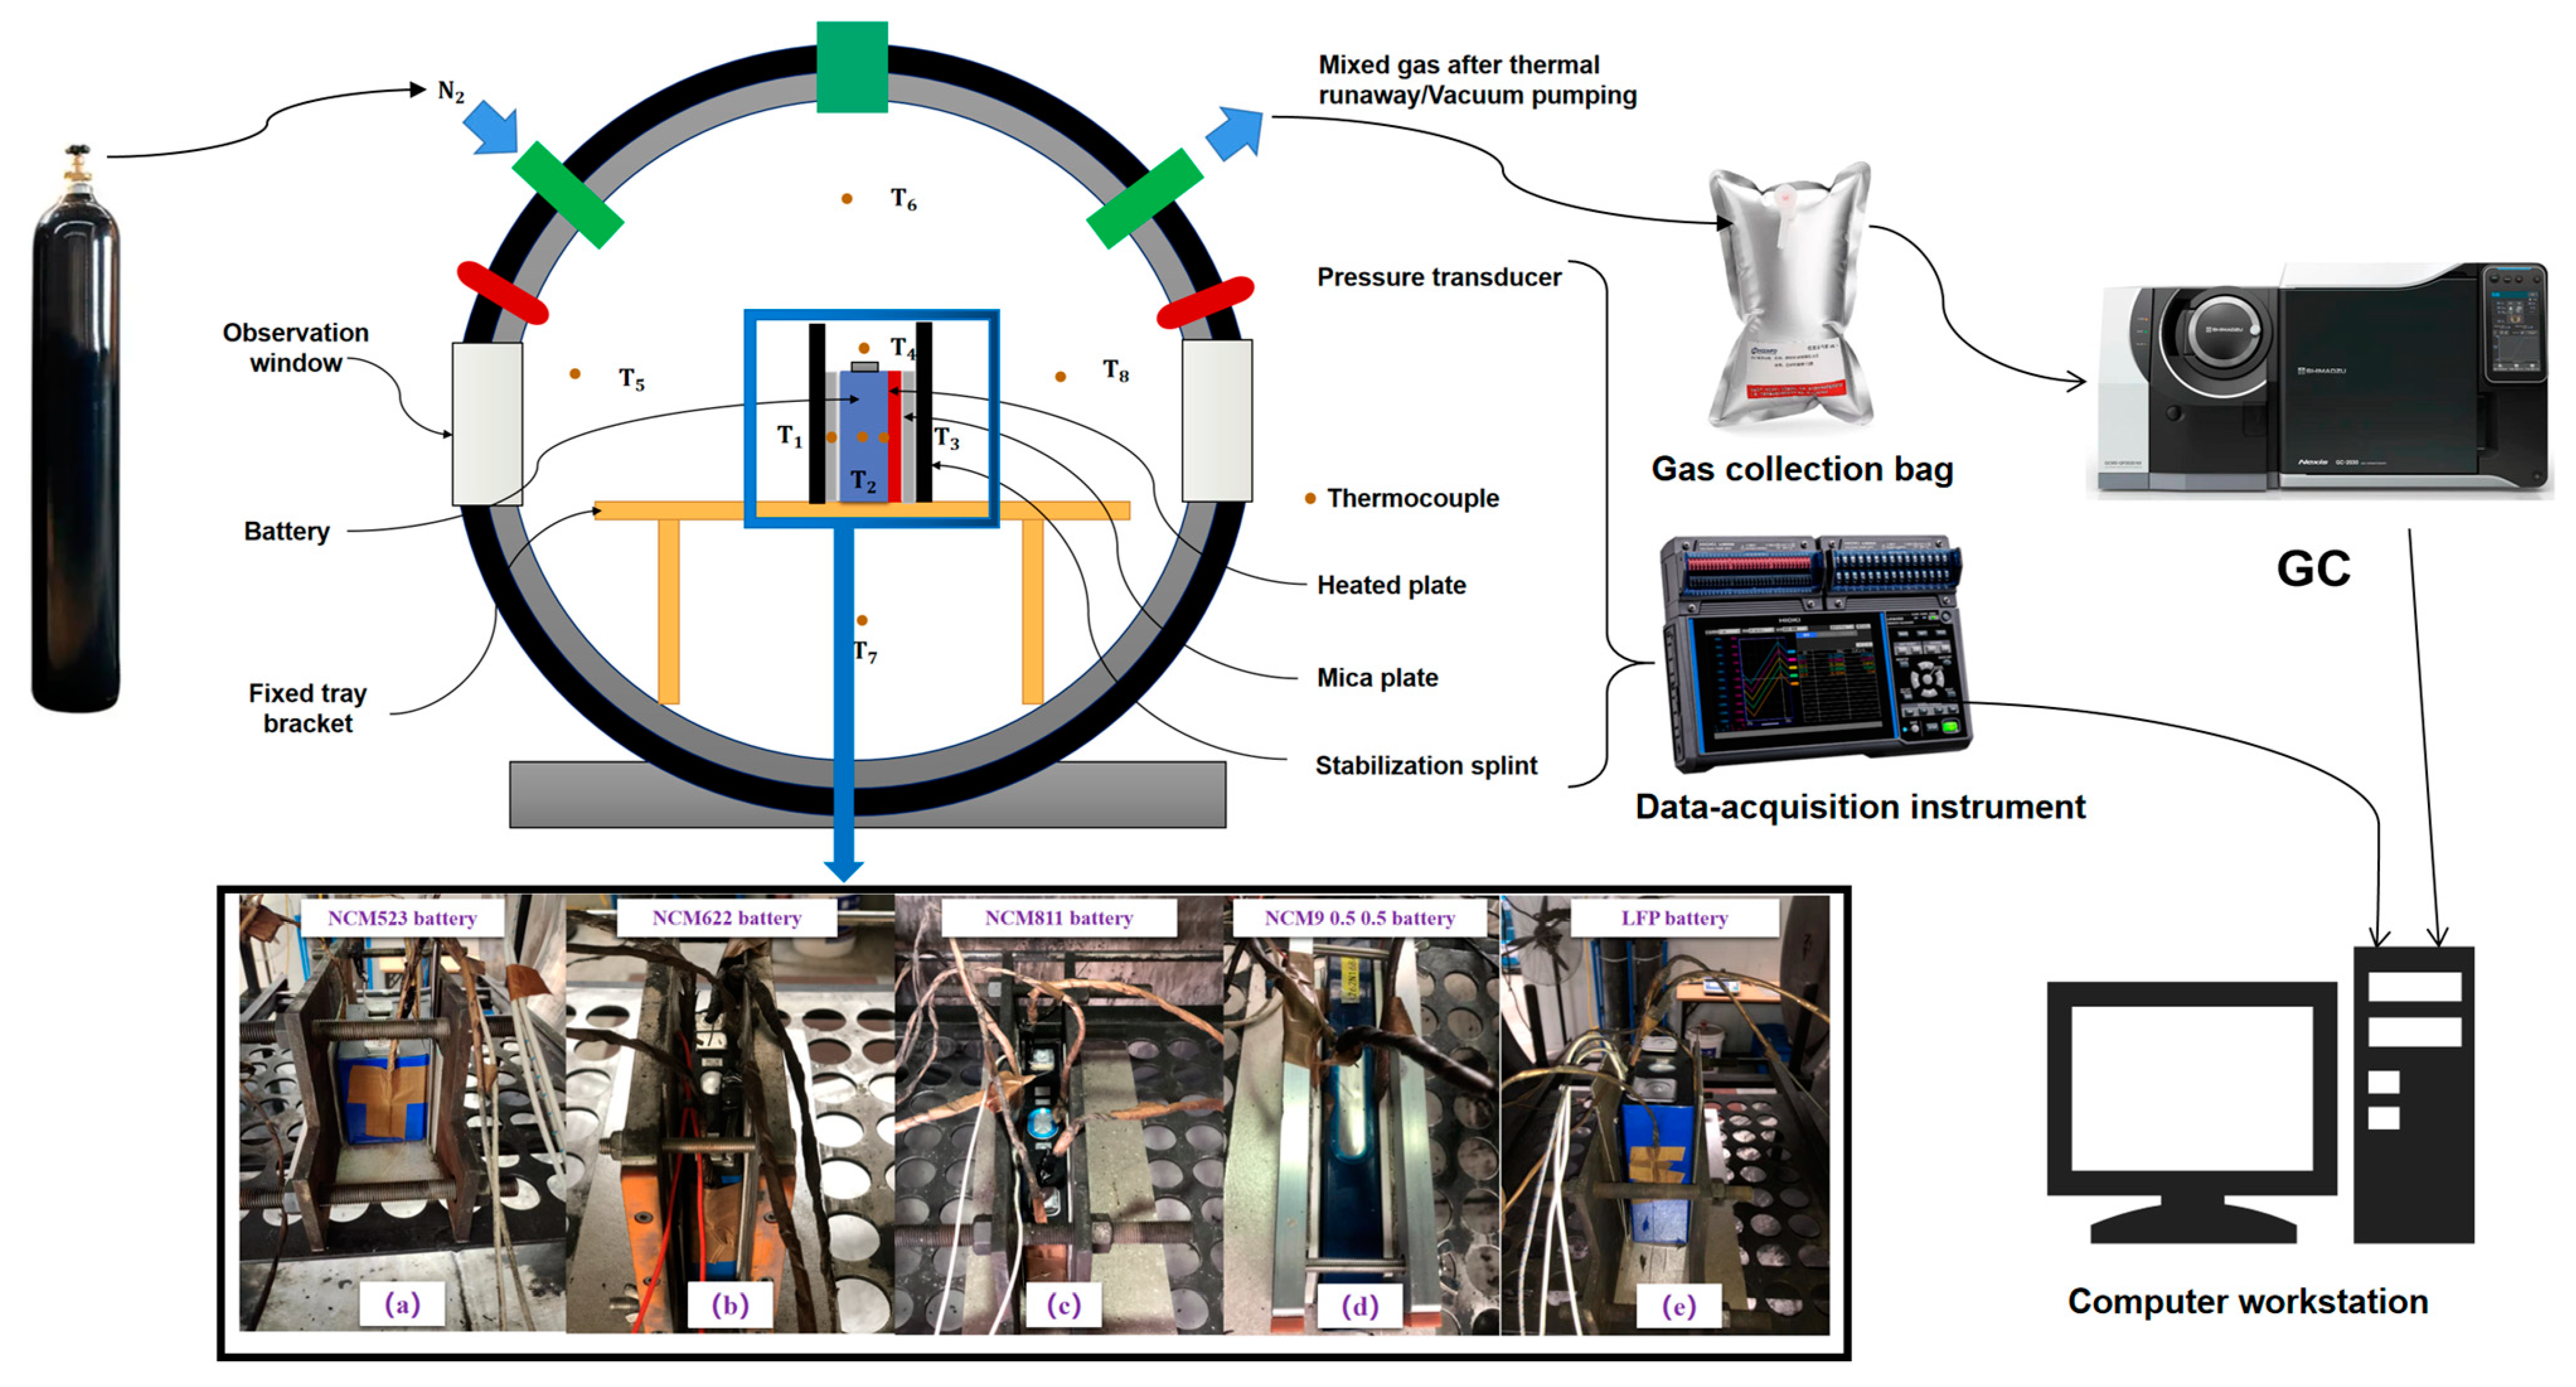
2.2. Experimental Methods

Based on the literature review of previous studies [36,38,40,41,42,43,44], it is clear that the phenomenon of thermal eruption during TR is particularly significant in large-capacity lithium iron batteries. However, existing experimental instruments are inadequate for studying the gas release and eruption characteristics of such batteries during TR. To address this, AEC was designed and developed with a controllable and variable thermal shock, providing an experimental environment with high-pressure resistance and inert protection. This new equipment can induce TR in power batteries under various boundary conditions, resolving the issue of scene distortion in existing experimental equipment and measurement methods that do not meet the needs of experimental research. The physical appearance of the equipment is shown in Figure 1.
The AEC is a high-temperature-resistant, constant-volume sealed test chamber made of stainless steel with a maximum allowable working pressure of 20 MPa. It has an inner and outer double-layer structure, with the inner tank being a closed cavity supported by an outer shell. Vacuum operation between the inner and outer tanks can effectively prevent heat loss to the environment. The heating devices on the outer wall of the inner liner and the front and rear doors allow for precise temperature control inside the combustion bomb.
As a constant-volume experimental chamber, the AEC enables analysis of gas production and gas production rate of the exhaust gas released during TR by analyzing temperature and pressure in the chamber. By placing a thermocouple on the surface of the battery and combining temperature and pressure analysis in the gas atmosphere inside the combustion bomb, an adiabatic environment is created, ignoring heat loss during the TR process. This allows for obtaining the heat release power and heat release of the lithium battery TR during the TR process with good approximation.
Figure 2 illustrates the layout of the battery fixture and the distribution of thermocouples inside the AEC. The interior of the chamber is equipped with eight K-type thermocouples and two pressure sensors, and two wires are used for real-time measurement of the battery voltage. The thermocouples detect the temperature of the battery surface and surrounding environment, while the pressure sensor is used to detect gas release during TR. Both the thermocouples and pressure sensor have a sampling frequency of 10 Hz. The purpose of this study is to investigate the temperature, voltage, and gas generation characteristics of large-capacity LIBs with different cathode materials during TR. To this end, a custom heating plate is used to trigger TR by side heating the battery with a 500 W heating plate customized according to the battery size.
The experimental procedure is as follows:
(a)
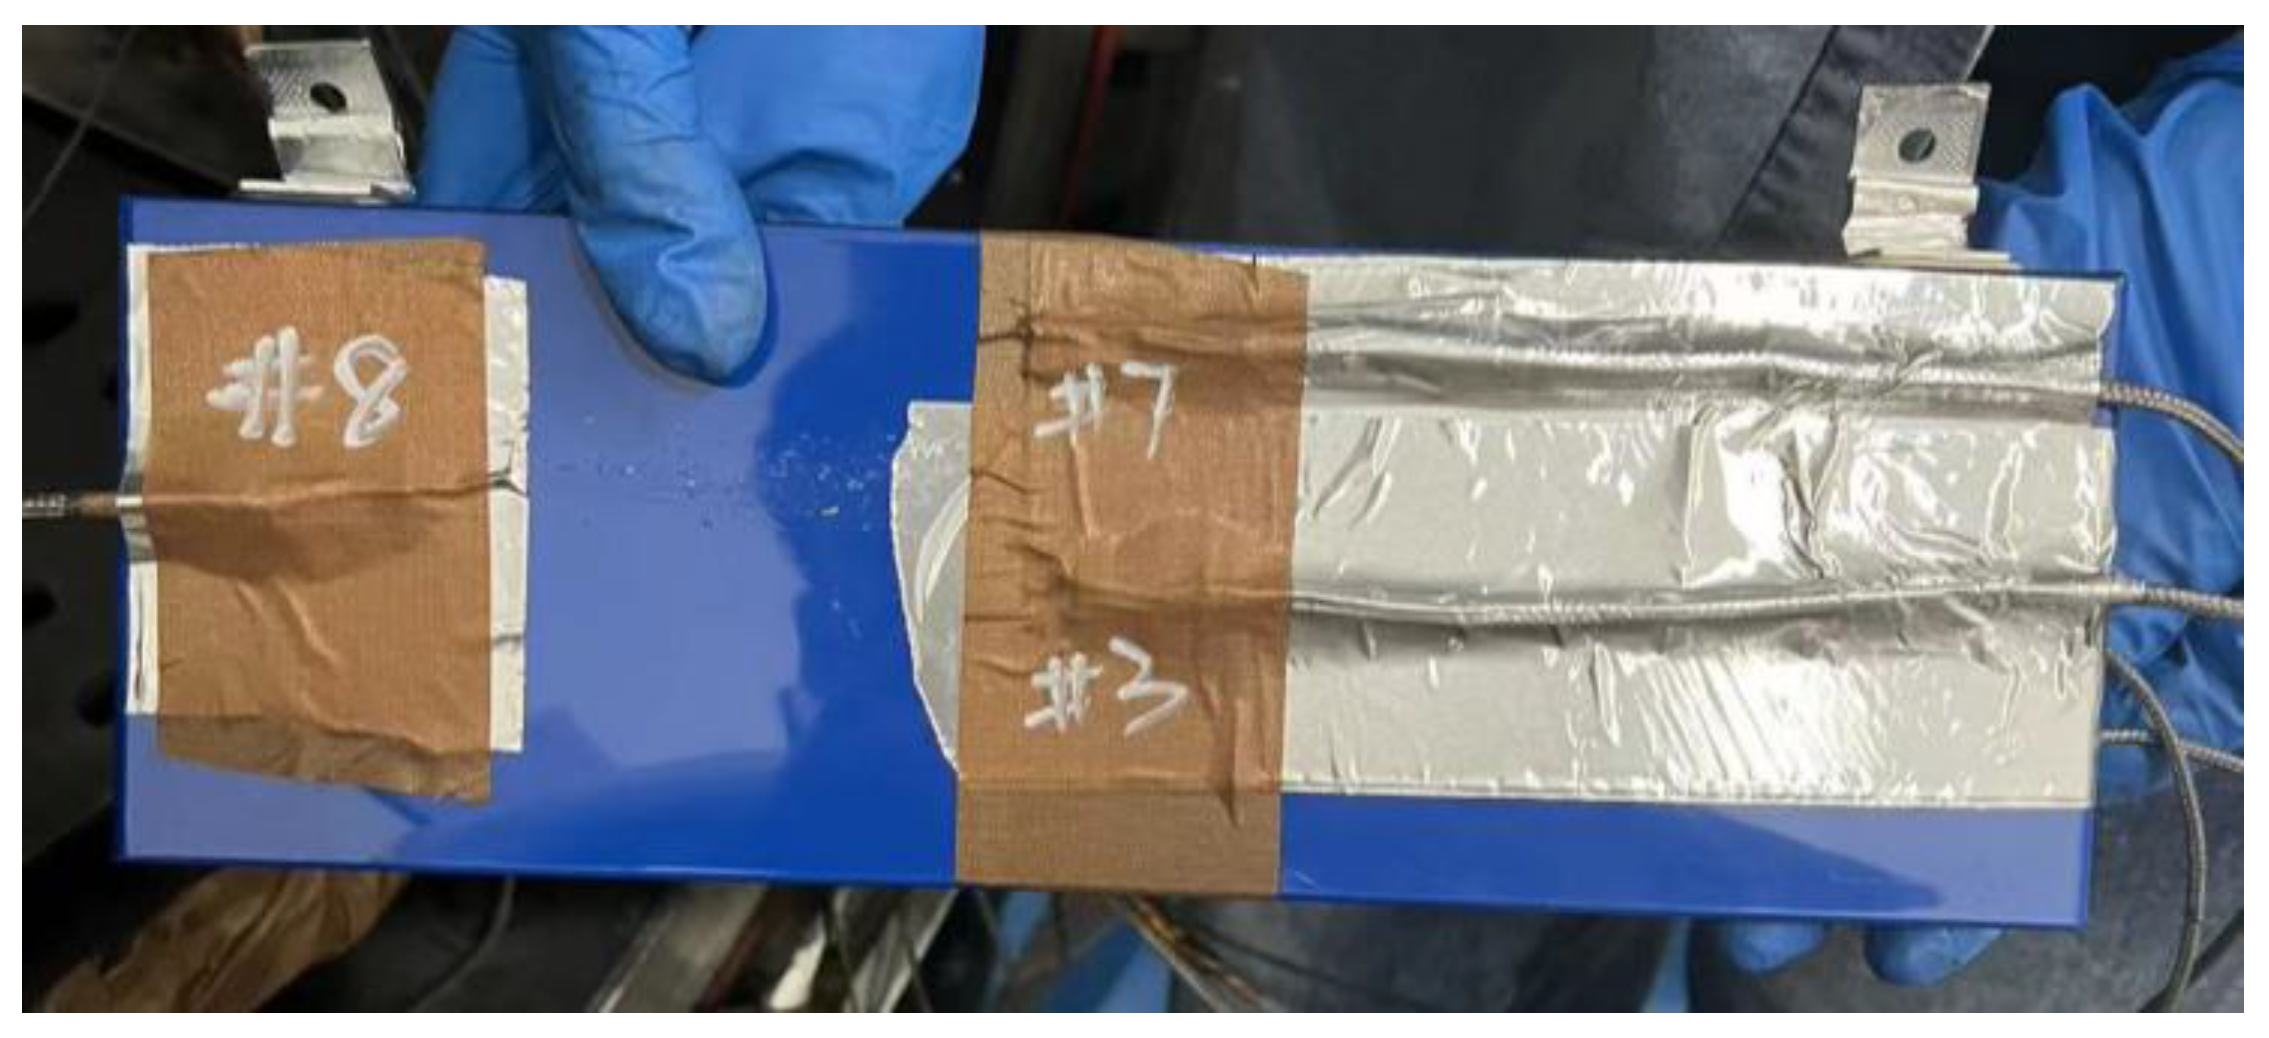
The battery is centrally located within the AEC cabin with a thermocouple affixed to its surface using aluminum tape. Two additional thermocouples (T1 and T3) are positioned at the center of the battery’s large surface, while a third thermocouple (T2) is located on the battery’s side. Four more thermocouples (T5–T8) are evenly placed around the battery in four directions (down, left, right, and ambient) to measure the temperature within the cabin. Additionally, a thermocouple (T4) is situated 30 mm above the safety valve. The heating plate used in the experiment has the same size and arrangement as the battery, as indicated in Figure 2a–e.
(b)
The battery, heating plate, and mica plate are secured using clamps, with the bolt’s tightening force determining the preload.
(c)
After arranging the battery, the AEC cabin door is closed, and the gas within is vacuumed three times to reach a pressure of −90 KPa. The AEC is then refilled with N2 to reach normal pressure, resulting in a 1% reduction in oxygen composition within the AEC. The experiment is allowed to stand for 10 min to ensure that the internal gas is stable and meets the necessary conditions for the next step.
(d)
The heating plate is then turned on, and the battery’s surface temperature, voltage, internal pressure, and other parameters are carefully monitored for any changes. The voltage sag is used as an indication of the start of battery TR, as per previous studies [8,22,36,39,40,41,42,45]. Once the battery voltage drops, the heating plate is turned off, and the experiment is allowed to continue until the battery undergoes TR spontaneously.
(e)
The judgment basis for the end of battery TR release flue gas is determined by monitoring the AEC cabin’s internal pressure fluctuation rate |dp/dt|, which must be less than 0.2 KPa/s and must last for more than 30 s after the occurrence of TR. The experiment ends when the battery surface temperature drops below 80 °C, and the data is saved.
(f)
At the end of the experiment, the battery’s TR product, including particulate matter and electrolyte, is collected and analyzed for its internal gas composition.
Additional notes:
To prevent issues with loose or poorly connected thermocouples during battery TR, this study utilized aluminum tape with good thermal conductivity for attachment, as seen in Figure 3. Following the experiment, the thermocouple remained attached to the measurement point without falling off. The thermocouple used was a K-type armored thermocouple with a maximum measurement temperature of 1500 degrees.
For gas detection, the GC-MS (gas chromatography/mass spectrometry) equipment used in this study was the GC-MS-QP2020 NX model. Its resolution was between 0.5 and 2.0 u, and its quality stability was less than or equal to ±0.1 u/48 h (at constant temperature). The maximum scan speed was 18,000 u/sec, and its ionization energy ranged from 10 to 180 eV.

3. Experimental Results and Data Analysis

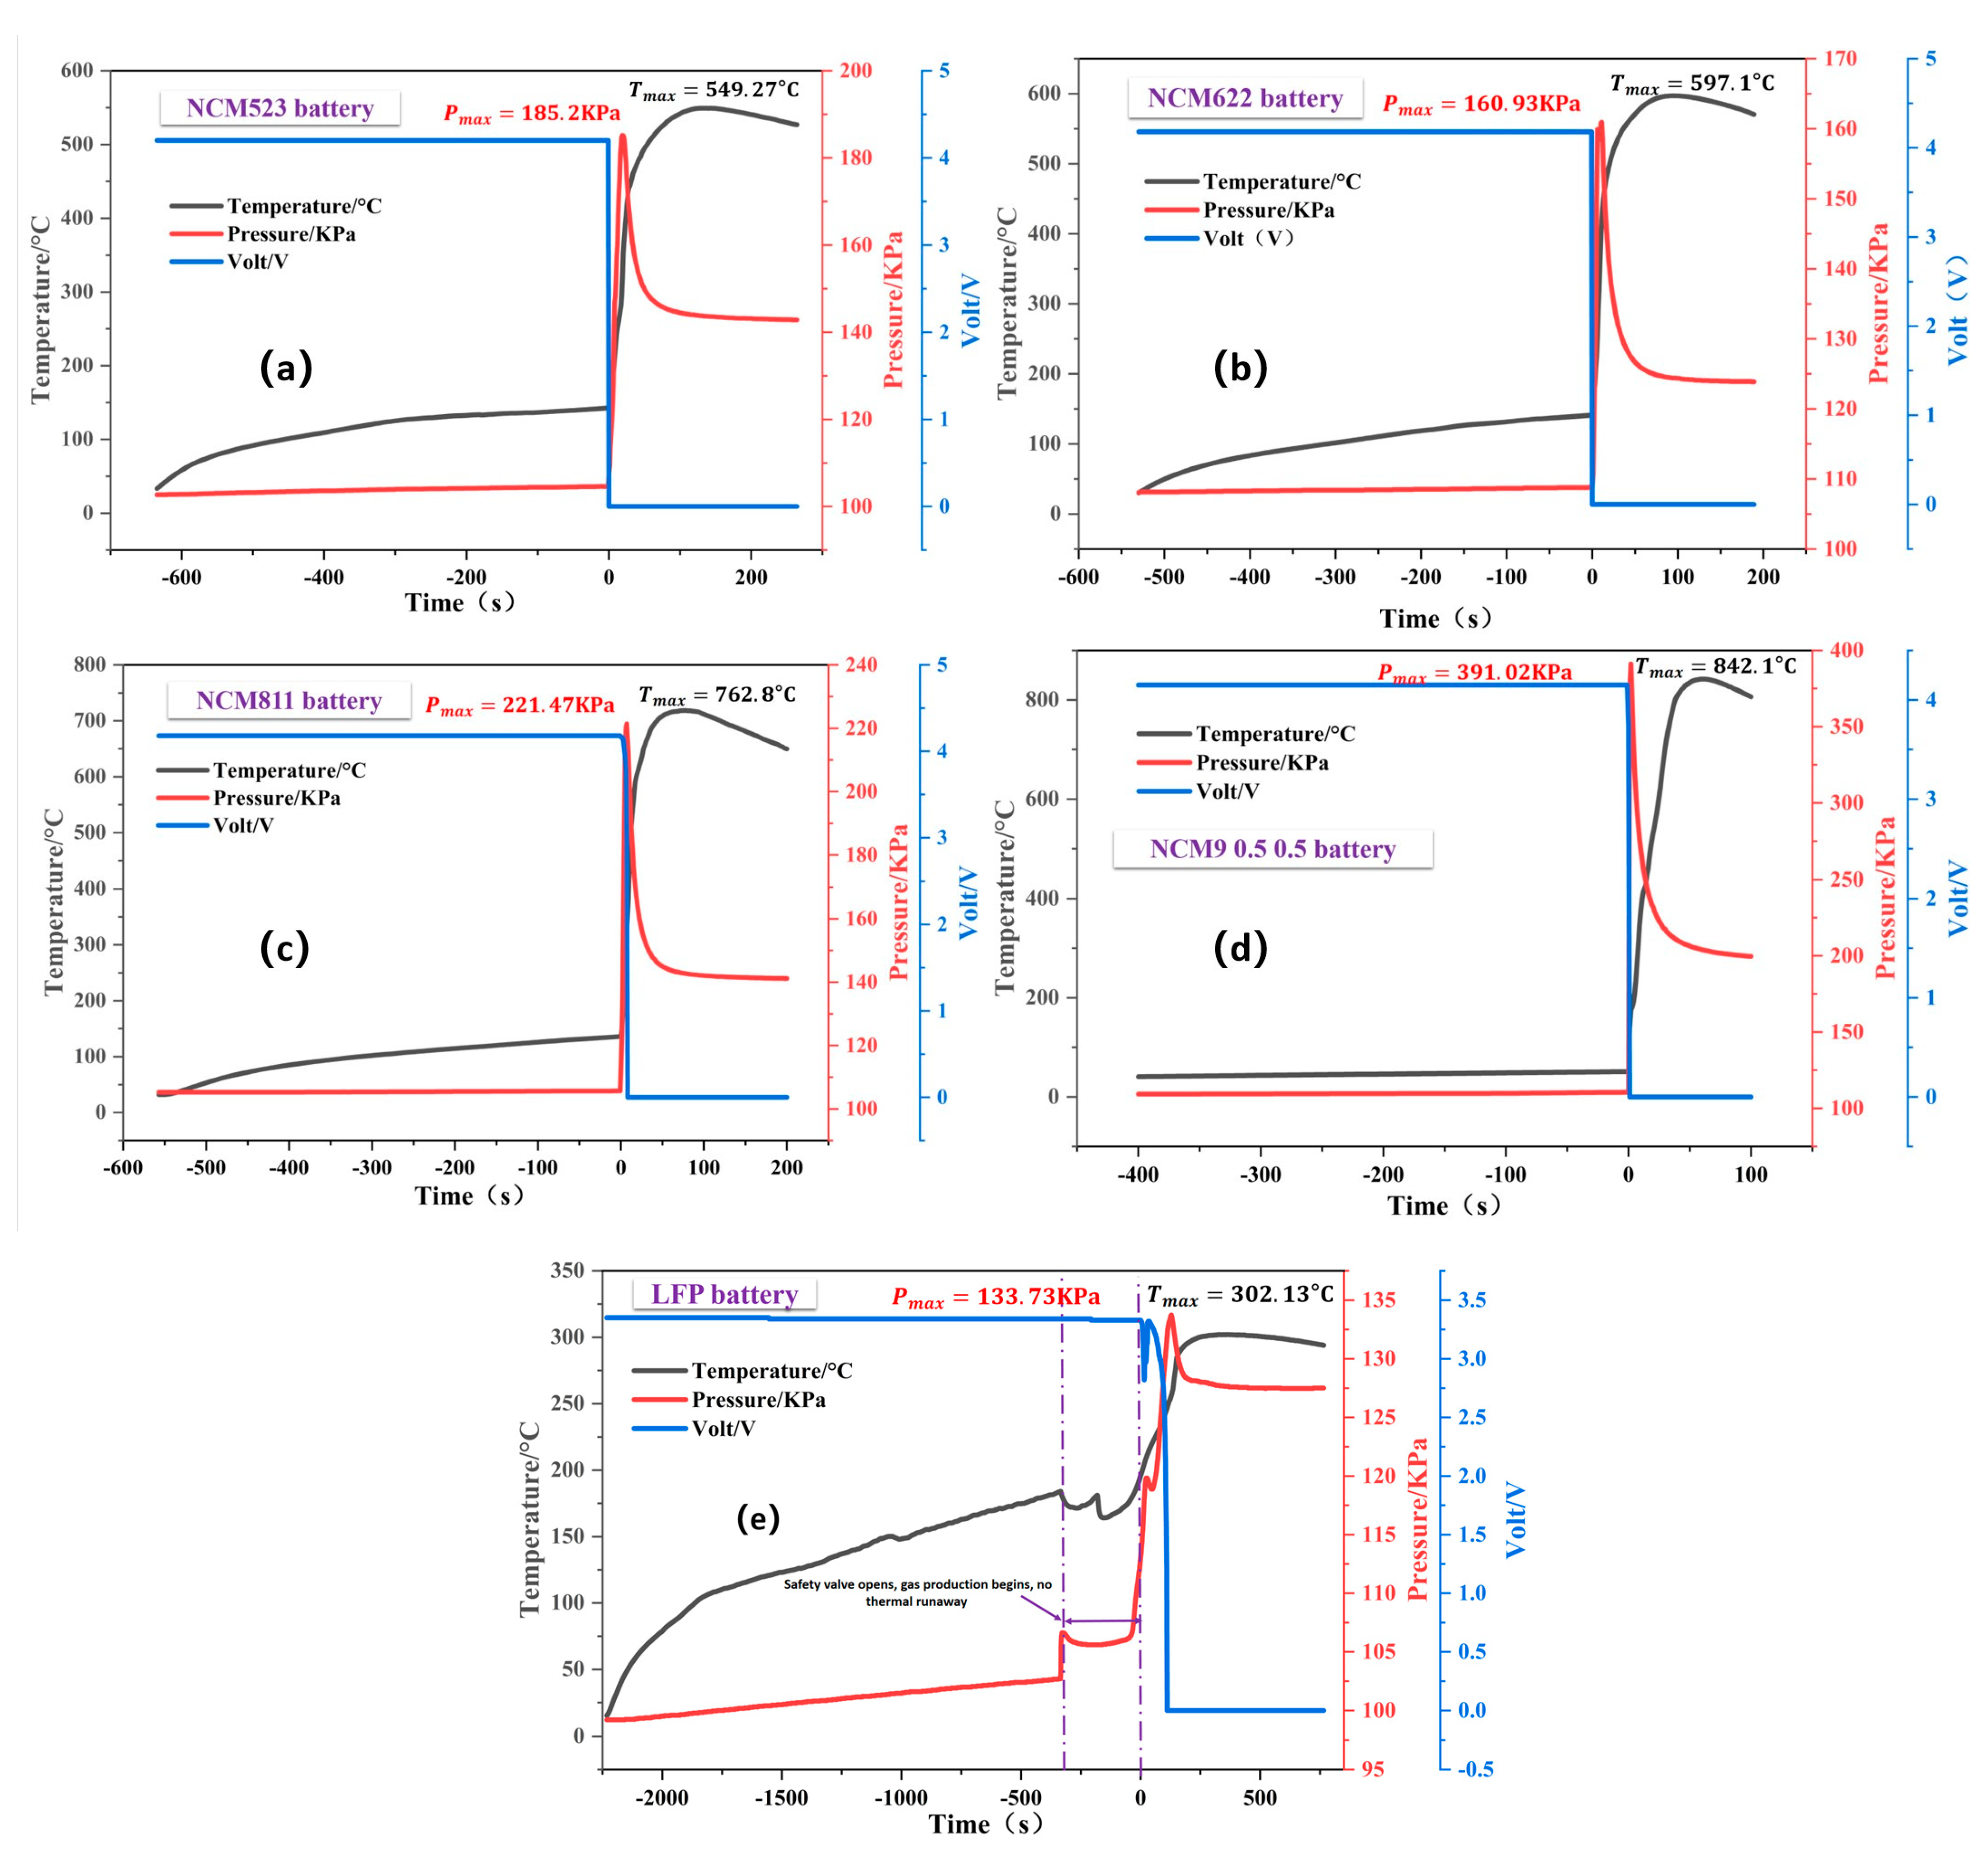
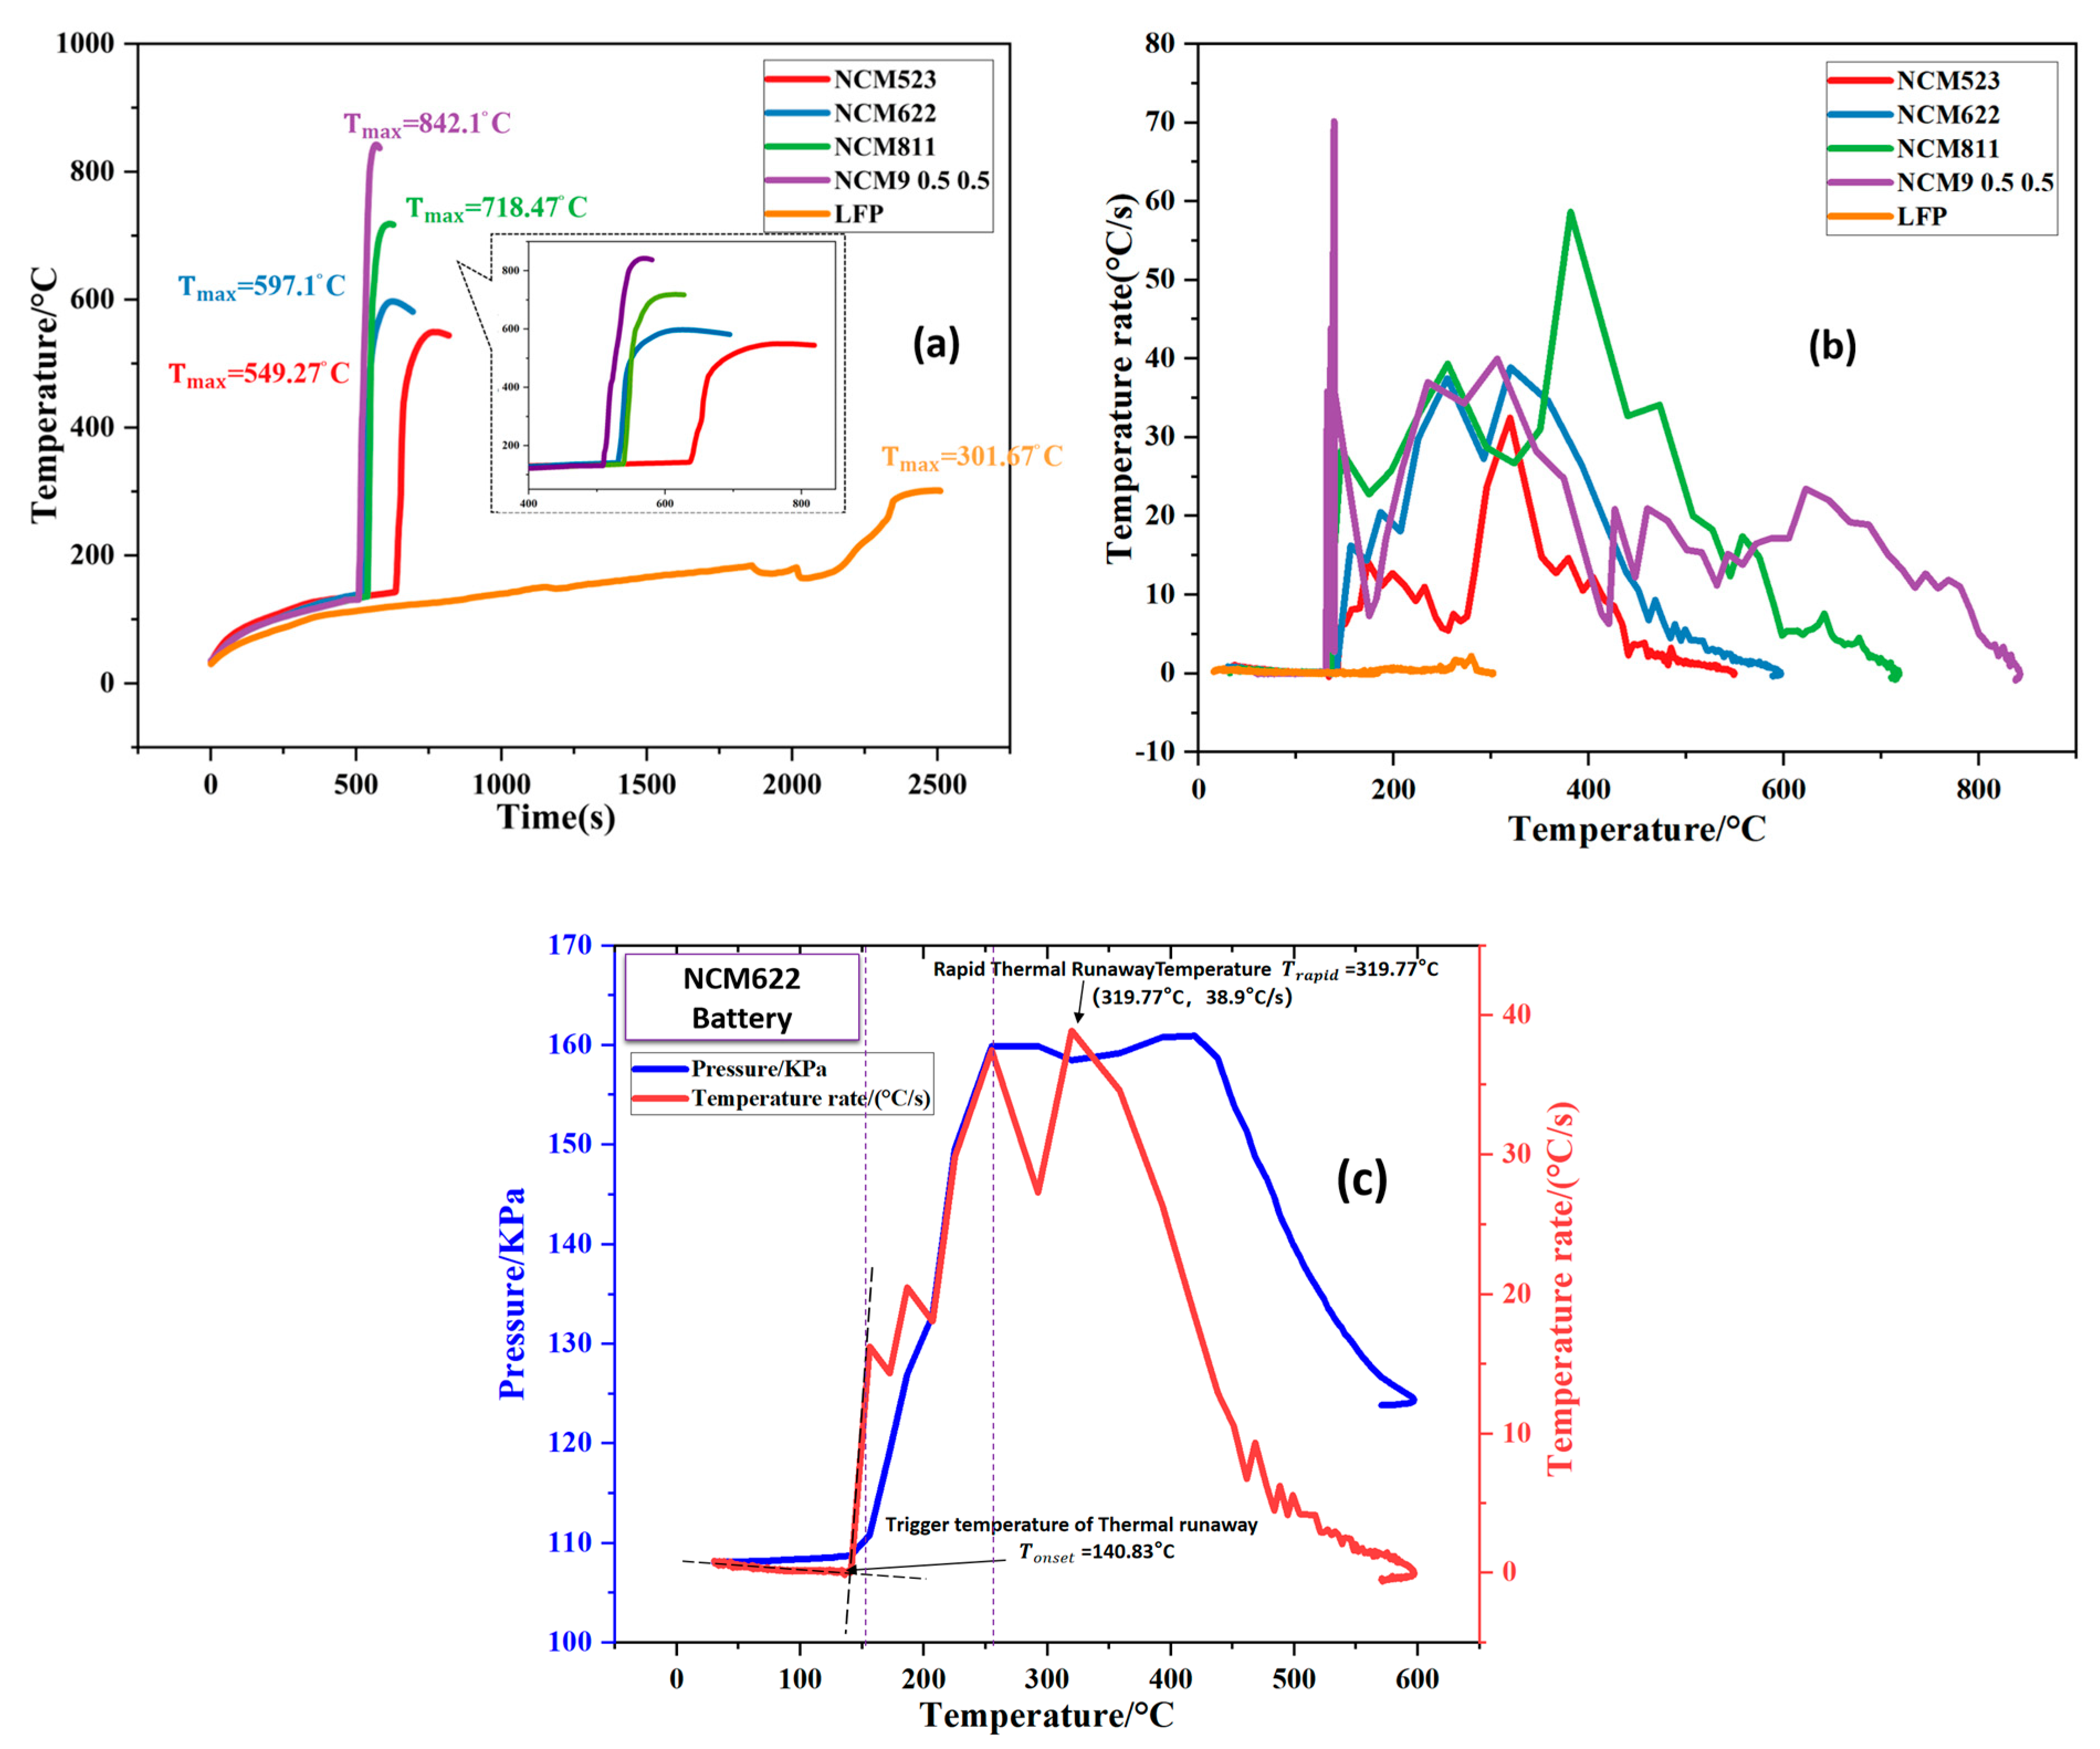
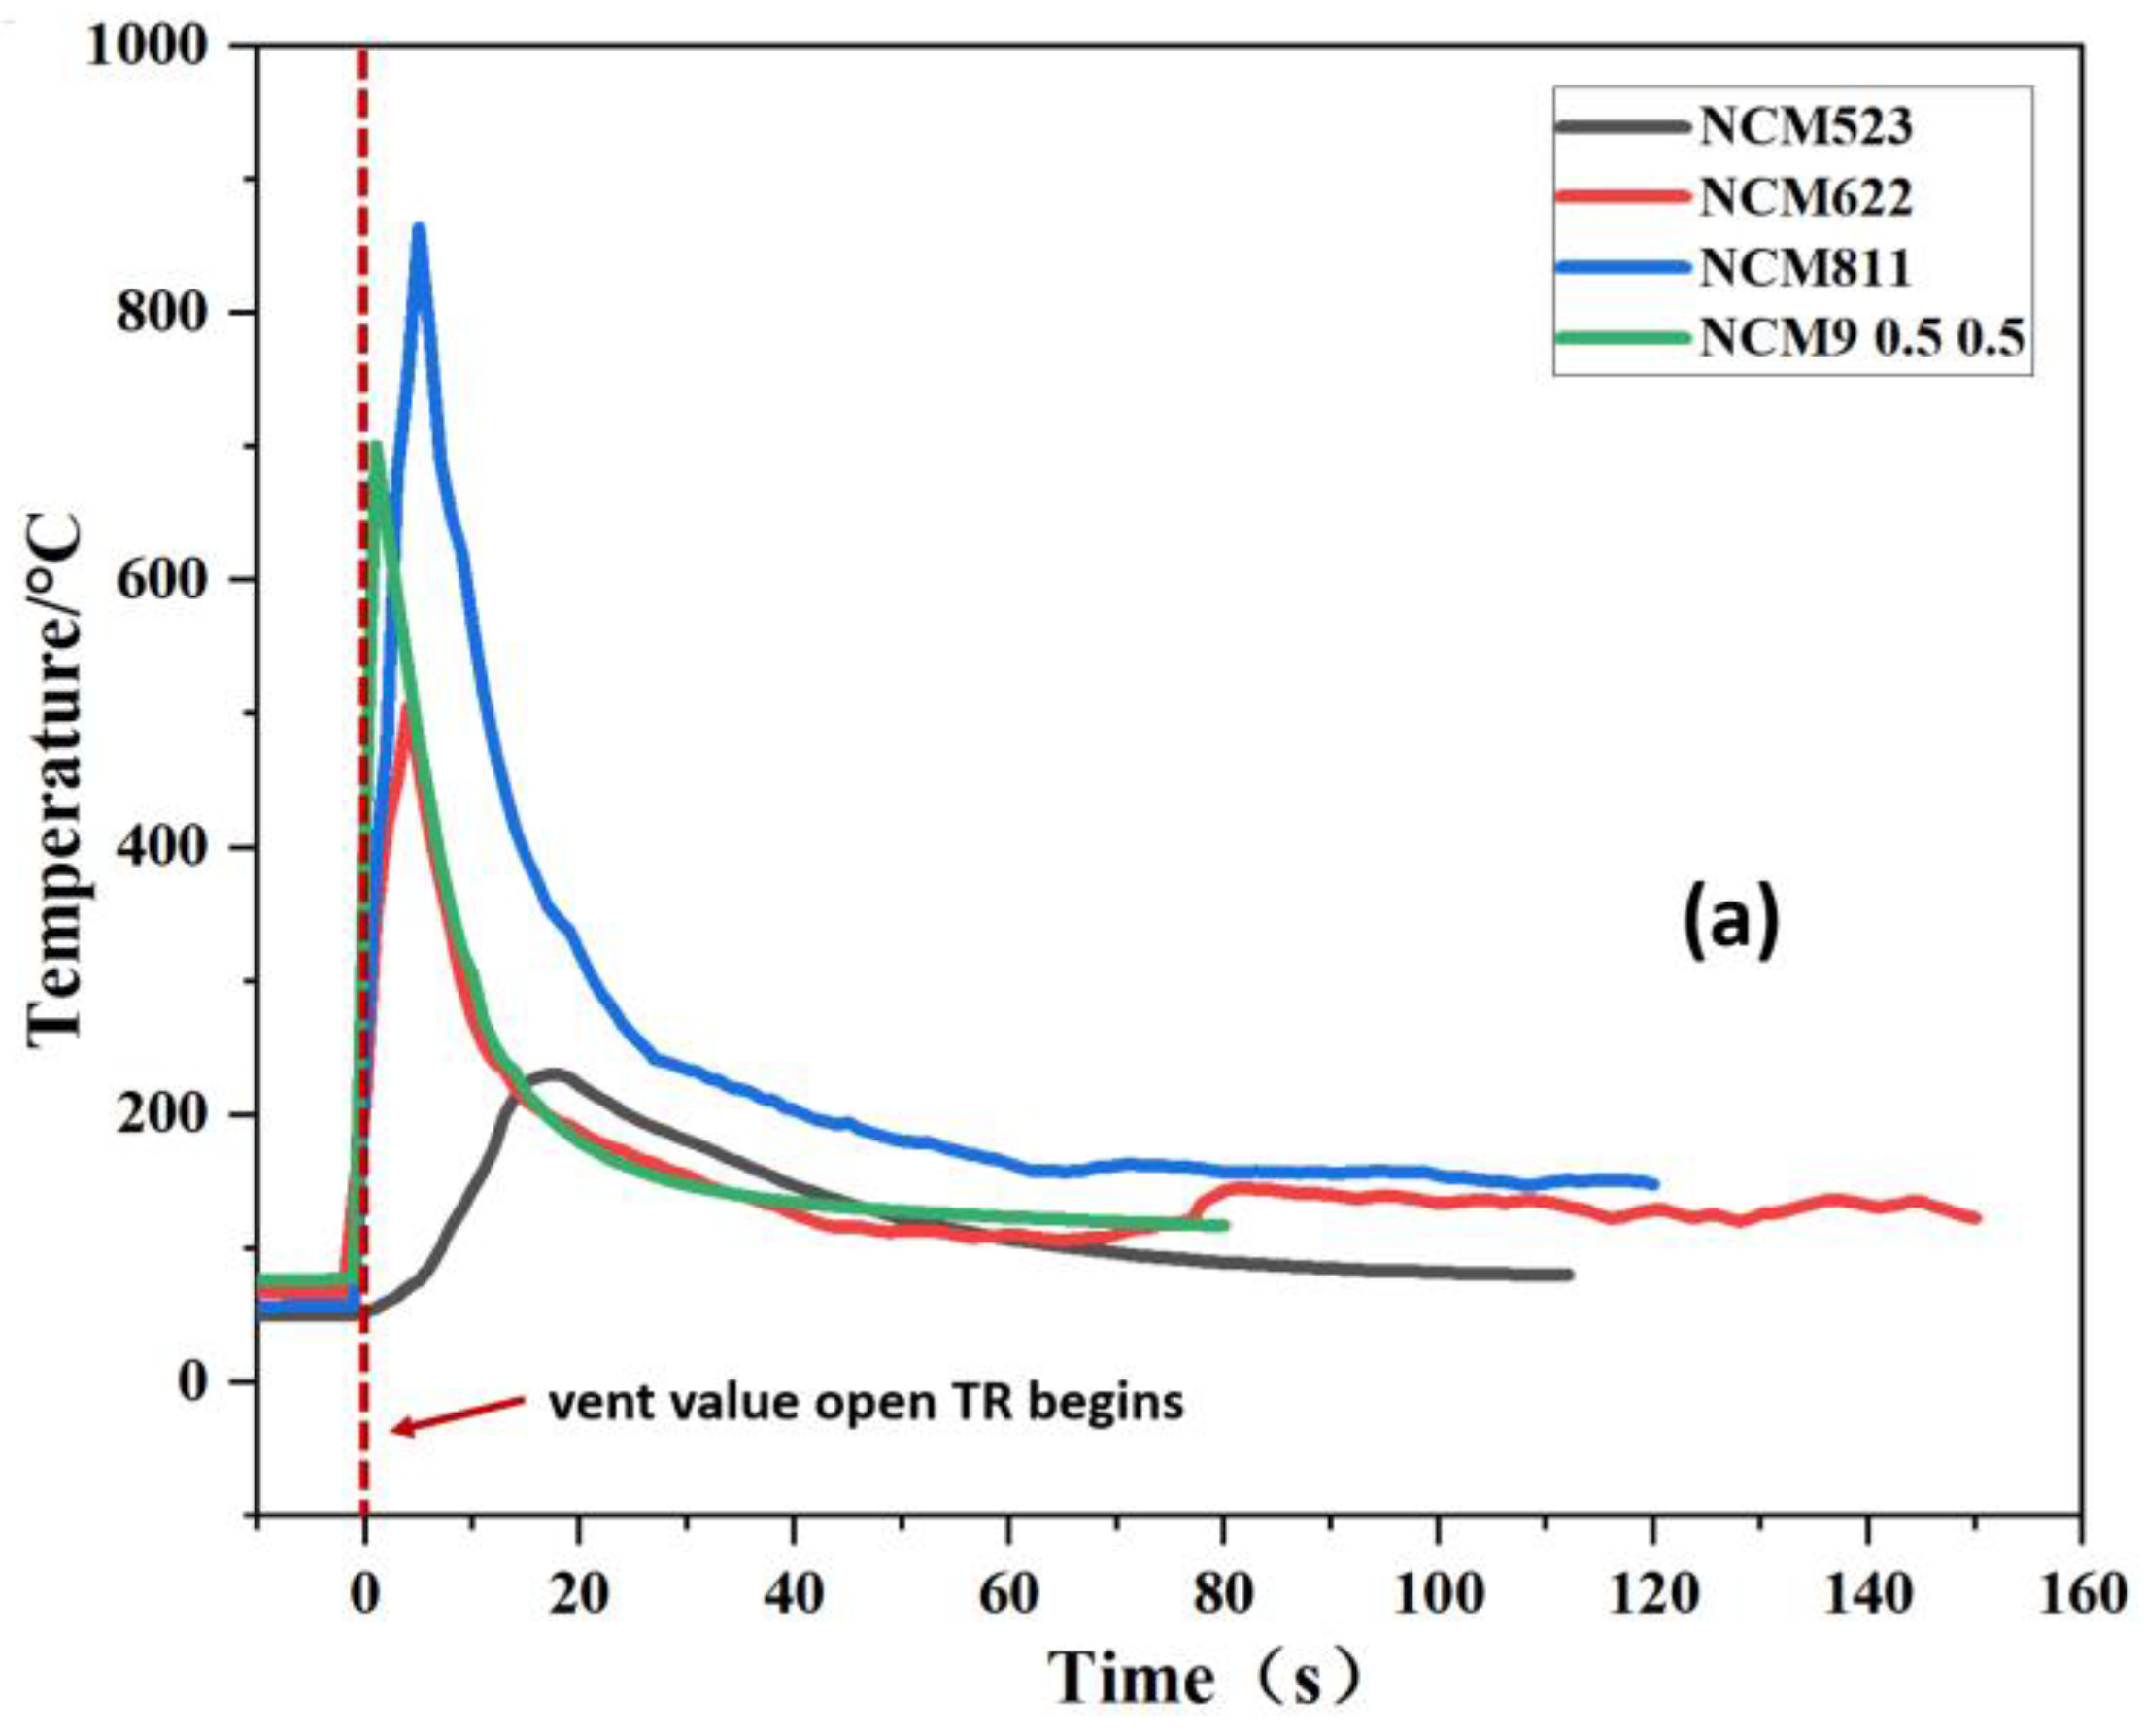
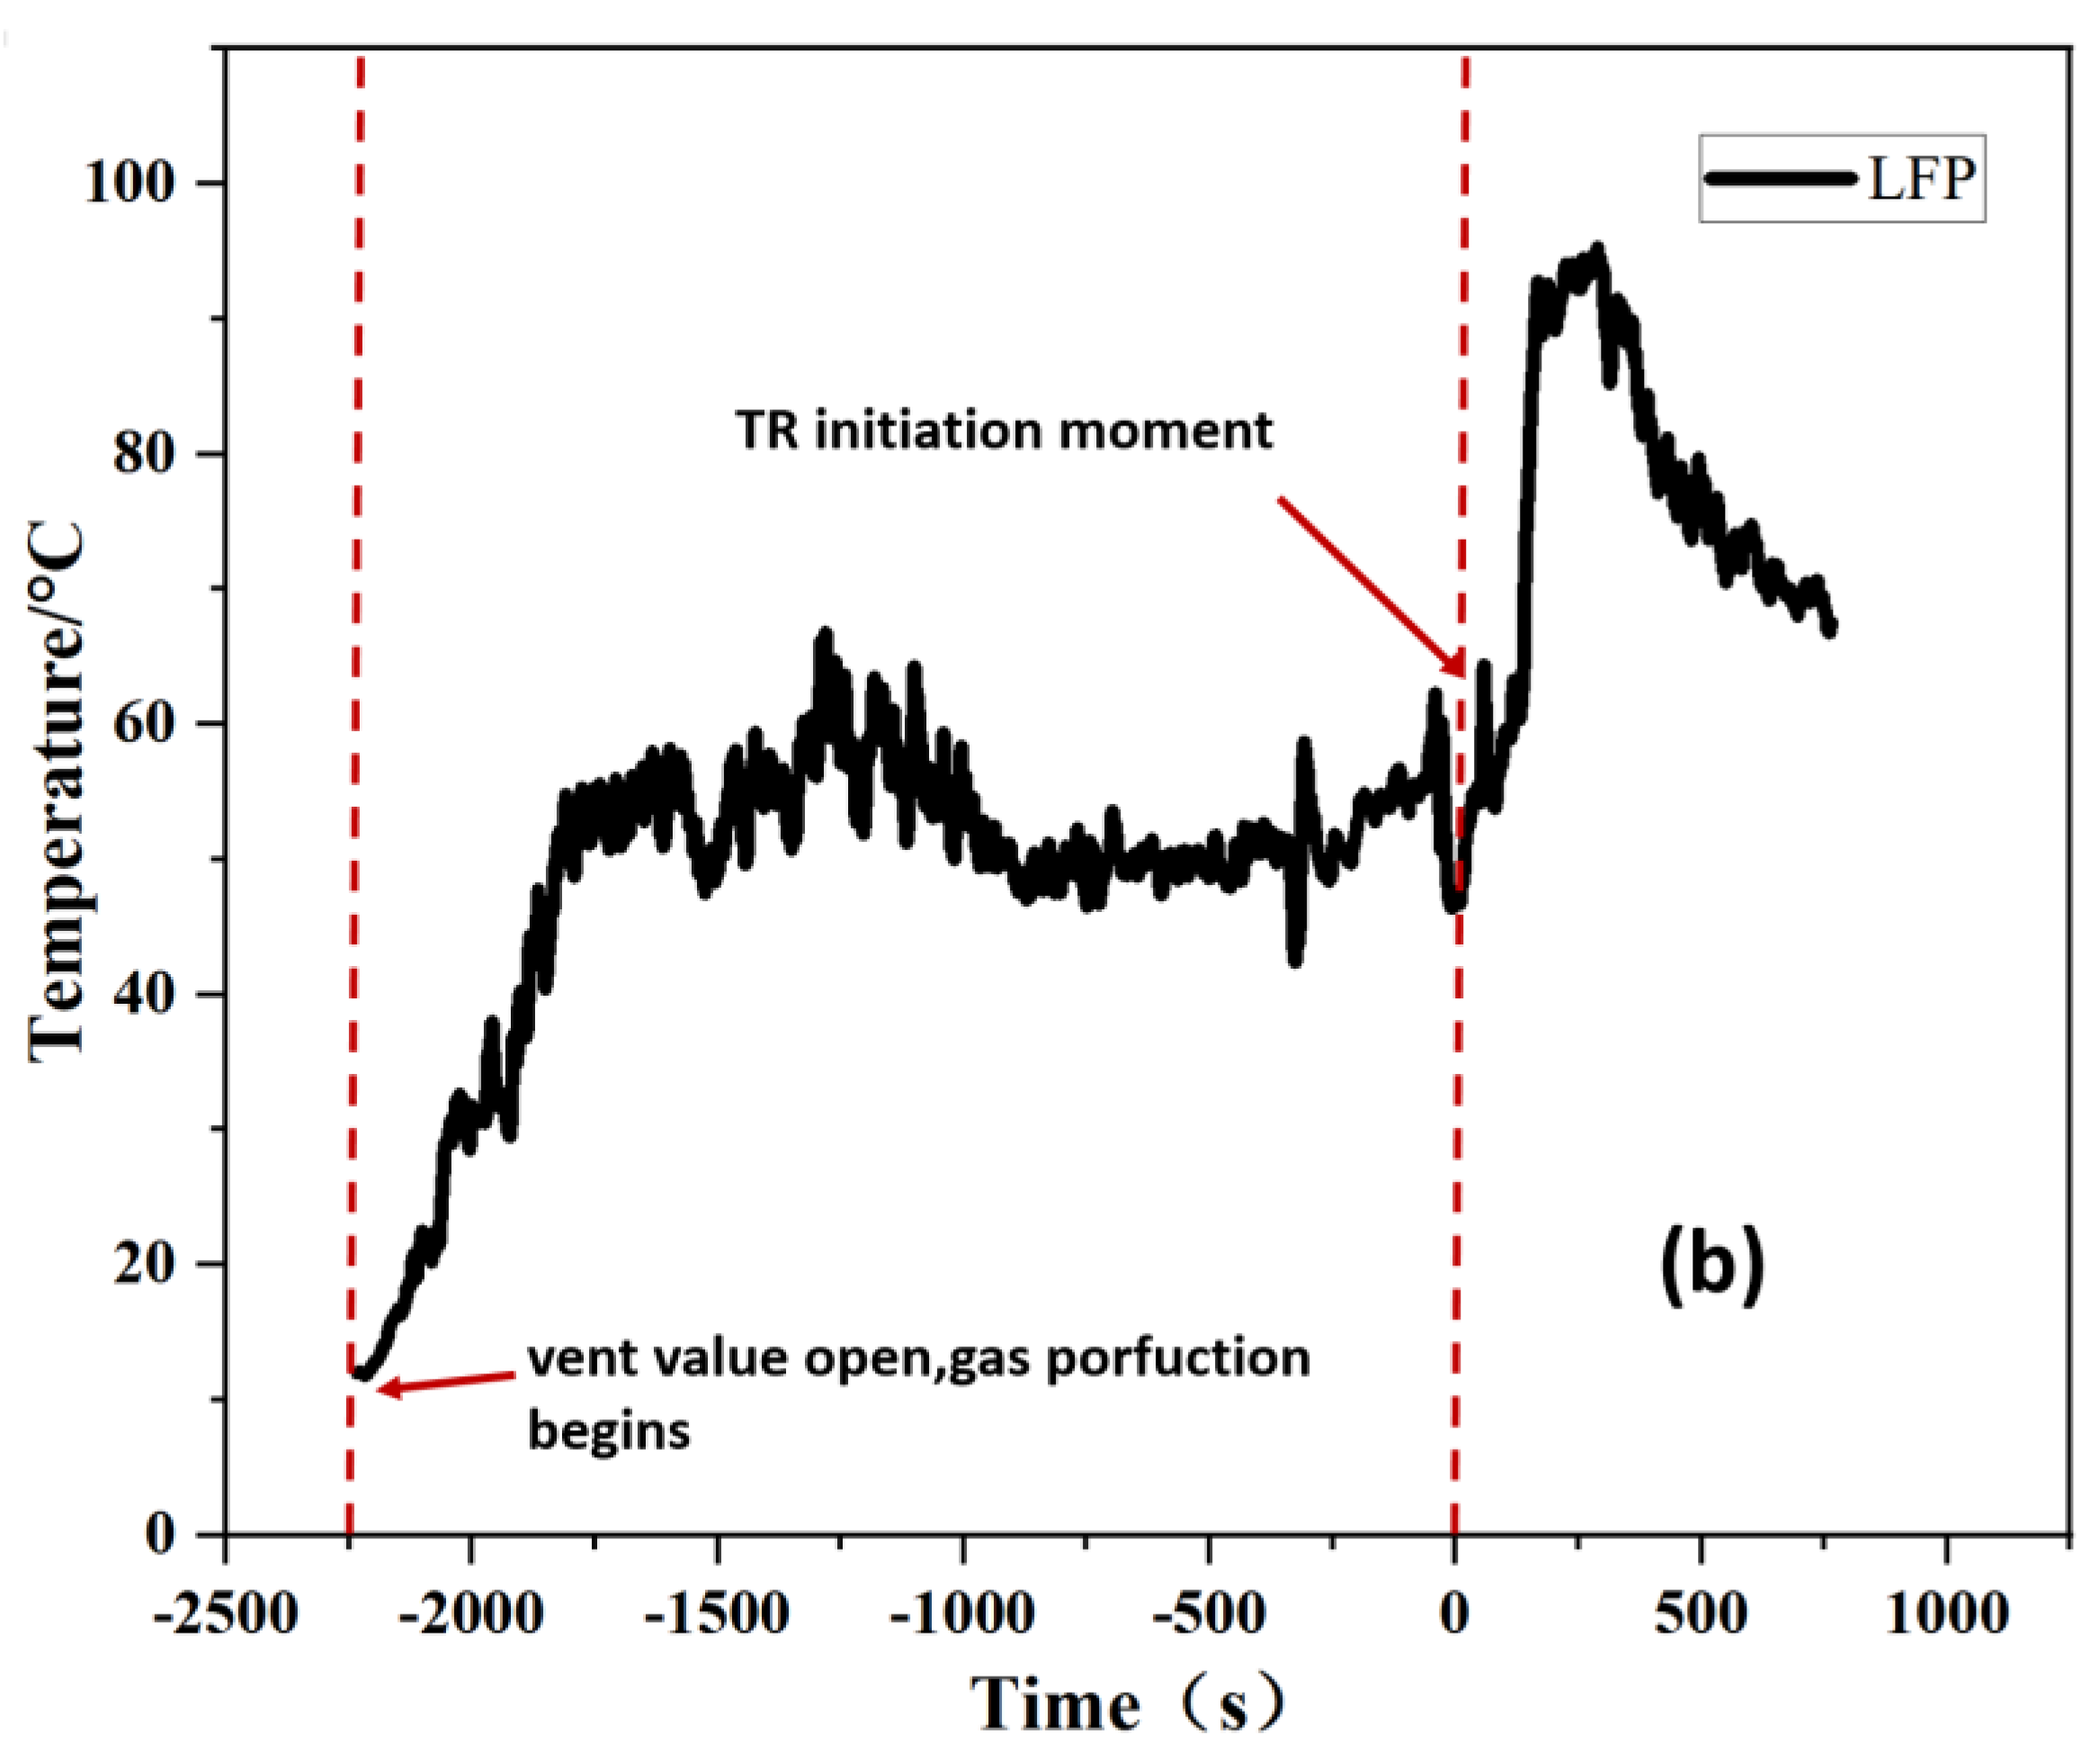
3.1. TR Temperature Characteristics of Batteries with Different Cathode Materials

During the battery TR, real-time recordings were taken of the ambient temperature within the AEC, the surface and side temperature of the battery, the temperature of the heating side of the battery, the measured temperature of the heating side, the voltage during the TR, and the pressure inside the projectile. To obtain more accurate battery temperature data, the temperature of the three thermocouples on the battery’s surface was averaged to represent the overall battery temperature. The onset of TR is defined as the point at which the battery surface temperature increases sharply [8,22,46,47]. To ensure that TR is fully realized, a sharp drop in voltage is used as the trigger signal to stop the heating plate. This method provides a clear and objective criterion for determining the onset of TR in batteries.
The heating time of the heating plate was taken as the experiment’s start time, with the TR trigger time serving as the ‘0’ time. The corresponding temperature, pressure, and voltage characteristics are depicted in Figure 4a–e.
Figure 4 provides a comparison between NCM batteries and LFP batteries during the process of triggering TR through lateral heating. At the moment of TR, the NCM ternary battery shows an instantaneous opening of the safety valve, intense gas production, rapid temperature rise, and voltage sags. In contrast, the LFP battery’s TR overall performance is not as intense.
Under the same heating conditions, the time required to trigger TR in the LFP battery is longer than that of the NCM battery, indicating that the thermal stability of the LFP battery is better than that of the NCM battery. As illustrated in Figure 4e, during the experiment, the vent value of the LFP battery opened first, resulting in a surge in pressure inside the AEC cabin, but TR did not occur, and the voltage remained stable at the operating voltage. It was only after approximately 300 s that TR occurred.
The TR in this study was triggered by lateral heating, and the TR trigger temperature ( T o n s e t ) was calculated based on the (temperature/temperature change rate/pressure) data curve. The calculation method involved finding the data intersection point after straight-line fitting of the two end curves in Figure 5c (the inflection point of the slope of the temperature change rate). As the battery experiences a temperature change rate surge at the moment of TR, T o n s e t can be defined as the TR trigger temperature. Table 3 summarizes the results, showing that the co-TR trigger temperature ( T o n s e t ) is ranked as follows: LFP > NCM523 > NCM622 > NCM811 > NCM905.
Figure 5a,b provide a comparison of the temperature/time and temperature change rate/temperature curves of batteries with five different cathode materials during TR. Figure 5b indicates that the NCM9 series battery’s TR is the most severe in the initial stage, while the TR of the NCM5, NCM6, and NCM8 series is more severe in the middle stage, with a phenomenon of multiple jets. The LFP battery exhibits a more severe TR towards the end. Figure 5a and Table 3 show that the TR trigger temperature for NCM batteries is lower than that for LFP batteries, and the TR duration is shorter. The TR of the LFP battery is more moderate. Therefore, from the characteristics of temperature change during TR, the safety of the LFP battery is better than that of the ternary NCM battery.

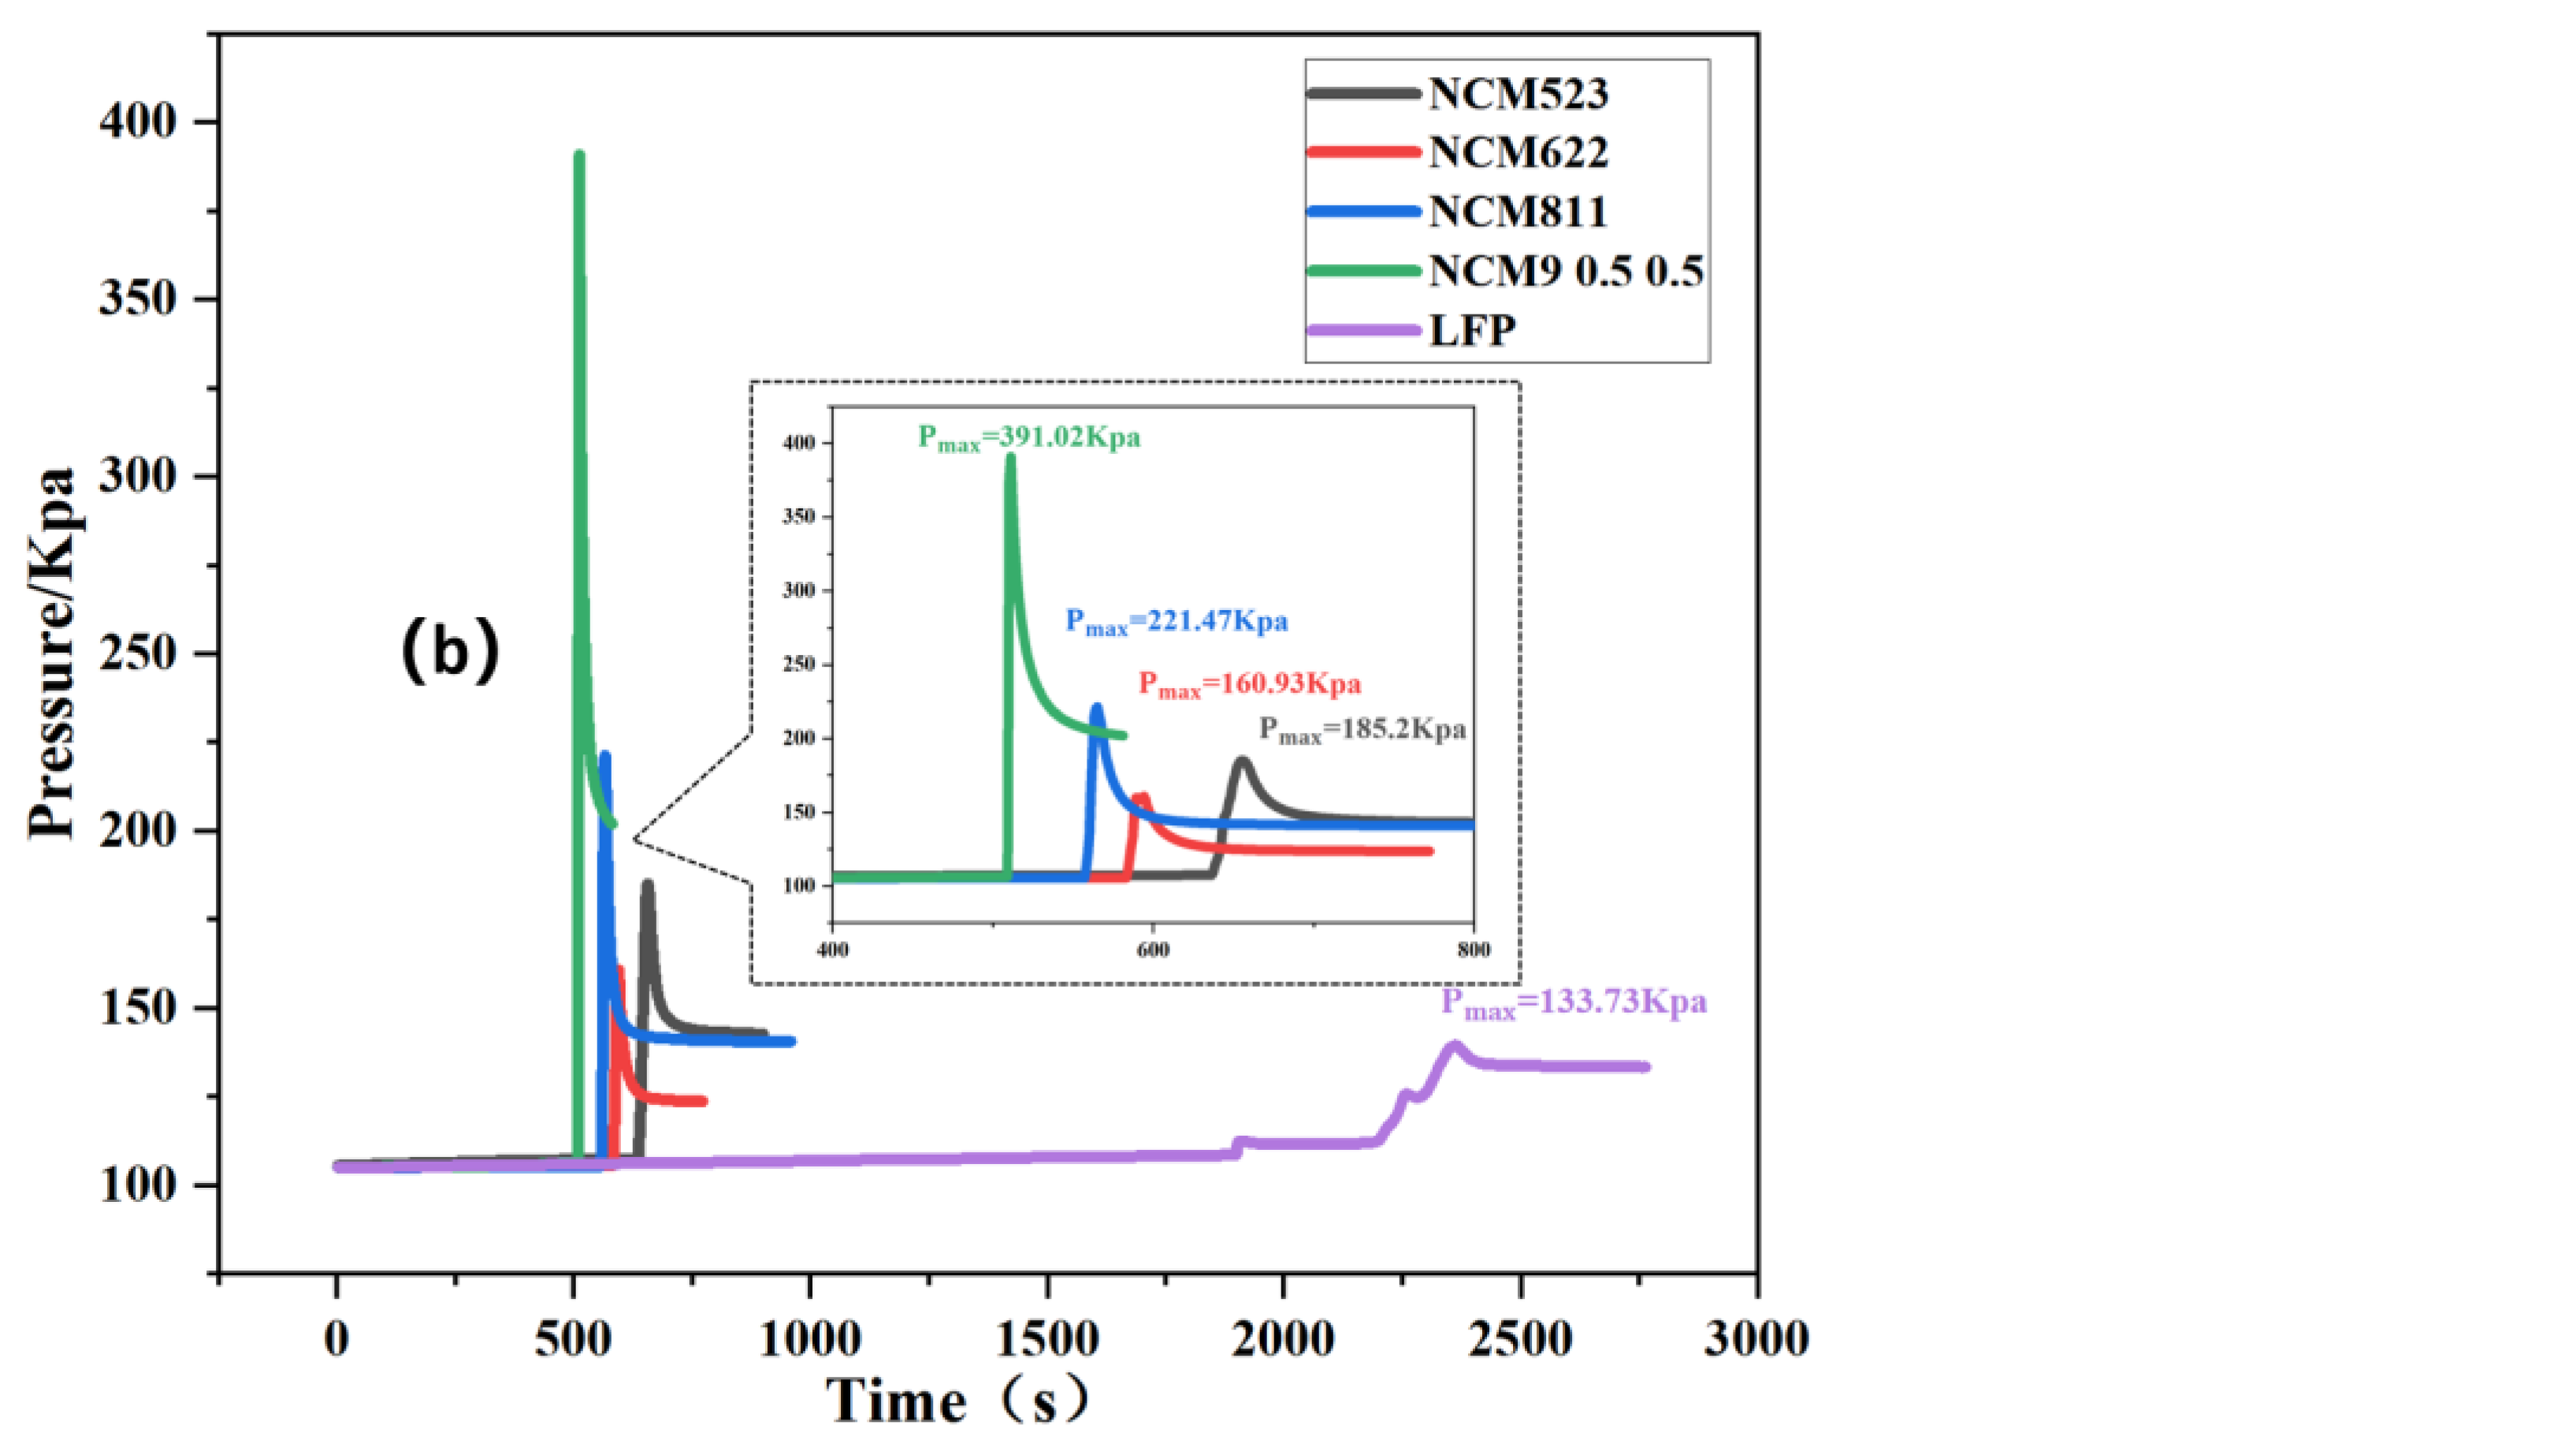
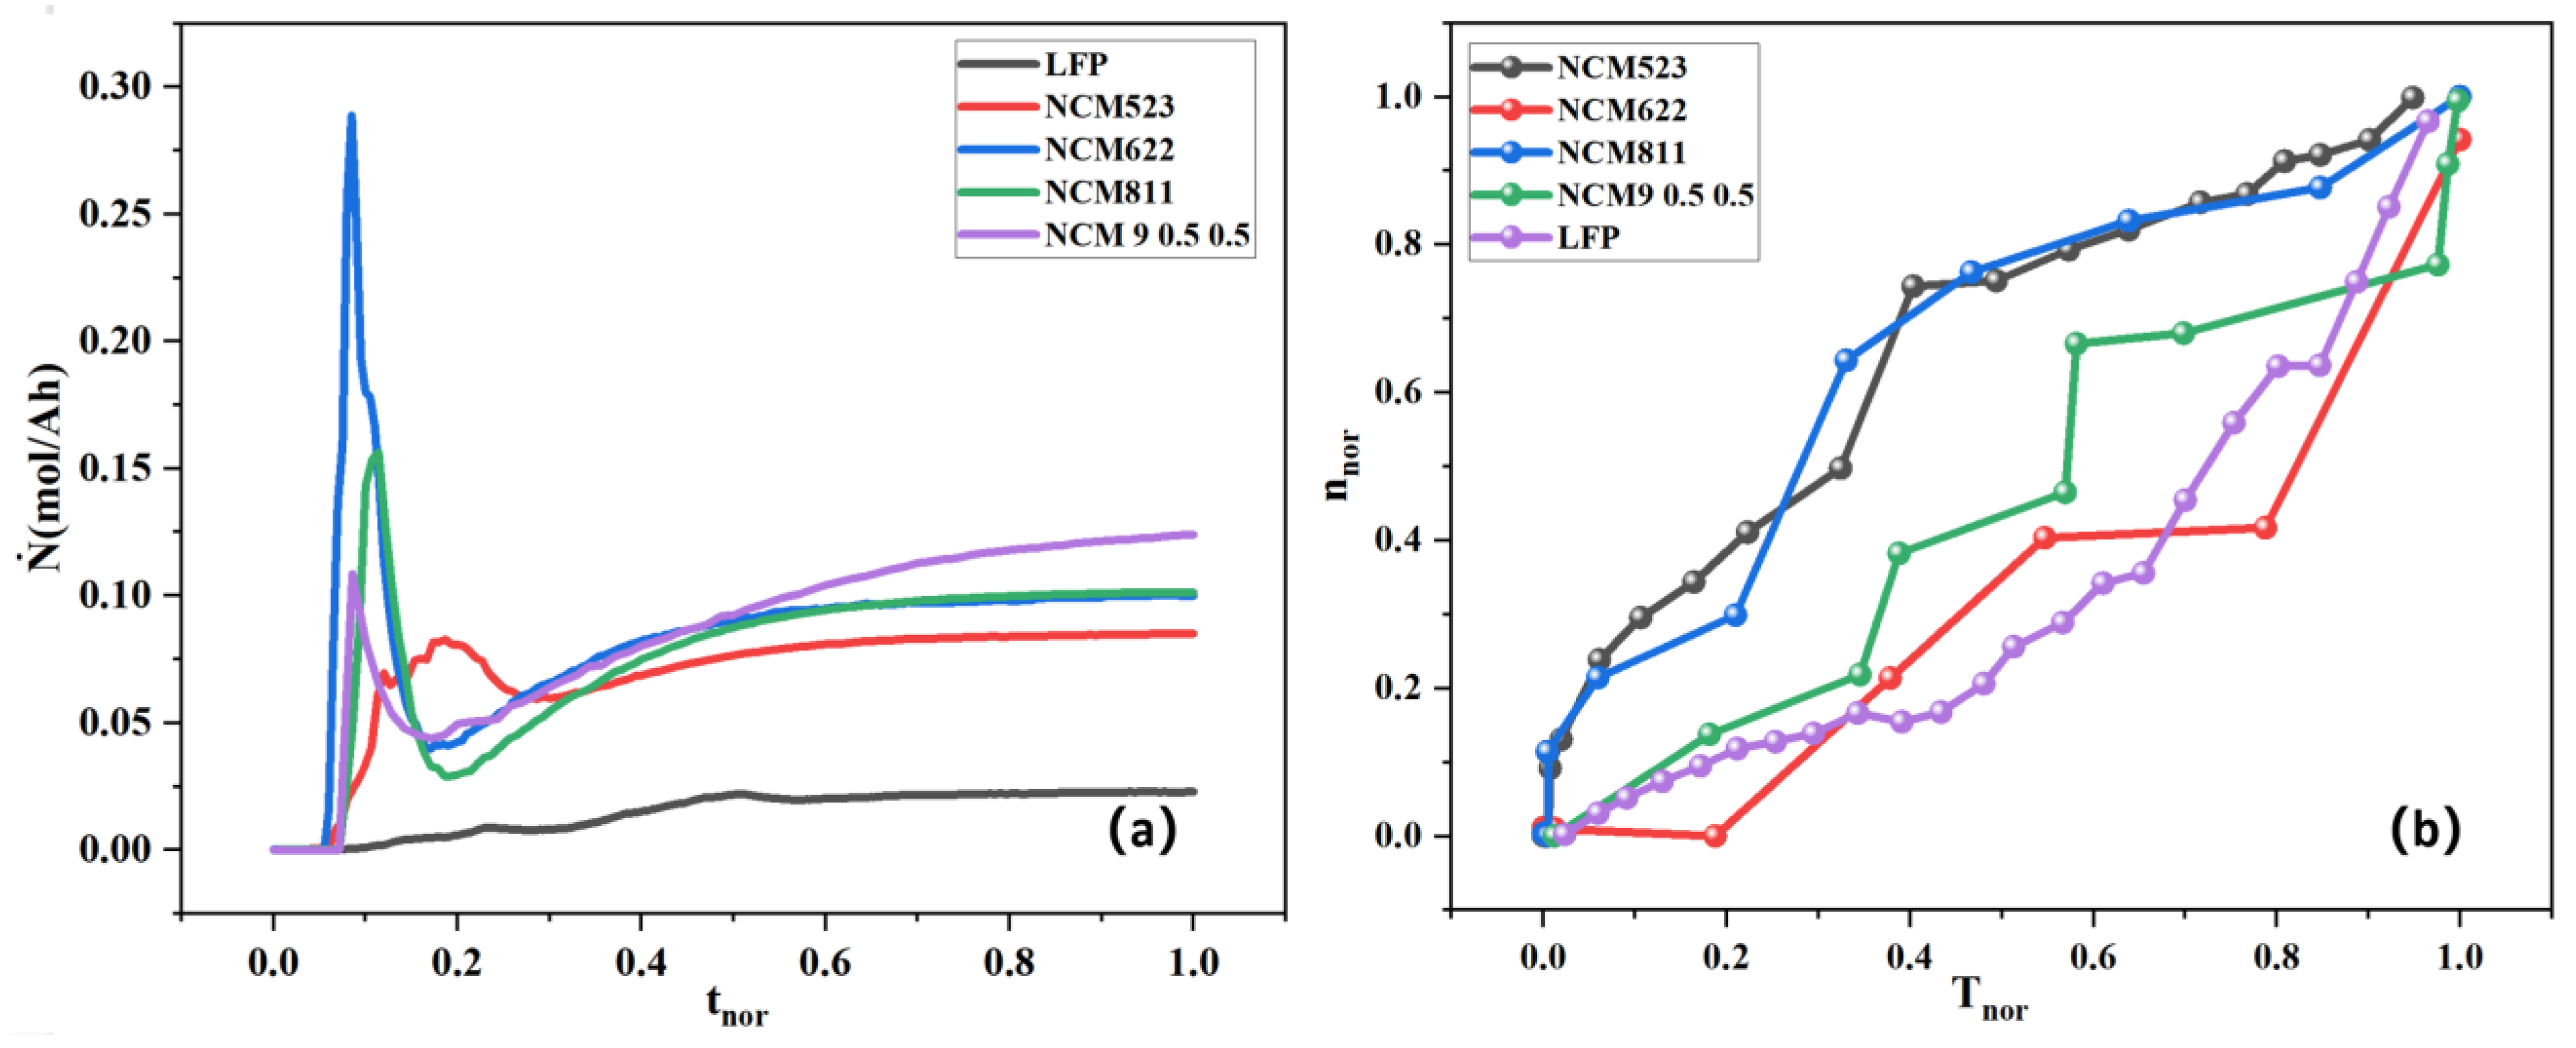
3.2. TR Gas Release Characteristics of Batteries with Different Cathode Materials

In this section, the focus of the research is on analyzing the gas release characteristics of batteries with different cathode materials during TR, with the heating plate opening time being defined as the 0 moment. The pressure and pressure change rate in the AEC during the experiment are shown in Figure 6. Since the experiment is conducted in a closed space, the values of pressure and pressure change rate in the chamber can reflect the intensity of gas production caused by TR of the battery. The pressure change rate during TR indicates that the NCM9 0.5 0.5 battery has a higher intensity of gas production compared to NCM811, NCM622, NCM523, and LFP batteries. Furthermore, it is observed that at the moment when the vent valve of the NCM battery opens, TR occurs, and severe gas production follows. On the other hand, the LFP battery does not exhibit TR phenomenon, but due to excessive internal pressure, the vent valve opens to release gas.
The primary gas released at this time is due to the gasification of the high temperature electrolyte inside the battery. LFP batteries experience two violent gas production stages after TR, with the first gas production being more intense than the second, as shown in a partial enlarged view of Figure 6a. Figure 6b shows the internal pressure change of the chamber during TR. Additionally, Figure 7a,b demonstrate that the battery vent value located directly above the thermocouple temperature of 30 mm can provide a more intuitive understanding of the NCM and LFP battery TR gas production characteristics and vent value opening time differences. At the moment of NCM battery TR, the vent value opens, causing intense gas production, and leading to a sharp rise in the nozzle temperature. The LFP battery exhibits a sharp rise in the nozzle temperature before the TR, during which the vent value opens to produce gas, but there is no TR. Upon the start of TR, the LFP battery exhibits violent gas production. The change in nozzle temperature indicates that the intensity of the eruption during the moment of TR is greater than the first time.
The calculation of TR gas production in batteries is performed using the ideal gas state equation, as shown in Formula (1). The gas constant R is used in this equation, and its value depends on the unit of state parameter. For example, in the international system of units, R = 8.31 J/(mol·K). This equation reflects the relationship among three state parameters of a certain mass of gas in the same state. The total gas production is then calculated using Formula (2), where P e n d is the value measured by the corresponding pressure transducer at the end of TR (dp/dt < 0.2 Kpa/s), T e n d is the ambient temperature value recorded by the temperature sensor at this moment, and P 0 and T 0 are the values of pressure and environment temperature in AEC at the beginning of the experiment. The V c h a m b e r represents the in-cabin volume of the AEC used in this experiment and is equal to 1000 L. The results are then normalized to standard conditions (25 °C, 101 Kpa) and presented in Table 4. The gas production of the NCM battery is between 1.814–2.752 L/Ah after normalization, while the gas production of the LFP battery is significantly lower at 0.569 L/Ah.
V = n R T = M μ R T
n = P e n d V c h a m b e r R T e n d P 0 V c h a m b e r R T 0
To compare the TR gas release characteristics of different battery systems, a dimensionless normalization method is utilized. Figure 8a shows the instantaneous gas production value calculated using Formula (1), which is then normalized to (mol/Ah). The gas production time is dimensionless normalized from the beginning of gas production to the end of eruption and is represented on the abscissa. The definition of this normalization is provided in Formula (3). Since batteries with different cathode materials have varying temperature ranges and gas production, a dimensionless normalization method is used to compare the temperature/gas production characteristics of different batteries during TR. Figure 8b shows the result of this normalization method, which includes temperature dimensionless normalization ( T n o r ) of gas production during the TR of the battery. The calculation formulas of t n o r ,  n n o r , and T n o r are presented in Formulas (3)–(5).
t n o r = t t s t a r t t e n d t s t a r t
T n o r = T T s t a r t T m a x T s t a r t
n n o r = n n s t a r t n e n d n s t a r t
From Figure 8a, it can be observed that the gas production rate of the LFP battery is relatively slow during the entire TR process, and there is no distinct gas generation time compared to NCM batteries. In contrast, the NCM battery generates gas violently within seconds after the vent values opened, followed by a gradual stabilization in the degree of gas production. The abscissa in Figure 8b corresponds to the normalized total gas production result between the battery temperature at which gas production begins and the maximum temperature of the battery during TR. The ideal gas production state is represented by the region below the red dotted line in Figure 8b, which is used as the reference line for the gas production corresponding to the battery’s TR process. From the diagram, the gas production corresponding to the temperature of the battery at different stages of TR can be analyzed. It is preferred that the ideal gas production curve of the battery remains below the red dotted line, indicating a relatively slow initial gas production during the TR process.

3.3. Battery TR Gas Release Characteristics and TR Manifestations

Figure 9 provides an overview of the gas production sequence and internal structure changes with temperature during the TR of LFP and NCM batteries. Initially, between 70 and 90 degrees, the metastable components of the SEI film undergo exothermic decomposition [12,46,48], resulting in the accumulation of most of the gas inside the battery, primarily carbon dioxide, methane, and oxygen [49]. As the temperature increases, intercalated lithium further reacts with organic solvents and electrolytes [50,51,52], leading to the release of ethylene, propylene, and ethane [53,54,55]. Between 90 and 260 degrees, three chemical reactions occur simultaneously, including the melting of the SEI, the internal short circuit between electrodes, the decomposition of different cathode materials, and the reaction with the electrolyte to release gas [43,47,56]. This gas release mainly includes oxygen, carbon dioxide, and carbon monoxide. L i P F 6 is commonly used as an electrolyte in combination with commonly used electrolytes such as PC [57], EMC [58], and DMC [59]. The electrolyte self-decomposes between temperatures of 200 and 300 °C, with the main decomposition products being fluoroethane, carbon dioxide, hydrofluoric acid, and ethylene [60]. Above 260 °C [61], the binder PVDF further reacts with intercalated lithium to directly produce hydrogen. This chemical reaction occurs during the TR of both NCM and LFP batteries. The trimeric anion bond of lithium iron phosphate gives LFP a relatively safe nature [62]. However, there is no direct evidence that lithium iron phosphate will decompose at high temperatures to release oxygen. In NCM batteries, Ni is the most unstable element, with higher nickel content leading to a lower initial temperature of oxygen release and worse thermal stability [63]. The presence of Mn can improve thermal stability. During thermal decomposition, Co ions undergo cation migration into the spinel structure, which plays a crucial role in determining the thermal stability of NMC cathode materials. Specifically, the NCM ternary battery experiences a transition from its internal layered structure (with space group R 3 m) [57,63] to a disordered LiMn2O4 spinel and M3O4 spinel phase (with space group Fd 3 m) within the temperature range of 350 °C to 441 °C.
To determine the original gas composition of batteries after TR, an experiment was conducted in an inert gas atmosphere with an oxygen content of less than 1%. The internal gas of AEC after TR was collected using aluminum foil bags and analyzed using GC. Figure 10a summarizes the TR gas composition of different cathode material batteries after the experiment, with the percentage of gas composition being the result after nitrogen exclusion. The main components of TR gas production for ternary NCM and LFP batteries were found to be C O 2 , C O , H 2 , C H 4 , and C 2 H 4 . Figure 10b compares the content of the main gas components produced by TR across different batteries. Comparing LFP batteries with NCM batteries, there is a significant difference in the proportion of H 2 and C O in the gas production. In the gas production of LFP batteries, H 2 accounts for 50.82%, while CO only accounts for 9.3%. There is not much difference in C H 4 production. The content of C 2 H 4 differs based on the cathode materials used.
This section also investigates the flammability limit of the gas mixtures produced during battery TR. The deflagration upper and lower limits of the mixed gas are calculated using Le Chatelier’s equation [55], based on the gas test results shown in Figure 10. In this equation, L mix   represents the flammability limit of the gas produced by the battery’s TR, L i represents the flammability limit of the combustible component I in the battery, and x i represents the volume percentage of component i. Although there is a small error of about 7% [55,56,57,64] in calculating the flammability limit of mixed multi-component gases using Le Chatelier’s equation, it has been widely accepted and is of significant reference value for engineering applications.
L mix   = 1 i = 1 n   x i L i × 100 %
Table 5 provides a list of the UFL and LFL of gas components that make up more than 1% of the gas produced during battery TR, as measured in this study.
The upper and lower flammable limits were calculated using Equation (6) and are presented in Figure 11. The TR formation gas of the LFP battery contains a higher amount of H 2 compared to the NCM battery, resulting in a lower LFL due to the relatively low LFL of H 2 . This makes it easier for the TR gas of the LFP battery to reach combustible conditions and suggests a greater risk of TR for the LFP battery compared to the NCM battery, based on the gas production results.
Table 6 presents the relationship between the gas–solid ratio and mass loss rate after the TR of the LFP and NCM batteries. The mass loss rate is calculated as the initial weight of the battery minus the residual weight, divided by the initial weight. The gas–solid ratio is determined by collecting the cooled particles and battery debris after the experiment. The R G S is then calculated using Formula (7).
R G S = M 0 M e n d M p a r t i c u l a t e M p a r t i c u l a t e
R G S is the gas–solid ratio of the battery, defined as the ratio of the gas mass to particle mass produced during the TR of the battery. The calculation is based on the initial weight M 0 and residual weight M e n d of the battery as well as the mass of particulate matter ( M p a r t i c u l a t e ) collected after the test. Table 6 presents the gas–solid ratio and mass loss rate of both the LFP and NCM batteries.
Figure 12 presents photos of the debris and products after the experiment. It can be observed that the main product of the LFP battery’s TR is electrolyte, and only a small amount of particulate matter is produced. The erupted electrolyte eventually accumulates inside the AEC cabin. On the other hand, the main product of the NCM battery’s TR is particulate matter, as shown in Figure 12A,B, because the high-temperature electrolyte sprayed during the TR of LFP batteries will further volatilize, producing more combustible gases.

4. Conclusions

In this study, we aimed to investigate the in situ gas production during thermal runaway of different NCM and LFP batteries for energy storage applications. By designing experiments conducted under an inert atmosphere (99% N2), and performing data post-processing, we have obtained the thermal runaway temperatures, gas generation characteristics, and combustion characteristics of different batteries. There are three main conclusions, as shown below:
1: The TR trigger temperature of LFP battery is about 180 °C, which is higher than that of the NCM ternary battery, which is around 130–140 °C. If the severity of the battery’s TR is divided by temperature, NCM9 0.5 0.5 battery has the most intense TR in the early stage, while NCM523, NCM622, and NCM811 have multiple injection phenomena in the middle. The TR of the LFP battery is more intense at the end. From the perspective of thermal stability, the LFP battery is safer than the NCM battery.
2: Under standard conditions, the normalized gas production of NCM ternary battery is (1.8–2.8) L/Ah, while that of LFP battery is only 0.569 L/Ah. Based on battery gas production, the degree of harm caused by thermal runaway can be ranked as follows: NCM9 0.5 0.5 > NCM811 > NCM622 > NCM523 > LFP.
3: The gas generated during TR of LFP batteries contains a higher proportion of H 2 , which results in a LFL for the gas produced by the LFP battery thermal runaway compared to the mixed gas produced during the NCM battery thermal runaway. Therefore, from the perspective of thermal runaway gas composition, the hazard ranking is LFP > NCM811 > NCM622 > NCM523 > NCM9 0.5 0.5.
In people’s impression, LFP batteries have better thermal stability compared to NCM batteries during normal use and thermal stability tests. However, in the case of a large-scale battery thermal runaway incident, such as in an energy storage power station, considering the gas production components, LFP batteries may be more dangerous. This paper points out the gas products generated after battery thermal runaway. In the future, by designing experiments, gas detection can be used as a signal factor for detecting thermal runaway accidents, providing new ideas and assistance for the safety design of large-scale energy storage systems.

Author Contributions

Conceptualization, H.S., H.W., M.O. and Y.L.; methodology, H.S., X.F., Y.L. and H.W.; software, H.S.; validation, H.S., X.Y. and C.L.; formal analysis, H.S., M.L., H.W. and Y.L.; investigation, H.S.; resources, Y.Z., H.W., M.O.; data curation, C.L., X.Y.; writing—original draft preparation, H.S.; writing—review and editing, H.S., H.W., M.L., Y.L., M.O., X.F., C.L.; visualization, H.S., C.L., X.Y.; supervision, H.S.; project administration, Y.Z., H.W., M.O.; funding acquisition, H.W., M.O. All authors have read and agreed to the published version of the manuscript.

Funding

This research is generously supported by the National Natural Science Foundation of China (Youth Program Grant No. 52207240) and the Shandong Province Science and Technology Foundation (Youth Program Grant No. ZR2022QE099). The authors gratefully acknowledge the financial support from the Joint Science Foundation of Guangdong Province (Grant No. 21201910260000023) and Open-end Funds from the State Key Laboratory of Automobile Safety and Energy Conservation from Tsinghua University (Grant No. KFY2221). The research is also supported by the Science Foundation of Sichuan Province (Grant No. 2021YSYF0001).

Data Availability Statement

Not applicable.

Conflicts of Interest

The authors declare no conflict of interest.

Nomenclature

Symbols
SOCState of charge
LFP L i F e P O 4
NCM L i N i x C o y M n z O 2
SEISolid electrolyte interphase
DMCDimethyl carbonate
EMCEthyl methyl carbonate
PCPropylene carbonate
ARCAccelerating rate calorimeter
AECAdiabatic explosion chamber
DSCDifferential scanning calorimeter
GCGas chromatographyy
PVDFPolyvinylidene fluoride
UFLUpper flammable limit
LFLLower flammable limit
TRThermal runaway
V c h a m b e r AEC internal volume
P e n d Internal pressure of AEC after experiment
P 0 Back pressure of AEC before experiment
T e n d AEC internal ambient temperature after experiment
T 0 Internal ambient temperature of AEC before experiment
n Gases generated
R Gas constant
t n o r Time normalization
T n o r Temperature normalization
L mix   Flammability limit of the gas
x i Volume percentage
L i Flammability limit of combustible component i in battery
R G S Gas–solid ratio
M 0 Initial weight of battery
M e n d Battery residual weight
M p a r t i c u l a t e Particulate matter mass
C-rateBattery charge and discharge rate
LFP L i F e P O 4
LIBsLithium-ion batteries

References

  1. Wang, X.; Wei, X.; Zhu, J.; Dai, H.; Zheng, Y.; Xu, X.; Chen, Q. A review of modeling, acquisition, and application of lithium-ion battery impedance for onboard battery management. eTransportation 2021, 7, 100093. [Google Scholar] [CrossRef]
  2. Gao, W.; Hu, Z.; Huang, H.; Xu, L.; Fang, C.; Li, J.; Wang, C.; Ouyang, M. All-condition economy evaluation method for fuel cell systems: System efficiency contour map. eTransportation 2021, 9, 100127. [Google Scholar] [CrossRef]
  3. Zhang, X.; Wang, B.; Zhao, S.; Li, H.; Yu, H. Oxygen anionic redox activated high-energy cathodes: Status and prospects. eTransportation 2021, 8, 100118. [Google Scholar] [CrossRef]
  4. Zhang, H.; Zhang, J. An overview of modification strategies to improve LiNi0·8Co0·1Mn0·1O2 (NCM811) cathode performance for automotive lithium-ion batteries. eTransportation 2021, 7, 100105. [Google Scholar] [CrossRef]
  5. Wildfeuer, L.; Lienkamp, M. Quantifiability of inherent cell-to-cell variations of commercial lithium-ion batteries. eTransportation 2021, 9, 100129. [Google Scholar] [CrossRef]
  6. Piao, N.; Gao, X.; Yang, H.; Guo, Z.; Hu, G.; Cheng, H.-M.; Li, F. Challenges and development of lithium-ion batteries for low temperature environments. eTransportation 2021, 11, 100145. [Google Scholar] [CrossRef]
  7. Meng, X.; Li, S.; Fu, W.; Chen, Y.; Duan, Q.; Wang, Q. Experimental study of intermittent spray cooling on suppression for lithium iron phosphate battery fires. eTransportation 2021, 11, 100142. [Google Scholar] [CrossRef]
  8. Wang, H.; Zhang, Y.; Li, W.; Gao, Z.; Zhang, B.; Ouyang, M. Experimental study on the cell-jet temperatures of abused prismatic Ni-rich automotive batteries under medium and high states of charge. Appl. Therm. Eng. 2021, 202, 117859. [Google Scholar] [CrossRef]
  9. Fernandes, Y.; Bry, A.; de Persis, S. Identification and quantification of gases emitted during abuse tests by overcharge of a commercial Li-ion battery. J. Power Sources 2018, 389, 106–119. [Google Scholar] [CrossRef]
  10. Sloop, S.E.; Kerr, J.B.; Kinoshita, K. The role of Li-ion battery electrolyte reactivity in performance decline and self-discharge. J. Power Sources 2003, 119–121, 330–337. [Google Scholar] [CrossRef]
  11. Gachot, G.; Grugeon, S.; Eshetu, G.G.; Mathiron, D.; Ribière, P.; Armand, M.; Laruelle, S. Thermal behaviour of the lithiated-graphite/electrolyte interface through GC/MS analysis. Electrochim. Acta 2012, 83, 402–409. [Google Scholar] [CrossRef]
  12. Finegan, D.P.; Scheel, M.; Robinson, J.B.; Tjaden, B.; Hunt, I.; Mason, T.J.; Millichamp, J.; Di Michiel, M.; Offer, G.J.; Hinds, G.; et al. In-operando high-speed tomography of lithium-ion batteries during thermal runaway. Nat. Commun. 2015, 6, 6924. [Google Scholar] [CrossRef] [PubMed] [Green Version]
  13. Wang, H.; Zhang, Y.; Li, C.; Li, W.; Ouyang, M. Thermal runaway product ejection process in lithium-ion power batteries under medium state of charge. Energy Storage Sci. Technol. 2019, 6, 1076–1081. [Google Scholar]
  14. Zhang, Y.; Wang, H.; Li, W.; Li, C.; Ouyang, M. Size distribution and elemental composition of vent particles from abused prismatic Ni-rich automotive lithium-ion batteries. J. Energy Storage 2019, 26, 100991. [Google Scholar] [CrossRef]
  15. Bolshova, T.; Shvartsberg, V.; Shmakov, A. Synergism of trimethylphosphate and carbon dioxide in extinguishing premixed flames. Fire Saf. J. 2021, 125, 103406. [Google Scholar] [CrossRef]
  16. Tomaszewska, A.; Chu, Z.; Feng, X.; O’Kane, S.; Liu, X.; Chen, J.; Ji, C.; Endler, E.; Li, R.; Liu, L.; et al. Lithium-ion battery fast charging: A review. eTransportation 2019, 1, 100011. [Google Scholar] [CrossRef]
  17. Feng, X.; Fang, M.; He, X.; Ouyang, M.; Lu, L.; Wang, H.; Zhang, M. Thermal runaway features of large format prismatic lithium ion battery using extended volume accelerating rate calorimetry. J. Power Sources 2014, 255, 294–301. [Google Scholar] [CrossRef]
  18. Feng, X.; Zheng, S.; Ren, D.; He, X.; Wang, L.; Cui, H.; Liu, X.; Jin, C.; Zhang, F.; Xu, C.; et al. Investigating the thermal runaway mechanisms of lithium-ion batteries based on thermal analysis database. Appl. Energy 2019, 246, 53–64. [Google Scholar] [CrossRef]
  19. Zhang, Y.; Wang, H.; Wang, Y.; Li, C.; Liu, Y.; Ouyang, M. Thermal abusive experimental research on the large-format lithium-ion battery using a buried dual-sensor. J. Energy Storage 2021, 33, 102156. [Google Scholar] [CrossRef]
  20. Qin, P.; Sun, J.; Wang, Q. A new method to explore thermal and venting behavior of lithium-ion battery thermal runaway. J. Power Sources 2020, 486, 229357. [Google Scholar] [CrossRef]
  21. Wen, C.-Y.; Jhu, C.-Y.; Wang, Y.-W.; Chiang, C.-C.; Shu, C.-M. Thermal runaway features of 18650 lithium-ion batteries for LiFePO4 cathode material by DSC and VSP2. J. Therm. Anal. Calorim. 2012, 109, 1297–1302. [Google Scholar] [CrossRef]
  22. Kupper, C.; Spitznagel, S.; Döring, H.; Danzer, M.A.; Gutierrez, C.; Kvasha, A.; Bessler, W.G. Combined modeling and experimental study of the high-temperature behavior of a lithium-ion cell: Differential scanning calorimetry, accelerating rate calorimetry and external short circuit. Electrochim. Acta 2019, 306, 209–219. [Google Scholar] [CrossRef]
  23. Yuan, L.; Dubaniewicz, T.; Zlochower, I.; Thomas, R.; Rayyan, N. Experimental study on thermal runaway and vented gases of lithium-ion cells. Process Saf. Environ. Prot. 2020, 144, 186–192. [Google Scholar] [CrossRef]
  24. Gachot, G.; Ribière, P.; Mathiron, D.; Grugeon, S.; Armand, M.; Leriche, J.-B.; Pilard, S.; Laruelle, S. Gas Chromatography/Mass Spectrometry As a Suitable Tool for the Li-Ion Battery Electrolyte Degradation Mechanisms Study. Anal. Chem. 2010, 83, 478–485. [Google Scholar] [CrossRef]
  25. Spinner, N.S.; Field, C.R.; Hammond, M.H.; Williams, B.A.; Myers, K.M.; Lubrano, A.L.; Rose-Pehrsson, S.L.; Tuttle, S.G. Physical and chemical analysis of lithium-ion battery cell-to-cell failure events inside custom fire chamber. J. Power Sources 2015, 279, 713–721. [Google Scholar] [CrossRef]
  26. Golubkov, A.W.; Fuchs, D.; Wagner, J.; Wiltsche, H.; Stangl, C.; Fauler, G.; Voitic, G.; Thaler, A.; Hacker, V. Thermal-runaway experiments on consumer Li-ion batteries with metal-oxide and olivin-type cathodes. RSC Adv. 2013, 4, 3633–3642. [Google Scholar] [CrossRef] [Green Version]
  27. Fu, Y.; Lu, S.; Li, K.; Liu, C.; Cheng, X.; Zhang, H. An experimental study on burning behaviors of 18650 lithium ion batteries using a cone calorimeter. J. Power Sources 2015, 273, 216–222. [Google Scholar] [CrossRef]
  28. Ping, P. Lithium-Ion Battery Thermal Runway and Fire Risk Analysis and the Development on the Safer Battery System. Ph.D. Thesis, University of Science and Technology of China, Hefei, China, 2014. [Google Scholar]
  29. Ribière, P.; Grugeon, S.; Morcrette, M.; Boyanov, S.; Laruelle, S.; Marlair, G. Investigation on the fire-induced hazards of Li-ion battery cells by fire calorimetry. Energy Environ. Sci. 2011, 5, 5271–5280. [Google Scholar] [CrossRef]
  30. Wang, H.; Liu, B.; Xu, C.; Jin, C.; Li, K.; Du, Z.; Wang, Q.; Ouyang, M.; Feng, X. Dynamic thermophysical modeling of thermal runaway propagation and parametric sensitivity analysis for large format lithium-ion battery modules. J. Power Sources 2021, 520, 230724. [Google Scholar] [CrossRef]
  31. Liu, P.; Liu, C.; Yang, K.; Zhang, M.; Gao, F.; Mao, B.; Li, H.; Duan, Q.; Wang, Q. Thermal runaway and fire behaviors of lithium iron phosphate battery induced by over heating. J. Energy Storage 2020, 31, 101714. [Google Scholar] [CrossRef]
  32. Zhou, Z.; Ju, X.; Zhou, X.; Yang, L.; Cao, B. A comprehensive study on the impact of heating position on thermal runaway of prismatic lithium-ion batteries. J. Power Sources 2022, 520, 230919. [Google Scholar] [CrossRef]
  33. Larsson, F.; Andersson, P.; Blomqvist, P.; Mellander, B.-E. Toxic fluoride gas emissions from lithium-ion battery fires. Sci. Rep. 2017, 7, 10018. [Google Scholar] [CrossRef] [PubMed] [Green Version]
  34. Somandepalli, V.; Marr, K.; Horn, Q. Quantification of Combustion Hazards of Thermal Runaway Failures in Lithium-Ion Batteries. SAE Int. J. Altern. Powertrains 2014, 3, 98–104. [Google Scholar] [CrossRef]
  35. Wang, H.; Shi, W.; Hu, F.; Wang, Y.; Hu, X.; Li, H. Over-heating triggered thermal runaway behavior for lithium-ion battery with high nickel content in positive electrode. Energy 2021, 224, 120072. [Google Scholar] [CrossRef]
  36. Abraham, D.; Roth, E.; Kostecki, R.; McCarthy, K.; MacLaren, S.; Doughty, D. Diagnostic examination of thermally abused high-power lithium-ion cells. J. Power Sources 2006, 161, 648–657. [Google Scholar] [CrossRef]
  37. Hoelle, S.; Scharner, S.; Asanin, S.; Hinrichsen, O. Analysis on Thermal Runaway Behavior of Prismatic Lithium-Ion Batteries with Autoclave Calorimetry. J. Electrochem. Soc. 2021, 168, 120515. [Google Scholar] [CrossRef]
  38. Kondo, H.; Baba, N.; Makimura, Y.; Itou, Y.; Kobayashi, T. Model validation and simulation study on the thermal abuse behavior of LiNi0.8Co0.15Al0.05O2-based batteries. J. Power Sources 2019, 448, 227464. [Google Scholar] [CrossRef]
  39. Liao, Z.; Zhang, S.; Li, K.; Zhao, M.; Qiu, Z.; Han, D.; Zhang, G.; Habetler, T.G. Hazard analysis of thermally abused lithium-ion batteries at different state of charges. J. Energy Storage 2019, 27, 101065. [Google Scholar] [CrossRef]
  40. Li, Z.; Guo, Y.; Zhang, P. Effects of the battery enclosure on the thermal behaviors of lithium-ion battery module during TR propagation by external-heating. J. Energy Storage 2022, 48, 104002. [Google Scholar] [CrossRef]
  41. Teng, X.; Zhan, C.; Bai, Y.; Ma, L.; Liu, Q.; Wu, C.; Wu, F.; Yang, Y.; Lu, J.; Amine, K. In Situ Analysis of Gas Generation in Lithium-Ion Batteries with Different Carbonate-Based Electrolytes. ACS Appl. Mater. Interfaces 2015, 7, 22751–22755. [Google Scholar] [CrossRef]
  42. Wang, Q.; Ping, P.; Zhao, X.; Chu, G.; Sun, J.; Chen, C. Thermal runaway caused fire and explosion of lithium ion battery. J. Power Sources 2012, 208, 210–224. [Google Scholar] [CrossRef]
  43. Shin, J.-S.; Han, C.-H.; Jung, U.-H.; Lee, S.-I.; Kim, H.-J.; Kim, K. Effect of Li2CO3 additive on gas generation in lithium-ion batteries. J. Power Sources 2002, 109, 47–52. [Google Scholar] [CrossRef]
  44. Zou, K.; Lu, S.; Chen, X.; Gao, E.; Cao, Y.; Bi, Y. Thermal and gas characteristics of large-format LiNi0.8Co0.1Mn0.1O2 pouch power cell during thermal runaway. J. Energy Storage 2021, 39, 102609. [Google Scholar] [CrossRef]
  45. Wang, Q.; Mao, B.; Stoliarov, S.I.; Sun, J. A review of lithium ion battery failure mechanisms and fire prevention strategies. Prog. Energy Combust. Sci. 2019, 73, 95–131. [Google Scholar] [CrossRef]
  46. Huang, Z.; Zhao, C.; Li, H.; Peng, W.; Zhang, Z.; Wang, Q. Experimental study on thermal runaway and its propagation in the large format lithium ion battery module with two electrical connection modes. Energy 2020, 205, 117906. [Google Scholar] [CrossRef]
  47. Xue, L.; Li, Y.; Han, Q.; Su, Q.; Chen, Y.; Li, J.; Lei, T.; Chen, Y.; Chen, J. Effect of high-temperature crystallization on the electrochemical properties of LiNi0.5Co0.2Mn0.3O2 synthesized from a lithiated transition metal oxide precursor. Ionics 2018, 24, 2957–2963. [Google Scholar] [CrossRef]
  48. Wang, S.I.; Bi, M.S.; Li, Y. Industrial multivariate mixed gas explosion limit calculating. Chem. Equip. Technol. 2000, 28–30. [Google Scholar] [CrossRef]
  49. Bak, S.-M.; Hu, E.; Zhou, Y.; Yu, X.; Senanayake, S.D.; Cho, S.-J.; Kim, K.-B.; Chung, K.Y.; Yang, X.-Q.; Nam, K.-W. Structural Changes and Thermal Stability of Charged LiNixMnyCozO2 Cathode Materials Studied by Combined In Situ Time-Resolved XRD and Mass Spectroscopy. ACS Appl. Mater. Interfaces 2014, 6, 22594–22601. [Google Scholar] [CrossRef]
  50. Konishi, H.; Yuasa, T.; Yoshikawa, M. Thermal stability of Li1−yNixMn(1−x)/2Co(1−x)/2O2 layer-structured cathode materials used in Li-Ion batteries. J. Power Sources 2011, 196, 6884–6888. [Google Scholar] [CrossRef]
  51. Röder, P.; Baba, N.; Friedrich, K.A.; Wiemhöfer, H.-D. Impact of delithiated Li0FePO4 on the decomposition of LiPF6-based electrolyte studied by accelerating rate calorimetry. J. Power Sources 2013, 236, 151–157. [Google Scholar] [CrossRef]
  52. Huang, Y.; Lin, Y.-C.; Jenkins, D.M.; Chernova, N.A.; Chung, Y.; Radhakrishnan, B.; Chu, I.-H.; Fang, J.; Wang, Q.; Omenya, F.; et al. Thermal Stability and Reactivity of Cathode Materials for Li-Ion Batteries. ACS Appl. Mater. Interfaces 2016, 8, 7013–7021. [Google Scholar] [CrossRef] [PubMed] [Green Version]
  53. Ping, P.; Wang, Q.; Huang, P.; Li, K.; Sun, J.; Kong, D.; Chen, C. Study of the fire behavior of high-energy lithium-ion batteries with full-scale burning test. J. Power Sources 2015, 285, 80–89. [Google Scholar] [CrossRef]
  54. Yang, H.; Shen, X.-D. Dynamic TGA–FTIR studies on the thermal stability of lithium/graphite with electrolyte in lithium-ion cell. J. Power Sources 2007, 167, 515–519. [Google Scholar] [CrossRef]
  55. Li, W.; Wang, H.; Zhang, Y.; Ouyang, M. Flammability characteristics of the battery vent gas: A case of NCA and LFP lithium-ion batteries during external heating abuse. J. Energy Storage 2019, 24, 100775. [Google Scholar] [CrossRef]
  56. Liu, B. Study on explosion limit prediction of mixed combustible gas. Guangdong Chem. Ind. 2018, 45, 119–121. [Google Scholar]
  57. Röder, P.; Baba, N.; Wiemhöfer, H.-D. A detailed thermal study of a Li[Ni0.33Co0.33Mn0.33]O2/LiMn2O4-based lithium ion cell by accelerating rate and differential scanning calorimetry. J. Power Sources 2013, 248, 978–987. [Google Scholar] [CrossRef]
  58. Richard, M.N.; Dahn, J.R. Accelerating Rate Calorimetry Study on the Thermal Stability of Lithium Intercalated Graphite in Electrolyte. I. Experimental. J. Electrochem. Soc. 1999, 146, 2068–2077. [Google Scholar] [CrossRef]
  59. Jiang, J.; Dahn, J.R. ARC studies of the thermal stability of three different cathode materials: LiCoO2; Li[Ni0.1Co0.8Mn0.1]O2; and LiFePO4, in LiPF6 and LiBoB EC/DEC electrolytes. Electrochem. Commun. 2004, 6, 39–43. [Google Scholar] [CrossRef]
  60. Golubkov, A.W.; Scheikl, S.; Planteu, R.; Voitic, G.; Wiltsche, H.; Stangl, C.; Fauler, G.; Thaler, A.; Hacker, V. Thermal runaway of commercial 18650 Li-ion batteries with LFP and NCA cathodes—Impact of state of charge and overcharge. RSC Adv. 2015, 5, 57171–57186. [Google Scholar] [CrossRef] [Green Version]
  61. Gnanaraj, J.S.; Zinigrad, E.; Asraf, L.; Gottlieb, H.E.; Sprecher, M.; Aurbach, D.; Schmidt, M. The use of accelerating rate calorimetry (ARC) for the study of the thermal reactions of Li-ion battery electrolyte solutions. J. Power Sources 2003, 119–121, 794–798. [Google Scholar] [CrossRef]
  62. Belharouak, I.; Lu, W.; Vissers, D.; Amine, K. Safety characteristics of Li(Ni0.8Co0.15Al0.05)O2 and Li(Ni1/3Co1/3Mn1/3)O2. Electrochem. Commun. 2006, 8, 329–335. [Google Scholar] [CrossRef]
  63. Kawamura, T.; Kimura, A.; Egashira, M.; Okada, S.; Yamaki, J.-I. Thermal stability of alkyl carbonate mixed-solvent electrolytes for lithium ion cells. J. Power Sources 2002, 104, 260–264. [Google Scholar] [CrossRef]
  64. Wang, H.; Xu, H.; Zhang, Z.; Wang, Q.; Jin, C.; Wu, C.; Xu, C.; Hao, J.; Sun, L.; Du, Z.; et al. Fire and explosion characteristics of vent gas from lithium-ion batteries after thermal runaway: A comparative study. eTransportation 2022, 13, 100190. [Google Scholar] [CrossRef]
Figure 1. Physical picture of AEC constant volume adiabatic explosion chamber.
Electronics 12 01603 g001
Figure 2. Experimental device structure diagram.
Electronics 12 01603 g002
Figure 3. Thermocouple paste method diagram.
Electronics 12 01603 g003
Figure 4. Subfigures (ae) show the experimental data curves for the temperature, chamber pressure, and battery voltage during the experiments for NCM523, NCM622, NCM811, NCM9 0.5 0.5, and LFP batteries, respectively.
Electronics 12 01603 g004
Figure 5. (a) Image of temperature change during TR of different battery (b) (temperature change rate-temperature) curves during TR of batteries. (c) Acquisition method of battery TR trigger temperature T o n s e t .
Electronics 12 01603 g005
Figure 6. Pressure change rate (a) and pressure (b) in AEC chamber during TR of batteries with different cathode materials.
Electronics 12 01603 g006aElectronics 12 01603 g006b
Figure 7. Subfigure (a) shows the temperature variation curve of the thermocouple at 30 mm above the vent valve of NCM523, NCM622, NCM811, and NCM9 0.5 0.5 batteries during the experiments. Subfigure (b) shows the temperature variation curve of the thermocouple at 30 mm above the vent valve of the LFP battery during the experiments.
Electronics 12 01603 g007aElectronics 12 01603 g007b
Figure 8. (a) (Gas production/gas production time) normalization and (b) (gas production/battery temperature) normalization.
Electronics 12 01603 g008
Figure 9. Investigation of gas generation and phase change sequence during TR of NCM battery and LFP battery [12,42,43,47,49,50,51,52,53,54,55,56,57,58,59,60,61,62,63].
Electronics 12 01603 g009
Figure 10. (a) Summary of test results of battery gas components. (b) Comparison of main gas content in different batteries after TR.
Electronics 12 01603 g010aElectronics 12 01603 g010b
Figure 11. UFL and LFL of battery TR gas.
Electronics 12 01603 g011
Figure 12. (A) Comparison of main products after TR of battery. (B) Subfigures (ae) correspond to the photographs of NCM523, NCM622, NCM811, NCM, and LFP batteries, respectively, taken after the experiments.
Electronics 12 01603 g012
Table 1. Review on TR of lithium ion batteries.
Related ResearchersResearch ObjectTest InstrumentTest Result
Zhang et al. [8]Type: Square battery
Capacity: 50 Ah
Cathode :   N i 0.6 C o 0.2 M n 0.2 O 2
Anode: Graphite
Adiabatic test chamber1: TR can occur when the jet temperature at the vent valve position increases.
2: The maximum temperature can reach up to 701 °C.
3: As the SOC of the battery increases, the jet velocity and temperature also increase.
Qin et al. [20]Capacity: 2.6 Ah
Cathode :   L i N i 0.8 C o 0.1 M n 0.1 O 2
Anode: Graphite
ARC 1: The rate of temperature increase in the battery before the second stage of TR, known as ‘Tsc’, does not have a linear relationship with the gas production rate. 2: The rise in internal battery pressure is caused by the gas generated during the redox reaction occurring inside the battery.
Yuan et al. [22] (1) Capacity: 3.8 Ah
Cathode :   L i F e P O 4
Anode: Graphite
(2) Capacity: 1.3 Ah
Cathode :   L i 4 T i 5 O 12
Anode: Graphite
(3) Capacity: 3.2 Ah
Cathode: NCM
Anode: Graphite
ARC
DSC
GC
1: The NCM battery exhibits a low initial temperature for TR, but a relatively high maximum temperature for gas production and TR.
2: The LTO battery experiences a low maximum temperature during TR and produces less gas.
3: The LFP battery has a relatively high initial temperature for TR, while the maximum temperature and gas production rate are between those of the LTO and NCM batteries.
Wang et al. [35]Type: Cylindrical battery
Capacity: 4.6 Ah
Cathode :   L i N i 0.8 C o 0.1 M n 0.1 O 2
Anode: Graphite
Self-made experimental device TR comparison experiment1: NCM811 compared to NCM111, NCM532, and NCM622, increasing the nickel content in the positive electrode amplifies the damage caused by TR in the battery.
Abraham et al. [36] Capacity: 1 Ah
Cathode :   L i N i 0.8 C o 0.15 A l 0.05 O 2
Anode: Mag-10 Graphite
Microscope, Spectrometer, diffraction method, ARC1: The research provides evidence for the sequence of events leading to battery TR and the corresponding sequence of gas generation sources.
S. Hoelle et al. [37] Capacity: 8–145 Ah
Cathode: NCM, NCA, LMO
Anode: Graphite
Battery needle test bench1: The gas production of LIBs with different ampere hours was examined and standardized, and the findings revealed that the range of gas production was between 1.6 L/Ah and 2.8 L/Ah.
Kondo et al. [38] Capacity: 0.5 Ah
Cathode :   L i N i 0.75 C o 0.15 A l 0.05 M g 0.05 O 2
Anode: Graphite
Combining DSC and simulation1: The thermal properties of the battery were determined via DSC experiments.
2: A simulation was carried out to examine the thermal abuse of the battery.
Liao [39]Capacity: 2.4 Ah
Cathode :   L i N i 1 / 3 C o 1 / 3 M n 1 / 3 O 2
Anode: Graphite
Self-made 24 L sealed high pressure vessel1: The maximum temperature during TR of a battery increases linearly with the SOC.
2 :   The   gases   released   during   TR   consist   mainly   of   hydrocarbons ,   carbon   oxides ,   and   other   compounds   such   as   C 2 H 4 O 2   and   C 2 H 6 O .
3: This process also generates harmful environmental substances such as benzene.
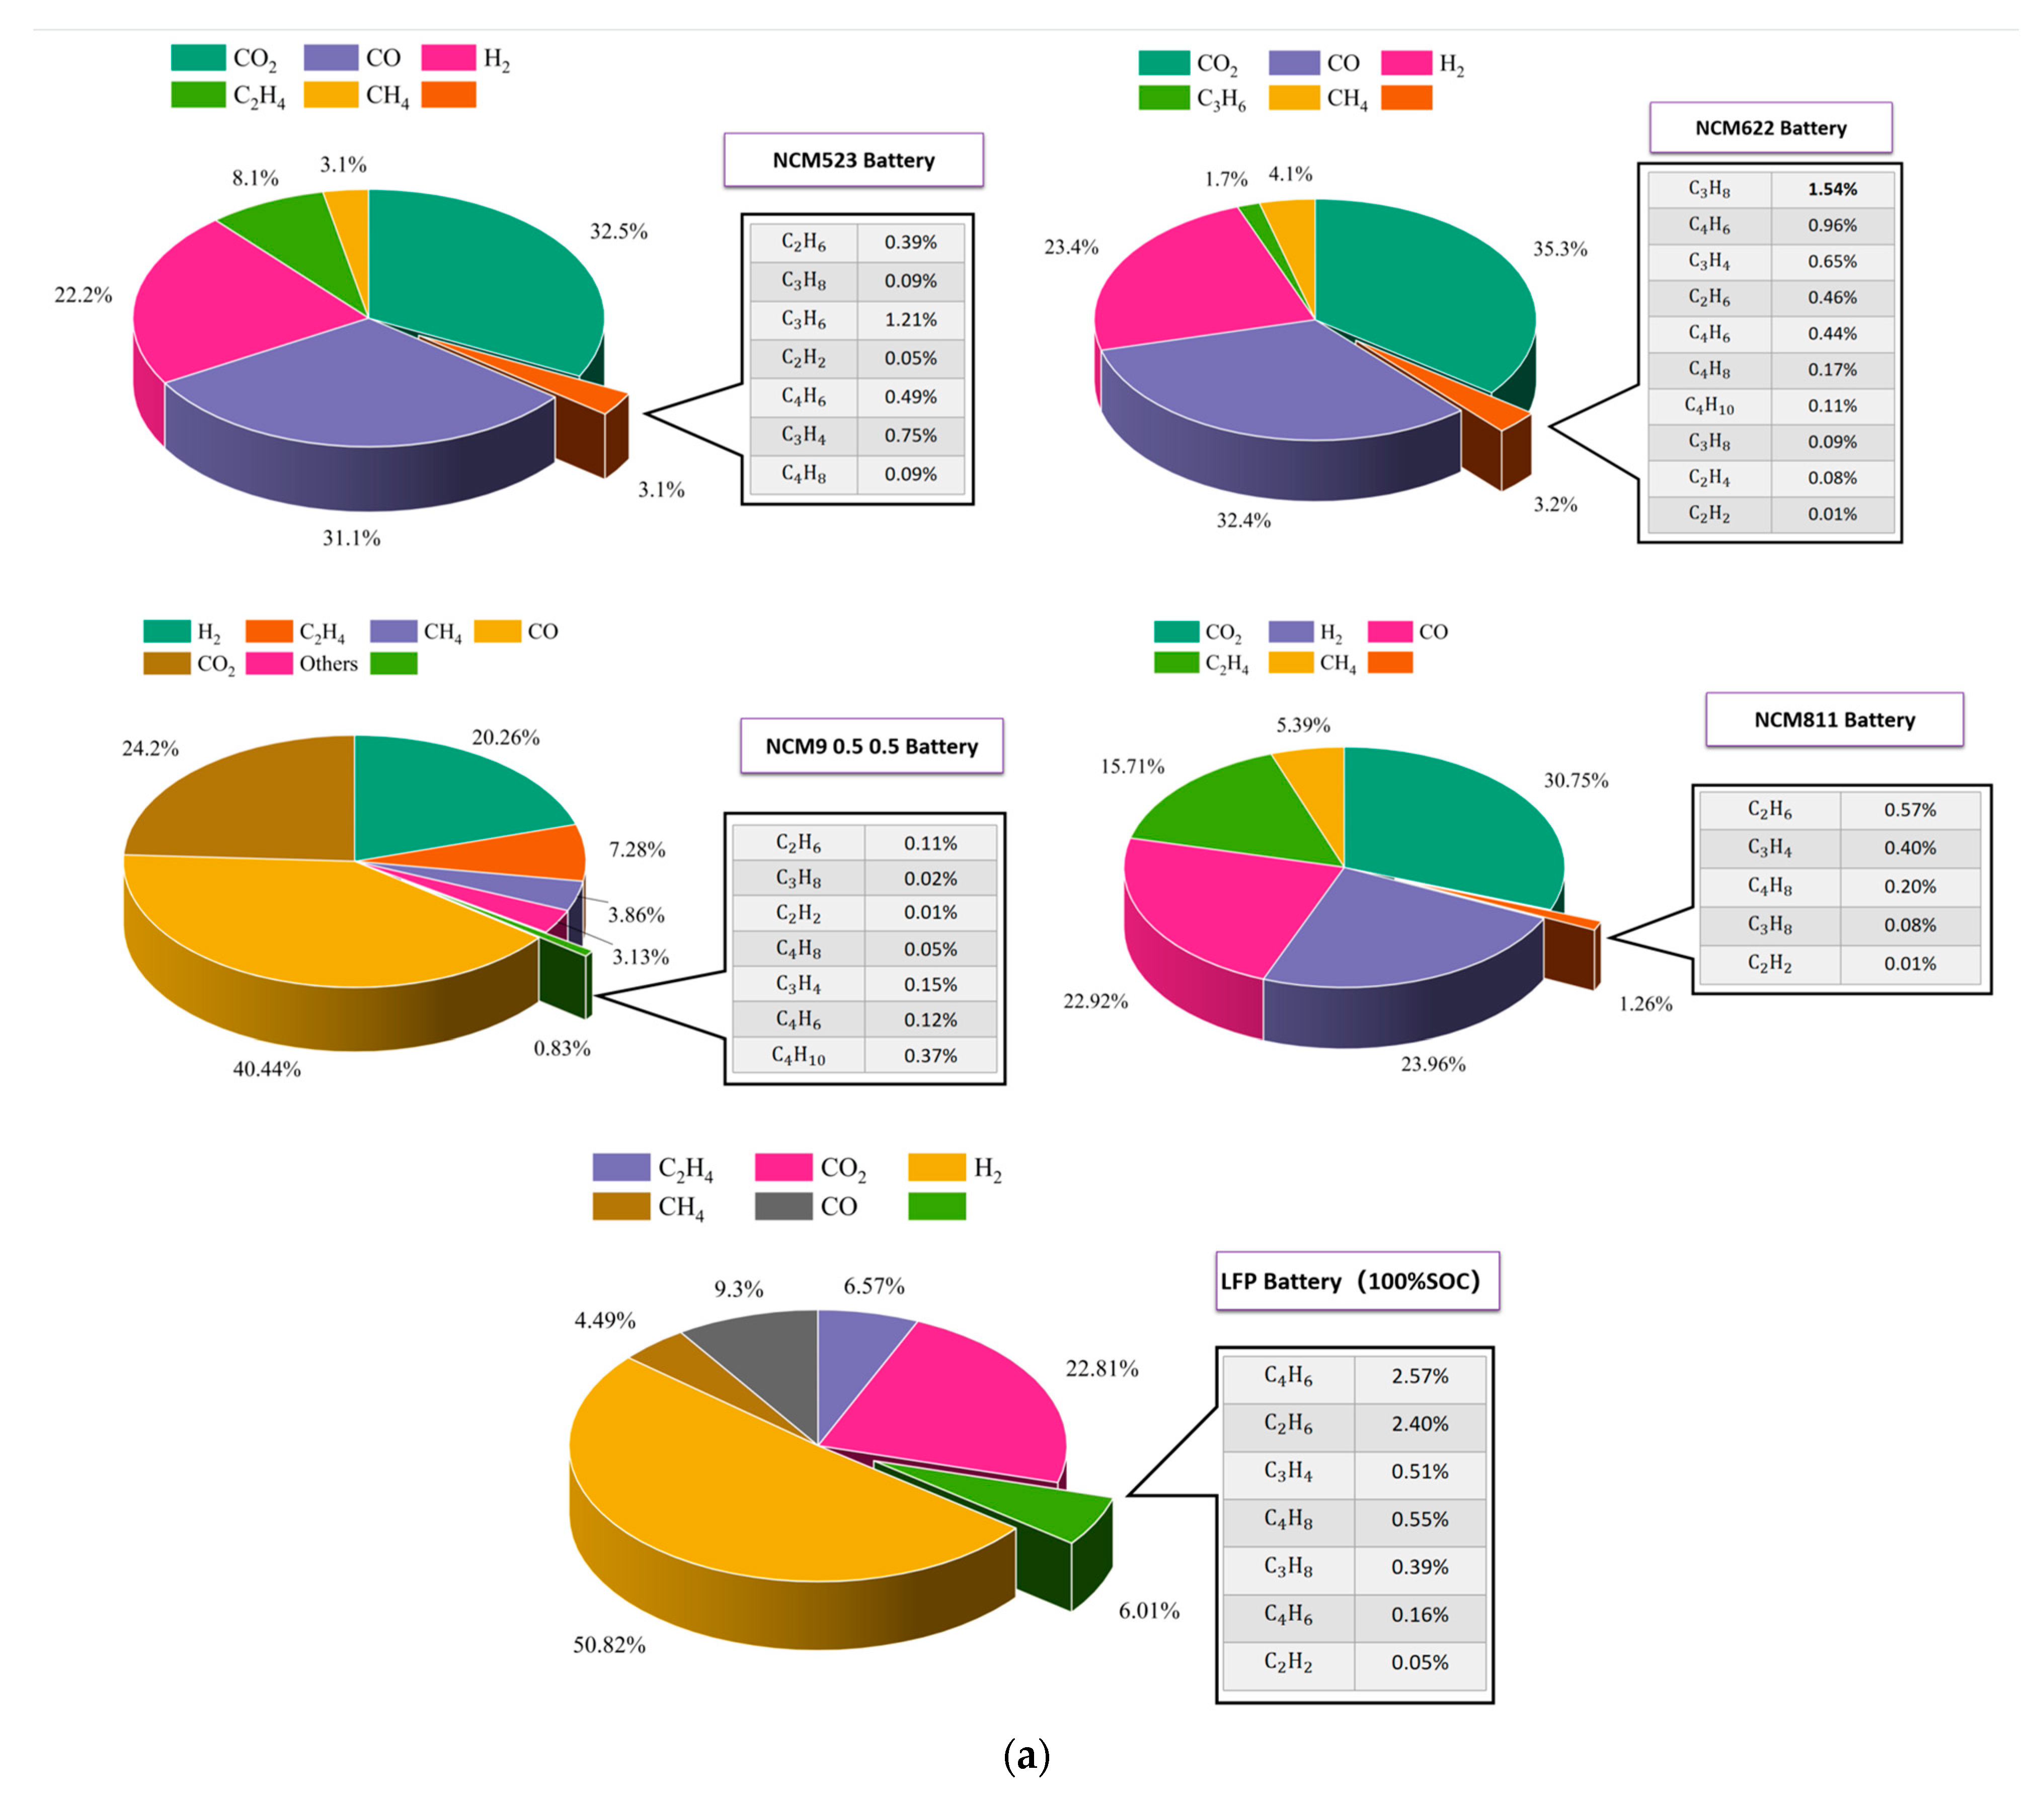
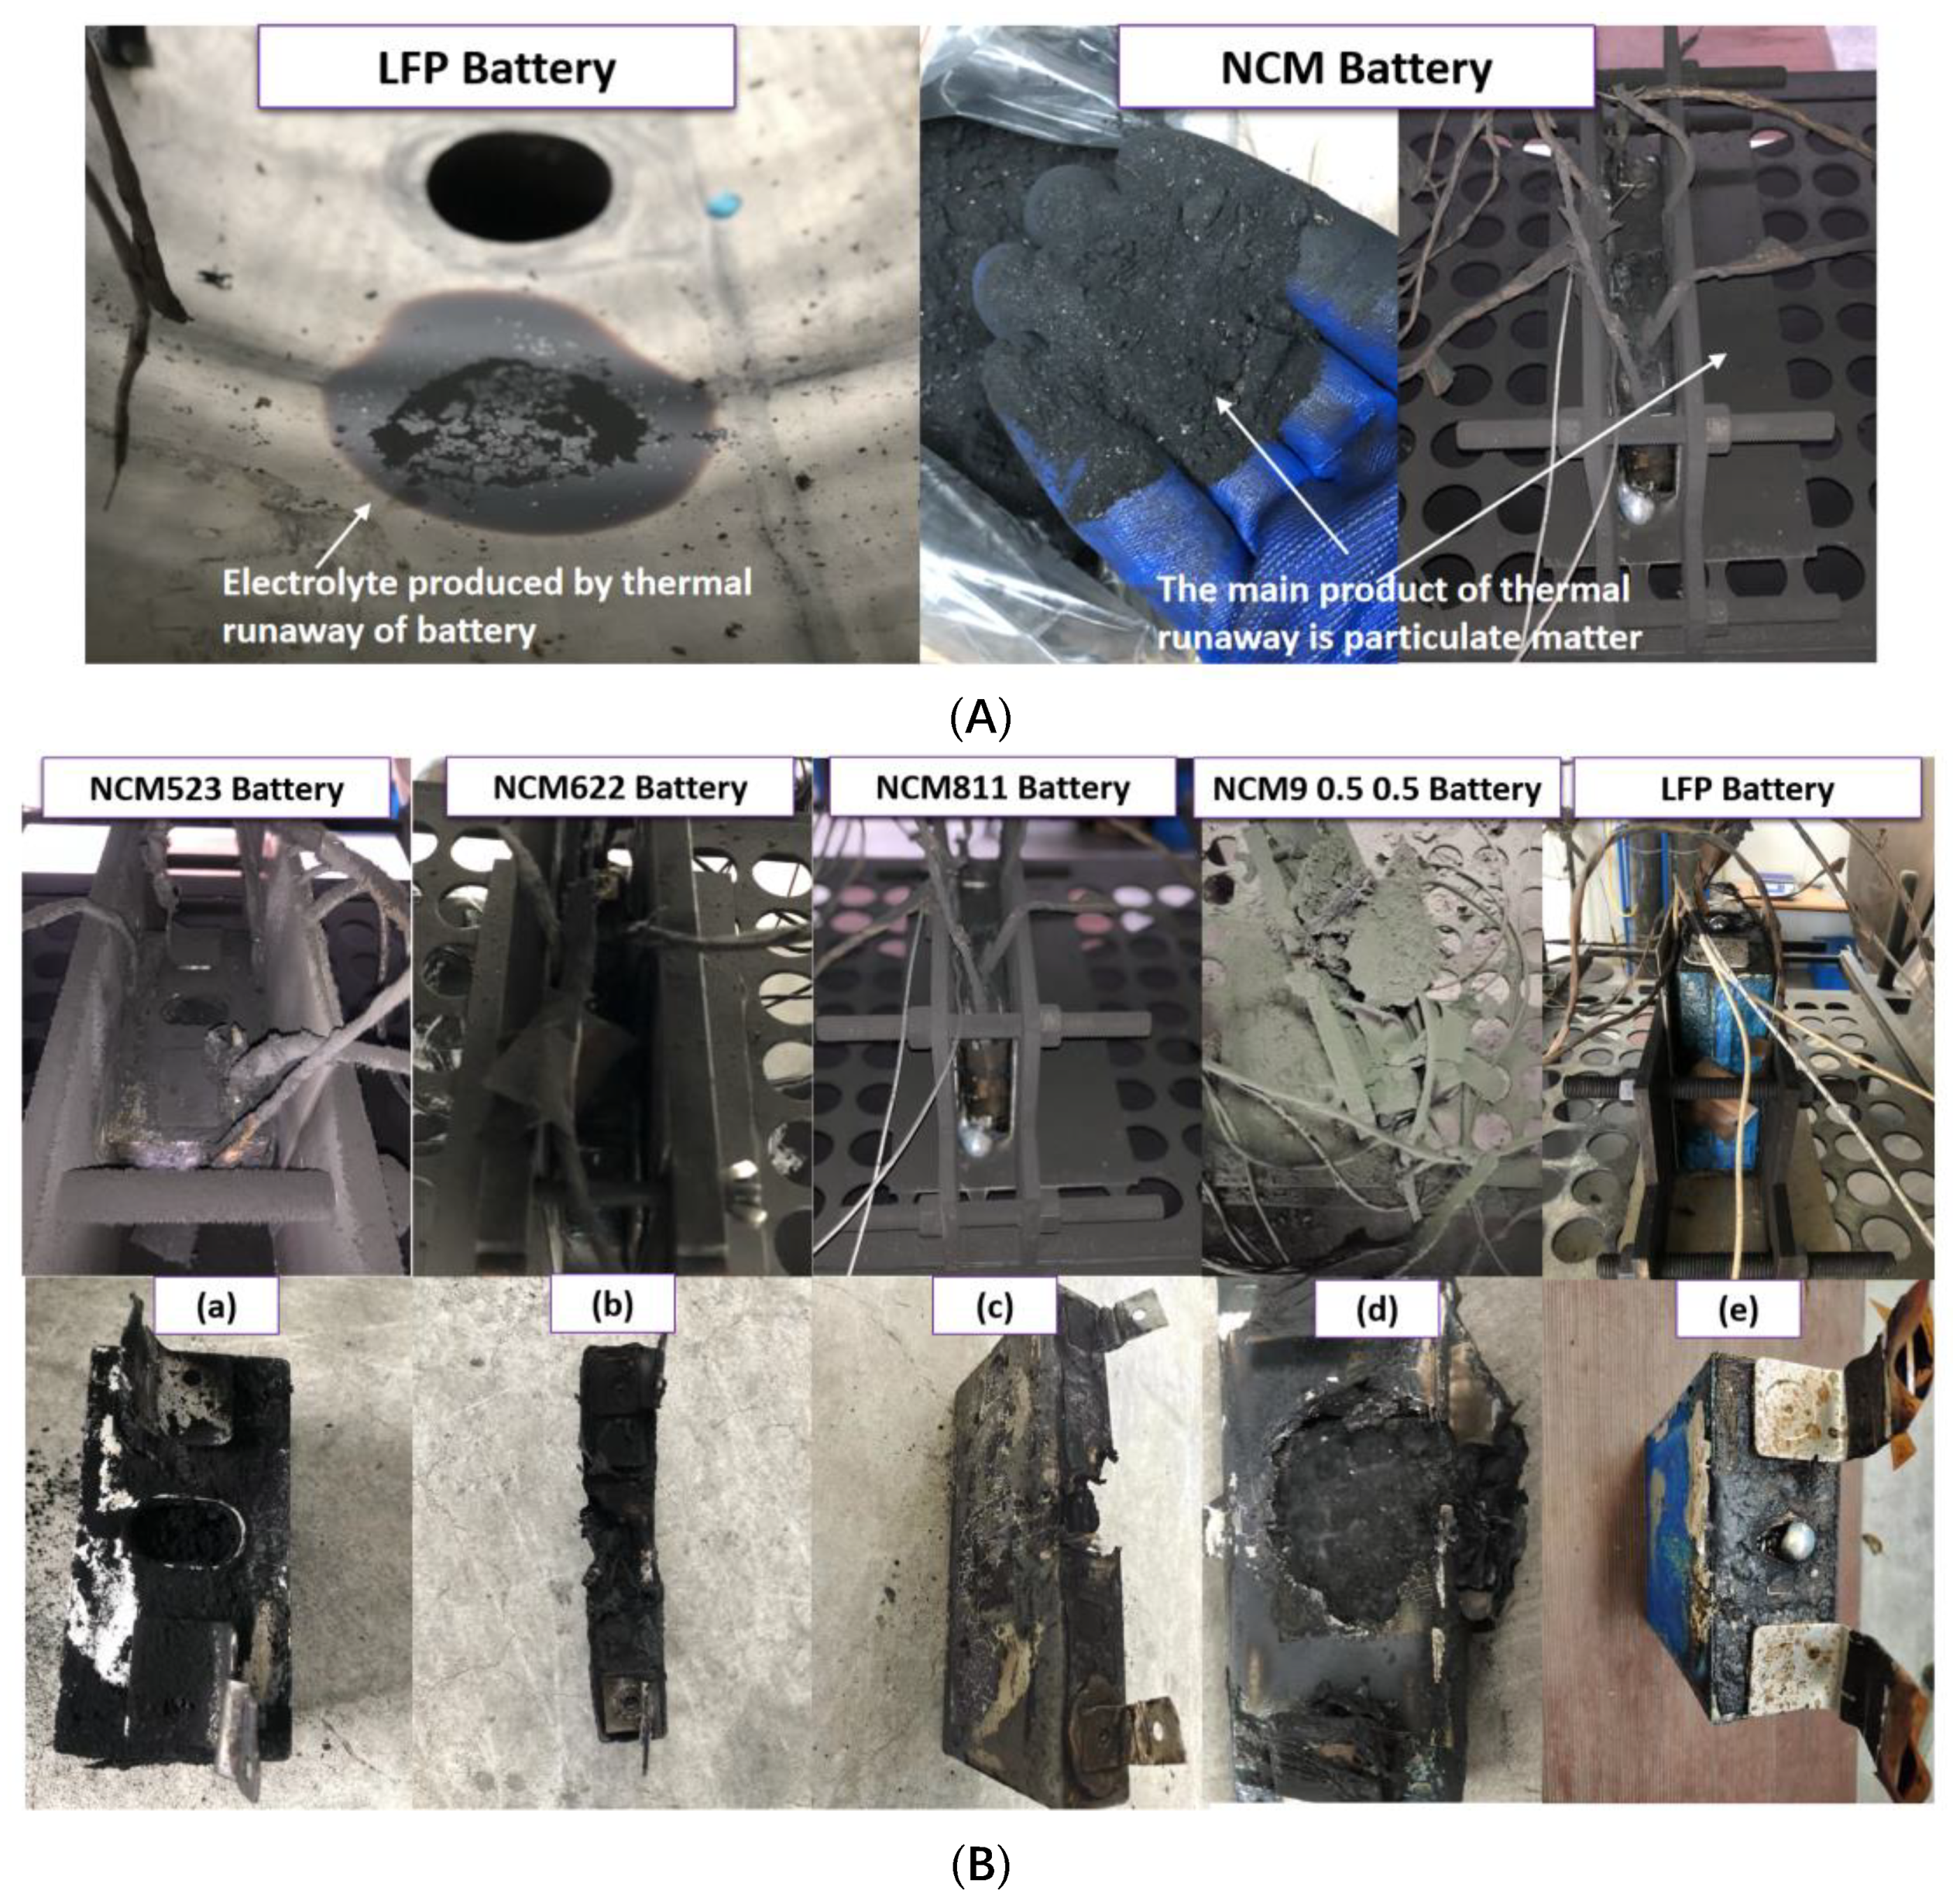
This study(1) Capacity: 304 Ah Square battery
Cathode :   L i F e P O 4
Anode: Graphite
(2) Capacity: 118 Ah Square battery
Cathode :   L i N i 0.8 C o 0.1 M n 0.1 O 2
Anode: Graphite
(3) Capacity: 50 Ah Square battery
Cathode :   L i N i 0.6 C o 0.2 M n 0.2 O 2
Anode: Graphite
(4) Capacity: 153 Ah Square battery
Cathode :   L i N i 0.5 C o 0.2 M n 0.3 O 2
Anode: Graphite
(5) Capacity: 165 Ah Square battery
Cathode :   L i N i 0.9 C o 0.05 M n 0.05 O 2
Anode: Graphite
1: Inert atmosphere
2: GC-MS
1: The normalized gas production of NCM batteries ranges from 1.8 to 2.8 L/Ah, while that of LFP batteries is only 0.569 L/Ah.
2: Based on gas production, the degree of harm caused by TR is ranked as follows: NCM 9 0.5 0.5 > NCM 811 > NCM 622 > NCM 523 > LFP.
3: LFP battery TR produces a large amount of electrolyte, while NCM battery generates a large number of particles.
4 :   H 2 , C O , C O 2 , C 2 H 4   and   C H 4 are the main gas components generated during TR of NCM and LFP batteries.
5: The flammability limit of the TR gas of the battery was calculated, and the risk of TR of LFP and NCM batteries was re-evaluated from the perspective of flammability limit.
Table 2. Battery information used in this study.
CellLFPNCM523NCM622NCM811NCM 9 0.5 0.5
ShapeSquareSquareSquareSquareSquare
Cathode L i F e P O 4 L i N i 0.5 C o 0.2 M n 0.3 O 2 L i N i 0.6 C o 0.2 M n 0.2 O 2 L i N i 0.8 C o 0.1 M n 0.1 O 2 L i N i 0.9 C o 0.05 M n 0.05 O 2
AnodeGraphiteGraphiteGraphiteGraphiteGraphite
Specific energy (Wh/kg)172.51247.43234.03273.06324.95
Weight (g)5639262890818152158
Upper limit cut-off voltage (V)3.654.34.34.34.3
Lower cut-off voltage (V)2.52.82.82.82.8
Wrapper MaterialAl AlloyAl AlloyAl AlloyAl AlloyAl Alloy
Capacity (Ah)30415350118165
Max discharge current2C2C2C1C1C
Temperature range for normal
Operation (°C)
−40~55−40~50−40~45−40~55−40~50
Jellyroll22222
SOC100%100%100%100%100%
Table 3. Data recorded during battery TR.
(°C)T1T2T3 T ˙ m a x T o n s e t
NCM523370.6589.3695.5549.3142.7
NCM622555.9504.8600.6597.1140.8
NCM811564.2767.6826.1762.8135.6
NCM9 0.5 0.5843.5903.7943.9842.1130.6
LFP170.9306.6559.2302.1184.0
T1: the maximum temperature of battery side TR; T2: the highest temperature during TR of battery surface; T3: the highest temperature during TR of battery heating surface; T ˙ m a x : the maximum average temperature during TR( T ˙ m a x = average( T ˙ 1 + T ˙ 2 + T ˙ 3); T o n s e t : TR onset temperature.
Table 4. Different battery TR gas production and gas production normalization.
Celln (mol)L/Ah
NCM52312.391.814
NCM6224.992.236
NCM81112.092.295
NCM9 0.5 0.520.272.752
LFP7.720.569
Table 5. Combustible limits of common combustible gases.
Gas Type L m a x L m i n
C O 7412.5
H 2 75.64
O 2 74.14.2
C H 4 155
C 2 H 4 362.7
C 2 H 6 132.9
1.3- C 4 H 6 16.31.1
C 3 H 6 10.32.4
C 3 H 8 9.52.2
Table 6. TR mass loss rate and R G S of battery.
Cell R G S Mass Loss Rate (%)
NCM5231.61437.84
NCM6220.51840.36
NCM8111.03448.67
NCM9 0.5 0.50.91062.89
LFP50.61919.22
Disclaimer/Publisher’s Note: The statements, opinions and data contained in all publications are solely those of the individual author(s) and contributor(s) and not of MDPI and/or the editor(s). MDPI and/or the editor(s) disclaim responsibility for any injury to people or property resulting from any ideas, methods, instructions or products referred to in the content.

