1. Introduction
A frequent and computationally intensive operation in scientific computing and other high-performance applications is matrix multiplication. It is reasonable to expect it to be a significant portion of exascale workloads. Power consumption has been a major obstacle for developing exascale systems for many years [
1] and will continue to be a concern in the future. A point of general motivation for this investigation is the notion that some algorithms may offer savings in power consumption that may be of value in systems that use them in a significant portion of typical workloads. In an exascale system, even small savings in power may be valuable, as the effects may accumulate and amplify in potentially massive workloads if sufficiently ubiquitous.
Previous work on the power characteristics of other commonplace computational tasks, such as sorting [
2,
3] and searching [
4], ave provided further encouragement to examine matrix multiplication. Those studies showed that some methods, not necessarily the usual choices, could provide a better alternative for power-aware applications. In [
3], experimental results showed that a natural unoptimized mergesort consumes less power than a highly optimized three-way quicksort. A later study by other researchers supported that result [
5]. Similarly, in [
4], a two-way binary search was more power efficient than its faster three-way counterpart. The researchers identified interesting time-power tradeoffs in cases of both mergesort and two-way binary search.
Moreover, work in [
6,
7] showed that the codes executed by a processor are correlated with the chip temperature. Codes generated under different conditions cause the chip to run at different temperatures, which reflect the code and measures inside the processor designed to protect against overheating. The two chief influences on the code are the original algorithm and the compilation process. Compilers typically offer rich compilation options focused on execution speed and code efficiency, not power performance. The researchers experimented with matrix multiplication code. They proposed optimizations to reduce overheating based on monitoring the temperature reported by the chip. Their work served as further motivation for this work, which explores algorithmic aspects.
In this study, we describe a preliminary investigation of the energy and power characteristics of three matrix multiplication algorithms:
Definition-based matrix multiplication (will be referred to as D3.0 in this work).
Basic divide-and-conquer matrix multiplication by Strassen (D2.8).
Optimized divide-and-conquer multiplication (D2.4).
The first is simply the familiar pen–paper systematic row-by-column multiplications. The difference between the three methods is best illustrated by examining the 2-by-2 case. The definition-based algorithm performs eight basic multiplications to generate the elements of the product matrix. The other two perform only seven but combine the products in different ways. A recursive divide-and-conquer provides a succinct statement. It repeatedly replaces a product with a combination of seven half-dimension submatrices. The naming convention intends to remind the reader of an algorithm by its time complexity, which in each case is a polynomial term with a different degree. For example, the well-known time efficiency of brute force implementation of the definition of matrix multiplication is
, hence the D3.0 tag. For the other two, the degrees are either
[
8] or ≈2.376 [
9]. The programs used in the study were based on code from [
10,
11] adapted to the experimental environment. The study relied on internal sensors embedded in an HPC-class processor. Power, energy, and other microarchitectural activity measurements from those sensors were collected via the Intel running average power limit (RAPL) interface. A recent study showed that RAPL provided accurate power readings compared to plug power on the processor used for the experiment [
12]. In that report, the terms power and energy were not used interchangeably.
The objectives of this study, within the general goal of discovering new ways to help build power-efficient HPC software, are threefold. First, to study the primary matrix multiplication algorithms that may be considered in high-performance applications and compare them based on their power efficiency on a credible HPC platform. Second, to quantify the power cost for each in an HPC context. Third, to help identify the best choices for applications where power efficiency is a priority. The organization of this paper is as follows.
Section 2 reviews in chronological order interesting related research in the last ten years, focusing on the methods and the findings.
Section 3 introduces the methods and materials used in this research.
Section 4 presents and discusses the results. Finally, some conclusions and suggested future work are in
Section 5.
2. Literature Review
Basmadjian et al. [
13] performed redundant multithreading (RMT) on a two-way chip microprocessor (CMP) in gate-level mode. The failure rate of the method was estimated through the injection of the fault. The energy consumption and performance cost of the method were also studied. The simulation and examinations performed resulted in an RMT error (relative to 4% capacitance) of 91.7%. The RMT technology consumed 20 to 40 times more energy than conventional technology.
Khezripour et al. [
14] implemented two different types of electronic refrigeration and cooling systems, exploring reducing the total energy consumption with a model that combines a microprocessor and a real cooling system. They utilized thermoelectric coolers (ETEC) to cool the cache, achieving a modest three development but with the benefit of integration. In addition, they utilized their cooling system for chip-level cooling, which saved 25% in energy in contrast to the non-cooled designs.
Partk and Yang [
15] suggested a method to anticipate the number of cores needed to interconnect multicore processors using scheduling control information. The method was characterized by low energy consumption without deterioration. It was successfully applied to a 32-core processor.
Al-Hasib et al. [
16] examined the energy competence impact of applying data reuse conversion to utilize time location on a multicore processor operation with a movement evaluation algorithm. This method increased the energy competence 5.5 times.
Kodaka et al. [
17] comprehensively surveyed approaches for estimating the power consumption of single-core and multicore processors, virtual machines, and the entire server.
Dargie and Wen [
18] examined a lightweight probability model to evaluate the power utilization for the entire CPU, network interface cards, and servers. They assessed the precision of the model via two criteria (custom-made and standard benchmarks) on two heterogeneous server platforms. The reported error related to the custom benchmark was minus 1%, while it was minus 12% for the standard scale.
Yuechuan et al. [
19] provided an energy examination methodology for C resource programs. Building on the basic structure of the C process and the C program, this technique proposed classifying atomic processes and creating a database of power for atomic processes through experiments. For the sequential statement block, control blocks, and subblocks, three types of methodologies related to counting the energy were suggested. The entire C program was turned into a stream tree. The power prediction algorithm for C was advanced.
Hamady et al. [
20] estimated the power used by multicore processor systems when operating diverse work burdens with a restricted numeral of cores. Their method developed energy competence by applying a single physical core with ultra-connectivity.
Poon et al. [
21] presented an energy-conscious sorting algorithm applying networked computers with visual hierarchical mapping. This reduced the overall time and data flow, thus decreasing energy consumption.
Aliaga et al. [
22] offered an energy-saving runtime application responsible for simultaneously executing ILUPACK on a multicore platform. The findings demonstrated that decreasing the idle time of the strands saved energy without degrading the performance.
Yildiz et al. [
23] evaluated the power utilization of diverse I/O methods. Regardless of the system architecture or application-specific parameters, the model chose the best I/O method based on energy competence.
Cebrian et al. [
24] applied microarchitecture to correspond to power limitations while minimizing the processor power consumption. They converted the decentralized CPU power consumption at the cycle and base block levels into icons to choose among various microarchitectural methods to save on energy consumption. The energy efficiency was increased by 11% for this method.
Lastovetsky et al. [
25] suggested a new model founded on approaches and algorithms to reduce the computing time and effort for equal data applications implemented on a similar multicore mass (Intel E5-2670 Haswell Server). Compared to the customary balanced workload allocation, it also showed a significant increase in the two applications’ average and maximum percent of performance and functionality. The findings demonstrated that performance improvement alone could significantly decrease energy consumption.
Abdel-Hafeez et al. [
26] suggested a new mathematical algorithm for sorting and categorizing the correct elements of the input data on a y basis without a comparison. They used a custom built-in CMOS circuit (90 nm, Taiwanese semiconductor manufacturer) with a 1 V power supply to evaluate the work and contrasted it with other device-based enhanced hybrid classification designs; the findings demonstrated a 50% energy savings.
Gupta et al. [
27] suggested a new methodology to distribute the best CPU and GPU power consumption to mobile platforms within a provided power financial plan. They assessed their work using simulations and trials on industry-standard advanced mobile platforms. The findings demonstrated the high productivity and efficient use of the available stagnated energy. They effectively achieved the objective of distributing the best power consumption for the CPU and GPU for the provided power.
Aljabri et al. [
3] conducted a comprehensive empirical study on a high-performance quicksort against basic mergesort, paying careful attention to the experimental environment. They used a RAPL profiler on a light Linux setup to obtain measurements on an HPC-class Intel Haswell chip, which supported better instrumentation. They gathered energy (joules), power (watts), and cache miss information. The work was careful to focus readings on the experimental code and to eliminate those from other sources. The plain mergesort showed a clear advantage over the quicksort.
Haidar et al. [
28] examined the performance of several kernels and the energy consumption of different hardware elements from a maximum power perspective. They utilized the PAPI instrument of power tuning to decrease the total power consumption by 30%, and there was no regression in performance in many cases.
Kondo et al. [
29] suggested a venture under the name of “BomPP venture” and advanced numerous energy-saving methods within a specific energy financial plan. They also provided a recognized resource manager, energy performance simulation, and examined a framework for future supercomputer systems.
Chandra et al. [
30] researched the impact of programming languages related to power consumption. They used a higher than one programming language (Java, Visual Basic, and C#) to implement different sorting algorithms (bubble, pick, insert, and quick sort) to find the most energy-efficient programing language. They discovered that Java was the most energy-efficient, and the least energy-efficient was Visual Basic.
Ozer et al. [
31] applied a machine learning methodology to anticipate energy indicators and legacy guidelines with potential recurrence settings by utilizing information gathered at runtime. Then, they used degradation algorithms, creating preprocessed data and training algorithms to anticipate the best recurrence settings.
3. Methods and Procedures
The underlying objective of determining the power advantage that an algorithm for a basic computation process may have over its competitors is a critical driver of the methodology used in this research. As much noise as possible, i.e., power from environmental sources had to be removed to obtain representative sensor values. Eliminating noise lends credibility to results. A considerable time was spent with the CPU environment to ensure removal of noise. For the best results, the experimental code was run on one core as a precaution to guarantee that readings were least affected by on-chip optimizations, internal power control mechanisms, or temperature effects from neighboring silicon. For a reliable estimate of the measured values, the experiment was allowed to run as much as needed until converging on an average value. In this environment, the average stabilized around 240 runs. Execution time was used as a control to confirm that the code worked as expected.
This section outlines the techniques and tools utilized in the research. It is divided into four parts: the environment of the experiments, the datasets used in the experiments, the characteristics of the executables that implemented the algorithms, and the profiling tool used to collect CPU data and related statistics.
3.1. Experimental Environment
This empirical study relies on an experimental setup originally developed for work described in [
3]. The setup and the various measures and settings designed to eliminate as many factors as possible that could confound measurements in empirical studies, such as the ones described in this report, are detailed in [
32]. This study contributes with a significant update, however. During the initial runs of the experiments, some environmental noise was detected in the results. The expected time complexity behavior was somewhat off. It was determined to be due to the data collection process thread running on multiple cores instead of the designated one, as had been anticipated. To fix this, we set the affinity for the OS thread and the process to run on core 0 only, thus eliminating another power source that contaminates the measurements. It is vital to ensure the credible of the majority of the power readings that come from the running code to be able to discuss the underlying algorithms. This experience highlights the importance of collecting information about timing in these studies.
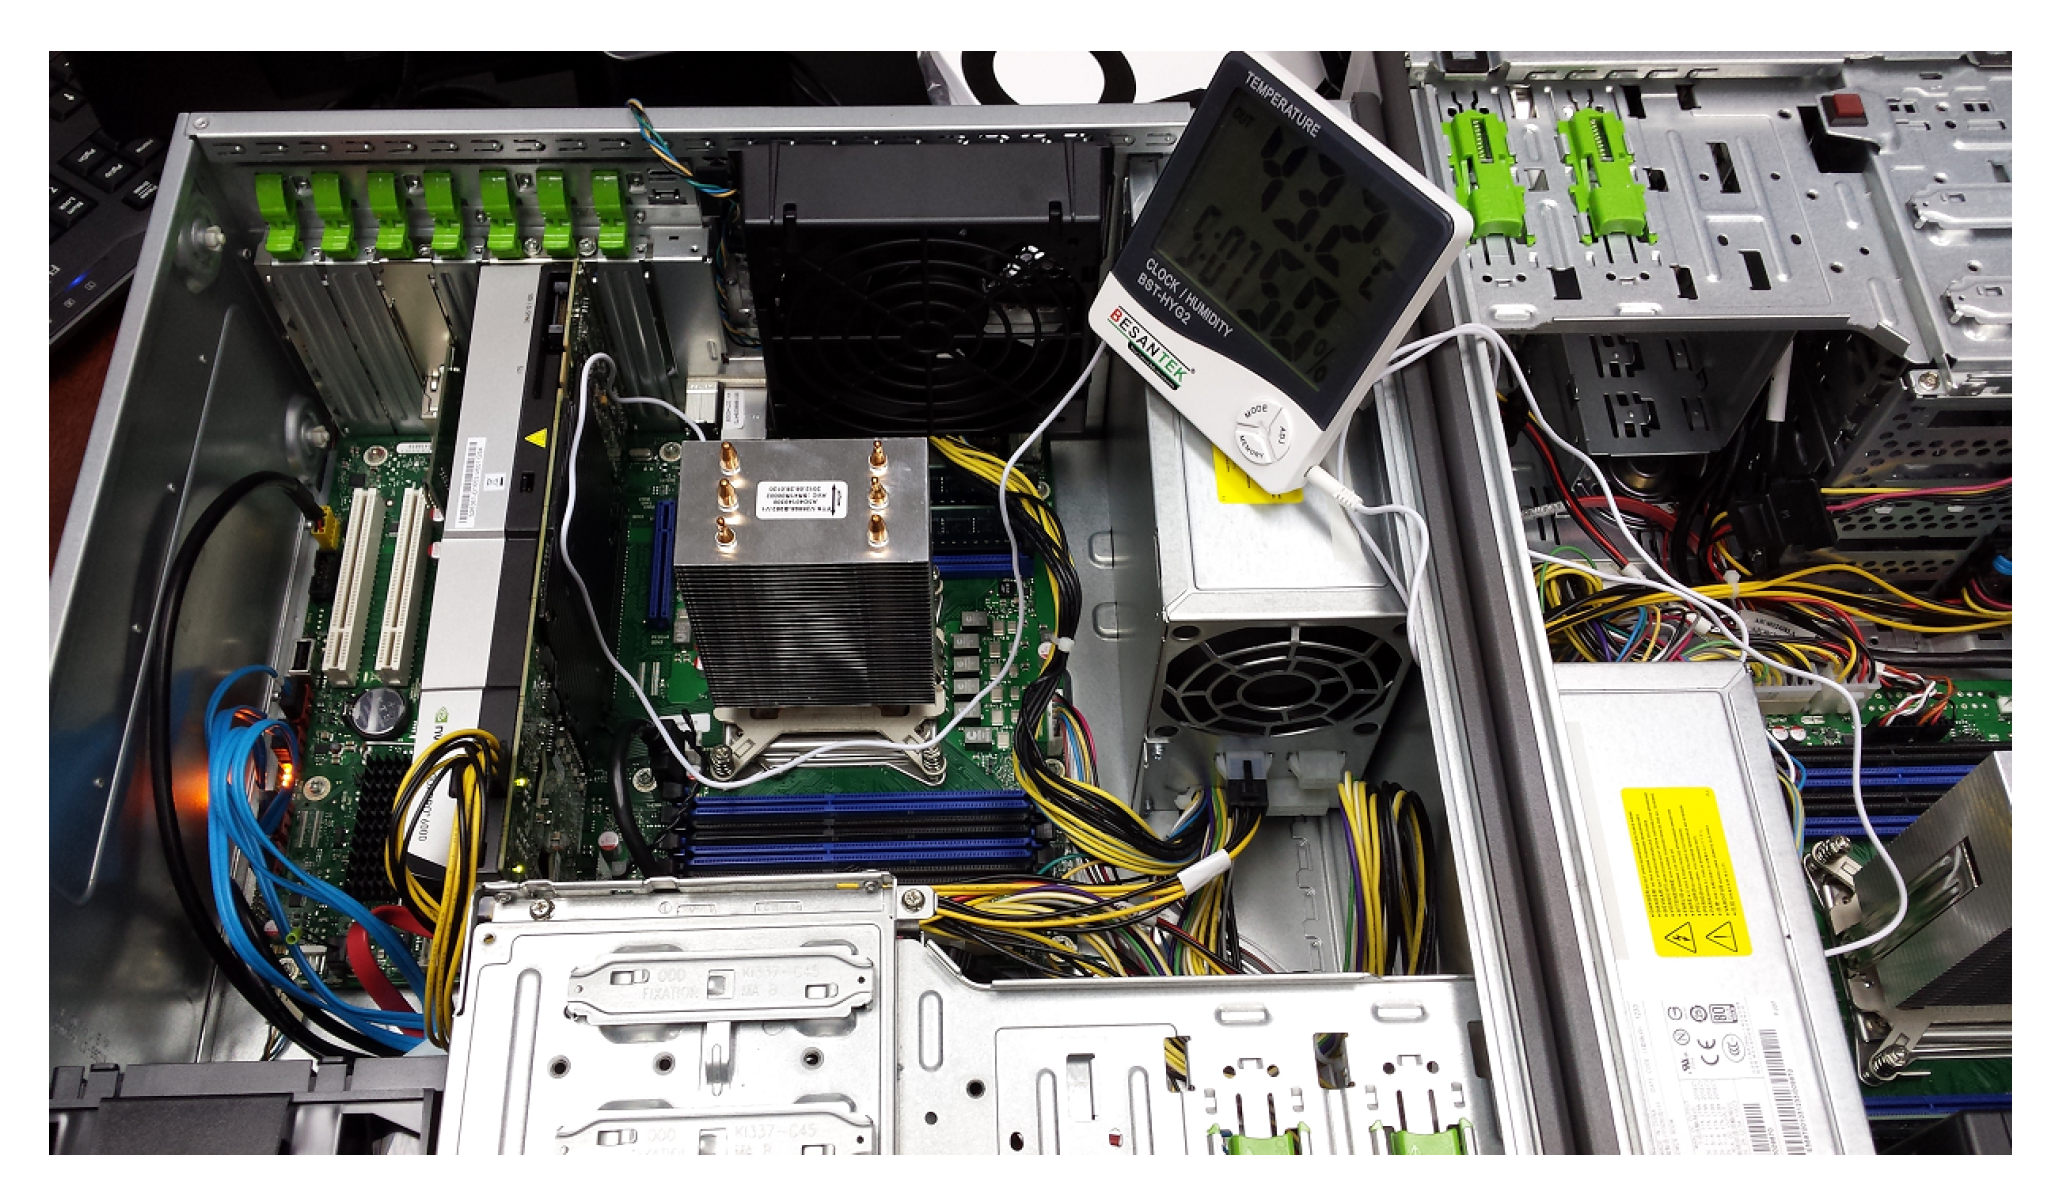
An Intel Xeon-class Haswell processor, a popular HPC part that provides credible readings from its internal sensors [
12], was used. The addition of fully integrated voltage regulators (FIVR) to the Haswell platform provided the reliable, high-resolution measurements required for the experiments in this research.
Table 1 lists the specifications of the machine used for running the experiments. The setup is shown in
Figure 1.
3.2. Test Dataset Generation
Square matrices, sized (dimension) from to , were generated for the tests. They were filled by randomly generated 32-bit integer operands ranging in value from 0 to 9 (int in C++). A dataset was run three hundred times in each case, of which the first twenty were ignored to bypass the initial thermal state of the system and start from a consistent point. The remaining runs were enough to obtain a reliable average.
3.3. Executable Files
The algorithm codes, [
10,
11] for the Coppersmith–Winograd-based D2.4, were reimplemented in C++ to fit the experimental framework. Executables were produced by the GCC 64-bit compiler. Optimizations were disabled to minimize the role of compilation in shaping the code. With no optimization, the code was expected to be more faithful to the original algorithms. This measure was crucial for being able to argue about the underlying method. In addition, we specified in the code the affinity of the executables to processor core number 0 to avoid context-switching overheads when sampling the CPU sensors. In particular, the thread and the process were explicitly specified to run on core 0 only.
3.4. Profiling Tools
The Linux perf profiler was used to obtain the measurements. It is available from the kernel as a command. The powerful tool was developed to reliably read the CPU sensors based on the RAPL interface by Intel. It was configured to automatically run the executables from designated folders and systematically record the readings from the CPU.
4. Results and Discussion
Loading input datasets and reading sensor data while running the algorithm’s code will consume some power that adds to the measurements. Those unwelcome additions, considered noise in this research, must be eliminated. To remove that noise, we configured the profiling tool to read sensor data right after running the executables. Furthermore, datasets were integrated directly into the executables to avoid the overheads associated with the loads. These simple measures resulted in measurements that better reflected the code.
Table 2 presents the main results. They show the averages of three hundred executions for each set size. Randomized datasets ensured that the results were unaffected by anomalies of a set. A quick look reveals that there were no significant differences in energy or power consumption for very small matrix sizes. At those sizes, all methods would have very close runtimes. Time is the main factor affecting energy consumption in general, which seemed to be the case there. In addition, the readings at dimension 50 seemed off. Runtime at that point was very short and likely the most distorted by environmental factors. It may be ignored as an outlier.
The power consumption readings were the most interesting in this investigation for applications where the energy concern was not confined to total consumption. In mobile and exascale applications, the rate of energy expenditure is also a concern but for different reasons. For example, how quickly batteries drain is critical for mobiles. Optimizing for low power can allow making smaller and hence lighter, more practical batteries.
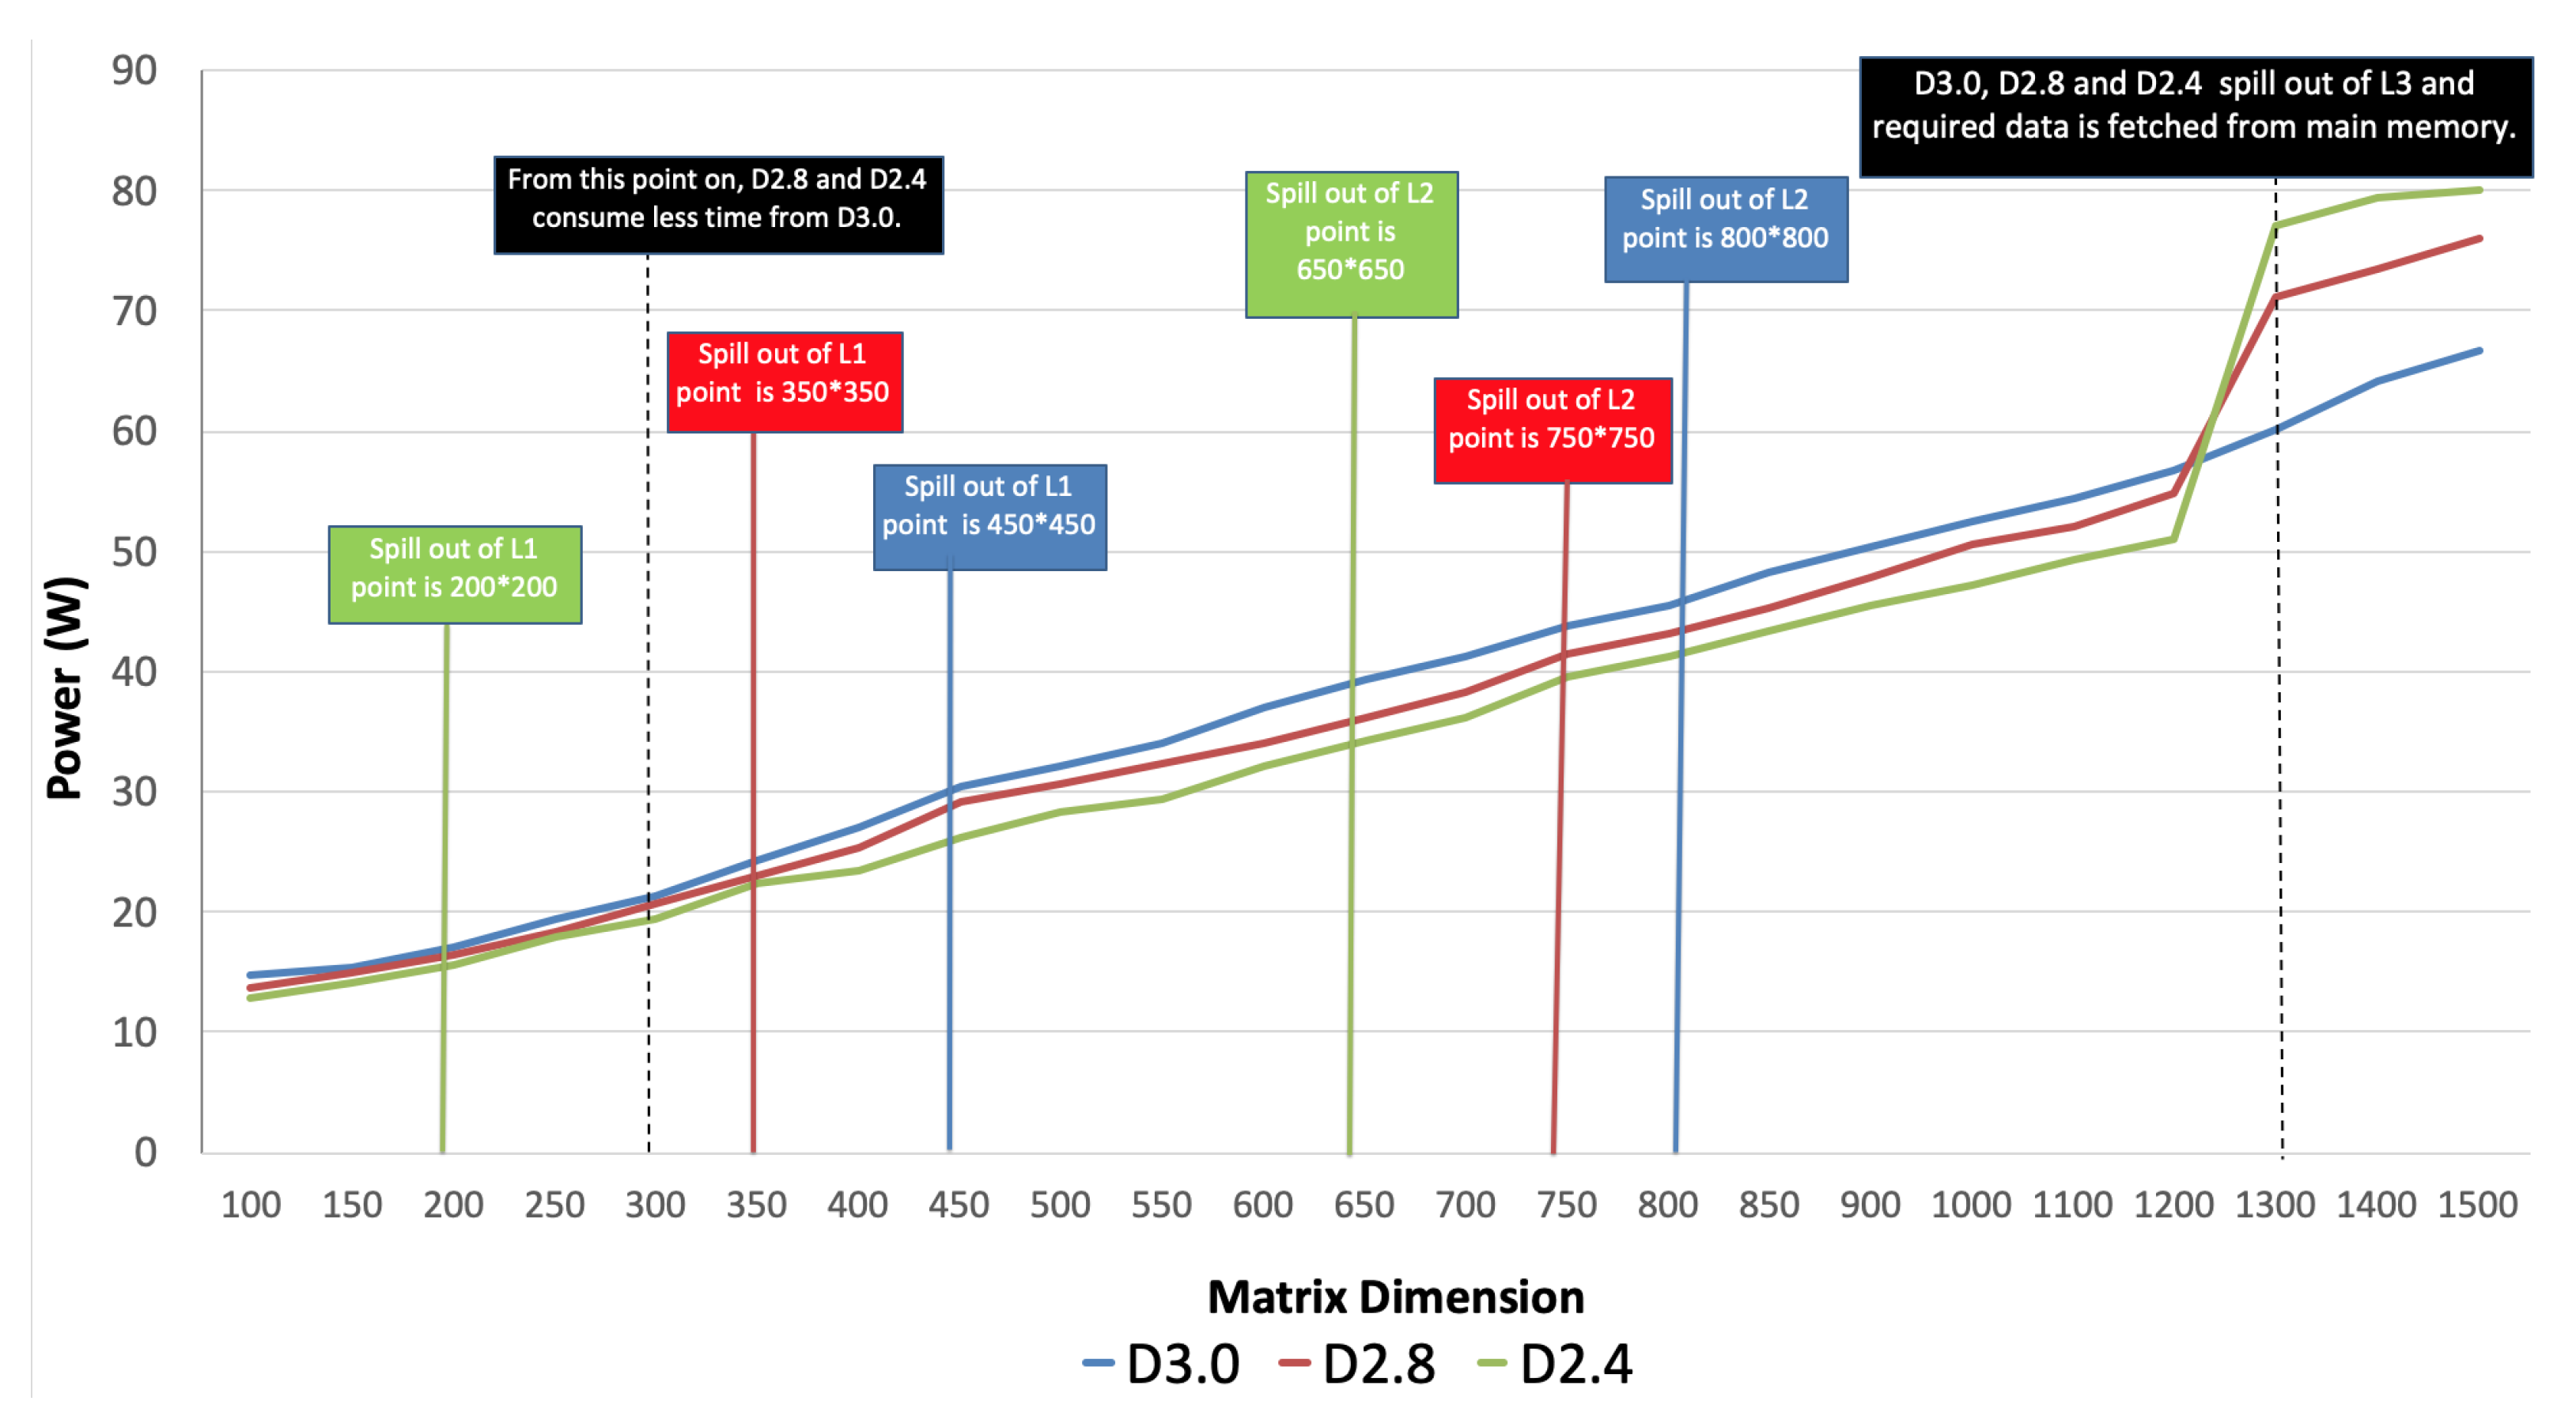
Figure 2 tracks the power consumption that results from using the three methods under investigation as the computations move in the upper memory hierarchy. For sizes that fit in the cache memory regardless of the level, both the divide-and-conquer versions outperformed D3.0, with the more time-efficient one, D2.4, being consistently better. It consumed up to 14% and 10% less power than D3.0 and D2.8, respectively, or a respectable average of 11% and 6%. At its best, D2.4 showed an average savings 4.817 W at dimensions 500–1200 (relative to D3.0). The trend reversed as D2.4, D2.8, and D3.0 progressively, in that order, moved to the main memory for larger matrix sizes. All cases were estimated to be out of the L3 cache by matrix dimension 1300, with D2.4 and D2.8 exiting sooner due to their cached recursion stacks. Power consumption increased in all cases, as expected. However, D3.0 not only consumed less power but continued to rise steadily, seemingly unaffected by the move out of the cache. It is worth noting that the high-performance CPU circa 2014 managed to hold fully in the cache computations of matrix dimensions 1200–1300, composed of 32-bit elements. It was also astonishing how much power was consumed at relatively moderate multiplication workloads, as much as a household lightbulb.
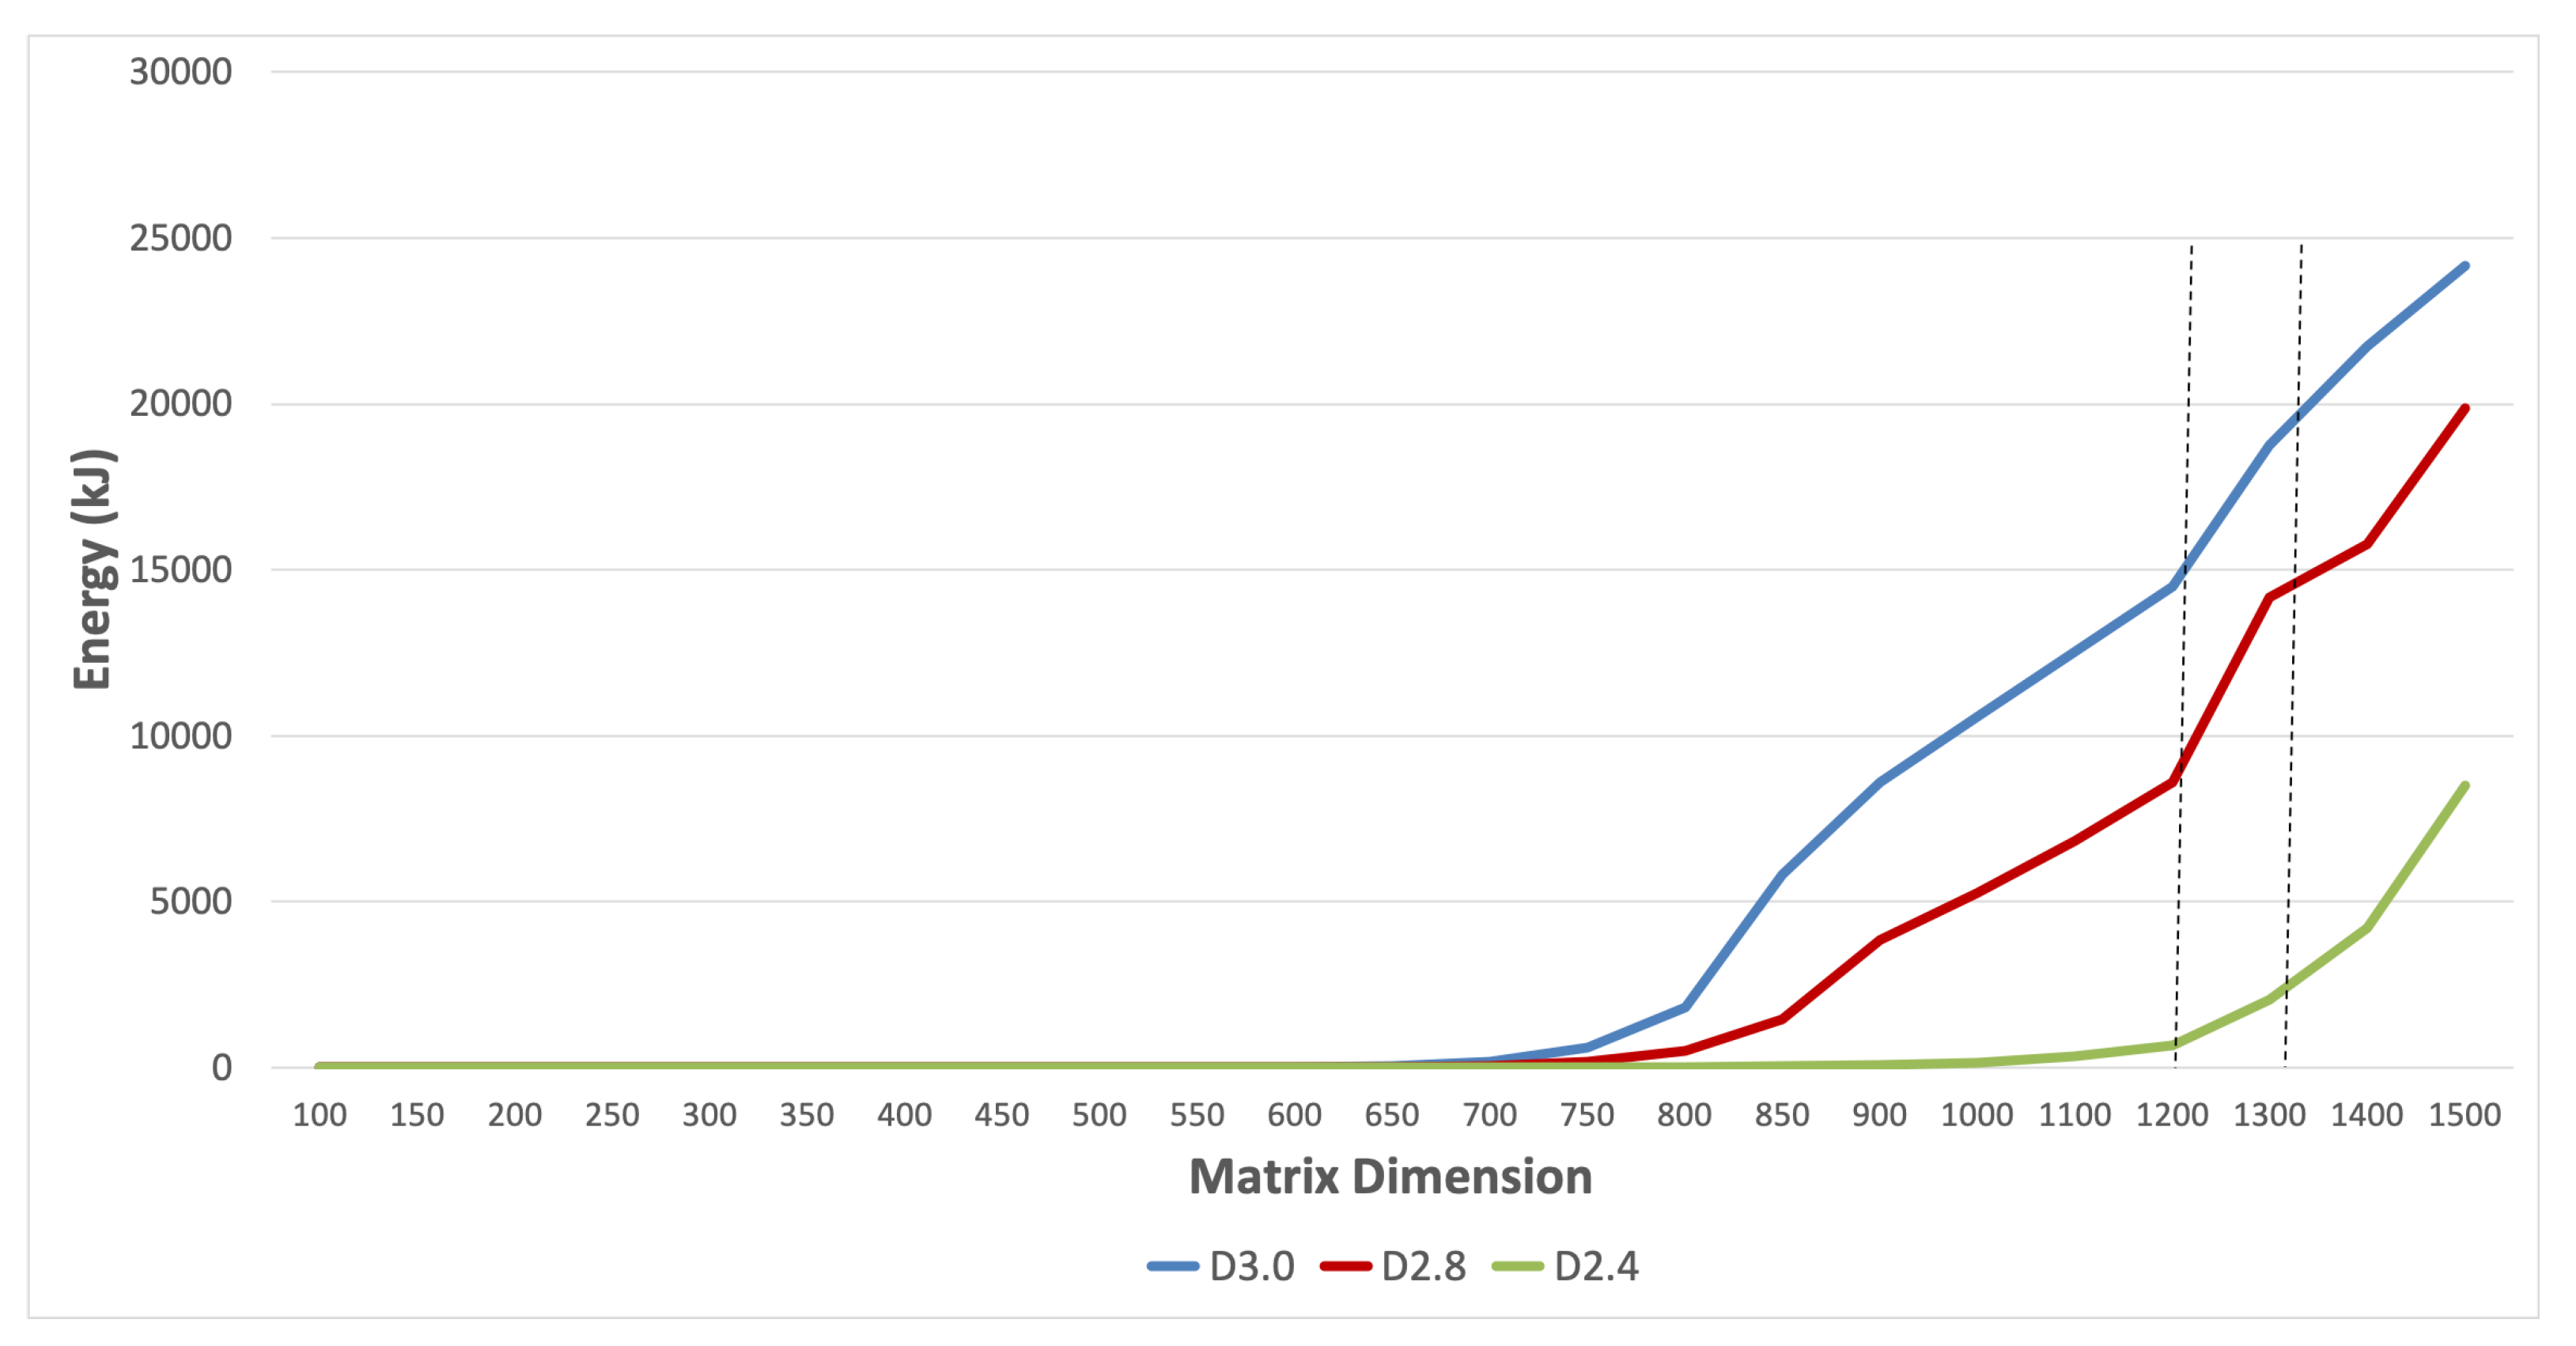
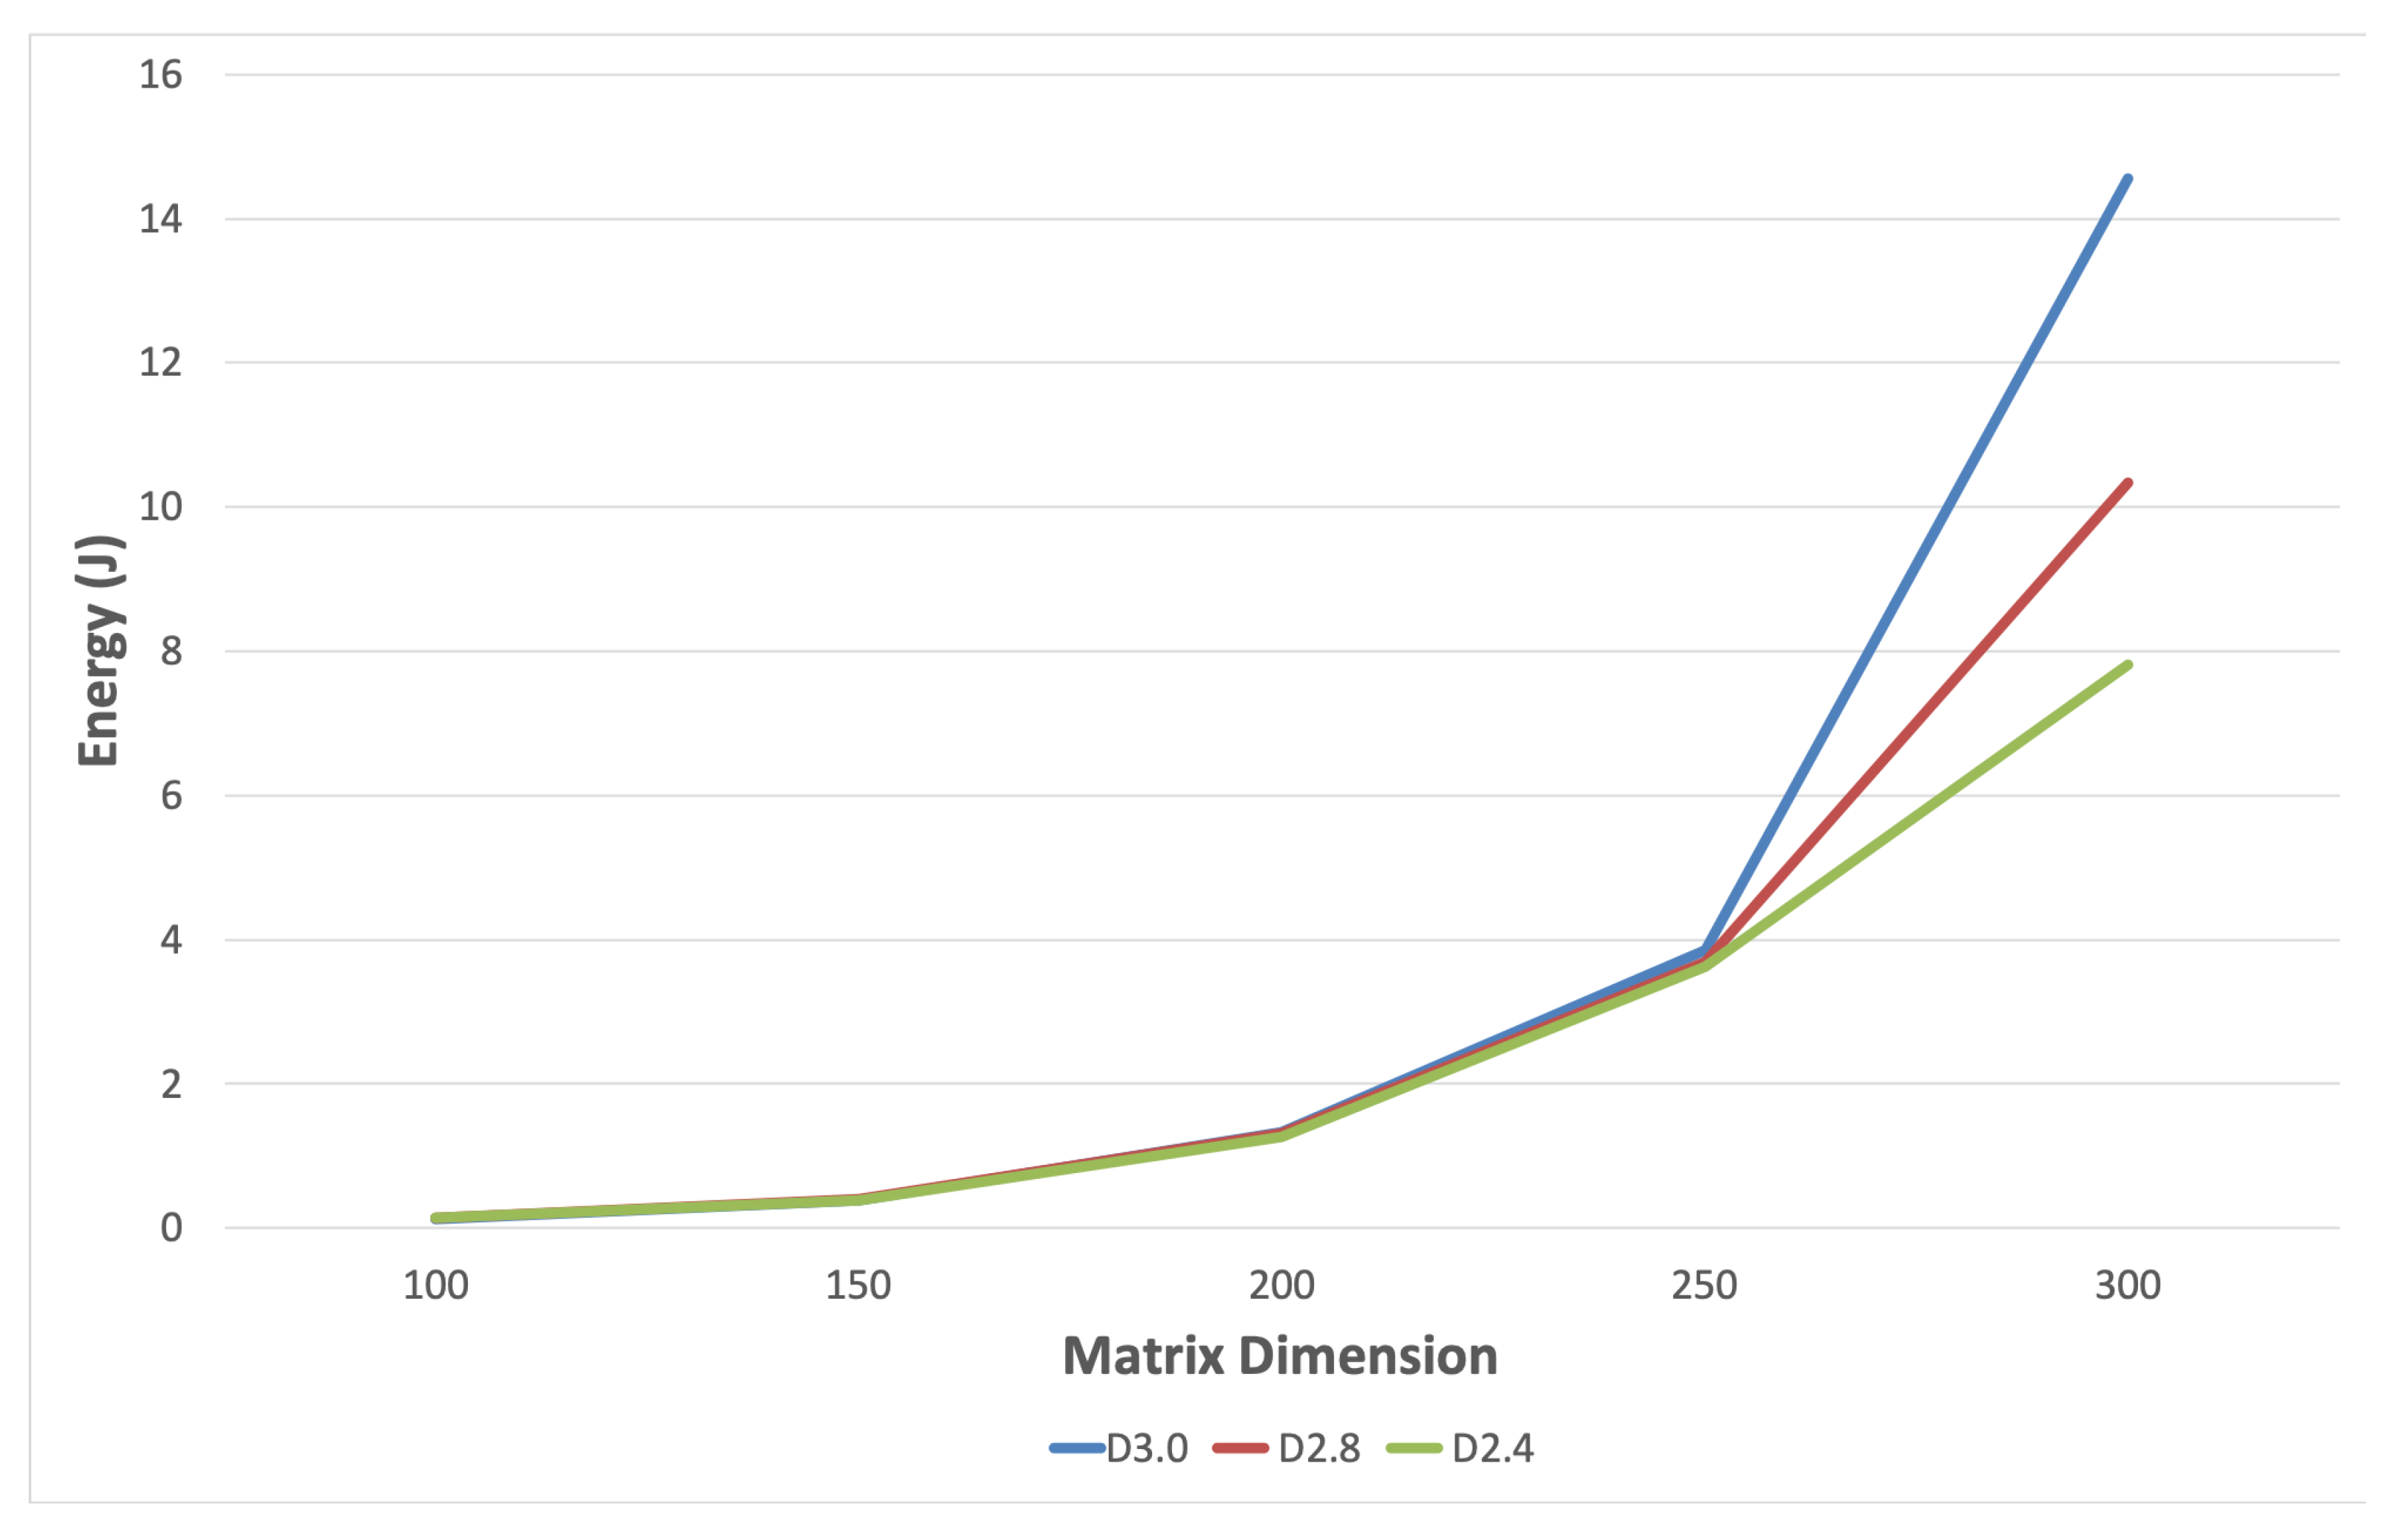
Figure 3 tracks the total energy used at each matrix dimension. It shows that D2.4 consumed much less energy than the computations based on the other two algorithms. The differences were drastic, averaging 73% and 65% better than D3.0 and D2.8, respectively. A closer look in
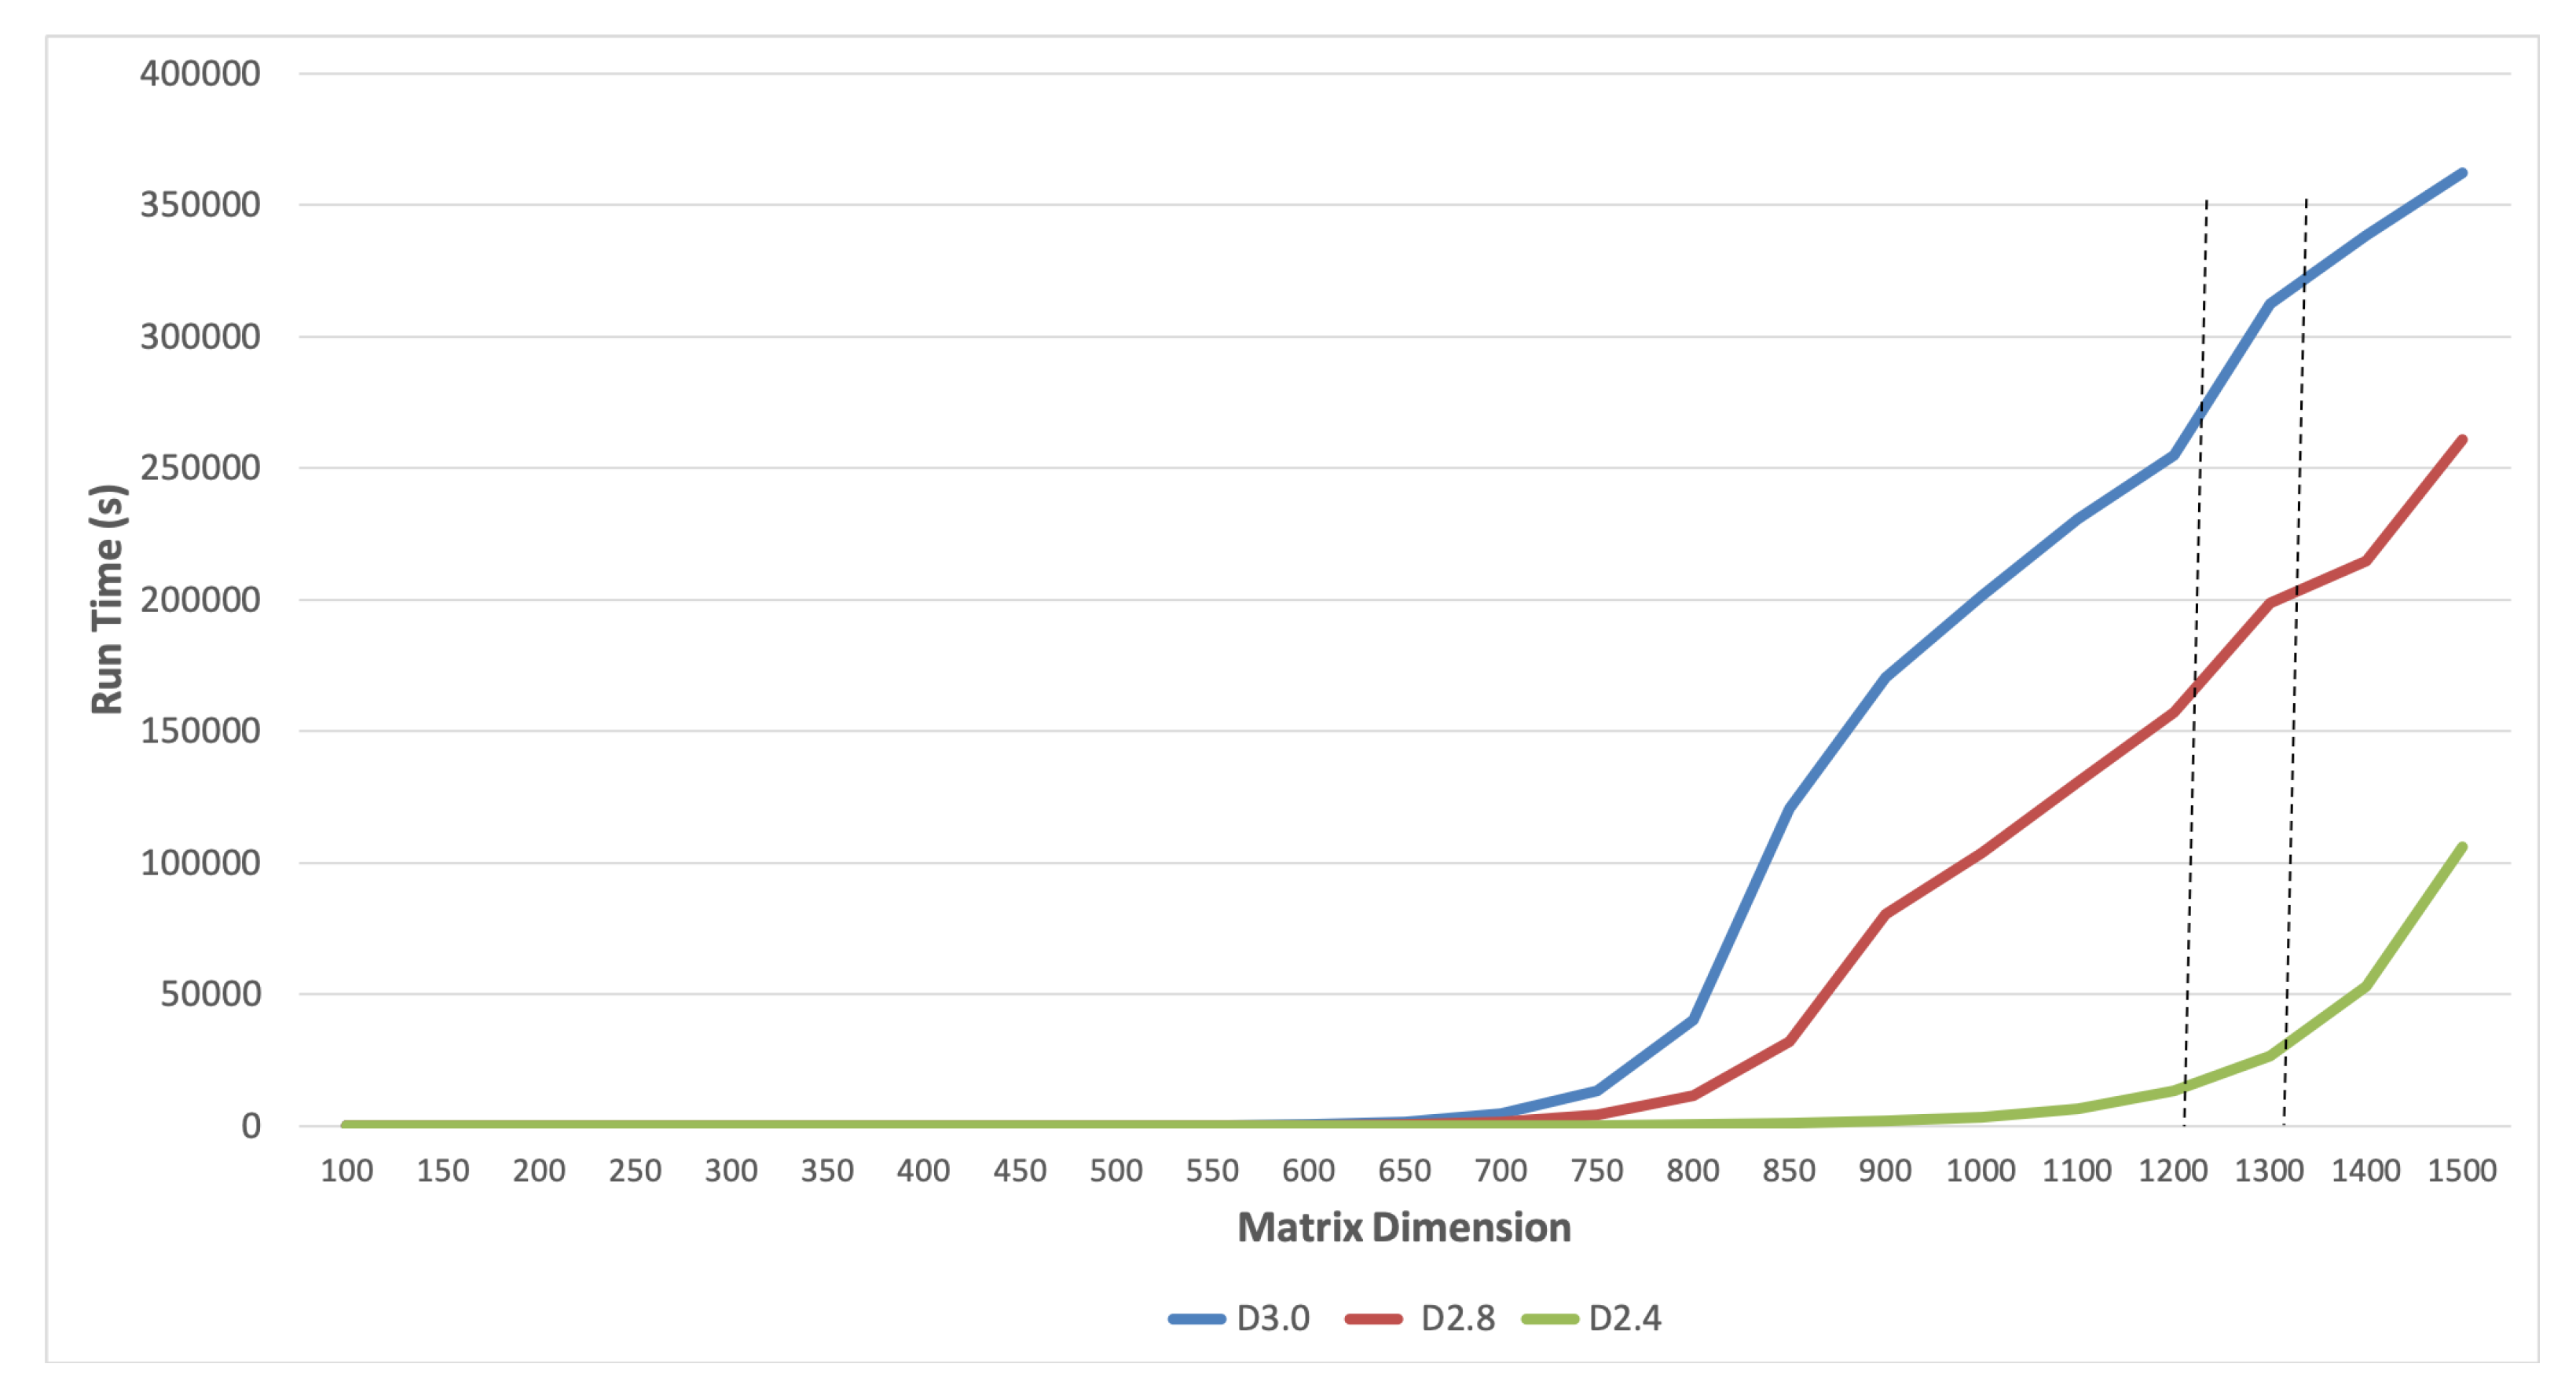
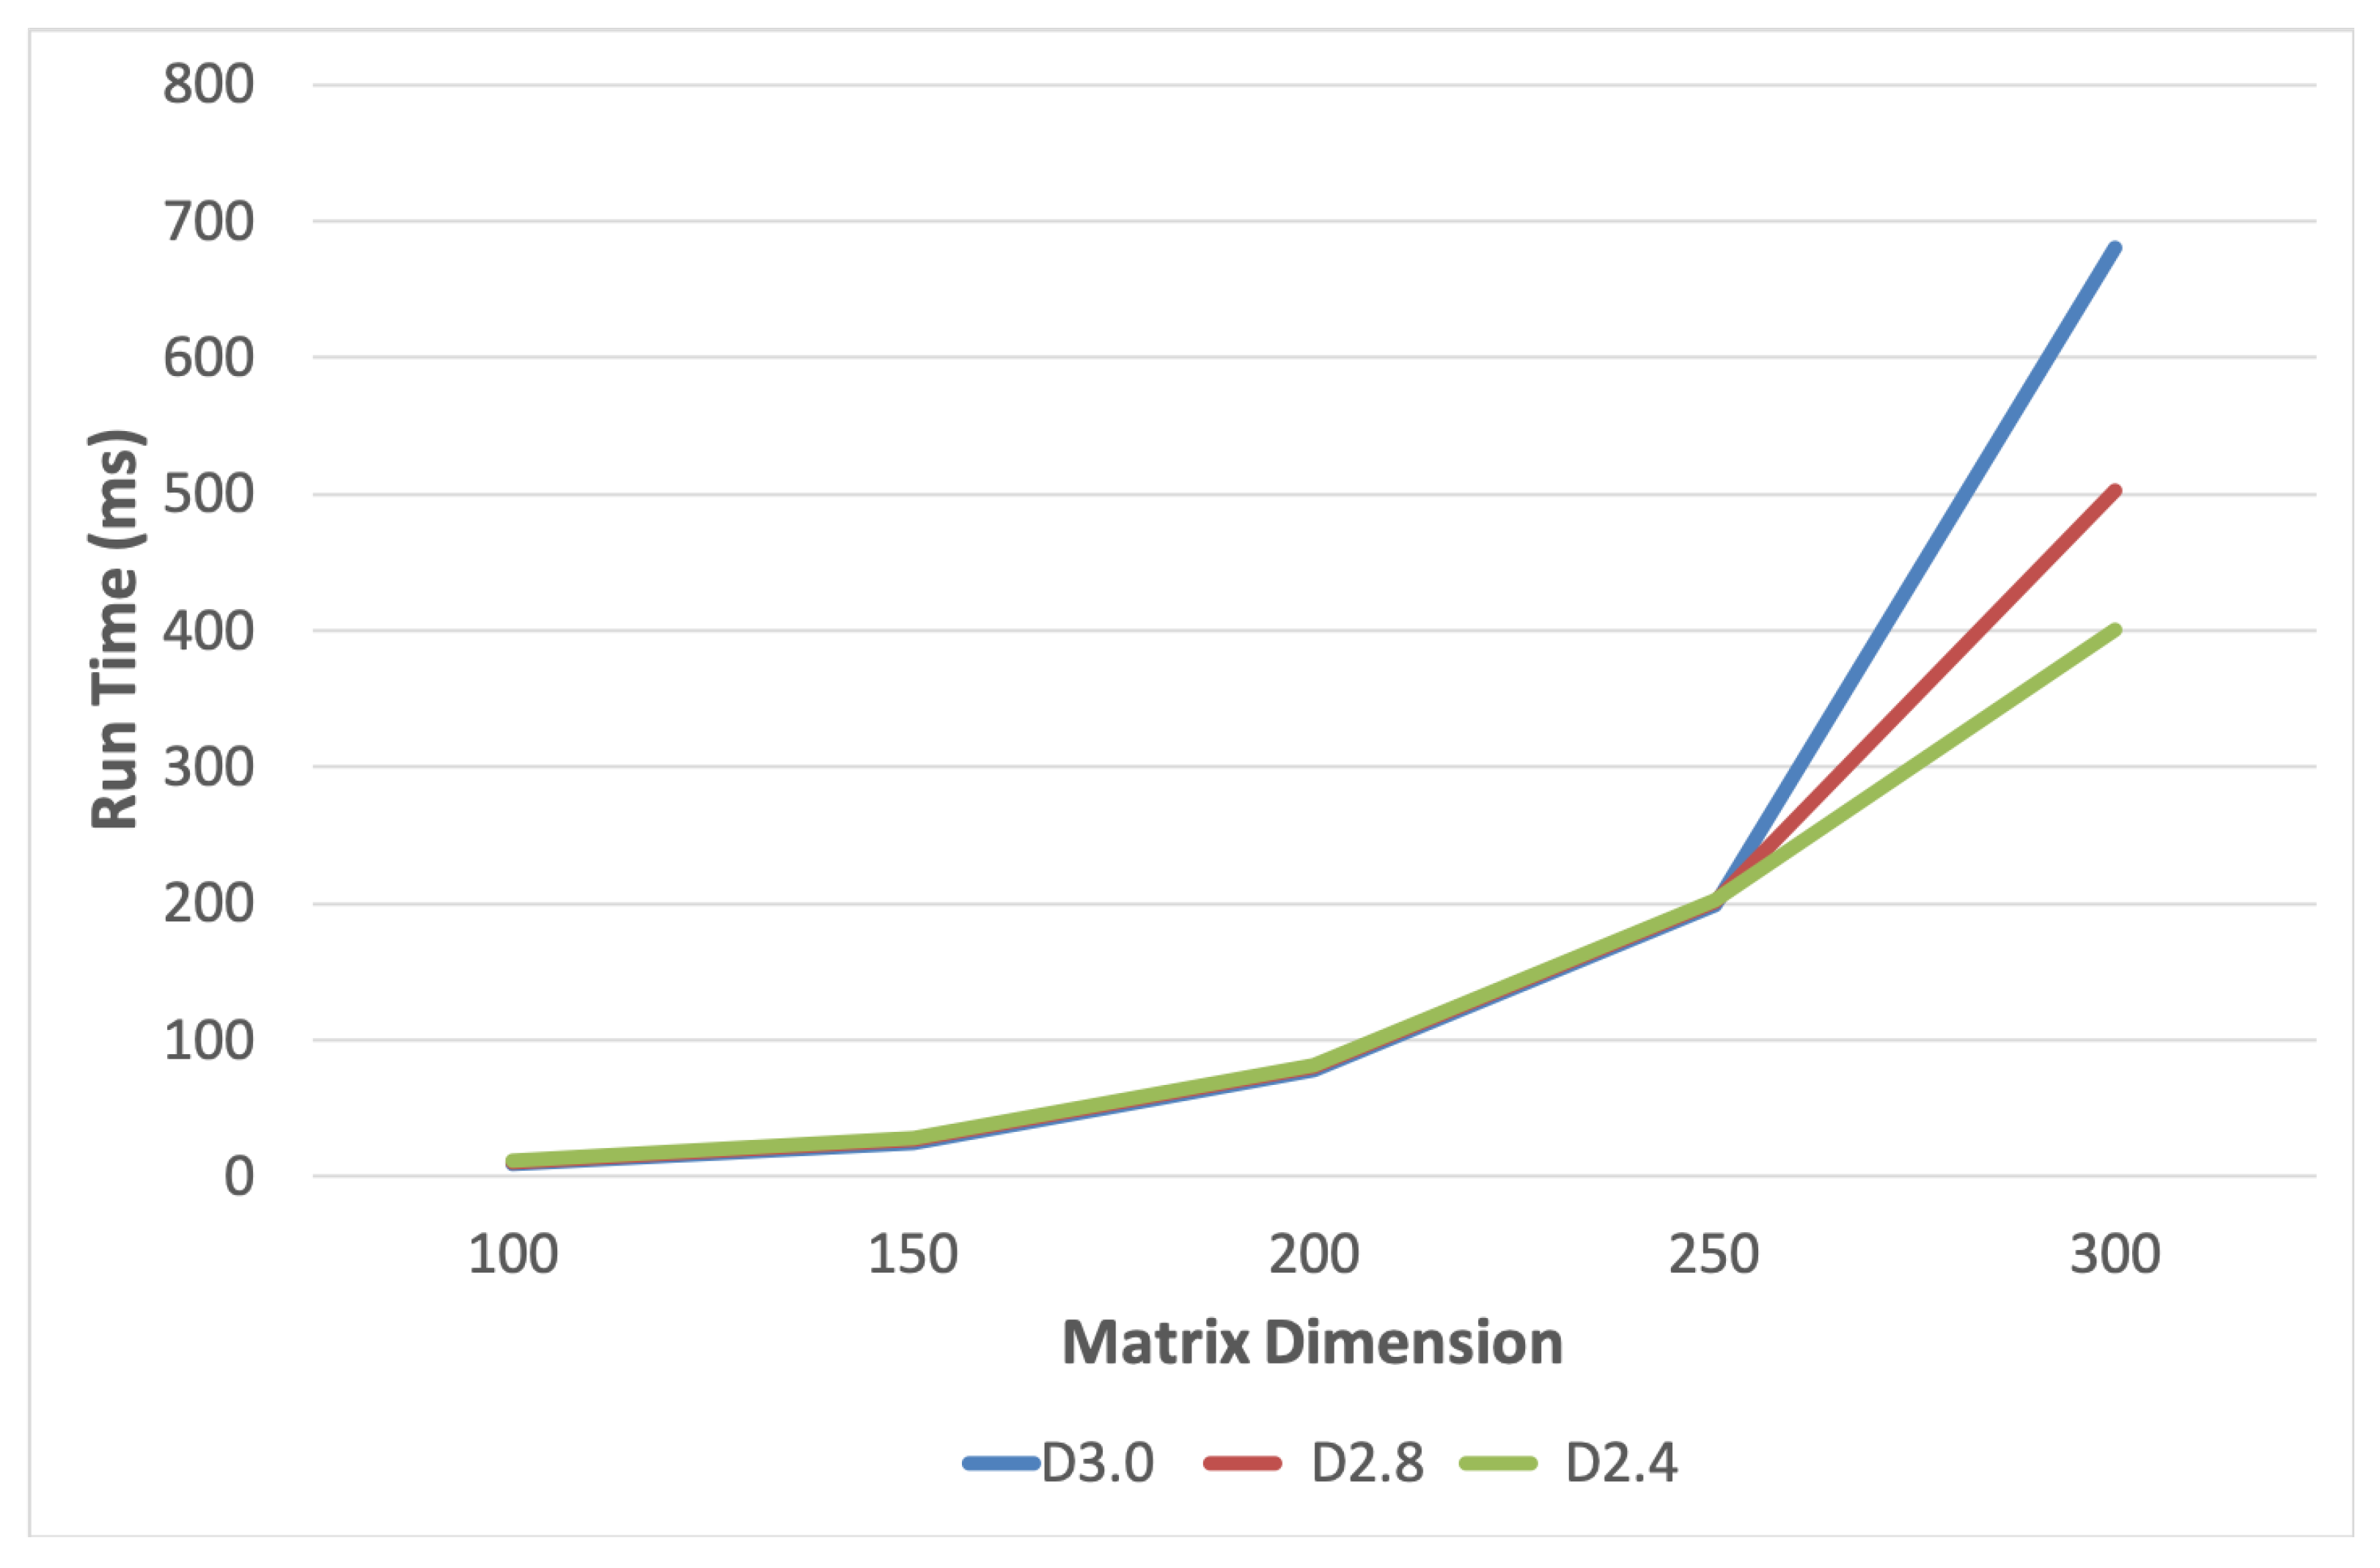
Figure 4 reveals that the trend started early at matrix dimension 250. Both of the computations based on divide-and-conquer were decisively more energy-efficient. It is interesting to point out that energy consumption closely followed the runtime trend (see
Figure 5), suggesting a close complexity behavior in each case. A closer look at run times (see
Figure 6) confirms that the energy trend of D2.4 indeed started at matrix dimension 250. The figure seems to indicate that time efficiency had more influence on the overall energy consumption than being in the cache or the main memory. The transition to the main memory seemed smooth in all cases.
4.1. Miss Rate Analysis
Cache misses were expected to be the principal influence on power and energy characteristics. Thus, cache miss data were obtained to see the effects on power and energy usage. Moreover, the information helped track the computations across the various cache levels through to the main memory. The miss data could also help infer cache level and main memory boundaries.
Table 3 shows the numbers of cache miss events reported by the internal counters in the CPU. We remind the reader that the matrix elements and stack frames, in the case of D2.4 and D2.8, were retained in the same cache. Therefore, the different algorithms should be expected to cause their computations to spill to the following level of the storage hierarchy at different matrix dimensions.
In particular,
Table 3 gives cache misses averaged over multiple runs for each algorithm in each cache level. By carefully noting where the misses suddenly spike, estimating cache and main memory boundaries is possible. According to our analysis, the D3.0 spill point out of L1 was 200, L2 was 650, and L3 was 1300. D2.8 spilled out of L1 a bit earlier at dimensions 350, L2 at 750, and L3 at 1300. For D2.4, the points were L1 at dimensions 450, L2 at 800, and L3 at 1300. By matrix dimension 1300, all three were accessing the main memory. The estimated level boundaries on
Figure 2 were made based on the previous analysis.
Hence, D2.4 had the power advantage when the computation was in the on-chip memory. The trend shifted in favor of D3.0 when accessing the off-chip memory (DRAM) at matrix dimension 1300. Only the expensive misses from the L3, which are satisfied from data kept in the main memory, had an impact on the power advantage, strongly indicating the DRAM effect.
Moreover, a closer inspection of the miss data table reveals that in the matrix dimensions from the smallest up to 1200, D3.0 displayed the sharpest increase in the cache miss rate, which could account for why it consumed the most power while there. Conversely, D2.4 had the lowest increase in the cache miss rate, which likely accounted for the lowest power consumption within the various cache levels. After the inflection point, the D3.0 algorithm, which had the highest power consumption when matrix dimensions were small, now has the lowest consumption because it had a lower increase in the cache miss rate. D2.4 had the most power consumption because it showed the highest rise in the cache miss rate. D2.8 sat in between the other two.
4.2. Main Memory Trends
The columns in
Table 3 listing misses in the third level of the cache are the most relevant to behaviors related to the main memory. A high increase in misses is noted just before dimension 1300 in D2.4 and D2.8, compared with D3.0, signaling an early spill to DRAM. Subsequently, the earlier trend of power efficiency in the cache reversed in the main memory. Miss data suggest that 1300 was when D3.0 spilled. That shift associated with the off-chip memory (DRAM) access should not be surprising. According to the literature [
16], access to off-chip memory had a substantial impact on power consumption, more than on-chip memory. The divide-and-conquer access memory was heavier due to recursion overheads.
Hence, from matrix dimension 1300 onward, D3.0 commanded a significant edge in power draw over the time-optimized algorithms D2.4 and D2.8. The overall energy consumption, however, was significantly lower for the divide-and-conquer algorithms, signaling the clear advantage gained from their significant time efficiency and reflecting substantially lower runtimes. It was lower still in D2.4, which was the most aggressively time-efficient, suggesting that time efficiency is the dominant factor. From an energy budget viewpoint, D2.4 and D2.8 were the top performers. However, from a power draw perspective, D3.0 is more appealing.
4.3. Algorithm Behavior
The Strassen method and similar divide-and-conquer algorithms for matrix multiplication have significantly better time complexity than a definition-based one. They function as follows: a matrix is recursively broken into smaller submatrices and combined in specific ways to construct a product. The process takes
more memory for the bigger stack space [
10], which is worse than a simpler nonrecursive D3.0. Generally, divide-and-conquer may be considered more efficient for small matrix sizes because it is faster, and the space overhead may be neglected. However, they are not space efficient for large matrices. Power and energy consumption depend on hardware usage. Hence, from a viewpoint based on hardware usage, divide-and-conquer may not necessarily be regarded as more efficient than D3.0 algorithms, especially for large datasets [
31,
33]. On the other hand, less runtime should lead to less energy consumption if the power draw (rate) is the same.
The results confirm the memory overhead of D2.8 and D2.4 as computations spill out of lower caches sooner than D.3.0. They show no significant differences for trivially small sizes that fit in the L1 cache. However, the faster D2.4 consumes considerably less energy, all the way through the DRAM.
Figure 2 suggests that at least while in the cache, there is more than just lower runtimes behind the energy trend. D2.4 consistently drew less power despite needing more memory to complete, suggesting a more efficient use of the memory. Since the power overheads of the SRAM-based cache are generally similar and may be assumed to be relatively small, efficiency may be attributed to usage patterns that depend on how the computation was systemized. It is not entirely clear if the trend reversal in DRAM was due to nuances of the computations or solely due to the transition to reliance on DRAM.
According to [
34], enlarging the cache size reduces those misses due to capacity. Therefore, power consumption should be less, and exit from cache memory would occur later. However, the trend of faster times and increased memory usage would remain the same. Results generally confirm this but also show that the trends are not solely dependent on being in the cache.
5. Conclusions
This study investigated a potential advantage that may be traced back to an algorithm for basic computation in terms of its overall energy cost and how quickly it spends that budget (power being the consumption time rate). The study compared two high-performance matrix multiplication algorithms (D2.8, D2.4) to a definition-based one (D3.0) as a baseline on an HPC-class platform. Misses in each cache level were studied to discern effects on consumption patterns and to examine their impact.
The main finding was an average 11% and 6% power advantage for D2.4 over D3.0 and D2.8, respectively, when the computation was generally within the boundaries of on-chip (SRAM) caches. It shifted just before all the cases spilled out to the off-chip memory (DRAM), where D3.0 gained the advantage. Total energy consumption mainly followed the runtime and seemed unaffected by the memory hierarchy. The most time-efficient, D2.4, used drastically less energy, even in DRAM, where its power consumption (the rate) was the highest. Therefore, it was significant that the power trend reversal happened in the L3 cache. An effect of the shift to DRAM was evident, but there was a suggestion of a computation-related influence. This remains, however, inconclusive based on this one investigation.
In summary, for large matrix sizes relative to the cache configuration, a D3.0 algorithm could be interesting when the main concern is power, not time. However, D2.4 should be interesting when both power and total energy are the primary concern, particularly for computations that could fit in the caches. In the authors’ opinion, the power-energy performance more than makes up for the functional complexity of the algorithm, even when compared to basic divide-and-conquer. Optimizing locality has been long known to result in better execution times. Optimizing the locality should also reduce power consumption, which our findings seem to support. There was no suggestion in this preliminary investigation of good opportunities to trade time for power savings, such as those reported for sorting and searching scenarios [
2,
4]. Although one could argue for trading runtime for low power by switching to D3.0 in DRAM, the time and total energy costs were too terrible to justify. In this study, there was no interplay between power and time on comparable energy budgets as in those studies. There is evidence to suggest that a larger cache was better for matrix multiplication in terms of power consumption. This could be a crucial design factor for high-performance processors routinely including that computation in their workloads. Finally, the study further highlights the importance of looking at power separately from energy in some cases. Some results may be of interest to mobile devices and exascale systems, where the power in watts (energy draw rate) is crucial. Exascale computing would also benefit from cumulative savings in their massive workloads, especially when the multiplication could fit in the caches and it is a significant fraction of the general workload (as much as 4.8 W average savings were measured for dimensions 500–1200).
The findings from this study should encourage looking into more algorithms, including those previously underutilized due to their time performance or complexity. It could lead to a finer understanding of the factors that affect their energy and power performance or uncover patterns that could help design new ones. Results from different hardware are needed to make a case for an algorithmic power advantage that should be demonstrable independently of hardware or at least for hardware in the same architectural class, particularly investigation of a more modern HPC-class processor platform. It would also be interesting to examine how each algorithm used the memory to understand and optimize the power behavior, perhaps by boosting locality. Future research may also devise a better experimental setup with a minimal system load to eliminate even more sources that contaminate measurements and amplify the signature of code implementing an algorithm. Further investigations along those lines may reveal natural algorithmic power efficiency, i.e., originating in the method.


