Essay

Research on Algorithm for Improving Infrared Image Defect Segmentation of Power Equipment

Department of Electronics and Information Engineering, Shanghai University of Electric Power, Shanghai 201306, China
*
Author to whom correspondence should be addressed.
Electronics 2023, 12(7), 1588; https://doi.org/10.3390/electronics12071588
Submission received: 22 February 2023 / Revised: 22 March 2023 / Accepted: 27 March 2023 / Published: 28 March 2023
(This article belongs to the Special Issue Image Segmentation)

Abstract

:
The existing infrared image processing technology mainly relies on the traditional segmentation algorithm, which is not only inefficient, but also has problems such as blurred edges, poor segmentation accuracy, and insufficient extraction of key power equipment features for the infrared image defect segmentation of power equipment. A CS_DeeplabV3+ network for the accurate segmentation of the infrared image defect segmentation of power equipment is designed for the situation of leakage and false detection after segmentation by traditional algorithms. The ASPP module is improved in the encoder part to enable the network to obtain a denser pixel sampling, an improved attention mechanism is introduced to enhance the sensitivity and accuracy of the network for feature extraction, and a semantic segmentation feature enhancement module—the structured feature enhancement module (SFEM)—is introduced in the decoder part to enhance the feature processing to improve the segmentation accuracy. The CS_DeeplabV3+ network is validated using the dataset, and the experimental comparison proves that the improved model has finer contours compared with other models for segmenting infrared images of power equipment defects, and MPA is improved by 5.6% and MIOU is improved by 7.3% compared with the DeeplabV3+ network.

1. Introduction

Power grid construction has always been a very important basic industry in economic and social development. With the development of a socialist market economy, the power system is gradually developing to meet the technical requirements of a large capacity and UHV. Therefore, it also sets high technical requirements for equipment safety and equipment operation and maintenance efficiency. Infrared thermal imaging technology [1], with the advantages of having no contact, no shutdown, high efficiency, high sensitivity, and more safety, is one of the main methods for the safety monitoring of electrical equipment. It has effectively enhanced the safety of electrical equipment to a great extent. Due to the differences in the nature and location of the electrical equipment and the severity of the fault, the distribution of the surface temperature of the equipment is also different [2]. By analyzing the surface temperature of electrical equipment, it is possible to find the location of potential faults and accidents in the equipment [3] and determine the severity level. However, due to eye fatigue and the low efficiency of manual marking caused by the heavy workload of the large number of images taken by artificial and unmanned aircraft, it is easy to result in missing and mismarking the potential faults [4].
However, the infrared probe receives infrared radiation from the detected target, but is also affected by a large amount of infrared radiation information from the undetected target. Therefore, the acquired infrared image will inevitably have noise, low contrast, blurred edges, etc. [5], for which we need to enhance and divide the infrared image of power equipment. After reducing the noise of the image, the noise can be effectively reduced and the sharpness of the image can be improved, so that the maintenance personnel can judge the equipment failure [6,7]. Through image contrast enhancement processing, the brightness of the image increases and the visual effect of the image improves. In some special cases where humans cannot participate (e.g., high-pressure, or high-temperature), an intelligent system is required to automatically monitor the operation of the equipment [8]. Defect segmentation is performed on infrared images of power equipment because segmentation is the basis for identification. By segmenting the image, we can see specific parts of the equipment where high temperatures occur. This facilitates the technical personnel to judge the running condition of the equipment in time, thereby improving the accuracy of the technical personnel in judging the equipment faults [9].
With the recent development of deep learning, the convolutional neural network (CNN) has achieved very good performance in image segmentation and classification, and is widely used in various fields. For example, Liu et al. combined neural networks and wind speed short-term forecasting. A hybrid wind speed series forecasting model that is made up of the EWT method, three kinds of deep neural networks, and the Q-learning method is proposed; this new network improves the accuracy of short-term wind speed forecasts [10]. Shao et al. combined neural networks and traffic forecasting; they proposed a novel dynamic spatial–temporal adjacent graph convolutional network (DSTAGCN) for traffic forecasting. This network allows for faster convergence and more accurate predictions [11]. Image segmentation is mainly divided into instance segmentation and semantic segmentation; the instance segmentation of power equipment uses the color and texture information of the equipment to segment the whole equipment and provide the base image for subsequent equipment fault diagnosis. Qi et al. proposed a new method for infrared image segmentation based on the multi-information fusion fuzzy clustering method. The method segments the complete power plant by constructing a joint domain of the fuzzy clustering field (FCF) and Markov random field (MRF) [12]. Shu et al. combined multispectral feature extraction, feature fusion module (MARFN), and instance segmentation (SOLOv2) to design a SOLOv2-based multispectral instance segmentation (MSIS) to achieve the multispectral instance segmentation of power equipment [13]. Long et al. (2015) proposed a semantic segmentation model based on a full convolution network (FCN) [14], in which the full connection layer is replaced by the convolution layer. After sampling to the original image size, you can learn the label of each pixel in the image, and you can make intensive inferences. However, FCN does not take into account the relationship between pixels during sampling and may lose a lot of information. Badrinarayanan et al. (2015) proposed a Seg Net network with an encoder–decoder architecture [15]. The encoder gradually reduces the size of the input signature map through the pooling layer; the decoder is symmetrical with the encoder, and gradually recovers the image details and feature map size through upsampling. Ronneberger et al. (2015) proposed the U-Net [16] network, which combines the information extracted by the feature extraction layer to restore the original image during the upsampling process. Rubén et al. used U-Net and YOLOv5 for the automated detection of metal surface defects, improving detection accuracy and reducing computational costs [17].
However, none of the above networks make use of the spatial background of the image, which is why many details cannot be handled well. Chen et al. (2015) proposed DeepLab [18,19], which represents a deep CNN structure that uses the hole convolution and spatial pyramid pool (ASPP) modules to expand the perceptual field of the network and introduce a larger context. Finally, the split result is smoothed through the full joint CRF. However, ASPP may lead to the loss of local information, and convolution may result in the loss of position information for some pixels, resulting in inaccurate segmentation. Therefore, Chen et al. (2018) proposed the DeepLabV3+ network, which improves DeepLab by using an encoder–decoder structure, refines the segmentation of edge targets, and achieves a better segmentation effect than the DeepLabV3 network, but still has limitations, such as the easy loss of local information and inaccurate segmentation of small objects, etc.
Although the semantic segmentation method described above has high accuracy, it is not ideal in terms of speed. At the same time, when the obtained complex infrared image is divided, there will be problems such as blurred edges and poor accuracy [20,21,22]. This paper firstly uses DeeplabV3+ with a lighter structure and higher segmentation precision as the basic structure of the network, then improves ASPP and attracts attention and the SFEM model to improve the sensitivity to non-power equipment areas in the image, and is more targeted to obtain target characteristics. The flow chart of the algorithm in this paper is shown in Figure 1.

2. Countermeasure Datasets for Learning Attack Strategies

LAS-AT networks improve the stability of the model by introducing “learnable attack strategies” [23]. The network is mainly composed of a target network that is trained to improve stability using adversarial datasets and a policy network, which generates attack strategies to control the generation of adversarial datasets. The target network is a convolutional neural network for image classification with the formula as shown in (1):
y ^ = f w ( x )
where  y ^  represents the estimation label, x represents an input image, and  w  represents the parameters of the neural network.
The policy network takes the dataset as the input and the policy as the output. The parameters of the policy network are updated step by step, and different policies are given at different stages of the dataset training, depending on the target network stability, given the same inputs.
The two networks are in a competitive relationship. For the strategy network, under the premise of giving a clean image, the strategy network can generate a corresponding attack strategy for the dataset, and for the target network, the counter sample generator will generate a counter sample according to the attack strategy and the target network to train the target network. At the same time, the target network will also give a monitoring signal to the adversary sample generator and the strategy network. The process formula for generating the adversarial dataset by the adversarial sample generator is shown in Equation (2):
x a d v : = x + δ g ( x , a , w )
where x represents a clean sample and   x a d v   represents its corresponding counter sample, a is an attack strategy, w indicates the parameters of the target network, and  g ( )  indicates a PGD attack.
The standard countermeasure strategy is based on the artificial attack strategy to solve the problem of internal optimization, and the policy network of the model is learnable. It generates a dataset dependency strategy based on the conditional probability distribution  p ( α x ; θ ) . The policy network formula is shown in Equation (3):
m i n w E ( x , y ) D ( m a x θ E a p ( a x ; θ ) ( f w ( x a d v ) , y ) )
Because there is a competitive relationship between the target network and the policy network, that is, the same loss function of minimize and maximize, the target network learns to adjust parameters to resist the countermeasure samples generated by the countermeasure attack strategy, while the strategy network improves the attack strategy according to the sample of the given attack target network. Combining this network with the SRGAN image enhancement network improves the stability of the network. The infrared image acquired over the network is shown in Figure 2.

3. CS_DeeplabV3+ Model

3.1. Deeplab V3+ Model

DeepLabV3+ is a semantic segmentation model with good comprehensive performance developed by Google. It is mainly an encoder–decoder structure. The encoder part consists of the backbone network MobilenetV2 [24] and the ASPP module. The traditional DeepLabV3+ backbone network Xception [25] is not ideal for feature extraction and speed control, so it is replaced by the lightweight network MobilenetV2 with a better feature extraction effect, higher accuracy, and smaller model, which is suitable for the real-time requirements of the infrared image recognition of power equipment.

3.2. CS_DeeplabV3+Model

The original network of DeepLabV3+ is used to train various power equipment and background, but its segmentation accuracy is low and the effect is average. The improved network model proposed in this paper is shown in Figure 3.
In the encoder section of Figure 3, the ASPP module of the DeepLabv 3+ network is improved by the dense connectivity, as shown in the dotted wireframe in Figure 2. The original ASPP module operates in parallel and each branch does not share any information. The improved ASPP adds a sequence structure to the original three parallel convolutions. The output of the smaller expansion rate convolution is connected to the output of the backbone network, and then sends it to the convolution at the larger expansion rate for better feature extraction and information sharing through layered jump connections. After the ASPP module is densely connected, more pixels can be used in the calculation, and the expansion rate gradually increases. The higher rate layer uses the output of the lower rate layer as its input, which makes the pixel sampling denser, improves the utilization rate of pixels, and enhances the ability of network feature extraction. The processed high-dimensional feature graph and low-dimensional feature graph are processed by the improved CBAM, and the resulting feature graph is used as the input of a decoder.
In the improved DeepLabv 3+ architecture, the SFEM module is introduced into the decoder to further extract the input features, and the obtained feature map is sampled four times. The obtained feature map is fused with the improved low-level feature map processed by the CBAM network, and the features are refined by convolving and upsampling, and restored to the original image size, and finally a predictive segmentation map is obtained.

3.3. Improving Attention Mechanism Module

The original CBAM [26,27] directly enters the results of the channel attention module into the space attention module, but also loses the space context information between different categories in the feature map. Therefore, this article adds the results of the original feature map and channel attention, and then inputs them into the space attention module, which to some extent complements the missing space feature information of the channel attention module. The overall structure is shown in Figure 4. The improvements are indicated by dashed lines.
The channel attention module first performs a global average pool and a global maximum pool on the input feature map F to obtain two feature maps   F m a x c  and   F a v g c  of 1 × 1 × C, the output feature map is shared through the neural network (MLP) information of the two layers, and the two features are added together. Finally, the output is normalised using the sigma activation function as shown in Equation (4). The improvements are shown in Equation (5), which adds the original feature map to the channel attention result.
W c = σ ( M L P ( A v g P o o l ( F ) ) + M L P ( M a x P o o l ( F ) ) ) = σ ( W 1 ( W 0 ( F a v g c ) ) + W 1 ( W 0 ( F m a x c ) ) )
F = W o u t c = F × W c + F
where σ is a sigmoid activation function, W0∈RC/r × C, W1∈RC × C/r, W0, and W1 denote the two-layer network parameters of the MLP, and the final output of the channel attention is F’.
The spatial attention module mainly focuses on the spatial region, which has the greatest impact on the final result. First, the average and maximum values of F’ are calculated across all channels, and then put into the channel dimension. After the 7 × 7 convolution operation, the sigmoid activation function is used for normalisation, and F″ is the final output, as shown in Equation (6):
F = W o u t s = F × σ ( f 7 × 7 ( [ A v g P o o l ( F ) ; M a x P o o l ( F ) ] ) )

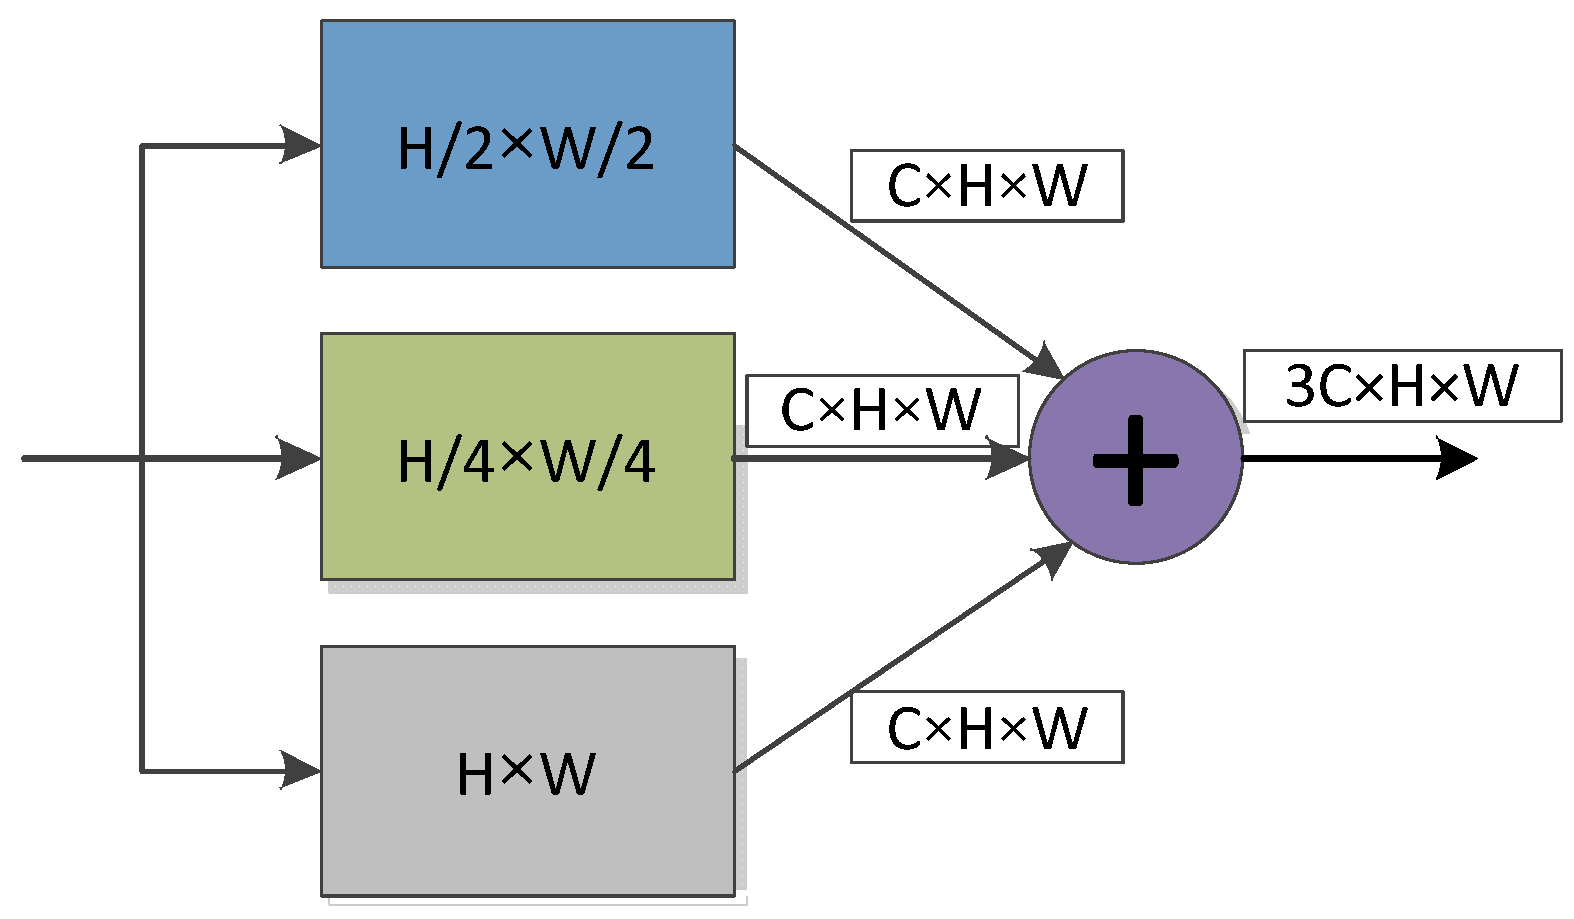
3.4. Semantic Segmentation Feature Enhancement Module

The deep semantic features of convolutional neural networks are of great significance for recognition and segmentation, in order to make better use of the semantic features in the convolutional neural network. This paper introduces the SFEM feature enhancement module, as shown in Figure 5.
SFEM can refine features on images of different scales by using conditional random fields (CRFs) [28] to achieve feature optimization.

3.5. Improved Loss Function

Sample imbalance is a common phenomenon in deep learning. In the semantic segmentation process of deep learning for power equipment detection, this imbalance is more obvious. Semantic segmentation is a pixel-level category, and the number of pixels between different categories in an image usually varies widely. The number of pixels in one category is usually several times or even dozens of times greater than in another category. The sample size is seriously unbalanced, and this level of sample imbalance is often difficult to balance through training strategies.
In order to alleviate a series of problems caused by sample imbalance, we try our best to ensure the balance of samples between different categories during the generation of datasets. In addition, different learning difficulties in different samples can also lead to an imbalance, so adjusting the weight of the loss values and focusing on the training of difficult samples can also alleviate the problem of sample imbalance. Therefore, we introduced a loss function in the algorithm, which can automatically adjust the weight according to the difficulty of sample learning. The focus loss is a typical loss function to mitigate sample unbalance in two-stage target detection, which is improved by cross entropy. The focus loss adjusts the weight of the loss value according to the difficulty of the sample, making it easy for the network to learn difficult samples. Equation (7) is the formula of cross entropy, and Equation (8) is the formula of coke loss:
C E = l o g P t
F L = ( 1 P t ) γ l o g P t
where Pt represents the probability predicted by the model, and weight γ represents the rate of decline in the weight of the adjusted sample. When γ is set to 0, the focus loss function degrades to a cross-entropy loss function. As γ increases, so does the adjustment factor. The original focus loss function achieves the target training by suppressing the loss value of the sample to varying degrees. Suppression causes the weight of the sample loss value to decrease between 0 and 1. The weight of the simple sample is close to 0, and the weight of the difficult sample is close to 1, but during the semantic segmentation process, we need to correctly classify each pixel. Therefore, while retaining the loss value weight of easy samples, increasing the loss value weight of difficult samples is more suitable for semantic segmentation.

4. Experimental Evaluation and Discussion
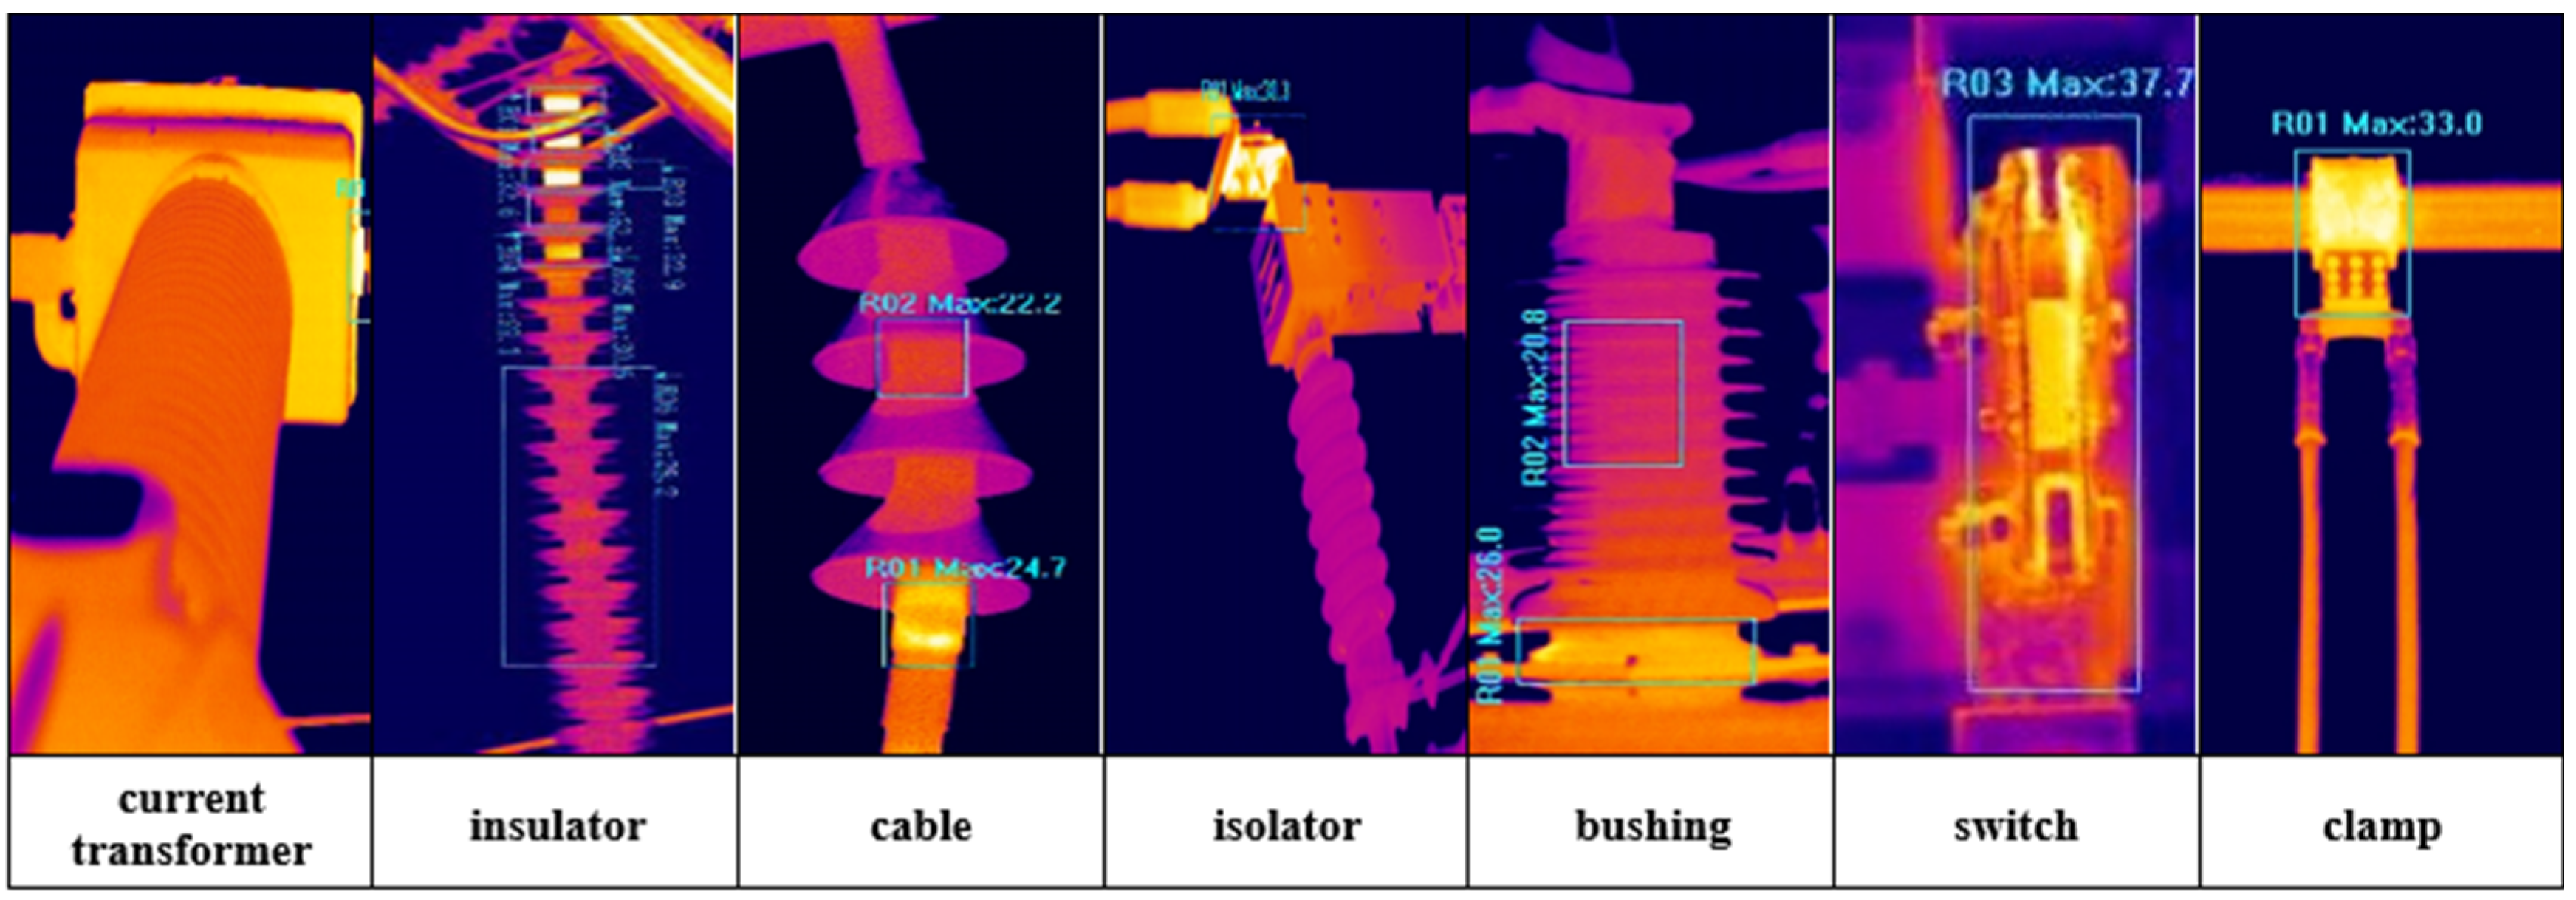
4.1. Dataset

The dataset used in this experiment is collected and produced by ourselves, and trained by seven kinds of infrared images of power equipment with a resolution of 640 × 480, as shown in Figure 6. In the segmentation of power equipment defects phase, the data are seen as a binary problem, in which various types of power equipment are seen as the foreground and objects other than power equipment as the background.

4.2. Experimental Evaluation Indicators

In this study, two metrics were used to compare the experimental effects: mean intersection over union (MIoU) and mean pixel accuracy (MPA). The formula is as follows. MIOU is the most commonly used evaluation index in semantic segmentation. IOU refers to the overlap between the predicted frame and the actual frame; the closer the IOU value is to 1, the closer the prediction is to the correct value. MPA represents the ratio of the correct number of pixels to the total number of pixels in each category.
M I o U = 1 k i = 0 k p i i j = 0 k p i j + j = 0 k p j i p i i
M P A = 1 k i = 0 k p i i 0 j = 0 k p i j
where k represents the number of target categories,  P i i  indicates the correct prediction probability (that is, it belongs to a certain class and the prediction is also that class), and  i = 0 k p i j  indicates the number of pixels belonging to category i that are predicted to be other categories.

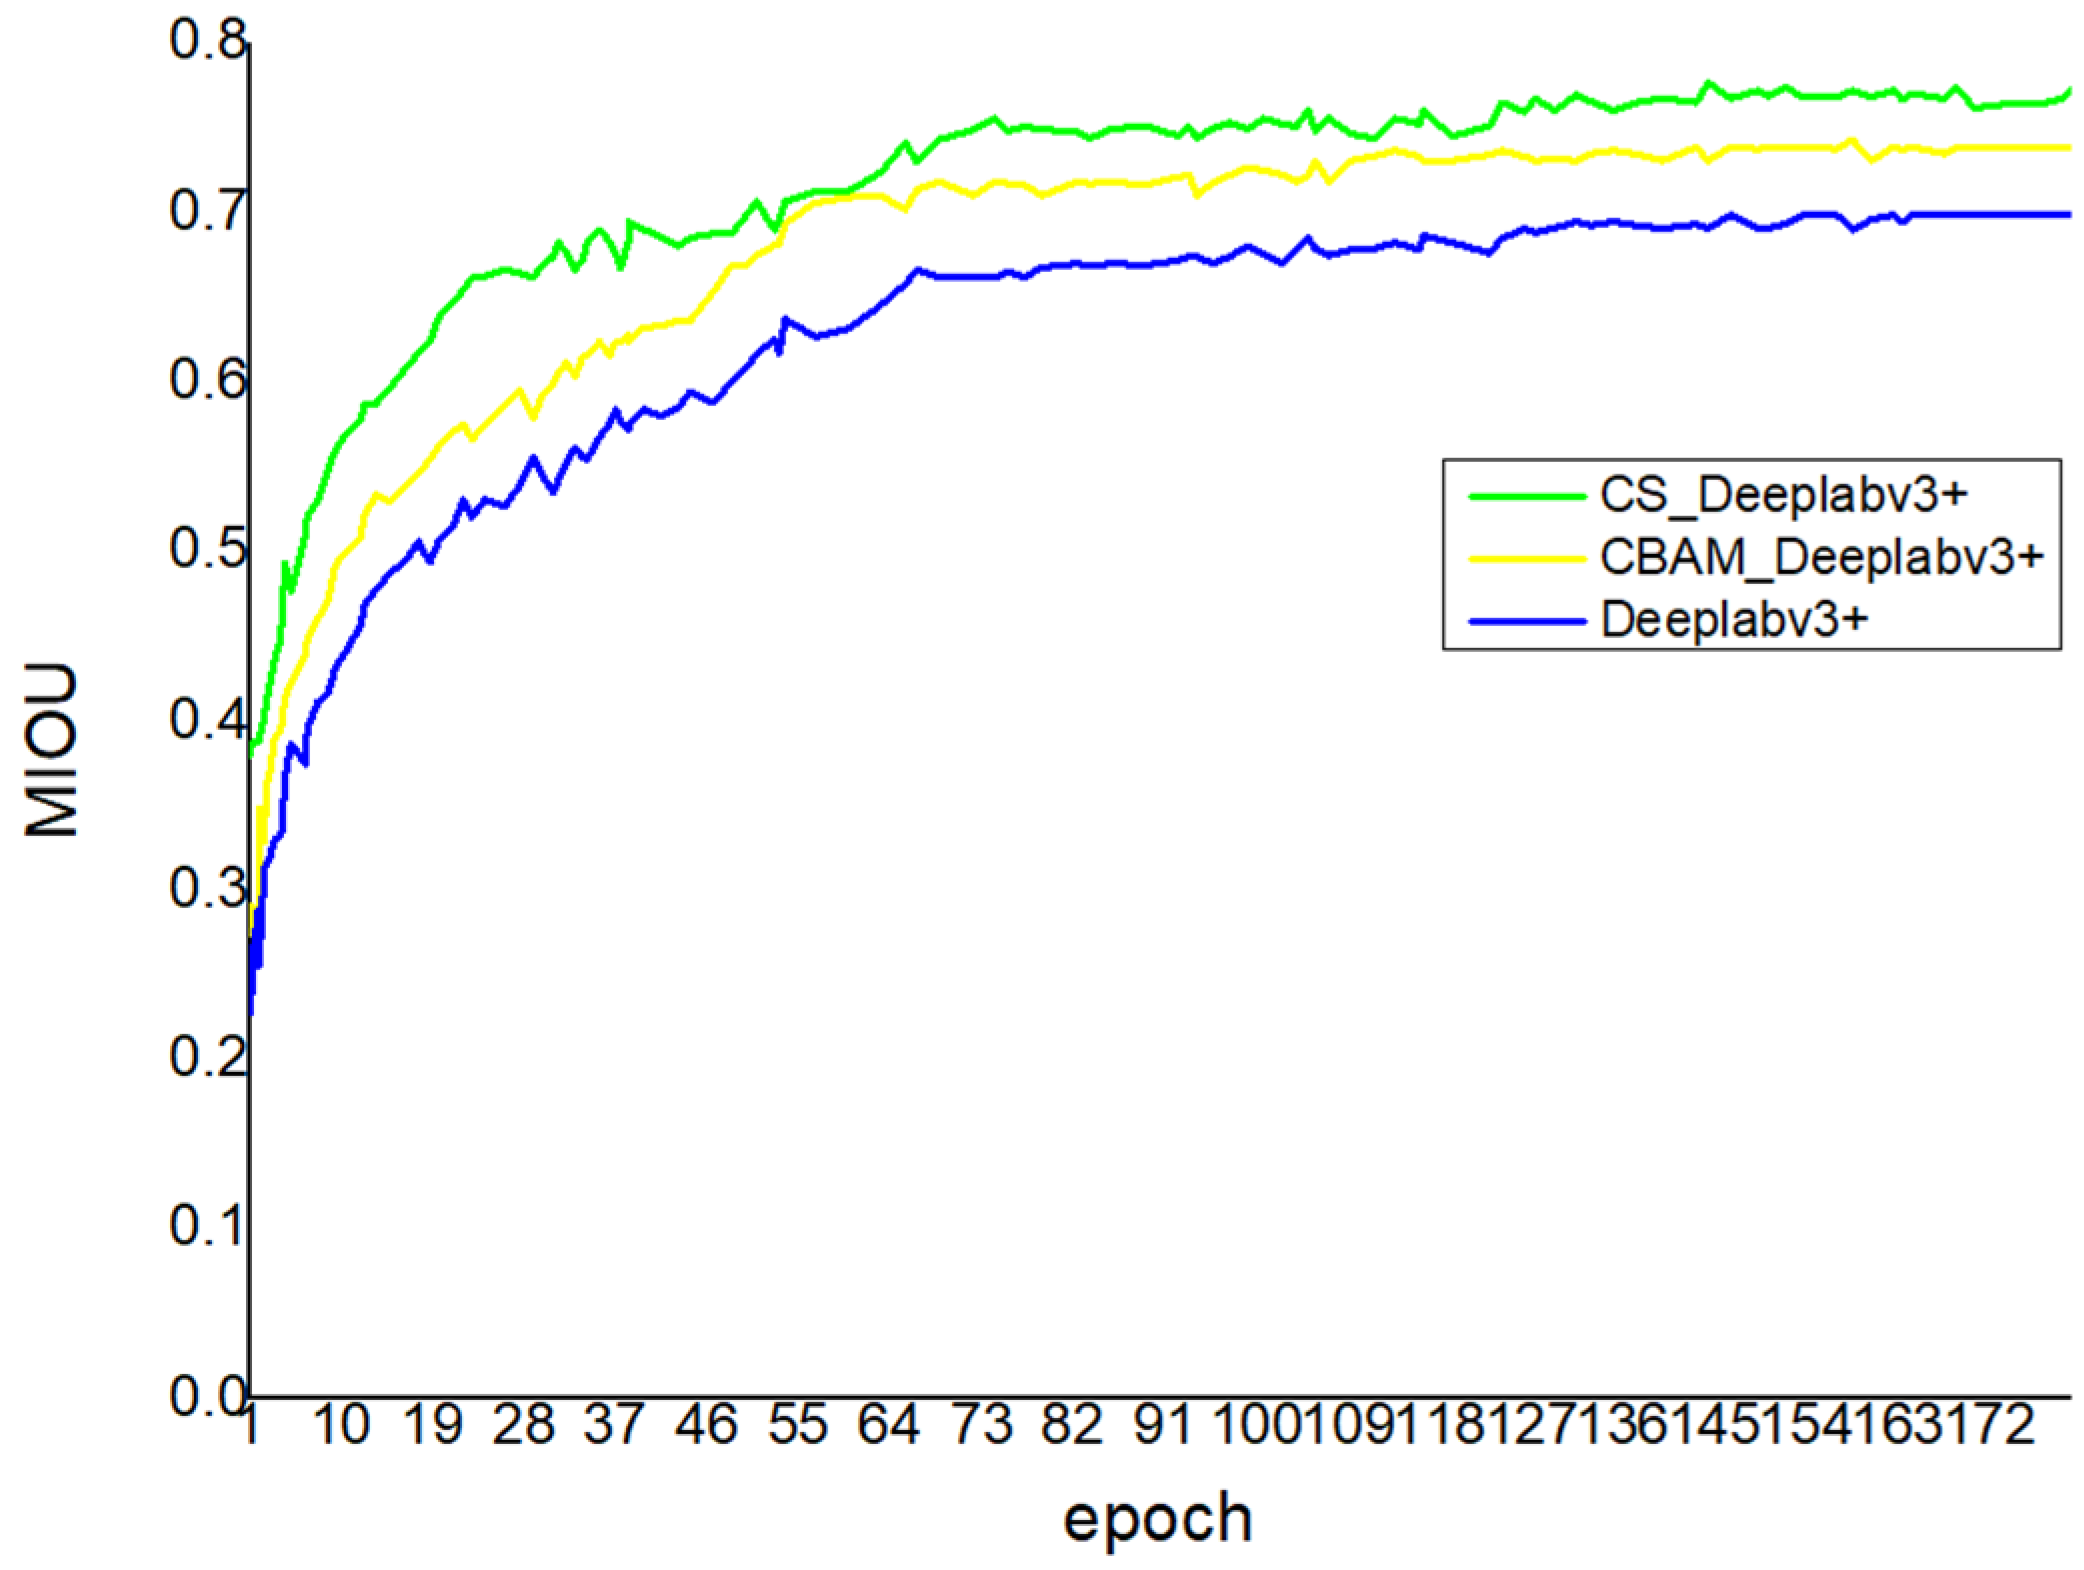
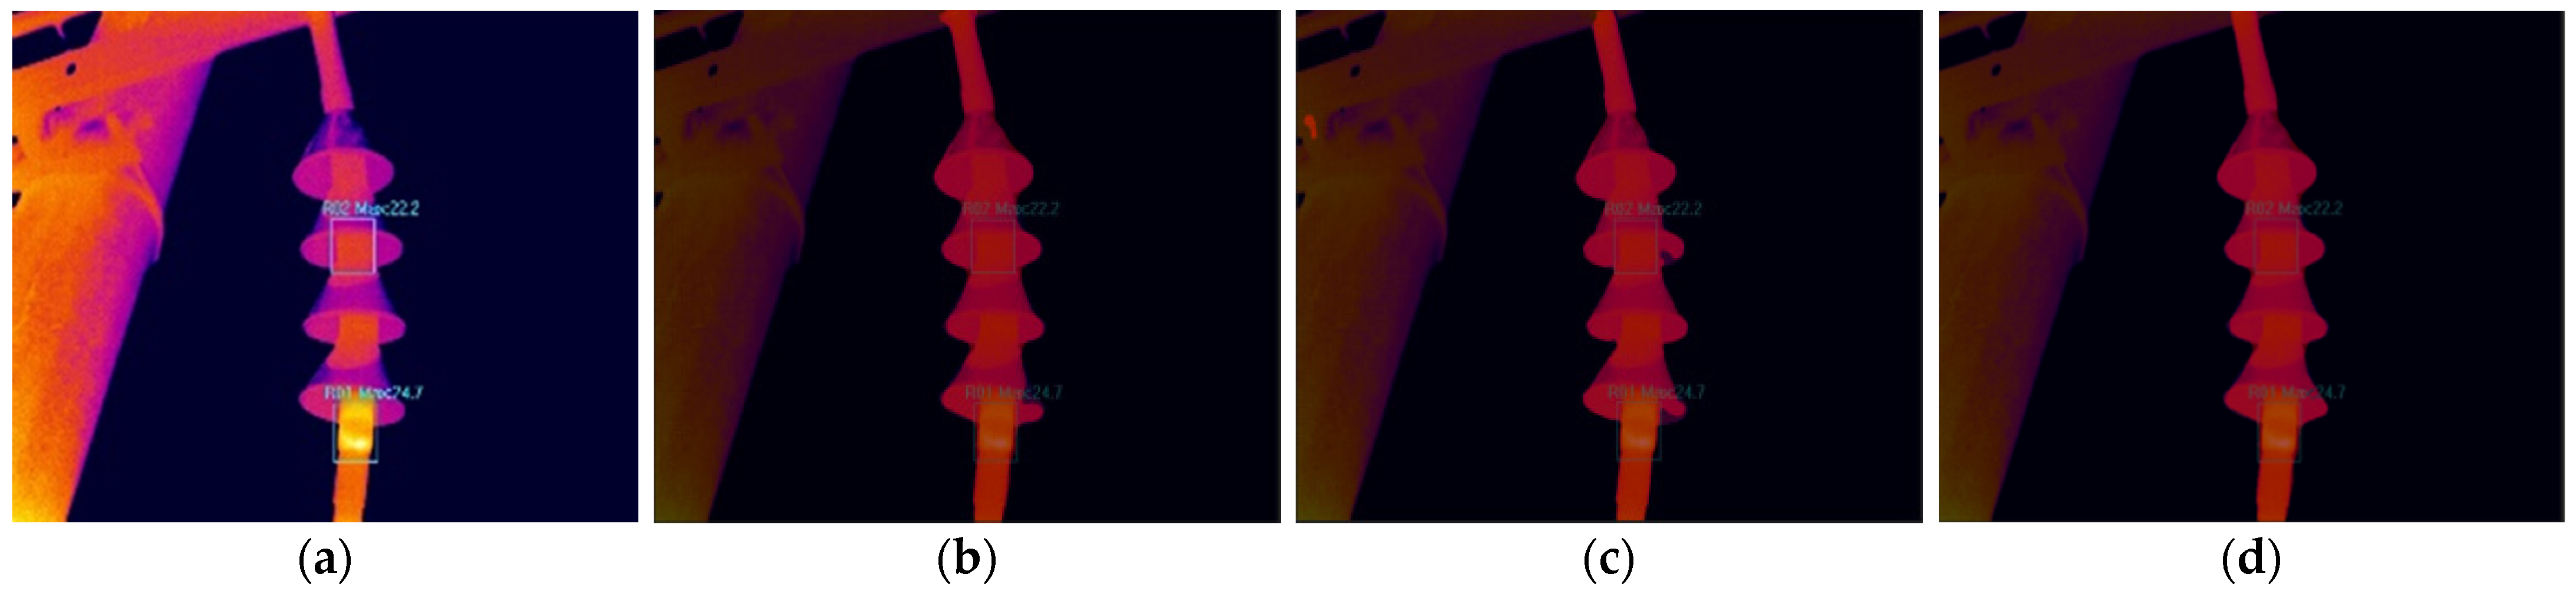
4.3. Comparison Experiment and Analysis

The experiments compare the DeeplabV3+ network, the CBAM module added to the DeeplabV3+ network (CBAM_DeeplabV3+ network), the CBAM module, and the SFEM module added to the DeeplabV3+ network (CS_DeeplabV3+ network). The MIOU curve obtained from the test network is shown in Figure 7. The blue line below represents the DeeplabV3+ network, the yellow line represents the CBAM_DeeplabV3+ network, and the green line represents the CS_DeeplabV3+ network. As the number of iterations increases, the MIOU values of the three networks gradually stabilize. As can be seen from the figure, the performance of the CBAM_DeeplabV3+ network is slightly higher than the DeeplabV3+ network, and the performance of the CS_DeeplabV3+ network is much higher than the DeeplabV3+ network and the CBAM_DeeplabV3+ network. This is because the network model not only improves the ability to reserve space and channel information by incorporating the CBAM modules, but also improves information extraction by incorporating the SFEM feature enhancement modules.
In the comparison experiment, the dataset contained seven categories of power equipment. As shown in Table 1, the improved ASPP and attention mechanism modules in the CBAM_DeeplabV3+ network have improved their metrics MPA and MIOU by 3% and 3.9%, compared to DeeplabV3+. On the basis of the CBAM_DeeplabV3+ network, the MPA and MIOU values of the CS_DeeplabV3+ network added with the SFEM feature enhancement module are greatly improved, which are 5.6% and 7.3% higher than the DeeplabV3+ network. This is because the CS_DeeplabV3+ network designed in this paper improves the ASPP module, and introduces the improved attention mechanism and SFEM feature enhancement module, which improves the accuracy of feature information extraction and improves the precision of segmentation.
In this paper, the original diagram is processed by the network partition mask, and only the partition diagram of the original power equipment defect is retained, so that it can directly reflect the effective information of the power equipment partitioned by the network. The power equipment defect image of the three network segments is shown in Figure 8.
Comparing the three segmentation models of the same graph as observed in Figure 8 shows that the CS_DeeplabV3+ network has the best segmentation effect and the sharpest segmentation boundary. The original DeeplabV3+ network and the CBAM_DeeplabV3+ network do not completely divide the power equipment in the image; there is a loss of detail, and there are local differences at the power equipment boundary.
In order to prove the segmentation accuracy of the CS_DeeplabV3+ network, the U-Net semantic segmentation network and CS_DeeplabV3+ network are selected for comparative experiments. Based on the above two evaluation indices and combining with Table 2, it can be seen that both the MPA and MIOU values of the DeeplabV3+ network are improved compared with the U-Net network. The MPA value of the CS_DeeplabV3+ network designed in this paper is 0.85 and the MIOU value is 0.772; compared with the U-Net network, MPA increased by 13.6% and MIOU increased by 15.7%; and compared with DeeplabV3 +, MPA increased by 5.6% and MIOU increased by 7.3%. The experimental results show that the CS_DeeplabV3+ network designed in this paper has more advantages than other networks.
The current transformer, insulator, and cable are divided into three semantic segmentation networks, as shown in Figure 9. The prediction diagram obtained by the U-Net network and the DeeplabV3+ network is not accurate in extracting characteristic information, lacks details, and is not ideal for power equipment defect boundary segmentation, and it is easy to divide other parts into power equipment classes by mistake. The improved CS_DeeplabV3+ network makes up for the shortcomings mentioned above, accurately extracts the detailed information of power equipment, the boundary division is clearer and smoother, and the problem of misdivision is also solved, which makes the prediction diagram more comprehensive and accurate.

5. Conclusions

Based on the CS_DeeplabV3+ network, the algorithm of power equipment defect segmentation is designed in this paper. In the network structure part, the ASPP module in the original network is changed from the parallel structure of each branch to the dense connection form, which realizes a denser and multi-scale information coding, obtains a denser pixel sampling and larger perceptual field, and reasonably controls the number of network parameters. In order to obtain a higher precision of small target identification, the improved attention mechanism and SFEM module are introduced. The experimental results show that the segmentation algorithm proposed in this paper is effective, and all the indicators are superior to other algorithms. Although the improved CS_DeeplabV3+ algorithm has a positive effect on the precision of image segmentation, due to the introduction of CBAM and SFEM, the segmentation speed is reduced. In the future, the model will be further optimized to balance the segmentation rate and accuracy. In-depth research on the detection of high-performance networks combining prediction accuracy and real-time functionality will improve the usefulness of semantic segmentation algorithms in engineering applications.

Author Contributions

J.Z. and W.Z. were involved in the full process of producing this paper including conceptualization, methodology, modeling, validation, visualization, and preparing the manuscript. All authors have read and agreed to the published version of the manuscript.

Funding

This research was funded by State Grid Shanghai Electric Power Company Science and Technology Project, grant number H2020-073.

Data Availability Statement

The data presented in this study are available upon request from the corresponding author.

Acknowledgments

This research was carried out within the inspection of electrical equipment defects, H2020-073, State Grid Shanghai Electric Power Company. Science and Technology Project.

Conflicts of Interest

The authors declare no conflict of interest.

References

  1. Cao, H.; Zhang, Y.; Zhu, Q.; Zhao, Q. On-line detection and diagnosis of transformer thermal fault based on infrared imaging technology. Lab. Res. Explor. 2012, 31, 30–32+40. [Google Scholar]
  2. Li, T. Application of accurate infrared temperature measurement in condition maintenance of power equipment. High Volt. Appar. 2022, 56, 246–251. [Google Scholar] [CrossRef]
  3. Liu, X.; Ma, J. The Application of the ubiquitous power Internet of Things in the state monitoring of power equipment. Power Syst. Prot. Control 2020, 48, 69–75. [Google Scholar] [CrossRef]
  4. Zhang, Z.; Li, K.; Liu, J.; Jia, B.; Wang, P.; Geng, J. Live detection technology of deteriorated insulator based on UAV inspection platform. Sci. Technol. Eng. 2020, 20, 8616–8621. [Google Scholar] [CrossRef]
  5. Jin, L.; Tian, Z.; Gao, K.; Xiao, R. Insulator contamination level recognition based on infrared and visible light image information fusion. Proc. CSEE 2016, 36, 3682–3691. [Google Scholar] [CrossRef]
  6. Peng, Z.; Chen, Y.; Pu, T.; Wang, Y.; He, Y. Review of image denoising methods based on sparse representation and regular constraints. Data Acquis. Process. 2018, 33, 1–11. [Google Scholar] [CrossRef]
  7. Zhang, N.; Zhang, Y.; Ding, W. A Review of Classical Image Denoising Methods. Chem. Autom. Instrum. 2021, 48, 409–412, 423. [Google Scholar] [CrossRef]
  8. Tang, C.; Tao, Q.; Huang, M. Discussion on the application of infrared temperature measurement technology in substation operation and maintenance. Shi He Zi Sci. Technol. 2020, 06, 14–15. [Google Scholar] [CrossRef]
  9. Chen, D.; Tang, W.; Niu, Z. Fault diagnosis method of infrared image of power equipment based on deep learning. Guangdong Electr. Power 2021, 34, 97–105. [Google Scholar] [CrossRef]
  10. Liu, H.; Yu, C.; Wu, H.; Duan, Z.; Yan, G. A new hybrid ensemble deep reinforcement learning model for wind speed short term forecasting. Energy 2020, 202, 117794. [Google Scholar] [CrossRef]
  11. Shao, Z.; Zhang, Z.; Wei, W.; Wang, F.; Xu, Y.; Cao, X.; Jensen, C.S. Decoupled dynamic spatial-temporal graph neural network for traffic forecasting. arXiv 2022, arXiv:2206.09112. [Google Scholar] [CrossRef]
  12. Qi, C.; Li, Q.; Liu, Y.; Ni, J.; Ma, R.; Xu, Z. Infrared image segmentation based on multi-information fused fuzzy clustering method for electrical equipment. Int. J. Adv. Robot. Syst. 2020, 17, 1–18. [Google Scholar] [CrossRef]
  13. Shu, J.; He, J.; Li, L. MSIS: Multispectral Instance Segmentation Method for Power Equipment. Comput. Intell. Neurosci. 2022, 2022, 2864717. [Google Scholar] [CrossRef] [PubMed]
  14. Long, J.; Shelhamer, E.; Darrell, T. Fully convolutional networks for semantic segmentation. In Proceedings of the IEEE Conference on Computer Vision and Pattern Recognition (CVPR), Boston, MA, USA, 7–12 June 2015; pp. 3431–3440. [Google Scholar]
  15. Badrinarayanan, V.; Kendall, A.; Cipolla, R. SegNet: A Deep Convolutional Encoder-Decoder Architecture for Image Segmentation. IEEE Trans Pattern Anal. Mach. Intell. 2017, 39, 2481–2495. [Google Scholar] [CrossRef] [PubMed]
  16. Ronneberger, O.; Fischer, P.; Brox, T. U-Net: Convolutional Networks for Biomedical Image Segmentation. In Proceedings of the Medical Image Computing and Computer-Assisted Intervention—MICCAI, Munich, Germany, 5–9 October 2015; Volume 9351, pp. 234–241. [Google Scholar]
  17. Usamentiaga, R.; Lema, D.G.; Pedrayes, O.D.; Garcia, D.F. Automated surface defect detection in metals: A comparative review of object detection and semantic segmentation using deep learning. IEEE Trans. Ind. Appl. 2022, 58, 4203–4213. [Google Scholar] [CrossRef]
  18. Chen, L.-C.; Zhu, Y.; Papandreou, G.; Schroff, F.; Adam, H. Encoder-Decoder with Atrous Separable Convolution for Semantic Image Segmentation. In Proceedings of the Computer Vision—ECCV, Munich, Germany, 8–14 September 2018; Volume 11211, pp. 833–851. [Google Scholar]
  19. Chen, L.-C.; Papandreou, G.; Kokkinos, I.; Murphy, K.; Yuille, A.L. DeepLab: Semantic Image Segmentation with Deep Convolutional Nets, Atrous Convolution, and Fully Connected CRFs. IEEE Trans. Pattern Anal. Mach. Intell. 2018, 40, 834–848. [Google Scholar] [CrossRef] [Green Version]
  20. Liu, S.; Yin, F. Image segmentation method based on graph secsion and its new progress. Acta Autom. Sin. 2012, 38, 911–922. [Google Scholar] [CrossRef]
  21. Zeng, J.; Huang, S. Comparison and analysis of typical image edge detection operators. J. Hebei Norm. Univ. (Nat. Sci. Ed.) 2020, 44, 295–301. [Google Scholar] [CrossRef]
  22. Dang, W. Research and application of image region segmentation algorithm. Anhui Univ. Sci. Technol. 2018, 12, 76. [Google Scholar] [CrossRef]
  23. Jia, X.; Zhang, Y.; Wu, B.; Ma, K.; Wang, J.; Cao, X. LAS-AT: Adversarial training with learnable attack strategy. In Proceedings of the IEEE/CVF Conference on Computer Vision and Pattern Recognition, New Orleans, LA, USA, 18–24 June 2022; pp. 13398–13408. [Google Scholar]
  24. Meng, L.; Xu, L.; Guo, J. A Semantic Segmentation Algorithm for MobileNetV2 Network Based on Improvement. Chin. J. Electron. 2020, 48, 1769–1776. [Google Scholar] [CrossRef]
  25. Chollet, F. Xception: Deep Learning with Depthwise Separable Convolutions. In Proceedings of the 2017 IEEE Conference on Computer Vision and Pattern Recognition (CVPR), Honolulu, HI, USA, 21–26 July 2017; pp. 1800–1807. [Google Scholar]
  26. Guo, L.; Zhang, T.; Sun, W.; Guo, J. Pictorial Semantic Description Algorithm for Fusion Spatial Attention Mechanism. Adv. Laser Optoelectron. 2021, 58, 313–322. [Google Scholar] [CrossRef]
  27. Hou, T.; Zhao, J.; Qiang, Y.; Sanhu, W.; Pan, W. The CRF 3D-UNet lung nodule segmentation network. Comput. Eng. Des. 2020, 41, 1663–1669. [Google Scholar] [CrossRef]
  28. Li, K.; Han, B.; Zhang, J. Detection and Recognition of Traffic Signs Based on Conditional Random Airport and Multi-scale Convolutional Neural Network. Comput. Appl. 2020, 41, 1663–1669. [Google Scholar]
Figure 1. Algorithm flow chart.
Electronics 12 01588 g001
Figure 2. Renderings: (a) low-resolution graphs; and (b) high-resolution graphs.
Electronics 12 01588 g002
Figure 3. CS_DeeplabV3+ network structure.
Electronics 12 01588 g003
Figure 4. Improved attention mechanism module.
Electronics 12 01588 g004
Figure 5. SFEM structure.
Electronics 12 01588 g005
Figure 6. Seven types of power equipment.
Electronics 12 01588 g006
Figure 7. MIOU result curves for different networks.
Electronics 12 01588 g007
Figure 8. Original drawing and segmentation effects for 3 different models: (a) original drawing; (b) DeeplabV3+; (c) CBAM_DeeplabV3+; and (d) CS_DeeplabV3+.
Electronics 12 01588 g008
Figure 9. Network prediction effect diagram: (a) original drawing; (b) U-Net; (c) Deeplabv3+; and (d) CS_Deeplabv3+.
Electronics 12 01588 g009aElectronics 12 01588 g009b
Table 1. The network performance comparison of each module.
ModuleMPAMIOU
DeeplabV3+0.7940.699
CBAM_DeeplabV3+0.8240.738
CS_DeeplabV3+0.8500.772
Table 2. Performance comparison of different semantic segmentation networks.
ModuleMPAMIOU
U-Net0.7140.615
DeeplabV3+0.7940.699
CS_DeeplabV3+0.8500.772
Disclaimer/Publisher’s Note: The statements, opinions and data contained in all publications are solely those of the individual author(s) and contributor(s) and not of MDPI and/or the editor(s). MDPI and/or the editor(s) disclaim responsibility for any injury to people or property resulting from any ideas, methods, instructions or products referred to in the content.

