Article

Investigation of Oscillation and Resonance in the Renewable Integrated DC-Microgrid

by
Mohammad Habibullah
1,
Nadarajah Mithulananthan
1,
Rakibuzzaman Shah
1,2,*,
Md Rabiul Islam
3,* and
S. M. Muyeen
4
1
School of Information Technology and Electrical Engineering, University of Queensland, Saint Lucia, QLD 4072, Australia
2
Centre for New Energy Transition Research (CfNETR), Federation University Australia, Mt. Helen, VIC 3353, Australia
3
School of Electrical, Computer, and Telecommunications, University of Wollongong, Wollongong, NSW 2522, Australia
4
Department of Electrical Engineering, College of Engineering, Qatar University, Doha 2713, Qatar
*
Authors to whom correspondence should be addressed.
Electronics 2023, 12(7), 1574; https://doi.org/10.3390/electronics12071574
Submission received: 31 January 2023 / Revised: 19 March 2023 / Accepted: 23 March 2023 / Published: 27 March 2023
(This article belongs to the Special Issue Energy Harvesting and Energy Storage Systems, Volume II)

Abstract

:
This paper assessed the small-signal stability performance of a multi-converter-based direct current microgrid (DCMG). The oscillation and potential interactions between critical modes are evaluated. First, the complete analytical model of the DCMG is developed with the converter and associated controllers. Three methodologies, impedance scanning, eigenvalue analysis, and time-domain simulation, along with the fast Fourier transform (FFT) analysis, have been used to comprehensively investigate the oscillations and interactions. The simulation results show inherent weak modes, with a wide range of oscillations in the studied DCMG, which may destabilize the system under disturbances. Based on the sensitivity analysis, controller gains and DC-link capacitance are identified as the most critical parameters and substantially influence the weak modes leading to oscillations, interactions, and resonance. Finally, the performance of the various control synthesis methods is compared. This examination would help the researchers, planning, and design engineers to design and stably operate a multi converter-based DC microgrid.

1. Introduction

DCMGs or DC distribution systems are emerging as the future electricity delivery systems that could enable the extensive integration of renewable energy sources (RESs) into the power grid without multiple conversions. A DCMG consists of several DC–DC converters (e.g., buck and boost converters), inverters that are usually connected through a cable to a common DC bus [1,2,3,4,5]. Several key technical challenges associated with DCMGs have received moderate attention in the literature. For example, the identification of oscillations and resonance sources in DCMGs and their mitigation are always considered challenging tasks. Furthermore, these issues so far have limited coverage and understanding and are yet to be comprehensively investigated [6,7,8,9,10].
Power oscillations in the DCMG can originate from poorly tuned controllers, line switching, sudden changes in demand or generator outputs, and others [9,10,11]. In the DCMG, generated power primarily comes from distributed and intermittent energy resources, e.g., photovoltaic (PV)/wind/energy storage. For example, the sudden change in power output at the sources may reduce the DC bus voltage, or DC voltage fluctuation may be observed at the DC bus. Therefore, the scale of disturbances in the DC system may vary from small to severe. Furthermore, these disturbances may lead to power and voltage oscillations in the DC bus, with drastic consequences. Therefore, the security of the system would be compromised [12,13]. The consequence of security and the nature of instability depends on the types of the DCMG grid.
Additionally, several power electronic converters are connected through the common DC bus in industrial DCMGs. This DC bus acts as a resonant or tuned circuit with a finite inductor and capacitor. In contrast, each DC–DC converter has its capacitor bank. Therefore, when several PWM DC–DC converters simultaneously act together, converters’ frequencies could coincide with the DC-link bus frequency [12]. Therefore, the system could face severe disturbances, such as power oscillations, overshoot, or undershoot in the DC bus voltage. In the worst case, this may lead to the blackout of the system [10,11,12]. Therefore, it is essential to understand the root cause and impact of disturbances in power oscillations in DC grids and develop innovative solutions to avoid the possibilities of such consequences.
In this respect, a few excellent research works have been conducted to investigate the small-signal stability in the DC microgrid [1,2,3]. Furthermore, constant power loads and disturbances have introduced power oscillations in resonance for the DC bus, as reported in [4,5]. However, this investigation has been conducted for a small-scale DC microgrid (only two units of converters). The work in [13] focused on modelling the buck converter to supply the constant impedance, current, and power load. In addition, the Kharitonov theory has been applied for a robustness assessment with several controls (i.e., P, PI, and PID). The large-signal stability of a DC microgrid using the Lyapunov method is proposed in this work [14]. Furthermore, the load limit under the stability and voltage violation restriction is presented. However, a simple system is used without any details about the control. The effect of the cascaded converter on the stability of the DC system is proposed in [15]. Individual stable converters are used to create the multiple stage cascaded converter without informing the types of load and controls. The work in [16] compared the droop control and virtual inertia control of the DC microgrid using the eigenvalue method. The research work in [17] developed a reduced-order impedance model starting from the DC-side load converter for stability analysis in a three-terminal DC distribution system. The local sensitivity index has been used to identify the direction of stability enhancement.
Furthermore, the DC microgrid is expected to experience increasing uncertainty in parameters due to the distinct stochastic nature of RESs and the proliferation of new types of loads. However, only some of these uncertainties are critical for system operation and control. Therefore, estimating the essential parameters under various operating conditions would enable secure and reliable operation with targeted control action and monitoring requirements. Several sensitivity analysis (SA) methods are applied in the literature for AC power system application, i.e., load classification, ranking of the generator, and ranking the critical load in terms of the voltage and frequency stability [18,19]. However, no reported work has considered the SA method for critical parameter identification in the DC system. With the increasing number of uncertain parameters and their coupling, a cost-efficient technique to identify the most critical parameters of the DC microgrid in terms of low frequency and resonance is required.
Furthermore, few works have proposed controller design/retuning for DC microgrid stability enhancement [20]. For example, the LQR-based control is proposed in [21] to enhance the DC microgrid’s low frequency and resonance performance. However, the LQR controller needs to be more robust, with a complex and high-order model, which is challenging to implement. Furthermore, several works have proposed the PI controller without assessing the limits of the controllers. Therefore, a comprehensive assessment of various control methods for the DC microgrid and their impact on stability is sought.
The summary of the key review is given in Table 1. It is noticed in Table 1 that work in the literature has yet to comprehensively assess the key parameters affecting the stability of the DC grid under various operating conditions. Furthermore, most of the research works focused on various stability assessment methods with different complexities and less on mitigation and the control design.
Therefore, the HF oscillation assessment of the DC system has been conducted in this study using both the impedance and eigenvalue methods. The numerical studies have been conducted using MATLAB Simulink, with a detailed state-space model of the DCMG and considering the dynamics of the power electronic converters. The main contributions of the paper can be listed as follows:
  • A comprehensive analytical model for investigating high-frequency oscillations and resonance has been developed. The impedance analysis and eigenvalue-based method are used simultaneously to identify the source of oscillation/instability in the DC microgrid.
  • Most of the prior studies have considered a constant power load for the high-frequency and resonance assessment of DC microgrids. This work has considered the various types of loads in the DC microgrid and their impact on the overall high-frequency oscillations and resonance.
  • A semi-global sensitivity analysis technique has been used to rank the most critical parameters of the DC microgrid, considering the cross-coupling of various parameters and uncertainties.
  • Three control synthesis methods are described and compared in their suitability to the conventional PI controller in terms of high-frequency oscillations and resonance.
The rest of the paper is organized as follows. Section 2 provides a brief synopsis of the state-of-the-art oscillation challenges of DCMGs. Section 3 presents the modelling of DCMGs for small-signal stability studies. Section 4 illustrates the key results and discussions, including the sensitivity studies and control comparisons. The conclusions, contributions, and future directions of this research are highlighted in Section 5.

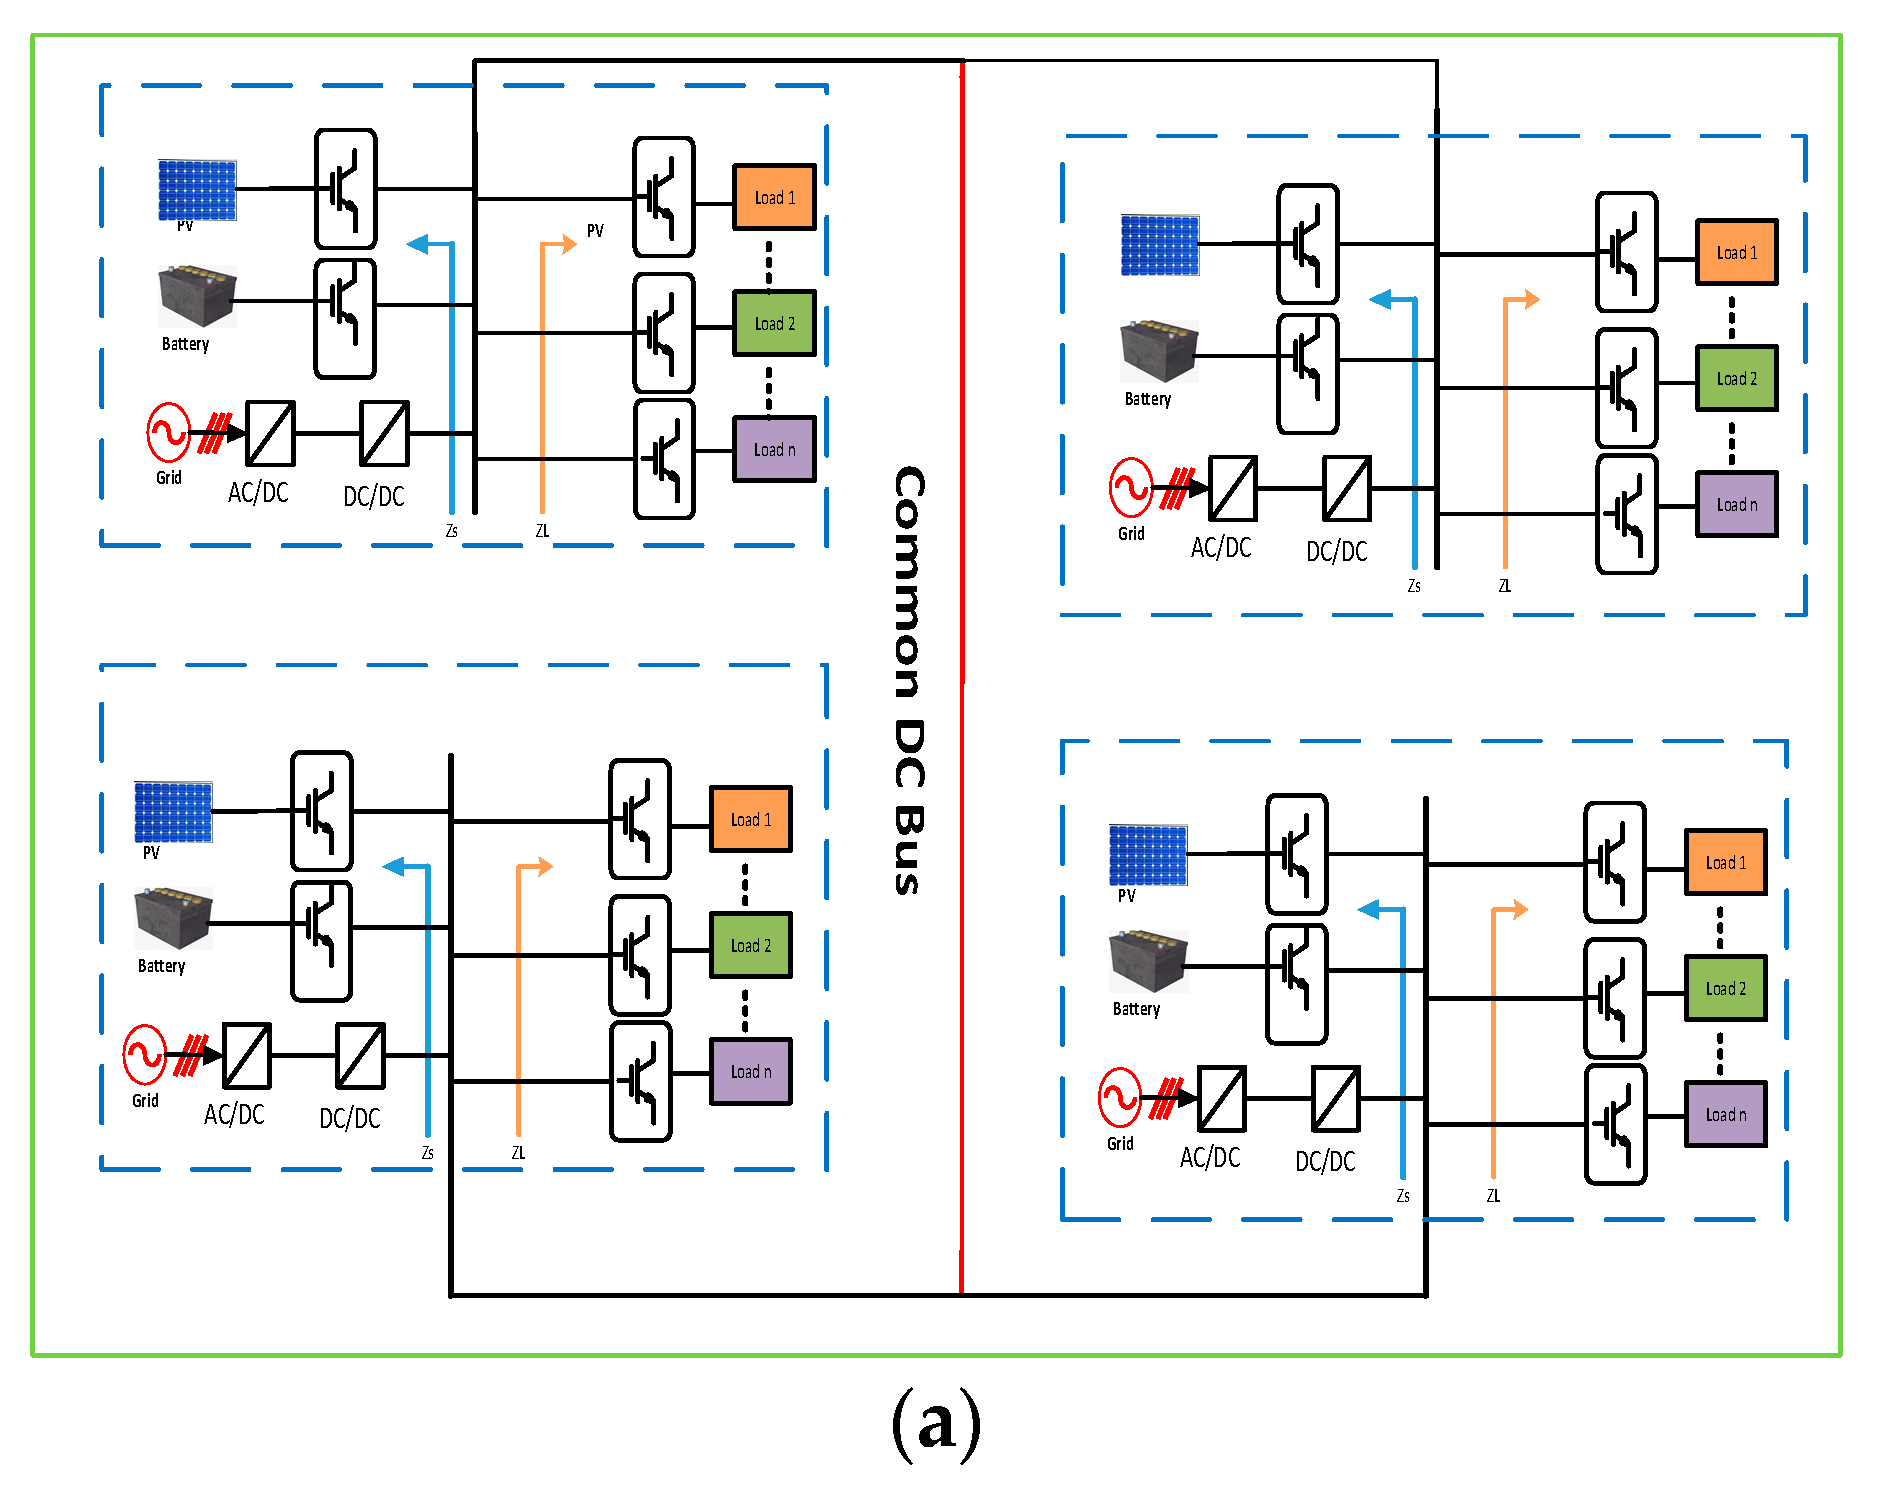
2. Oscillation Challenges in DCMG

The DCMG facilitates the integration of RESs better and has many advantages compared to an ACMG. However, the DCMG has some technical challenges. Recently, several studies have focused on the technical challenges of DCMGs and the application of power electronic devices in the DC network. These can be divided into five general categories, which are the protection, standardization of voltage, power quality, voltage stability, and overall security of the system, as described in [6,7,8,9]. The challenges associated with the oscillation phenomena of DCMGs are given next.
Power oscillation is a severe issue in DC or AC microgrids. In the present literature, the extensive analysis and investigation of power oscillations in AC microgrids are reported. It is identified that numerous types of power oscillations can be observed in AC power systems, including intra-plant mode oscillations, local plant mode oscillations, inter-area mode oscillations, and control mode oscillations [22,23]. On the other hand, in the DC grid, two types of oscillations are found in the contemporary literature: HF oscillations and LF oscillations [24,25]. In addition, distributed energy resources such as PV and wind sources have significant effects on the damping performance and generation of HF oscillation, as reported in [24,25]. However, the effect of sub-synchronous oscillations and the mitigation of power oscillations in the DC system is overlooked and has not been extensively investigated in the literature.
Another possibility for power oscillations in the sub-synchronous range could be in the form of resonance. A dynamic system can lose its equilibrium state temporarily due to disturbances. A sub-synchronous frequency of oscillation could occur when two dynamic systems are bilaterally coupled. One can affect others and may lead to instability. The sub-synchronous frequency of oscillation poses a significant threat to system stability, as reported in [26,27,28]. It can be significantly amplified with time, causing system instability. Furthermore, if the disturbing force frequency is near or equal to one of the natural frequencies of the system, resonance may potentially occur in the system. Sub-synchronous resonances could lead to voltage fluctuation and light flickering, and an abnormal vibration of the control. In the previously mentioned literature, the effect of sub-synchronous oscillations and the mitigation of power oscillations in the DC bus is yet to be extensively investigated.
Recently, significant research has been conducted to find a suitable methodology to investigate the various aspects of stability, particularly the oscillatory type of instability problems, in DC grids. For instance, the authors in [2] have investigated two methods: impedance and eigenvalue analyses in the HVDC system. The impedance analysis is useful for local stability, while the eigenvalue analysis is suitable for global stability [29]. Both assessment methods were recommended for the accuracy of the analysis in [29]. However, a comprehensive SSS analysis of HF oscillation and a detailed state-space model of a DC microgrid with the dynamics of power electronic converters are yet to be covered in the present literature.
Typically, power system engineers use stabilizers with synchronous machines to provide damping to obstruct HF and LF oscillations in the AC system. However, the same approach may not be appropriate for dealing with these types of oscillations in the DCMG [30]. Some researchers suggested optimal capacitor banks for the DC distribution networks. The negative aspect known as resonance could be reduced by adding a filter in the capacitor bank. However, the effects of the DC link and its control were ignored in this study. The resonance can be generated from either capacitors or impedances or from both in DC grids, as reported in [9]. If the driving system frequency coincides with the driven subsystem frequency, then the system could face catastrophic consequences and a high possibility of a blackout via the resonance path. In addition, the power electronic converters have EMI filters, which may cause inrush currents and might lead to voltage oscillations in the DC bus.
Therefore, finding the source of the power oscillation and how to maintain the stability of a DC distribution network under such oscillatory conditions require further exploration. Therefore, these are the critical interests of this work. The flowchart of the complete work is given in Figure 1.

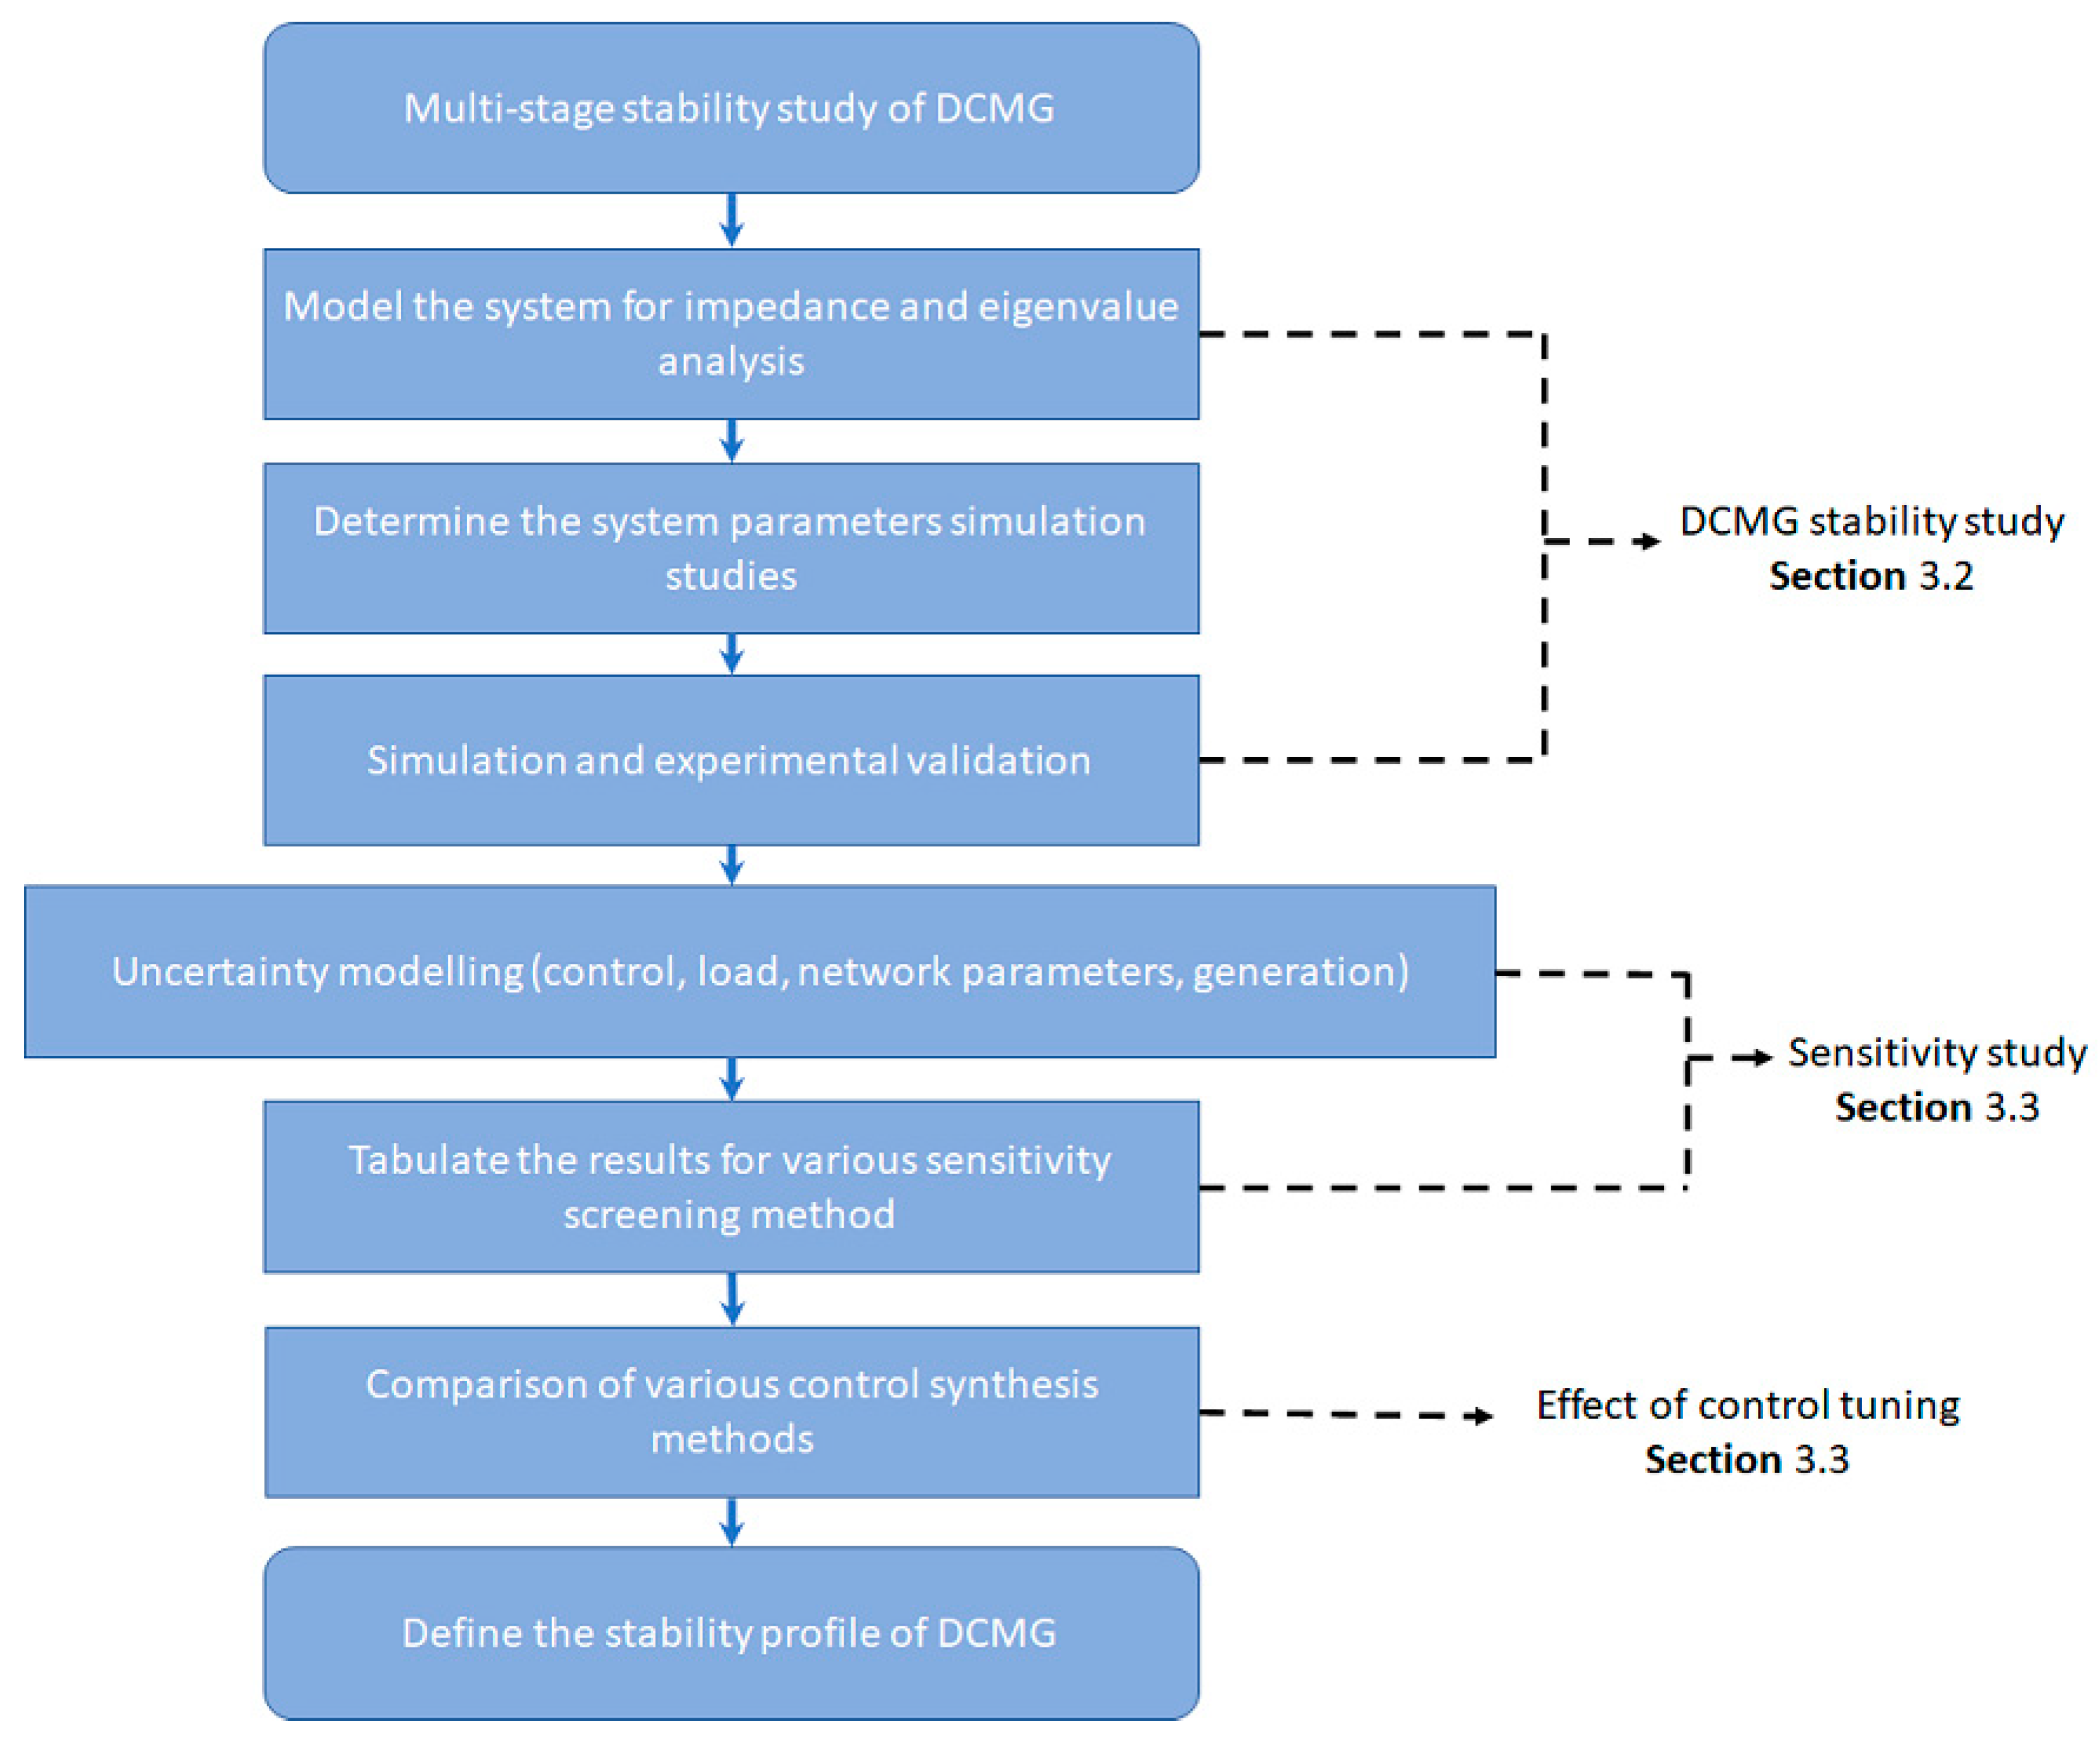
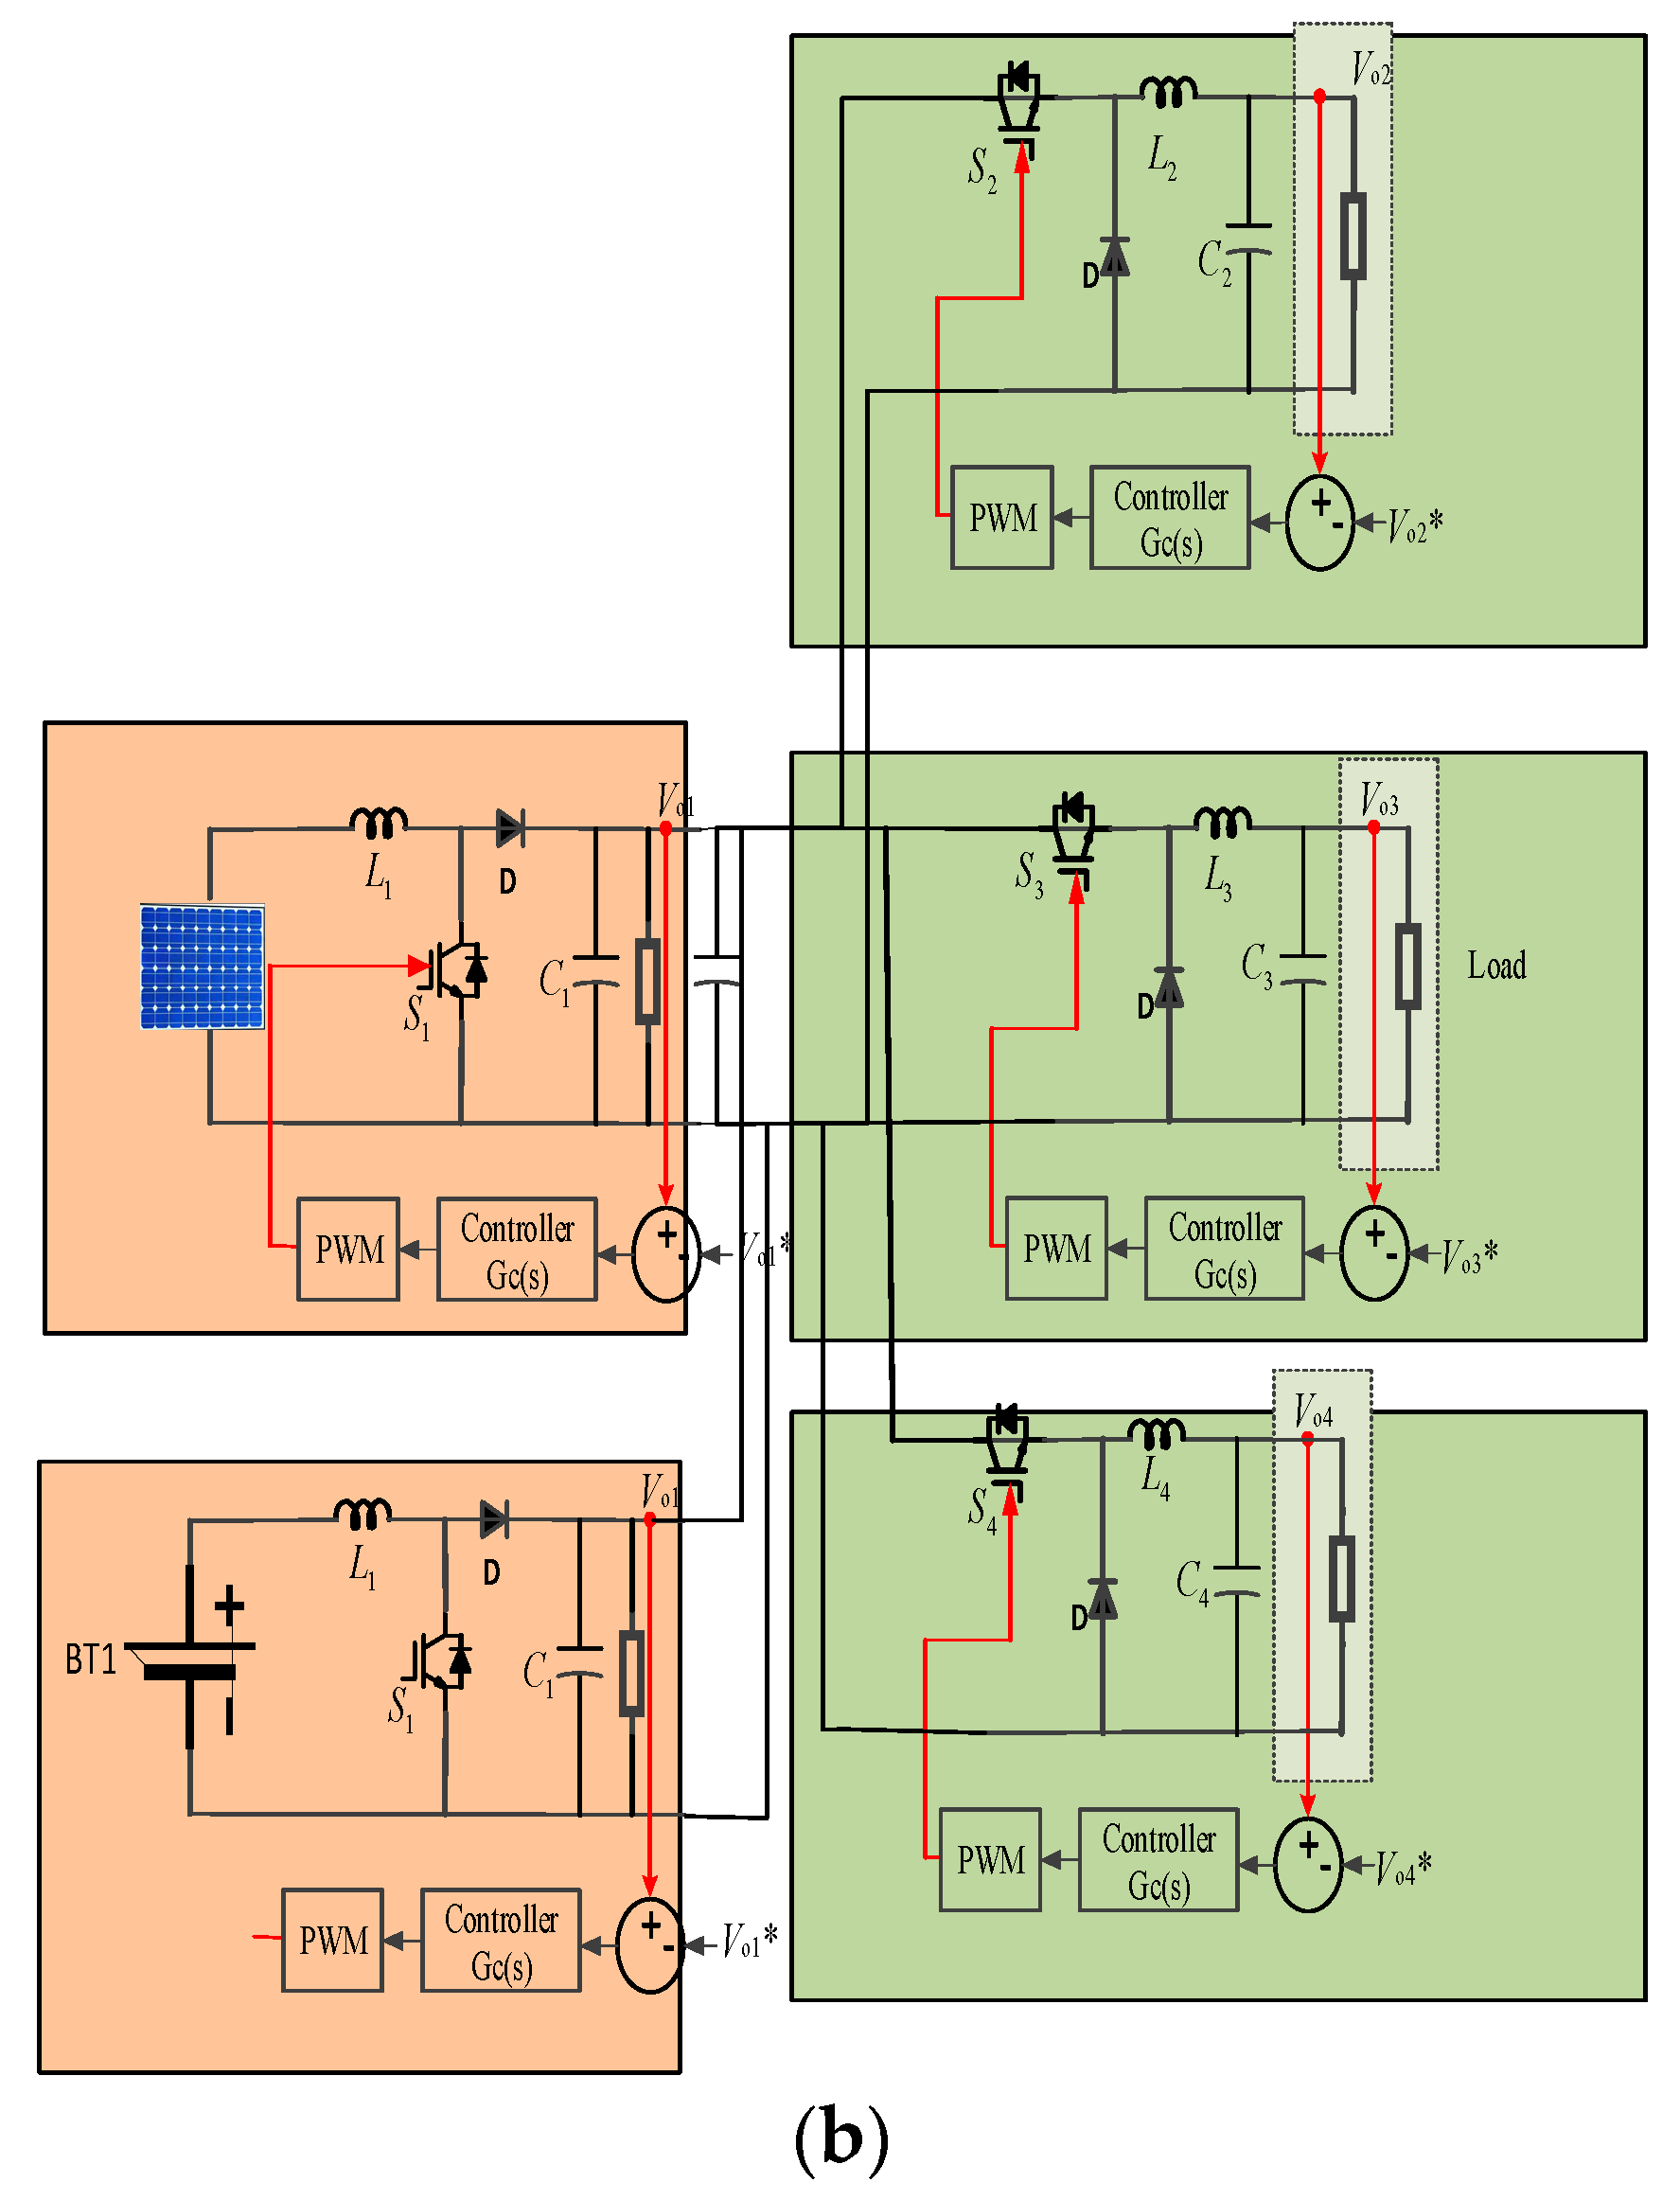
3. Methodology and Modelling

A multi-converter-based DC microgrid is composed of highly nonlinear components and often operated in a constantly changing environment. Hence, the stability of the system should be ensured for the wide operating ranges to avoid any adverse consequences. A multi-converter-based DC microgrid of a 1-MW capacity has been designed at the University of Queensland, Australia, as shown in Figure 2a. The details of the microgrid parameters are presented in Table 2.
The campus microgrid includes a large-scale solar PV, EV bidirectional DC fast charging station with a rooftop solar PV system, BESS, and interfaces with the existing conventional AC grid. Additionally, various types of loads, i.e., a DC load and AC load, are interfaced with the power electronic converters in the DC microgrid. In this investigation, the main focus is the stability of the DC bus voltage. Two units of the converter on the generation side and three units of the converter at the load sides are considered. The topology of the DC microgrid with five converters is given in Figure 2b.

3.1. State Space Modelling

A detailed small-signal state-space mathematical model is necessary to conduct the eigenvalue (participation factor assessment) and sensitivity analysis. A proportional and integral (PI) controller has been used to regulate the output voltage of the boost and buck converters. The state-space model of a boost converter along with a PI controller can be expressed, as given in (1).
[ d i l d t d v o d t d β d t ] = [ 0 1 L 1 ( 1 + K p V r e f 2 V 0 K p + K i β ) K i V 0 L 1 ( 1 C 1 + C 2 ) ( 1 K p V r e f + K p V 0 K i β ) ( 1 C 1 + C 2 ) ( K p I l 1 R 1 ) ( K i I l C 1 + C 2 ) 0 1 0 ] [ i l v 0 β ]
In (1), C 1 ,   L 1 , and R 1 represent the capacitor, inductor, and resistor of the boost converter. Additionally, i l is the inductor current in the boost converter, V 0 and V g are the capacitor and input voltages of the boost converter, and d is the duty cycle. In (1), K P is the proportional gain and K i is the integral gain of the PI controller. The parameter β is introduced to represent the state vector of the integrator. The small-signal state-space model of a buck converter with a PI controller can be expressed as in (2).
[ d i l d t d v 0 d t d β d t ] = [ 0 1 L 2 ( 1 V i n K p ) K i V i n L 2 1 C 3 1 R 2 C 3 0 0 1 0 ] [ i l v 0 β ]
In (2), C 2 ,   L 2 , and R 2 are the capacitor, inductor, and resistor in the buck converter, K P is the proportional gain, and K i is the integral gain of the given PI controller. The parameter β is introduced to represent the state vector of the integrator. The overall system state matrix is essential to conduct a sensitivity analysis on weak modes with respect to parameter variations. The complete state-space model can be obtained by using the individual subsystem, given in (1) and (2).

3.2. Analytical Expression for Impedance Scanning

A detailed analytical impedance model is required to conduct impedance scanning. The closed-loop output impedance of the boost converter can be expressed as in (3).
Z o c l ( s ) = Z o ( s ) 1 + T ( s )
where Z 0 ( s ) is the open-loop output impedance of the boost converter and T ( s ) is the loop gain. Open-loop output impedance and loop gain can be expressed as given in (4) and (5), respectively.
Z 0 ( s ) = s 2 + s ( C 1 × R 1 ( 1 + D 2 ) + L 1 + ( R 1 × D 2 ) ) L 1 × C 1 × R 1
T ( s ) = ( K p + K i s ) × ( V i n ( 1 D ) 2 ) × ( 1 s L 1 ( 1 D ) 2 × R 1 ) ( L 1 × C 1 ( 1 D ) 2 ) ( s 2 + s ( 1 C 1 × R 1 + ( 1 D ) 2 L 1 ) ) + ( 1 D ) 2 L 1 × C 1
here, two individual converters with power ratings of 12 kW and 8 kW have been used at the source side. Since the converters have been connected in parallel, the total output impedance can be written as (6).
Z t s = Z o c l 1 × Z o c l 2 Z o c l 1 + Z o c l 2
Three individual converters with power ratings of 1 kW, 5 kW, and 10 kW, respectively, have been used at the load side of the system, and the input impedance of the closed-loop buck converter can be estimated as in (7).
Z i c l ( s ) = Z i ( s ) × R 2 × ( 1 + T ( s ) ) R 2 + Z i ( s ) D 2 × T ( s )
where Z i ( s ) and T   ( s ) are the open-loop input impedance and loop gain, respectively. These can be expressed in (8) and (9).
T ( s ) = ( K p + K i s ) × [ ( V i n L 2 × C 2 ) × ( 1 + s × C 2 ) s 2 + s ( 1 C 2 × R 2 + 1 L 2 ) + 1 L 2 × C 2 ]
Z i ( s ) = ( s 2 L C ) + R D 2 × ( 1 + s R C )
The open-loop input impedance of the individual unit can be expressed as (10)–(12).
Z i 3 ( s ) = ( s 2 L 3 C 3 ) + R 3 D 2 × ( 1 + s R 3 C 3 )
Z i 4 ( s ) = ( s 2 L 4 C 4 ) + R 4 D 2 × ( 1 + s R 4 C 4 )
Z i 5 ( s ) = ( s 2 L 5 C 5 ) + R 5 D 2 × ( 1 + s R 5 C 5 )
where Z i 3 , Z i 4 , and Z i 5 are the open-loop input impedances of the load side buck converters. Since all converters have been connected in parallel, the total impedance can be expressed using (13).
Z t i n = Z 1 × Z 2 × Z 3 ( Z 1 × Z 2 ) + ( Z 2 × Z 3 ) + ( Z 1 × Z 3 )
In (13), Z t i n is the total input impedance from the load side. Eventually, the DC bus impedance can be expressed as given in (14).
Z b u s = Z t s × Z t i n Z t s + Z t i n

3.3. Sensitivity Analysis

The most critical input to the system’s output can be numerically identified using the sensitivity analysis method. Three methods are available for sensitivity analysis: local, semi-global, and global. The local method, or the one-at-a-time (OAT) method, considers the slight variation in the input around its nominal value and ignores the coupled relationship among different parameters, whilst the global sensitivity method considers the influence of a given parameter across the full parametric range with cross dependencies. However, it requires a high simulation and computational time, deemed infeasible for a system with large variables. Therefore, a semi-global sensitivity analysis, known as the Morris method, has been used in this work.
The semi-global Morris method generates a multi-dimensional trajectory in search space [18,19]. To generate the search space, the base value (initial) is randomly selected for each uncertainty ( Δ   t o   1 Δ ) . The step is bounded in such a way that the search space boundary is not violated. In the Morris method, one variable is changed at a time by the magnitude of Δ, whilst other variables remain fixed. This process runs until the n steps are completed for each variable. From this point, the method selects another variable and changes the value by Δ in the multi-dimensioned space. This is effectively a random walk in the search space where the dimension of work depends on the number of uncertainties and is limited by the steps. The elementary effect of a Δ change can be defined as in (15) [19].
E t i ( x ) = [ Y ( x 1 , x 2 x i 1 , x i + Δ , x i + 1 , x t ) Y ( x ) ] Δ
In this work, the mean ( μ ) given in (16) would be used as the index of the Morris method. This mean expresses the sensitivity strength between the t t h input and the Y output.
μ = 1 n i = 1 n | E E t i |
The higher value of μ indicates the higher contribution of the input to the output variables. This method requires n t + 1 simulations, where t indicates the variables and n is the step size (ranges between 4 to 10). In this work, the n value of 5 has been considered.

3.4. Overview of Control Tuning

In this work, the suitability and the performance of three control design methods are illustrated. At first, the LQR control proposed in [20,21] has been developed in this work. For the sake of brevity and to avoid repetition, the details about the LQR control implementation are not illustrated here. It should be worth noting that the structure of the LQR control is different from the structure of the conventional PI control.
Recently, a PI+clegg integrator has been reported in the literature with the capability of enhancing the control performance by resetting the part of the controller. This can be easily implemented in the standard PI control structure without changing the structure. Therefore, a PI+clegg integrator is considered in this work. The reset-based control has been reported in [31] to enrich the performance of the integrator. In this control strategy, the controller state is reset to zero under certain conditions. As a result, the phase lag could be reduced. The transfer function of the PI+clegg control can be expressed as [31].
G = K p ( 1 + 1 s T i + j 4 P r π s T i )
where P r is the parameter reset rate, and 0 P r 1 [32]. The control structure forms into the PI structure when P r = 0 , and with the PI+clegg structure when P r = 1 .
Several works have reported the suitability of the IP control over the PI control. The IP controller may overcome the inherent lacking in the K P gain of the PI controller. It has already been implemented in [33] for the tuning of the current controller in VSC-HVDC under a weak grid condition. In this work, the IP controller has been used in the converter control of the DC microgrid.

4. Numerical Analysis and Discussion

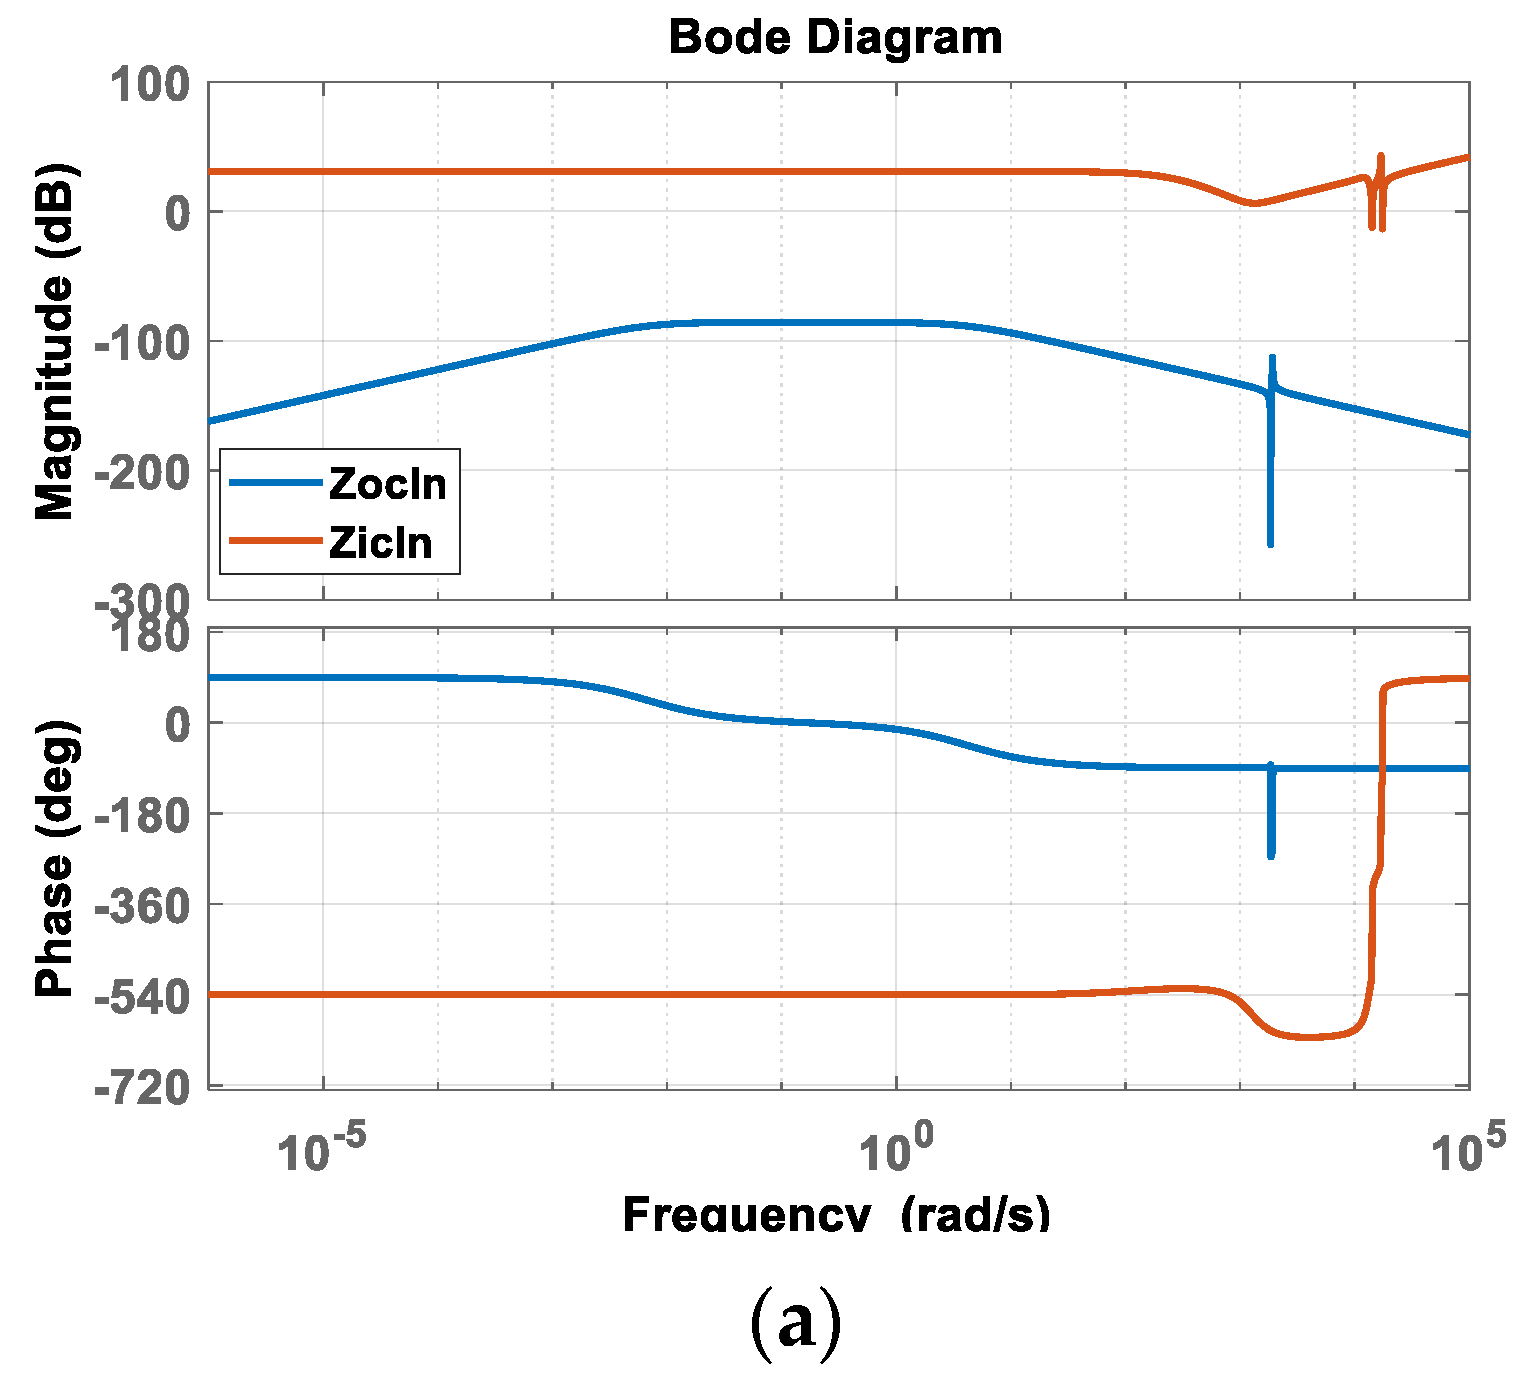
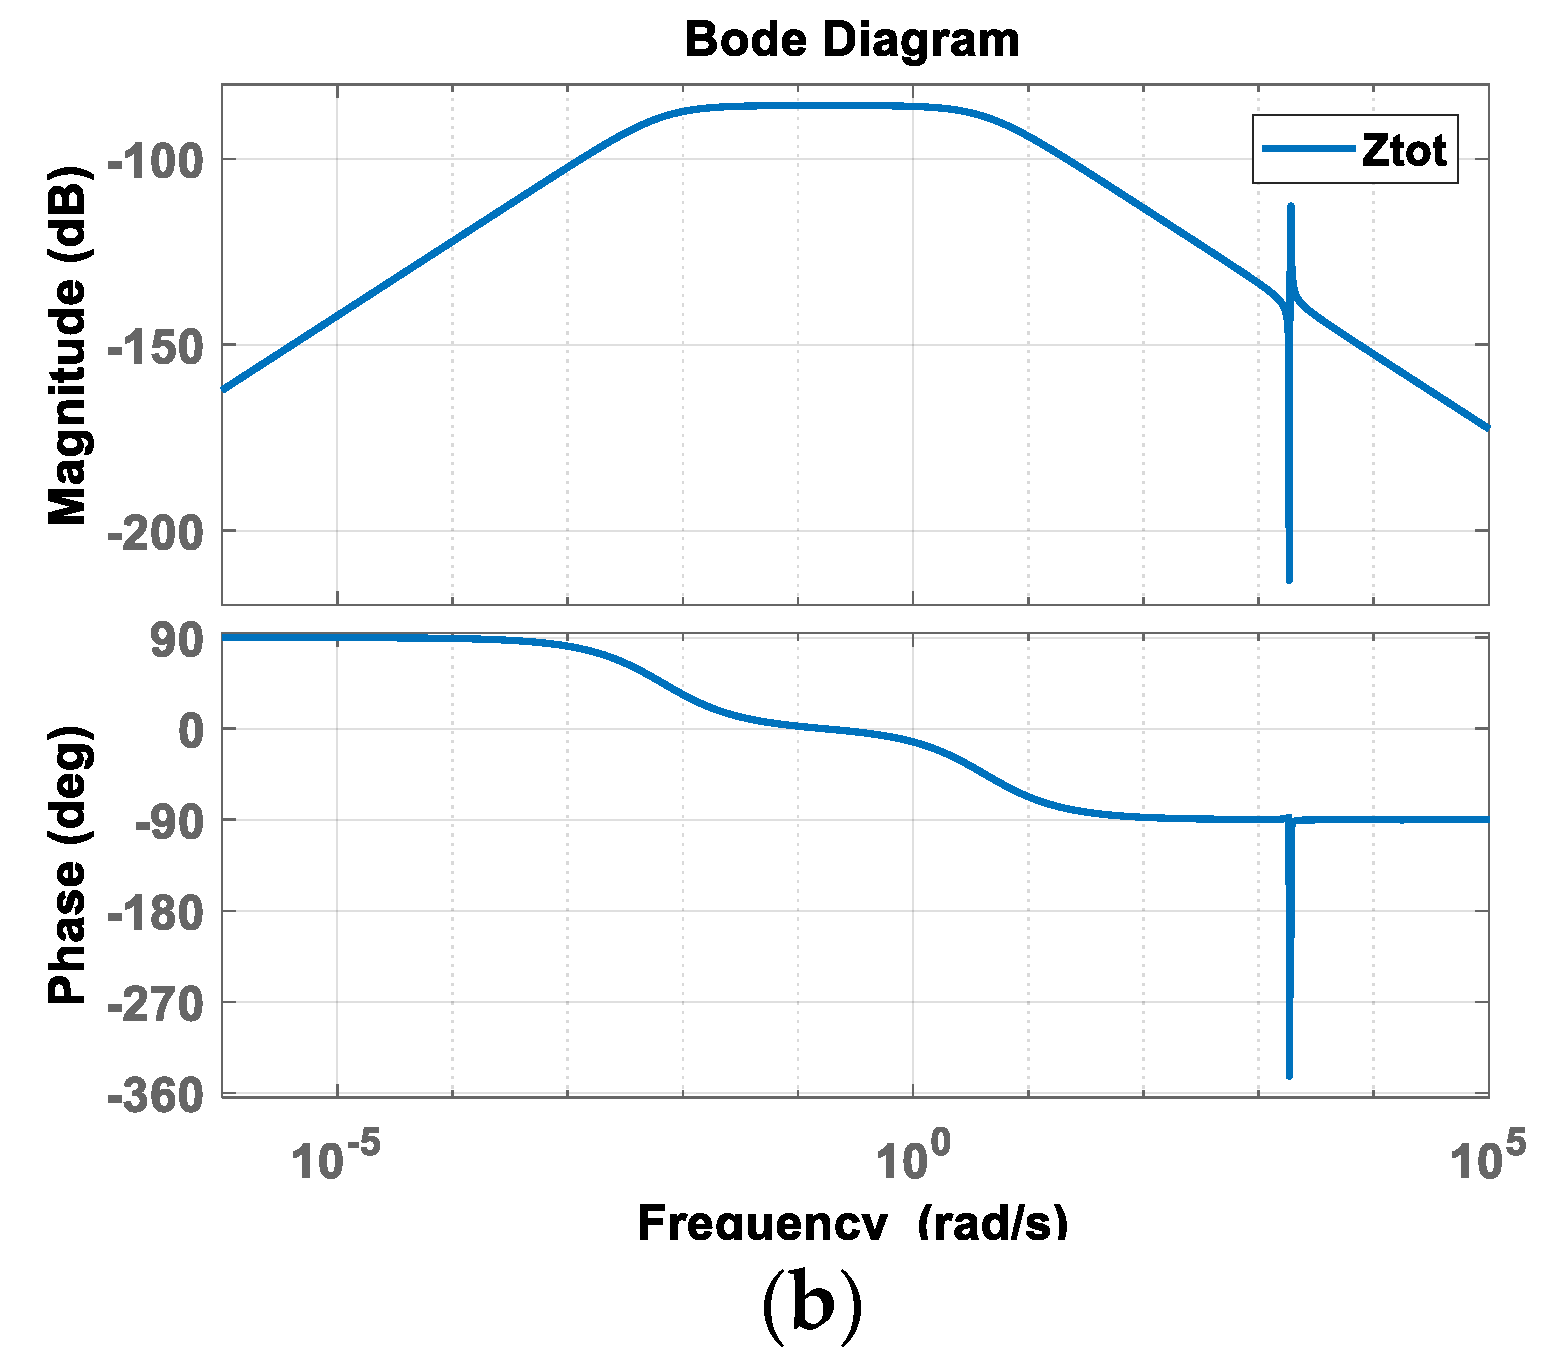
4.1. Impedance Analysis

This subsection presents an impedance-based assessment to investigate the small-signal stability of DCMG. Two groups of converters have been considered for this research work. The boost converter has been considered on the source side, whereas the buck converter has been placed on the load side. To construct a prototype of the DC microgrid, the converters are first designed individually in the MATLAB Simulink platform. Then, a proportional and integral controller is designed based on the PM, step response, and GM requirements. The values of the proportional (P) and integral (I) gains (i.e., K p = 0.00005 pu and K i = 0.003 pu) are selected, based on the PM = 95 degrees and GM = 15 dB for the source-side converters. Following the same procedure, a conventional PI controller is designed for the load-side buck converters. An optimal proportional and integral gain (i.e., K p = 0.9 pu and K i = 0.005 pu) is considered, with a PM and GM of 90 degrees and 16 dB, respectively. Lastly, the multiple-converter-based DC microgrid is formed by combining these converters with their controllers. The parameters of the individual converters are given in Table 3 and Table 4, respectively.
Then, an impedance analysis has been conducted in the MATLAB Simulink platform for the given system. Figure 3a presents the output and input impedances, whereas Figure 3b presents the total impedance seen from the DC link. From Figure 3a, it is evident that the output impedance is far away from the input impedance except for three resonance peaks, which are 230 Hz, 2280 Hz, and 2790 Hz, respectively. Figure 3b presents the total input impedance seen from the DC link, whereas only 230 Hz of the potential oscillatory mode is observed.
From the impedance analysis, three sensitive modes have been identified, and they are 230 Hz, 2280 Hz, and 2790 Hz. However, the source of the problem and the critical mode that contributes to oscillation could not be identified via impedance scanning. For this reason, the eigenvalue and participation factor analyses are recommended. To find out the sensitivity of the modes, an eigenvalue analysis has been conducted in the following subsection.

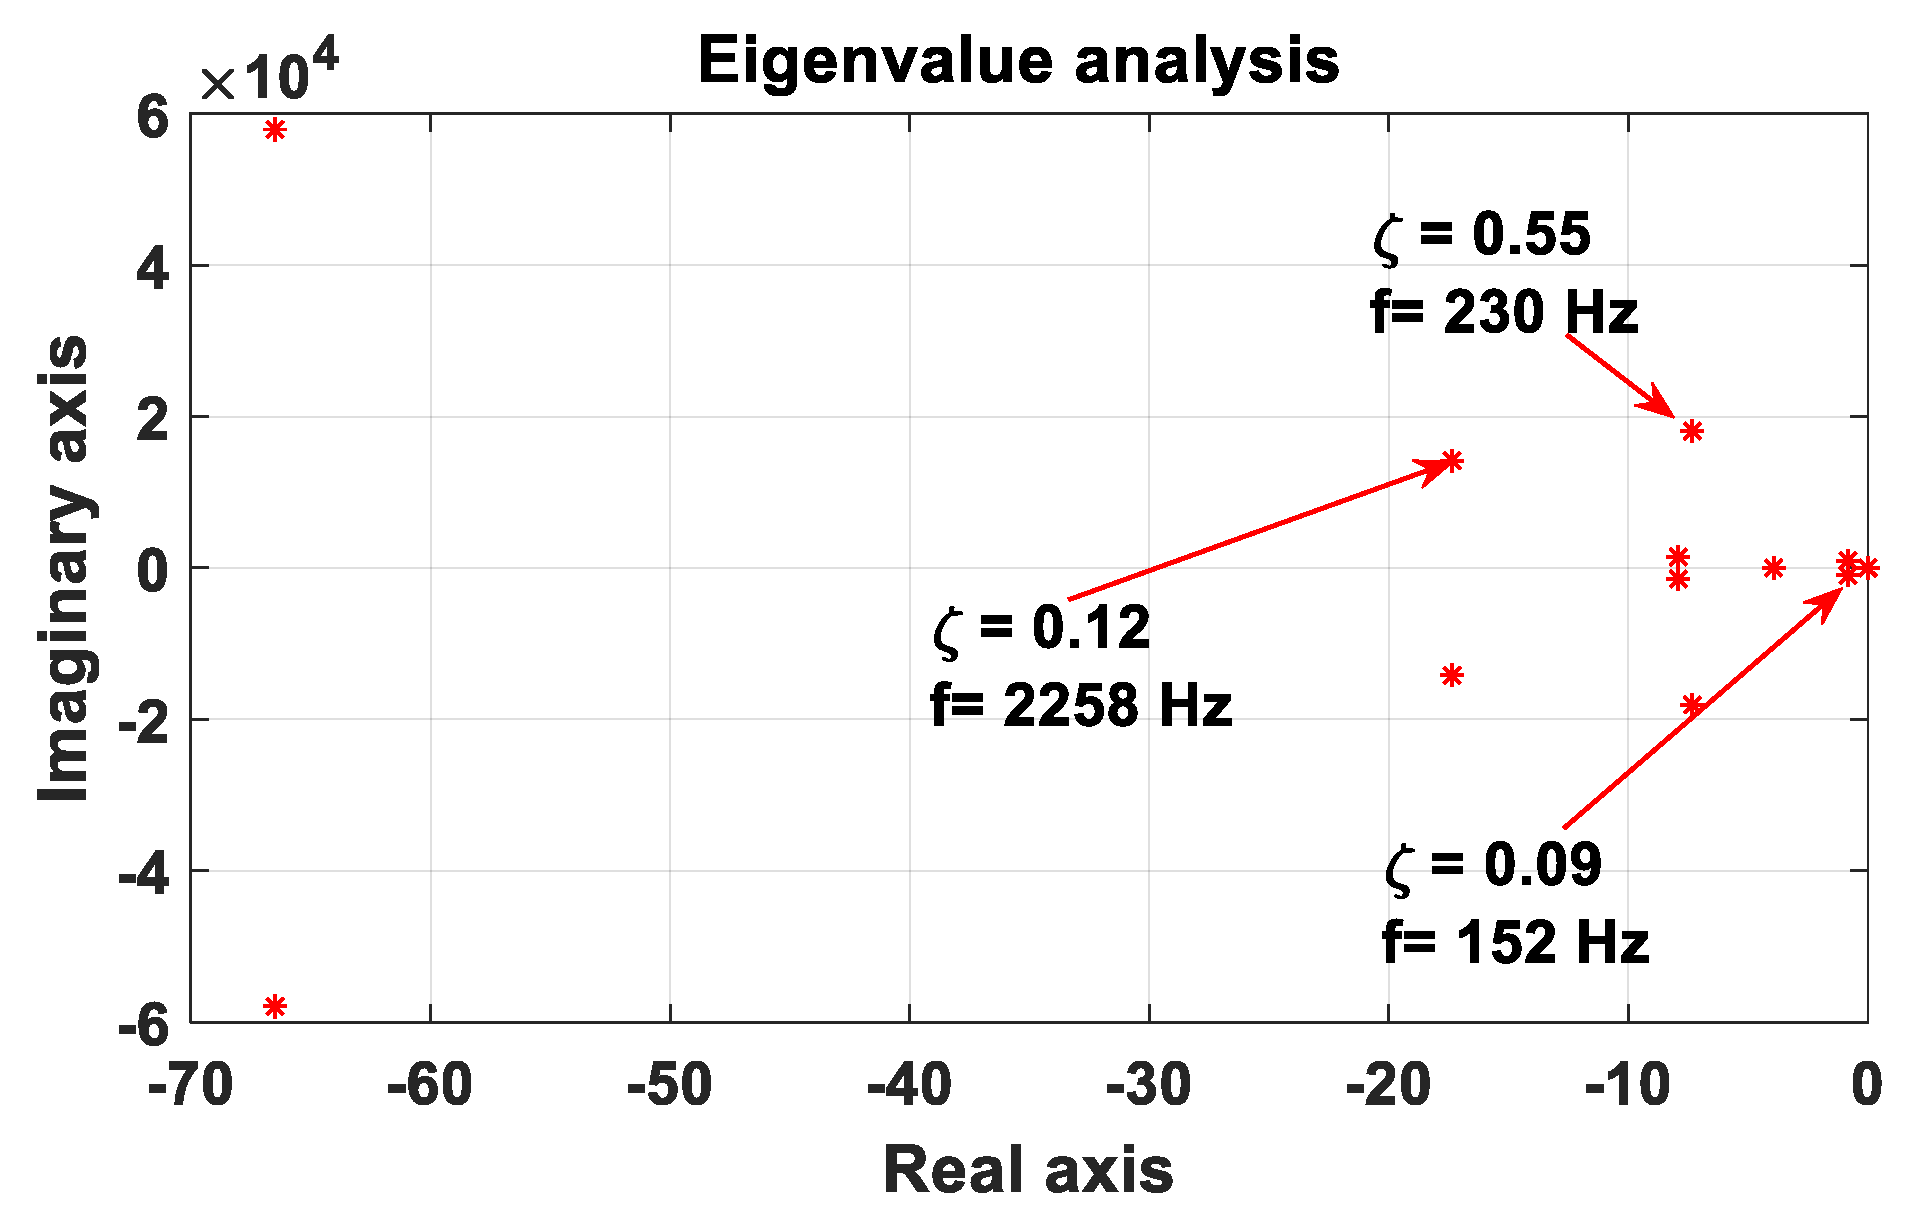
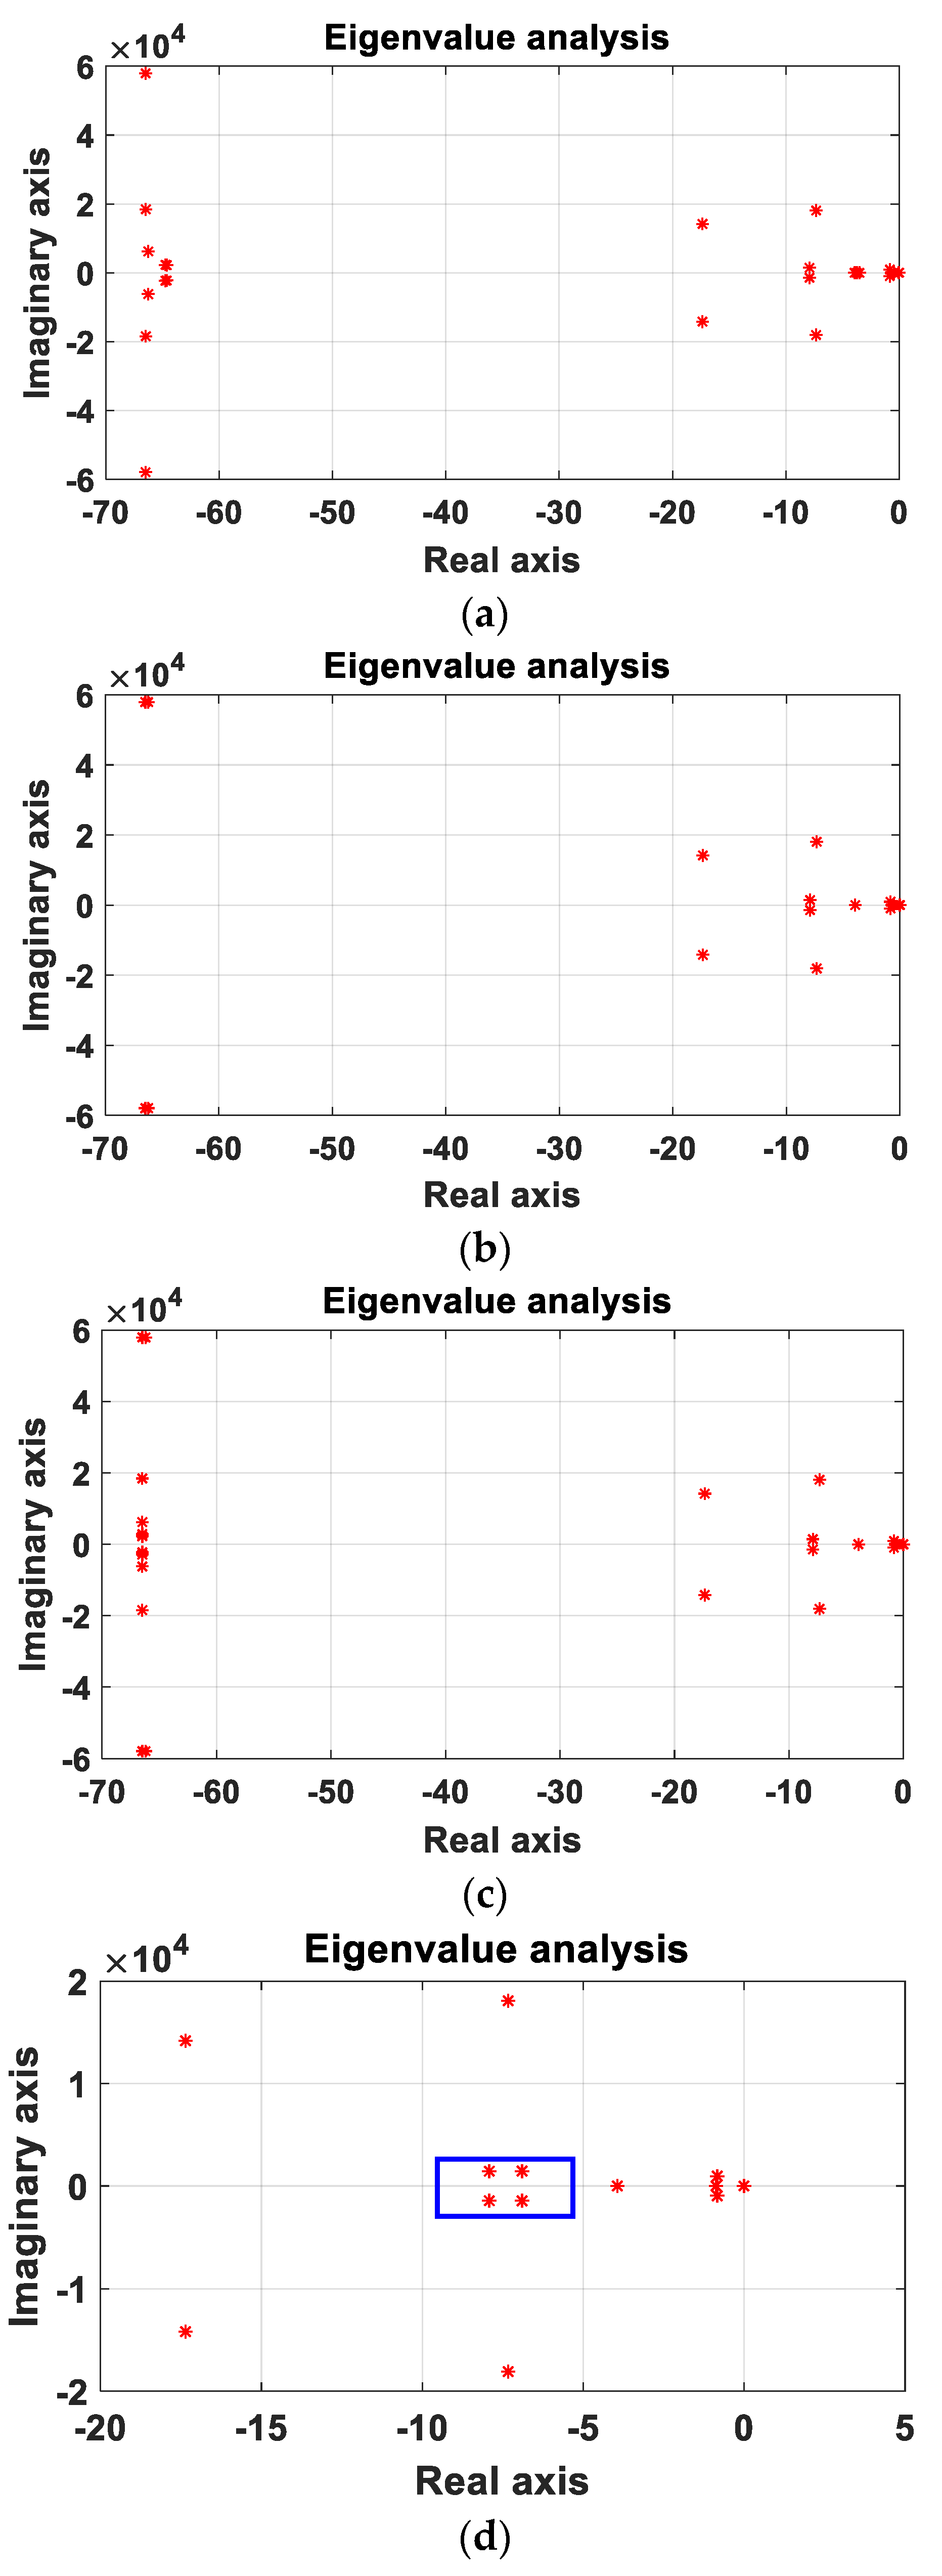
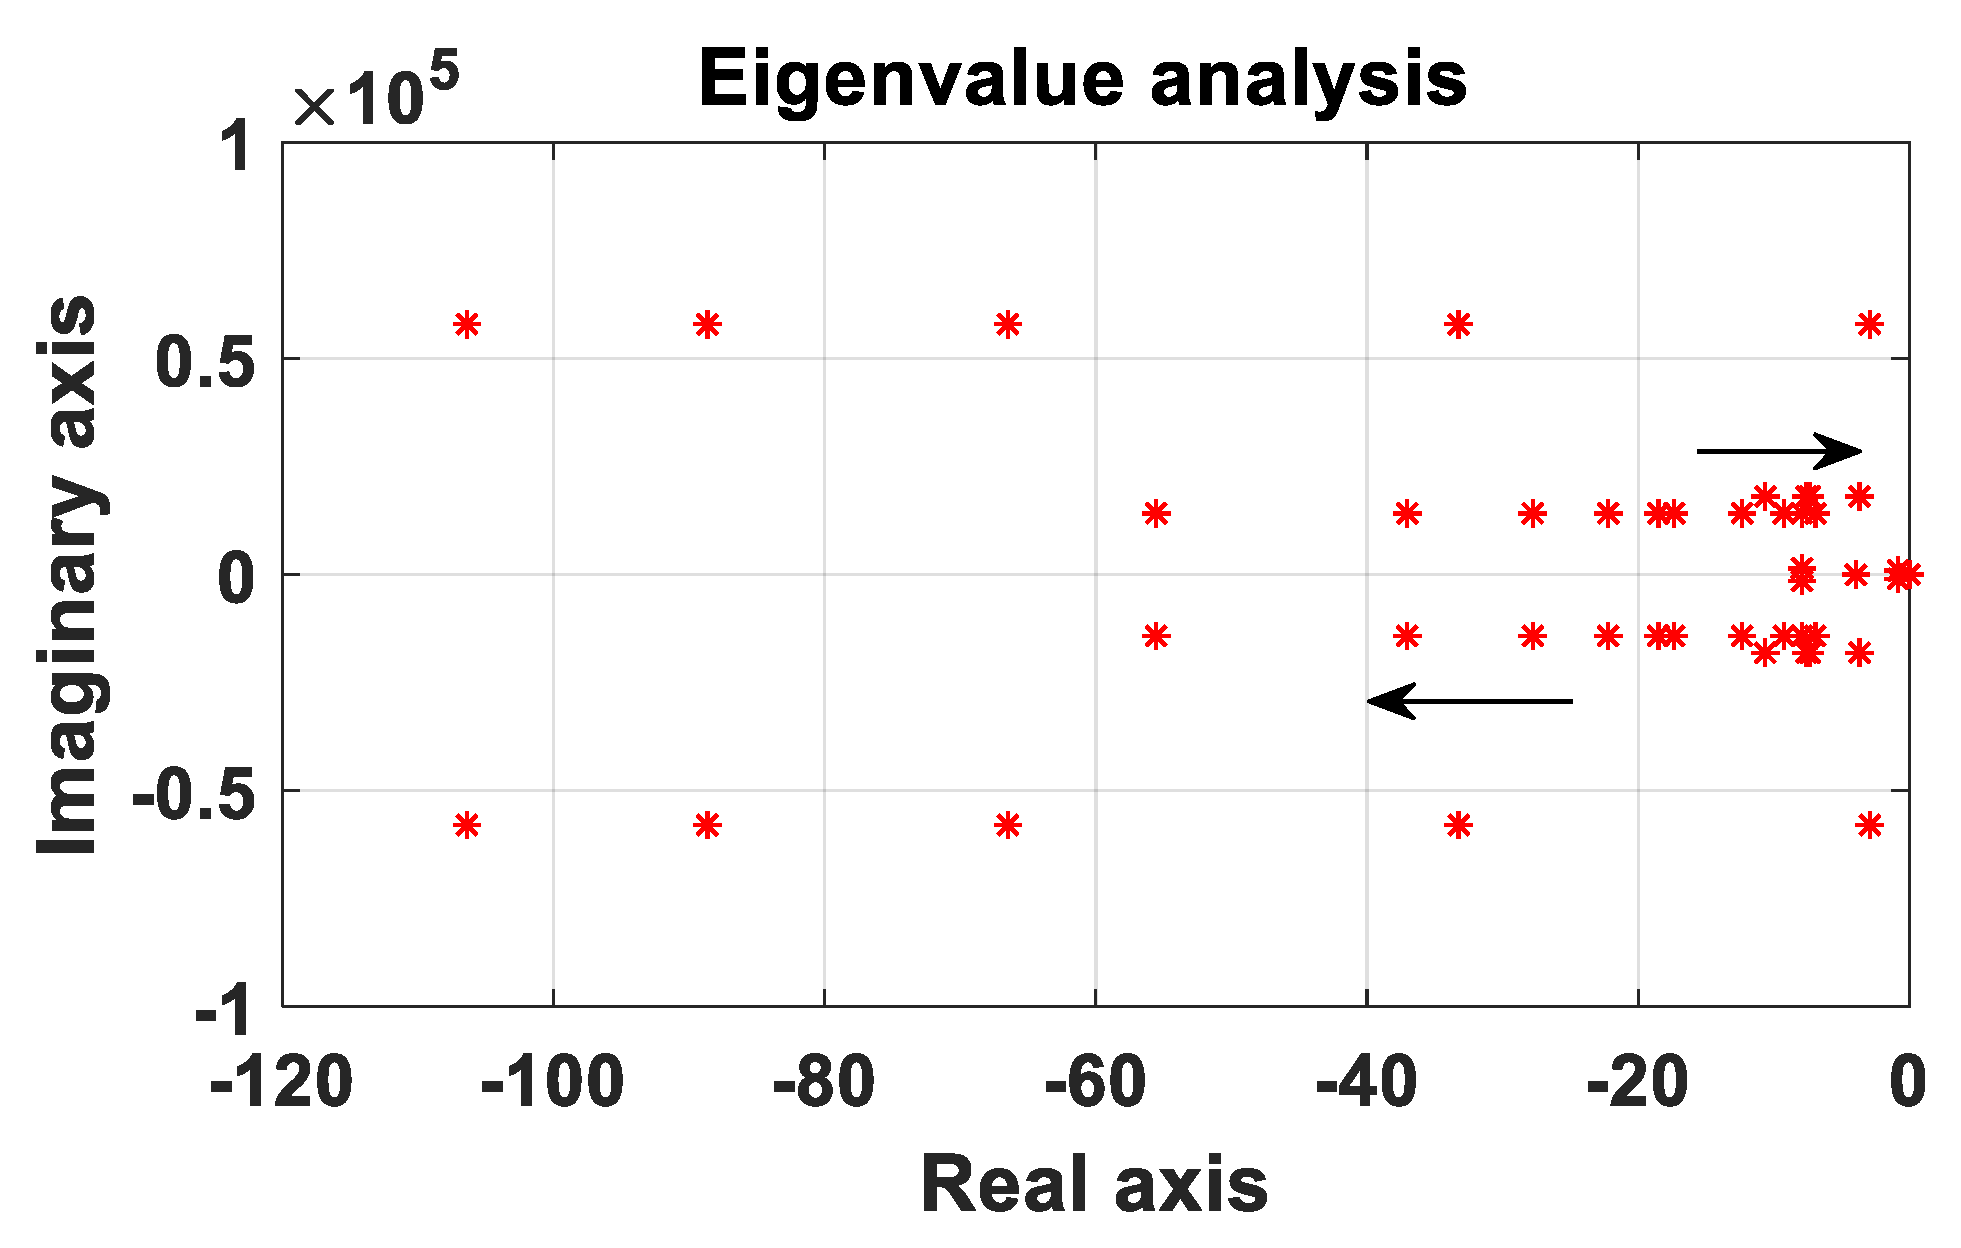
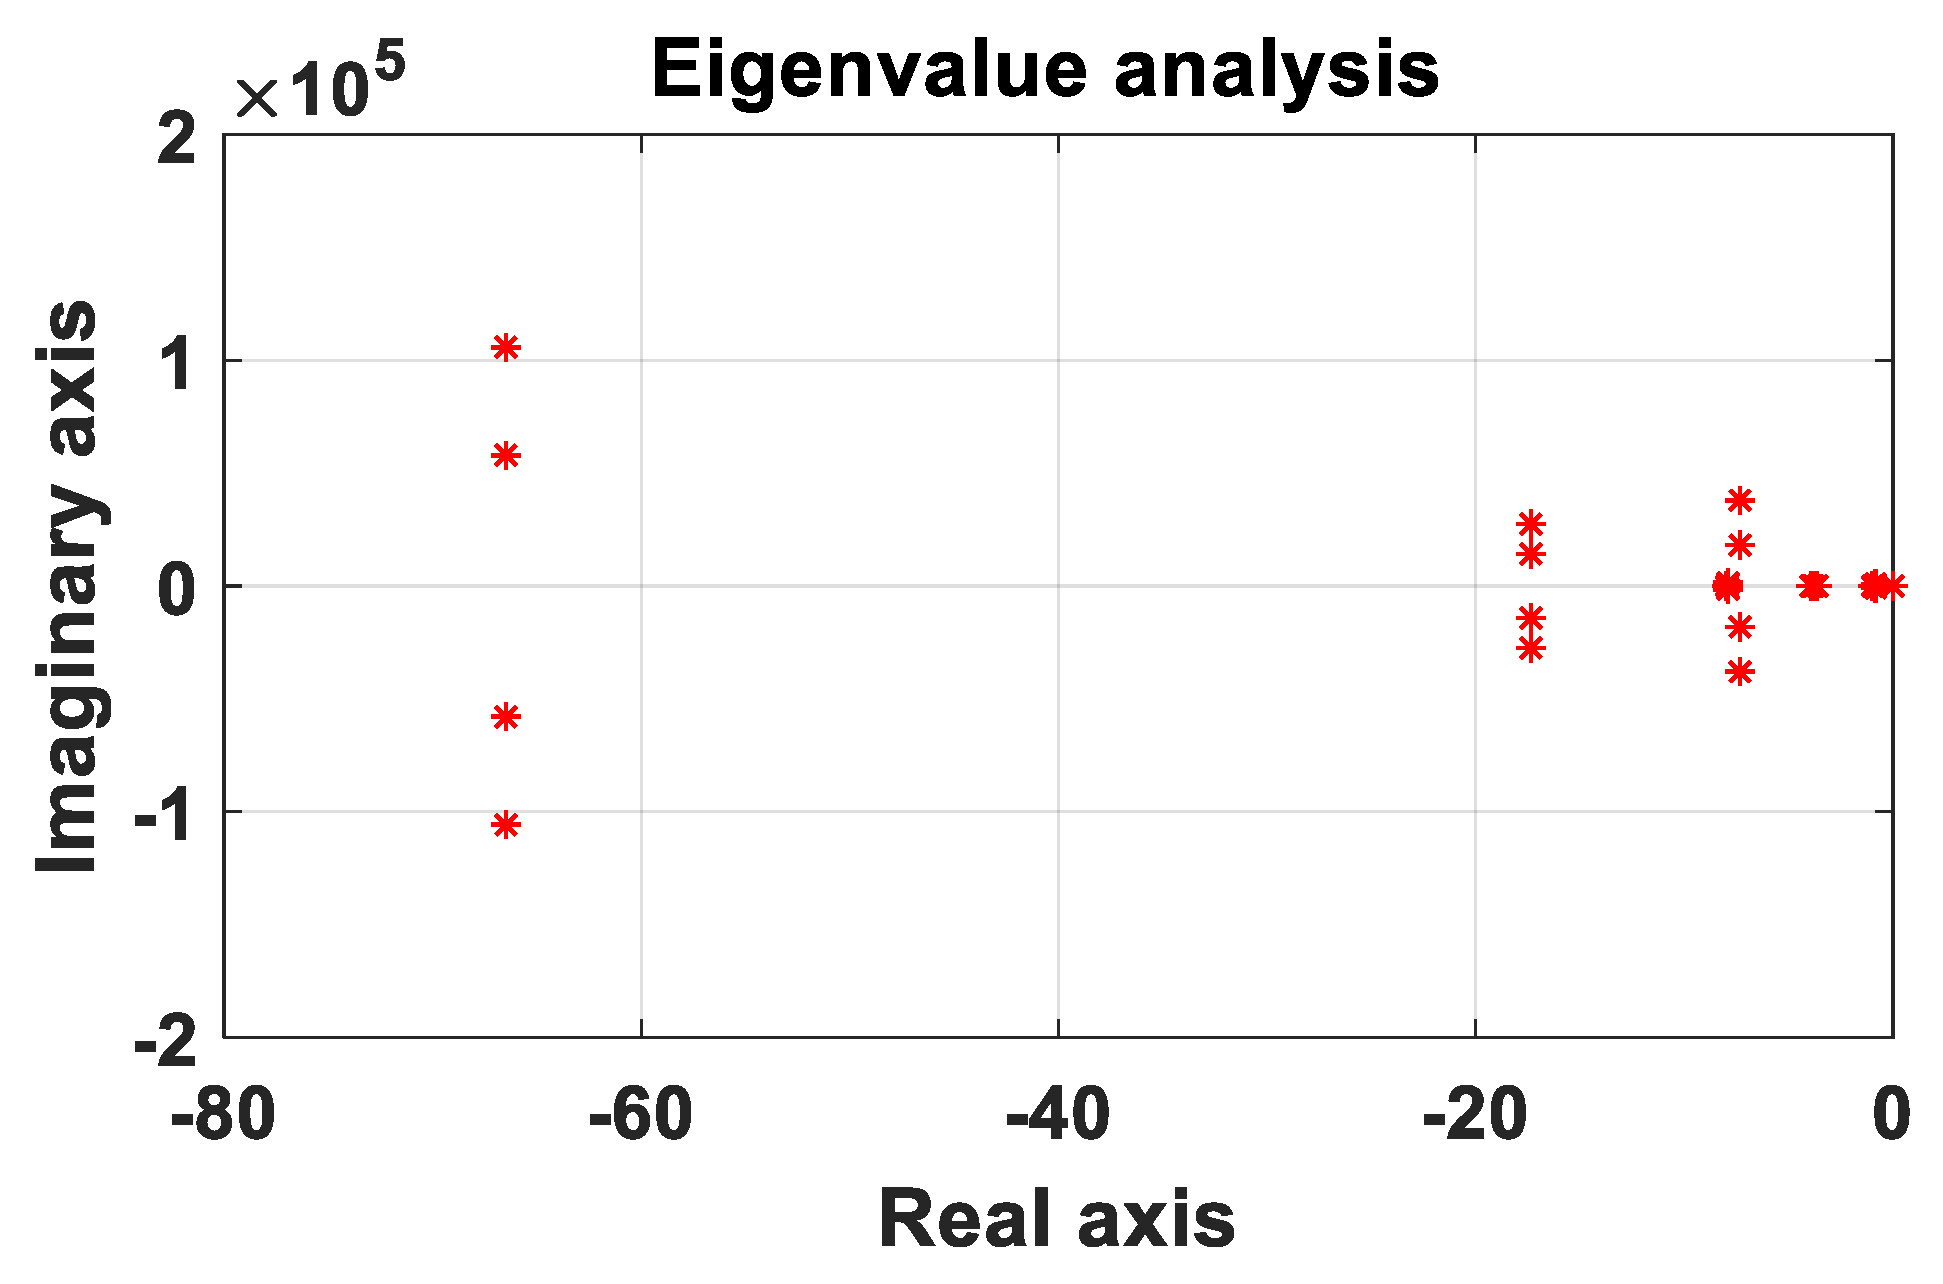
4.2. Eigenvalue Analysis

This section presents the eigenvalue-based approach to identify the critical modes and the associated modal characteristics in the DC microgrid. To find out the source of the problem, interaction among controllers and devices as well as the detailed investigation produced by the eigenvalue analysis has been conducted with cross participation factor. Table 5 shows the frequency of oscillations and damping ratios of oscillatory modes in the DCMG. The HF oscillation of the weakest mode (λ1) was found with 153 Hz and a damping ratio of 0.09, as shown in Figure 4. Hence, it is assumed that the critical mode might move further right in the s-plane and reduce the stability margin of the system with the variation in the system parameters. Subsequently, a participation factor analysis has been conducted to see the modes and associated devices that contribute to the modes, as presented in Table 5.
From the participation factor analysis, it is found that the 152 Hz and 230 Hz modes are contributed by the two boost converters. The HF modes (e.g., 2878 Hz, 9224 Hz, and 2258 Hz) are contributed by the three buck converters. Consequently, to see the system sensitivity against small changes in the parameters, a detailed sensitivity analysis has been conducted in the following subsections.

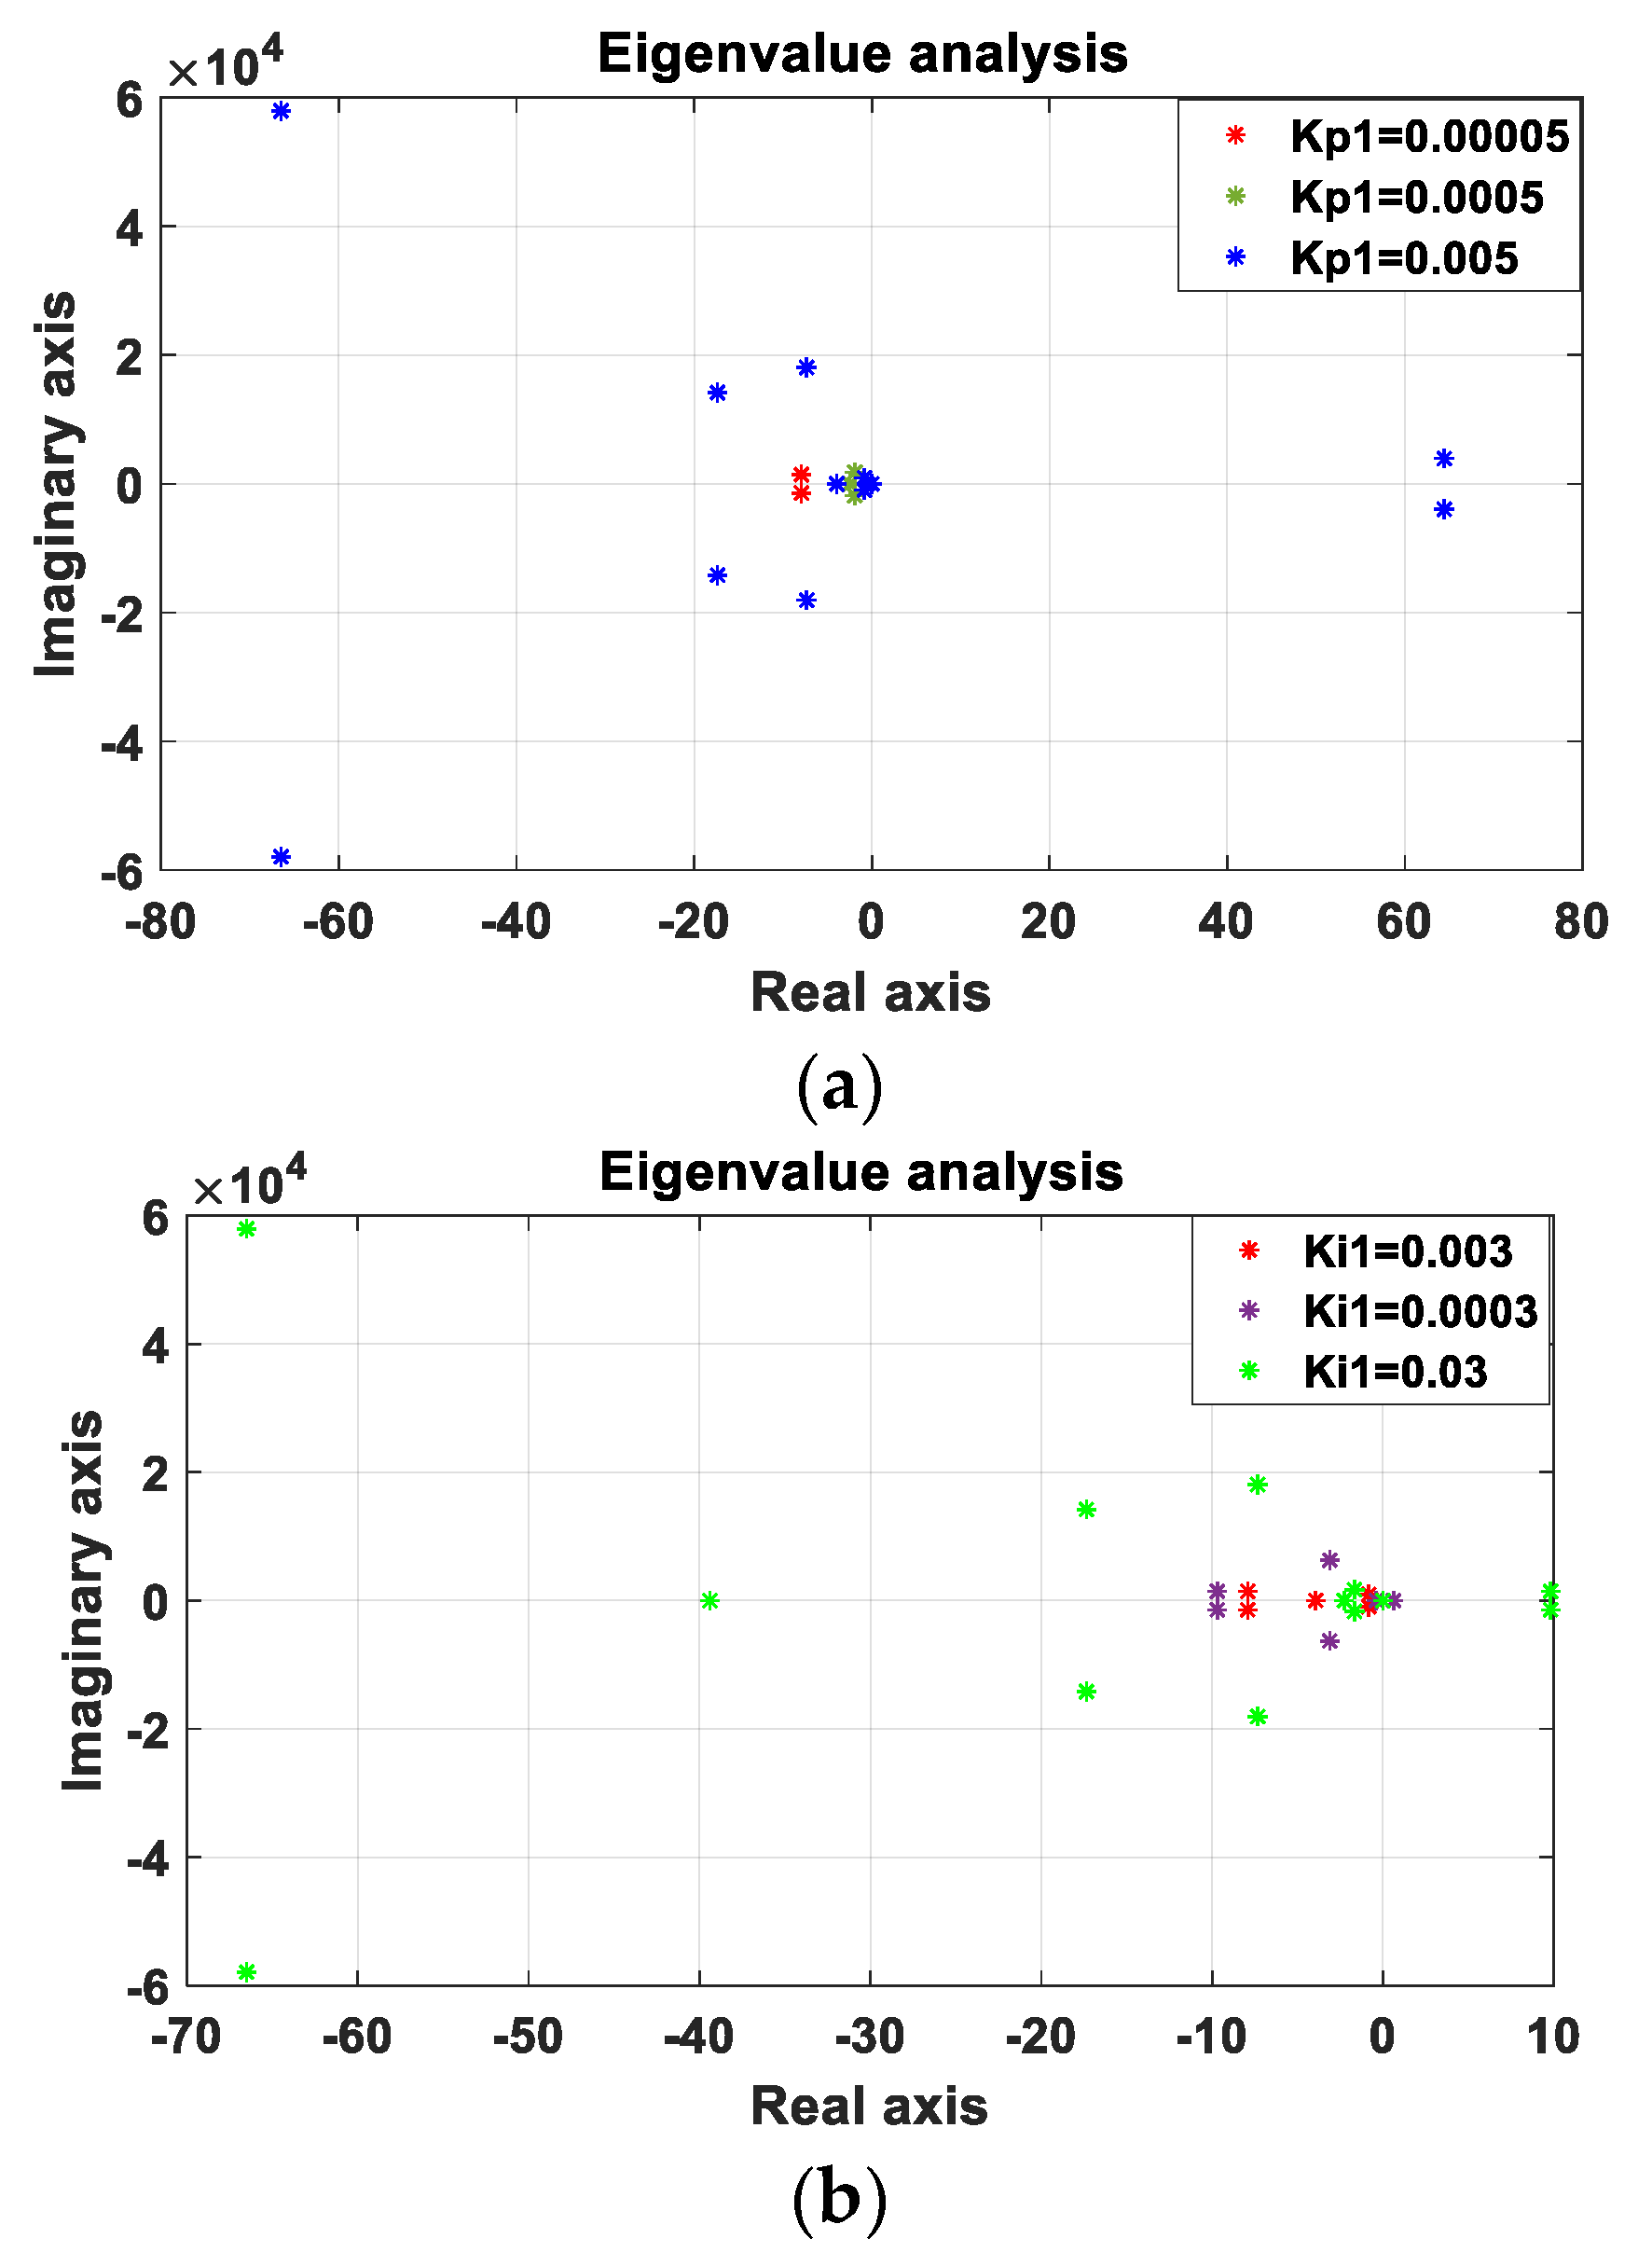
4.2.1. Case Study 1 (Parameter Variation in 12-kW Boost Converter)

In this case study, a small variation in the control parameters is made to the source-side boost converters. The trajectories of the sensitive modes are recorded and presented in Figure 5a–d. Figure 5a,b illustrate the root locus of the critical modes under the variation in the proportional gain of the 12-kW and 8-kW boost converters, respectively. As the parameter of the gain decreased, modes 1 and 2 moved to the right half-plane, which indicates the degradation of the dynamic response of the system stability. Trajectories of sensitive modes under the variation in the integral controller are presented in Figure 5c,d. In Figure 5c, mode 1 shifts to the right half-plane with the decrease in the integral gain. However, in Figure 5d, an interesting phenomenon has been observed. Increasing the value of the boost converter integral gain considerably influenced the eigenvalue movements. The imaginary parts of modes 1 and 2 become equal when boost converters are tuned at 0.003 pu and 0.0012 pu, respectively. The 230-Hz oscillation frequency has been observed during the interaction point. Hence, the interaction between these modes occurred. The interaction event might lead to the system being in an unstable situation. It is an indication of resonance conditions, which may deteriorate the stability margin of the system. From the results, it is evident that the system is very sensitive to the parameters of the PI controllers. Furthermore, it is evident that the proportional and integral parameters of the boost converter should be tuned between 0.00005 to 0.005 pu and 0.003 to 0.03 pu, respectively. It is also observed that the system stability margin deteriorates with the larger value of the proportional and integral gains.

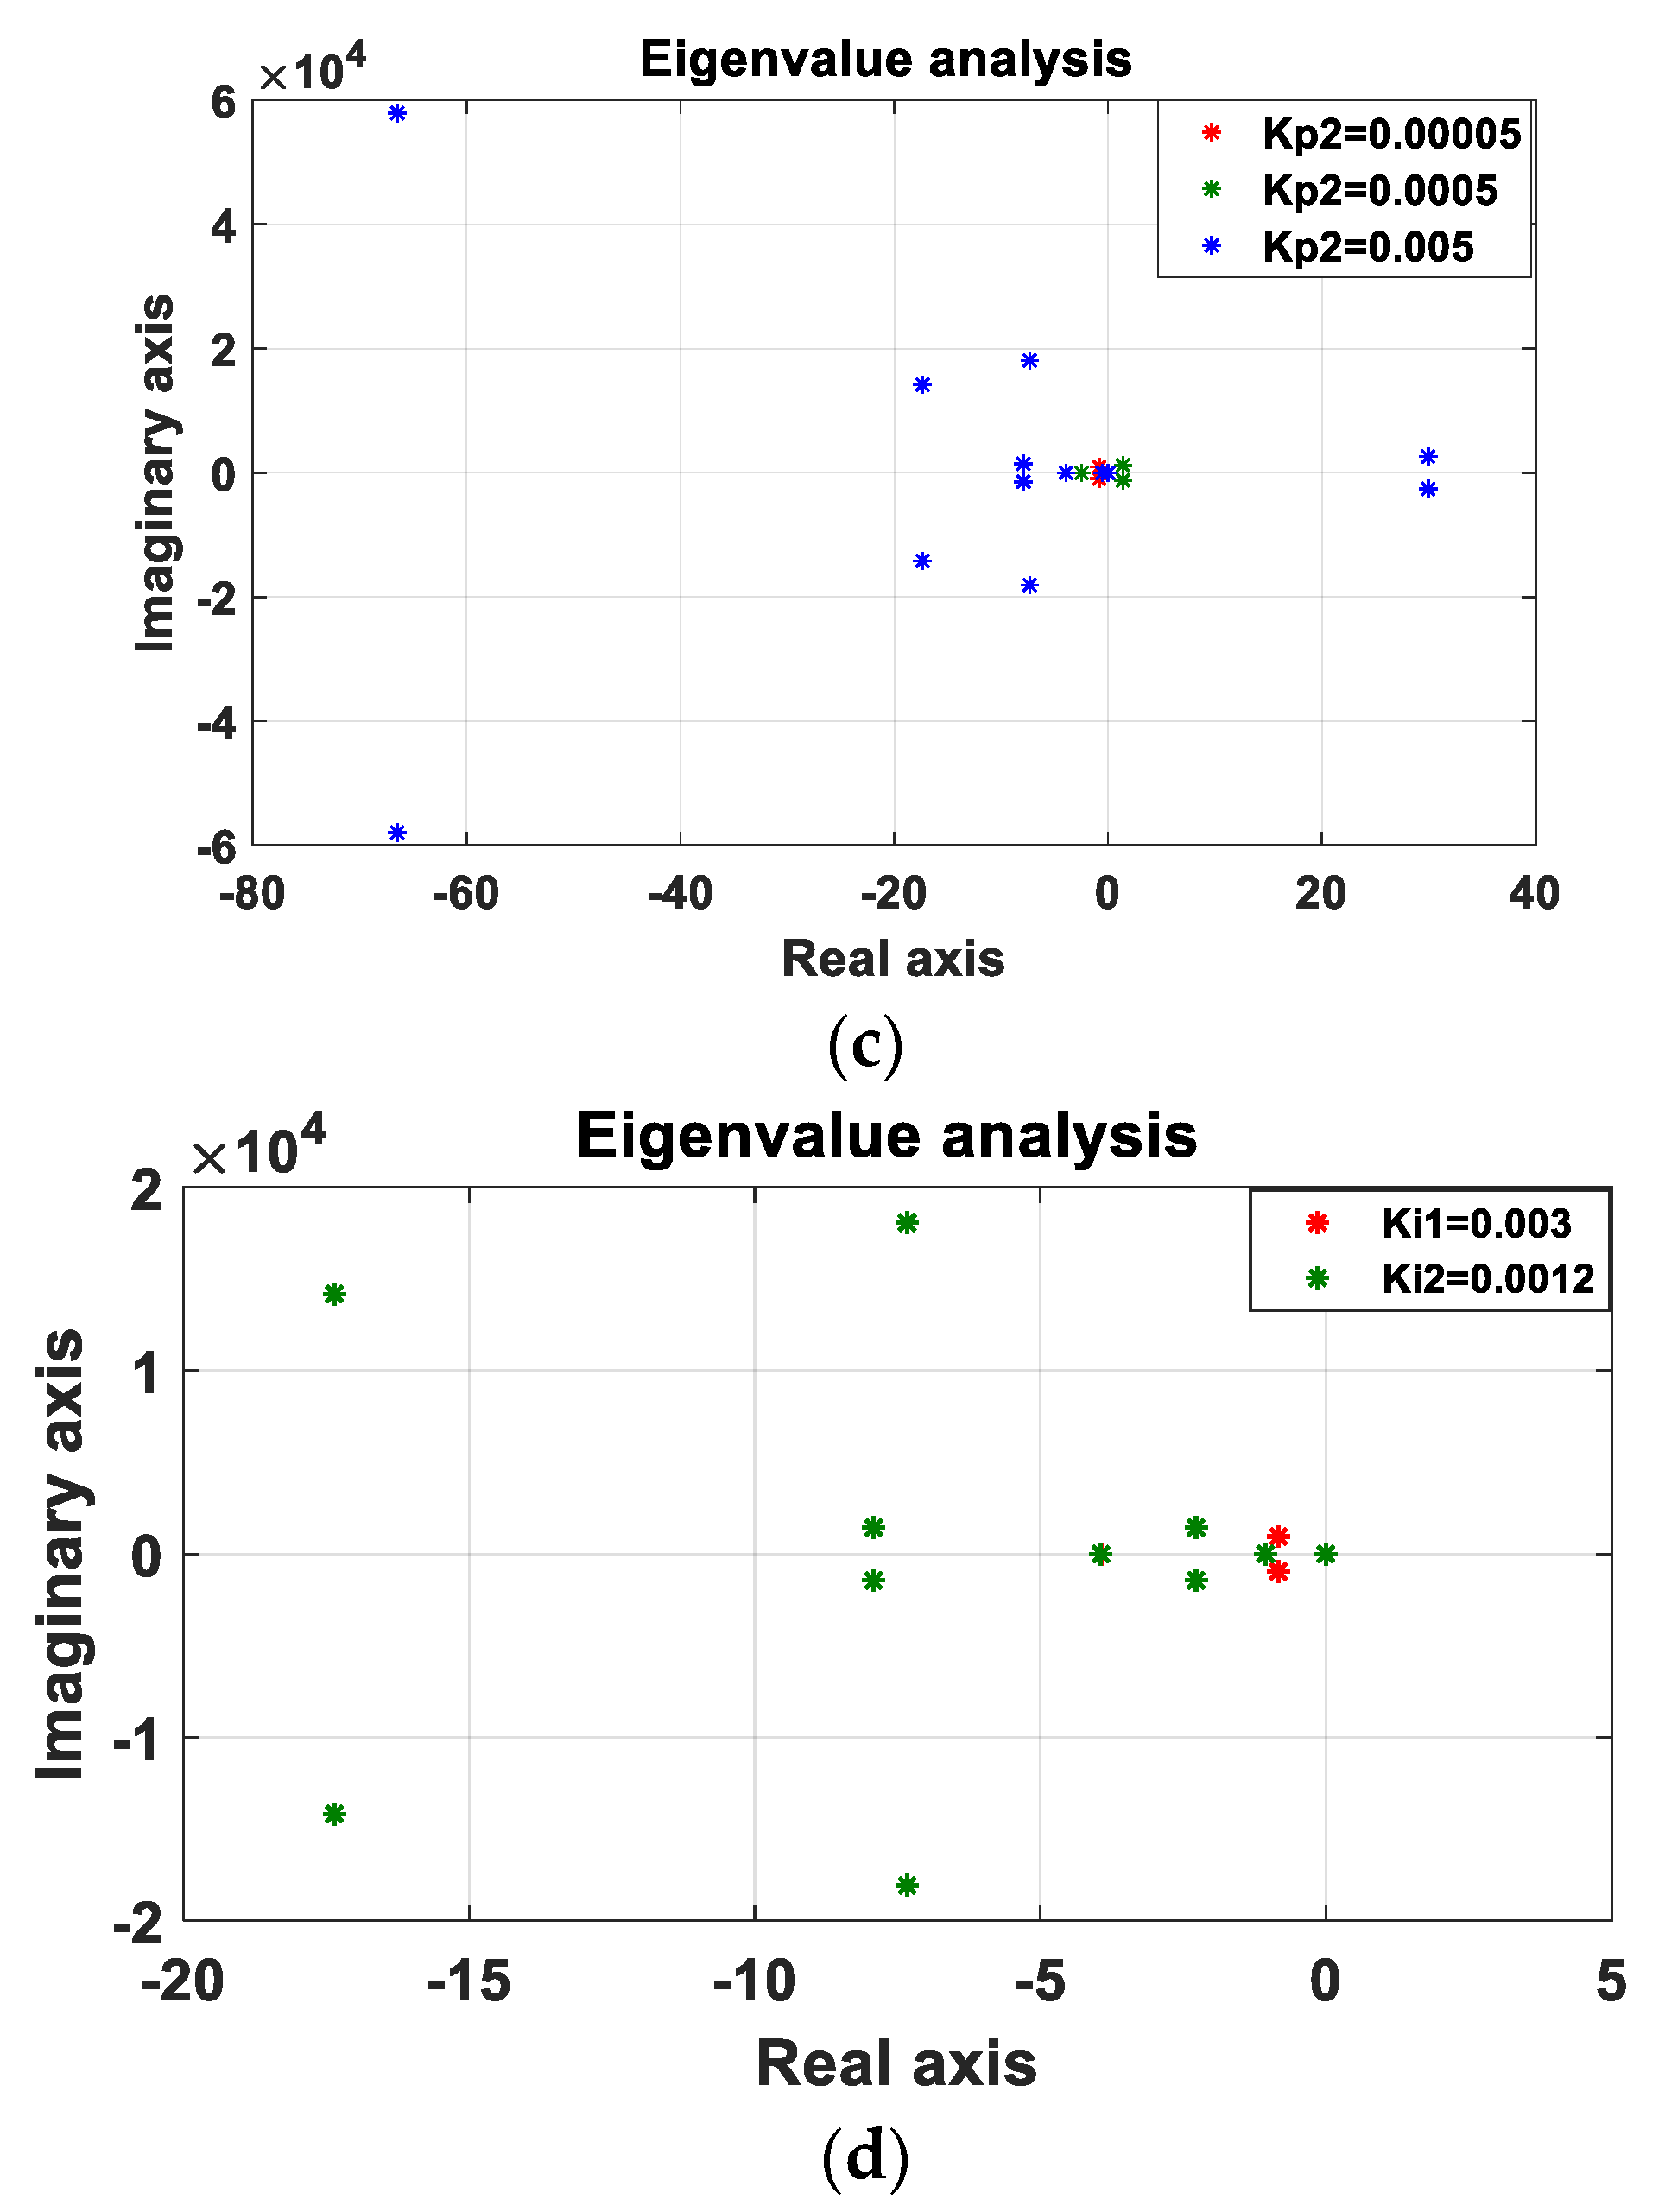
4.2.2. Case Study 2 (Parameter Variation in Buck Converter)

This case study investigates the sensitivity of the individual and multiple units of buck converter gains on the stability of the overall DC microgrid. A small variation in the PI gain has been considered for this case study. Figure 6a–c present the root loci due to the variation in the proportional and integral gain separately and concurrently. Under the variation in the proportional and integral gains of the buck converter, the eigenvalues are found in the stable region. However, the incremental value of the proportional gain of multiple units of converters considerably influenced the movements of the eigenvalues, as given in Figure 6d. The imaginary parts of modes 1 and 3 become equal when the proportional gain of the buck converter is tuned at 0.0044 pu. An oscillation at a frequency of 230 Hz has been observed around the interaction point, as marked by the rectangular box. Hence, the interaction between these modes potentially occurs in the system.
Furthermore, as a result of the arbitrary selection of the control parameters, ( K i 2 = 0.0012; K p 4 = 0.0044; K p 5 = 0.0079), an interesting scenario can be observed, which is depicted in Figure 6e. Changes in the controller gain notably influenced the eigenvalues movements. It is also noted that the imaginary parts of modes 1, 2, 4, and 5 become equal when the converters’ integral gains are tuned at 0.0012 pu, 0.0044 pu, and 0.0079 pu, respectively. A 230-Hz oscillation frequency has been observed during the interaction point, as marked by a rectangular box plot. Hence, the interaction between these modes occurs in the system. The interaction event might lead to the system developing into an unstable situation. This is an indication of resonance, which can lead to the deterioration of the system stability. As can be observed, with the change in the PI controller parameters, the overall system becomes very sensitive, and the system becomes unstable as the eigenvalues move to the right-half plane.

4.2.3. Case Study 3 (Variation in DC-Link Capacitance)

The DC-link capacitor is a crucial part in connecting the PV/BESS systems as it acts as an electrostatic energy-storing device to release the energy at the time of the disturbances. The third case study is dedicated to investigating the sensitivity of the systems with respect to the variation in the DC-link capacitance. Figure 7 presents the stability margin of the system with respect to changes in the DC-link capacitance between 400 µF to 2700 µF. As can be seen, the eigenvalue with the 153-Hz mode slowly moves to the adjacent imaginary axis with the DC-link capacitance. The eigenvalue of the system moves to the right-hand side, and the system becomes unstable after 2400 µF. This study shows that in a converter-connected power system, an appropriate calculation of the DC-link capacitance by considering the stability analysis is very crucial. This investigation clearly shows the significance of the stability analysis before adding the converters and capacitor bank. Hence, it has been strongly proposed for its utility in industry to conduct a comprehensive stability analysis before adding any capacitor bank and power electronic devices into renewable energy-integrated DCMGs.

4.2.4. Case Study 4 (Variation in Load Power)

The fourth case study presents the stability of the overall system with respect to load changes. The ZIP load has been considered for the analysis. The assessment results are given in Figure 8. The load is varied with 5-kW steps. From Figure 8, it is observed that the eigenvalues gradually move to the left half-plane with the gradual decrease in the load. On the other hand, the eigenvalues slowly move adjacent to the imaginary axis with the increase in the load, but still stay within the complex of the left half-plane. Therefore, the system remains stable. Table 6 shows the load compositions and their impact on the overall stability margin. Based on the results discussed in this section, it can be concluded that changing the load compositions and parameters has little impact on the system stability.

4.2.5. Case Study 5 (Variation in Inductance Parameter)

The fifth case study is dedicated to investigate the sensitivity of the systems with the variation in the converter inductance between 1 mH to 4 mH. The eigenvalue does not move to the right half-plane with the variation in the inductance (see Figure 9). Overall, two sensitive modes to inductance change have been identified. One is 230 Hz, and the other one is 153 Hz. It has been noted that both the eigenvalue and impedance analyses detect 230 Hz and 2880 Hz of oscillation. However, in the impedance analysis, a high frequency, such as a reading of 9224 Hz, was not picked up. Some of the key results are validated in the time-domain simulation in the following section.

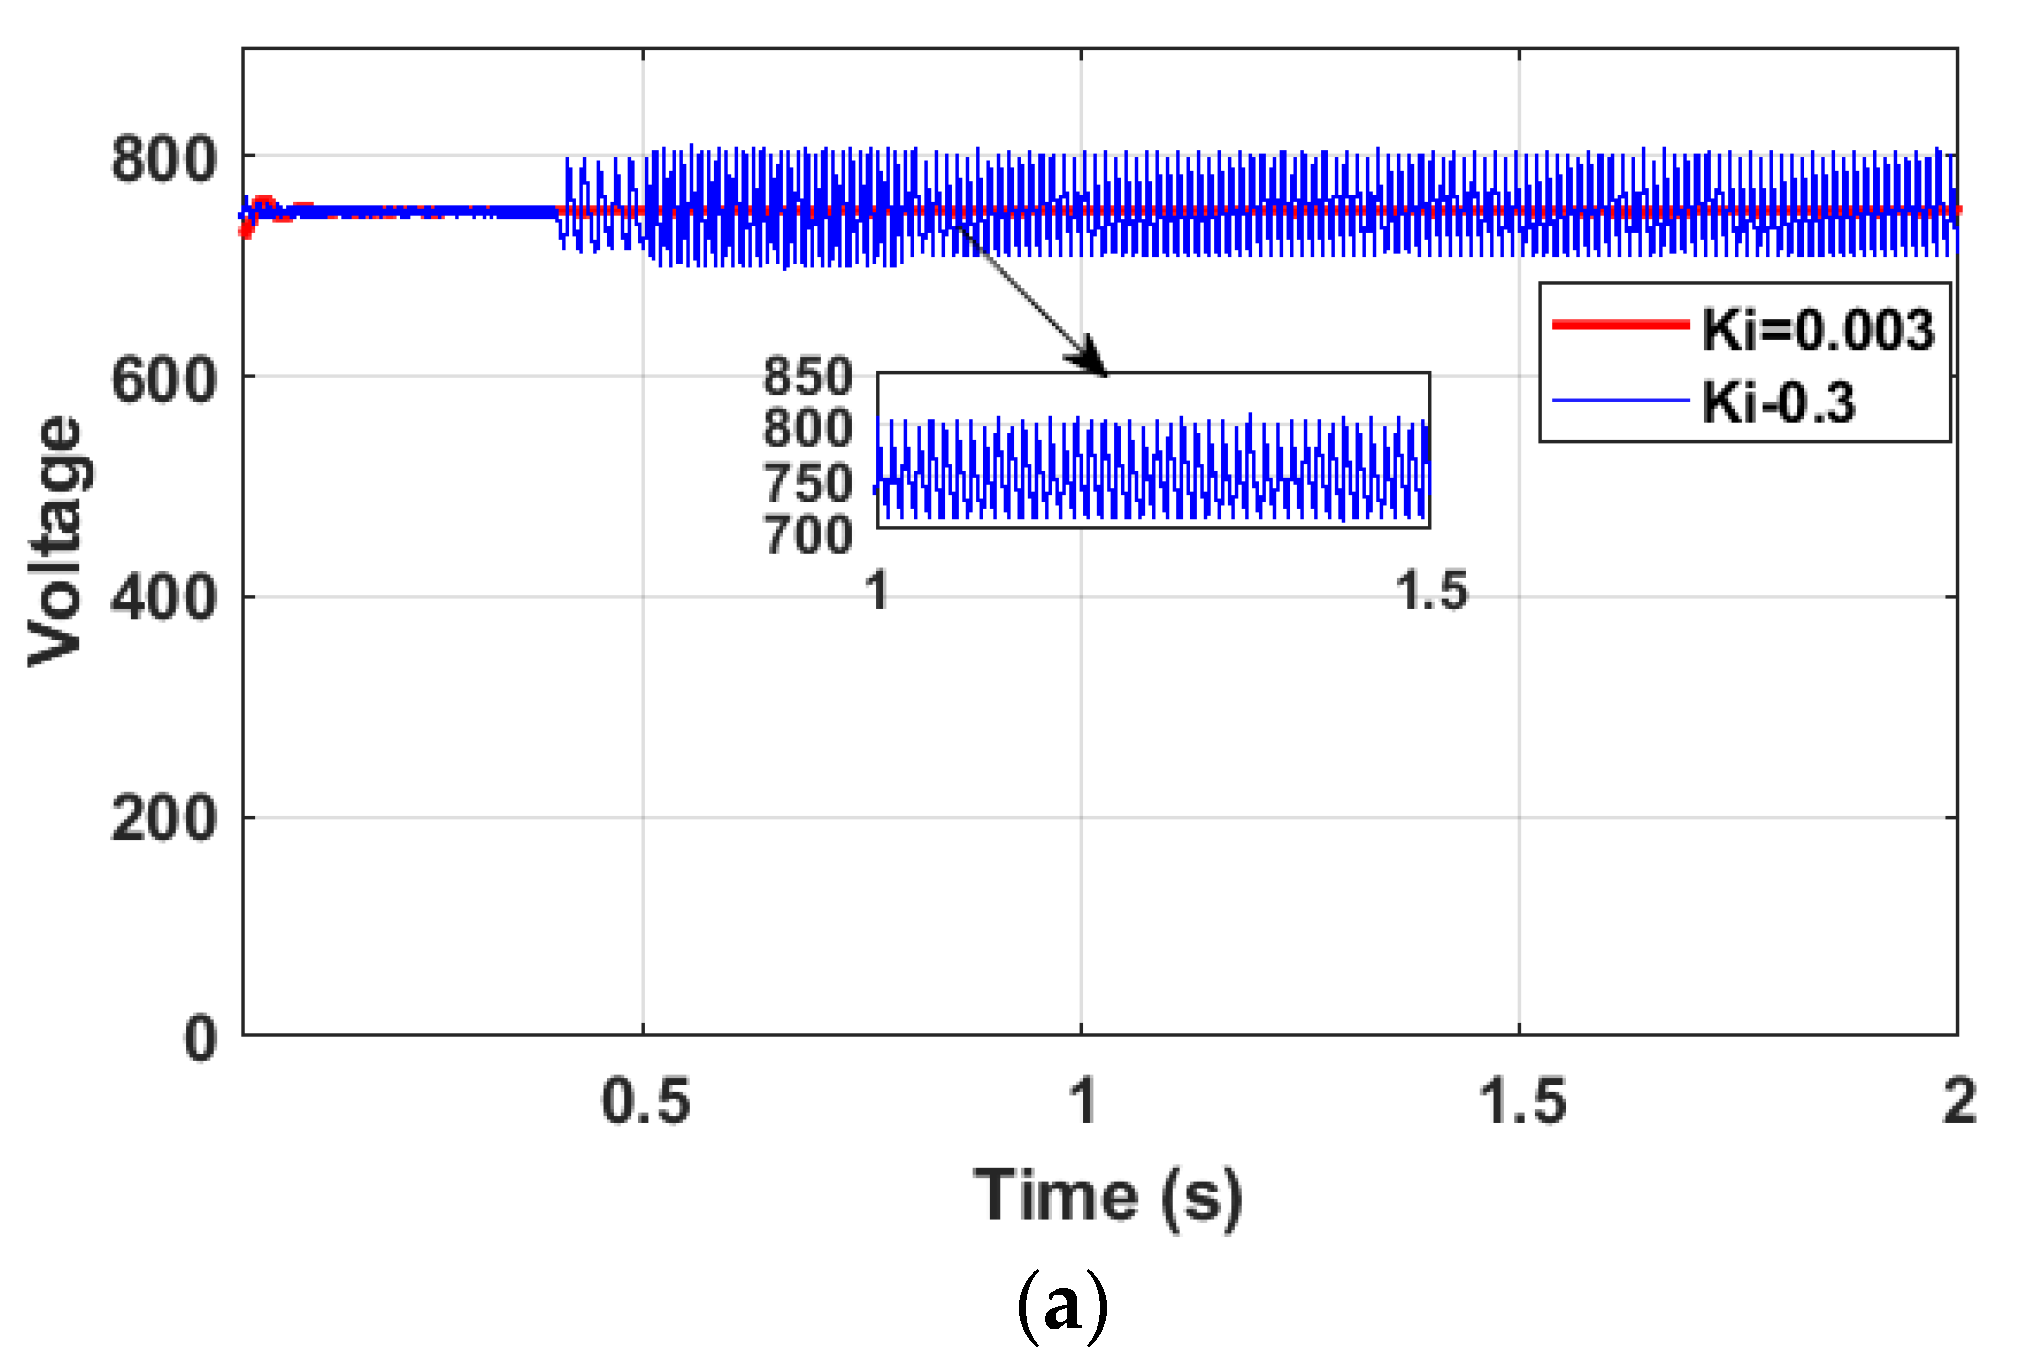
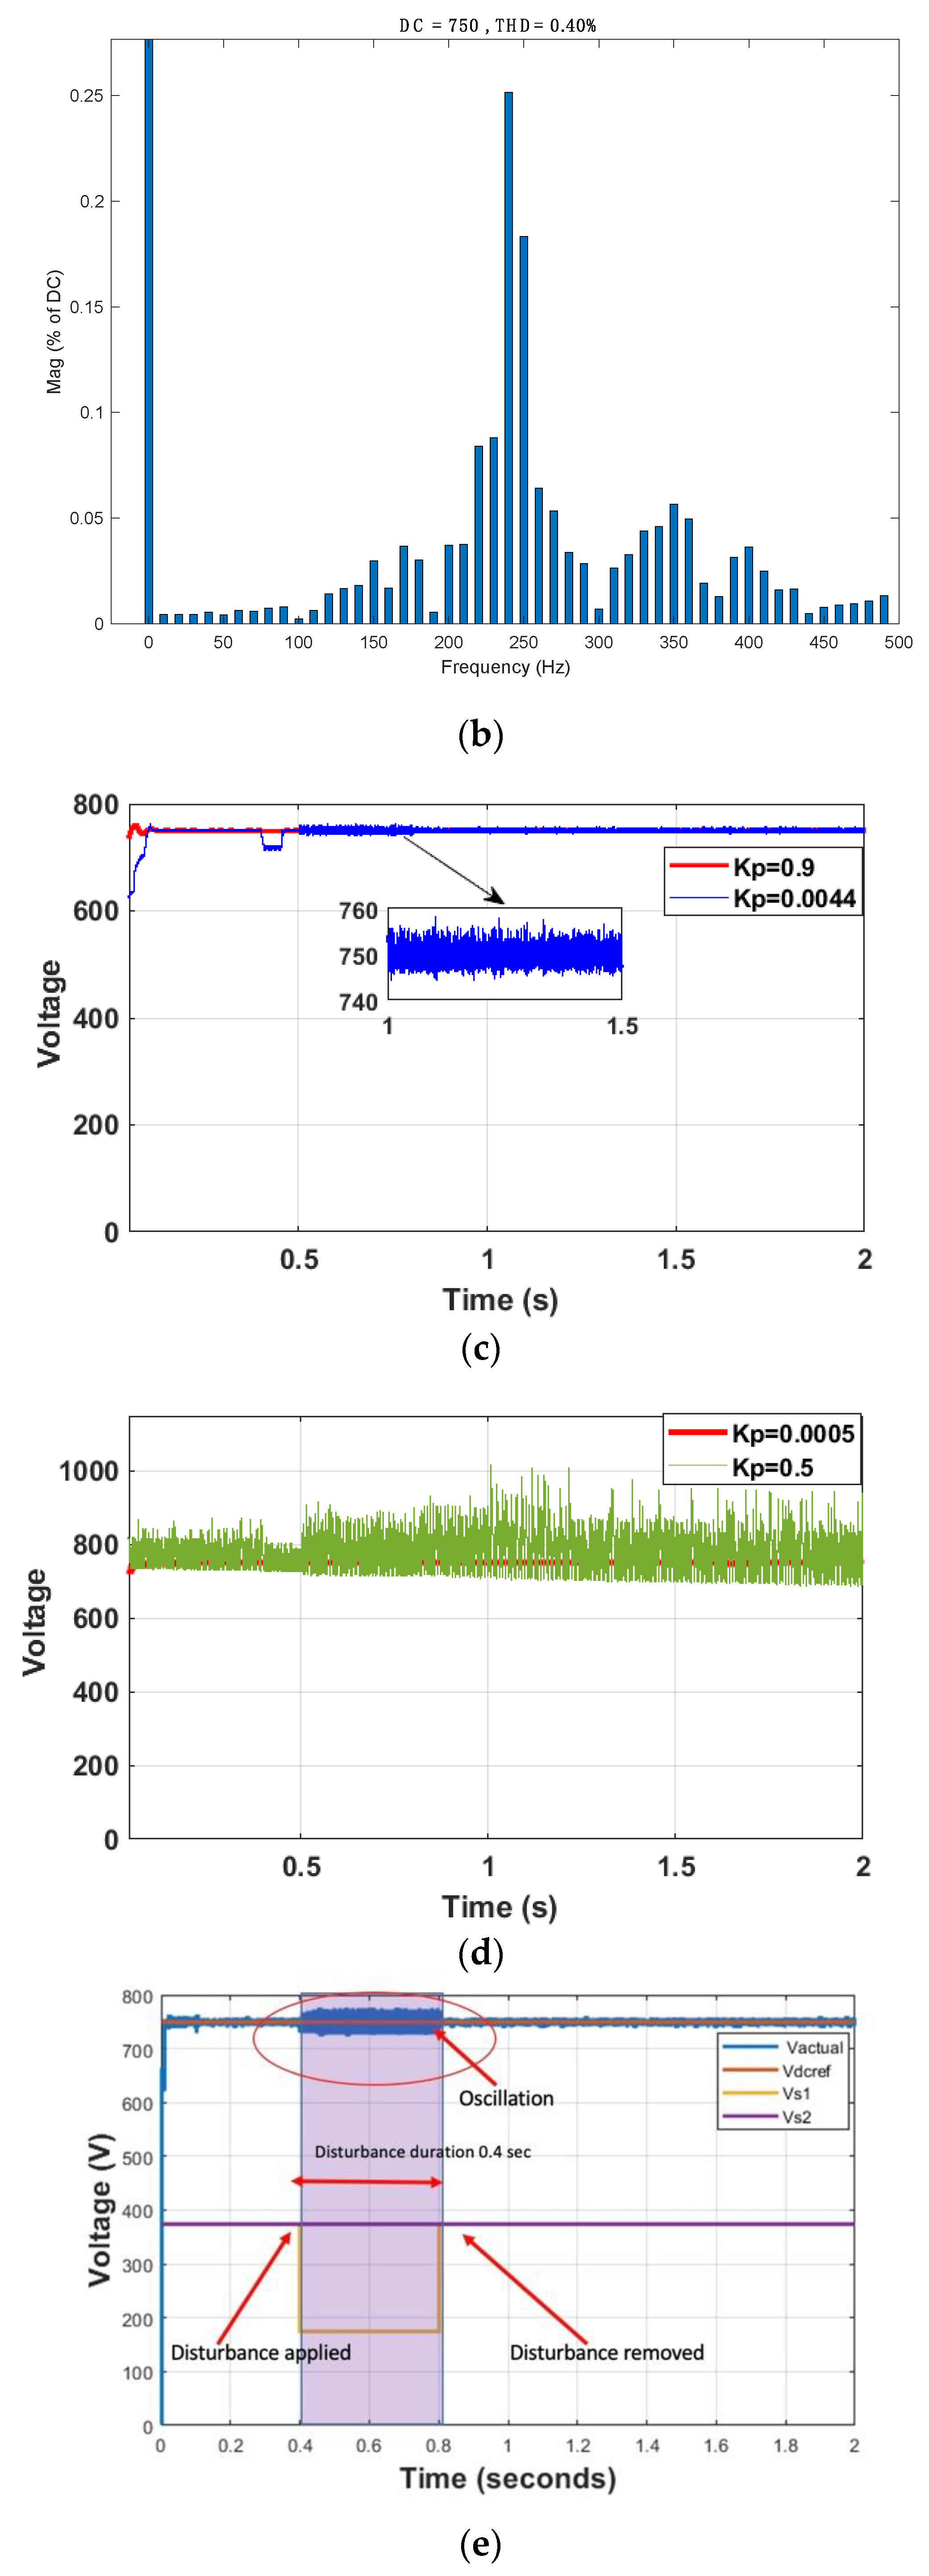
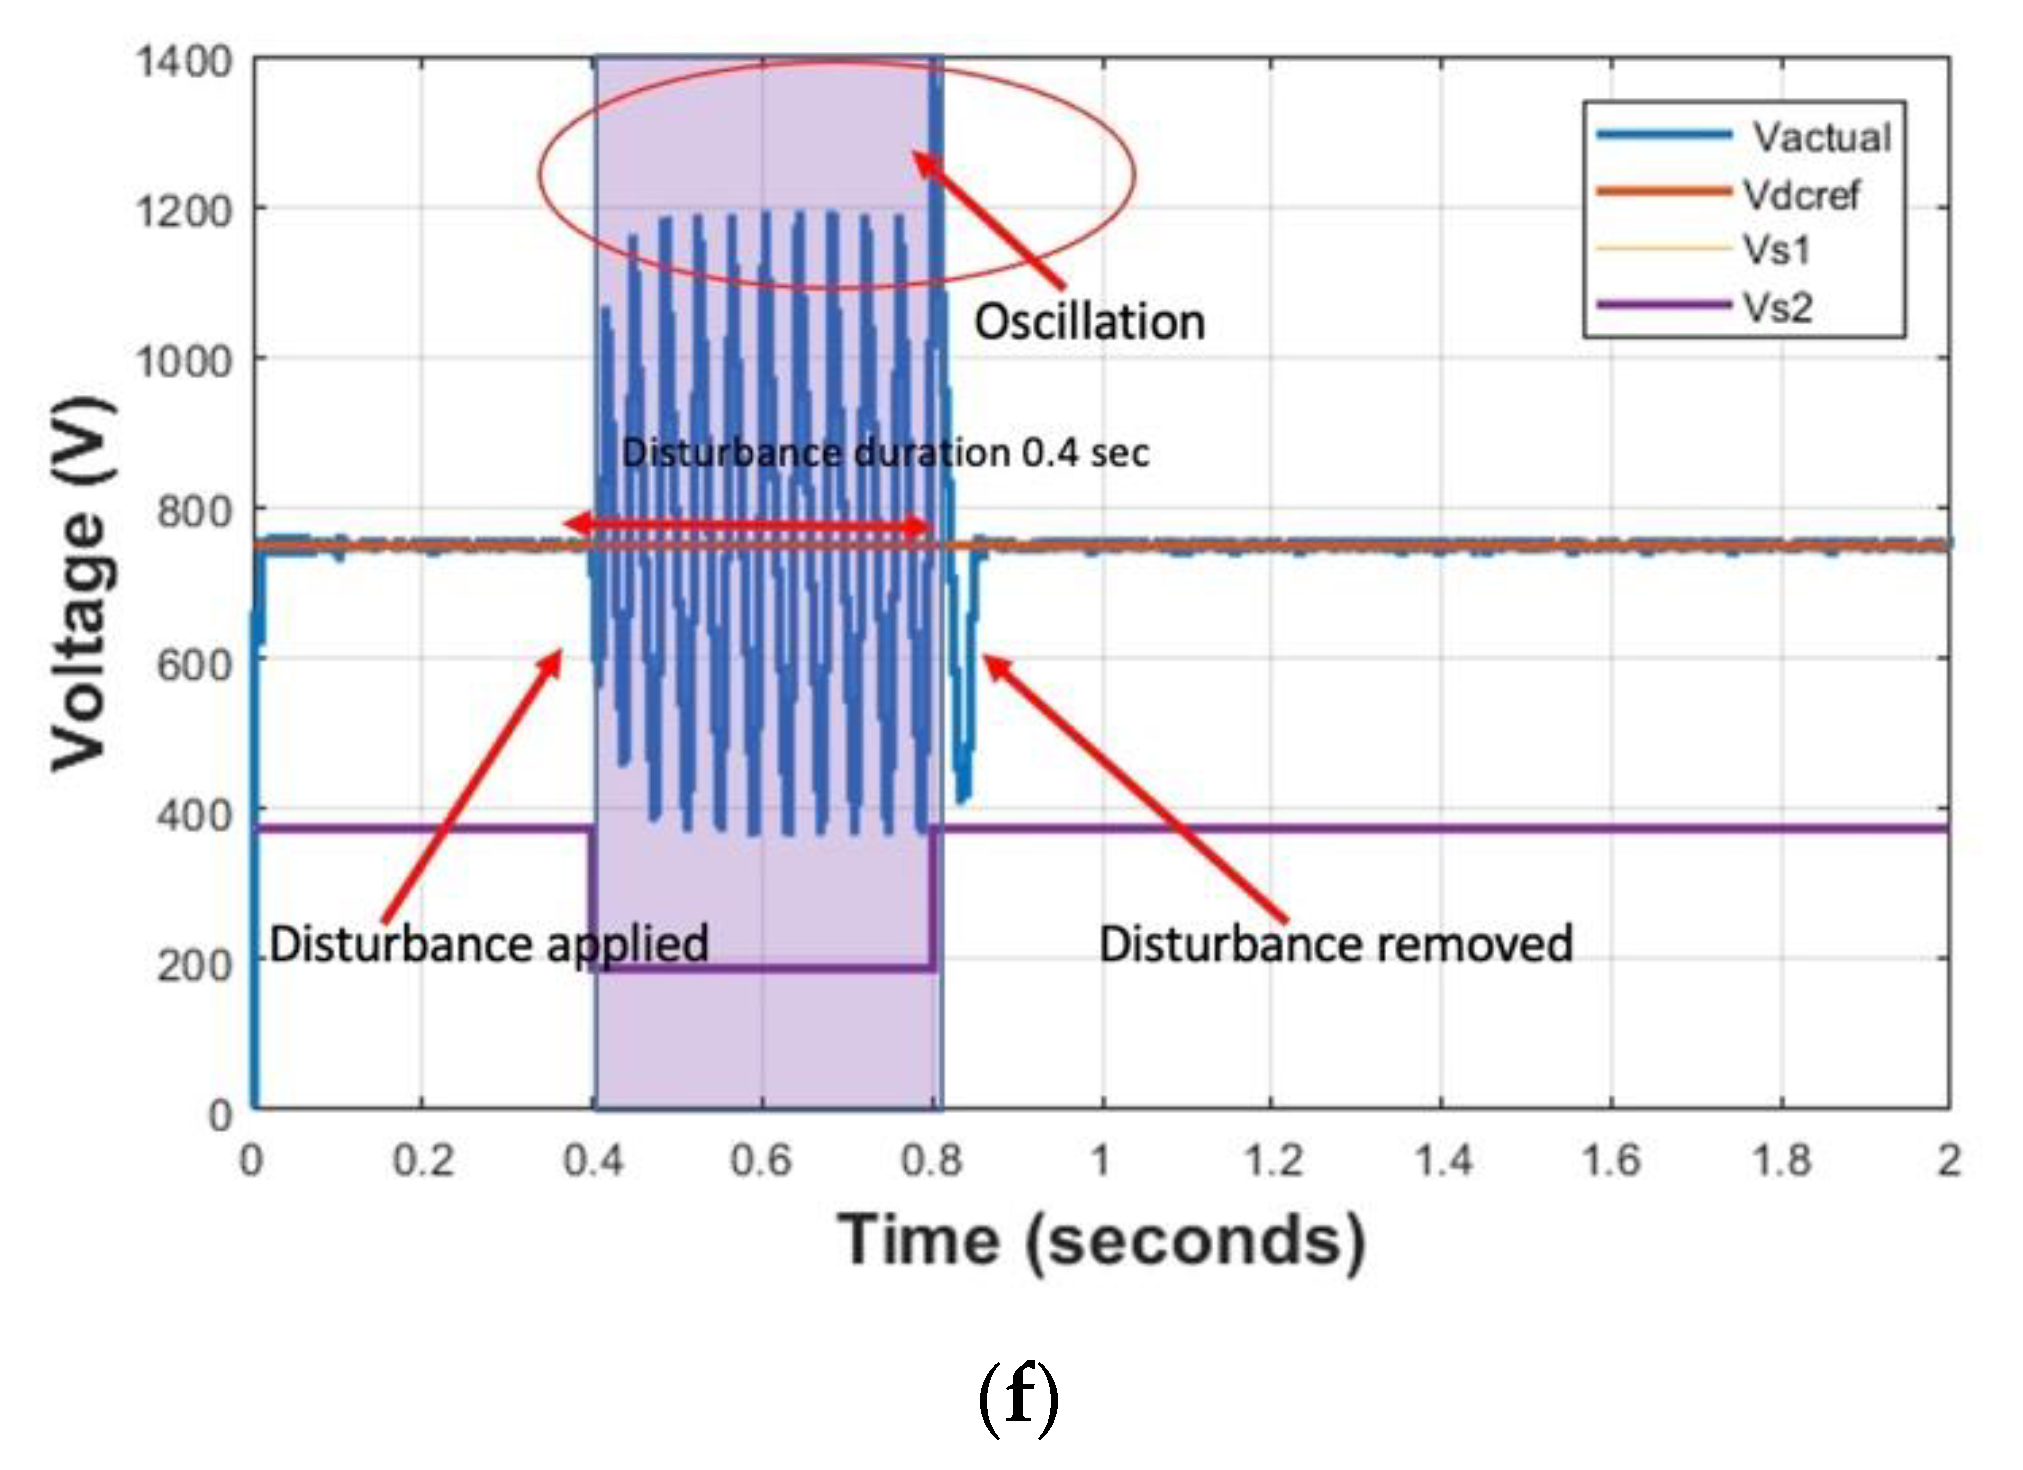
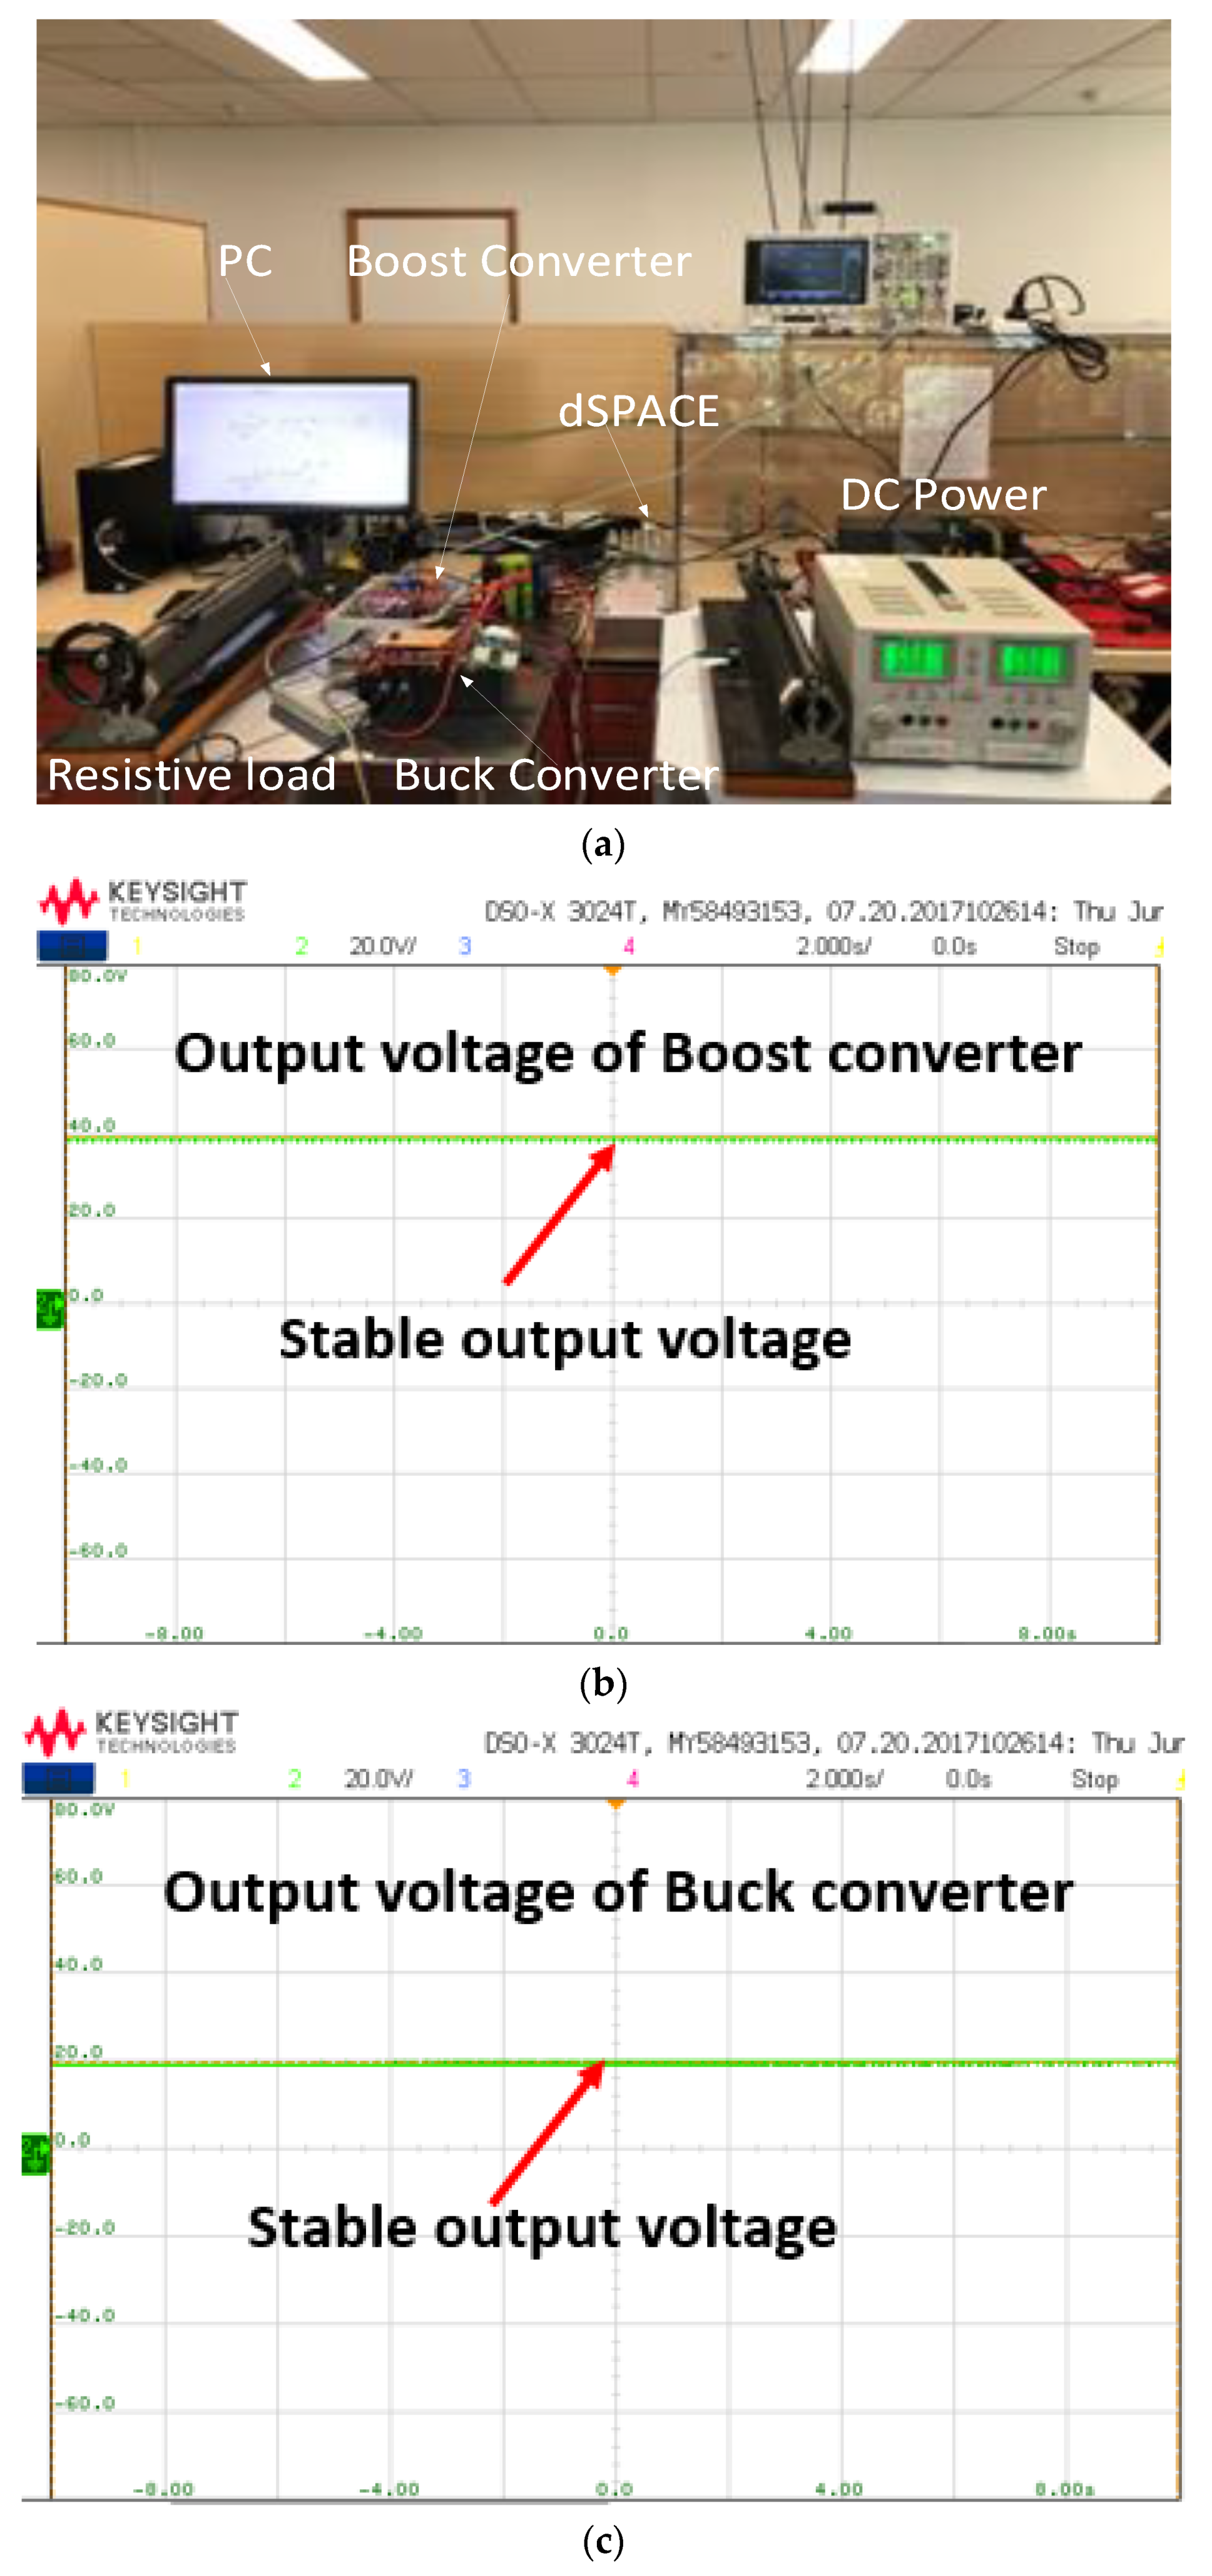
4.3. Time-Domain Simulations and Experimental Studies

The effect of the controller dynamics on a DC microgrid is visualized in a time-domain simulation, as given in Figure 10a–d. These results corroborated the previous steady-state analysis obtained using the eigenvalue analysis, as given in Figure 5 and Figure 6. Figure 10a presents the impact of the integral controller dynamics on the DC bus of the DCMG. It is observed that at an appropriate gain setting and an oscillation-free and stable DC bus voltage can be obtained, since, in this gain setting, the two sensitive modes and their oscillation frequency were far away from the imaginary axis. Hence, an oscillation-free DC bus voltage is observed. When the integral control gain is tuned at 0.5 pu, a continuous voltage oscillation has been found in the DC bus. At this gain setting, the eigenvalue moves towards the right half-plane. Therefore, the significant deterioration of the DC bus voltage is observed. Furthermore, an FFT analysis is conducted on the DC bus. A 240-Hz oscillation has been observed, as shown in Figure 10b. Likewise, a very similar scenario has been observed when the parameters of the buck converters are changed, as depicted in Figure 10c. In contrast, a different scenario has been observed when the proportional gain of the boost converter is tuned to 0.5 pu. In this setting, a continuous voltage oscillation is observed from the beginning of the simulation period, as presented in Figure 10d. Furthermore, to see the worst-case scenario, simultaneous disturbances have been applied both on the source side and load side. The recorded results are depicted in Figure 10e,f. Results show that with respect to the disturbances, a large overshoot along with a power oscillation is observed in the DC bus.
From the results given in Figure 10, it is observed that the DC bus voltage at the DC microgrid is very sensitive and becomes unstable due to small variations in the controller parameters and DC-link capacitance, which are similar to the eigenvalue results that are presented in Figure 5, Figure 6, Figure 7, Figure 8 and Figure 9. The impacts of the various parameters on the stability of the DC grid are investigated in the prior sections. However, from these analyses, it is difficult to identify the most critical parameters via cross-coupling various parameters and uncertainties. Therefore, a comparative ranking of the uncertain parameters has been investigated in the next section.
To understand the stability behavior in DCMG, a mathematical modelling, time-domain simulation, and hardware implementation are inevitable. However, capturing all the dynamics and interactions in a mathematical model is hard. Hence, a real-time simulation is essential. In the simulation, by looking at the overshoot, mode of oscillation, and damping ratio, the stability-related problem in the power system can be identified. However, no industry standard exists in terms of a weak mode related to DCMGs. Hence, experimental validation is inevitable to understand the stability behavior of DCMGs. To further verify the theoretical analysis, an experimental setup (a prototype of DCMG) has been built in the University of Queensland (UQ) power engineering lab. The detailed system parameters for the experimental study are given in the Appendix. The experiment platform mainly consisted of a boost converter, a buck converter, a DC link capacitance, and a resistor. In this investigation, for the converter, SEMIKRON-SKM75 is used as the IGBT switch, SKYPER 32 R is used as the IGBT driver, and the dSPACE controller board is used as an interface between the hardware and MATLAB simulation. In addition, the LEM current and voltage transducers have been used as measurement units, and current and voltage probes are used for control and measurement purposes. The experimental setup has been built in two steps. Firstly, by creating a DC–DC converter separately/individually, then running a hardware loop and checking the output voltage. Secondly, by connecting them to form a small/lab-scale DCMG. After running the hardware loop, the output voltage of the boost and buck converter has been documented separately, which is shown in Figure 11b,c.

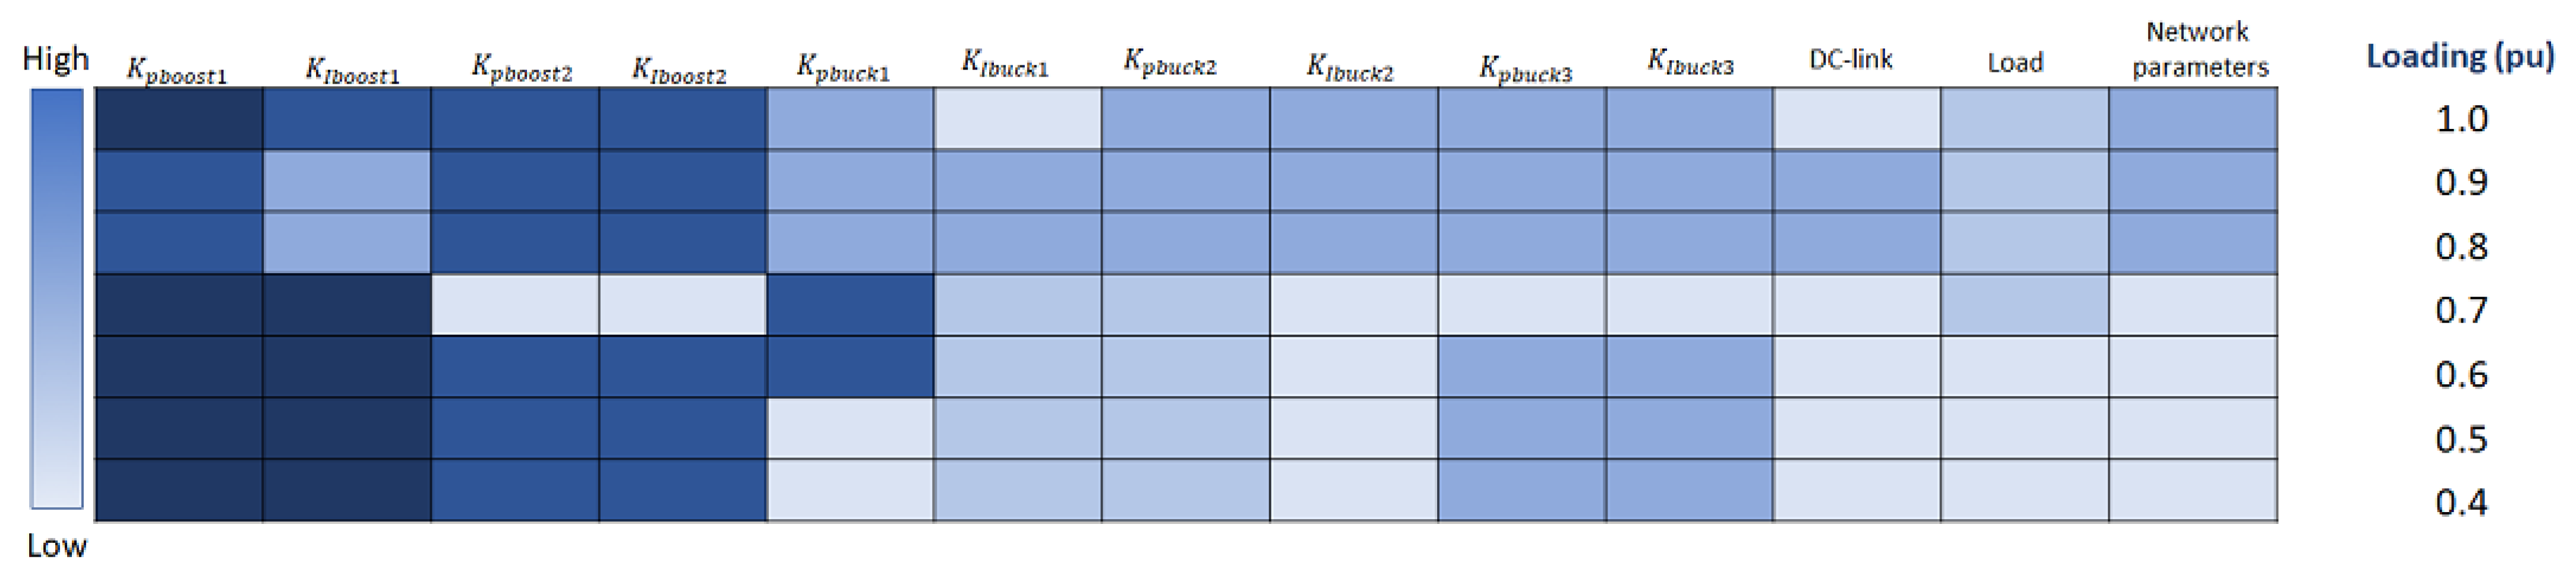
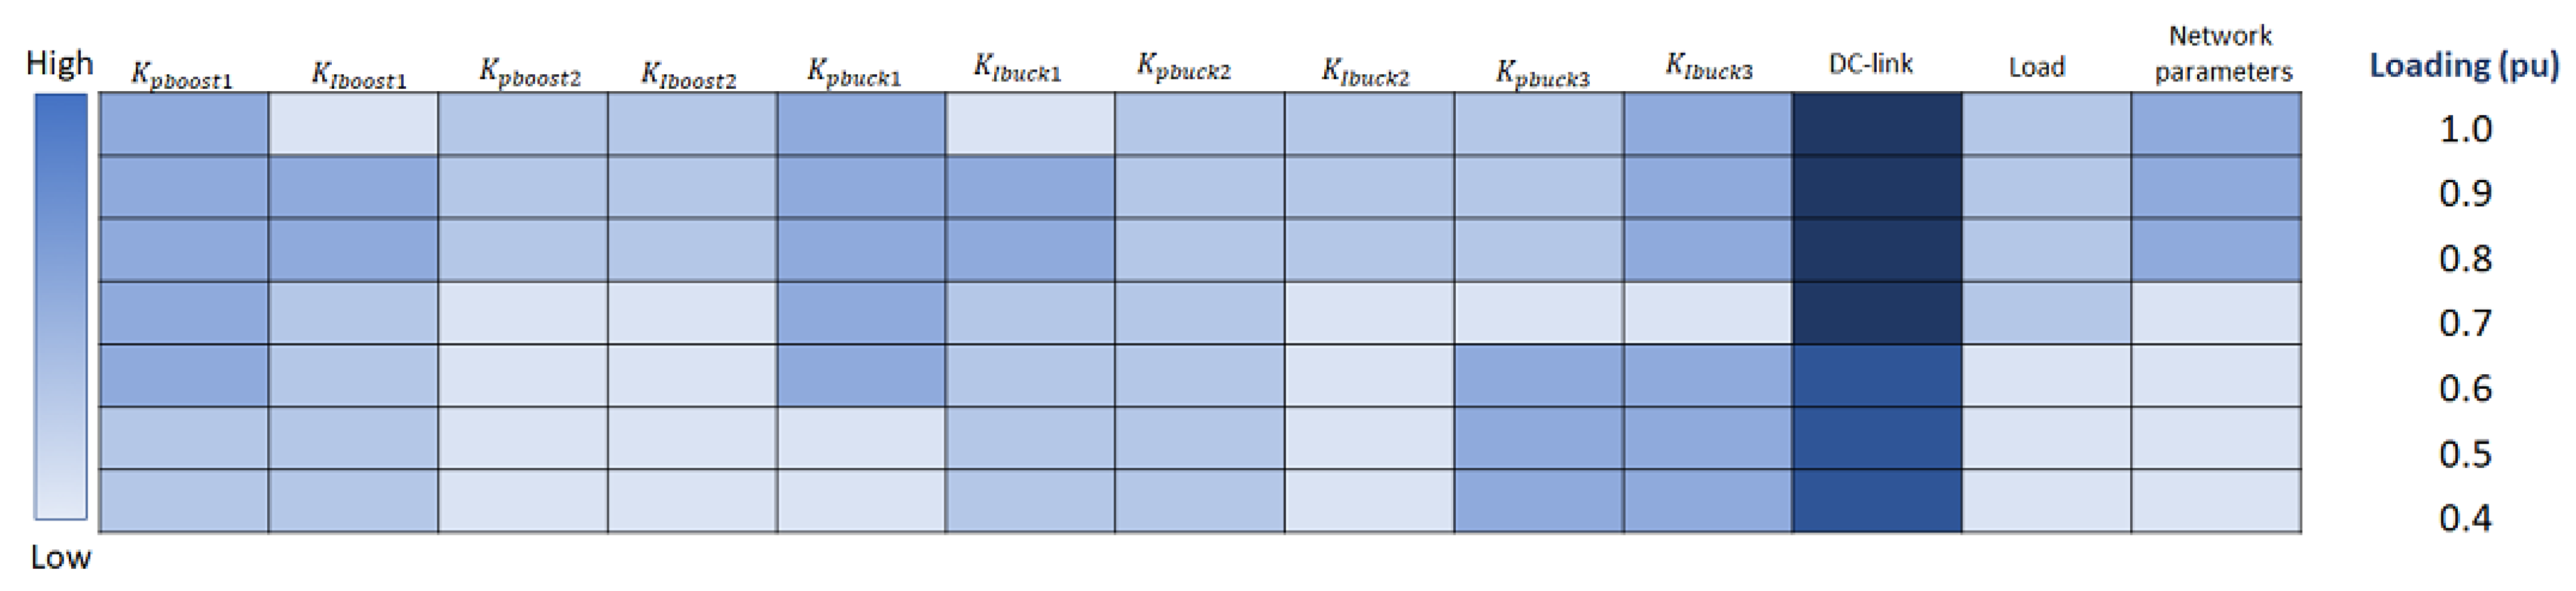
4.4. Critical Parameter Ranking

This section illustrates the critical parameter ranking for low frequencies and resonance. For the sensitivity study, the probabilistic system variables are considered. There are a total of ten uncertainties considered with respect to the converters. Three uncertainties are considered and related to the load and DC link. Furthermore, two uncertainties are considered in the network parameters. The probabilistic modelling of the input parameters and sensitivity is conducted in MATLAB. The stability studies for the DCMG are done by using MATLAB Simulink. Figure 12 shows the heatmap for ranking the critical parameters affecting the low-frequency oscillation of the DC grid under different loading conditions. The results in Figure 13 show that the proportional and integral gains of boost converter 1 are the most critical parameters. Figure 11 shows the heatmap for ranking critical parameters affecting the resonance of the DC grid. From the figure, it is evident that the DC-link capacitance is the most critical parameter affecting the performance of the resonance. Table 7 illustrates the performance of different sensitivity methods applied for the DC microgrid. The one-at-a-time (OAT) method, Morris screening, and Pearson method are compared. From the table, it is evident that all methods have good agreement in terms of ranking the most influential parameters, since the top three are the same for all methods (with position differences). The ranking performance of the Morris screening is between the OAT and Pearson methods. The OAT, Morris screening, and Pearson simulation times are 17 s, 120 s, and 19 m, respectively.

4.5. Control Performance Assessment

Table 8 shows the effect of different control tunings on the damping performance of the critical modes. Four different controller tuning methods are compared here. From the given results in Table 8, it is evident that the PI+clegg provides better damping performance, followed by IP control tuning. The control parameters are given in the Appendix of the paper.

5. Conclusions

This paper presents a complete analytical model of DCMGs to analyze the small-signal stability performance. Then, the semi-global sensitivity analysis is presented to rank the most critical parameter in terms of high-frequency oscillation and resonance. The ranking of the critical parameter is different for high-frequency oscillations and resonance. It is found that control dynamics can significantly contribute to voltage oscillations in DC buses. In the worst case, it can destabilize the DC bus voltage. It is also observed that the DC link capacitance is the key contributor to the resonance in the DC bus. Furthermore, this paper reviews and compares the dynamic characteristics (i.e., high-frequency oscillation and resonance) of the DC microgrid, considering different controllers such as LQR, PI+clegg, and IP instead of the conventional PI controller. From the results, it is evident that the PI+clegg provides a better dynamic performance, followed by the IP, LQR, and conventional PI with retuning. Due to the worldwide interest in DC microgrids with a high penetration of renewable resources, it appears more important to pay attention to the modelling and development of a normalized control method for DC microgrids. Furthermore, a framework to distinguish between the modelling and solver issues needs to be established for practitioners dealing with power system modelling as well as for and software and hardware implementation.

Author Contributions

Conceptualization, M.H. and R.S.; methodology, M.H.; software, M.H.; validation, R.S., M.H. and N.M.; formal analysis, M.H.; investigation, M.H. and R.S.; resources, M.H.; data curation, M.H.; writing—original draft preparation, R.S.; writing—review and editing, N.M., M.R.I. and S.M.M.; visualization, M.R.I. All authors have read and agreed to the published version of the manuscript.

Funding

This research received no external funding.

Data Availability Statement

Not applicable.

Conflicts of Interest

The authors declare no conflict of interest.

Nomenclature

Variables
BESSBattery energy storage system
DCMGDC microgrid
EMIElectromagnetic interference
EVElectric vehicle
GMGain margin
HFHigh frequency
HVDCHigh-voltage DC
LFLow frequency
LQRLinear Quadratic Regulator
MVDCMedium voltage DC
PIProportional integral
PIDProportional integral derivative
PMPhase margin
PVPhotovoltaic
PWMPulse-width modulated
RESsRenewable energy sources
SSSSmall-signal stability

Appendix A

Table A1 shows the parameters used for the experimental studies.
Table A1. The parameters used for the experimental studies.
ParameterSymbolValue
Boost converter source voltage V s 20   V
Boost converter inductor and capacitor L 1   C 1 147 e 6 H & 470 e 6 μ F
Parasitic inductor resistor r L 1 70 e 3   Ω
Boost converter output voltage V o 1 40   V
DC link voltage V d c 40   V
Switching frequency f s w 20   K H z
Proportional and integral gain of PI controller in boost converter K p 1   K i 1 0.0011262   0.05
Input voltage of buck converter V i n 40   V
Buck converter output voltage V 02 20   V
Boost converter inductor and capacitor L 2   C 2 1.5 e 3 H 470 e 6 μ F
Proportional and integral gain of PI controller in buck converter K p 2   K i 2 0.9 0.5
Switching frequency f s w 20   K H z
Load R 75   Ω
Rated output power P o 500   W
Table A2 shows the control parameters used in this work.
Table A2. Controller parameters.
ConverterPILQRIPPI+clegg
1Proportional: 0.9
Integral: 0.005
Proportional: 0.0011
Integral: 1.73
Proportional: 0.0013
Integral: 0.707
Proportional: 0.0015
Integral: 1.25
2Proportional: 0.9
Integral: 0.005
Proportional: 0.0011
Integral: 1.73
Proportional: 0.0012
Integral: 0.707
Proportional: 0.0012
Integral: 1.23
3Proportional: 0.9
Integral: 0.005
Proportional: 0.0011
Integral: 1.73
Proportional: 0.0011
Integral: 0.707
Proportional: 0.0012
Integral: 1.22

References

  1. Amin, M.; Molinas, M. Non-parametric impedance based stability and controller bandwidth extraction from impedance measurements of HVDC-connected wind farms. arXiv 2017, arXiv:1704.04800. [Google Scholar]
  2. Amin, M.; Molinas, M. Small-signal stability assessment of power electronics based power systems: A discussion of impedance-and eigenvalue-based methods. IEEE Trans. Ind. Appl. 2017, 53, 5014–5030. [Google Scholar] [CrossRef]
  3. Hamzeh, M.; Ghazanfari, A.; Mohamed, Y.A.-R.I.; Karimi, Y. Modeling and design of an oscillatory current-sharing control strategy in DC microgrids. IEEE Trans. Ind. Electron. 2015, 62, 6647–6657. [Google Scholar] [CrossRef]
  4. Habibullah, M.; Mithulananthan, N.; Zare, F.; Alkaran, D.S. Investigation of power oscillation at common DC bus in DC grid. In Proceedings of the IEEE International Conference on Industrial Technology (ICIT), Melbourne, VIC, Australia, 13–15 February 2019; pp. 1695–1700. [Google Scholar]
  5. Habibullah, M.; Mithulananthan, N.; Zare, F.; Sharma, R. Impact of control systems on power quality at common DC bus in DC grid. In Proceedings of the IEEE PES GTD Grand International Conference and Exposition Asia (GTD Asia), Bangkok, Thailand, 19–23 March 2019; pp. 411–416. [Google Scholar]
  6. Augustine, S.; Quiroz, J.E.; Reno, M.J.; Brahma, S. DC Microgrid Protection: Review and Challenges; Sandia National Lab. (SNL-NM): Albuquerque, NM, USA, 2018. [Google Scholar]
  7. Planas, E.; Andreu, J.; Gárate, J.I.; De Alegría, I.M.; Ibarra, E. AC and DC technology in microgrids: A review. Renew. Sustain. Energy Rev. 2015, 43, 726–749. [Google Scholar] [CrossRef]
  8. Whaite, S.; Grainger, B.; Kwasinski, A. Power quality in DC power distribution systems and microgrids. Energies 2015, 8, 4378–4399. [Google Scholar] [CrossRef] [Green Version]
  9. Kumar, D.; Zare, F.; Ghosh, A. DC microgrid technology: System architectures, AC grid interfaces, grounding schemes, power quality, communication networks, applications, and standardizations aspects. IEEE Access 2017, 5, 12230–12256. [Google Scholar] [CrossRef]
  10. Beheshtaein, S.; Cuzner, R.M.; Forouzesh, M.; Savaghebi, M.; Guerrero, J.M. DC microgrid protection: A comprehensive review. IEEE J. Emerg. Sel. Top. Power Electron. 2019. [Google Scholar] [CrossRef]
  11. Augustine, S.; Reno, M.J.; Brahma, S.M.; Lavrova, O. Fault current control and protection in a standalone DC microgrid using adaptive droop and current derivative. IEEE J. Emerg. Sel. Top. Power Electron. 2020, 9, 2529–2539. [Google Scholar] [CrossRef]
  12. Bayati, N.; Hajizadeh, A.; Soltani, M. Impact of faults and protection methods on DC microgrids operation. In Proceedings of the IEEE International Conference on Environment and Electrical Engineering and IEEE Industrial and Commercial Power Systems Europe (EEEIC/I & CPS Europe), Palermo, Italy, 12–15 June 2018; pp. 1–6. [Google Scholar]
  13. Pourmohammd, M.; Toulabi, M.; Rayati, M.; Khajehoddin, S.A. Load type impacts on the stability and robustness of DC microgrids. Int. J. Electr. Power Energy Syst. 2022, 140, 108036. [Google Scholar] [CrossRef]
  14. Zhang, Z.; Yang, X.; Zhao, S.; Wu, D.; Cao, J.; Gao, M.; Zheng, G.; Wang, Z. Large signal stability of islanded DC microgrids with multiple types of loads. Int. J. Electr. Power Energy Syst. 2022, 143, 108450. [Google Scholar] [CrossRef]
  15. He, B.; Chen, W.; Hu, H.; Zhan, D.; Zhang, C. Small signal stability analysis and criterion of triple stage cascaded DC system. IEEE J. Emerg. Sel. Top. Power Electron. 2022, 10, 2576–2586. [Google Scholar] [CrossRef]
  16. Lin, G.; Li, W.Z.Y.; Liu, J.; Wang, S.; Wang, P. Comparative analysis on the stability mechanism of droop control and VID control in DC microgrid. Chin. J. Electr. Eng. 2021, 7, 37–46. [Google Scholar] [CrossRef]
  17. Chen, P.; Zhao, W.; Chen, X.; Zhao, W.; Chen, X.; Jiang, J. An impedance based parameter design method for active damping of load converter station in MTDC distribution. J. Mod. Power Syst. Clean Energy 2022, 10, 1423–1435. [Google Scholar] [CrossRef]
  18. Hasan, K.; Preece, R.; Milanovic, J. Priority ranking of critical uncertainties affecting small-signal stability using sensitivity analysis techniques. IEEE Trans. Power Syst. 2017, 32, 2629–2639. [Google Scholar] [CrossRef] [Green Version]
  19. Fatah, R.; Hasan, K.; Preece, R. Comparative ranking of critical uncertainties affecting the stability of mixed AC/DC system. In Proceedings of the Power System Computational Conference (PSCC), Dublin, Ireland, 11–15 June 2018; pp. 1–6. [Google Scholar]
  20. Habibullah, M.; Mithulananthan, N.; Bhumkittipich, K.; Amin, M. A comprehensive investigation on high-frequency oscillation in DC microgrid. IEEE Access 2021, 9, 54850–54861. [Google Scholar] [CrossRef]
  21. Habibullah, M.; Bhumkittipich, K.; Mithulananthan, N.; Sharma, R.; Zare, F. Damping oscillation and removing resonance in a RE based DC microgrids. IEEE Access 2021, 9, 163516–163525. [Google Scholar] [CrossRef]
  22. Vijayakumari, A. Design of Microgrids. In Smart Microgrids; CRC Press: Boca Raton, FL, USA, 2020; pp. 13–117. [Google Scholar]
  23. Farrokhabadi, M.; Cañizares, C.A.; Simpson-Porco, J.W.; Nasr, E.; Fan, L.; Mendoza-Araya, P.A.; Tonkoski, R.; Tamrakar, U.; Hatziargyriou, N.; Lagos, D.; et al. Microgrid stability definitions, analysis, and examples. IEEE Trans. Power Systems 2019, 35, 13–29. [Google Scholar] [CrossRef]
  24. Carpintero-Rentería, M.; Santos-Martín, D.; Guerrero, J.M. Microgrids literature review through a layer’s structure. Energies 2019, 12, 4381. [Google Scholar] [CrossRef] [Green Version]
  25. Laaksonen, H. Technical Solutions for Low-Voltage Microgrid Concept. PhD Dissertation, The University of Vaasa, Vaasa, Finland, 2011. [Google Scholar]
  26. Abdelgawad, H.; Sood, V.K. A comprehensive review on microgrid architectures for distributed generation. In Proceedings of the 2019 IEEE Electrical Power and Energy Conference (EPEC), Montreal, QC, Canada, 16–18 October 2019; pp. 1–8. [Google Scholar]
  27. Anderson, P.M.; Agrawal, B.L.; Van Ness, J.E. Subsynchronous Resonance in Power Systems; John Wiley & Sons: Hoboken, NJ, USA, 1999. [Google Scholar]
  28. Padiyar, K. Analysis of Subsynchronous Resonance in Power Systems; Springer Science & Business Media: Berlin/Heidelberg, Germany, 2012. [Google Scholar]
  29. Egwebe, A.M.; Fazeli, M.; Igic, P.; Holland, P.M. Implementation and stability study of dynamic droop in islanded microgrids. IEEE Trans. Energy Convers. 2016, 31, 821–832. [Google Scholar] [CrossRef] [Green Version]
  30. Setiadi, H.; Krismanto, A.U.; Mithulananthan, N.; Hossain, M. Modal interaction of power systems with high penetration of renewable energy and BES systems. Int. J. Electr. Power Energy Syst. 2018, 97, 385–395. [Google Scholar] [CrossRef]
  31. Wu, G.; Sun, H.; Zhao, B.; Xu, S.; Zhang, X.; Egea-Alvarez, A.; Wang, S.; Li, G.; Li, Y.; Zhou, X. A low-frequency converter-driven oscillations in weak grids: Explanation and damping improvement. IEEE Trans. Power Syst. 2021, 36, 5944–5947. [Google Scholar] [CrossRef]
  32. Banos, A.; Barreiro, A. Reset Control Systems; Springer Science and Business Media: Berlin, Germany, 2011. [Google Scholar]
  33. Li, C.; Wang, S.; Colas, F.; Liang, J. Dominant instability mechanism of VSI connecting to a very weak grid. IEEE Trans. Power Syst. 2022, 37, 828–831. [Google Scholar] [CrossRef]
Figure 1. Flowchart of the study.
Electronics 12 01574 g001
Figure 2. System topology; (a) typical DCMG; (b) topology of DC microgrid using in this work.
Electronics 12 01574 g002aElectronics 12 01574 g002b
Figure 3. Frequency response of the system: (a) Output and input impedance; (b) total impedance seen from DC link.
Electronics 12 01574 g003aElectronics 12 01574 g003b
Figure 4. Eigenvalue analysis result—stable operation in DC grid.
Electronics 12 01574 g004
Figure 5. Impact of variation in relation to control parameters (boost converter). (a) Variation in Kp in 12-kW boost converter; (b) variation in Ki in 8-kW boost converter; (c) variation in Kp in 8-kW boost converter on DC grid; (d) variation in Ki in 8-kW boost converter on DC grid.
Electronics 12 01574 g005aElectronics 12 01574 g005b
Figure 6. Impact of variation in relation to control parameters (buck converter). (a) Variation in Kp in 10-kW buck converter; (b) variation in Ki in 10-kW buck converter; (c) variation in both Kp and Ki in 10-kW buck converters; (d) incremental Kp value for multiple units of converters; (e) arbitrarily selected controller parameter.
Electronics 12 01574 g006aElectronics 12 01574 g006b
Figure 7. Impact of the DC-link capacitance on the DC grid.
Electronics 12 01574 g007
Figure 8. Impact of the variation in load power on the DC grid.
Electronics 12 01574 g008
Figure 9. Impact of the variation in inductance on the DC grid.
Electronics 12 01574 g009
Figure 10. Impact of the controller and DC link dynamics on DC bus. (a) DC bus voltage influenced by integral controller dynamics; (b) FFT analysis on DC bus; (c) parameter variations of the controller (buck converters); (d) DC bus voltage influenced by the proportional controller dynamics; (e) impact of simultaneous disturbances (50% voltage disturbances in source 1 and 50% load disturbances); (f) impact of simultaneous disturbances (50% voltage disturbances in source 1 and source 2, and 50% load disturbances).
Electronics 12 01574 g010aElectronics 12 01574 g010bElectronics 12 01574 g010c
Figure 11. Experimental investigation. (a) A prototype of DC microgrid setup; (b) output voltage of boost converter; (c) output voltage of buck converter.
Electronics 12 01574 g011
Figure 12. Heatmap of ranking critical parameter for oscillatory stability.
Electronics 12 01574 g012
Figure 13. Heatmap for ranking critical parameter for resonance.
Electronics 12 01574 g013
Table 1. Summary of the critical review.
ReferenceDetailed Load ModelSensitivity AnalysisKey Parameter IdentificationControl Method
[13]
[14]
[15]
[16]
[17]
[20]
[21]
This work
Table 2. Parameters of the DC microgrid used in this work.
ParameterSymbolValue
Rated power of the simulated system P o 20 kW
Rated power of boost converter 1 P o b o o s t 1 12 kW
Rated power of boost converter 2 P 0 b o o s t 2 8 kW
Rated power of buck converter 1 P o b u c i k 1 10 kW
Rated power of buck converter 2 P o b u c i k 2 5 kW
Rated power of buck converter 3 P o b u c i k 3 1 kW
Boost converter source voltage V s 1 375 V
Boost converter output voltage V o 1 750 V
DC link voltage V d c 750 V
Switching frequency of boost converters f s w b o o s t 20 kHz
Switching frequency of buck converter f s w b u c k 1 10 kHz
f s w b u c k 2 20 kHz
f s w b u c k 3 20 kHz
Input voltage of buck converter V i n 750 V
Buck converter output voltage V 02 400 V
Table 3. Parameters of the DC–DC boost converters.
Boost Converter 1Boost Converter 2
Vs = 375 VL = 157 µHVs = 400 VL = 147 µH
V0 = 750 VR = 47 ΩV0 = 750 VR = 70 Ω
D = 0.5 (no unit)C = 1000 µFD = 0.5 (no unit)C = 1000 µF
Kp = 0.005 puKi = 0.003 puKp = 0.005 puKi = 0.003 pu
Table 4. Parameters of the DC–DC buck converters.
ParametersConverter 1Converter 2Converter 3
Input voltage (V)750750750
Output voltage (V)400400400
Inductance (H)0.004280.00440.0033
Resistance (ohm)16145147
Duty cycle0.50.50.5
Proportional gain (pu)0.90.90.9
Integral gain (pu)0.0050.0050.005
Table 5. Eigenvalue for the complete system.
Critical ModeDamping (%)f (Hz)Associated ModeRemarks
−0.83 ± j9530.09151ControllerBoost converter
−7.91 ± j14430.55230ControllerBoost converter
−7.33 ± j18,0800.042878ControllerBuck converter
−66.48 ± j57,9310.119224ControllerBuck converter
−17.36 ± j14,1840.122258ControllerBuck converter
Table 6. Damping performance of complete system under different loads.
Load TypeDamping of Mode 1Damping of Mode 2Damping of Mode 3Damping of Mode 4Damping of Mode 5
Constant P0.0910.560.0410.1120.121
Constant I0.0920.550.0380.1110.122
Constant Z0.0930.550.0390.1130.122
ZIP0.0910.540.0410.1140.121
Table 7. Influential parameters identified using the different sensitivity method (oscillation stability).
RankingOATMorrisPearson
1 k i b o o s t   1 k p b o o s t   1 k p b o o s t   1
2 k p b o o s t   1 k i b o o s t   1 k i b o o s t   1
3 k p b o o s t   2 k p b o o s t   2 k p b o o s t   2
4DC-link k i b o o s t   2 k p b u c k   2
Table 8. Damping performance of complete system under different controls.
ModeDamping with PIDamping with PI+cleggDamping with IPDamping with LQR
10.0910.1220.1050.11
20.5510.5930.5730.57
30.0410.0710.0550.054
40.1120.1340.1230.115
50.1220.1510.1340.125
Disclaimer/Publisher’s Note: The statements, opinions and data contained in all publications are solely those of the individual author(s) and contributor(s) and not of MDPI and/or the editor(s). MDPI and/or the editor(s) disclaim responsibility for any injury to people or property resulting from any ideas, methods, instructions or products referred to in the content.

