Article

An Image Object Detection Model Based on Mixed Attention Mechanism Optimized YOLOv5

1
Department of Electrical and Information Engineering, Hebei Jiaotong Vocational and Technical College, Shijiazhuang 050051, China
2
Road Traffic Perception and Intelligent Application Technology R&D Center of Universities in Hebei Province, Shijiazhuang 050051, China
3
School of Technology, Beijing Forestry University, Beijing 100083, China
*
Author to whom correspondence should be addressed.
Electronics 2023, 12(7), 1515; https://doi.org/10.3390/electronics12071515
Submission received: 18 February 2023 / Revised: 17 March 2023 / Accepted: 20 March 2023 / Published: 23 March 2023
(This article belongs to the Special Issue Advanced Technologies of Artificial Intelligence in Signal Processing)

Abstract

:
As one of the more difficult problems in the field of computer vision, utilizing object image detection technology in a complex environment includes other key technologies, such as pattern recognition, artificial intelligence, and digital image processing. However, because an environment can be complex, changeable, highly different, and easily confused with the target, the target is easily affected by other factors, such as insufficient light, partial occlusion, background interference, etc., making the detection of multiple targets extremely difficult and the robustness of the algorithm low. How to make full use of the rich spatial information and deep texture information in an image to accurately identify the target type and location is an urgent problem to be solved. The emergence of deep neural networks provides an effective way for image feature extraction and full utilization. By aiming at the above problems, this paper proposes an object detection model based on the mixed attention mechanism optimization of YOLOv5 (MAO-YOLOv5). The proposed method fuses the local features and global features in an image so as to better enrich the expression ability of the feature map and more effectively detect objects with large differences in size within the image. Then, the attention mechanism is added to the feature map to weigh each channel, enhance the key features, remove the redundant features, and improve the recognition ability of the feature network towards the target object and background. The results show that the proposed network model has higher precision and a faster running speed and can perform better in object-detection tasks.

1. Introduction

Object detection is a research hotspot in computer vision, and it is also one of the most basic and challenging tasks. It provides a strong feature classification basis, for instance, segmentation, image analysis, video tracking, and other tasks. Object detection includes the classification and positioning of objects. By analyzing the input pictures or videos, each object in the image is accurately detected with a co-ordinate position and boundary box, and the features of the object are extracted [1]. The object refers to the entity object to be detected in the image. The task of detection includes classification and positioning. Classification is carried out to determine the category of these objects to be detected, and positioning helps to accurately find the position of the object in the image. In this process, the advantages and disadvantages of the algorithm will affect the detection accuracy, tracking accuracy, stability, and real-time performance of the object. At the same time, object detection technology has been used in many fields, such as road traffic control, medical image processing, human-computer interaction, video surveillance, unmanned driving, etc. [2]. In an image, a single pixel or a single target does not exist alone but has some connection with the surrounding pixels and targets. Mining and the utilization of the relationship between objects, that is, context information, are beneficial to target detection. Since the object detection algorithm with manual feature extraction can only extract shallow feature information, it is difficult to go deep to extract more semantic feature information. In order to improve detection accuracy, it is necessary to build a more complex feature extraction model [3]. Although object detection technology has gone through many years of theoretical research and technical application with the continuous development of society, the existing technology still needs to be further explored to meet the new requirements in different fields and, on the basis of continuously enhanced performance, it also needs to make the design more simplified, more scientific and more robust.
The collected images are mainly affected by various internal and external factors. Internal factors include window size selection and variable target shape. The selection of the target window size used in some algorithms is a difficult problem because the window size is usually predefined, and the local difference is invariant [4,5]. However, if the window size is too large, you may not be able to detect slight changes in texture features, and this will consume more computation. In a window of too small a size, some interfering pixels can be detected as target pixels, such as noise or pixels affected by lighting changes or other factors [6]. The target may be in high-speed motion when shooting, so the imaging will show deformation and scale changes, and the robustness of the target detection algorithm is high. External factors include background noise and various detection equipment. In a complex background, because the target strength is weak, it is partially blocked by the interfering object or buried in the clutter and noise [7]. In these cases, it is difficult to separate the target from the complex and noisy background. The farther the target is from the acquisition point, the smaller the image area of the target is. At the same time, the worse the image quality is and the more difficult it is to detect the target. For the target collection device, different collection devices will be set according to different scenes. In order to estimate the relative position and absolute position of the target, it is necessary to obtain the relative distance between the target and the acquisition equipment by means of ranging [8].
This paper analyzes the object detection algorithm based on deep learning, and the research contents mainly include:
  • In this paper, the YOLOv5 feature extraction network is improved, and the feature map extraction operation is advanced. If it is a small object, the deeper the network level is, the less semantic information is retained by the small object. By extracting the feature map in advance, more abundant location information can be obtained to improve the problem of the feature loss of object information as the network level deepens;
  • The network model proposed in this paper adds a selfattention mechanism. The attention mechanism can improve the object feature weight, reduce the background feature weight, let the model obtain the object area that needs to be focused on, and reconstruct the features;
  • The network model proposed in this paper uses a context feature-fusion structure. The feature information with rich deep semantics but also unclear location information is fused to the feature information with clear shallow location information but not rich semantics to improve the detection difficulty caused by complex multiobject;
  • The remainder of this paper is organized as follows: Section 2 discusses work related to image object detection, followed, in Section 3, by the object detection algorithms based on deep learning. In Section 4, the proposed method is addressed along with the considerations for the analysis of this paper. Section 5 presents the experimental results and analysis. Finally, in Section 6, a conclusion is drawn.

2. Related Work

As a basic task in computer vision, object detection has been a hot topic in academic research in recent years. From traditional image processing methods to deep learning-based methods, from single-stage and two-stage object detection frameworks based on anchor frames to object detection frameworks based on anchor frames, researchers have explored better object detection methods from various dimensions. In recent years, the object detection algorithm has been constantly updated iteratively. It has been constantly challenged between solving new problems and finding new problems. It has weighed between bigger and stronger algorithms and lighter and faster algorithms. With the joint efforts of scholars, the overall research framework of the algorithm has become increasingly mature [9]. As the downstream task of image classification, the object detection algorithm needs to complete two tasks: one is to generate the object detection frame to be recognized; the second is to accurately judge the types of objects in the detection frame. Traditional object detection methods use artificial features to represent complex features, which are gradually reduced due to their weak applicability and low detection performance; the object detection method based on deep learning has been developed with the proposed convolutional neural network, which eliminates the disadvantages of traditional object detection, and it is widely used [10]. At present, in the field of deep learning, object detection algorithms can be divided into two categories: two-stage object detection and one-stage object detection. The former gradually realizes detection according to the idea of “from big to small”, such as region-based convolutional neural networks (R-CNN) series, spatial pyramid pooling network (SPPNet), etc.; the latter performs region category judgment while generating prediction boxes, with low model complexity and fast detection speed, including the YOLO series, single shot multibox detector (SSD), and RetinaNet [11]. The squeeze and extinction network (SENet) represents an attention mechanism proposed by Momenta. In the attention mechanism, SENet is not an independent model design but is only an optimization of the model. Generally, SENet is used in combination with other factors [12].
In the actual object detection task, objects of different sizes are mixed together and interfere with each other, which affects the performance of small object detection. Therefore, Hu et al. [13] proposed a pixel-level balance (PLB) method, which improved the accuracy of small object detection. Afsharirad and Seyedin [14] introduced the salient object detection method using task simulation (SOD-TS) based on saliency detection algorithms. SOD-TS can detect the salient object, which is the best response to the current task. This method has a wide range of applications. Du et al. [15] proposed a correlation complement (CC) module that combines the class representation vector with the relationships between the categories in the dataset. Yuet al. [16] proposed a multiobject subspace projection sample-weighted CEM (MSPSW-CEM) algorithm to solve the problem of spectral variability, which causes very serious false detection and missed detection. MSPSW-CEM showed a better detection performance than other object detection methods. With respect to adaptively obtaining optimal object anchor scales for the object detection of high spatial resolution remote sensing images (HSRIs), Donget al. [17] proposed a novel object detection method for HSRIs based on CNNs with optimal object anchor scales. Zhan et al. [18] proposed a novel task for visual relationship detection and significance detection as a complement to object detection and predicate detection. Meanwhile, they proposed a novel multitask compositional network (MCN) that simultaneously performed object detection, predicate detection, and significance detection.
Wang et al. [19] proposed a multiscale block fusion object detection method for large-scale HSRIs, aiming at how to achieve optimal block object detection for large-scale HSRIs. This method is superior to other single-scale image block detection methods. With respect to the multiangle features of object orientation in HSRIs object detection, Dong et al. [20] presented a novel HSRI object detection method based on a CNN with adaptive object orientation features; the proposed method can more accurately detect objects with large aspect ratios and densely distributed objects. Hou et al. [21] proposed a kullback–leibler single shot multibox detection (KSSD) object detection algorithm to detect small- and medium-sized objects. This algorithm has higher accuracy and stability than existing detection algorithms. Xi et al. [22] proposed an infrared small-object detection method to improve the capacity for detecting thermal objects in complex scenarios. When compared with the current advanced models, this framework has better performance in infrared small object detection under complex background conditions. Objects in aerial images have the characteristics of a small volume and dense and uncertain directions, which increase the difficulty of detection. In order to solve the problem, Koyun et al. [23] proposed a two-stage object detection framework called “Focus-and-Detect”. Kim et al. [24] proposed a novel object detection framework for obtaining robust object detection in occlusion. The framework is composed of an object detection framework and a plug-in bounding box (BB) estimator. Using Pascal VOC, MS Coco, and Kitti datasets, it was proved that this framework improves the performance of object detection.

3. Object Detection Algorithms Based on Deep Learning

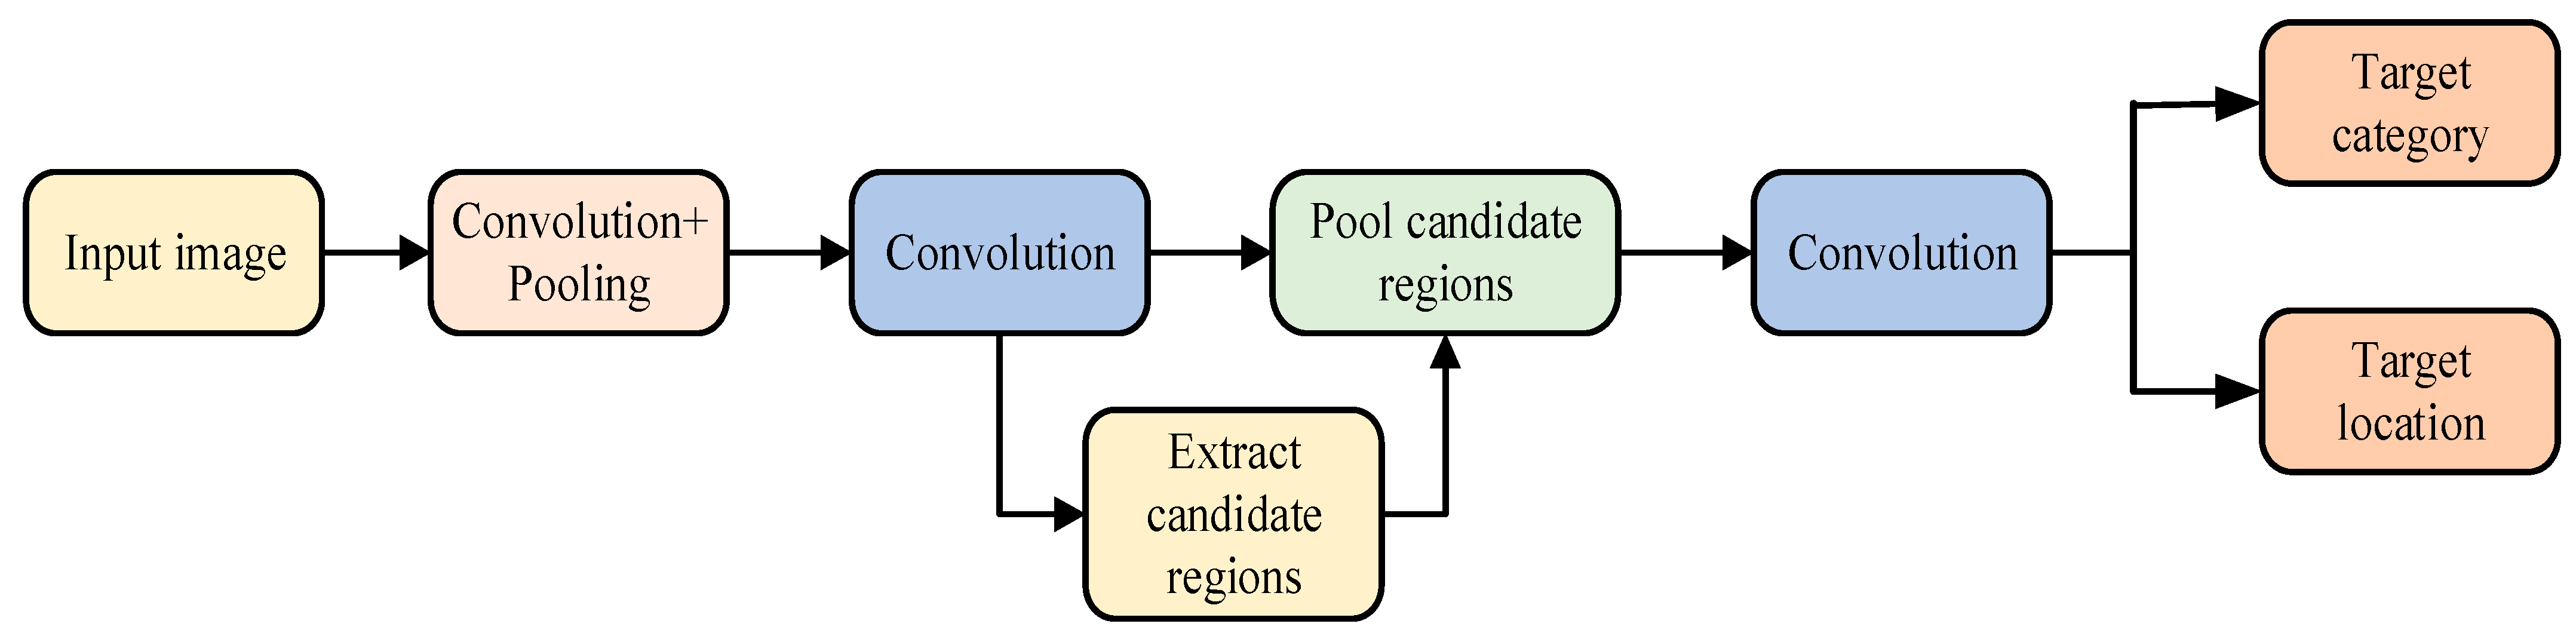
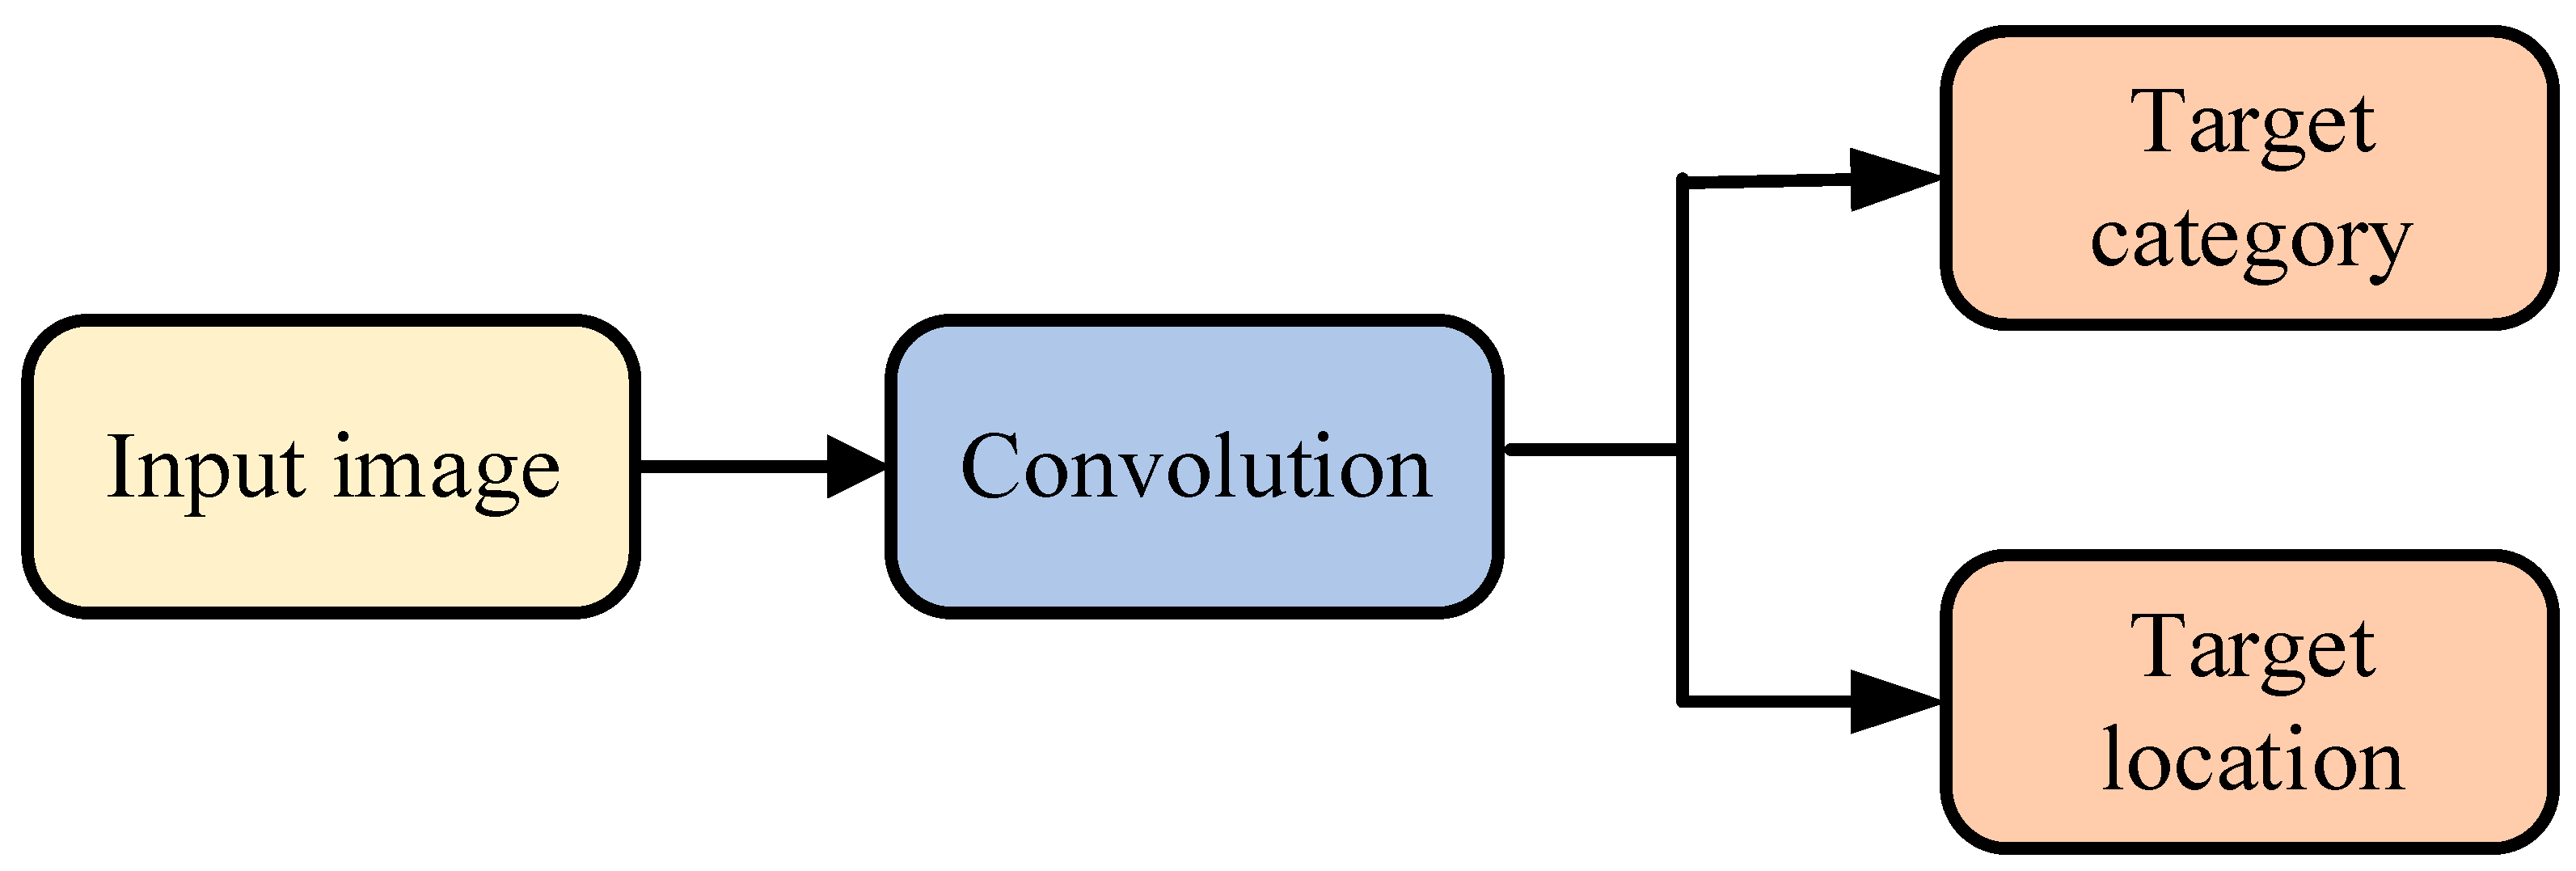
3.1. Classification of Mainstream Algorithms in Object Detection

In the field of object detection, the methods of object detection using deep learning technology have been gradually accepted by the majority of researchers. At present, object detection is mainly divided into two-stage methods and one-stage methods. These two methods have their own advantages and effects for different detection problems. In general, the two-stage method has better detection accuracy, while the one-stage method has faster detection speed [25,26].
Two-stage object detection algorithms pay more attention to the extraction of high-quality features from object images to obtain a higher detection accuracy. Its process is shown in Figure 1. Classic two-stage object detection algorithms include R-CNN, Fast R-CNN, etc. First, the candidate boxes are extracted, and then they are classified and regressed [27].
One-stage object detection algorithms only need one regression operation on the input image to predict the category and location information of the object image, so they have a fast detection speed. The detection flow chart of this type of algorithm is shown in Figure 2. Two-stage object detection algorithms, such as R-CNN, have shortcomings, such as large training parameters and long training times, which are not suitable for tasks with high real-time requirements; classical one-stage object detection algorithms, such as SSD, EfficientNet, and the YOLO series, only use convolutional neural networks to process the whole picture once, greatly reducing training parameters and processing times [28].

3.2. SSD Object Detection Algorithm

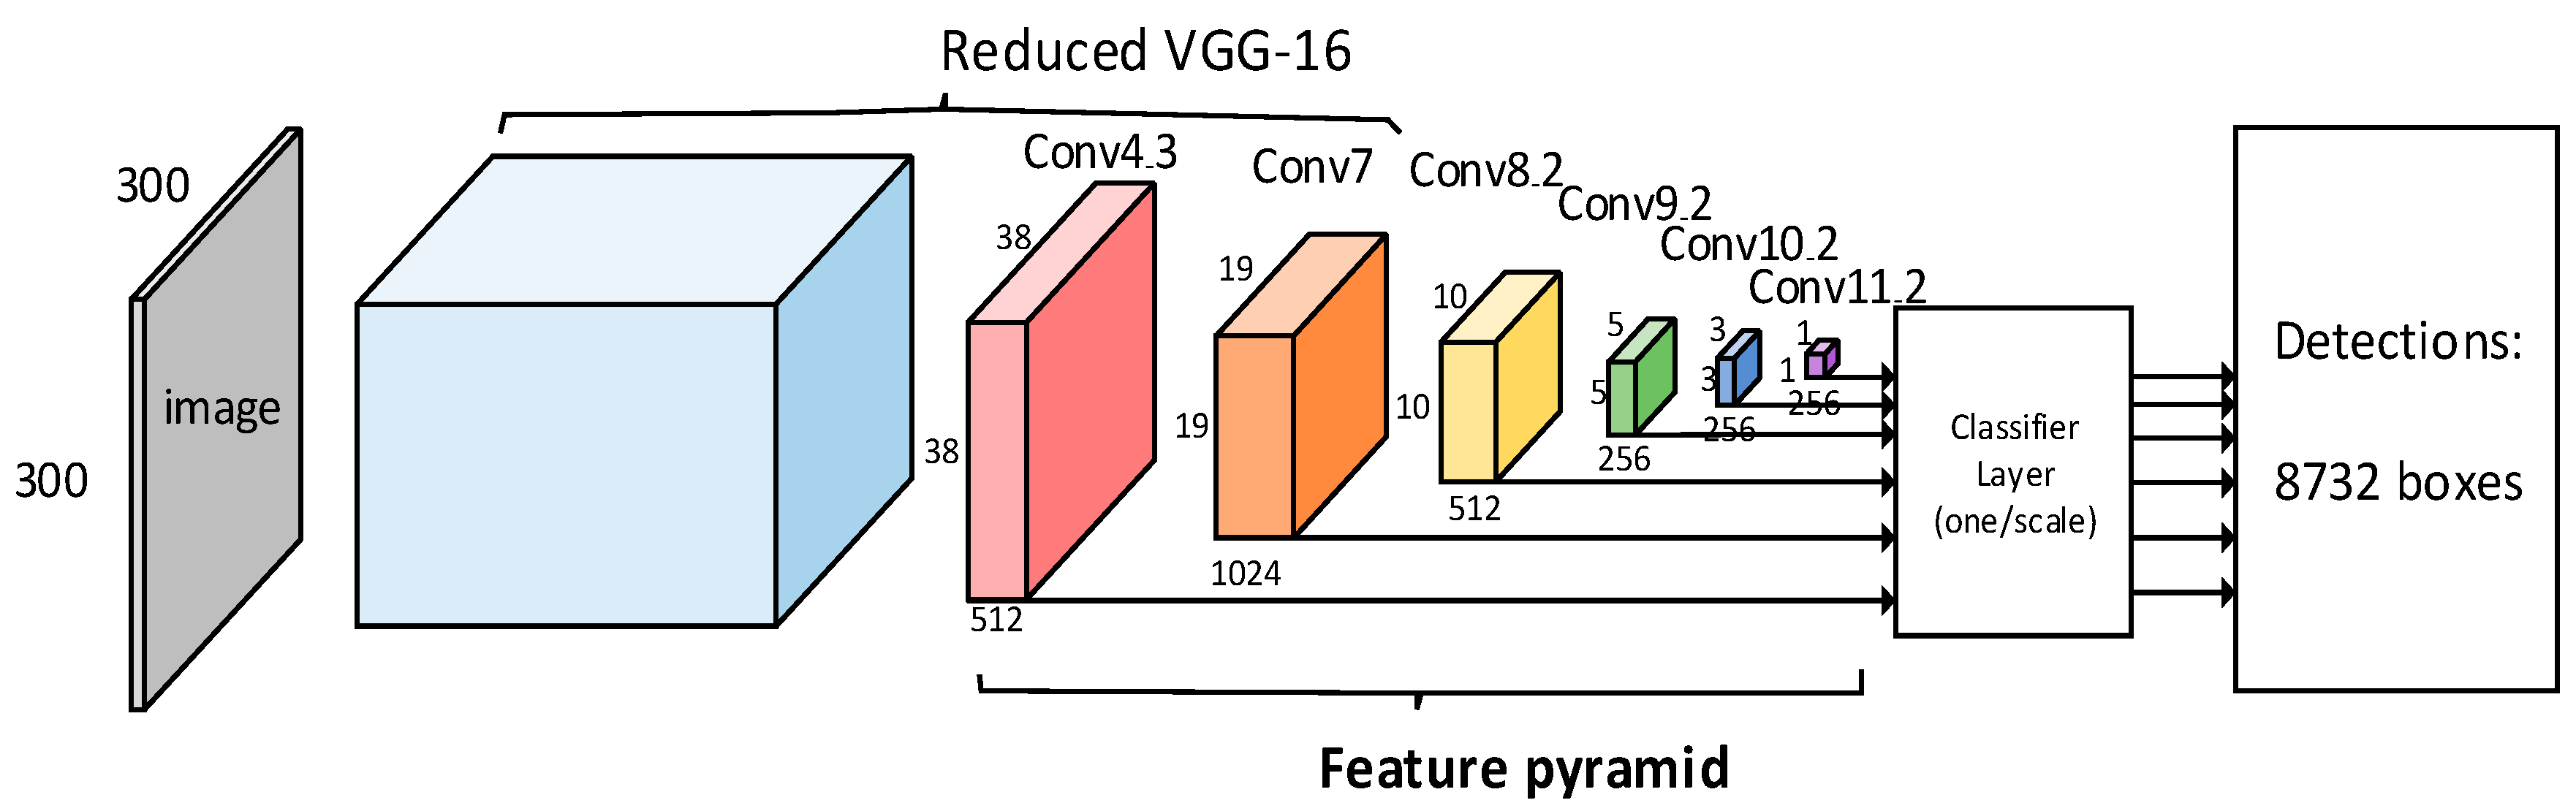
3.2.1. SSD Algorithm Model Structure

The SSD algorithm extracts the feature information from images through the VGG-16 network, extracting object features through multiple scale convolution layers and completing co-ordinate determination and object classification for feature information through a prediction module. Its structure is shown in Figure 3. The SSD algorithm has made a series of improvements to the VGG-16 network. First, the FC6, FC7, and FC8 full connection layers of the VGG-16 are deleted, and the 3 × 3 Conv6 and 1 × 1 Conv7 convolution layers are designed to replace them so as to ensure that the receptive field of the feature map increases while keeping the feature scale the same, with the feature information extracted from Conv7 used for prediction processing; then, the pooled core scale of the fifth pooled layer is changed from 2 × 2 to 3 × 3 and the step size is changed from 2 to 1 to ensure that the feature layer that can be extracted from the convolution layer after the fifth pooled layer has a high resolution, meaning that the network model can detect small objects with higher accuracy; finally, through the convolution layer Conv4_3, the feature information for multiscale feature prediction is extracted, adding additional convolution layers to the model and selecting different step down-sampling processing to improve the performance of the model to extract the image features [29].
The SSD algorithm innovatively designed multiscale feature layer prediction processing through the original pyramid network structure of the CNN network. Through these feature layers, features at all levels of the detection object can be extracted. Moreover, the object feature details contained in the lower feature layer are comprehensive, which can effectively detect small objects in the image. High-level features have high dimensions and strong semantic information, which can effectively detect large objects.

3.2.2. Prior Frame

Because the receptive fields of the feature maps of the different layers are different on the corresponding original images, a prior frame with the same scale but different scales will be generated on different feature layers. If the feature map scale is m × n and each grid contains k prior frames, then the feature map generates m × n × k prior frames. In addition, each prior box needs to complete the prediction of category confidence and border positioning co-ordinates (x, y, w, and h). If c categories are detected, (c + 4) prediction values of the corresponding prior boxes will be generated. At this time, the number of output prior boxes is (c + 4) × m × n × k, as shown in Figure 4.
The scaling formula of the prior frame in the corresponding feature map is
S k = S m i n + S m a x S m i n m 1 k 1 , k ϵ ( 1,2 , , m )
S k is the scale, S m a x is the scale of the highest-level feature map, and 0.9 is taken as the set value under normal conditions; S m i n is the scale of the lowest layer feature map. Under normal circumstances, 0.2 is taken as the set value. m refers to the calculated layer m feature map, and k refers to the layer k of the layer feature map.
If the number of network layers is low, it corresponds to a large-scale feature map and has low receptive field feature information, so it is necessary to preset a smaller scale prior frame to detect small objects. On the contrary, if the number of network layers is high, it corresponds to a small-scale feature map and has large receptive field feature information, so it is necessary to preset a larger scale prior frame to detect large objects. A total of 8732 prior frames will be generated by calculating the SSD model [30].

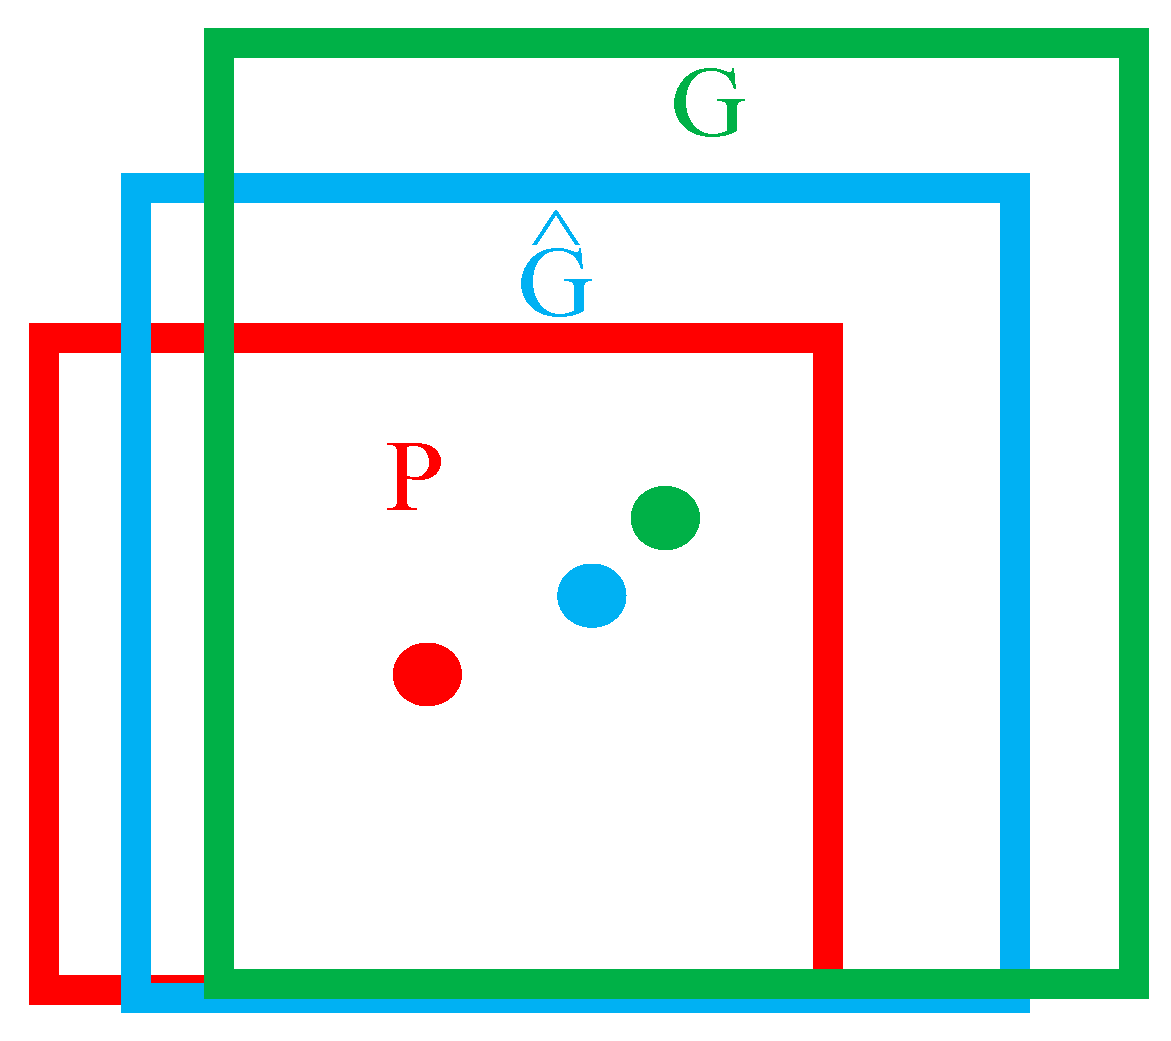
3.2.3. Border Regression

As shown in Figure 5, the red box P refers to the region proposal generated by training, the green box G refers to the ground truth of the object, and the blue box G ^ Refers to the regression window that is close to the ground truth after the region proposal is fine-tuned, that is, the prediction box, and defines the central co-ordinate value and width-height scale of each prediction box as (x, y, w, and h). The IOU value is improved by optimizing the gap between the prior frame and the real window to achieve accurate object positioning and detection.
Frame regression processing is used to solve the function f , so that
f P x , P y , P w , P h = G ˆ x , G ˆ y , G ˆ w , G ˆ h G x , G y , G w , G h
Frame regression learning is mainly completed through coding and decoding. The coding formula is as follows:
l x = G x P x / P w l y = G y P y / P h l w = l o g G w / P w l h = l o g G h / P h
Among them, l x , l y , l w , l h is the conversion value of the real box in the format of a prior box to facilitate the calculation of the loss function.
Decoding is the reverse process of encoding. It mainly restores a prior frame to the image in the form of translation transformation and scaling, that is, reversely deducing the real frame positioning information G x , G y , G w , G h through the output values l x , l y , l w , l h . In order to improve the proximity between the prior frame and the real frame, the overshoot parameters v x , v y , v w , v h are used for fine tuning during decoding. The decoding formula is
G x = P w v 1 × l x + P x G y = P h v 2 × l y + P y G w = P w e x p v 3 × l w G h = P h e x p v 4 × l h
The coding part normalizes the error between the prior frame and the real frame, which is conducive to the loss value calculation in the SSD network, while the decoding part deduces the position information of the real frame through the location information of the prior frame and the offset, which is the main step of frame regression learning.

3.2.4. Loss Function of SSD

The loss function used in the SSD algorithm model has the property of multitask processing, mainly including the classification of the loss function and the location of the loss function. Its calculation formula is
L ( d , c , l , g ) = 1 N L c o n ( d , c ) + α L l o c ( d , l , g )
where L con is the classification loss function; L l o c is the position loss function; N is the number of prior frames that can be compared with real frames. If N = 0, the loss function value L ( d , c , l , g ) = 0 ; α is the weighted parameter of the position loss function, which is normally preset as 1; d is the true or false value of whether the prior frame is similar to the real frame, or 0 or 1; L is the positioning information of the prediction box; c is the confidence level of the object to be measured; g is the positioning information of the real frame.
The classification loss function of the SSD model uses the Softmax function with multiple classification functions, as shown in the following formula:
L c o n ( d , c ) = i P o s e N   d i j p l o g c ˆ i p i   Neg a   l o g c ˆ i o c ˆ i p = e x p c i p p   e x p c i p
where c i p refers to the detection probability when the corresponding prior box of the pth category object is the ith; c ˆ i p refers to c i p detection probability after regression; c ˆ i o refers to the detection probability when the category object is the background and its corresponding prior frame is the ith; d i j p refers to the true or false value of the ith prior to box matching the pth category object of the jth real box, d i j P { 0,1 } , if d i j p = 1. This means that the object in the prior box is the category of the real box; Pose refers to the number of positive samples, and Nega refers to the number of negative samples.
The location classification function of the SSD model uses Smooth   L 1 a function to calculate the loss of the location offset information of the prior frame relative to the center co-ordinates and the width and height of the real frame. The expression is as follows:
L loc   ( d , l , g ) = i P o s e N m { x , y , w , h } d i j k Smooth   L 1 l i m g ˆ j m Smooth   L 1 = 0.5 x 2 if | x | < 1 | x | 0.5 otherwise
where l i m refers to the location information of the ith prior box; g ˆ j m refers to the position information of the jth real frame after it passes the coding phase.

3.3. YOLOv3 Object Detection Algorithm

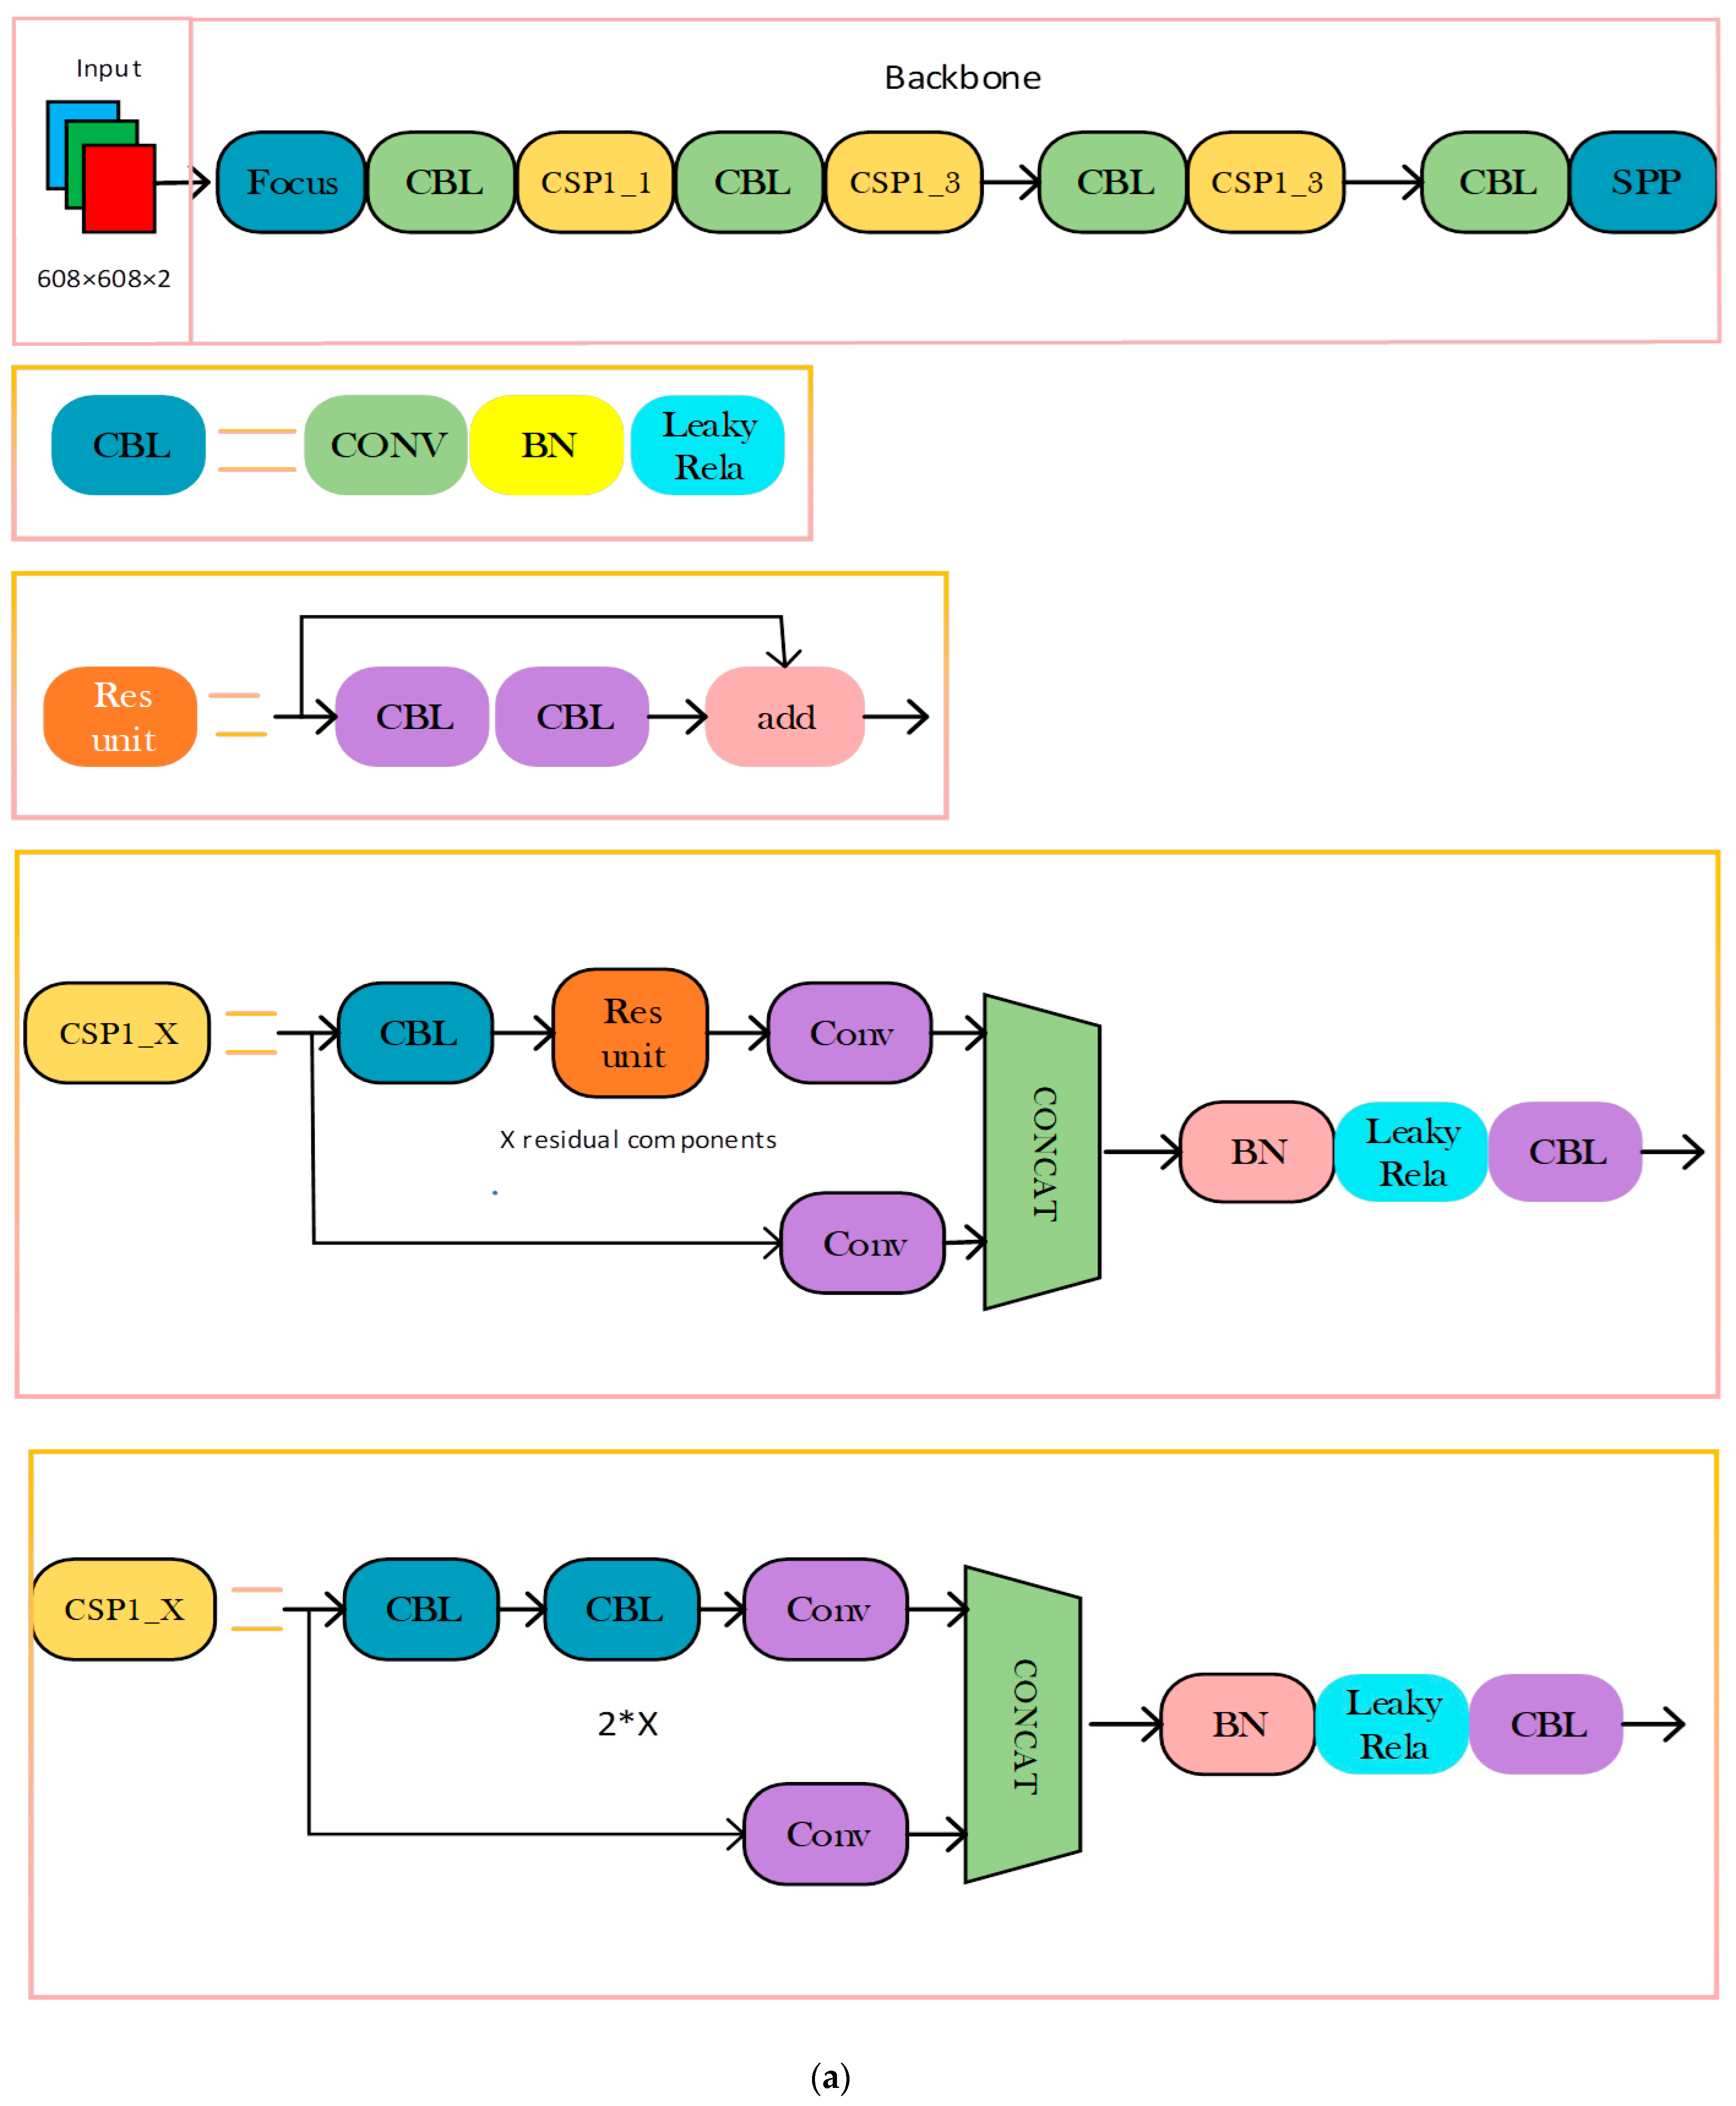
3.3.1. YOLOv3 Network Structure

YOLOv3 is one of the most used algorithms in one-stage object detection algorithms. On the network structure of YOLOv2, the algorithm increases the number of network layers to 53 layers by adding residual blocks. The deeper layers represent stronger learning ability. It can simultaneously predict the characteristics of low, medium, and high scales, and there is also an intersection between the three scales, which not only ensures the high accuracy of the feature map but also ensures the semantic richness of the feature map and. Thus. the small object detection ability is improved. YOLOv3 has an excellent effect in practical applications, and there is a lightweight version for edge devices with low processor performance.
YOLOv3 uses the Darknet-53 network with a deeper network, which is different from the two-stage object detection algorithm network. It replaces the pooling layer with a convolution layer with a step size of 2 to solve a problem whereby the pooling layer will lose some information. The 1 × 1 convolution replaces the full connection layer and solves the problem of too many parameters in the full connection layer. The connection mode of the residual network (ResNet) is used as a reference among the networks, with a residual module added. In Figure 6, DBL consists of conv, BN, Leaky_ Relu composition; Resunit is similar to the residual block in ResNet, playing the role of deepening the network and eliminating the negative optimization of network deepening; Resn consists of one DBL and n Resunits; Concat is a tensor concatenation. It concatenates the samples of the darknet-53 middle layer with other dimensions. Unlike the add operation of the residual layer, concatenation expands the tensor dimension. 26 × 26 × 256 and 26 × 26 × 512 concatenate into 768 dimensions. Add does not change the tensor dimension. For example, two 26 × 26 × 256 tensors remain 26 × 26 × 256 after the add operation. When compared with YOLOv2, YOLOv3 gives up the Softmax classifier as the final classification and uses multiple logistic classifiers for classification, which effectively solves the problem of multiobject detection and classification.

3.3.2. Residual Module

A large number of convolution layers are set in the Darknet-53 network structure to improve the network’s ability to detect objects. However, the increase in the number of network layers will also bring adverse effects, such as a decline in training accuracy and prediction accuracy. In order to solve the problem of gradient dispersion and explosion caused by the deep structure of the network, the residual neural network ResNet is introduced into the YOLOv3 structure. This residual structure and two convolution layers constitute the basic unit of the Darknet-53 network structure, where n represents the number of basic units used by this layer. The residual structure enables the upper layer of the network to directly skip two or more layers to connect the subsequent network, which can alleviate the gradient problem caused by network deepening. When assuming that the network layer behind the shallow network is an identity mapping layer, directly fitting the potential identity mapping function H ( x ) of a layer is difficult, so the residual structure does not directly learn the object mapping but learns a residual F ( x ) = H ( x ) x , making the original mapping H x = F x + x , as shown in Figure 6, when F ( x ) = 0 , identity mapping can be realized H x = x .
As shown in Figure 6, two convolutional layers use a 1 × 1 convolution core and a 3 × 3 convolution core, respectively, of which the 1 × 1 convolution core is mainly used for channel expansion and reduction. The residual network first uses the 1 × 1 convolution check channel to shrink and then uses the 3 × 3 convolution check channel to restore. Its essence is the idea of matrix decomposition, which is used to reduce the number of parameters. This helps the convolution network reduce the amount of computation to a certain extent and makes the convolution network run faster and more efficiently.

3.3.3. Loss Function of YOLOv3

For the YOLO series algorithms, the loss function is the core of the algorithm and plays a key role in optimization. There are 6 prediction parameters for YOLOv3 object detection; (x, y, w, h) are the co-ordinates of the upper left vertex of the object box, width and height, class is the category of the detected object, and confidence is the confidence level of the detected object; the formula of loss function is
l o s s ( object ) = λ coord i = 0 K × K j = 0 M I i j o b j 2 w i × h i x i x ˆ i 2 + y i y ˆ i 2 + λ coord i = 0 K × K j = 0 M I i j o b j 2 w i × h i w i w ˆ i 2 + h i h ˆ i 2 i = 0 K × K j = 0 M   1 i j o b j c ˆ i l o g c i + 1 c ˆ i l o g 1 c i λ noobj i = 1 K × K j = 0 M I i j n o o b j C ˆ i l o g C i + 1 C ˆ i l o g 1 C i i = 0 K × K I i j o b j c c   lasscs p ˆ i ( c ) l o g p i ( c ) + 1 p ˆ i ( c ) l o g 1 p i ( c )
The loss function consists of three parts: the part is the error of the upper left vertex co-ordinate of the object frame and the frame width and height. The BCE (binary cross entropy) loss function is used for the upper left vertex co-ordinate error, and the MSE (mean square error) loss function is used for the frame width and height error; Confidence error and category error are represented by the obj part and the class part of the formula, and BCE error function is used. The loss function is an important evaluation index for network training results, and the model detection ability can be improved through the loss function optimization algorithm.

4. Image Object Detection Based on YOLOv5 Optimized by Mixed Attention Mechanism

The attention mechanism is a powerful strategy for improving the performance of neural network models. By applying different weights to the different regions of the input, the model is able to focus on the most important and discriminative characteristics. We tried to introduce attention mechanisms to improve the detection performance of YOLOv5.

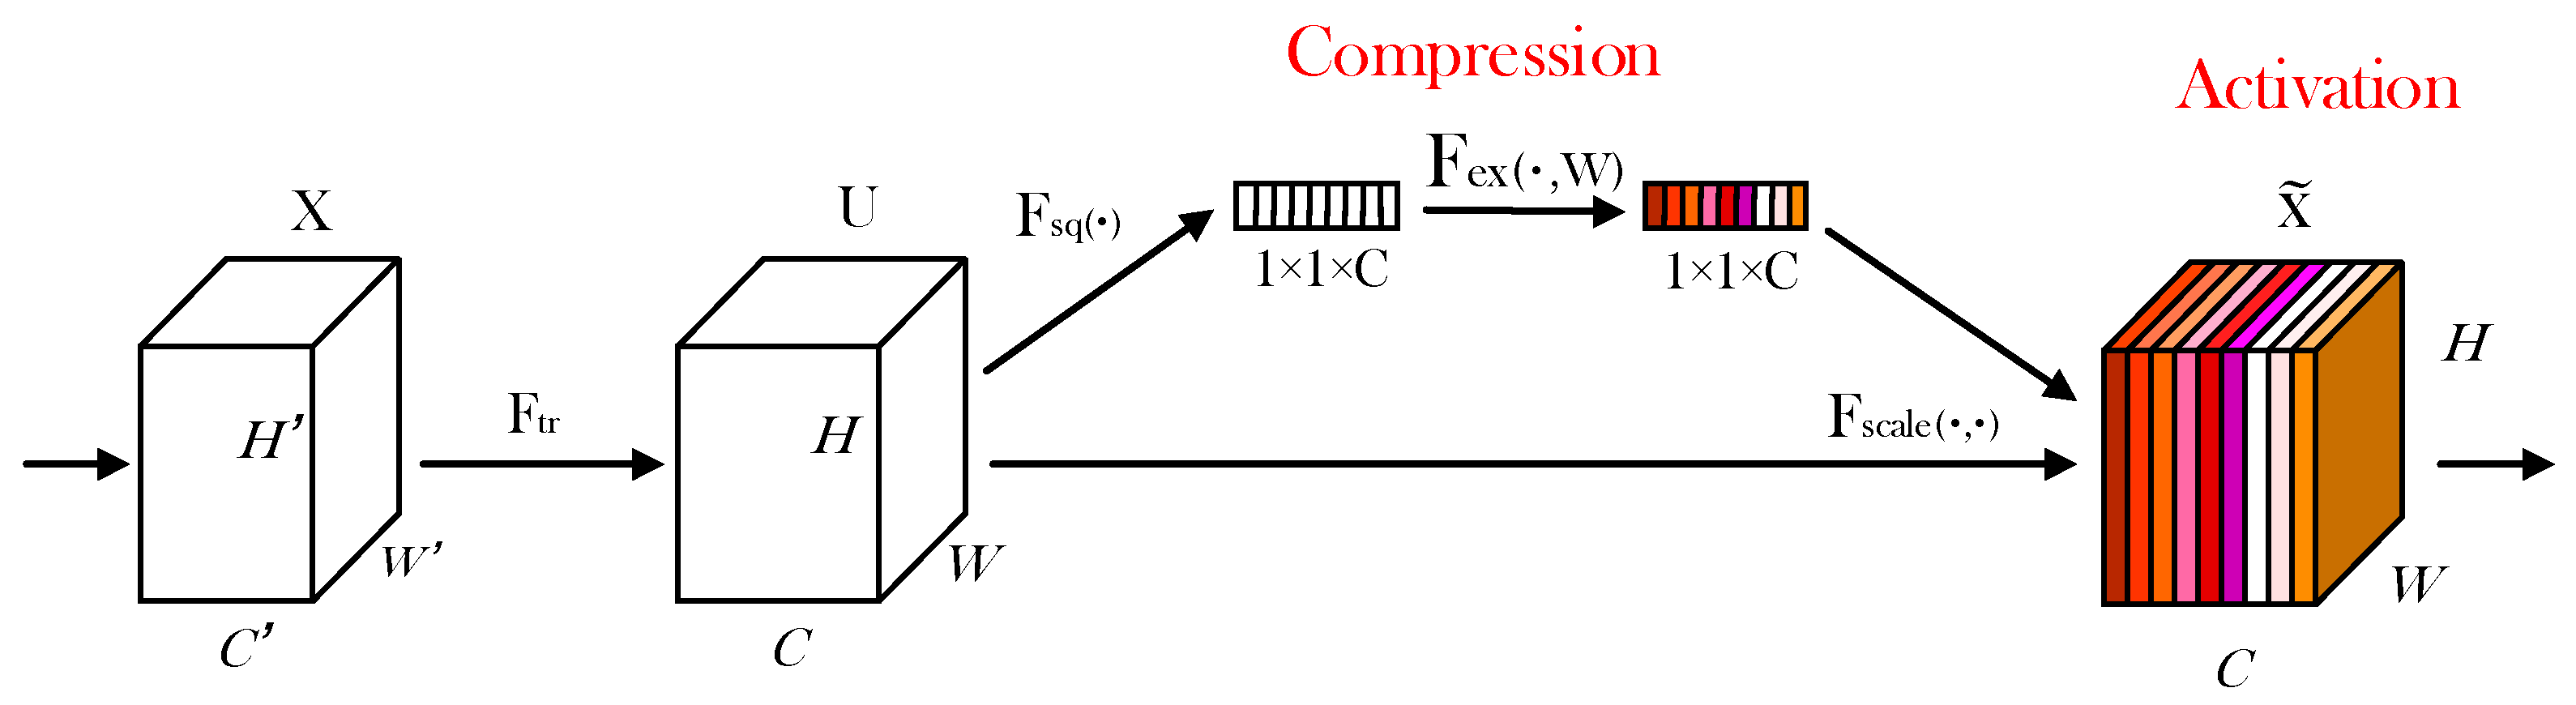
4.1. Attention Mechanism

4.1.1. Channel Attention Mechanism

The representative model of the channel attention mechanism is the squeeze and excitation network (SENet). SENet is divided into two parts: compression and activation. The purpose of the compression part is to compress the global spatial information, and then conduct feature learning in the channel dimension to form the importance of each channel. Finally, the activation part is used to assign different weights to each channel. Figure 7 shows the structure of the SENet module.
In the compression section, the dimension of the input element feature map is H × W × C. H, W, and C represents height, width, and number of channels, respectively. The function of the compression part is to change the dimension from H × W × C compressed to 1 × 1 × C. Namely, H × W is compressed to 1 × 1D. In the activation part, the dimension of 1 × 1 × C is integrated into the full connection layer, predicting the importance of each channel and then encouraging the operation on the corresponding channel of the preceding feature map. A simple gating mechanism and the Sigmoid activation function were adopted.

4.1.2. Spatial Attention Mechanism

The representative model of the spatial attention mechanism is the spatial transformer network (STN), which can transform various deformation data in space and automatically capture important regional features. It can ensure that the image can still obtain the same results as the original image after clipping, translation, or rotation. The STN network includes a local network, parametric network sampling (network generator), and differential image sampling.

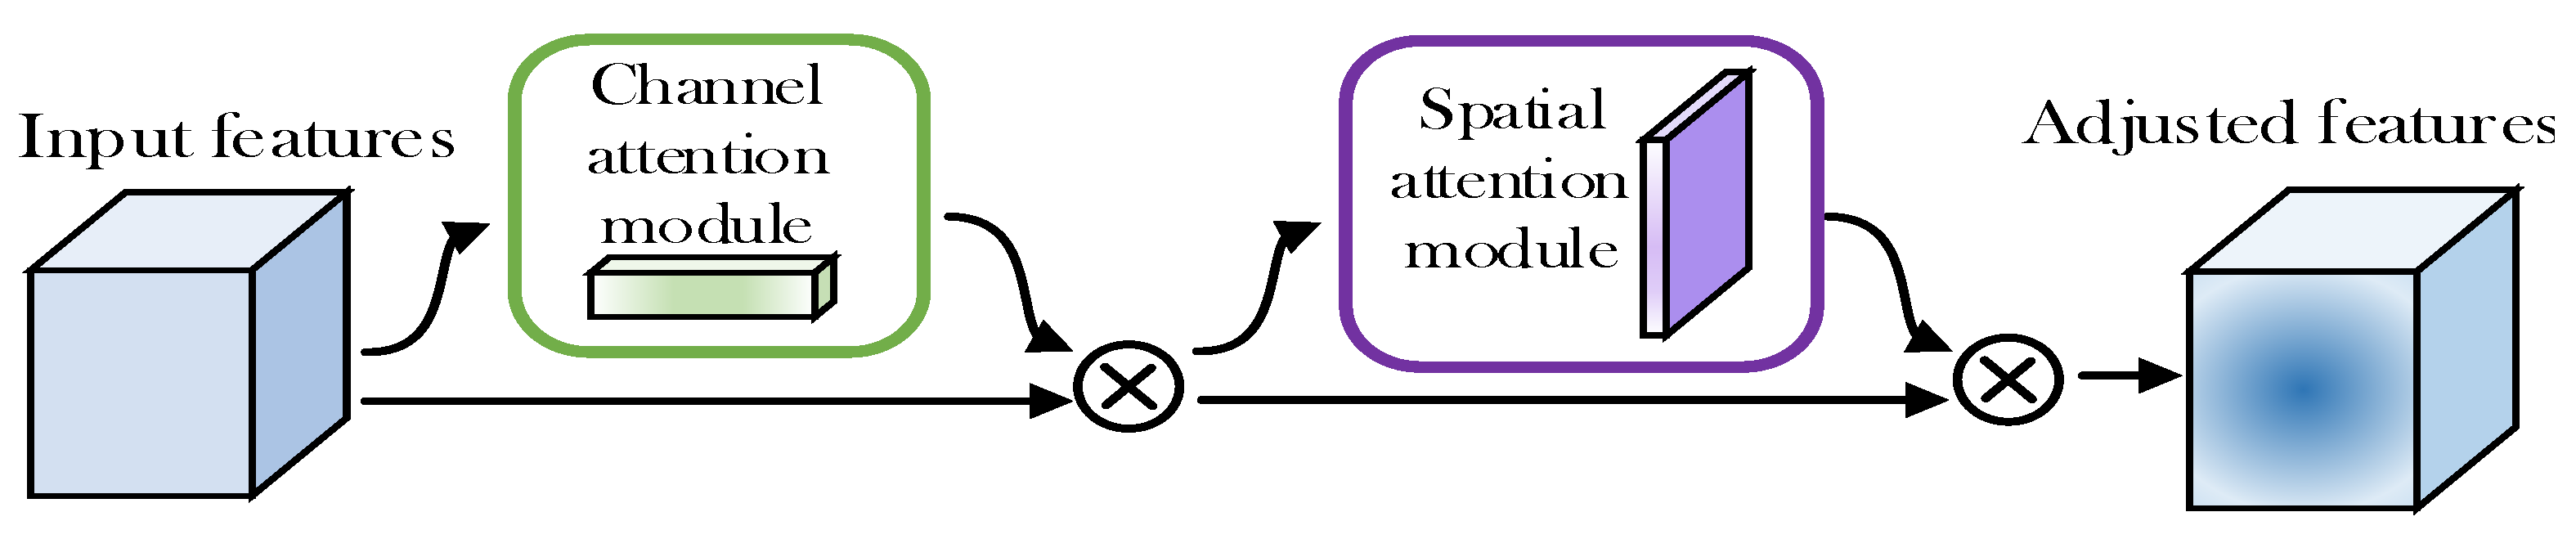
4.1.3. Mixed Attention Mechanism

In the combined attention mechanism, channel attention and spatial attention can be combined in series or parallel. The representative model of the mixed attention mechanism is the convolutional block attention module (CBAM), which includes the channel attention module CAM and the spatial attention module SAM. The model structure of CBAM is shown in Figure 8. It first processes the channel attention module for the input characteristic diagram; the result is processed by the spatial attention module, and finally, the adjusted feature is obtained.

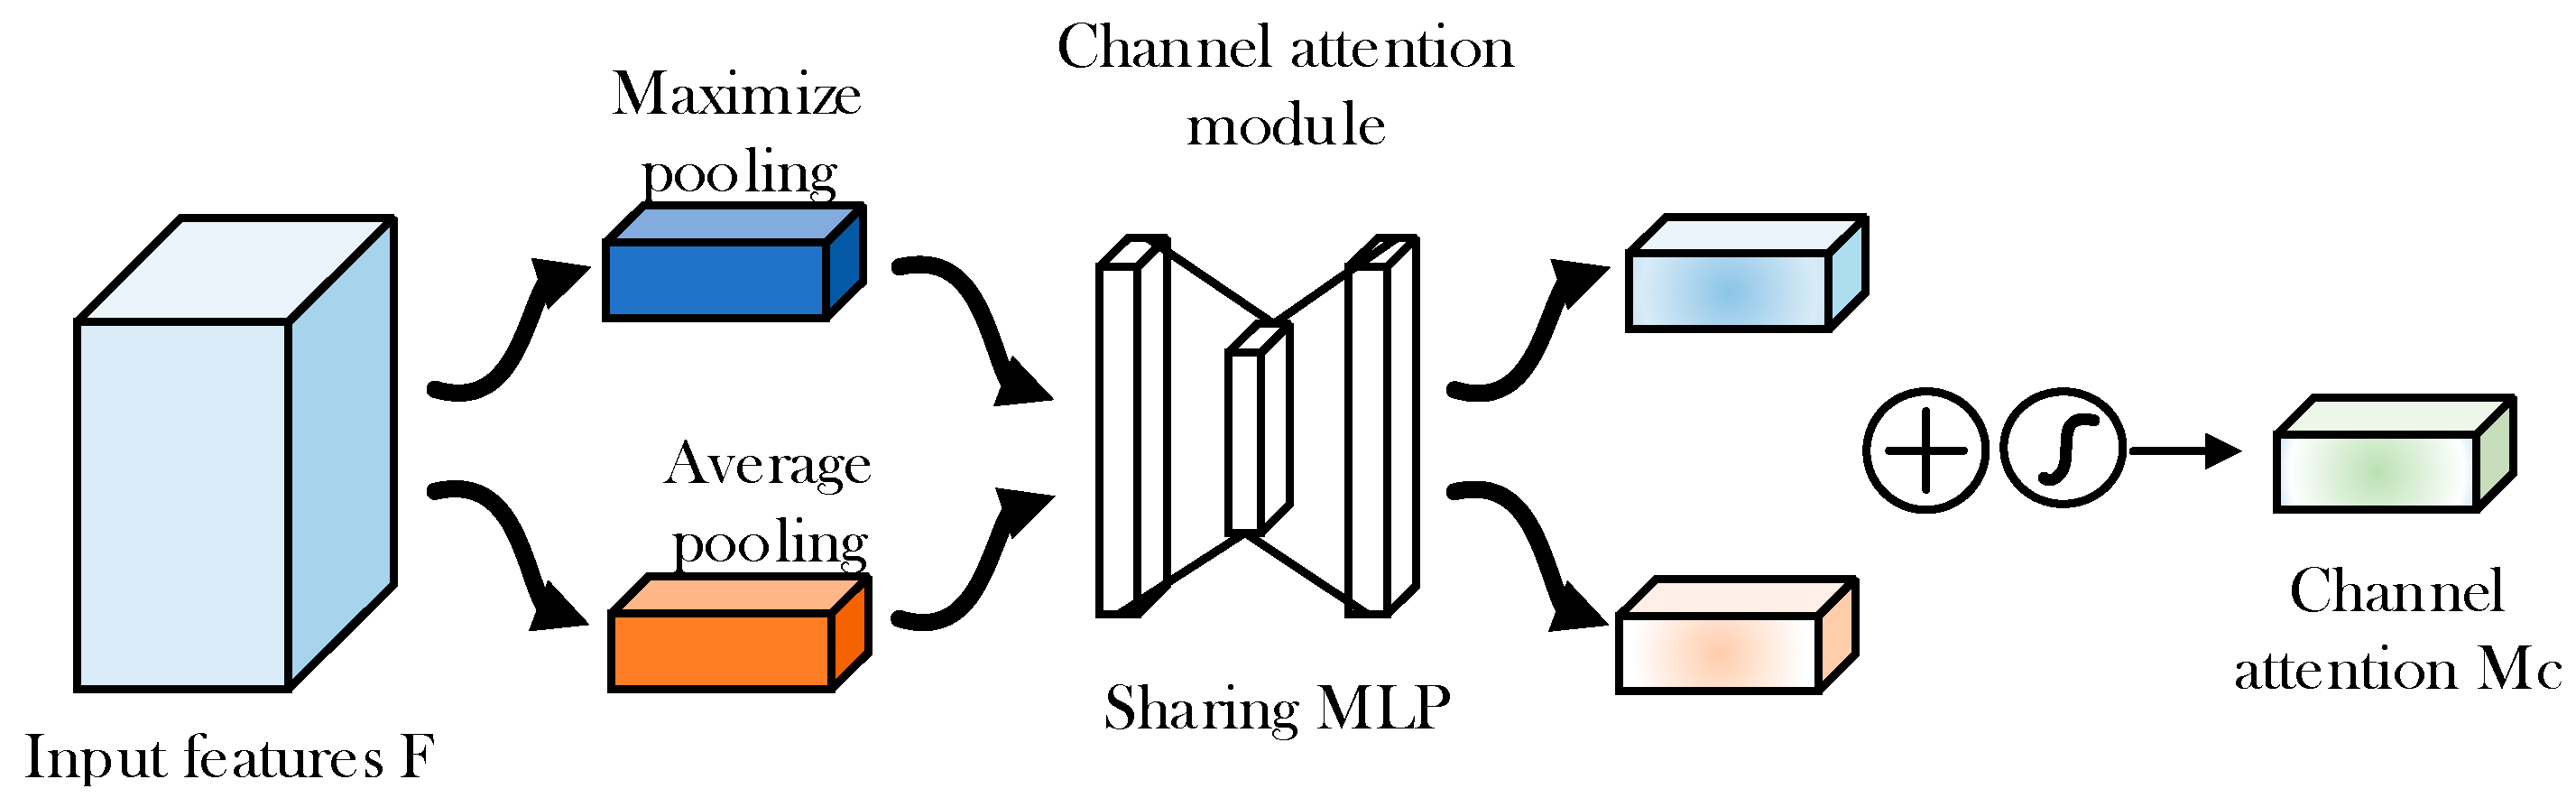
4.1.4. Channel Attention Module CAM

The input of CAM is a feature map, and the dimension is set as H × W × C, where H is the height of the feature map, W is the width, and C is the number of channels. The thought process is represented by the following: first, the input characteristic graph is pooled globally and averagely; (pool the space dimensions to compress the space dimensions; facilitate the learning of the characteristics of the channel later). Then, the global and evaluation pooled results are sent to the multilayer perceptron for MLP learning; (based on the characteristics of the MLP learning channel dimensions and the importance of each channel). Finally, the MLP outputs the value result, performs the “add” operation, and then obtains the final “channel attention value” through the mapping processing of the Sigmoid function. Figure 9 shows channel attention module.
The calculation formula of channel attention is as follows:
M c ( F ) = σ ( M L P ( A v g P o o l ( F ) ) + M L P ( M a x P o o l ( F ) ) ) = σ W 1 W 0 F avg c + W 1 W 0 F m a x c
In the above formula, M c is channel attention, M L P is sharing, F is input feature, A v g P o o l is average pooling, and M a x P o o l is maximum pooling.

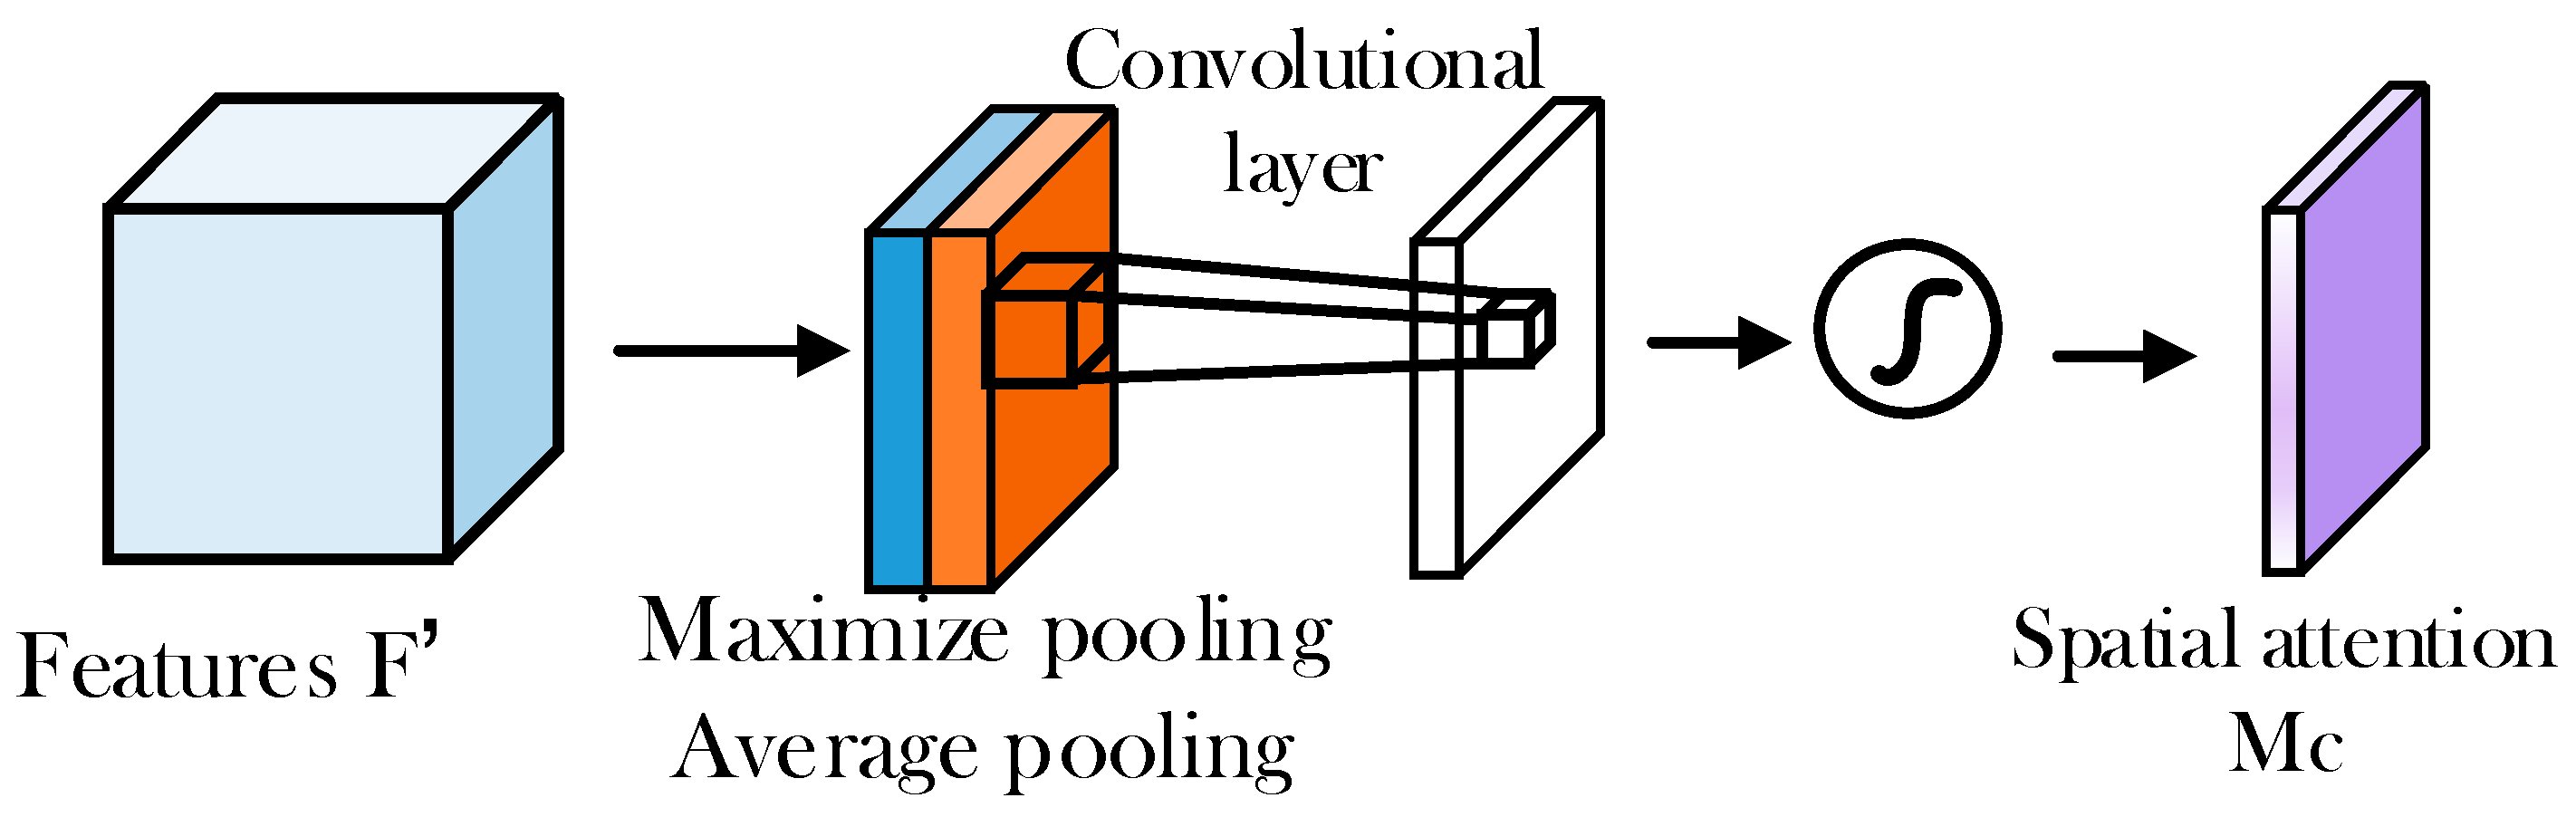
4.1.5. Spatial Attention Module SAM

The input of SAM is a feature map of the CAM output, and its process is represented by the following: first, the input characteristic graph is pooled globally and averagely; pooling is performed in the channel dimension to compress the channel size, and it is convenient to learn the characteristics of the space later. Then, the results of the global pooling and average pooling are spliced according to channels, and the dimensions of the feature map is H × W × 2. Finally, the splicing result is convolved, and the dimensions of the feature map is H × W × 1; it is then processed through the activation function. Figure 10 shows the spatial attention module.
The calculation formula of spatial attention is as follows:
M s ( F ) = σ f 7 × 7 ( [ A v g P o o l ( F ) ; M a x P o o l ( F ) ] ) = σ f 7 × 7 F ang s ; F m a x s
In the above formula, M s is spatial attention, F is feature, A v g P o o l is average pooling, and M a x P o o l is maximum pooling.

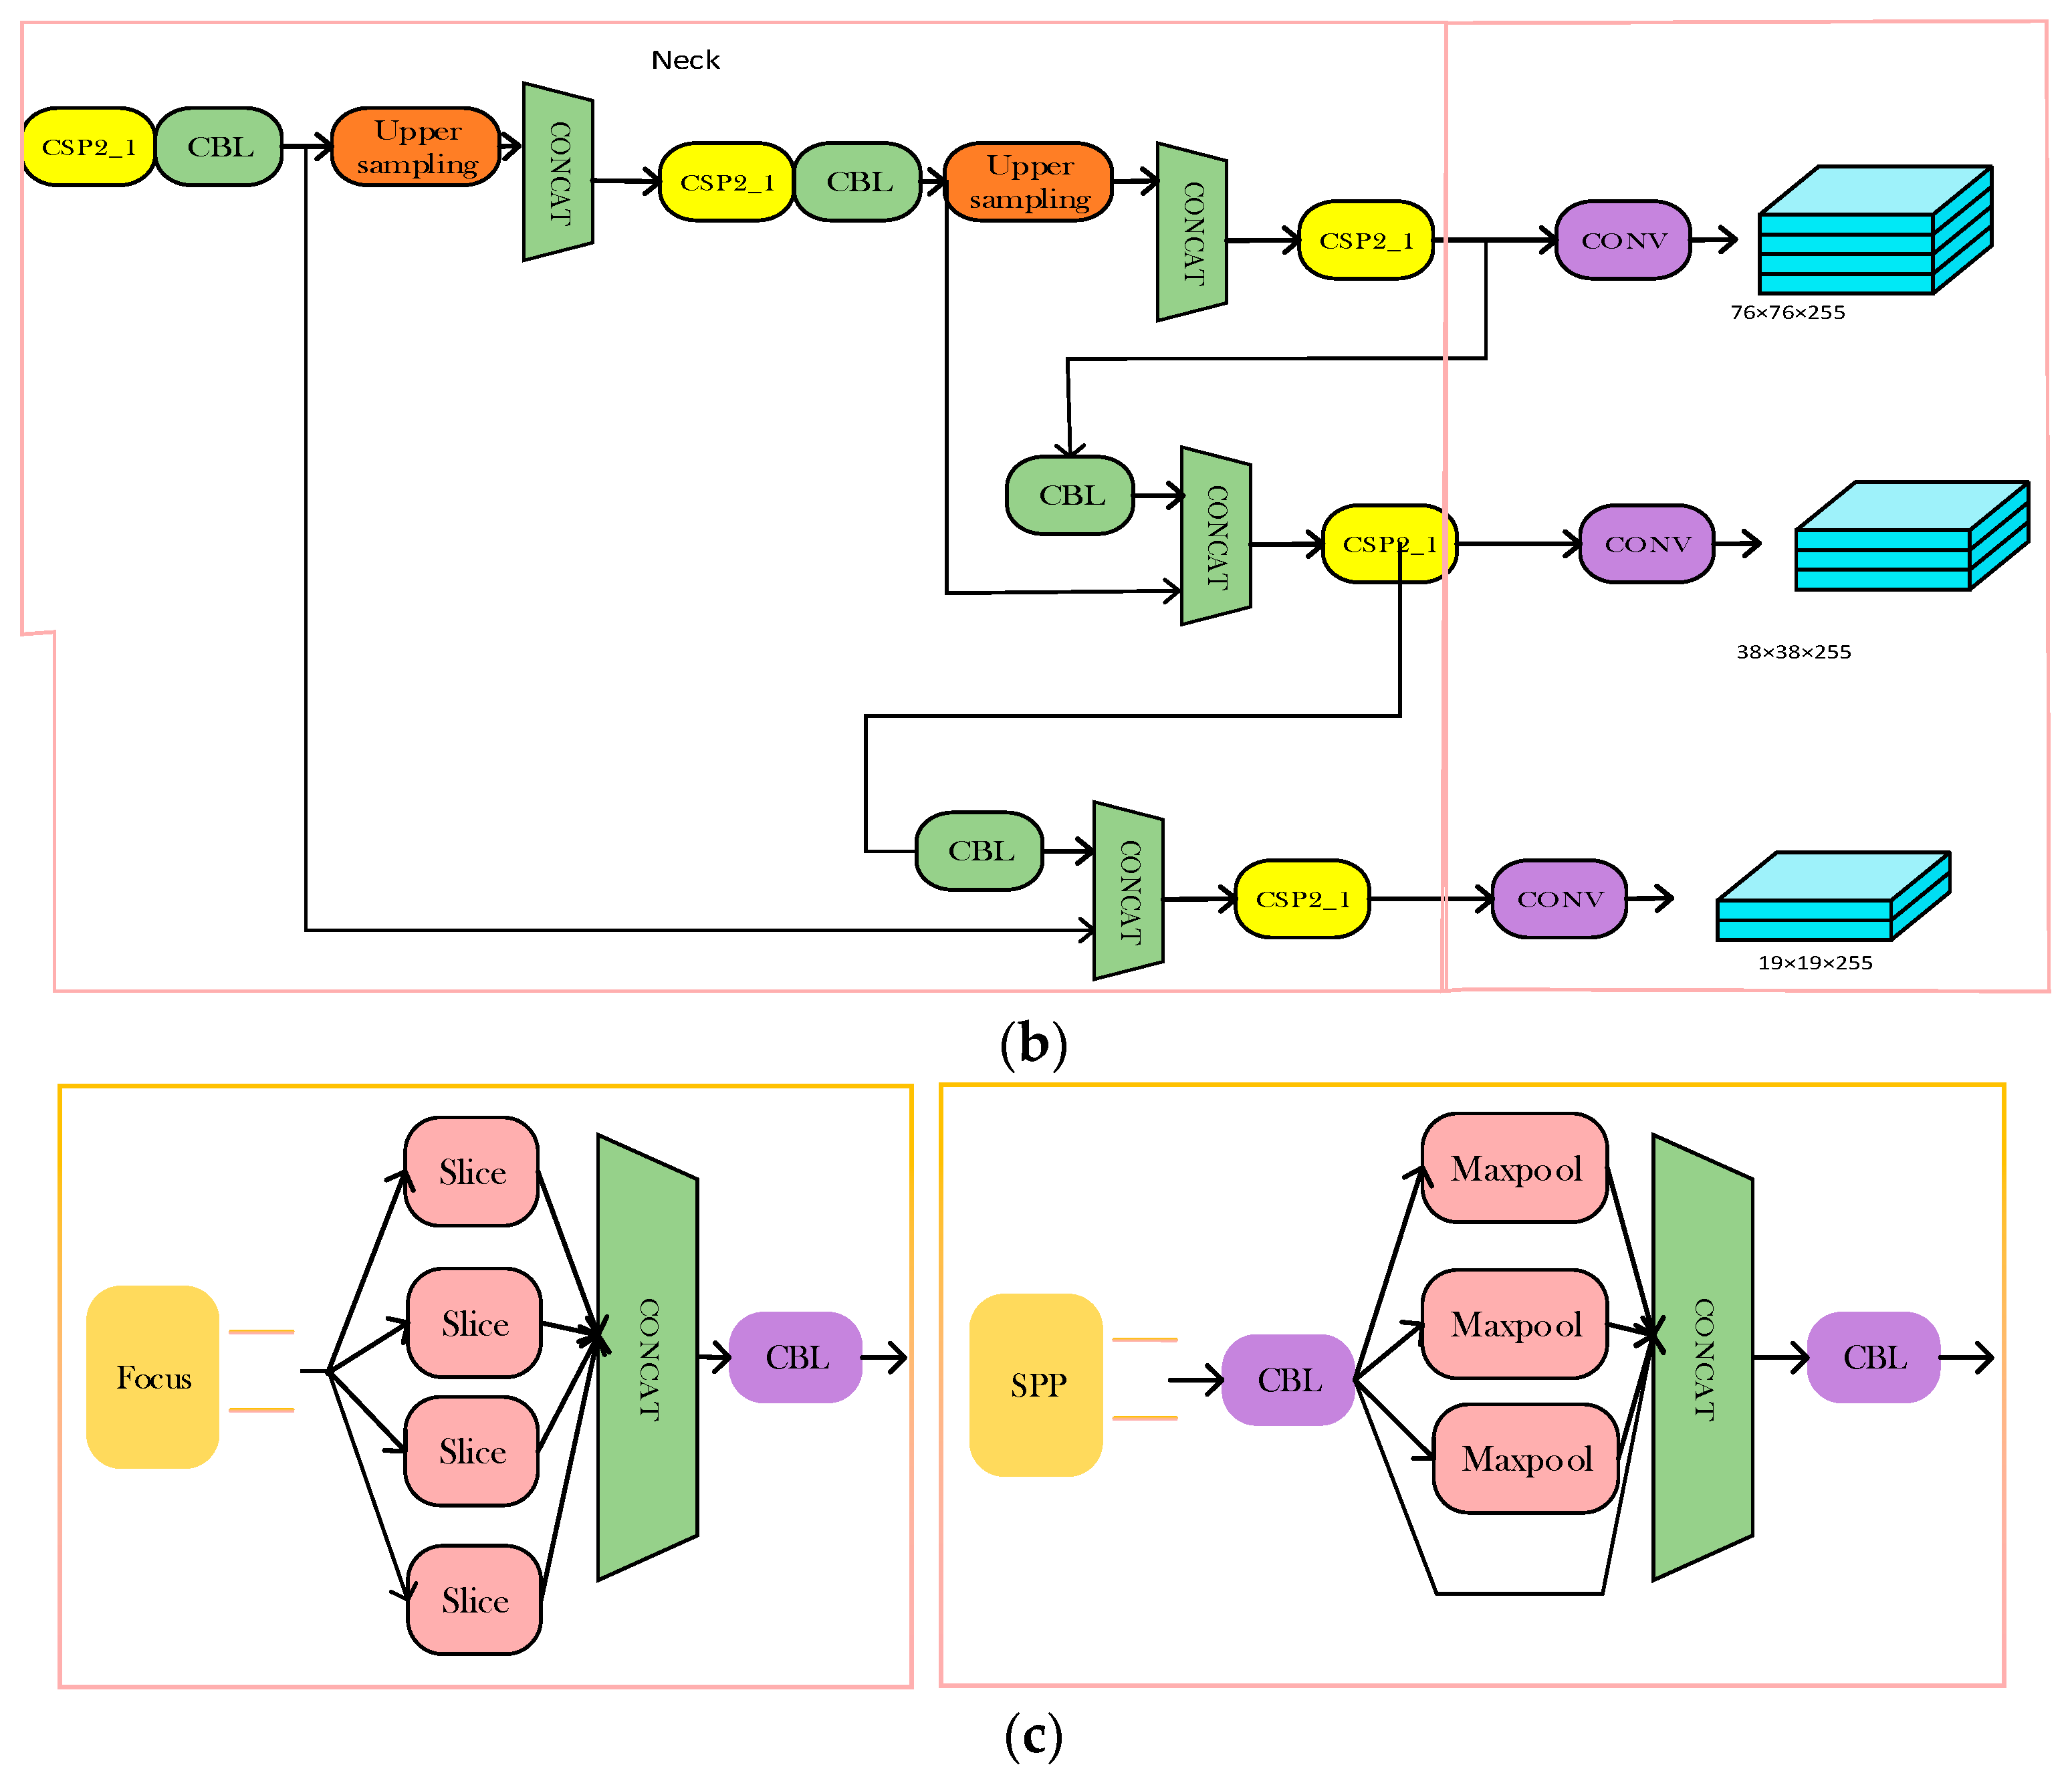
4.2. Construction of MAO-YOLOv5 Model Feature Extraction Structure

YOLOv5 is an improvement to the YOLO series algorithms, where the detection principle of the YOLO series algorithms is similar. First, take the whole input image as the input of the network and divide it into multiple N × N grids of the same size; each grid can predict B bounding BOXs, with a total of N × N × B candidates, where each of the boxes contains five variables (pc, bx, by, bh, bw). The original YOLO candidate box has serious defects, and its width and height are completely unrestricted, which easily leads to gradients that are out of control and unstable. YOLOv5 fixes this error and ensures that the center point remains unchanged. Therefore, the current equation for YOLOv5 limits the multiples of the anchor point from a minimum of 0 to a maximum of 4, and the anchor frame object matching is also updated based on the width and height multiples. Set the corresponding confidence threshold through non-maximum suppression (NMS) and select the anchor box of the maximum confidence to obtain the prediction box.
YOLOv5 has two CSP architectures. One is with X residual component (Resunit) modules, and the other is to replace Resunit with two CBL modules. Resunit is composed of two CBL convolution modules+residual networks, which are mainly used in the backbone network. The backbone network is mainly composed of CSPdarknet+SPP. Backbone is a deeper network system. Therefore, adding Resunit can improve the gradient value during reverse transmission between the layers, thus preventing the gradient generated by the increase from gradually disappearing so as to obtain more fine-grained characteristics without worrying about network fading.
The network structure of MAO-YOLOv5 is divided into four parts: input, backbone, neck module, and head; it mainly advances the feature extraction operation and needs to adjust the step size of the convolution core of the last convolution structure in the Backbone structure to 1 so as to achieve the fusion operation of the features with the same scale as the neck layer. In the original YOLOv5 structure, the convolution structure, encapsulated by 2D convolution, the BN layer, and the SiLU activation function, is used for down-sampling operations, and the sliding operation step of its convolution core is 2.
After MAO-YOLOv5 conducts 1 × 1 convolution and 3 × 3 convolution operations, a new SE module is added. The SE module first pools the input feature map globally, and then, through a two-layer full connection structure, the correlation between complex channels can be established. Through weight normalization and channel weighting, the channels with high-weight ratios will receive more attention so as to achieve the goal of improving channel attention. The feature map output from the bottle-neck layer is further input into the neck of the network. The neck is constructed as a pyramid network structure. The function is to divide the detector head into three different sizes, namely, large, medium, and small while ensuring that the underlying information is not lost so that the network can have good detection results for targets of different sizes. The neck contains multiple CSP bottleneck layers, and each CSP bottleneck layer contains several bottleneck layers added with SE modules. Therefore, the CSP bottleneck layer enriches the gradient combination of the architecture and improves the speed and accuracy of reasoning while reducing the amount of network computation and computing costs.
Due to the sliding window mechanism of the MAO-YOLOv5 network, a target may generate multiple detection frames. In order to make the detection results more accurate, non-maximum suppression (NMS) can be applied to find the detection frame with the maximum probability, and then a judgment can be made whether the intersection ratio of other detection frames and the detection frame is greater than the set threshold. If it is greater than the threshold, remove the detection box. If it is less than the threshold value, the detection frame will be retained, and it will be merged with the original detection frame, and finally, the rectangle processing will be performed.
MAO-YOLOv5 advances the feature extraction operation and the corresponding feature scale extracted is twice the feature scale extracted from the YOLOv5 Backbone structure. It cannot be fused with the corresponding layer of the FPN feature extraction of the neck layer. The convolution kernel step of the last convolution structure in the Backbone structure needs to be modified to 1 to successfully achieve the operation of feature extraction in advance. The modules of the MAO-YOLOv5 network structure are shown in Figure 11 below.
As can be seen from Figure 11, MAO-YOLOv5 mainly changes the feature extraction structure of the Backbone part (cf. Figure 11a) of the YOLOv5 benchmark network. The original network feature extraction operation is carried out in advance. The object features are extracted from the first C3 module of the Backbone structure and horizontally integrated into the feature layer of the same scale at the neck layer (cf. Figure 11b); After the SPPF structure (cf. Figure 11c), the SENet attention mechanism is introduced to reconstruct the feature weight of the detected object and background information; we added a context feature fusion structure at the head end of YOLOv5 network. This structure fuses the three feature maps used to predict the object at the head end, uses the transposed convolution to transform the width and height scales of the deepest and subdeep features, and sets the channel scale of both to half of the shallow feature channel scale as the context information and shallow feature splicing for feature fusion.

4.3. Modified Loss Function

In the object detection task of YOLOv5, in order to make the predicted value of the model closer to the real value, even if the prediction box is closer to the real box, three loss functions are introduced for optimization. One is classification loss, the other is confidence loss, and the final one is regression loss, that is, boundary box positioning loss. GIou loss is used as the loss of the bounding box. The probability of this class and the loss to the object value can be calculated by using binary cross entropy and the logits loss function. The category loss is binary cross entropy loss. The formula is as follows:
L cla ( o , c ) = i p o s   Σ j c i a o i j l n c ˆ i j + 1 o i j l n 1 c ˆ i j N p o s c ˆ i j = s i g m o i d c i j
where o i j [ 0,1 ] , indicating whether the j-type object exists in the prediction object bounding box i, c i j is the predicted value, c ˆ i j is c i j prediction confidence obtained by Sigmoid function, N p o s is the number of positive samples.
Binary cross entropy used for confidence loss:
L corf ( o , c ) = i   o i l n c ˆ t + 1 o i l n 1 c ˆ t N c ˆ t = s i g m o i d c i
where o i [ 0,1 ] , indicating the IoU of the predicted object bounding box and real object bounding box, c is the predicted value, c ˆ i is the prediction confidence obtained by Sigmoid function, N is the number of positive and negative samples, and category loss function also uses binary cross entropy loss.

5. Experimental Process and Result Analysis

Two datasets, VOC2007 and VOC2012, were utilized to compare the advantages of MAO-YOLOv5 compared to YOLOv3, YOLOv5, and SSD. Furthermore, some of the typical pictures of the object detection results are listed to visualize the high performance of MAO-YOLOv5.

5.1. Experiment Configuration and Dataset

The hardware equipment of the experiment was an AMD Ryzen 7 5800H CPU@3.20GHz NVIDIA GeForce GTX1650 GPU, with 4G GPU memory. PASCAL VOC is a popular universal detection dataset (http://host.robots.ox.ac.uk/pascal/VOC/) (accessed on 21 October 2022), so this chapter conducts experimental training using the VOC dataset. The VOC dataset includes detection, segmentation, human body layout, action classification (Object Classification, Object Detection, Object Segmentation, Human Layout, Action Classification), etc. VOC2007 contains 9963 labeled images, which are composed of three parts: train/val/test, and 24,640 objects were marked. VOC 2012 contains 20 types of objects, 11,530 images in train and val, 27,450 target detection tags, and 6929 segmentation tags. During training, VOC2007 and VOC2012 are often put together for joint training to increase the number of samples so that the model can learn more features.

5.2. Evaluating Indicators

In this subsection, the experiment uses precision, mAP (mean average precision), frames per second (FPS), and P-R (precision recall) curves to evaluate the performance of the four object detection algorithms. Suppose that TP (True Positive) means that the positive samples are correctly classified into positive samples, FP (False Positive) means that negative samples are wrongly classified into negative samples, FN (False Negative) means that positive samples are wrongly classified into negative samples, and TN (True Negative) means that negative samples are correctly classified into negative samples. The indicators are calculated as follows:
(1)
P-R curve
The P-R curve is a curve made with precision as the ordinate and the recall as the abscissa. The precision and recall are calculated as follows:
Precision = T P T P + F P   Recall = T P T P + F N
The P-R curve can judge the performance of the model, and the classifier with good performance can ensure that the Precision value remains a high value with the increase in Recall value; However, a classifier with poor performance may lose more Precision values in order to improve the Recall value. In addition, the P-R curve of the classifier with good performance has a larger offline area.
(2)
mAP
mAP stands for the Average Precision (AP) of all categories. The AP value is obtained by calculating the area under the P-R curve. Assuming that A P i represents the average recognition accuracy of the ith category, the calculation of mAP is as follows:
MAP stands for Average Precision (AP) of all categories. The AP value is obtained by calculating the area under the P-R curve. Assuming that A P i represents the average recognition accuracy of the ith category, the calculation of mAP is as follows:
m A P = i = 1 n   A P i n
n represents the total number of categories tested.

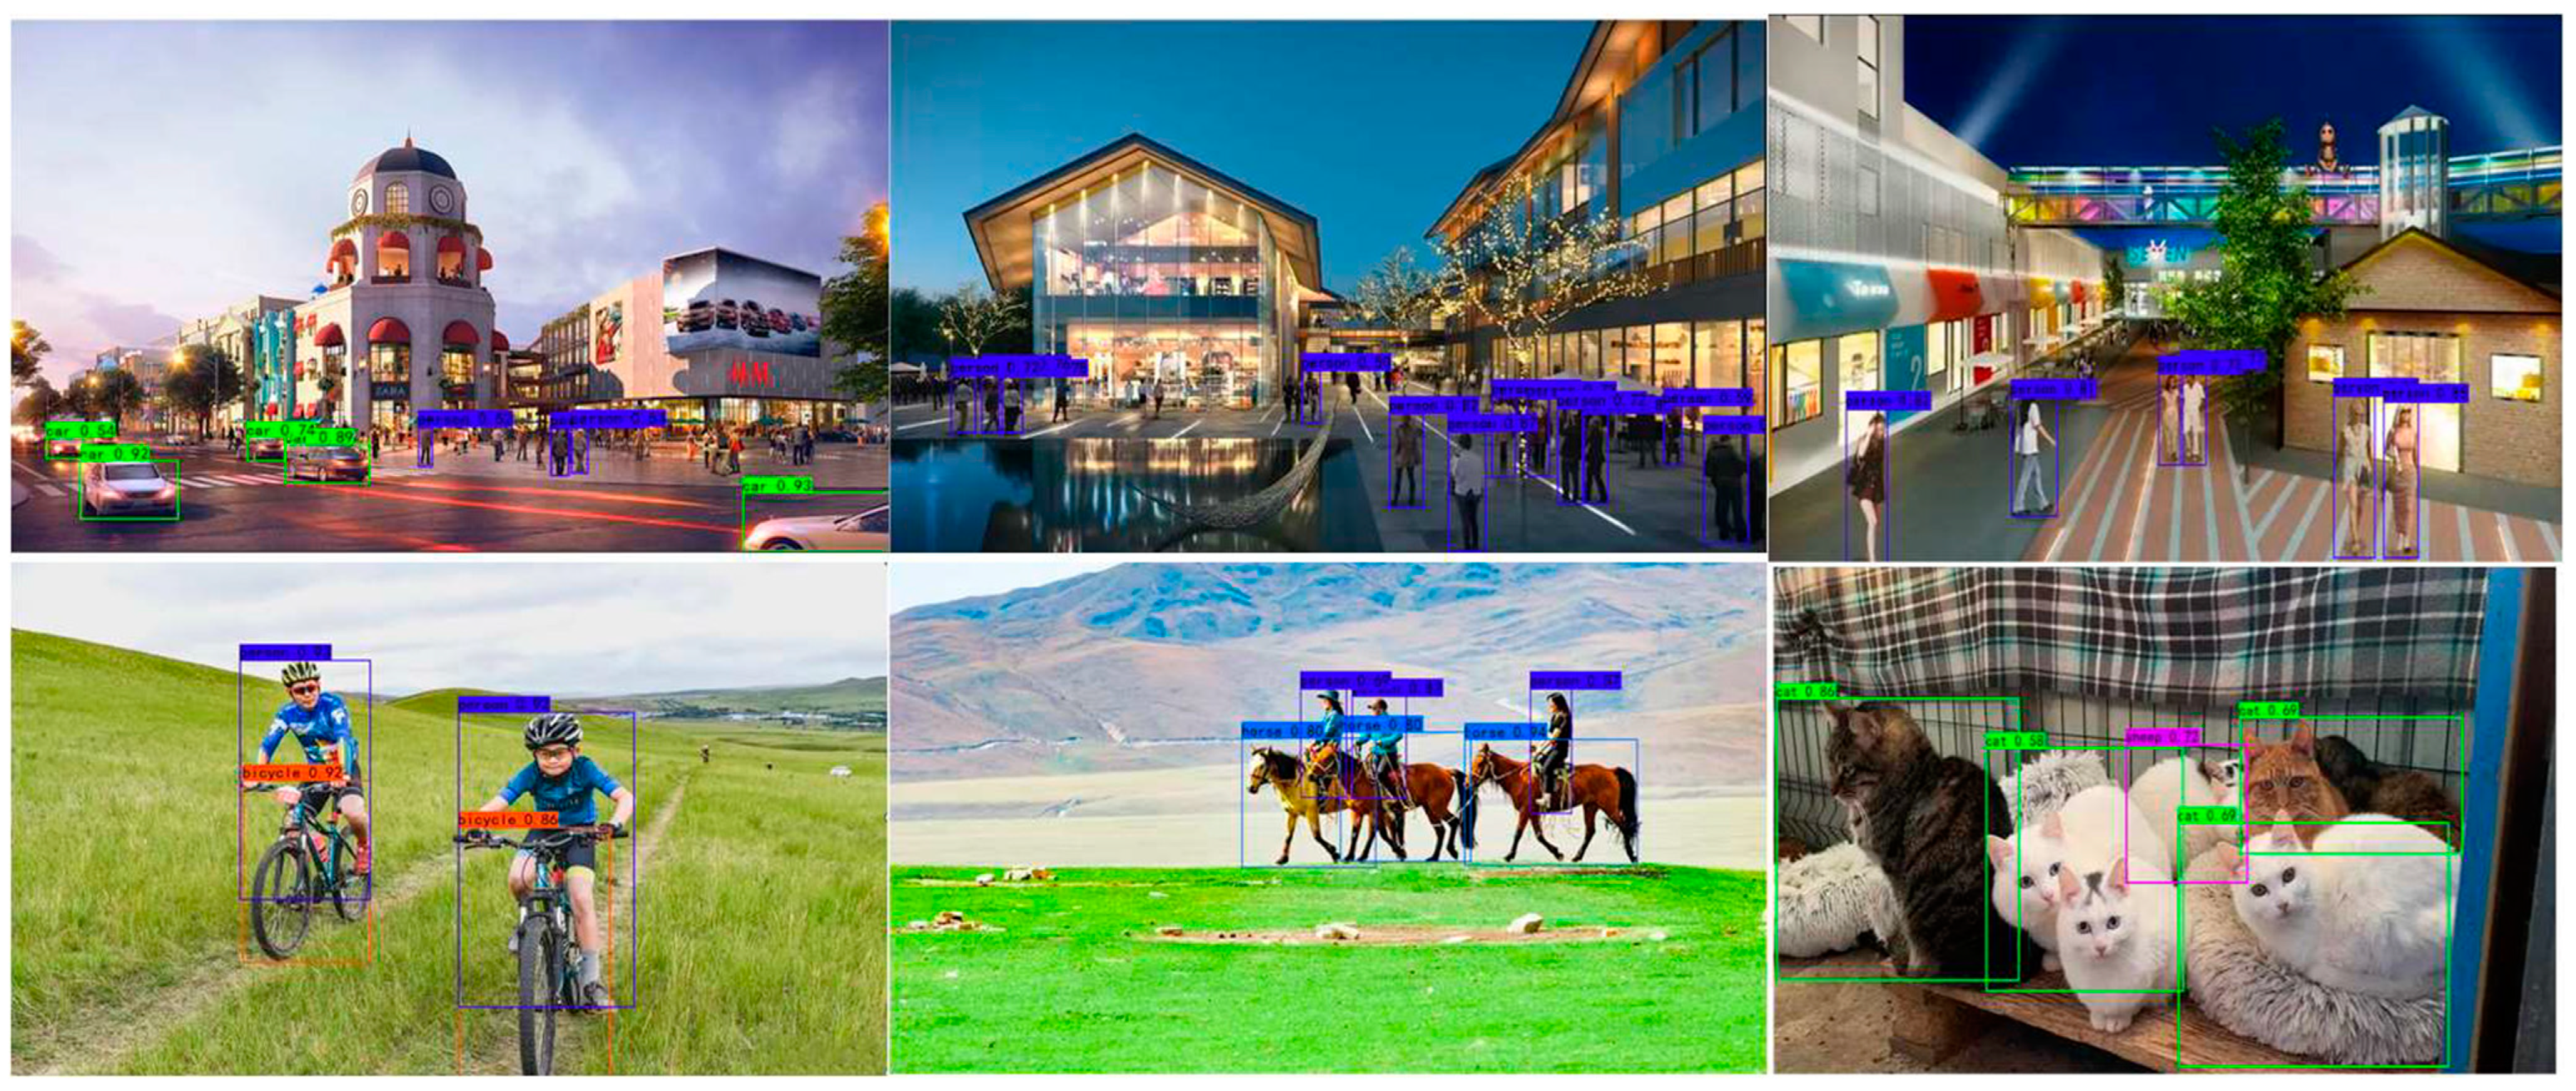
5.3. Experimental Process and Result Analysis

In this study, the method a comparative experiment was adopted. Three object detection models were tested on the PASCAL VOC07+12 dataset, respectively, and the experimental results were analyzed. In the process of training the four object detection algorithms, YOLOv3, YOLOv5, SSD, and MAO-YOLOv5, instead of retraining the feature extraction network, the migration learning method was used to load the model with pretrained weight files with better performance, reducing the number of model training times and improving the model performance to a certain extent. In addition, the model training was divided into two stages: freezing and unfreezing to improve the training speed in the early stage of the model, but the weight value of the trunk is not necessarily suitable for this dataset, so it is necessary to unfreeze the model to make its training jump out of the local optimal solution. We set Epoch to 150, where Freeze_ Epoch was set to 50. First, we fine-tuned the network and then defrosted it to improve the accuracy of the model. As the three object detection algorithms were compared, random gradient descent was used to optimize and adjust the weight. In order to prevent weight attenuation, we set the weight decay to 5 × 10⁻⁴.
In this study, four object detection algorithms were used to train on the PASCAL VOC07+12 dataset. Among the four algorithms, YOLOv3, YOLOv5, SSD, and MAO-YOLOv5, MAO-YOLOv5 had the best performance. The mAP value reached 92.3%, followed by SSD; YOLOv3 only reached 82.36%, as shown in Table 1.
Although MAO-YOLOv5 is superior to the other three models in mAP or other classified APs, there are still differences in the categories, such as bus, airplane, cow, sheep, horse, bird, tv monitor, car, bicycle, and person. The AP values of the corresponding categories are more than 95%, while those of chair, dining table, and potted plant are less than 85%. The same model corresponds to the objects of different categories, and the maximum average recognition accuracy is 19.01%. The category with the largest gap in YOLOv3 reached 33%, which further verifies the performance advantages of MAO-YOLOv5.
We can also observe the AP values of MAO-YOLOv5 in different categories by viewing the P-R curves of the different categories. The larger the area under the curve, the better the performance of the model in this category. As shown in Figure 12, the performance of the model in different categories is different, but the overall effect is better.
MAO-YOLOv5′s improvements compared with other object detection algorithms mainly include enhanced picture data using Mosaic technology; adaptive image compression technology can scale images of different scales to a fixed scale, which is convenient for network training; the Backbone network adds a focus structure and feature extraction network (CSP) structure; neck adds an FPN+PAN module for network feature fusion; GIOU is used in the output (head). GIOU_Loss is the loss function of the bounding box.
GIOU is an improvement of IOU. IOU represents the intersection and merger ratio between the real box A and the prediction box B. The expression is
I O U = A B A B
However, there are two problems with IOU. If the loss is 0, the model can be updated by training, and the parameters can be optimized. The degree of overlap between the two cannot be accurately reflected. In order to solve the problem of gradient disappearance without overlap, GIOU adds a penalty term on the basis of IOU, which can better reflect the closeness and coincidence of two boxes than IOU. The GIOU expression is as follows:
G I O U = I O U [ C ( A B ) ] [ C ]
DIOU uses the ratio of the square of the distance between the center point of the real box and the prediction box and the square of the diagonal length of the minimum box as a part of the measurement standard. The calculation method and loss of DIOU are as follows:
D I O U B , B g t = I O U B , B g t ρ 2 B , B g t C 2 L D I O U B , B g t = 1 D I O U B , B g t
DIOU solves the problem that IOU cannot accurately reflect the coincidence between two frames, making the center point of the prediction frame close to the center point of the real frame. At the same time, DIOU can converge faster than GIOU.
Figure 13 shows the detection effect of the three object detection algorithms in the same picture.
The results show that the recognition ability of SSD in a dense crowd is slightly weaker than the YOLO algorithm. MAO-YOLOv5′s effect on smaller-scale objects and dense objects is better than the two other algorithms, and its detection speed is faster. The MAO-YOLOv5 algorithm reserves more feature information for multiscale objects in the dataset and can accurately identify and present their location and classification. At the same time, it can also effectively distinguish and recognize some small objects and objects with dense overlap.
In order to more intuitively show the performance of the MAO-YOLOv5 object detection algorithm, this paper shows the image detection effects of different types and scales in Figure 14.
The results show that MAO-YOLOv5 can detect multiscale objects and is less affected by the background, correctly matching the object with its corresponding category, which can meet the effective object detection requirements. MAO-YOLOv5 can effectively improve the detection accuracy of complex multiobjects and small objects. This structure carries out the initial feature extraction operation of YOLOv5 in advance to obtain more accurate location information of complex multiobjects and small objects.
As expected, the FPS of MAO-YOLOv5 (23.07) is lower than that of YOLOV5 (34.69) owing to the integration of the attention mechanism module, but it is still higher than that of the other methods and has certain benefits. More research will be undertaken to understand how to increase the FPS in the future.

6. Conclusions and Future Work

The rise of deep learning has promoted the rapid development of computer vision. Although the current object detection algorithm based on deep learning has solved many practical problems, it can continue to improve its accuracy and speed by optimizing the current model. This paper first analyzes the object detection algorithms SSD, YOLOv3, and YOLOv5 based on deep neural networks and focuses on the network structure, loss function, and anchor frame of the YOLOv5 model with good performance. On the basis of the above research, an MAO-YOLOv5 model based on the attention mechanism and context feature fusion is proposed. This model adds the SENet attention mechanism to the Backbone that optimizes the YOLOv5 structure and, at the same time, it adds a context feature-fusion structure. The deep semantic information is fused as the background information of shallow object features to solve the problem of the insufficient extraction of object semantic information. In the comparative experiment, this paper combines the PASCAL VOC 2007 and PASCAL VOC 2012 datasets as the entire dataset of this experiment, using them to train different deep neural network models. The experimental results show that the recognition accuracy of the proposed MAO-YOLOv5 model is better than the original YOLOv5 model, and its recognition accuracy is also better than other main object detection algorithms.
Image object detection should also consider the influence of object scale, differences in light brightness, multiobject overlap, and other factors, so the performance of deep neural networks should be further improved in the follow-up work. In addition, the dataset used in this paper also has shortcomings, such as the imbalance of the number of objects in different categories, which may affect the detection accuracy. We will also conduct further research into new YOLO versions: the YOLOv6, YOLOv7, and YOLOv8 models are available. These are the areas that need to be further improved in future research work.

Author Contributions

Conceptualization, G.S. and J.X.; writing—original draft preparation, G.S.; writing—review and editing, S.W. and J.X. project administration, J.X. All authors have read and agreed to the published version of the manuscript.

Funding

This Paper was funded by the High-level Talents Funding Project of Hebei Province (Grant NO. A202105006); and the Hebei Provincial Higher Education Science and Technology Research Key Project (Grant No. ZD2021317).

Institutional Review Board Statement

Not applicable.

Informed Consent Statement

Not applicable.

Data Availability Statement

The data (PASCAL VOC 2007 and 2012) supporting this paper are available from the below links: http://host.robots.ox.ac.uk/pascal/VOC/ (accessed on 21 October 2022).

Conflicts of Interest

The authors declare no conflict of interest.

References

  1. Wu, Y.; Zhang, H.; Li, Y.; Yang, Y.; Yuan, D. Video Object Detection Guided by Object Blur Evaluation. IEEE Access 2020, 8, 208554–208565. [Google Scholar] [CrossRef]
  2. Zhang, Q.; Wan, C.; Han, W.; Bian, S. Towards a fast and accurate road object detection algorithm based on convolutional neural networks. J. Electron. Imaging 2018, 27, 053005. [Google Scholar] [CrossRef]
  3. Kaur, J.; Singh, W. Tools, techniques, datasets and application areas for object detection in an image: A review. Multimed. Tools Appl. 2022, 81, 38297–38351. [Google Scholar] [CrossRef]
  4. Zhang, Z.; Lu, X.; Liu, F. ViT-YOLO: Transformer-based YOLO for object detection. In Proceedings of the 18th IEEE/CVF International Conference on Computer Vision (ICCV), OCT 2021, Montreal, QC, Canada, 10–17 October 2021; pp. 2799–2808. [Google Scholar]
  5. Silva, L.P.E.; Batista, J.C.; Bellon, O.R.P.; Silva, L. YOLO-FD: YOLO for face detection. In Proceedings of the 24th Iberoamerican Congress on Pattern Recognition (CIARP), OCT 2019, Havana, Cuba, 28–31 October 2019; Volume 11896, pp. 209–218. [Google Scholar]
  6. Yan, B.; Li, J.; Yang, Z.; Zhang, X.; Hao, X. AIE-YOLO: Auxiliary Information Enhanced YOLO for Small Object Detection. Sensors 2022, 22, 8221. [Google Scholar] [CrossRef] [PubMed]
  7. Ye, J.; Yuan, Z.; Qian, C.; Li, X. CAA-YOLO: Combined-Attention-Augmented YOLO for Infrared Ocean Ships Detection. Sensors 2022, 22, 3782. [Google Scholar] [CrossRef]
  8. Wang, K.; Liu, M. YOLO-Anti: YOLO-based counterattack model for unseen congested object detection. Pattern Recognit. 2022, 131, 108814. [Google Scholar] [CrossRef]
  9. Xu, P. Progress of Object detection: Methods and future directions. In Proceedings of the 2nd IYSF Academic Symposium on Artificial Intelligence and Computer Engineering, Xi’an, China, 8–10 October 2021; Volume 12079. [Google Scholar]
  10. Murthy, C.B.; Hashmi, M.F.; Bokde, N.D.; Geem, Z.W. Investigations of Object Detection in Images/Videos Using Various Deep Learning Techniques and Embedded Platforms—A Comprehensive Review. Appl. Sci. 2020, 10, 3280. [Google Scholar] [CrossRef]
  11. Ma, D.W.; Wu, X.J.; Yang, H. Efficient Small Object Detection with an Improved Region Proposal Networks. In Proceedings of the 5th International Conference on Electrical Engineering, Control and Robotics (EECR), Guangzhou, China, 12–14 January 2019; Volume 533, p. 012062. [Google Scholar] [CrossRef]
  12. Fang, F.; Li, L.; Zhu, H.; Lim, J.-H. Combining Faster R-CNN and Model-Driven Clustering for Elongated Object Detection. IEEE Trans. Image Process. 2019, 29, 2052–2065. [Google Scholar] [CrossRef]
  13. Hu, B.; Liu, Y.; Chu, P.; Tong, M.; Kong, Q. Small Object Detection via Pixel Level Balancing With Applications to Blood Cell Detection. Front. Physiol. 2022, 13, 911297. [Google Scholar] [CrossRef]
  14. Afsharirad, H.; Seyedin, S.A. Salient object detection using the phase information and object model. Multimed. Tools Appl. 2019, 78, 19061–19080. [Google Scholar] [CrossRef]
  15. Du, L.; Sun, X.; Dong, J. One-Stage Object Detection with Graph Convolutional Networks. In Proceedings of the 12th International Conference on Graphics and Image Processing (ICGIP), Xi’an, China, 13–15 November 2020; Volume 11720. [Google Scholar]
  16. Yu, L.; Lan, J.; Zeng, Y.; Zou, J.; Niu, B. One hyperspectral object detection algorithm for solving spectral variability problems of the same object in different conditions. J. Appl. Remote Sens. 2019, 13, 026514. [Google Scholar] [CrossRef]
  17. Dong, Z.; Liu, Y.; Feng, Y.; Wang, Y.; Xu, W.; Chen, Y.; Tang, Q. Object Detection Method for High Resolution Remote Sensing Imagery Based on Convolutional Neural Networks with Optimal Object Anchor Scales. Int. J. Remote Sens. 2022, 43, 2677–2698. [Google Scholar] [CrossRef]
  18. Zhan, Y.; Yu, J.; Yu, T.; Tao, D. Multi-task Compositional Network for Visual Relationship Detection. Int. J. Comput. Vis. 2020, 128, 2146–2165. [Google Scholar] [CrossRef]
  19. Wang, Y.; Dong, Z.; Zhu, Y. Multiscale Block Fusion Object Detection Method for Large-Scale High-Resolution Remote Sensing Imagery. IEEE Access 2019, 7, 99530–99539. [Google Scholar] [CrossRef]
  20. Dong, Z.; Wang, M.; Wang, Y.; Liu, Y.; Feng, Y.; Xu, W. Multi-Oriented Object Detection in High-Resolution Remote Sensing Imagery Based on Convolutional Neural Networks with Adaptive Object Orientation Features. Remote Sens. 2022, 14, 950. [Google Scholar] [CrossRef]
  21. Hou, Q.; Xing, J. KSSD: Single-stage multi-object detection algorithm with higher accuracy. IET Image Process. 2020, 14, 3651–3661. [Google Scholar] [CrossRef]
  22. Xi, X.; Wang, J.; Li, F.; Li, D. IRSDet: Infrared Small-Object Detection Network Based on Sparse-Skip Connection and Guide Maps. Electronics 2022, 11, 2154. [Google Scholar] [CrossRef]
  23. Koyun, O.C.; Keser, R.K.; Akkaya, I.B.; Töreyin, B.U. Focus-and-Detect: A small object detection framework for aerial images. Signal Process. Image Commun. 2022, 104, 116675. [Google Scholar] [CrossRef]
  24. Kim, J.U.; Kwon, J.; Kim, H.G.; Ro, Y.M. BBC Net: Bounding-Box Critic Network for Occlusion-Robust Object Detection. IEEE Trans. Circuits Syst. Video Technol. 2019, 30, 1037–1050. [Google Scholar] [CrossRef]
  25. Lee, D.-H. CNN-based single object detection and tracking in videos and its application to drone detection. Multimed. Tools Appl. 2020, 80, 34237–34248. [Google Scholar] [CrossRef]
  26. Wu, T.; Liu, Z.; Zhou, X.; Li, K. Spatiotemporal salient object detection by integrating with objectness. Multimed. Tools Appl. 2017, 77, 19481–19498. [Google Scholar] [CrossRef]
  27. Wang, C.; Yu, C.; Song, M.; Wang, Y. Salient Object Detection Method Based on Multiple Semantic Features. In Proceedings of the 9th International Conference on Graphic and Image Processing (ICGIP), Ocean Univ China, Acad Exchange Ctr, Qingdao, China, 14–16 October 2017; Volume 10615. [Google Scholar]
  28. Kang, S. Research on Intelligent Video Detection of Small Objects Based on Deep Learning Intelligent Algorithm. Comput. Intell. Neurosci. 2022, 2022, 3843155. [Google Scholar] [CrossRef] [PubMed]
  29. Tong, K.; Wu, Y.; Zhou, F. Recent advances in small object detection based on deep learning: A review. Image Vis. Comput. 2020, 97, 103910. [Google Scholar] [CrossRef]
  30. Wu, X.; Sahoo, D.; Hoi, S.C.H. Recent advances in deep learning for object detection. Neurocomputing 2020, 396, 39–64. [Google Scholar] [CrossRef] [Green Version]
Figure 1. Flow chart of two-stage object detection algorithms.
Electronics 12 01515 g001
Figure 2. Flow chart of one-stage object detection algorithms.
Electronics 12 01515 g002
Figure 3. SSD network structure.
Electronics 12 01515 g003
Figure 4. Schematic diagram of prior frame prediction process.
Electronics 12 01515 g004
Figure 5. Schematic diagram of border regression.
Electronics 12 01515 g005
Figure 6. Residual structure.
Electronics 12 01515 g006
Figure 7. Structure of the SENet module.
Electronics 12 01515 g007
Figure 8. Model structure of CBAM.
Electronics 12 01515 g008
Figure 9. Channel attention module.
Electronics 12 01515 g009
Figure 10. Spatial attention module.
Electronics 12 01515 g010
Figure 11. MAO-YOLOv5 network structure. (a) Backbone module; (b) Neck module; (c) Focus and SPP module.
Electronics 12 01515 g011aElectronics 12 01515 g011b
Figure 12. P-R curves of MAO-YOLOv5 in different categories.
Electronics 12 01515 g012
Figure 13. Comparison of detection effects. (a) YOLOv3; (b) YOLOv5; (c) SSD; (d) MAO-YOLOv5.
Electronics 12 01515 g013
Figure 14. Detection effect of MAO-YOLOv5 in different environment.
Electronics 12 01515 g014
Table 1. mAP and FPS of different models on the PASCAL VOC dataset.
MethodmAPFPS
YOLOv382.36%16.74
YOLOv584.75%34.69
SSD86.64%18.99
MAO-YOLOv592.30%23.07
Disclaimer/Publisher’s Note: The statements, opinions and data contained in all publications are solely those of the individual author(s) and contributor(s) and not of MDPI and/or the editor(s). MDPI and/or the editor(s) disclaim responsibility for any injury to people or property resulting from any ideas, methods, instructions or products referred to in the content.

