Article

Intelligent Approaches to Fault Detection and Diagnosis in District Heating: Current Trends, Challenges, and Opportunities

1
Department of Computer Science, Blekinge Institute of Technology, 371 79 Karlskrona, Sweden
2
Unit Energy Technology, Flemish Institute for Technological Research (VITO), Boeretang 200, 2400 Mol, Belgium
3
EnergyVille, Thor Park 8310, 3600 Genk, Belgium
*
Author to whom correspondence should be addressed.
Electronics 2023, 12(6), 1448; https://doi.org/10.3390/electronics12061448
Submission received: 1 February 2023 / Revised: 4 March 2023 / Accepted: 13 March 2023 / Published: 18 March 2023
(This article belongs to the Special Issue Smart Energy Systems Using AI and IoT Solutions)

Abstract

:
This paper presents a comprehensive survey of state-of-the-art intelligent fault detection and diagnosis in district heating systems. Maintaining an efficient district heating system is crucial, as faults can lead to increased heat loss, customer discomfort, and operational cost. Intelligent fault detection and diagnosis can help to identify and diagnose faulty behavior automatically by utilizing artificial intelligence or machine learning. In our survey, we review and discuss 57 papers published in the last 12 years, highlight the recent trends, identify current research gaps, discuss the limitations of current techniques, and provide recommendations for future studies in this area. While there is an increasing interest in the topic, and the past five years have shown much advancement, the absence of open-source high-quality labeled data severely hinders progress. Future research should aim to explore transfer learning, domain adaptation, and semi-supervised learning to improve current performance. Additionally, a researcher should increase knowledge of district heating data using data-centric approaches to establish a solid foundation for future fault detection and diagnosis in district heating.

1. Introduction

In the next 30 years, the world’s population will grow by two billion [1], and urbanization level will grow by 13% [2], such that 68% of the world population will be living in urban areas. In Europe, around 72% of the population resides in cities, and by 2050 urbanization this will continue to increase to approximately 83.7%. Currently, more than half of the energy consumption in Europe is due to heating and cooling of buildings [3]. With the ongoing energy transition District Heating (DH) will have a crucial role and can contribute to reaching the European Union’s goal of achieving climate-neutrality by 2050 [4], as DH can provide higher efficiencies than, e.g., localized gas boilers.
DH networks consist of four key components: heat production unit(s), a distribution network, substations and building installations. The heat production unit(s) generate heat in several ways, such as by burning fossil fuels, biomass, waste heat recuperation, geothermal energy, or solar energy. The heat is then circulated as hot water through a network of insulated pipes that constitute the distribution network and arrives at the substation. The substation consists of a combination of heat exchangers, pumps, valves, and control systems, to regulate the flow and temperature to the building installations. The substation is the interface between the primary network (heat production unit and distribution network) and the secondary network (building internal systems). The building installation, or heat consumer, refers to a building or facility and their internal heating system that consumes heat for space heating system, Domestic HotWater system (DHW) or industrial processes.
Traditionally, DH utilities have primarily focused on increasing efficiency on the production side. However, recent studies indicate that between 43% and 75% of the studied substations [5,6] perform sub-optimal due to faults, resulting in high return temperatures, which negatively impacts customer comfort, heat retention, hydraulic capacity, and production efficiency [7]. Typical Fault Detection and Diagnosis (FDD) methods rely on manual inspections; however, DH operators face several major challenges when it comes to FDD, including aging infrastructure with limited sensors—many DH systems are decades old—and the immense size of DH networks, as networks may contain thousands of heat consumers, making identifying and diagnosing faults difficult. Moreover, manual FDD methods are time-consuming, costly, and error-prone; therefore, automatic fault handling becomes vital to retain an optimal network and reduce the impact of faults. Due to the ongoing trend of digitizing DH systems across the world, such as in Sweden, where legislation mandates the placement of automatic heat meters at every building substation for billing purposes, Machine Learning (ML) and Artificial Intelligence (AI) approaches have emerged as promising tools to enhance FDD in DH. Automatic heat meters periodically collect usage data, and by combining intelligent FDD using ML or AI, the methods have the potential to overcome the challenges DH operators face. For example, ML can process large amounts of data automatically and identify hidden patterns that may not be detected by manual methods. ML models can also be trained to identify and diagnose faults in real-time, leading to faster response times, reduced downtime, and reduce the impact of a fault.
In this paper, we have conducted a survey of 57 papers on the topic of intelligent FDD in DH systems. We attempt to provide a structured and comprehensive overview of the state-of-the-art in FDD in DH, as it is currently not present in the DH field. Additionally, to overcome the preceding shortcomings in Section 3, we present an in-depth analysis of FDD in DH and cover all relevant work from the past decade. We will highlight the advantages and disadvantages of the techniques, as well as the recent trends and key challenges in the field. Furthermore, we will provide suggestions for future research directions, which can guide the development of more effective FDD methods. We conclude the paper by summarizing the key findings for each topic to provide a clear understanding of the research progress in this field. In summary, our main contributions are:
  • We provide a comprehensive overview of state-of-the-art intelligent FDD in DH.
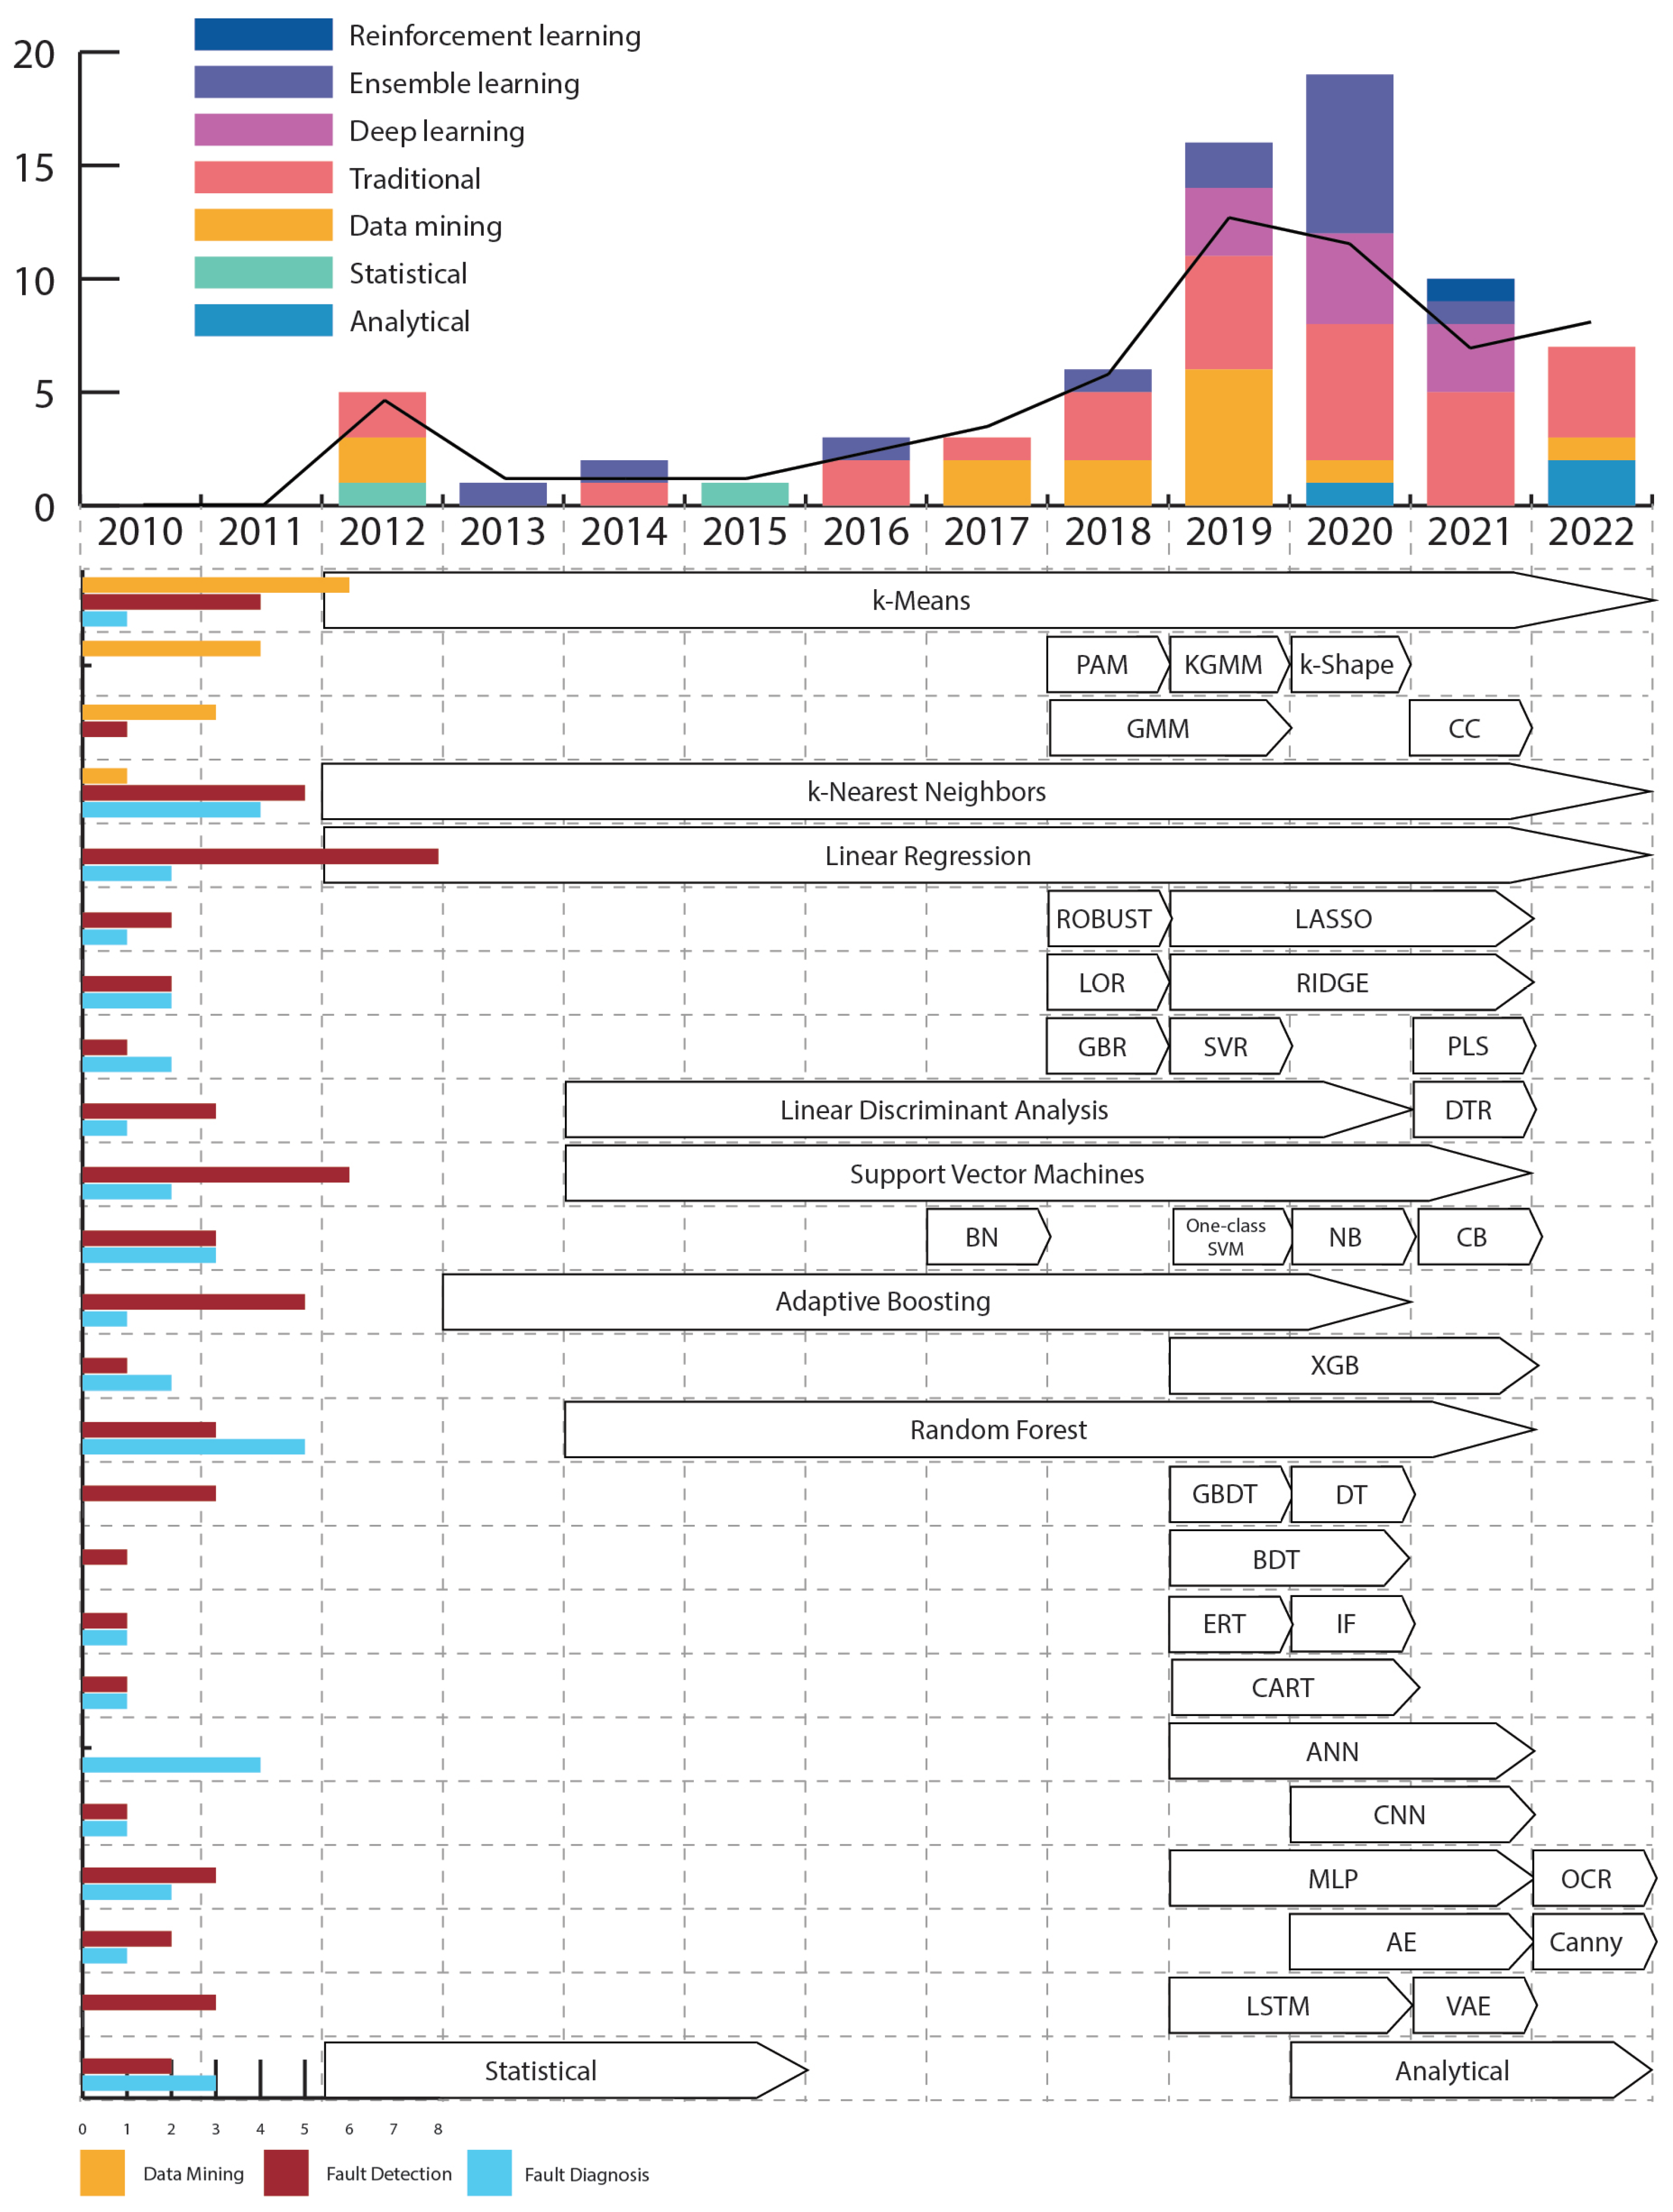
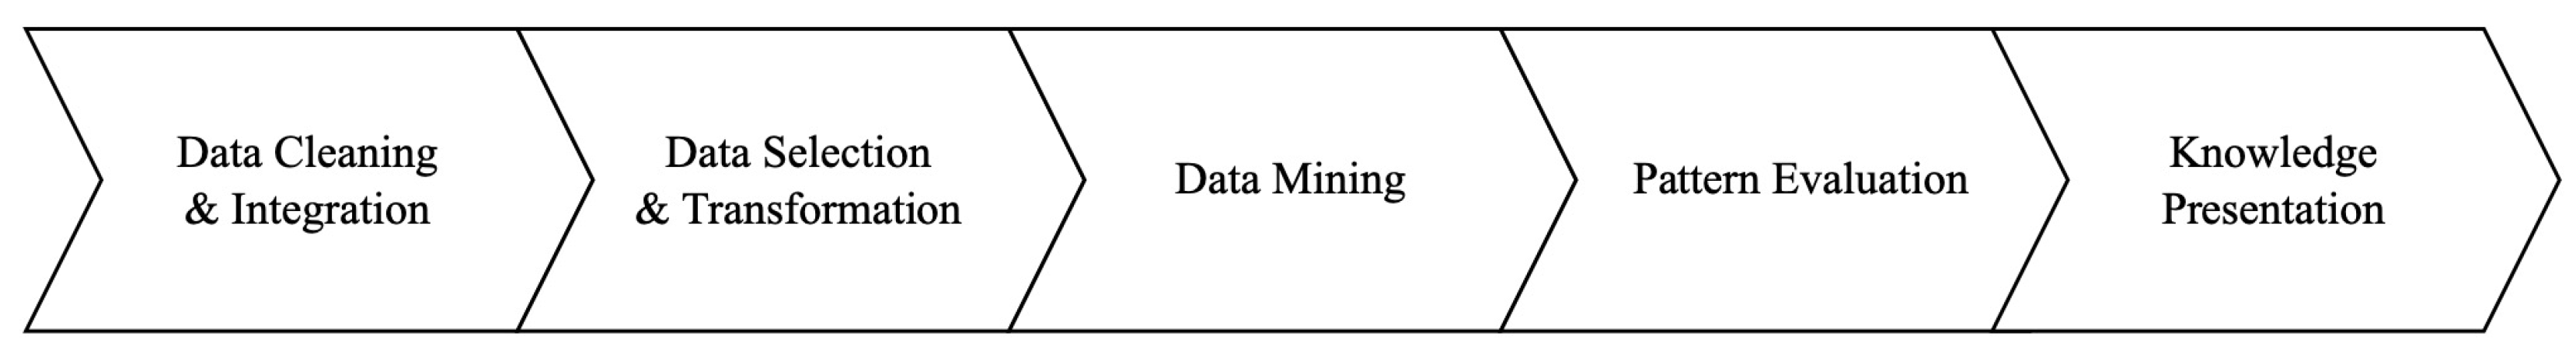
  • We provide an elaborated overview in research papers based on fault detection, fault diagnosis or data mining, as well as current trends, as depicted in Figure 1.
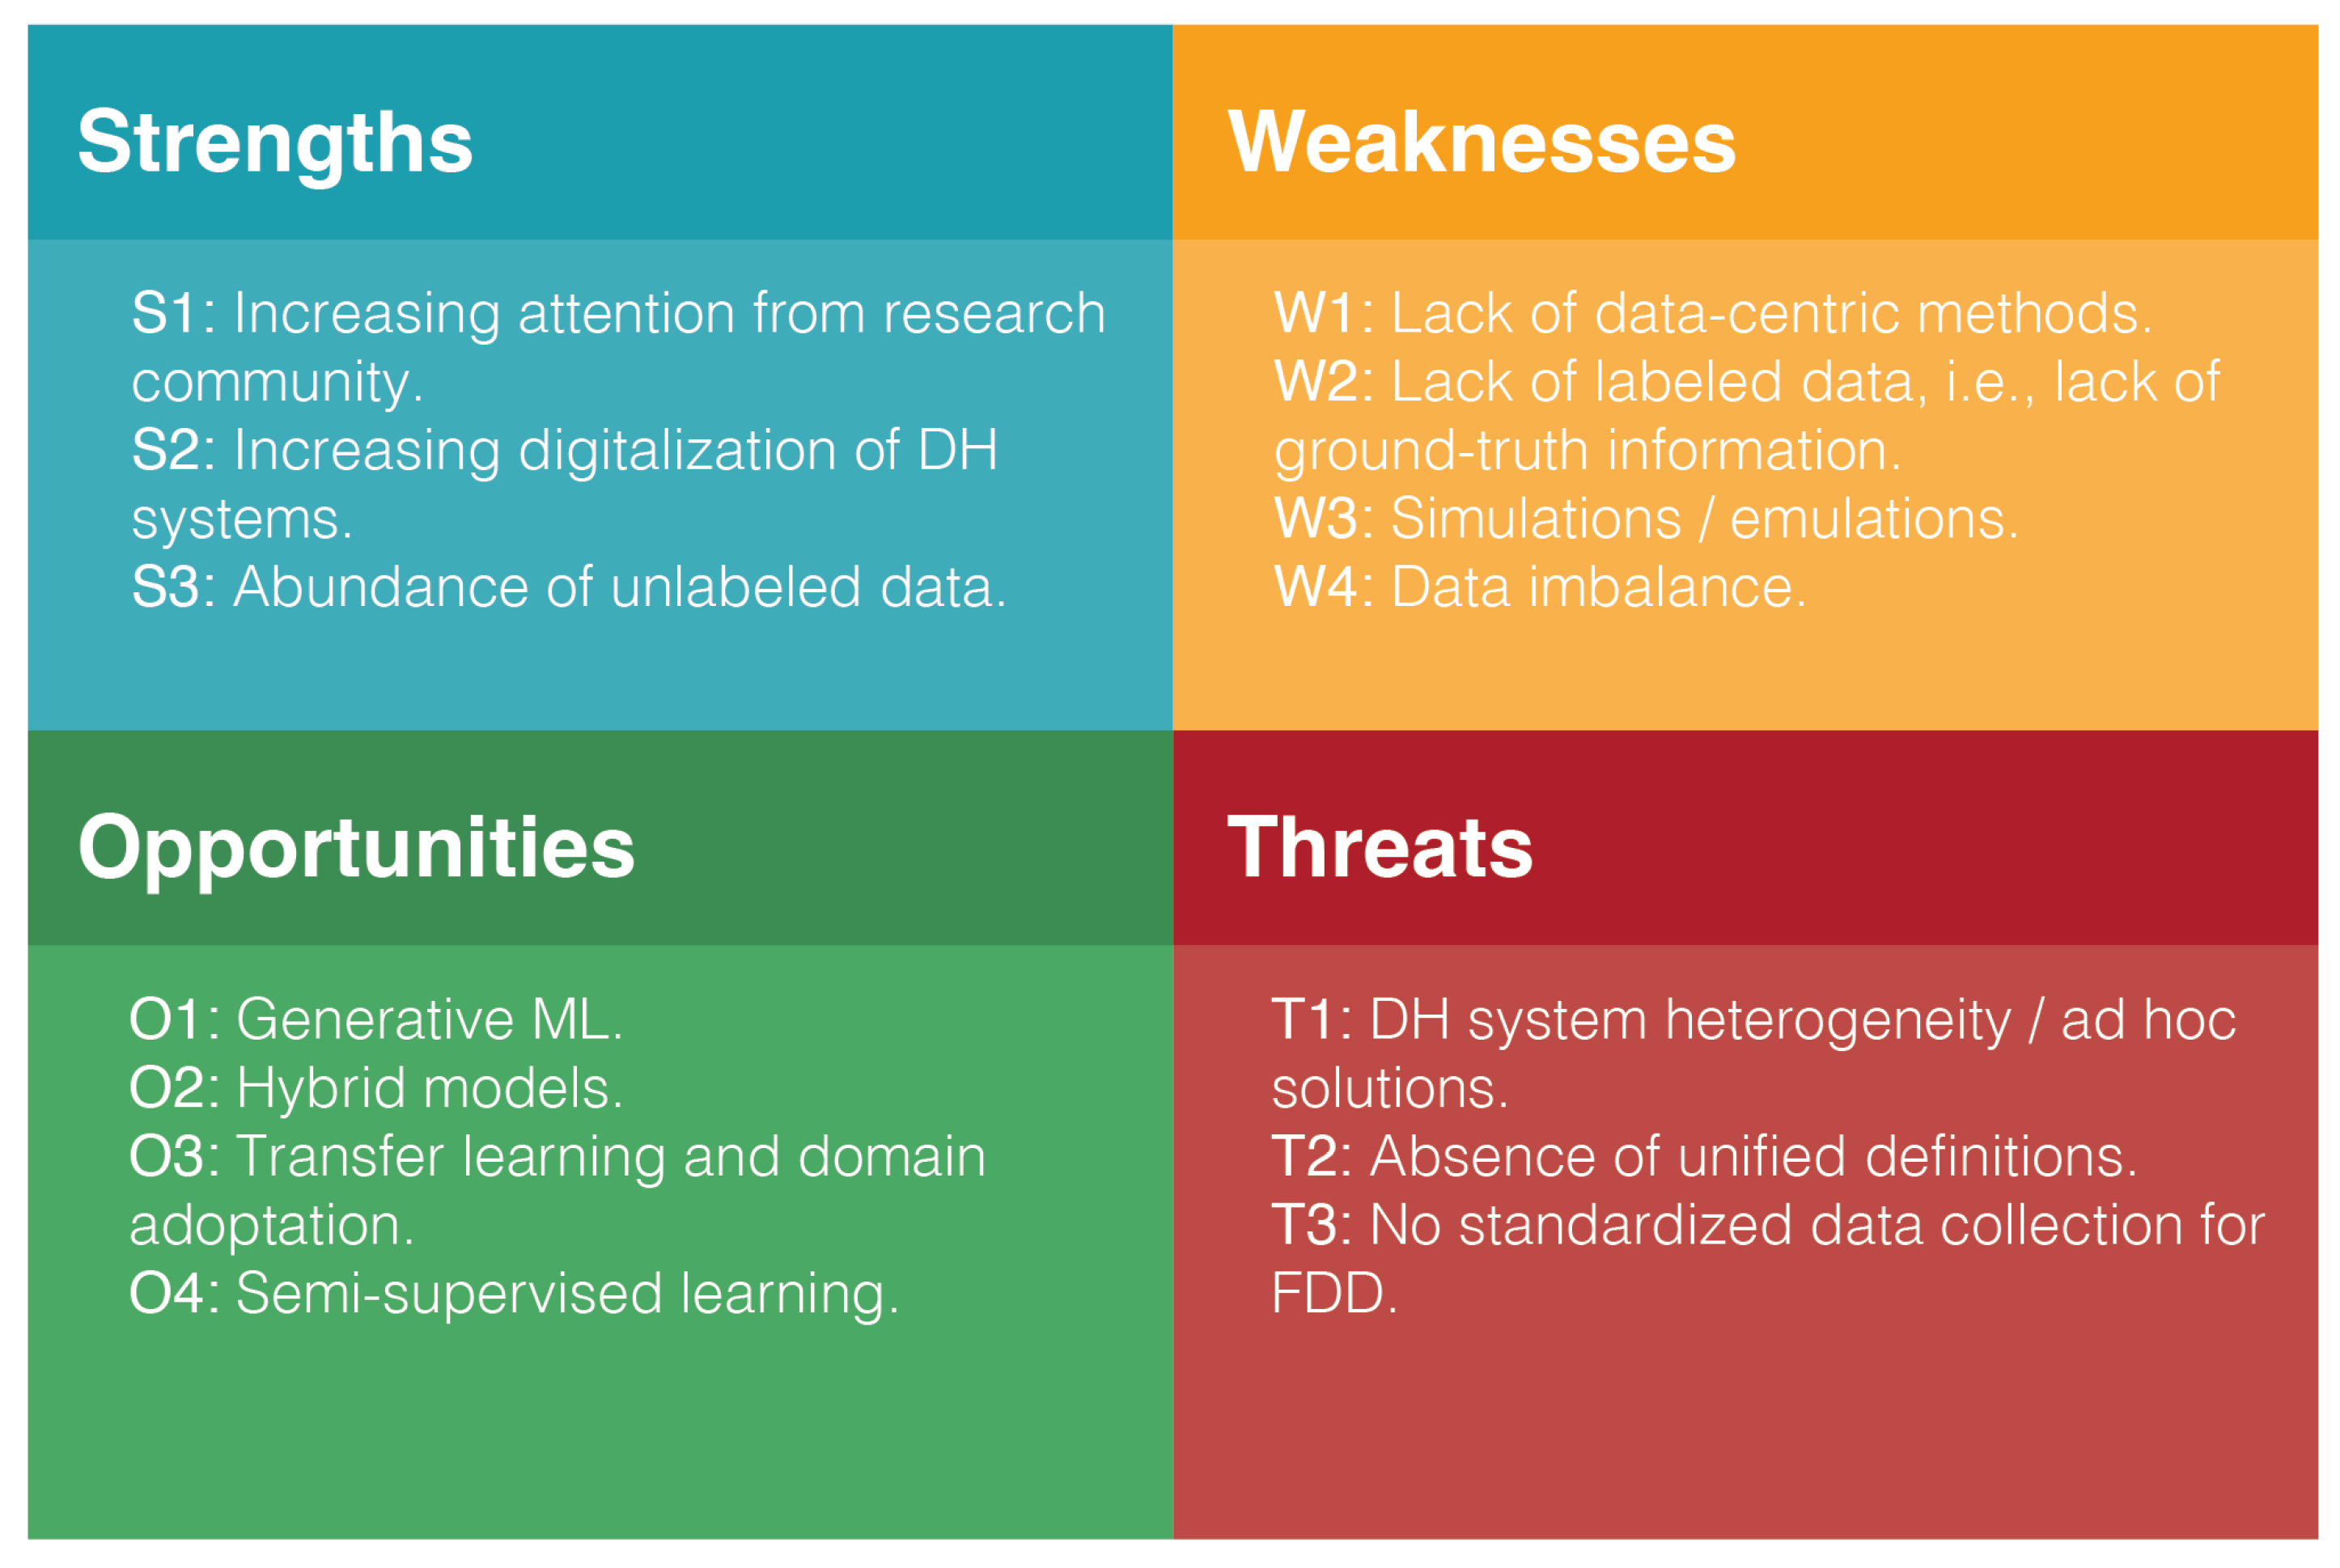
  • We provide an in-depth Strengths,Weaknesses, Opportunities, and Threats (SWOT) analysis to identify industry challenges, research gaps, and opportunities.
  • We provide a clear list of research directions in the form of recommendations, and explain several advantages and disadvantages.
Our main results are presented in Figure 1, which shows that in recent years there has been an increase in intelligent FDD studies using AI and ML. Consequently, our main conclusions are summarized in the form of a SWOT analysis in Section 7. Overall, our study provides a comprehensive and exhaustive review of the current state of FDD in DH, providing a structured and organized collection of information that can be helpful for researchers and practitioners to understand the field and develop new methods.
We organize the rest of the paper as follows. In Section 2 we discuss some of the essential concepts in intelligent FDD in DH. In Section 3, we cover related work both in FDD and DH. In Section 4 we explain our method and categorization of FDD methods. In Section 5 we briefly discuss current data collection in DH. In Section 6, we present the main results of our survey and discuss the current intelligent techniques. We divide each of the studies into their respective category: fault detection (Section 6.1) or fault diagnosis (Section 6.2). We subdivide fault detection into data mining and knowledge discovery (Section 6.1.1), outlier detection (Section 6.1.2), and leakage detection (Section 6.1.3). Furthermore, we subdivide fault diagnosis into binary-label classifications, such as sensor failure (Section 6.2.1), fouling (Section 6.2.2), valves (Section 6.2.3), and pipes (Section 6.2.4) and multi-label classification (Section 6.2.5). In Section 7, we discuss trends, key challenges, and opportunities. Finally, in Section 8, we will provide a summary of key findings and future directions.

2. Background

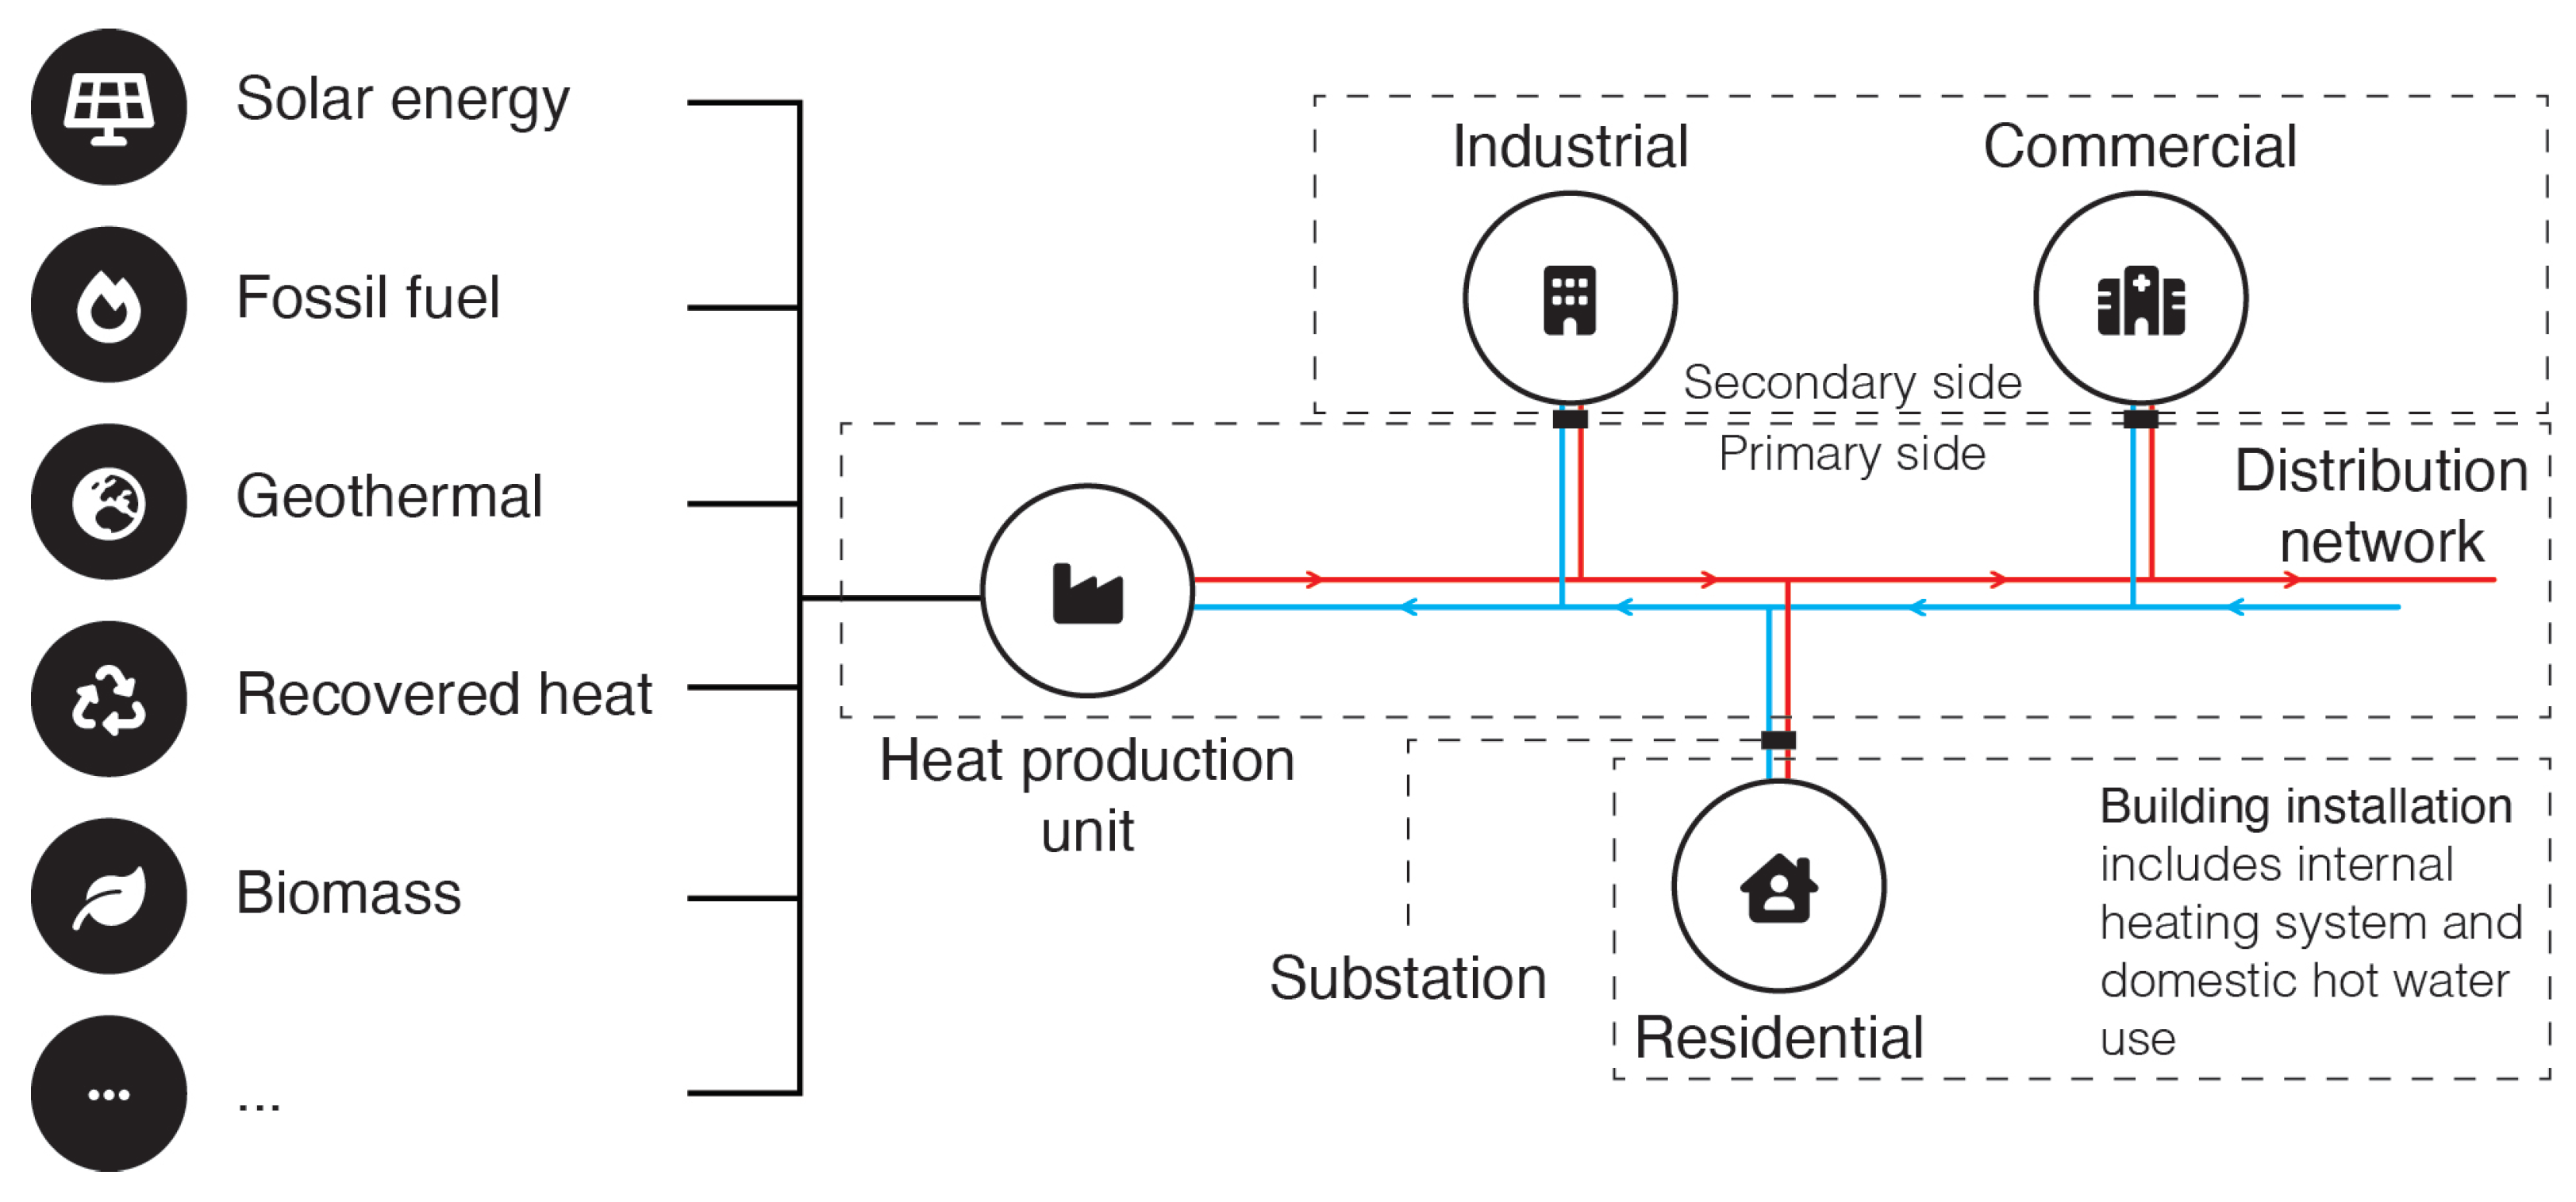
2.1. District Heating

DH systems provide space heating and DHW to buildings. As seen in Figure 2, a DH system consists of four elements: production unit(s), distribution network, substations, and heat consumers. The production unit(s) are responsible for generating heat using various resources, e.g., primary energy sources such as solar energy, geothermal, biomass, or fossil fuels, but also through recovering surplus heat. In 2021, fossil fuels accounted for nearly 90% of the global DH [8]. For example, in Europe, gas and coal are the predominant (40% gas, 29% coal) energy sources [3]; however, the newer generation of DH systems aim at introducing local, sustainable resources and low-grade heat sources such as geothermal heat, residual heat, solar energy, and biogas. The use of these resources helps to reduce greenhouse gas emissions and enhance the transition of the heating and cooling sector towards a low carbon energy supply [9]. The distribution network is responsible for transporting the heat from the production unit(s) to the heat consumers using a hydronic system. Such a system consists of a network of pipes, pumps, fittings, coils, and control valves. Once the heat arrives at a particular building, a substation redistributes the heat to multiple heat consumers. The substation is an interface between the primary and secondary network (see Figure 2). It typically includes components such as heat exchangers, pumps, valves, and control systems to regulate the flow and temperature of the circulating hot water. A heat consumer refers to a building or a facility that receives and uses heat from a DH system, e.g., commercial, industrial, and residential buildings. The heat consumers utilize the heat for space heating, DHW use, or industrial processes.

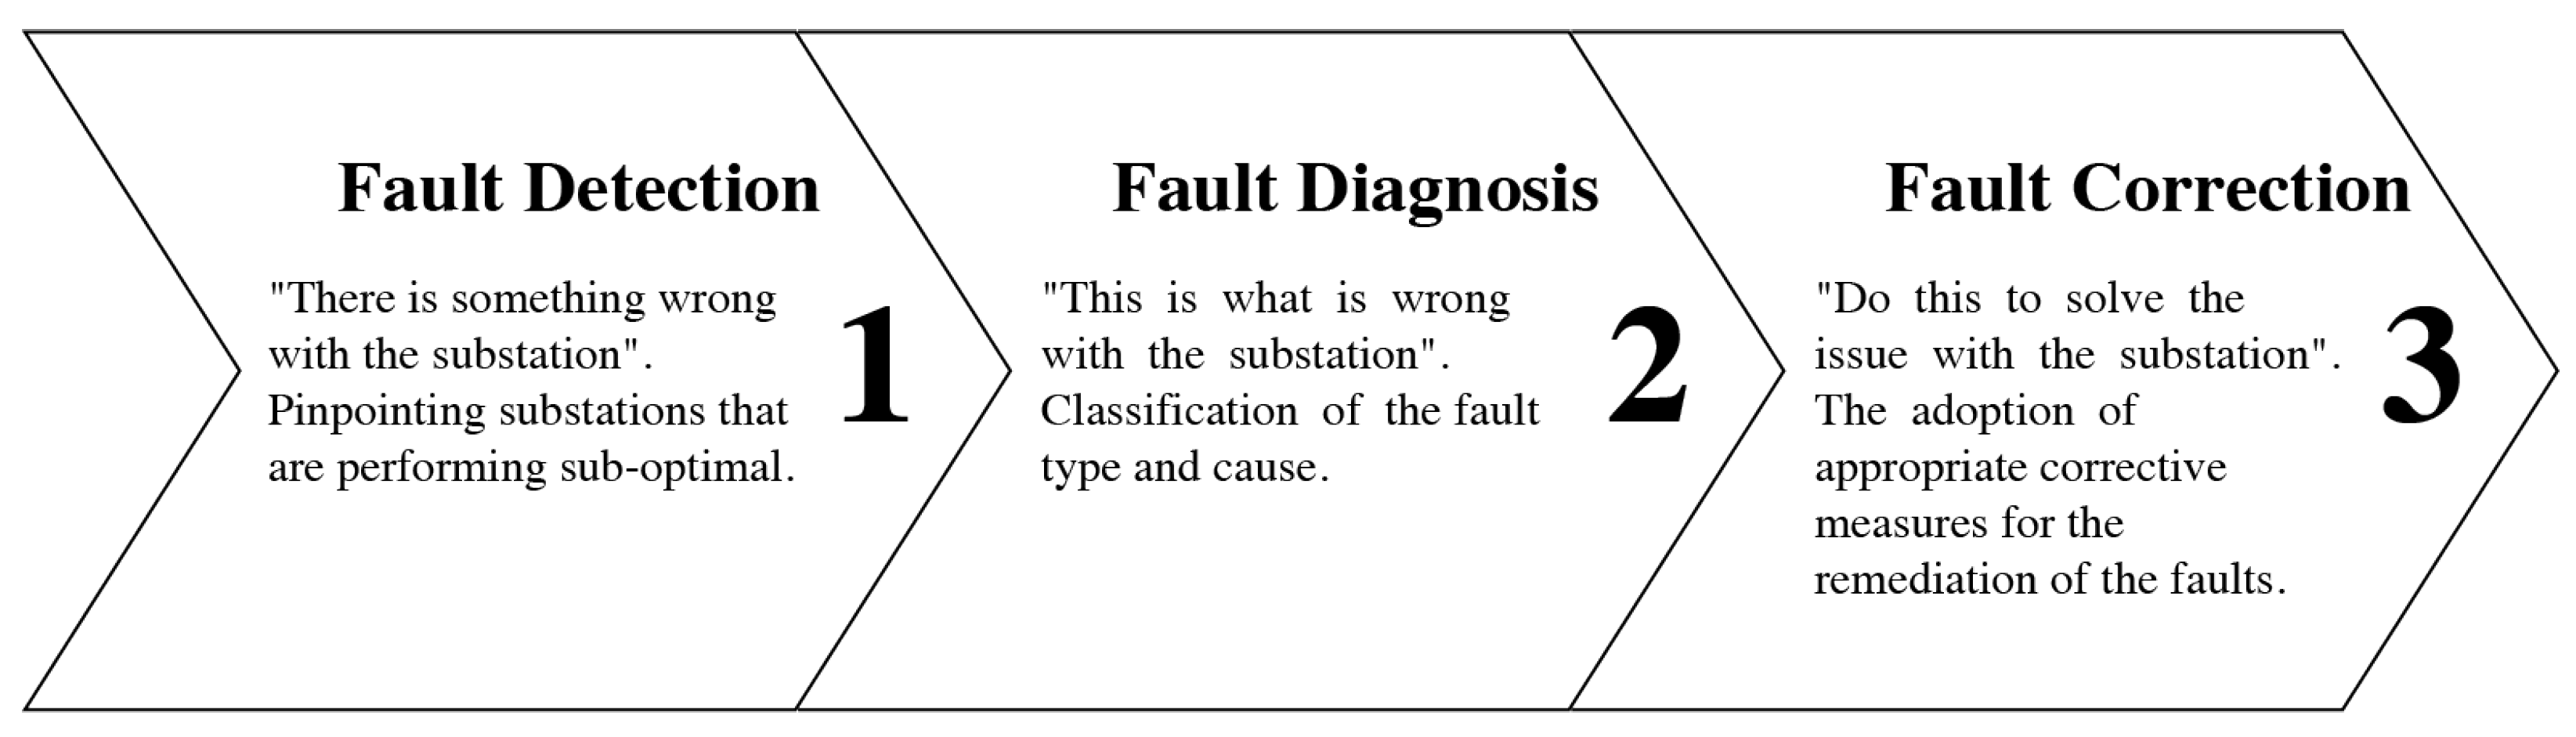
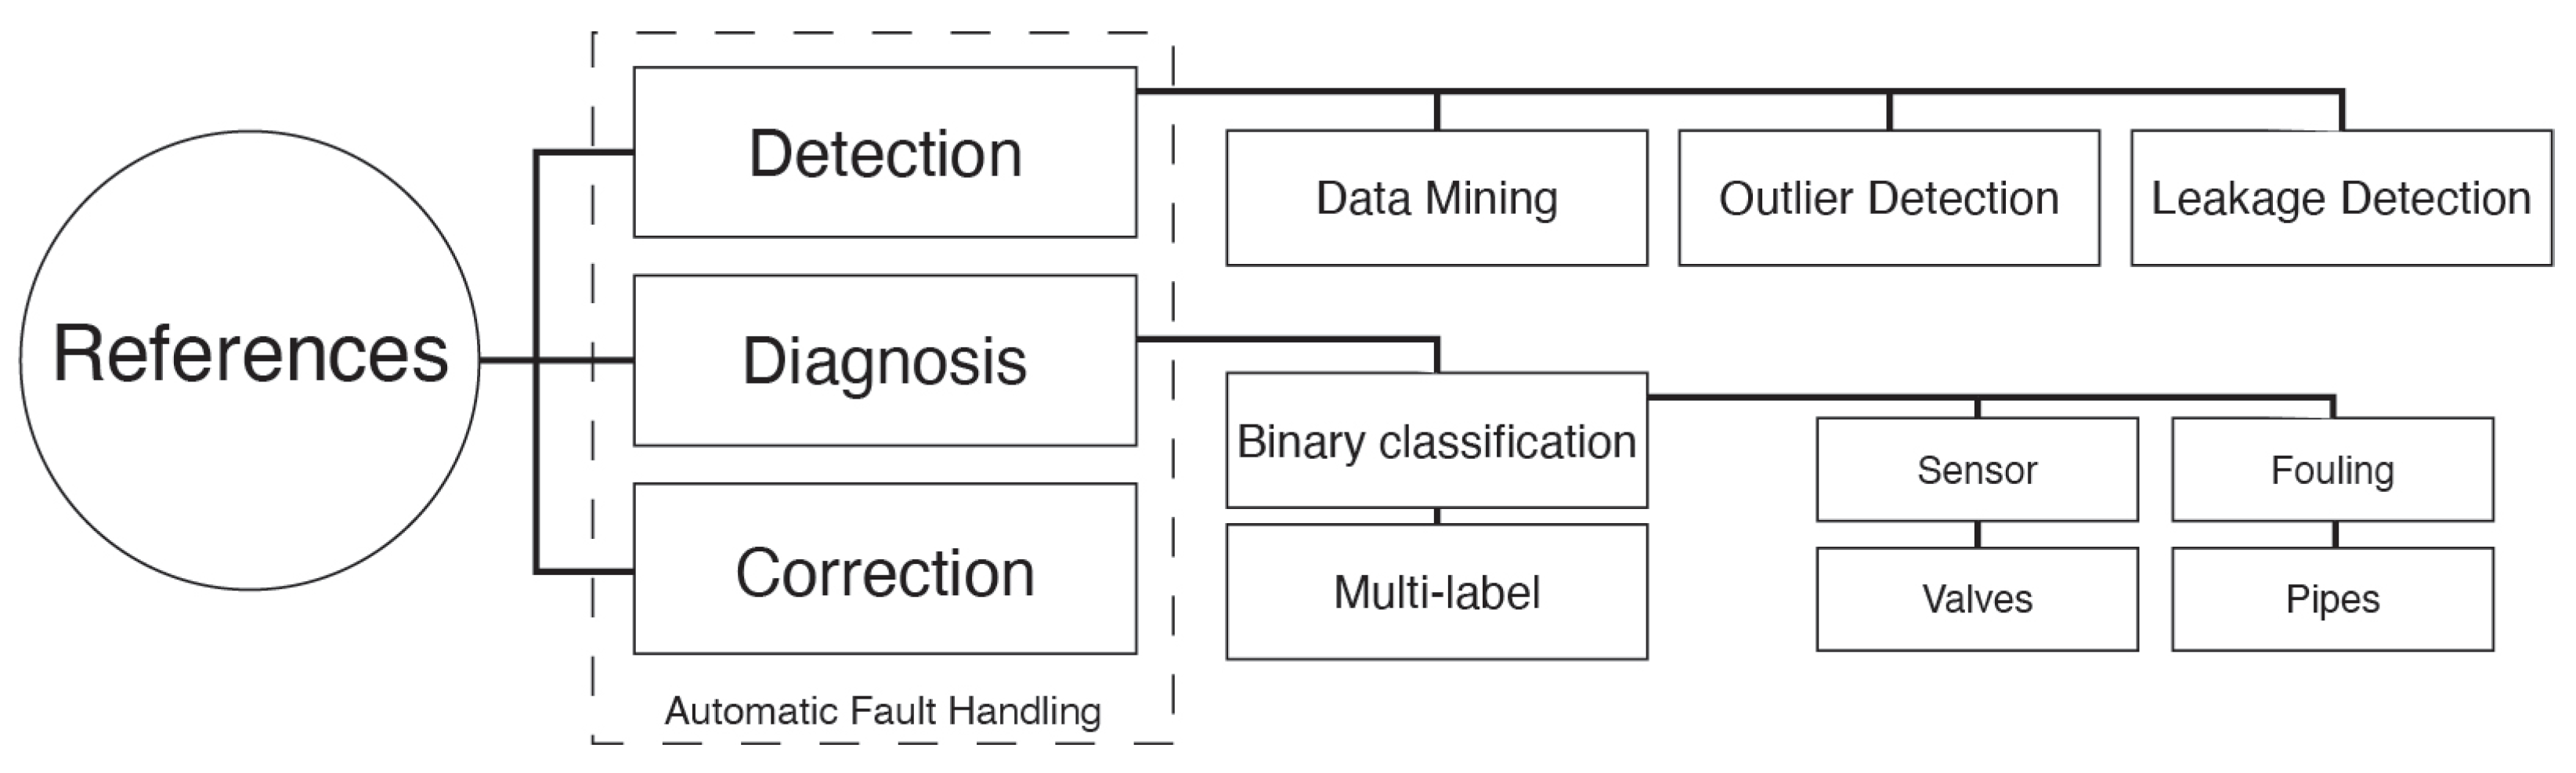
2.2. Automatic Fault Handling

As seen in Figure 3, automatic fault handling consists of three steps. Fault detection is the process of identifying a problem or malfunction within a system. Typically, it is the first step in the fault-handling process. Fault detection can alert network operators that something is wrong. Fault diagnosis is the process of identifying the specific cause of the problem or malfunction. It is the second step in the fault-handling process. Fault diagnosis can determine the root cause of the problem or malfunction. Fault correction is the process of taking steps to repair the problem or malfunction. This can be an online (automatic) measure to restore the system to normal operation or by suggesting the required manual action, such as repairing or replacing components.

2.3. Machine Learning

As the DH domain is transitioning to an increasingly digital environment, i.e., data is getting increasingly abundant, there is a rise in ML and Data Mining and Knowledge Discovery (DMKD) applications. Manually analyzing this data is impractical, and ML makes it possible to automate the analysis process. ML is a sub-field of AI that focuses on the study and development of algorithms capable of improving their knowledge or performance based on experience [10], i.e., by training on historical data. Below we describe some of the most important and relevant paradigms.
(i)
Supervised learning [11] (predictive) is concerned with learning mappings between inputs x and outputs y given a labeled data set of input-output pairs, i.e., the output is a label that represents the class type of the inputs x . Supervised learning can be divided into two types: classification and regression. Classification refers to classifying with discrete values as output, e.g., industrial or residential, i.e., classification attempts to predict class membership (assign a label). If the labels are numerical in a continuous range, it is called regression, i.e., regression attempts to predict numerical values, e.g., energy demand in the next 24 h. The algorithms fit a model to the labeled data set and can classify or predict new unseen data based on the independent variables as input. Some techniques in supervised learning include Linear Regression (LR), Support Vector Machines (SVM), Naive Bayes (NB), or Random Forests (RF).
(ii)
Unsupervised learning [10] (descriptive) is the technique of discovering underlying structures in data. Unsupervised learning can help identify essential (statistical) characteristics and patterns within the data without human intervention. It is a crucial paradigm in DMKD. Unsupervised learning is ideal for explanatory data analysis, outlier detection, and image or pattern recognition. Consequently, unsupervised learning can also be used for data pre-processing, e.g., dimensional reduction techniques such as Principle Component Analysis (PCA). Some techniques in unsupervised learning include k-Means (kM), Gaussian Mixture Model (GMM), or Linear Discriminant Analysis (LDA).
(iii)
Reinforcement learning [12] is the technique where an agent learns in a particular environment through exploration and exploitation. The agent performs specific actions that lead to a reward or punishment, aiming to maximize the reward. An agent should perform actions known to produce a high reward; however, the agent has to learn such actions by trial and error. That is, the algorithm rewards the agent for reinforcing the preferred behavior. The model continues to learn until it converges or achieves its stopping criteria. A well-known technique in reinforcement learning is Q-learning, which has a broad set of application areas such as self-driving or gaming AI.
(iv)
Deep learning [13] applies to any of the paradigms mentioned above in case one or more of the employed regressors or classifiers is a Deep Neural Network (DNN). Deep refers to using a neural network consisting of three or more layers. DNN can handle unstructured data sets, such as texts or images. Recently, deep learning has made a significant impact in text and image generation[14,15]. Also, DNN can automate feature extraction, such as Convolutional Neural Network (CNN), which reduces the need for human interventions; a side effect is that reasoning about model behavior becomes significantly more complicated, as the models are incredibly complex (black box models). However, an upcoming field, called explainable AI, tries to mitigate this problem. Explainable AI refers to the ability of complex models, such as in deep learning, to explain their reasoning or decision-making process such that it can be understood by humans, i.e., it can provide a transparent and understandable explanation for how a model arrived at its output or recommendation. A brief overview is given in [16]. Some techniques in deep learning include Multilayer Perceptron (MLP), CNN, or Long short-Term Memory (LSTM).
(v)
Semi-supervised learning [17], as the name indicates, provides hybrid solutions combining supervised and unsupervised learning techniques. It can use smaller labeled data sets to classify or extract patterns from larger unlabeled data sets. Compared to a traditional classifier, semi-supervised learning can reduce the size of the original labeled data set by 66%, at the cost of five times as many unlabeled data [18]. Semi-supervised learning is beneficial in scenarios where unlabeled data is abundant, but labeled data is expensive—typical in most engineering scenarios. Compared to the preceding paradigms, semi-supervised learning is less explored. Some techniques include MixMatch [19], label propagation [20], or self-training [21].
(vi)
Transfer learning [22] is a technique where a model trained for one task (source domain) is reused, e.g., as a starting point, in a second but related task (target domain). Unlike semi-supervised learning, where the model exploits the abundance of unlabeled data, transfer learning exploits the models available in similar domains. A subcategory of transfer learning is domain adaptation [23], which mainly focuses on using labeled data in one or more similar domains—assuming the domains shares class labels. It is similar to supervised learning, where the goal is to find a mapping based on training data, and the model predicts test data assumed to be from the same data distribution as the training data. In domain adaption, the training data comes from a particular domain with a large set of labeled data. The model can predict in another similar domain under the same assumptions as supervised learning—test data is from the same distribution as the training data. Transfer learning and domain adaption can be helpful in DH as it reduces the need for labeled data, which is currently scarce in DH.

3. Related Work

In [24], Lei, et al. present a comprehensive review of machine fault diagnosis over the past 40 years and cover various application areas and learning methods. In [25], the authors present an exhaustive review of anomaly detection in several industries, such as cyber-intrusion, fraud detection, healthcare, industrial processes, image processing, linguistics, and sensor networks. Zhao et al. [26] cover 20 years of development in artificial intelligence-based FDD for building energy systems, such as economizers, chillers, air handling units, heat pumps, or heating, ventilation, and air conditioning (HVAC) systems. In [27], the authors present a comprehensive review of data mining in building energy systems and cover both unsupervised and supervised data mining methods for building energy systems, such as chillers and HVAC systems. Mbiydzenyuy et al. [28] present an overview of ML in DH and opportunities for new solutions. The study consists of a workshop to create domain insights, a literature review to refine ideas, an analysis of the information, and a road map for DH. Buffa et al. [29] review advanced control and fault detection strategies for DH and include topics such as peak shaving, demand response, fault detection, or cost reduction. Zhou et al. [30] briefly reviewed leakage detection methods for DH by classifying and discussing existing methods based on their technology into three topics: physical model-based methods, data-driven methods, and unmanned airborne infrared thermography methods.
There are several shortcomings in the previous reviews, which we will discuss here. In [24,25], the authors did not include any techniques specifically used in DH. Since FDD in DH has specific data constraints and DH systems are highly heterogeneous distributed systems with many introduced ad-hoc solutions, it is crucial to discuss these techniques in the context of DH. Both [26,27] cover some DH FDD solutions; it only includes a limited number of papers. In [28], the authors do focus on DH; however, the review lacks important references regarding FDD as the review only included studies found with a single search string: “ML and DH”; thus, missing valuable papers. Consequently, in [29], DH is the main topic but includes many other topics, resulting in a lack of depth in FDD, and its primary focus is on leakage detection. Leakage detection is also the primary focus in [30]. While the review covers leakage detection well, the studied fault is only one of many faults in DH, thus missing other essential topics related to FDD in DH.

4. Method

We used two strategies to identify relevant papers for this research article. Initially, we identified relevant search keywords related to FDD in DH. These keywords include district heating, machine learning, artificial intelligence, data mining, fault detection, outlier detection, anomaly detection, and fault diagnosis. Any non-related keywords to DH, e.g., HVAC, are excluded, as the search domain becomes too broad and the constraints of the topic differ too much from DH, e.g., the systems or data. We search in Scopus, or Web of Science, based on title, abstract, and keywords. Table 1 presents the inclusion and exclusion search criteria. We cover the last twelve years of work, as before 2010, there was not much work on the FDD in DH (see Figure 1). Consequently, we only cover relevant work until mid-2022, as a result of when we conducted this survey. The initial search resulted in 62 studies. We applied a backward snowballing approach [31] to increase the likelihood that we have included the most relevant papers of the past decade. Snowballing led to an additional 24 studies. After reviewing the studies, 57 studies are shown to be relevant for this review.
Since automatic FDD is a three steps process (see Section 2.2 and Figure 3), the relevant literature has been classified according to the three categories, namely fault detection, fault handling, and fault correction, with several subcategories, as depicted in Figure 4. To our knowledge, there are no relevant studies on fault correction in the considered period; thus, this topic has been further excluded from this review.
Fault detection is divided into three subcategories: DMKD, outlier detection, and leakage detection. As explained in Section 2.3, DMKD is the task of finding hidden knowledge potentially useful for the fault detection task. It differs from outlier detection, as the latter is mainly concerned with finding anomalies in data. Therefore, it is reasonable to separate them. Since leakage detection is a more mature research topic within DH, much literature regarding leakage detection is present; therefore, we have contained relevant work in its subcategory.
Fault diagnosis is divided into two subcategories: binary classification and multi-label classification. Binary classifiers are much less complex than multi-label classifiers; thus, it is important to make this distinction to present a clear overview. Finally, the binary classification is further divided into subcategories corresponding to their target label, namely: sensor, fouling, valves, and pipe faults. Note that these subcategories only cover some possible fault labels since the literature lacks a full cover of such categorizations.

5. District Heating Data Collection

In the last decade, DH systems have been increasingly digitized. For example, in 2015, heat meters became standard equipment in Sweden and China [32,33]. A heat meter can collect close to real-time information; thus, data collection has changed from biannual manual readings [34] to, e.g., automatic hourly readings. As seen in Figure 1, studies related to FDD seem to increase, specifically after 2015. One of the reasons may be that data has become more accessible, thus positively impacting the number of studies. However, many unsolved challenges still need to be addressed related to data collection in DH, e.g., systematic collection of ground-truth information, maintenance intervention, or building meta-data.
DH utilities measure and monitor different parameters in the distribution network using various sensors. The most common sensors are temperature sensors, flow sensors, pressure sensors, water quality sensors, and energy meters. Temperature sensors are used to measure the temperature in the supply and return pipes to determine if there is any temperature drop that may indicate a fault in the network, such as leakage. Flow sensors measure the flow rate of the network fluid (typically hot water) to, e.g., detect any blockages or changes in the flow rate that may indicate a fault. Pressure sensors measure the pressure of the hot water in the network to detect any pressure drops that may indicate a fault, such as a leak or a valve that is not working properly. Water quality sensors monitor the quality of water in a DH network, these sensors measure various water parameters such as pH, temperature, dissolved oxygen, and conductivity to ensure the hot water circulating through the DH network is of sufficient quality to prevent corrosion and scale buildup, which can cause damage to the pipes and reduce the system’s efficiency. And energy meters measure the total amount of energy consumed by a DH network. Collecting data from these sensors allows operators to monitor the performance of the district heating system, detect faults, and optimize the system’s operation. The type and number of sensors in a DH network may vary depending on specific requirements or design.
Currently, DH utilities collect data from buildings through automatic heat meters with the main purpose of billing. A typical heat meter installed to monitor the consumption of a building is placed in the substation and consists of two temperature sensors, a flow meter, and a calculator. The temperature sensors measure the water temperature at the supply and the return pipes of the substation’s primary side. The flow meter measures the flow at the primary side, before the point where space heating and DHW circuits split and is usually placed on the return pipe. The metering instruments are powered either via the public power grid or via batteries [35]. The calculator performs calculations on the measured data to derive some parameters such as energy. In Table 2, we present an overview of the typical variables a heat meter collect. Other parameters, such as the average power over a certain period of time, are also provided. While the data is useful for billing, it is not necessarily useful for FDD for two reasons. At first, DH utilities install the sensors for the purpose of billing and, therefore, mainly collect data relevant to billing rather than for FDD. It must be determined whether the data is appropriate for automatic FDD and what kind of additional information is needed to improve the FDD accuracy. For example, only a single study reports FDD accuracy gains when including secondary side information [36]. While secondary side data is sometimes available, it is not consistently available due to, e.g., privacy and practical issues. Consequently, currently, any building meta-data is not collected, while it could be useful for FDD, e.g., building occupancy, energy label, or building size. To our knowledge, no studies are researching this topic. Moreover, the data is lacking labels of fault classes or optimal behavior, i.e., the ground-truth information is missing. There is a need for a well-defined data set with verified faulty and optimal behavior for the training and evaluation of models. Some studies [37,38,39,40] address this issue, e.g., by creating a framework to label faults occurring in substations, however, this is still an ongoing work, and there is still much work left to do.

6. Current Intelligent Techniques for FDD

The results presented in this section provide a comprehensive evaluation of the proposed methodologies and their performance in identifying patterns and detecting and diagnosing anomalies in DH systems. Intelligent techniques refer to various methodologies and algorithms that automatically extract knowledge and insights from data by employing AI, ML, or DMKD. Intelligent FDD is widely applied in various industries, such as healthcare, finance, and energy, to solve complex problems and make informed decisions. In particular, the field of DH has seen a growing interest in the application of intelligent techniques for FDD to improve operational efficiency and reduce heat loss. In this context, we present various studies that have been proposed to, e.g., identify heat load patterns, cluster substations, and detect abnormal or unexpected behavior in DH systems.

6.1. Fault Detection

In this section, we present, in detail, different ML and DMKD techniques used for fault detection in DH. Fault detection is an essential field of study within industrial process control, machine monitoring, and condition-based maintenance. It involves identifying abnormal or unexpected behavior in a system or process and is widely applied in various industries, such as manufacturing, power generation, transportation, and building management. The primary objective of fault detection is to detect system problems early to prevent significant damage or downtime. Techniques may include monitoring sensor data, comparing current system behavior to historical patterns, or applying ML techniques to identify abnormal behavior. These techniques enable the detection of faults at an early stage, allowing for immediate corrective measures. Fault detection can help increase system efficiency, reliability, cost savings, and improved safety.

6.1.1. Data Mining and Knowledge Discovery

DMKD is the process of identifying patterns and meaningful insights in large and complex data sets. It involves techniques such as clustering or regression to identify patterns, relationships, and trends (hidden) within the data, which can be used to make informed decisions and predictions. As shown in Figure 5, the process of DMKD involves multiple steps such as data cleaning, data integration, data selection, data transformation, data mining, pattern evaluation, and knowledge presentation.
Tureczek et al. [34] use kM algorithm to cluster DH heat meter data based on autocorrelation. The authors use hourly meter data from a single heating season from 49 substations located in Denmark. The authors mention the choice for kM, as it is widely used in various industries, and use default settings (ten iterations) to select the best clustering result. The study uses four scaling techniques: Normalization, Standardization, Mean-centring scales, and Mean-divide, to remove volume differences and retain the patterns—to avoid clustering the amount of energy consumed instead of the patterns. Leave-one-out cross-validation is applied to the cluster-validation indices to avoid overfitting. Furthermore, the authors use four clustering validation metrics: Mean Index Adequacy (MIA), Cluster Dispersion Indicator (CDI), Davies-Bouldin Index (DBI), and Silhouette Index (SI) to identify the optimal number for k, which in their case is 4. The study claims the method can help DH utilities to optimize heat production and awareness campaigns. Also, the homogeneous consumption clusters may help FDD. Furthermore, the authors confirm the existence of autocorrelation in the data and utilize it for clustering.
Gianniou et al. [41] present a three-phase methodology for analyzing data utilizing a clustering approach. Specifically, the authors use the kM algorithm with the KSC-distance metric, utilizing hourly data from 8293 single-family households in Aarhus, Denmark. The data set covers six years, starting in 2009, and encompasses building and customer information. The authors use k = 5 , as suggested by using Bayesian Information Criterion (BIC) and employ SI for validating clustering results. Their proposed solution can potentially assist DH utilities in optimizing operations, e.g., heat production and demand-side management. Furthermore, the authors can segment the customers into five clusters based on consumption intensity. Additionally, using LR, the authors found that factors such as building age, area, and family size, significantly impact heat consumption. In contrast, the effect of the age of the occupants is less substantial.
Ma et al. [42] propose a clustering method to identify heat load profiles using DMKD. The authors employ the Partitioning Around Medoids (PAM) algorithm in combination with the Pearson Correlation Coefficient (PCC) and validate clustering results using the Dunn index. The study claims that PAM outperforms kM with Euclidean distance. The authors utilize hourly data from nineteen higher education buildings in Trondheim, Norway. Data cover a period of two heating seasons, beginning in 2011. The study results demonstrate the effectiveness of the proposed method in identifying heat load profiles. Furthermore, the authors claim that the approach can help in the development of advanced building control, FDD, or cost-effective demand-side management strategies.
Lu et al. [43] present a clustering method using GMM and estimate hyper-parameters using the Expectation Maximization (EM) algorithm. The authors apply BIC to determine the number of mixture components. The study uses ten-minute interval data from a single heating season from six office buildings in Tianjin, China; however, the authors solely considered hourly mean values. Furthermore, the authors employ several evaluation criteria such as Root Mean Square Error (RMSE), Mean Absolute Error (MAE), and PCC. Additionally, the study employs a multi LR, auto Regression (AR) model, and an Artificial Neural Network (ANN) to extract additional information from the heat load variation. The authors claim that the results improved heat load prediction and intend to employ the proposed method for operation fault diagnosis.
Flath et al. [44] describes a clustering analysis method using the data warehouse software SAP NetWeaver Business Intelligence. This tool is capable of preparing and analyzing data, thereby supporting a range of data analysis techniques such as clustering analysis, ABC analysis—an inventory categorization technique—and classification. The authors use data with a fifteen-minute interval and divide the data into subsets of days, similar to [45]. Through their analysis, the authors identified nine clusters and utilized this information for clustering analysis. The clustering methodology adopted in their study employs the kM algorithm with Euclidean distance. Finally, the authors evaluate clustering results using DBI and visualize results using BEx Analyzer.
Hong et al. [46] present a Holistic Operational Signature (HOS) approach to provide deeper insights into DH substations, such as detecting excessive water flow rates based on heating load. The authors employ data from a single heating season consisting of both daily and hourly measurements from multifamily residential buildings in South Korea. They use kM to identify energy consumption patterns and HOS labels and evaluate results using DBI. Furthermore, HOS labels include data on secondary temperature differences ( Δ T ), heating energy consumption, and outdoor air temperature. The approach incorporates multiple Operation Signature elements (x-OS) for analysis and combines existing signatures such as energy, Δ T , and operational signatures. Finally, the authors visualize and interpret the results and claim that the approach provides more information on the current operation, control states, and opportunities for operational improvements.
Lu et al. [47] propose a method for reverse identification of control strategy using the GMM algorithm, as the control strategy significantly impacts heating consumption. The authors evaluate the operation effect and diagnose inefficiencies in the control strategy by using Equivalent Supply-Demand Matching Coefficients (ESDMC) and daily mean operation data to reduce the complexity of the dynamic heat transfer process. The study employs hourly data, consisting of a single heating season, from an indirect DH system in Tianjin, China. The authors claim that the approach successfully identifies four regulation strategies, can evaluate the operation effect, and diagnose inefficient strategies. Furthermore, the authors suggest that GMM is an effective method for identifying regulation strategies and combining their proposed ESDMC can help diagnose inefficiencies.
Calikus et al. [32] suggest a data-driven approach to identify heat load patterns and deviating customers. The study utilizes one year of data from two DH networks in Helsingborg and Ängelholm, Sweden. Data comprises six building categories: multi-dwellings, commercial, public administration, health and social service, school, and industrial buildings. The approach consists of three steps: (1) heat load pattern discovery using the k-Shape (kS) algorithm with k = 15 , and evaluation of the clusters through SI, (2) identification of customers of interest which deviate by three standard deviations ( 3 σ ) from their clusters’ centroid (derived from Cantelli’s inequality), and (3) large-scale evaluation by an expert through visualization of the results and their comparison with four existing control strategies (Continuous Operation Control (COC), Night Setback Control (NSB), Time Clock Operation (during five workdays) (TCO5), and Time Clock Operation (during seven workdays) (TCO7)). The study demonstrates the effectiveness of the proposed approach in finding customer heat load patterns, identifying deviating customers, and finding control strategies that are not suitable for specific customer categories.
Xue et al. [48] present an unsupervised DMKD approach for FDD and operation optimization. They use ten-minute interval data consisting of two heating seasons from two types of indirect DH systems in Changchun, China. The study includes secondary side information calculated from the primary supply/return temperatures. The authors use two DMKD techniques: cluster analysis, and association analysis. For clustering the substations, the authors use Euclidean distance with the following algorithms: kM with k = 6 , PAM with k = 3 , and Agglomerative Hierarchical Clustering (AHC) with k = 2 . They use DBI to evaluate clustering results. To discover hidden correlations, the authors perform association analysis using the Apriori algorithm. Since the Apriori algorithm requires categorical data, and DH data is mostly numerical, they apply discretization based on kM with k = 3 (categories represent low, medium, high, according to original numerical magnitude). The final generated rules can either be interpreted using domain knowledge or used to detect anomalies in the DH system. The authors found useful diagnostic rules for FDD in DH, which could further assist DH utilities.
Abghari et al. [49,50,51] propose a DMKD using Higher Order Mining (HOM) to identify outliers for fault detection in DH systems. HOM is a sub-field of DMKD that uses non-primary, derived data or patterns [52]. In [50], the authors explain an approach for sequential pattern mining using the PrefixSpan algorithm [53], clustering analysis using the affinity propagation algorithm [54], consensus clustering using the algorithm proposed in [55] with Levenshtein distance [56], and finally, Kruskal’s algorithm [57] to create an Minimum Spanning Tree (MST) algorithm on the extracted patterns to find deviating substations. The last three techniques utilize derived patterns instead of primary data, i.e., the last three are HOM methods. The authors discretize data to extract weekly patterns and group the patterns into clusters. The method compares substation behavior every two consecutive weeks to measure the discrepancy in its performance. Subsequently, substations that exceed a certain threshold are subjected to further analysis through consensus clustering techniques. Finally, the approach creates a MST to identify outliers by cutting the tree’s longest edge(s). The authors empirically evaluate the method using hourly data of two heating seasons from 10 randomly selected buildings (data set contains 82 buildings) from a DH system in Southern Sweden. The results indicate that the method is effective in identifying deviating substations. The authors continue their work in [50,51].
Sun et al. [33] present an anomaly detection method using Kernel Gaussian Mixture Model (KGMM) for 17,000 DH apartments from 18 zones in China throughout three heating seasons. The authors acknowledge the challenges associated with anomaly detection and statistical methods in DH systems, as heat meter readings may not be accurate. Additionally, linear models are unsuitable for nonlinear data. Due to the lack of accurate and labeled data, the authors motivate their choice of unsupervised learning. The study employs kM, GMM, and KGMM. The authors claim that KGMM outperforms GMM and kM in terms of detection rate and false positive rate by computing the minimum sum of squared error. Furthermore, the study identifies four types of anomalies: abnormal heat behavior, inaccurate heat meters, exceptional temperature probes of intake pipes, and inverse temperature probes of intake and return pipes. The method shows that it can assist DH utilities in finding anomalies and detecting faults, thereby improving energy efficiency and thermal comfort with a 5.4 % reduction in heat demand.
Kiluk [58] suggests a DMKD method using regression analysis and clustering. The author employs hourly data from an area containing 1000 buildings in Sweden, ranging from multi-unit housing and offices to schools and hospitals. Additionally, the data includes outdoor air temperature and building size. The author uses regression analysis to map the relationship between outdoor temperature and energy consumption. For clustering, the author employs the k-Nearest Neighbor (kNN) algorithm with the semi-Chebyshev metric. Further improvements are in [59]. The method demonstrates the ability to retain a high precision (>0.96) in current diagnostic classification and to detect new features, thereby assisting operators in decision-making and significantly reducing the volume of information.
In summary, the studies discussed in this section employ some form of DMKD to identify patterns and structures in DH data. In Table 3, we provide an overview of each of the studies’ methodologies, distance metrics, and validation metrics. Data mainly contains primary-side unlabeled data. A majority of studies focus on clustering substations and utilize the kM algorithm with Euclidean distance as the similarity metric. However, some studies employ alternative distance metrics, such as those by [32,42,49]. Commonly used validation measures include DBI, SI, and BIC. A minority of the studies utilize Gaussian Mixture Models, with one study reporting improved performance in anomaly detection [33] when using this technique over kM.

6.1.2. Outlier Detection

Outlier detection is the process of identifying observations in a data set that deviate significantly from normal or expected behavior. The deviating data points are often called outliers, anomalies, or deviations. Outlier detection aims to identify data that can result from faults or errors in, e.g., DH equipment. Outlier detection can perform in one of the following ways: supervised, semi-supervised, or unsupervised detection. The latter is often used in the DH domain, as unlabeled data is readily available and labeled data scarce; however, unsupervised outlier detection implicitly assumes that normal data is far more frequent than anomalous data; if the assumption is violated, it will result in a high alarm rate. In this section, we provide the research papers addressing outlier detection.
Wang et al. [60] present a two-stage approach for condition monitoring and outlier detection of heating and cooling equipment. In the first stage, the so-called “condition prediction”, the authors apply an LSTM and compare the results to Lasso Regression (LASSO), Support Vector Regression (SVR), and MLP. The authors evaluate performance using RMSE, and state that the LSTM had a lower prediction error for six out of nine cases. In the second stage, the so-called “anomaly detection”, the authors use the Exponential Weighted Moving Average (EWMA) to detect outliers based on the prediction errors in the previous stage. The study describes that performance evaluation cannot use traditional methods, as the number of real anomalies is unavailable. Therefore, the authors use the rate between detected anomalies and the number of samples to calculate the false positive rate assuming that most anomalies are true positives. The authors claim that the LSTM model successfully captures normal behavior and thus can detect outliers.
Månsson et al. [5] propose an automated statistical method for fault detection of DH substations. The authors use piecewise LR on hourly data (converted to daily) of a single heating season from 3000 substations in Sweden. Substations are ranked such that the 3000 substations are in descending order of their energy consumption, i.e., large energy consumers are ranked higher, as larger consumers have a more significant impact on the network. The authors use the following three signatures to identify the poor-performing substations: cooling performance, return temperature level, and energy consumption. Furthermore, the authors define Δ T = 45 °C as the optimal value and identify outliers using three standard deviations ( 3 σ ). The study claims that approximately 43% of the examined substations exhibit sub-optimal performance. The authors suggest that the difference between supply and return temperature ( Δ T ) is not constant under identical conditions, e.g., the same outdoor temperature, as the heat demand is affected by factors such as DHW preparation. Furthermore, the study raises the issue of the lack of uniform definitions in DH, e.g., substation optimality, and as such, the findings differ from previous studies, such as in [6].
Calikus et al. [61] suggest a method to rank abnormal substations based on their power signature using Robust Regression (RR). The study describes three methods, namely outlier-based, dispersion-based, and aggregated-based using the Borda count method. The authors utilize RR to estimate an LR model, as Ordinary Least Squares (OLS) is sensitive to outliers, which significantly impacts results. Observations that fall outside a specified threshold are considered outliers. However, since the authors have no prior knowledge of outlier ratio, they assume 20% of observations are outliers. Furthermore, the authors compare their approach with a OLS method and evaluate results using 20 % of observations are outliers. Furthermore, the authors compare their approach with a OLS method and evaluate results using R 2 and a Student’s t-test. The study employs hourly data from two DH networks (approximately 1700 buildings) in Sweden for a single heating season. Each of the methods produces a ranking of the most anomalous buildings. The authors claim that the dispersion-based and aggregated method significantly outperforms the OLS approach.
Gadd and Werner [6] present a manual method for fault detection in DH substations. The study utilizes hourly data from two DH systems (after pre-processing 135 substations) in Sweden. The data consists of six customer categories: industrial demand, one- and two-family dwellings, multi-dwelling units, ground heating, public administration, and others. The authors segment faults into three categories: unsuitable heat load pattern, low average annual temperature difference, and poor substation control. The authors claim that 74 % of examined substations are performing sub-optimal and that the poor correlation between heat demand and outdoor temperature indicates poor substation control.
Farouq et al. [62,63,64] propose several studies for anomaly detection based on fleet monitoring. In [62], the authors state their motivation for unsupervised learning as there are three problems: (1) no large, labeled data sets are available, (2) the faulty behavior is rare, and (3) the data is difficult to generalize. The study uses the Unit Level Ensemble Model (ULEM), Subfleet Level Ensemble Model (SLEM), Combined Ensemble Model, and for offline the Matrix-Profile (MP) method [65], to monitor DH substations and detect anomalies. Furthermore, the authors use a kNN based method to construct the ensemble instances for ULEM and SLEM. The study employs data from a single heating season, and six substations are manually analyzed and labeled by domain experts based on the flow variable. The author evaluates results through precision and Normalized Mean Detection Delay (NMDD). In earlier work [64], the authors only considered a single operational variable, and used a kNN based approach with Euclidean distance and k = 80 and used Isolation Forests (IF) to detect anomalies. This study employs hourly data of a single heating season from 778 substations in South-West Sweden. In [63], the authors extend their approach to multivariate and compare the kNN based approach to a Conformal Clustering (CC) approach while considering evaluating different non-conformity measures, namely: 3-NN, 5-NN, 10-NN, median and IFor. The authors claim their approach is helpful in monitoring, diagnosis, and knowledge extraction in DH systems, especially when no labeled data is available.
Wang et al. [66] present a fault detection approach for the integrated energy system using ML. The authors combine regression analysis and exponential smoothing step averages to predict deviating behavior. The authors evaluate the regression model using R 2 . The study divides interface failures into sensor faults, drive faults, and part faults. Furthermore, sensor faults often cause deviations, distortions, and drift. The authors use an SVM to classify healthy and faulty operations and evaluate results with precision, recall, and F 1 . The authors claim the approach reaches a 98.67 % accuracy in identifying faults.
Zhang and Fleyeh [67] propose a method for anomaly detection of DH substations using a simplified physical model, LSTM combined with a Variational Auto Encoder (VAE). The authors compare several approaches, such as a VAE-based LSTM, Auto Encoder (AE)-based LSTM, and LSTM. The study utilizes hourly labeled data from a single heating season in Sweden. The authors evaluate results using Area under Receiver Operating Characteristic (ROC) Curve (AUC) and F 1 , and state that for warm months (with a threshold value of 99.5 % ), all anomalies are detected by the VAE-based LSTM approach, while the other two approaches missed one outlier. For the cold months, all models performed the same.
Palasz and Przysowa [68] present an approach to detect heat meter failures. The authors use several ML algorithms: ANN, Gradient Boosted Decision Tree (GBDT), and SVM, and increase accuracy by using hyperparameter optimization through sequential model-based optimization with RandomForest Regression (RFR) and AUC. The authors state that common heat meter failures are failure of the flow transducer, temperature meter failure, and battery exhaustion. The study uses heat meter data collected from ten years of operations. Additionally, the authors present an Exploratory Data Analysis (EDA) to find relevant information and claim that only the state variables are enough for failure prediction—historical information on the equipment (how and when) is not needed. Also, failure occurrence follows aWeibull distribution. The authors utilize the ensemble learning paradigm by combining the models fromprevious steps and evaluate results using AUC, Matthews Correlation Coefficient (MCC), accuracy, recall, and F 1 . The authors claim their approach is successful in fault detection and reached a detection rate of >95%.
Lee et al. [69] propose a delta-T-based clustering method for FDD. The authors present several steps of data mining, such as: assigning labels from the clusters from the energy consumption patterns and delta-T signature analysis to divide substations into three categories: normal, extreme, and negative delta-T, and assigning labels from the clustering analysis, from the operational signatures, and faulty signatures. Signatures were defined manually based on a set of variables. The authors employ hourly data collected from four months of operation and use kM for clustering analysis—k is set to 3–6. The authors evaluate clusters using DBI and the elbow method. The study results show that their approach can detect operation patterns and faults. Additionally, the patterns can provide a profound knowledge of operations.
Brès et al. [36] present an FDD approach using a Binary Decision Tree (BDT) and building simulations to discover fault signatures and identify four issues that cause high return temperatures. The authors calculate the correlation coefficient and quotient of average values for each pair of variables. The authors simulate the scenario 1000 times, with a ten-minute interval for a six-month simulation period. In 10% of the simulations, the authors introduce four types of faults: (1) excessive hot water re-circulation, (2) lack of space heating secondary temperature reset, (3) space heating heat exchanger valve leakage, and (4) undersized space heat exchanger, resulting in a data set containing 40% faults, 60% fault-free behavior. The authors utilize the Classification and Regression Tree (CART) algorithm, using five-fold cross-validation, to construct a BDT. Furthermore, the authors evaluate the results using accuracy and claim that having secondary side measurements increases prediction accuracy from 78% to 96%.
Theusch et al. [70] propose a fault detection and condition monitoring method using DH using kNN, kM, LR and residual analysis. The authors utilize data from a single heating season with a three-minute interval from 896 offices and households in the South of Germany. The study follows several steps: in the pre-processing step, the authors remove unrealistic values, convert values to hourly averages, and apply kNN (with Euclidean distance) to the outdoor temperature and consumed power to detect outliers. In the next step, the authors apply clustering analysis to identify heat load patterns using kM with Euclidean distance and use DBI to find the optimal k. The study utilizes an LR to model the relationship between heat demand and outdoor temperature. Finally, the authors detect deviations through residual analysis. Results show that for a circulate pump breakdown, the approach reached a cluster consistency of 0.94 , while for a leaking control valve, the approach reached a cluster consistency of 0.57 . The authors state that regular load patterns are useful for fault detection; however, learning the regular load patterns significantly depends on the regularity of the substation.
Al Koussa and Månsson [71] present two fault detection approaches. The authors use hourly data (single heating season) from 3000 substations in Sweden that had the most significant energy consumption. The cluster-based approach uses the overflow method and performance signatures to compare the substations. Here substations are clustered, and the authors use a set of substations with the lowest overflow value to produce an LR model to detect deviating substations. The instance-based method employs a black-box model with various features to predict a substation’s behavior and compare the predictions to the measured behavior. The authors utilize Tree-based Pipeline Optimization Tool (TPOT) to optimize the fault detection algorithms. TPOT uses genetic programming to automatically optimize feature selection, pre-processing, model selection, and parameter optimization. The authors introduce two types of faults into the data set: (1) communication loss between the energy meter and DH utility, and (2) meter drifting. Furthermore, the authors evaluate performance with R 2 and MAE and claim the highest performance is combination number five with a R 2 = 0.9740 and MAE = 0.1301 . The authors claim that both approaches can detect deviating behavior in building substations.
Sandin et al. [72] present two basic methods for FDD in DH with primary side data, as secondary side data is not commonly accessible. The first approach consists of correlation analysis using supply temperatures and corresponding temperatures. The authors claim that the correlation coefficient between two supply temperatures time series is superior to their geographical distance as a similarity metric. The second approach uses the thermal power with limit checking and clustering, e.g., kM, to define fault detection conditions. The authors suggest that de-trending the time series data is essential; otherwise, the seasonal variations dominate the correlation coefficient. The authors use first-order differencing to make the data stationary and claim that correlation analysis can help identify substations with similar supply temperatures. Furthermore, the authors state that the second approach helps detect faults affecting primary flow and temperature sensors.
Johansson and Wernstedt [73] present an n-dimensional statistical approach with performance metrics. The authors describe that the relationship between the variables is essential, not the variables themselves. The authors use parallel coordinates and scatter plot matrices to visualize and evaluate the relationships between the variables. The authors use Chauvenet’s criterion and regression analysis for outlier detection and evaluate results using PCC. Both methods, visualizing and using performance metrics, were successful in detecting outliers; however, the study states that the performance metrics help remove subjectivity.
In summary, the studies discussed in this section utilize a wide variety of techniques for outlier detection. In Table 4, we provide an overview of each of the studies’ methodologies and their respective category. Most studies chose unsupervised outlier detection, as labeled data is scarce; however, it has an implicit assumption that normal data is far more frequent than anomalous data, which might not be the case [5]. The unsupervised approaches employ, e.g., a regression method to detect outliers, such as LR. Subsequently, models that are based on geometry, including the kNN and SVM, are widely acknowledged as prevalent alternatives. Few studies focus on deep learning or logical models, while none utilize probabilistic methods for outlier detection.

6.1.3. Leakage Detection

Leakage detection is the process of identifying and locating leaks in a DH system, typically water for most DH systems. Leakage detection employs various techniques, such as acoustic sensing, pressure monitoring, AI and ML, and computer vision using airborne thermal imagery. Leakage detection aims to identify leaks in a network as quickly as possible to minimize losses and reduce environmental and property damage.
Chen et al. [74] present a leakage detection method for DH networks using reinforcement learning. The authors employ data from leakage simulations with ten-minute intervals, and state that leakage data is rare and does not cover all possible leakages. The authors utilize Contextual Bandit (CB) with Linear Upper Confidence Bound (LinUCB) for arm selection, as it performed best compared to random selection, ϵ -greedy method, and the Boltzmann method. To mitigate overfitting, the authors use Ridge Regression (RIDGE) and emphasize the importance of a delayed alarm trigger, to reduce the effects of false alarms due to peaks caused by measurement error and environmental noise. The authors apply stratified sampling to train the model and cumulative take-rate replay to evaluate the algorithm. The study achieves a high degree of accuracy, reporting an accuracy rate of 95%, and outperforming algorithms such as Extreme Gradient Boosting (XGBoost), ANN, and SVM (outperforming the second-best algorithm with 3%, and the worst algorithm by 15%).
Guan et al. [75] present an automatic leakage detection method using infrared thermal images. The proposed algorithm consists of two parts: (1) image segmentation and (2) fault diagnosis. The authors use image segmentation to eliminate irrelevant information and enhance the detection of relevant information. Fault diagnosis consists of three parts: (1) temperature analysis, (2) pipe diameter analysis, and (3) defect analysis. In temperature analysis, the authors use Optical Character Recognition (OCR) and an LR model to define the relationship between temperature and color and to construct the temperature matrix. The authors employ 3 σ to detect abnormal temperature values. In pipe diameter analysis, the authors use an analytical-based approach to detect the pipes where the insulation layer has fallen off. Once a pipe diameter violates a threshold, it indicates it is missing an insulation layer. The authors state that if the insulation layer damage is shallow, the temperature analysis may not be sufficient to detect faults; thus, the authors suggest in defect analysis an edge detection approach using Canny’s algorithm to extract the outer edge of the water pipe. Furthermore, the authors perform several computations to check if the value violates a specific threshold. The authors evaluate the methods by accuracy, precision, recall, and F 1 and present a flowchart to classify faults. On average, the authors claim their proposed approach reached robust efficacy (precision = 90.02 % , recall = 88.99 % , and F 1 = 89.49 % ).
Pierl et al. [76] propose a leakage detection method using three localization approaches: pressure wave detection, model-based numeric-analytical, and ML. The authors create a network model based on relevant data from a DH network and use simulations to generate leakage data, as they mention little historical leakage data exists. The ML approach makes use of three algorithms: SVM, NB, and RUS Boosted Trees (RUSBT). The authors motivate their choice for the specific algorithms. The authors use SVM to transform data into a higher dimension to make it separatable, NB as it can deal with noisy data, and RUSBT increases the classification quality of unbalanced data sets. To compute the accuracy, the authors evaluate the algorithms with the allocation rate to the affected exclusion area. The pressure wave detection approach reaches the highest accuracy with an allocation rate of 76 % .
Xue et al. [77] suggest an ML-based leakage fault detection method using the XGBoost algorithm. The authors use hydraulic simulations to generate leakage data and apply a delayed alert-triggering algorithm to detect a potential leakage. The authors construct the hydraulic simulation model when the DH network operates normally. If an alert is triggered, the authors collect a variation rate vector and use it as input in the XGBoost algorithm. The authors evaluate performance using accuracy and macro- F 1 , which are 85.84 % and 0.99786 , respectively.
Xu et al. [78] present a leakage detection method using airborne thermal imagery, using a human vision system assisted by Saliency computation (SC) [79]. The algorithm extracts three visual features: color, intensity, and orientation, to generate a saliency map. The authors remove thermal anomalies using buffer analysis (using ArcGIS). The authors claim the solution has good accuracy (sensitivity of 79.79 % ), especially when prior knowledge is scarce.
Hossain et al. [80] propose a leakage detection approach based on airborne thermal imagery using a CNN. The authors compare their approach to eight common ML algorithms. Four linear models: Logistic Regression (LOR), LDA, SVM, NB. Four non-linear models: kNN, Decision Tree (DT), RF, and Adaptive Boosting (AB). The authors utilize 16-bit images from an unmanned aerial vehicle in twelve different cities in Denmark. The approach uses a region extraction algorithm to extract potential leakages (image patches) from the full image. The authors use 243,082 images with 1345 leakages (labeled by an expert). The method uses leave-one-out to train and test the model. As the original data sets are highly imbalanced (around 99.7% are false patches), the authors remove data to create a balanced data set. Finally, the authors evaluate performance using recall, precision, false positive rate, unique ID, and accuracy. The study reports, on average, accurate results for the CNN with a balanced data set (recall = 82.2 % , precision = 90.2 % , false positive rate = 9.06 % , unique ID = 98.6 % , and accuracy = 0.866 ).
Berg et al. [81] present a leakage detection method using airborne thermal imagery. The authors collect thermal images taken at night from an aircraft and use ground truth data from seventeen Scandinavian towns and cities. Ground truth data has been manually labeled (media leakages, energy leakages, or false detections). The authors employ building information to remove false detections, using a building segmentation algorithm [82] and OpenStreetMap. Furthermore, the authors use two linear classifiers: LDA, SVM, and three non-linear classifiers: Radial Basis Function SVM, AB, and RF. The approach trains the models using 10-fold cross-validation. Consequently, the authors combine the models using a voting and layer invariant classification and evaluate performance using a true positive rate and a false positive rate. Further work and an enhanced method are seen in Berg et al. [83]. The authors report that the RF with 120 trees, average tree depth of ten, and splitting nodes on a randomly selected feature produces the best results with a false positive rate ( 42 % ) and positive rate ( 99 % ), respectively.
Friman et al. [82] propose a leakage detection method using airborne thermal imagery. The study utilizes thermal images from 15 cities in Sweden and Norway. Data contains partial ground-truth information, which the authors use for evaluation. The approach employs automatic building segmentation with AB and creates a detection model based on temperature field and heat flux around buried heating pipes. Furthermore, the authors construct a model of normal temperature variations using the pixel probability density function and flag outliers as potential leakages. The authors detect regions with significant temperature differences compared to other regions as temperature anomalies, i.e., classify it as a potential leakage. The study reports a high efficacy with a classification accuracy of 86 % .
In summary, the studies in this section utilize either airborne thermal imagery or leakage simulations to detect leakages in the primary side of the DH network. In Table 5, we provide an overview of each of the studies’ methodologies and their respective category, types of data, and DH segment. Only one study uses infrared thermal imagery to detect leakages on the secondary side. Overall, the studies use a wide variety of algorithms to achieve leakage detection and report a high detection rate. The most frequently employed algorithms included: SVM, RF, and AB.

6.2. Fault Diagnosis

Fault diagnosis is the process of identifying the specific cause of a malfunction or failure in DH system. In fault detection, the aim is to identify the presence of a fault. In contrast, in fault diagnosis, the aim is to classify the fault, i.e., fault detection is the first step in identifying a potential fault in the DH system, while fault diagnosis is the next step, and attempts to identify the specific cause of the problem. Fault diagnosis methods can use both supervised and unsupervised methods. We have organized the following section into several fault types: sensor failure (Section 6.2.1), fouling (Section 6.2.2), valves (Section 6.2.3), and (Section 6.2.4) and multi-label classification (Section 6.2.5) such that studies are grouped based on the same fault type they attempt to diagnose, to provide a clear overview.

6.2.1. Sensor Failure

Zimmerman et al. [84] propose an FDD method for pressure sensors using a Bayesian Network (BN). The authors use OpenModelica to simulate the DH system and faults. The approach utilizes HUGIN to build a probabilistic tree that can determine pressure faults. The study defines a fault as a discrepancy between sensor data and model predictions, i.e., the authors compare the model predictions with the measured values. Furthermore, the study classifies labels into normal, drifting, and jumping values. The authors define values within 1% of the model predictions as normal behavior; drifting values are leaks or deterioration of equipment, and jumping values are sensor faults. Furthermore, the authors verify potential sensor faults by checking the state of the next sensor. The study claims the approach shows potential for detecting network leaks and pressure sensor faults.
Aláiz-Moretón et al. [85] present a FDD methodology for sensor malfunctioning and recovering missing data. The authors employ several ML algorithms to model the behavior of the sensor: RF, XGBoost, Extremely Random Tree (ERT), AB, kNN, and a shallow ANN on data from the sensors of a geothermal heat exchanger during one year of operation with a ten-minute interval, i.e., the authors train predictive models to achieve a computational representation of the sensor. The authors evaluate results using MAE, Least Mean Log Squares (LMLS), Symmetric Mean Absolute Percentage Error (SMAPE), Mean Square Error (RMSE), Mean Absolute Percentage Error (MAPE), and Normalised Mean Square Error (NMSE). The study reports that a hybrid model with ERT performed best. The authors have proposed to undertake future studies to evaluate the efficacy of alternate algorithms, such as IF or one-class SVM.
Månsson et al. [86] suggest an ML approach for detecting sensor faults utilizing Gradient Boosting Regression (GBR) and TPOT. The authors use hourly data from a single heating season of a single substation in Sweden. The authors induce two types of faults into the data set: (1) communication problems between DH utility and heat meters, and (2) drifting meter faults. To automate parts of ML, the authors use TPOT, which creates combinations of pipelines, data transformations, and ML models to optimize the process. Furthermore, the authors evaluate the models using R 2 and MAE. The authors use sixteen training/testing sets, resulting in sixteen pipelines. The best-performing pipeline reached an R 2 = 0.9740 and MAE = 0.1301 . The authors claim that the models are capable of learning substation behavior and that the approach shows promising results for fault detection.

6.2.2. Fouling

Guelpa et al. [87] propose an analytical fouling detection method for substation heat exchangers. The authors use the primary side mass flow rate and the primary and secondary side supply/return temperatures to develop an automated tool that shows capabilities of detecting anomalies. Furthermore, the authors test the tool on 325 heat exchangers from multiple DH networks in Turin, Italy. The authors expect that utilizing the approach leads to an average annual decrease of primary heat consumption by 1.6 % .
Cadei et al. [88] present an ensemble learning-based approach for fouling detection in heat exchanger equipment. The authors combine two approaches, a short-term approach using an Auto Regressive Integrated Moving Average (ARIMA) model and a long-term approach using a RIDGE model. The authors employ data consisting of primary mass, flow rate, and supply/return temperatures. The study detects anomalies when the behavior statistically deviates from the models. Consequently, the authors use a one-class SVM to define the boundary of normal behavior. The study reports that the approach is currently being applied in the field to optimize maintenance activities and successfully detected two close fouling events.
Kim et al. [89] propose a fouling FDD approach using kM, MLP, and virtual assisted sensors. The authors employ kM to identify system operation patterns and utilize the identified clusters to divide data into training and testing data sets to evaluate the model under different testing conditions. Furthermore, the authors built a model using MLP with the system variables and measurements from the virtual assisted sensors, which estimate the unmeasured system variables necessary for modeling. Finally, the approach detects fouling when it violates a threshold by comparing the results of the predicted and measured values. The authors use R 2 (case 1: 0.89 , case 2 and 3: 0.99 ) and RMSE for model evaluation. Furthermore, the study reports that case 3 had, on average, a correct alarm rate of 89 % false alarm rate of 3 % and that by employing virtual sensors and the 17-min fast alarm approach, the prediction accuracy increased by 61 % .

6.2.3. Valves

Park et al. [90] present an ensemble learning-based method to detect malfunctioning differential pressure control valves by utilizing RF and Shapely Additive Explanations (SHAP). The authors use weather data from the Korea Meteorological Administration in combination with DH sensor data. The approach employs linear interpolation to compute smaller-resolution weather forecast data. The authors utilize labeled data (by an expert) from a single heating season. Furthermore, the approach utilizes stratified random sampling to divide data into training (70%) and test (30%) data sets. To construct the model, the authors employ RF and use SHAP to analyze the relationship between results and input variables. The RF with 120 trees had the highest performance. The authors compare the performance of RF with LR and DT using precision, recall, and F 1 , and report good results on the RF for normal behavior: 0.98 , 1.00 , 0.99 , and abnormal behavior: 0.95 , 0.81 , 0.87 , respectively.

6.2.4. Pipes

Langroudi et al. [91] describe an approach for predictive maintenance using backward simulation and test a wide variety of ML algorithms: LR, Decision Tree Regression (DTR), RIDGE, kNN, Partial Least Squares Regression (PLS), SVM, RF, LASSO, XGBoost and ANN. The authors employ hourly data from three DH networks and combine it with data from the Deutscher Wetterdienst. Furthermore, they replaced missing data with large negative numbers, such that null values are outliers. The authors calculated the correlation between features using PCC and claim that the non-temperature variables, such as relative humidity, sunshine duration, month, and hour, increase prediction quality. The approach employs a regression model trained using 10-fold cross-validation and evaluates results using MAE, RMSE, and R 2 . From the specified algorithms, RF showed the highest efficacy, with the accuracy of predictions for supply pipes (between 0.81 and 0.92) and return pipes (between 0.59 and 0.77).
Bahlawan et al. [92] propose an analytical FDD methodology to detect thermal and hydraulic faults. The authors aim to detect faults such as water leakages, heat losses, and pressure loss in DH pipes using the DH network of the University of Parma, Italy. Consequently, the authors employ a digital twin of the DH network to verify results. The study simulates faults to generate 23 data sets, each spanning ten days of operation. The model predicts six health indices for each pipe, where a low value indicates a fault. The lower the value, the higher severity of the fault. The authors claim their approach is capable of correctly detecting and identifying all simulated faults, including the severity of the fault.
Manservigi et al. [93] suggest an FDD approach for DH pipes using an analytical model. The authors aim to detect pipe faults, such as leakages, heat losses, and pressure losses. The study performs fault diagnosis by modeling an DH system and combining it with an optimization algorithm. The authors report a high accuracy, with a RMSE of <0.02%. Furthermore, the authors verify results by inducing six types of faults in the DH network at the University of Parma, Italy. The study claims the model correctly identifies all faults, including the exact magnitude.

6.2.5. Multi-Label Classification

Bode et al. [94] present an FDD methodology where the models are trained on laboratory data and applied in a real-world scenario. The synthetic data contains induced faults, such as leakages, condenser fouling, evaporator fouling, or refrigerant overcharging. The authors review a variety of algorithms, such as: LR, kNN, CART, RF, NB, SVM, and ANN. The authors generate three data sets using three reduction techniques: (1) univariate feature selection, (2) recursive feature elimination and cross-validation with linear regression, and (3) feature importance of the CART algorithm. Furthermore, the study uses oversampling to reduce the data imbalance. The authors evaluate results using accuracy and MCC and found that the algorithms perform well on the synthetic data with accuracy between 0.85 and 0.95 and MCC between 0.65 and 0.92 . The authors claim that CART and RF can correctly identify faults before they occur; however, the algorithms performed poorly on the real-world data set, with MCC scores between 0.58 and 0.7 respectively. However, the methodology shows promising results, as typically, in engineering scenarios, (fault) labels do not exist due to poor documentation of faults and maintenance interventions.
Li et al. [95] propose an FDD approach using a DH network simulation with kNN, RF, ANN, and CNN. The authors can classify nine types of faults, such as sensor, actuator, component faults, bias, drift, and complete failure faults. The study evaluates results using precision, accuracy, and F 1 . The authors state that the difference in the characteristics of a fault, such as an occurrence time, trend, amplitude, offset, or slope, makes faults distinguishable. kNN, and CNN had the highest F 1 ( 0.95 ); however, the latter had the highest performance in noisy conditions, and choosing the right data window significantly improves the accuracy. On average, the performance of the CNN, on most sub-faults, was >95% for all metrics, and can detect and isolate most of the sub-faults accurately when the data window is large enough.
Choi et al. [96] present two FDD methods utilizing an AE to generate useful features. The approaches consist of residual-based and latent space-based. The two methods work well with a variety of classification algorithms, such as: MLP, DT, and SVM. The authors use a data set collected from a 27-story multifamily residential building in South Korea. Data is recorded every minute and contains both primary and secondary supply/return temperatures. The authors use an MLP to classify faults and evaluate results using accuracy, precision, and F 1 . LSM reached an F 1 of 0.920, while residual-based reached an F 1 of 0.776. Furthermore, in residual-based, according to the authors, the training data dependency issue was present, which led to performance degradation.
In summary, the studies in this section utilize a wide variety of techniques and aim to compare the performance of different algorithms. In Table 6, we provide an overview of each of the studies’ methodologies and their respective diagnosis aim. Furthermore, many studies face challenges in obtaining ground truth information; thus often resort to using synthetic data or reducing the impact of the challenge. For example, one study [94] suggests training on lab-generated data may overcome the challenge. Another study proposes to utilize a one-class SVM [88] to reduce the need for labeled data, and another study exploits feature engineering [96] to develop higher-performing models. Overall, it was not the choice of ML algorithm, but primarily data quality, that impacted the performance the most, which is specifically challenging in fault diagnosis, as there is a severe lack of labeled data.

7. Discussion

In this section, we will reflect on the results obtained from this study. We present the findings through the topics in the SWOT analysis, seen in Figure 6. In Section 7.1 we will highlight the strengths and research trends for both fault detection and fault diagnosis. From Section 7.2, we will provide an extensive discussion on the most relevant threats, weaknesses (Section 7.3), and opportunities (Section 7.4), as well as the limitations of the methods and DH industry. Additionally, we will present recommendations and discuss the practical implications of synthetic data generation. Furthermore, we will provide some key opportunities in Section 7.4, which could further advance the understanding of FDD in DH. Overall, we aim to offer a holistic and in-depth understanding of the research and summarize the key findings in Figure 6 to provide a quick overview of the discussed points.
In the SWOT analysis, strengths refer to the positive characteristics in DH systems that benefit current intelligent FDD. Weaknesses refer to negative characteristics in DH systems, which are minor limitations but can be influenced in the short term. Opportunities refer to potential future research directions to improve intelligent FDD for DH systems. Threats refer to the negative characteristics in DH systems, which are major limitations and difficult to change in the short term.

7.1. Strengths

S1—Increasing attention from research community. As Figure 1 reveals, there has been a gradual increase in the number of DH FDD research publications. What stands out in this figure is that before 2018 there was a tendency to make use of more traditional ML methods, e.g., LR, kM, kNN, or RF; however, from 2018 onwards there seems to be an increase in the variety of ML types used, e.g., regression, logical, geometric, or deep learning. Although, what lags is the use of probabilistic models, which could be specifically relevant to the current situation, as it can effectively deal with uncertainty. The increase in research studies could be explained through the (increasing) digitization of DH networks, as data is significantly easier to obtain. The number of studies peaked in 2019, and we can see a slight reduction after 2019. It is unknown whether this is due to the challenges in DH we highlight or to external events such as the pandemic. However, the number of research studies is likely to increase after 2022, as it is expected for data to increase in amount and quality and for the introduction of novel and optimized ML methods. Data quality will play a key role in DH, and it is paramount for future successes in DH FDD.
S2—Increasing digitization of DH systems may explain the increase in research studies, as it has led to an increase in the amount of data available for analysis. Digitization is a key enabler for the development and implementation of intelligent FDD using AI and ML, which can significantly improve DH systems’ efficiency and reliability. Additionally, the digitization of DH networks enable predictive maintenance techniques, which can forecast potential failures before they occur and take preventive measures to avoid them. The preventive maintenance approach uses AI and ML techniques on real-time data to analyze equipment performance, identify potential issues and provide recommendations for maintenance or repairs of various parts depending on their current usage. It is different from reactive maintenance—currently, the DH field primarily employs—which waits for equipment to fail before taking action. Predictive and preventive maintenance based on AI and ML can reduce downtime and improve overall performance and system reliability. Understanding the physics of component failure can be beneficial for, e.g., predictive maintenance. Incorporating knowledge of the physical processes that lead to component failures into the ML models, could result in more accurate predictions. However, it is also important to note that ML is capable of identifying patterns that are present in the data which may not be directly related to the physics of component failure. Therefore, while the physics of component failure can help improve the accuracy of FDD, it is not the only factor that should be considered. Nevertheless, physics-based ML is an emerging field that aims to integrate physics-based knowledge with ML techniques. Physics-based ML refers to the integration of physical laws and principles into ML models. This approach can improve the accuracy and interpretability of the models by incorporating domain knowledge, such as knowledge of the underlying physics governing a system, into the learning process. By using physics-based models, it is also possible to make predictions about a system in scenarios where there is limited training data available or when extrapolating beyond the range of training data. An example is given in [97].
S3—The abundance of unlabeled data is a strength that makes DMKD particularly relevant for this field. In DMKD, we identify mainly two methods: kM and GMM. The most popular method is kM, which is used primarily in conjunction with Euclidean distance [34,41,44,46,48]. kM often performs exceptionally well for its simplicity; however, while Euclidean distance works well for two or three-dimensional data, it does not do well on higher-dimensional data, which we will explain further in Section 7.3.
Another popular method is GMM [33,43,47]. The authors in [33] report better results using GMM instead of kM. There is some experimentation in using different techniques other than kM, such as in [32,42,49,50,51,58]. For example, [32], uses kS, which has a similar iterative procedure seen in kM, but kS differs significantly in distance metric and centroid computation. The authors have reported good results and are successful in identifying deviating customers. In [49,50,51], the authors have used HOM and are successful in finding deviating substations. Consequently, a majority of DMKD studies utilize DBI or SI for clustering validation.
In Fault detection, as seen in Figure 1, most of the references fall into this category, i.e., most methods detect that there might be a malfunction. However, a significant challenge in this category is to conclusively state that a fault is a cause; thus, most studies make assumptions or perform anomaly or outlier detection, where only deviating behavior may be detected. A majority of studies report successful results using geometric models [5,60,61,66,70]; however, as we will explain in Section 7.3, there are substantial implications when using, e.g., regression models, due to the lack of known ground truth information. In [60], the authors mention that it is difficult to evaluate the performance due to the lack of knowledge of the number of real anomalies. For example, in [61], the authors have to assume that 20 % of the data are outliers; however, it is difficult to verify if this assumption is valid. The authors of [67] also refer to the issue, as they had to use trial-and-error for choosing outlier thresholds. In general, with current data sets, there is no prior knowledge or understanding of the underlying data, making it difficult to determine whether an outlier indicates a faulty or optimal value.
A noteworthy study is [6], although not an automatic method, shows that a significant number of the 135 examined substations in Sweden is performing sub-optimal. Additionally, the authors in [5] also report that a high number of their examined substations is performing sub-optimal; however, the authors suggest the lack of uniform definition in DH makes it challenging to define the optimal operation of a substation, making comparison difficult. While it may be challenging to quantify an optimal substation, it could be beneficial to study the data of known well-performing substations, e.g., using exploratory data analysis, such that it uncovers essential correlations or statistical characteristics. This information may help approximate the definition of an optimal substation and form a solid foundation for future fault detection research. Also, both studies are concerned with Swedish substations, which makes generalizing challenging. To our best knowledge, these are the only two publications that try to quantify the sub-optimal operation of substations in a DH system. Nevertheless, this is an important issue for future research, as several questions remain unanswered. For example, it is valuable to know whether this phenomenon occurs in different countries and various DH systems.
Several studies show that deep learning methods may work well for FDD. The deep learning studies for fault detection use either an LSTM [60,67] or an MLP [68]. For example, the authors in [60] suggest that utilizing an LSTM outperforms several algorithms, such as LASSO, SVR, and MLP. The work in [67] claims that combining an LSTM with a VAE outperforms an LSTM combined with an AE as well as an LSTM only. However, in general, the application of deep learning methods is limited for fault detection in DH. The lack of training data could be the reason since deep learning methods need an abundance of training data.
What stands out in Figure 1 is that for fault diagnosis, the most popular methods are: kNN, RF, and ANN. Multiple studies compare several algorithms, such as in [85,91,94,95]. In [85], the authors suggest that using ERT results in the best performance. The authors of [91] claim that RF regression had the best performance. In [94], RF also had the best performance together with CART. Furthermore, the authors take an intriguing approach by training their models on lab-generated data and transferring the knowledge to real-world data. While the models did not perform as well, it might be a solution to counteract the lack of labeled data from real-world scenarios. Consequently, their findings further support the idea that ensemble tree algorithms are well-suitable for performing FDD. In contrast to earlier findings, however, the results from [95] suggest that CNN performed better than rf. It is important to note that caution must be exercised when interpreting the results from models solely trained on synthetic data, as it is usually easier to achieve high performance on such data sets. Also, as discussed earlier, while deep learning models are known for solving complex problems, one typically needs a large set of labeled data, which currently does not exist in the DH domain. In general, ensemble learning methods tend to perform well.
Noteworthy is [88], as the authors were the only ones using a one-class SVM. This kind of approach solely needs a single class of data to find outliers, which might work well for fault detection. Also, another interesting study is [96], which uses an AE to generate useful features. To our knowledge, this is the only study that employs generative ML to perform feature engineering and improve prediction models.
Overall, most studies in fault diagnosis are comparative studies. This might explain the sudden increase of variety in ML methods from 2018, as seen in Figure 1. It might suggest that the large variety of ML methods indicates a lack of knowledge regarding the best-performing algorithms in DH scenarios and indicates that further work is required to increase that knowledge. Consequently, these findings may be somewhat limited as most studies only used synthetic data. More research must be conducted in real-world scenarios to reinforce the findings.

7.2. Threats

T1—system complexity is one of the significant challenges in DH, as DH systems are highly heterogeneous, with many ad-hoc solutions introduced over the past decades. Consequently, space heating and DHW needs heavily depend on the end-user; for example, a hospital may use heat day and night, while a school building may only use heat during the day. Another problem is that DHW preparation is not measured separately, causing noise in the data. It is currently unknown if the current data collection for billing contains enough information to conduct accurate FDD, i.e., the data constraints might be too strict in DH systems. There is an imperative need for knowledge of DH data, e.g., the effects of secondary data on accuracy. Only one study shows the importance of having secondary side data [36], as it significantly improves model prediction. Furthermore, some studies [5] chose to focus on the largest heat consumers, which may sound reasonable as they impact the DH system the most; however, it may be challenging to create a general model as these consumers are usually unique and highly heterogeneous. On the contrary, a unique solution may not exist.
T2—Absence of unified definitions is another challenge in DH, such as having quantitative parameters of optimal, sub-optimal, and fault operation. One study raises the issue of optimality [5] as it significantly impacts conclusions in analysis. Some studies focus on fault definitions or business innovations [37,38,40], but there is still significant work to be done, as faults should be further investigated based on, e.g., type or operational impact.
Recommendation 1: Policymakers and industry should make serious attempts to create legislation and facilitate standardization of (secondary) data collection and installation of (monitoring) equipment.
Recommendation 2: Researchers should investigate the effects of secondary data or additional sensor placement on model prediction performance, to generate knowledge for standardization in DH (data collection).
T3—Data collection in DH constitutes another significant challenge. There is currently no clear standard of data acquisition or logging technical interventions and faults for fdd; resulting in low-quality unlabeled data sets—making intelligent FDD incredibly difficult. There is an urgent need for improved data collection. Consequently, there are currently not enough efforts made for preliminary data analysis and proper interpretation of hidden patterns. This lack of attention will impede the acquisition of a comprehensive understanding of the phenomena associated with FDD in DH and the development of more precise ML models, i.e., there is a lack of data-centric approach to the FDD problems.

7.3. Weaknesses

W1—Lack of data-centric approaches. In the past five years, there was a significant increase in FDD related studies. However, since the topic is still in its infancy, much knowledge regarding DH data is not present, while it is important to successful ML, e.g., data drives model selection; thus, it is essential to understand the (hidden) characteristics of DH data. More research should focus on, e.g., DMKD to generate critical knowledge regarding DH data. Few studies explain their choices regarding their methods or use default settings. For example, many studies use Euclidean distance in clustering for no apparent reason, even when the distance metric significantly impacts clustering results. Euclidean distance works well for two- or three-dimensional data but does not do well on higher dimensional data, and according to the authors in [98], the Manhattan distance metric ( L 1 norm) is preferred over Euclidean, i.e., the choice for methods is essential to the success of intelligent FDD. Furthermore, few studies point out the problems of DH data, e.g., [33]. However, for example, unsupervised anomaly detection has an initial assumption that anomalies are far less common than normal behavior [25]. Violation of such an assumption lead to a high false alarm rate. There is some evidence [5,6] which suggests that the initial assumption may not hold, as a large share of the examined substations is sub-optimal; thus, the data may already include a large share of anomalous data, i.e., the regression models do not necessarily predict the correct values for an optimal substation, and it would be difficult to verify if they do so. While forecasting is helpful for billing and energy planning, as long as the premise is incorrect, the prediction for FDD is also potentially faulty, even when passing the statistical validation in training. It is evident that data-centric approaches will help build more accurate and robust ML models by gaining knowledge on data structures, distribution, (faulty) behavior, relationships, and features.
Recommendation 3: Improve and increase knowledge on characteristics and properties of DH data using data-centric approaches, which guides future work in intelligent FDD, e.g., association analysis studies, dimensional reduction studies, and DMKD studies.
W2—Lack of labeled data. There are serious implications regarding labeling data, as very little knowledge exists on the faults and their impact. For example, Månsson et al. [37] investigated the types and occurrences of faults. The study concludes that the most common faults in customer installations are leakages (33%), customer internal heating system (31%), control valves (13%), actuators (10%), control system and controller (5%), inferior gaskets (5%) and heat exchangers (3%). The paper may form a solid basis for labeling; however, it is not comprehensive and needs further refinements to contain all possible fault labels and their severity. To the best of our knowledge, there currently is a lack of labeled data sets in the DH domain, and there is a severe need for known ground truth information. Additionally, it is important to have a data set that includes many different contextual aspects. For example, the environmental factor can influence the diagnosis process, as the outdoor temperature affects the behavior of the system, and therefore affect the signature of faults. For example, it may be the case, when outdoor temperatures are high, a fault is less noticeable or has a different signature, than when the outdoor temperature is low. Similarly, heat consumption can be affected by environmental factors, which can impact the accuracy of FDD. It is therefore important to include various contextual aspects, to create a comprehensive and representative data set. Also, including environmental data in the modeling process can potentially improve the accuracy and robustness of intelligent FDD approaches.
Recommendation 4: Increasing known ground truth information (optimal, sub-optimal, faulty), which can be used to train more accurate models, but more importantly, evaluate the performance.
W3—Simulations and emulations, by inducing faults, may counter the lack of labeled data. While simulations solely mimic software features in a software environment, emulations use a physical model to mimic both hardware and software features; thus can be a step closer to reality. However, it is important to exercise caution with simulations and emulations, as both can oversimplify reality. Additionally, there are two major limitations to emulation. (1) it is expected that their use leads to the generalization of problems due to the highly heterogeneous nature of DH, i.e., the models might work well on the synthetic data from a specific substation but are not capable of generalizing to real-world data [94]. (2) it is very labor intensive to reproduce the entire temporal and spatial dynamic evolution of a particular fault, e.g., a leakage emerges and progresses and evolves in numerous ways, i.e., data may not be sufficiently accurate in reflecting reality. Both limitations may lead to a mismatch, and training on such data will generate useful insights. Simulations may solve the latter limitation, as it is easier to generate the dynamics of a fault; however, if not properly defined, the generated data would still be inadequate, thus leading to, e.g., generalization difficulties. Nevertheless, for example, generating synthetic data may be relevant to quantify and prove accuracy gains with secondary side information or additional sensor placement. It could also provide useful insights to feature importance, e.g., through dimensional reduction techniques such as PCA, or patterns, e.g., using DMKD techniques. This also highlights the importance of data-centric approaches, as much of the foundational knowledge is currently lacking but essential for effective FDD in DH.
W4—Data imbalance is a common phenomenon in engineering scenarios, as faults happen less frequently than optimal behavior. Data imbalance affects the decision boundary, as it will be biased towards the majority class, and predicting the minority class becomes a problem, i.e., data imbalance reduces the accuracy of the diagnosis model. It is, therefore, important to be aware of this phenomenon, as metrics such as accuracy scores can be misleading. We suggest utilizing metrics that provide more insights, such as Precision, Recall, F 1 score, Confusion Matrix, Area Under the ROC Curve, or a combination of metrics. Furthermore, there are several ways to deal with imbalanced data sets [99], such as utilizing resampling strategies or cost-sensitive training. Cost-sensitive training penalizes learning algorithms to increase the cost of classification mistakes of the minority class. Consequently, logical models and ensemble learning can further improve model prediction on imbalanced data sets, e.g., using RF or GBDT. As a side effect, logical models have high interpretability, leading to explainable FDD.

7.4. Opportunities

O1—Generative machine learning algorithms [100], e.g., such as VAE, could be relevant in data generation. VAE is an unsupervised generative method that learns the underlying data distribution. VAE transforms the original distribution into a latent distribution (encode) and transforms it back into the original distribution (decode). Only a single study used the algorithm [67]. Generative Adviserial Networks (GAN)s can generate realistic synthetic data. gans are two neural networks that compete against each other. The generator learns to generate realistic instances, while the discriminator (adversarial) learns to distinguish fake from real. To the best of our knowledge, none of the studies have employed GANs for data generation; however, both techniques might be worth exploring.
Recommendation 5: Experiment and increase knowledge using ML methods for the generation of realistic synthetic data, such as generative machine learning algorithms, e.g., using VAE or GAN.
O2—Hybrid models have the potential to counter, for example, data imbalance and the issues related to synthetic data. Hybrid models are ML models that train simultaneously on real-world and simulated data. This approach combines the strengths of both types of data, allowing for more accurate and robust model predictions. While real-world data provides a realistic representation of real-world scenarios, simulated data allows for controlled experimentation and the ability to generate (unavailable) data, such as faulty data. It can be beneficial to train on both data types, as training on a single type of data may result in missing important patterns and relationships; however, there are some limitations, as hybrid models introduce extra complexity, and it can be difficult to obtain both representative real-world data as well as simulated data.
Recommendation 6: Implementation of hybrid models that combine real-world and simulated data for FDD in DH. The approach can provide more insights and identify patterns and relationships that training on one type of data may miss.
O3—Transfer learning [22] may help solve some of the challenges in DH. In general, deep learning methods are very relevant for FDD, e.g., applications of 2D CNN with time-frequency input data are successful in other fields [24]; however, these algorithms need an abundance of labeled data with sufficient information on the health state. As previously discussed, this does not exist in the DH domain. Transfer learning—previously known as learning to learn—is an ML technique where models from a certain task are reused for a model in another novel task. Consequently, domain adoption [23], a subdomain of transfer learning, may also be effective for FDD in DH, as it exploits labeled data in one or more related source domains, such that the model can classify unlabeled data in a target domain. Transfer learning is applicable when the source and target tasks are similar but have different data distributions. At the same time, domain adaptation is applicable when the source and target tasks are related but have different feature representations. Both techniques can reduce the need for labeled instances in DH, as models can exploit information from a source task.
Recommendation 7: Explore the use of transfer learning and domain adaptation for FDD in DH. The knowledge from other domains, e.g., building energy management or industrial systems, can help improve the performance of FDD models in DH. Consequently, both techniques are useful for reducing the need for labeled data.
O4—Semi-supervised learning also offers an opportunity for FDD in DH. Semi-supervised learning combines both supervised and unsupervised learning, such that it leverages labeled instances to improve performance on unlabeled instances. This approach is useful when labeled data is scarce, and unlabeled data is abundant, such as in DH. While overall, the research on semi-supervised is lacking compared to, e.g., supervised learning, it still offers many benefits, such as reducing the need for labeled instances, improved performance, and handling missing, imbalanced, and noise data. Some common techniques worth exploring might be label propagation, label spreading, pseudo-labeling, self-training, co-training, multi-view learning, or related algorithms.
Recommendation 8: Investigate and utilize semi-supervised learning for FDD in DH by combining both labeled and unlabeled data for training FDD models. The technique can help improve performance by exploiting a large number of unlabeled data.

8. Conclusions

This study set out to review the topic of intelligent fault detection and diagnosis in district heating from the past twelve years. We have presented a comprehensive overview of state-of-the-art employed techniques, trends, challenges, and opportunities. Despite recent advancements in the field, research on intelligent fault detection and diagnosis in district heating is still in its infancy. Consequently, the lack of open-source high-quality labeled data severely hinders and slows progress in district heating fault detection and diagnosis research. The industry would benefit by increasing knowledge of data and should make serious attempts to standardize data collection for fault detection and diagnosis purposes. Nevertheless, we anticipate the trend of utilizing machine learning for fault detection and diagnosis in district heating to continue to advance. As district heating systems become more digitized, data becomes more accessible, machine learning will become increasingly prevalent, and district heating has the potential to make a significant contribution to the energy transition through its ability to provide efficient and sustainable heating solutions.
Future research should consider focusing on both the short and long-term perspectives. In the short term, researchers should aim to explore techniques to reduce the need for labeled data, such as:
  • Transfer learning.
  • Domain adaption.
  • Semi-supervised learning.
  • Hybrid models.
In the long term, research should direct efforts towards establishing a solid foundation for intelligent fault detection and diagnosis in district heating, by exploring:
  • Data-centric approaches.
  • Improving (labeled) data quality.
  • Quantifying district heating definitions.

Author Contributions

Conceptualization, J.v.D., V.B., S.A., H.G., J.A.K. and E.M.; methodology, J.v.D., V.B., S.A., H.G., J.A.K. and E.M.; validation, J.v.D., V.B., S.A., H.G., J.A.K. and E.M.; investigation, J.v.D.; data curation, J.v.D.; writing—original draft preparation, J.v.D.; writing—review and editing, J.v.D., V.B., S.A., H.G., J.A.K. and E.M.; visualization, J.v.D.; supervision, V.B., S.A., H.G., J.A.K. and E.M.; project administration, V.B., H.G. and E.M.; funding acquisition, V.B., S.A., H.G. and E.M. All authors have read and agreed to the published version of the manuscript.

Funding

Jonne van Dreven is funded by the Flemish Institute for Technological Research (VITO), Belgium. This research was funded partly by the Knowledge Foundation, Sweden, through the Human-Centered Intelligent Realities (HINTS) Profile Project (contract 20220068).

Institutional Review Board Statement

Not applicable.

Informed Consent Statement

Not applicable.

Data Availability Statement

Not applicable.

Conflicts of Interest

The authors declare no conflict of interest.

Abbreviations

The following abbreviations are used in this manuscript:
DHDistrict Heating
CHPCombined Heat and Power
DHWDomestic Hot Water system
FDDFault Detection and Diagnosis
4GDH4th generation district heating
5GDH5th generation district heating
DMKDData Mining and Knowledge Discovery
AIArtificial Intelligence
MLMachine Learning
HOMHigher Order Mining
EDAExploratory Data Analysis
GMMGaussian Mixture Model
KGMMKernel Gaussian Mixture Model
SVMSupport Vector Machines
kNNk-Nearest Neighbor
kMk-Means
kSk-Shape
PAMPartitioning Around Medoids
MIAMean Index Adequacy
CDICluster Dispersion Indicator
SISilhouette Index
DBIDavies-Bouldin Index
BICBayesian Information Criterion
PCCPearson Correlation Coefficient
CCConformal Clustering
MSTMinimum Spanning Tree
TPOTTree-based Pipeline Optimization Tool
AHCAgglomerative Hierarchical Clustering
LSTMLong short-Term Memory
ANNArtificial Neural Network
CNNConvolutional Neural Network
DNNDeep Neural Network
GANGenerative Adviserial Networks
MLPMultilayer Perceptron
GBDTGradient Boosted Decision Tree
BDTBinary Decision Tree
DTDecision Tree
DTRDecision Tree Regression
CBContextual Bandit
NBNaive Bayes
RUSBTRUS Boosted Trees
XGBoostExtreme Gradient Boosting
RFRandom Forests
IFIsolation Forests
ABAdaptive Boosting
ERTExtremely Random Tree
LDALinear Discriminant Analysis
PCAPrinciple Component Analysis
BNBayesian Network
ARIMAAuto Regressive Integrated Moving Average
LinUCBLinear Upper Confidence Bound
CARTClassification and Regression Tree
AEAuto Encoder
VAEVariational Auto Encoder
LRLinear Regression
RRRobust Regression
LORLogistic Regression
RFRRandom Forest Regression
ARauto Regression
LASSOLasso Regression
RIDGERidge Regression
GBRGradient Boosting Regression
PLSPartial Least Squares Regression
SVRSupport Vector Regression
OLSOrdinary Least Squares
COCContinuous Operation Control
NSBNight Setback Control
TCO5Time Clock Operation (during five workdays)
TCO7Time Clock Operation (during seven workdays)
HVACheating, ventilation, and air conditioning
OCROptical Character Recognition
SCSaliency computation
SHAPShapely Additive Explanations
EMExpectation Maximization

References

  1. United Nations. Growing World Population. Available online: https://www.un.org/en/global-issues/population (accessed on 2 August 2022).
  2. United Nations. Urbanization. Available online: https://www.un.org/development/desa/en/news/population/2018-revision-of-world-urbanization-prospects.html (accessed on 2 August 2022).
  3. Ferrari, L.; Morgione, S.; Rutz, D.; Mergner, R.; Doračić, B.; Hummelshøj, R.M.; Grimm, S.; Kazagic, A.; Merzic, A.; Krasatsenka, A.; et al. A comprehensive framework for District Energy systems upgrade. Energy Rep. 2021, 7, 359–367. [Google Scholar] [CrossRef]
  4. European Commission. 2050 Long-Term Strategy. Available online: https://ec.europa.eu/clima/eu-action/climate-strategies-targets/2050-long-term-strategy_en (accessed on 9 January 2022).
  5. Månsson, S.; Davidsson, K.; Lauenburg, P.; Thern, M. Automated statistical methods for fault detection in district heating customer installations. Energies 2018, 12, 113. [Google Scholar] [CrossRef] [Green Version]
  6. Gadd, H.; Werner, S. Fault detection in district heating substations. Appl. Energy 2015, 157, 51–59. [Google Scholar] [CrossRef] [Green Version]
  7. ∅stergaard, D.S.; Smith, K.M.; Tunzi, M.; Svendsen, S. Low-temperature operation of heating systems to enable 4th generation district heating: A review. Energy 2022, 248, 123529. [Google Scholar] [CrossRef]
  8. International Energy Agency (IEA). District Heating. Available online: https://www.iea.org/reports/district-heating (accessed on 20 January 2023).
  9. Sorknæs, P.; ∅stergaard, P.A.; Thellufsen, J.Z.; Lund, H.; Nielsen, S.; Djørup, S.; Sperling, K. The benefits of 4th generation district heating in a 100% renewable energy system. Energy 2020, 213, 119030. [Google Scholar] [CrossRef]
  10. Flach, P. Machine Learning: The Art and Science of Algorithms That Make Sense of Data; Cambridge University Press: Cambridge, UK, 2012. [Google Scholar]
  11. McClarren, R.G. Machine Learning for Engineers; Springer: Berlin/Heidelberg, Germany, 2021. [Google Scholar]
  12. Sutton, R.S.; Barto, A.G. Reinforcement Learning: An Introduction, 2nd ed.; MIT press: Cambridge, MA, USA, 2018. [Google Scholar]
  13. Goodfellow, I.; Bengio, Y.; Courville, A. Deep Learning; MIT Press: London, UK, 2016. [Google Scholar]
  14. Ramesh, A.; Dhariwal, P.; Nichol, A.; Chu, C.; Chen, M. Hierarchical Text-Conditional Image Generation with CLIP Latents. arXiv 2022, arXiv:2204.06125. [Google Scholar]
  15. Nakano, R.; Hilton, J.; Balaji, S.; Wu, J.; Ouyang, L.; Kim, C.; Hesse, C.; Jain, S.; Kosaraju, V.; Saunders, W.; et al. WebGPT: Browser-assisted question-answering with human feedback. arXiv 2021, arXiv:2112.09332. [Google Scholar]
  16. Holzinger, A.; Saranti, A.; Molnar, C.; Biecek, P.; Samek, W. Explainable AI methods-a brief overview. In Proceedings of the xxAI-Beyond Explainable AI: International Workshop on Extending Explainable AI Beyond Deep Models and Classifiers, Vienna, Austria, 18 July 2020; Revised and Extended Papers; Springer: Berlin/Heidelberg, Germany, 2022; pp. 13–38. [Google Scholar]
  17. Chapelle, O.; Scholkopf, B.; Zien, A. Semi-Supervised Learning; The MIT Press: Cambridge, MA, USA, 2006. [Google Scholar]
  18. Witten, I.H.; Frank, E.; Hall, M.A. Data Mining: Practical Machine Learning Tools and Techniques, 3rd ed.; Morgan Kaufmann: Burlington, MA, USA, 2011. [Google Scholar]
  19. Berthelot, D.; Carlini, N.; Goodfellow, I.; Papernot, N.; Oliver, A.; Raffel, C. MixMatch: A Holistic Approach to Semi-Supervised Learning. arXiv 2019, arXiv:1905.02249. [Google Scholar]
  20. Iscen, A.; Tolias, G.; Avrithis, Y.; Chum, O. Label Propagation for Deep Semi-supervised Learning. arXiv 2019, arXiv:1904.04717. [Google Scholar]
  21. Xie, Q.; Luong, M.T.; Hovy, E.; Le, Q.V. Self-training with Noisy Student improves ImageNet classification. arXiv 2019, arXiv:1911.04252. [Google Scholar]
  22. Zhuang, F.; Qi, Z.; Duan, K.; Xi, D.; Zhu, Y.; Zhu, H.; Xiong, H.; He, Q. A comprehensive survey on transfer learning. Proc. IEEE 2020, 109, 43–76. [Google Scholar] [CrossRef]
  23. Pan, S.J.; Yang, Q. A survey on transfer learning. IEEE Trans. Knowl. Data Eng. 2009, 22, 1345–1359. [Google Scholar] [CrossRef]
  24. Lei, Y.; Yang, B.; Jiang, X.; Jia, F.; Li, N.; Nandi, A.K. Applications of machine learning to machine fault diagnosis: A review and roadmap. Mech. Syst. Signal Process. 2020, 138, 106587. [Google Scholar] [CrossRef]
  25. Chandola, V.; Banerjee, A.; Kumar, V. Anomaly detection: A survey. ACM Comput. Surv. (CSUR) 2009, 41, 1–58. [Google Scholar] [CrossRef]
  26. Zhao, Y.; Li, T.; Zhang, X.; Zhang, C. Artificial intelligence-based fault detection and diagnosis methods for building energy systems: Advantages, challenges and the future. Renew. Sustain. Energy Rev. 2019, 109, 85–101. [Google Scholar] [CrossRef]
  27. Zhao, Y.; Zhang, C.; Zhang, Y.; Wang, Z.; Li, J. A review of data mining technologies in building energy systems: Load prediction, pattern identification, fault detection and diagnosis. Energy Built Environ. 2020, 1, 149–164. [Google Scholar] [CrossRef]
  28. Mbiydzenyuy, G.; Nowaczyk, S.; Knutsson, H.; Vanhoudt, D.; Brage, J.; Calikus, E. Opportunities for machine learning in district heating. Appl. Sci. 2021, 11, 6112. [Google Scholar] [CrossRef]
  29. Buffa, S.; Fouladfar, M.H.; Franchini, G.; Lozano Gabarre, I.; Andrés Chicote, M. Advanced control and fault detection strategies for district heating and cooling systems—A review. Appl. Sci. 2021, 11, 455. [Google Scholar] [CrossRef]
  30. Zhou, S.; O’Neill, Z.; O’Neill, C. A review of leakage detection methods for district heating networks. Appl. Therm. Eng. 2018, 137, 567–574. [Google Scholar] [CrossRef]
  31. Wohlin, C. Guidelines for snowballing in systematic literature studies and a replication in software engineering. In Proceedings of the 18th international Conference on Evaluation and Assessment in Software Engineering, London, UK, 13–14 May 2014; pp. 1–10. [Google Scholar]
  32. Calikus, E.; Nowaczyk, S.; Sant’Anna, A.; Gadd, H.; Werner, S. A data-driven approach for discovering heat load patterns in district heating. Appl. Energy 2019, 252, 113409. [Google Scholar] [CrossRef]
  33. Sun, W.; Cheng, D.; Peng, W. Anomaly Detection Analysis for District Heating Apartments. J. Appl. Sci. Eng. 2018, 21, 33–44. [Google Scholar]
  34. Tureczek, A.M.; Nielsen, P.S.; Madsen, H.; Brun, A. Clustering district heat exchange stations using smart meter consumption data. Energy Build. 2019, 182, 144–158. [Google Scholar] [CrossRef]
  35. Frederiksen, S. and Werner, S. District Heating and Cooling; Studentlitteratur: Lund, Sweden, 2013. [Google Scholar]
  36. Brés, A.; Johansson, C.; Geyer, R.; Leoni, P.; Sjögren, J. Coupled building and system simulations for detection and diagnosis of high district heating return temperatures. In Proceedings of the Conference: Building Simulation: 16th Conference of IBPSA, Rome, Italy, 2–4 September 2019. [Google Scholar]
  37. Månsson, S.; Kallioniemi, P.O.J.; Thern, M.; Van Oevelen, T.; Sernhed, K. Faults in district heating customer installations and ways to approach them: Experiences from Swedish utilities. Energy 2019, 180, 163–174. [Google Scholar] [CrossRef]
  38. Månsson, S.; Benzi, I.L.; Thern, M.; Salenbien, R.; Sernhed, K.; Kallioniemi, P.O.J. A taxonomy for labeling deviations in district heating customer data. Smart Energy 2021, 2, 100020. [Google Scholar] [CrossRef]
  39. Månsson, S.; Thern, M.; Johansson Kallioniemi, P.O.; Sernhed, K. A fault handling process for faults in district heating customer installations. Energies 2021, 14, 3169. [Google Scholar] [CrossRef]
  40. Leoni, P.; Geyer, R.; Schmidt, R.R. Developing innovative business models for reducing return temperatures in district heating systems: Approach and first results. Energy 2020, 195, 116963. [Google Scholar] [CrossRef]
  41. Gianniou, P.; Liu, X.; Heller, A.; Nielsen, P.S.; Rode, C. Clustering-based analysis for residential district heating data. Energy Convers. Manag. 2018, 165, 840–850. [Google Scholar] [CrossRef]
  42. Ma, Z.; Yan, R.; Nord, N. A variation focused cluster analysis strategy to identify typical daily heating load profiles of higher education buildings. Energy 2017, 134, 90–102. [Google Scholar] [CrossRef] [Green Version]
  43. Lu, Y.; Tian, Z.; Peng, P.; Niu, J.; Li, W.; Zhang, H. GMM clustering for heating load patterns in-depth identification and prediction model accuracy improvement of district heating system. Energy Build. 2019, 190, 49–60. [Google Scholar] [CrossRef]
  44. Flath, C.; Nicolay, D.; Conte, T.; van Dinther, C.; Filipova-Neumann, L. Cluster analysis of smart metering data. Bus. Inf. Syst. Eng. 2012, 4, 31–39. [Google Scholar] [CrossRef]
  45. Ramos, S.; Vale, Z. Data Mining techniques to support the classification of MV electricity customers. In Proceedings of the 2008 IEEE Power and Energy Society General Meeting-Conversion and Delivery of Electrical Energy in the 21st Century, Pittsburgh, PA, USA, 20–24 July 2008; pp. 1–7. [Google Scholar]
  46. Hong, Y.; Yoon, S. Holistic Operational Signatures for an energy-efficient district heating substation in buildings. Energy 2022, 250, 123798. [Google Scholar] [CrossRef]
  47. Lu, Y.; Tian, Z.; Peng, P.; Niu, J.; Dai, J. Identification and evaluation of operation regulation strategies in district heating substations based on an unsupervised data mining method. Energy Build. 2019, 202, 109324. [Google Scholar] [CrossRef]
  48. Xue, P.; Zhou, Z.; Fang, X.; Chen, X.; Liu, L.; Liu, Y.; Liu, J. Fault detection and operation optimization in district heating substations based on data mining techniques. Appl. Energy 2017, 205, 926–940. [Google Scholar] [CrossRef]
  49. Abghari, S.; Boeva, V.; Brage, J.; Johansson, C. District heating substation behaviour modelling for annotating the performance. In Proceedings of the Joint European Conference on Machine Learning and Knowledge Discovery in Databases, Würzburg, Germany, 16–20 September 2019; Springer: Berlin/Heidelberg, Germany, 2019; pp. 3–11. [Google Scholar]
  50. Abghari, S.; Boeva, V.; Brage, J.; Johansson, C.; Grahn, H.; Lavesson, N. Higher order mining for monitoring district heating substations. In Proceedings of the 2019 IEEE International Conference on Data Science and Advanced Analytics (DSAA), Washington, DC, USA, 5–8 October 2019; pp. 382–391. [Google Scholar]
  51. Abghari, S.; Boeva, V.; Brage, J.; Grahn, H. A higher order mining approach for the analysis of real-world datasets. Energies 2020, 13, 5781. [Google Scholar] [CrossRef]
  52. Roddick, J.F.; Spiliopoulou, M.; Lister, D.; Ceglar, A. Higher order mining. ACM SIGKDD Explor. Newsl. 2008, 10, 5–17. [Google Scholar] [CrossRef]
  53. Han, J.; Pei, J.; Mortazavi-Asl, B.; Pinto, H.; Chen, Q.; Dayal, U.; Hsu, M. Prefixspan: Mining sequential patterns efficiently by prefix-projected pattern growth. In Proceedings of the 17th International Conference on Data Engineering, Heidelberg, Germany, 2–6 April 2001; pp. 215–224. [Google Scholar]
  54. Frey, B.J.; Dueck, D. Clustering by passing messages between data points. Science 2007, 315, 972–976. [Google Scholar] [CrossRef] [PubMed] [Green Version]
  55. Boeva, V.; Tsiporkova, E.; Kostadinova, E. Analysis of multiple DNA microarray datasets. In Springer Handbook of Bio-/Neuroinformatics; Springer: Berlin/Heidelberg, Germany, 2014; pp. 223–234. [Google Scholar]
  56. Levenshtein, V.I. Binary codes capable of correcting deletions, insertions, and reversals. Sov. Phys. Dokl. 1966, 10, 707–710. [Google Scholar]
  57. Kruskal, J.B. On the shortest spanning subtree of a graph and the traveling salesman problem. Proc. Am. Math. Soc. 1956, 7, 48–50. [Google Scholar] [CrossRef]
  58. Kiluk, S. Algorithmic acquisition of diagnostic patterns in district heating billing system. Appl. Energy 2012, 91, 146–155. [Google Scholar] [CrossRef]
  59. Kiluk, S. Diagnostic information system dynamics in the evaluation of machine learning algorithms for the supervision of energy efficiency of district heating-supplied buildings. Energy Convers. Manag. 2017, 150, 904–913. [Google Scholar] [CrossRef]
  60. Wang, Y.; Yang, C.; Shen, W. A deep learning approach for heating and cooling equipment monitoring. In Proceedings of the 2019 IEEE 15th International Conference on Automation Science and Engineering (CASE), Vancouver, BC, Canada, 22–26 August 2019; pp. 228–234. [Google Scholar]
  61. Calikus, E.; Nowaczyk, S.; Sant’Anna, A.; Byttner, S. Ranking abnormal substations by power signature dispersion. Energy Procedia 2018, 149, 345–353. [Google Scholar] [CrossRef]
  62. Farouq, S.; Byttner, S.; Bouguelia, M.R.; Gadd, H. A conformal anomaly detection based industrial fleet monitoring framework: A case study in district heating. Expert Syst. Appl. 2022, 201, 116864. [Google Scholar] [CrossRef]
  63. Farouq, S.; Byttner, S.; Bouguelia, M.R.; Gadd, H. Mondrian conformal anomaly detection for fault sequence identification in heterogeneous fleets. Neurocomputing 2021, 462, 591–606. [Google Scholar] [CrossRef]
  64. Farouq, S.; Byttner, S.; Bouguelia, M.R.; Nord, N.; Gadd, H. Large-scale monitoring of operationally diverse district heating substations: A reference-group based approach. Eng. Appl. Artif. Intell. 2020, 90, 103492. [Google Scholar] [CrossRef]
  65. Yeh, C.C.M.; Zhu, Y.; Ulanova, L.; Begum, N.; Ding, Y.; Dau, H.A.; Zimmerman, Z.; Silva, D.F.; Mueen, A.; Keogh, E. Time series joins, motifs, discords and shapelets: A unifying view that exploits the matrix profile. Data Min. Knowl. Discov. 2018, 32, 83–123. [Google Scholar] [CrossRef]
  66. Wang, P.; Poovendran, P.; Manokaran, K.B. Fault detection and control in integrated energy system using machine learning. Sustain. Energy Technol. Assess. 2021, 47, 101366. [Google Scholar] [CrossRef]
  67. Zhang, F.; Fleyeh, H. Anomaly detection of heat energy usage in district heating substations using LSTM based variational autoencoder combined with physical model. In Proceedings of the 2020 15th IEEE Conference on Industrial Electronics and Applications (ICIEA), Kristiansand, Norway, 9–13 November 2020; pp. 153–158. [Google Scholar]
  68. Pałasz, P.; Przysowa, R. Using Different ML Algorithms and Hyperparameter Optimization to Predict Heat Meters’ Failures. Appl. Sci. 2019, 9, 3719. [Google Scholar] [CrossRef] [Green Version]
  69. Lee, T.; Yoon, S.; Won, K. Delta-T-based operational signatures for operation pattern and fault diagnosis of building energy systems. Energy Build. 2022, 257, 111769. [Google Scholar] [CrossRef]
  70. Theusch, F.; Klein, P.; Bergmann, R.; Wilke, W.; Bock, W.; Weber, A. Fault detection and condition monitoring in district heating using smart meter data. PHM Soc. Eur. Conf. 2021, 6, 11. [Google Scholar]
  71. Al Koussa, J.; Månsson, S. Fault detection in district heating substations: A cluster-based and an instance-based approach. In Proceedings of the CLIMA 2022 Conference, Rotterdam, The Netherlands, 22–25 May 2022. [Google Scholar]
  72. Sandin, F.; Gustafsson, J.; Delsing, J.; Eklund, R. Basic methods for automated fault detection and energy data validation in existing district heating systems. In International Symposium on District Heating and Cooling: 03/09/2012-04/09/2012; District Energy Development Center: Copenhagen, Denmark, 2012. [Google Scholar]
  73. Johansson, C.; Wernstedt, F. N-dimensional fault detection and operational analysis with performance metrics. In Proceedings of the 13th International Symposium on District Heating and Cooling, Copenhagen, Denmark, 3–4 September 2012. [Google Scholar]
  74. Shen, Y.; Chen, J.; Fu, Q.; Wu, H.; Wang, Y.; Lu, Y. Detection of district heating pipe network leakage fault using UCB arm selection method. Buildings 2021, 11, 275. [Google Scholar] [CrossRef]
  75. Guan, H.; Xiao, T.; Luo, W.; Gu, J.; He, R.; Xu, P. Automatic fault diagnosis algorithm for hot water pipes based on infrared thermal images. Build. Environ. 2022, 218, 109111. [Google Scholar] [CrossRef]
  76. Pierl, D.; Vahldiek, K.; Geißler, J.; Rüger, B.; Michels, K.; Klawonn, F.; Nürnberger, A. Online model-and data-based leakage localization in district heating networks-Impact of random measurement errors. In Proceedings of the 2020 IEEE International Conference on Systems, Man, and Cybernetics (SMC), Toronto, ON, Canada, 11–14 October 2020; pp. 2331–2338. [Google Scholar]
  77. Xue, P.; Jiang, Y.; Zhou, Z.; Chen, X.; Fang, X.; Liu, J. Machine learning-based leakage fault detection for district heating networks. Energy Build. 2020, 223, 110161. [Google Scholar] [CrossRef]
  78. Xu, Y.; Wang, X.; Zhong, Y.; Zhang, L. Thermal anomaly detection based on saliency computation for district heating system. In Proceedings of the 2016 IEEE International Geoscience and Remote Sensing Symposium (IGARSS), Beijing, China, 10–15 July 2016; pp. 681–684. [Google Scholar]
  79. Itti, L.; Koch, C.; Niebur, E. A model of saliency-based visual attention for rapid scene analysis. IEEE Trans. Pattern Anal. Mach. Intell. 1998, 20, 1254–1259. [Google Scholar] [CrossRef] [Green Version]
  80. Hossain, K.; Villebro, F.; Forchhammer, S. UAV image analysis for leakage detection in district heating systems using machine learning. Pattern Recognit. Lett. 2020, 140, 158–164. [Google Scholar] [CrossRef]
  81. Berg, A.; Ahlberg, J. Classification of leakage detections acquired by airborne thermography of district heating networks. In Proceedings of the 2014 8th IAPR Workshop on Pattern Reconition in Remote Sensing, Stockholm, Sweden, 24 August 2014; pp. 1–4. [Google Scholar]
  82. Friman, O.; Follo, P.; Ahlberg, J.; Sjökvist, S. Methods for large-scale monitoring of district heating systems using airborne thermography. IEEE Trans. Geosci. Remote. Sens. 2013, 52, 5175–5182. [Google Scholar] [CrossRef] [Green Version]
  83. Berg, A.; Ahlberg, J.; Felsberg, M. Enhanced analysis of thermographic images for monitoring of district heat pipe networks. Pattern Recognit. Lett. 2016, 83, 215–223. [Google Scholar] [CrossRef] [Green Version]
  84. Zimmerman, N.; Dahlquist, E.; Kyprianidis, K. Towards on-line fault detection and diagnostics in district heating systems. Energy Procedia 2017, 105, 1960–1966. [Google Scholar] [CrossRef]
  85. Aláiz-Moretón, H.; Castejón-Limas, M.; Casteleiro-Roca, J.L.; Jove, E.; Fernández Robles, L.; Calvo-Rolle, J.L. A fault detection system for a geothermal heat exchanger sensor based on intelligent techniques. Sensors 2019, 19, 2740. [Google Scholar] [CrossRef] [Green Version]
  86. Månsson, S.; Kallioniemi, P.O.J.; Sernhed, K.; Thern, M. A machine learning approach to fault detection in district heating substations. Energy Procedia 2018, 149, 226–235. [Google Scholar] [CrossRef]
  87. Guelpa, E.; Verda, V. Automatic fouling detection in district heating substations: Methodology and tests. Appl. Energy 2020, 258, 114059. [Google Scholar] [CrossRef]
  88. Cadei, L.; Corneo, A.; Milana, D.; Loffreno, D.; Lancia, L.; Montini, M.; Rossi, G.; Purlalli, E.; Fier, P.; Carducci, F. Advanced Analytics for Predictive Maintenance with Limited Data: Exploring the Fouling Problem in Heat Exchanging Equipment. In Proceedings of the Abu Dhabi International Petroleum Exhibition & Conference, Abu Dhabi, United Arab Emirates, 31 October–3 November 2019. [Google Scholar]
  89. Kim, R.; Hong, Y.; Choi, Y.; Yoon, S. System-level fouling detection of district heating substations using virtual-sensor-assisted building automation system. Energy 2021, 227, 120515. [Google Scholar] [CrossRef]
  90. Park, S.; Moon, J.; Hwang, E. Explainable anomaly detection for district heating based on shapley additive explanations. In Proceedings of the 2020 International Conference on Data Mining Workshops (ICDMW), Virtual, 17–20 November 2020; pp. 762–765. [Google Scholar]
  91. Langroudi, P.P.; Weidlich, I.; Hay, S. Backward simulation of temperature changes of District Heating networks for enabling loading history in predictive maintenance. Energy Rep. 2021, 7, 119–127. [Google Scholar] [CrossRef]
  92. Bahlawan, H.; Ferraro, N.; Gambarotta, A.; Losi, E.; Manservigi, L.; Morini, M.; Saletti, C.; Spina, P.R.; Venturini, M. Detection and identification of faults in a District Heating Network. Energy Convers. Manag. 2022, 266, 115837. [Google Scholar] [CrossRef]
  93. Manservigi, L.; Bahlawan, H.; Losi, E.; Morini, M.; Spina, P.R.; Venturini, M. A diagnostic approach for fault detection and identification in district heating networks. Energy 2022, 251, 123988. [Google Scholar] [CrossRef]
  94. Bode, G.; Thul, S.; Baranski, M.; Müller, D. Real-world application of machine-learning-based fault detection trained with experimental data. Energy 2020, 198, 117323. [Google Scholar] [CrossRef]
  95. Li, M.; Deng, W.; Xiahou, K.; Ji, T.; Wu, Q. A data-driven method for fault detection and isolation of the integrated energy-based district heating system. IEEE Access 2020, 8, 23787–23801. [Google Scholar] [CrossRef]
  96. Choi, Y.; Yoon, S. Autoencoder-driven fault detection and diagnosis in building automation systems: Residual-based and latent space-based approaches. Build. Environ. 2021, 203, 108066. [Google Scholar] [CrossRef]
  97. Gokhale, G.; Claessens, B.; Develder, C. Physics informed neural networks for control oriented thermal modeling of buildings. Appl. Energy 2022, 314, 118852. [Google Scholar] [CrossRef]
  98. Aggarwal, C.C.; Hinneburg, A.; Keim, D.A. On the surprising behavior of distance metrics in high dimensional space. In International Conference on Database Theory; Springer: Berlin/Heidelberg, Germany, 2001; pp. 420–434. [Google Scholar]
  99. Japkowicz, N.; Stephen, S. The class imbalance problem: A systematic study. Intell. Data Anal. 2002, 6, 429–449. [Google Scholar] [CrossRef]
  100. Bond-Taylor, S.; Leach, A.; Long, Y.; Willcocks, C.G. Deep generative modelling: A comparative review of VAEs, GANs, normalizing flows, energy-based and autoregressive models. arXiv 2021, arXiv:2103.04922. [Google Scholar] [CrossRef]
Figure 1. Overview of FDD studies and techniques in DH.
Electronics 12 01448 g001
Figure 2. Illustration of a district heating network.
Electronics 12 01448 g002
Figure 3. The process of automatic fault handling.
Electronics 12 01448 g003
Figure 4. Literature categories based on automatic fault handling.
Electronics 12 01448 g004
Figure 5. The steps of data mining and knowledge discovery.
Electronics 12 01448 g005
Figure 6. SWOT analysis from the perspective of intelligent FDD in DH.
Electronics 12 01448 g006
Table 1. Inclusion and exclusion criteria for this survey.
InclusionExclusion
Available in electronic formDuplicates
Peer-reviewed journal and conference papersNon-relevant title or abstract
Written in EnglishNon-indexed studies
Addresses FDD in DHResearch thesis
Published between 2010 and 2022
Table 2. Variables collected by a typical heat meter.
FeatureNotationUnit
Primary supply temperature T p s °C
Primary return temperature T p r °C
Volume flow V ˙ m 3 / h
Accumulated volumeVm 3
Accumulated energyQJ
Table 3. Summary of applications of clustering approaches.
ReferencesMethodologiesDistance MetricsValidation Metrics
Tureczek et al. [34]kMEuclidean distanceMIA, CDI, DBI and SI
Gianniou et al. [41]kMK-Spectral CentroidBIC, SI
Hong et al. [46]kMEuclidean distanceDBI
Flath et al. [44]kMEuclidean distanceDBI
Xue et al. [48]kM, PAMEuclidean distanceDBI
Ma et al. [42]PAMPearson Correlation
Coefficient-based dissimilarity
Dunn Index
Calikus et al. [32]kSDynamic Time WarpingSI
Kiluk [58]kNNChebyshev distance
Lu et al. [43]GMMProbability distributionBIC, Mean Absolute Percentage Error and PCC
Lu et al. [47]GMMProbability distributionBIC
Sun et al. [33]kM, GMM, KGMMEuclidean distance, Probability distributionMinimum Sum of Squared error
Abghari et al.  [49,50,51]Affinity, ConsensusLevenshtein distanceSI, Adjusted Rand score
Table 4. Summary of applications of outlier detection approaches.
ReferencesMethodologiesCategories
Wang et al. [60]LASSORegression
Wang et al. [60]SVRRegression
Månsson et al. [5], Theusch et al. [70], Calikus et al. [61],
Wang et al. [66], Sandin et al. [72], Johansson and Wernstedt [73]
LRRegression
Calikus et al. [61]RRRegression
Al Koussa and Månsson [71]TPOTGeometric
Wang et al. [66], Palasz and Przysowa [68]SVMGeometric
Theusch et al. [70], Farouq et al. [62,63,64]kNNGeometric
Lee et al. [69], Theusch et al. [70], Sandin et al. [72]kMGeometric
Farouq et al. [63]CCGeometric
Sandin et al. [72]Limit-checkingGeometric
Palasz and Przysowa [68]GBDTLogical
Brès et al. [36]BDTLogical
Brès et al. [36]CARTLogical
Farouq et al. [64]IFLogical
Wang et al. [60], Palasz and Przysowa [68]MLPDeep learning
Wang et al. [60], Zhang and Fleyeh [67]LSTMDeep learning
Zhang and Fleyeh [67]AEDeep learning
Zhang and Fleyeh [67]VAEDeep learning
Johansson and Wernstedt [73]VisualisationStatistical
Gadd and Werner [6]Manual analysisStatistical
Table 5. Summary of applications of leakage detection approaches.
ReferencesMethodologiesCategoriesDataDH Segment
Chen et al. [74]CB, RIDGEReinforcement learningLeakage simulationsPrimary
Pierl et al. [76]SVM, NB, RUSBT, ABTraditional learningLeakage simulationsPrimary
Xue et al. [77]XGBoostTraditional learningLeakage simulationsPrimary
Guan et al. [75]LR, OCR, CannyComputer visionInfrared thermal imagerySecondary
Xu et al. [78]SCComputer visionAirborne thermal imageryPrimary
Berg et al. [81]LDA, SVM, AB, RFComputer visionAirborne thermal imageryPrimary
Berg et al. [83]LDA, SVM, AB, RFComputer visionAirborne thermal imageryPrimary
Friman et al. [82]ABComputer visionAirborne thermal imageryPrimary
Hossain et al. [80]CNN, LOR, LDA, SVM, NB, kNN, DT, RF, ABComputer vision, Deep learningAirborne thermal imageryPrimary
Table 6. Summary of applications of fault diagnosis approaches.
ReferencesMethodologiesDiagnosis
Zimmerman et al. [84]BNSensor failure
Aláiz-Moretón et al. [85]RF, XGBoost, ERT, AB, kNN, ANNSensor failure
Månsson et al. [86]GBR, TPOTSensor failure
Guelpa et al. [87]AnalyticalFouling
Cadei et al. [88]ARIMA, RIDGE, one-class SVMFouling
Kim et al. [89]kM, MLPFouling
Park et al. [90]RFValves
Langroudi et al. [91]LR, DTR, RIDGE, kNN, PLS, SVM, RF, LASSO, XGBoost, ANNPipes
Bahlawan et al. [92]AnalyticalPipes
Manservigi et al. [93]AnalyticalPipes
Bode et al. [94]LR, kNN, CART, RF, NB, SVM, ANNMulti-label
Choi et al. [96]AE, MLPMulti-label
Li et al. [95]kNN, RF, ANN, CNNMulti-label
Disclaimer/Publisher’s Note: The statements, opinions and data contained in all publications are solely those of the individual author(s) and contributor(s) and not of MDPI and/or the editor(s). MDPI and/or the editor(s) disclaim responsibility for any injury to people or property resulting from any ideas, methods, instructions or products referred to in the content.

