1. Introduction
The COVID-19 pandemic crisis has led to several challenges in the economic environment and in the labor market, which required new approaches from companies, governments and individuals to manage economic activities. Digital innovation and transformation are widely debated current issues, especially after the COVID-19 effects. Following the pandemic crisis, the need for firms and SMEs to adopt digitalization measures in a short period arises because of home isolation measures taken by the authorities to avoid the wide spread of the virus among the population or constraints in the field of activity.
Information, Technology, and Communication (ITC) tools have become integral components of modern business and public administration, transforming the way organizations operate, interact with customers, citizens, and stakeholders, and make decisions. ITC has enabled companies to streamline their operations, increase efficiency, and improve customer service, including the interaction with fiscal authorities (Trașcă et al., 2019) [
1].
In public administration, ITC has enabled government agencies to improve their services, enhance transparency, and increase citizen engagement, but also the public trust, especially at a local level (Tejedo-Romero et al., 2022). For example, governments use various online portals and mobile applications to provide services to citizens, such as paying taxes, applying for permits, and accessing government information. Additionally, ITC has enabled governments to collect, store, and analyze data, which can be used to make informed decisions and improve public policy [
2].
Amankwah-Amoah, Khan, Wood, and Knight (2021) analyzed the company’s transformation process towards digitalization, focusing on employees and work. As such, the authors suggested that the pandemic crisis acted like a “catalyst”, representing “the great acceleration” that opened new opportunities for the companies to have access to the latest technologies available, such as 5G networks, cloud computing and artificial intelligence. Even if the pandemic started a new digital era, the opportunities given by the newfound technologies for the companies to create business models were stopped by forces that slowed down the progress, such as the digital divide or the inequalities effects on employees’ well-being [
3].
Moreover, the COVID-19 crisis represented the drive for most companies to adopt a few digitalization aspects at least, which turned out to be a good strategy for them to come out resilient from the current crisis. In addition, the pandemic has highlighted the need for companies to reinvent themselves; otherwise, they risk falling victim to market competition. Globally, companies expressed their concerns that digitalization could have negative effects on their capacity to monitor and assess their employees [
4].
The measures introduced by the governments to tackle the pandemic crisis, such as social distancing, working from home or closing schools, affected all people, including employees from the private and public sectors and companies as well. In this context, for both practitioners and the academic community, crisis management has become a key concern, and the concept of resilience was caught in organization and crisis management studies [
4]. Moreover, the measures adopted during the pandemic crisis implied a set of rapid changes in digitalizing the activity of organizations, under substantial political pressure, mainly in countries with a lower degree of digitalization before the pandemic crisis.
This article examined the economic resilience during the COVID-19 pandemic in the current EU Member States. In the first section, we realized a literature review regarding the concept of resilience and several definitions and methodologies used to measure resilience. We also analyzed the importance of digitalization and digital transformation as a driver for resilience. The second part of the article presents an empirical analysis of the EU Member States’ evolution during the COVID-19 pandemic and the role of different digitalization features in both private and public sectors for the gross value-added dynamics among EU states in 2019–2020.
In order to do so, our approach was firstly based on a Pearson statistical correlation, and secondly, we created a Hierarchical Cluster Analysis using an original, novel methodology. The role of the analysis was to assess if there is evidence that confirms the hypothesis that digitalization was an important tool for resilience during the pandemic and if this contributed to a better economic recovery or, at least, minimized its impact. At the same time, the aim was to identify several homogenous groups of states in the European Union landscape that share similar characteristics. The last part of the article covers conclusions and further discussions.
2. Resilience and Digital Transformation
The current business environment is characterized by the reality that the unexpected is omnipresent, and unexpected events may turn into disasters very fast. The organizations have to cope with numerous challenging conditions such as crises, shocks, disruptions of routines (such as teleworking, telecommuting, and remote working), scandals or discrete errors, and these challenging conditions have adverse consequences not only for existing productive capacities but also on future general growth prospects [
5,
6,
7,
8,
9,
10,
11,
12].
According to Egeland, Carlson and Sroufe (1993) [
13], the adjustment of organizations’ activities in the face of different challenging conditions involves strengthening the entity by creating a “hierarchical integration of behavioral systems whereby earlier structures are incorporated into later structures in increasingly complex forms”.
In the aftermath of the economic crisis and the COVID-19 crisis, resilience became a central element of internal evaluations of member states capabilities and vulnerabilities. Even if the term was largely debated in the literature, scholars still did not offer a unique definition of it. Usually, the concept may be understood as the ability to deal with a crisis or the process of managing a crisis [
14,
15,
16,
17,
18,
19,
20,
21]. There are researchers that consider resilience as an outcome of successful crisis handling, and resilient organizations are seen as entities that “can readily cope with a wide array of anomalies and are constantly striving to grow their capabilities to do so” [
14].
There are several field-specific definitions of resilience, beginning with disaster management, which defines it as “the ability of social units to mitigate hazards, contain the effects of disasters when they occur, and carry out recovery activities” [
15]. Cutter et al. (2008) emphasized the ability of social systems to respond and recover from disasters by absorbing negative, disruptive events [
22]. Thus, the authors broadened the concept of resilience to also include what happens after an event, defining it as an “adaptive process that facilitate the social system’s ability to reorganize, change, and learn in response to a threat.” This approach is consistent with Paton and Johnston (2001), who see resilience from two perspectives—first, as the capacity of social systems to bounce back and, second, as the ability to use their physical and economic resources effectively to recover from following exposure to hazards [
23].
Another literature source is represented by different national and international bodies that come with another interpretation and view on resilience, with an accent not on the idea of crisis management (which involves a reactive reaction to disaster) but on resilience as the process through which organizations and countries do not only react to the crisis but also prepare themselves, anticipate and measure the resilience with regularity.
MCEER (2008) defined resilience as the ability of social units, organizations and communities to mitigate hazards, contain disaster effects and carry out recovery activities in ways that minimize social disruption also at the same time mitigating the effects of future disasters [
24]. A similar definition emphasizes the ability to deal with adversity and gain strength to recover from hazards [
25]. In a more economic view, we could mention Christopherson et al. (2010), who see a resilient region as one that is not just economically successful, but also succeeds in maintaining economic growth in the long term, despite the international competition pressures, consumer demand shifts or other shocks [
16].
Thus, the logic behind this approach is that to be prepared, you must first understand what you are preparing for. In this context, resilience can be defined as an ability of a system, community or society to resist, absorb, accommodate and recover from the effects of a hazard in a timely and efficient manner, including through the preservation and restoration of its essential basic functions [
25,
26,
27,
28].
The ability to deal with external factors and reduce vulnerability is also a part of resilience. One of its primary responsibilities is to minimize losses and, as a result, to ensure the quickest possible economic recovery. In the context of a system (as it is often considered the economic system), resilience can be defined as the ability to maintain a system’s functionality when it is perturbed or the ability to maintain the elements required to renew or reorganize a system, if a disturbance alters its structure or function [
16].
OECD has made significant efforts in recent years to strengthen strategic foresight capabilities in its member countries. Strategic foresight efforts are defined as a structured and systematic approach to the future to anticipate and better prepare for change [
29,
30]. In this context, Gherghina et al. (2021) consider that foresight can support government decisions in three directions: to better anticipate future changes, to reveal options for experimentation with innovative models and to stress-test existing or proposed policies [
25].
Giannakis and Bruggeman (2020) investigated regional economic resilience differences in the EU, as well as 12 resilience drivers [
31]. The resilience approach was based on regional employment changes in the EU between 2008 (the start of the financial crisis) and 2015 (the end-year of economic recovery). Several economic determinants of resilience were investigated, including pre-crisis sectoral structure, population structure and migration, regional economic development level, accessibility and resilience of neighboring regions and Eurozone membership status. A new dimension of resilience was introduced: accessibility as a multimodal indicator that includes road, rail, and air accessibility. The authors also referred to the spillover effects caused by the proximity of other resilient regions, referring to “spatial spillovers between resilient regions”.
Gherghina et al. (2021) emphasized that regions with a high level of resilience are characterized by a strong regional system of innovation, especially small innovative firms that are more embedded in the local/regional economy and hire a large proportion of the labor force [
25]. Another feature could be the infrastructure (e.g., transport or broadband Internet, etc.) that reduces the transaction costs of economic agents, qualified labor and a diversified economic base which reduces specialization and spread risks within the entire economy [
32]. Additionally, in order to measure resilience (in terms of resistance to and pace recovery from a given shock), Martin and Sunley (2015) developed a methodology with five large groups of determinants of resilience: industrial and business structure (diversification), labor market conditions, agency and decision making, financial arrangements and governance arrangements [
33].
There are studies that see infrastructure as an important dimension of resilience, including communications technology and technology networks that could offer opportunities for workers (assuring workers mobility, wage and hours flexibility or alternative job alternative) and business flexibility during economic downturns [
28]. The same approach was also emphasized by Martin and Sunley (2015) in their study about economic resilience in regions that recover from recessionary shocks [
33].
In the new context, resilience in times of crisis implies the smart use of technology to increase the autonomy of organizations, ultimately leading to higher performance. Activities such as teleworking, remote working or e-commerce are internet-based and bandwidth-intensive activities (Scutariu et al., 2022) [
34]. On the one hand, these activities have fueled demand for high-quality connectivity, but on the other hand, there are digital divides between companies and countries that limit the impact of technology and digital tools [
34,
35].
Regarding the consequences of these challenging conditions on the activity of companies, Abidi, Herradi and Sakha (2022) argued that, in the case of companies from the Middle East and Central Asia region, the digitally enabled firms were able to mitigate economic losses better than digitally-constrained firms [
4]. According to these researchers, policymakers need to close the digital gap and accelerate firms’ digital transformation because these actions will be essential for economies to recover after the pandemic crisis and for building the foundation for future resilience. Even if progress has been made toward the digitalization of companies, fixed-broadband penetration remains low, and there are significant heterogeneities of digital adoption across companies between sectors and countries [
35,
36,
37,
38].
To achieve specific business outcomes, organizations must thoughtfully use technology. The situation differs between SMEs and big companies because the first ones are vulnerable to challenging conditions due to precarious conditions to absorb losses. Based on 96 SMEs surveyed across six developing countries (Bahrain, Egypt, Pakistan, Saudi Arabia, Tunisia and the United Arab Emirates), Khalil, Abdelli and Mogaji (2022) showed that digital technology helped them to survive the pandemic crisis [
9]. Fitriasari (2020) highlighted that there are three important elements of business resilience: product excellence, people behavior and process reliability [
5]. Digital transformation supports business resilience and, for achieving business goals and developing more competitive products and services, the right digitalization strategy is necessary. For a company, to carry out its digital transformation and create digital resilience is important to use appropriate technology [
11].
According to Simple Business (2021), SMEs from the UK were confronted with serious financial implications because of the nationwide lockdowns and operational restrictions [
39]. One thousand two hundreds six small companies were surveyed, and the main conclusions were the following: the total cost of the pandemic crisis for small businesses was higher than anticipated, 81% did not have enough support from the government, and 25% estimated that they would recover by spring or summer 2022. In a separate study elaborated by the Simple Business (2021), 765 small business owners were surveyed to see the impact of the pandemic on their mental health, and the results highlighted that 82% felt a negative impact on their mental health [
39].
It is obvious that SMEs are the most threatened group by those challenging conditions because they do not have the financial or human resources to survive. In the medium term, after the pandemic crisis, all the economies face the risk of economic depression, high levels of bankruptcy, unemployment and inflation.
For SMEs, to quickly adapt their activities during a crisis is necessary for them to use digital technologies and digital service models. For example, online platforms and digital services enable SMEs to tap into a large pool of consumers at a relatively low cost and to make marketing and advertisement.
All those disruptions of routines such as teleworking, telecommuting or remote working are examples of how digital technologies can enable business continuity. The e-signature support tools, remote access tools and video conferencing softwares were digital solutions that enabled remote and paper-less business operations.
The process of digitalization has multifaceted challenges. First of all, there is a size-related gap in firms’ access to key digital infrastructure, such as fast internet connection. More than 90% of SMEs across the OECD are well-connected to the Internet. However, 81% of large companies have fast internet connections, while only 45% of small-sized enterprises have fast internet connections, and fast-speed internet is a prerequisite for smoothly running digital services. In pursuing digitalization, there are numerous barriers for enterprises, such as access to financing, lack of skills, organizational inertia or incumbent systems. According to a Eurobarometer survey on SMEs (2020), about one in five SMEs cites a lack of skills among barriers to engaging in more digitalized and innovative practices. The biggest problems SMEs face are regulatory obstacles (55%), payment delays (35%), poor access to finance (21%) and lack of skills (17%) [
40].
3. Materials and Methods
The methodological framework had two parts. The first part assessed if countries with more intense use of digitalization and a high share of ITC in GDP registered a lower decline of the economy (including unemployment, employees, and incomes) in downward periods, as the economic flexibility of a country or a group of countries is supported by the use of ITC. This was available especially during the COVID-19 shock as more and more small and medium companies, employees and governments moved their focus to digitalization and teleworking amid the mobility restrictions. The approach was based on Pearson correlation analysis applied to several indicators obtained from Eurostat and the European Commission for different aspects of macroeconomic and digitalization dimensions.
The second part was in relation to different regional models of economic and social homogenous characteristics that could be found among the European Union Member States. To identify several regional economic patterns within the EU we used a hierarchical cluster analysis model.
Hierarchical cluster analysis is a clustering algorithm used in data analysis and involves grouping similar objects, entities, or data points together to form clusters based on their similarity or dissimilarity (i.e., agglomerative or divisive). Our model is an agglomerative hierarchical cluster analysis and was based on several structural socio-economic and digitalization indicators. Thus, we collected and organized the data from several data sources, and based on the Euclidean distance and the average linkage method, we defined the clusters and the distance between clusters using SPSS 26 software program. The Euclidean distance between two observations or variables represents the square root of the sum of the squared differences between their values across all variables. See the formula below:
where
p,
q = two points in the Euclidean n-space;
qi,
pi = Euclidean vectors, starting from the initial point;
n = n-space.
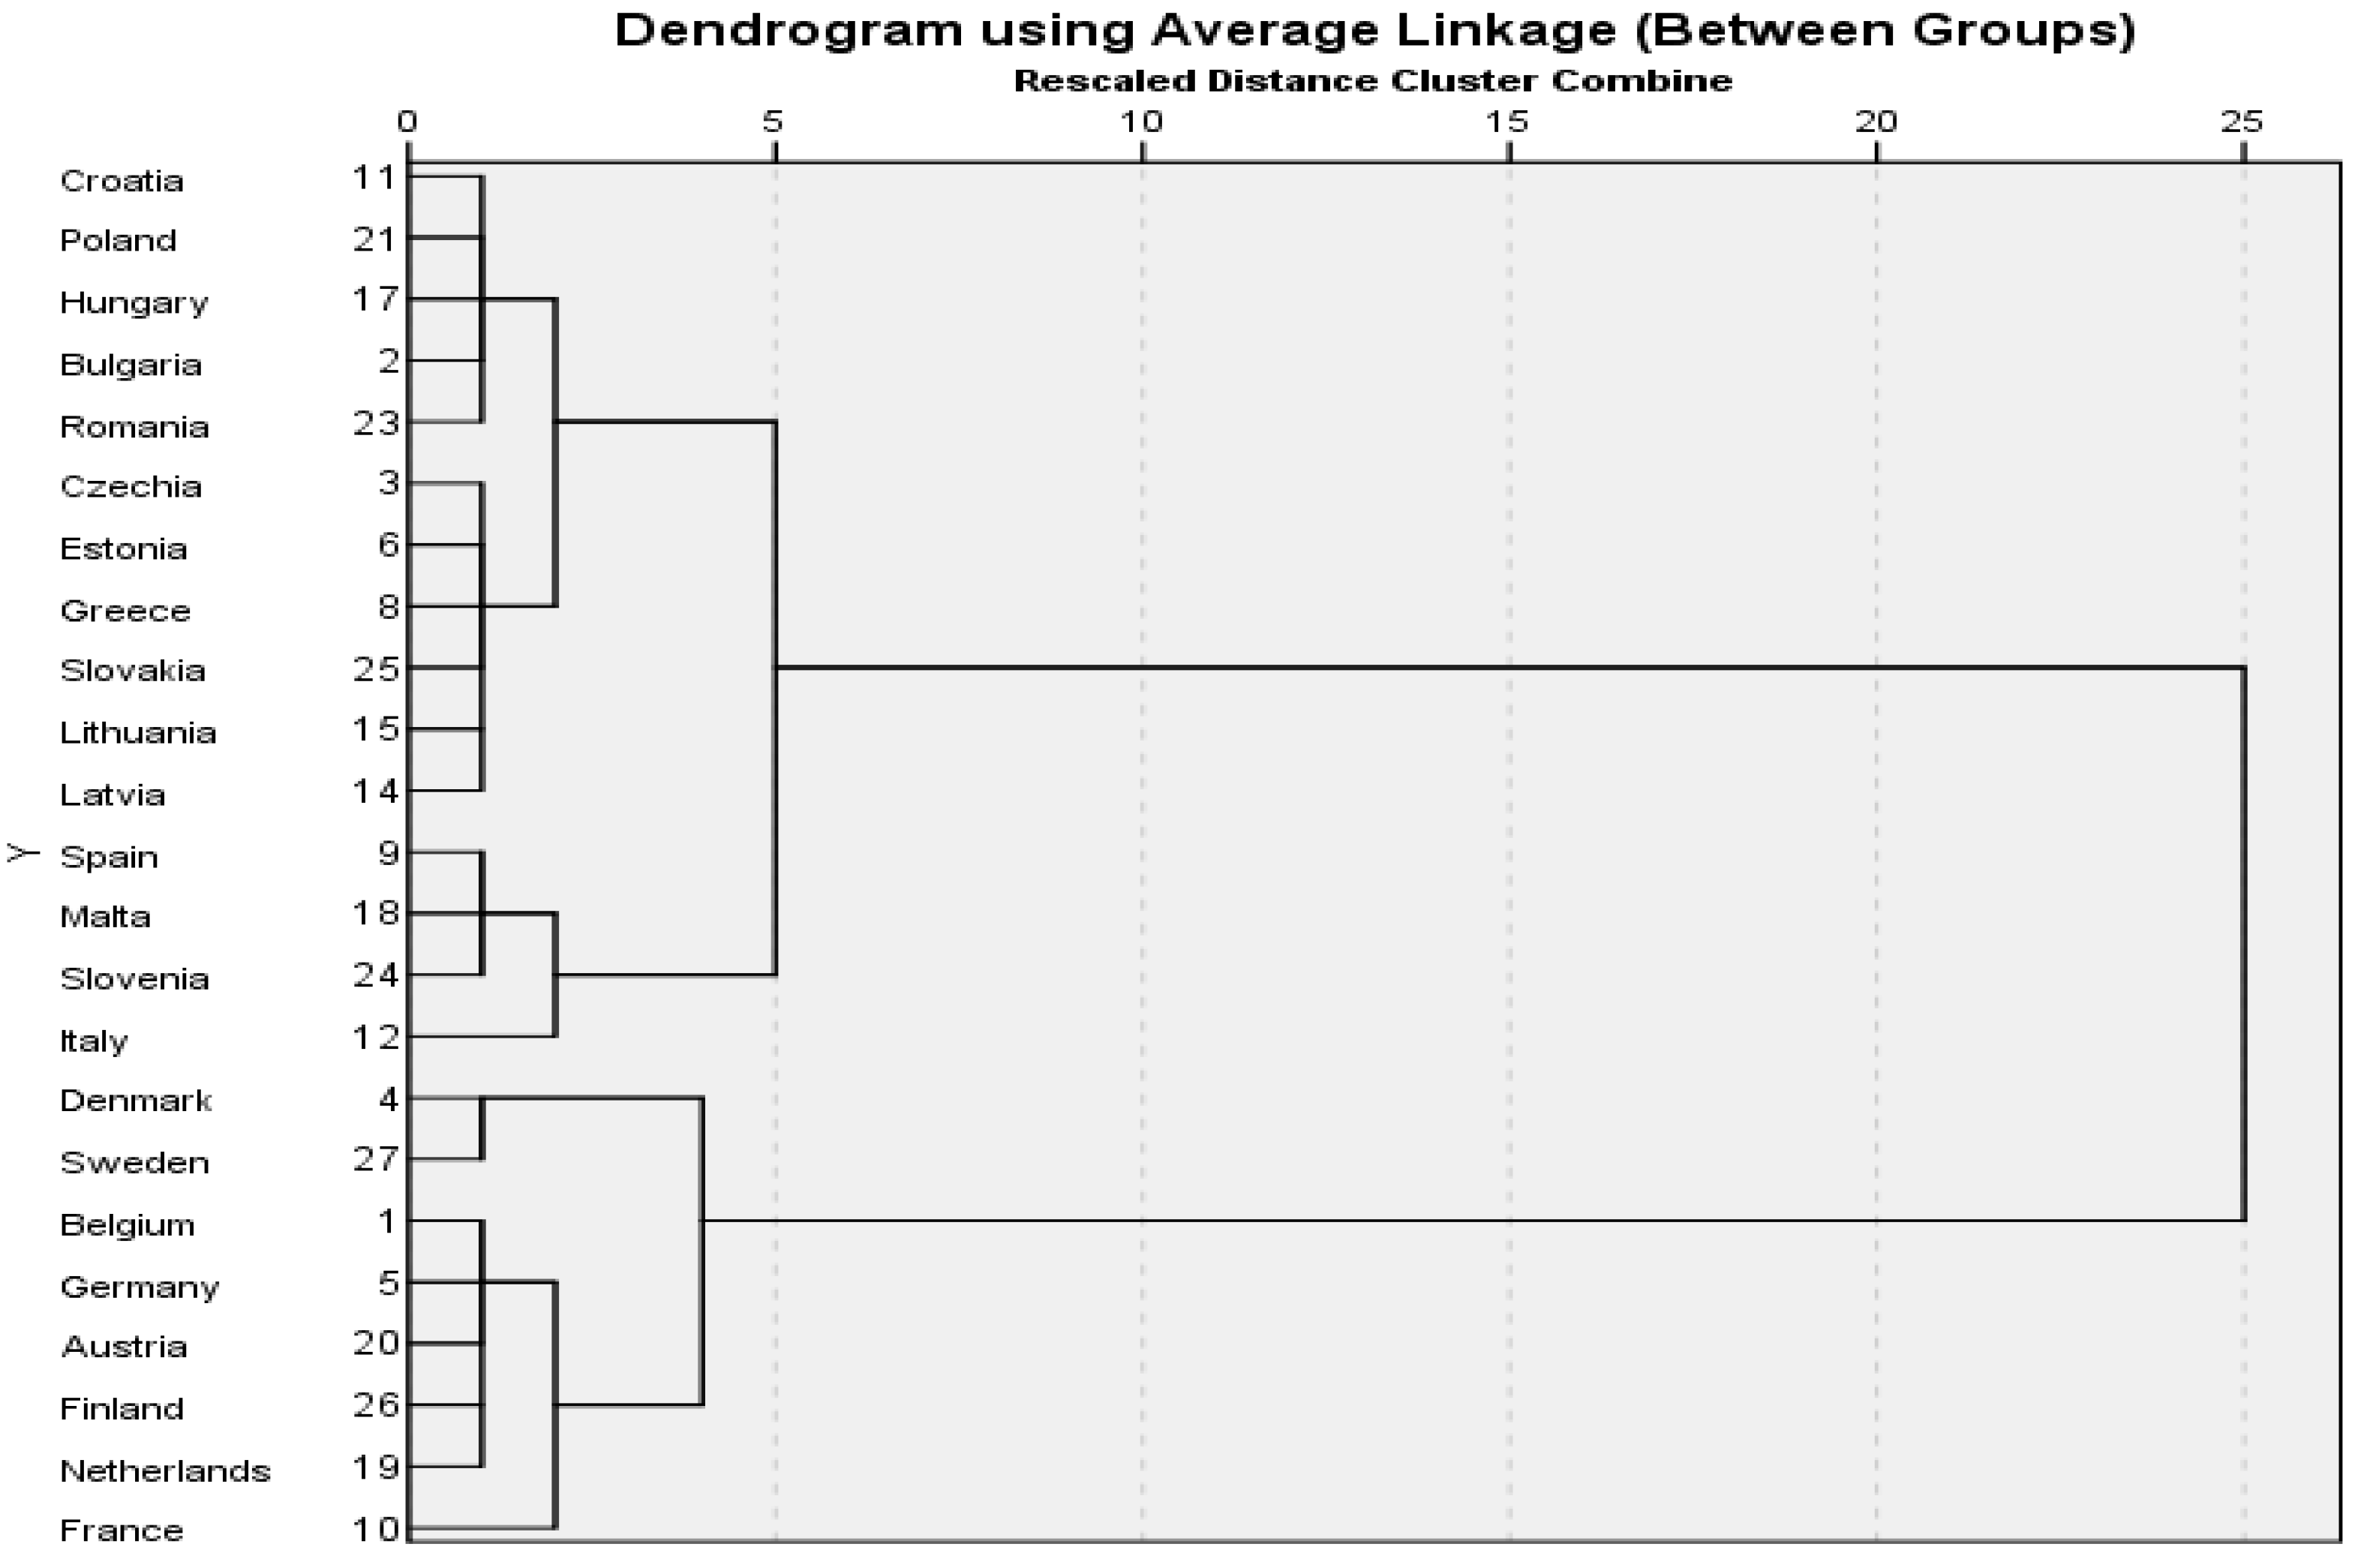
Based on the hierarchical cluster analysis, we obtained the dendrogram, which shows the hierarchical relationships between the clusters. The height of each branch on the dendrogram represents the level of similarity or dissimilarity between the clusters.
To calculate the distance between two clusters in a dendrogram, we used the average linkage method, which represents the average of the distances between each observation or variable in one cluster and each observation or variable in the other cluster.
Usually, the formula for the average linkage method for distance from cluster 1 to cluster 2 (d12) is:
where
X1,
X2,
….Xk = observations from cluster 1;
Y1,
Y2,
….Yl = observations from cluster 2;
a = number of clusters;
b = number of cases;
d(
x,
y) = distance between a subject with observation vector X and a subject with observation vector y.
The figures below show several aspects of ITC intensity in the EU member states (E-government public services for individuals and companies, Individuals who used the internet for interaction with public authorities), digital business intensity and digital skills of the general population (in relation to the gross value-added dynamics and working hours during 2020–2019. All the data were obtained from Eurostat. The objective was to assess if there was an impact of ITC on national output and the labor market—as the higher intensity of ITC should increase the flexibility of economies during the pandemic shock. The correlations were also tested by the Pearson analysis in the next section (see also
Table 1 below).
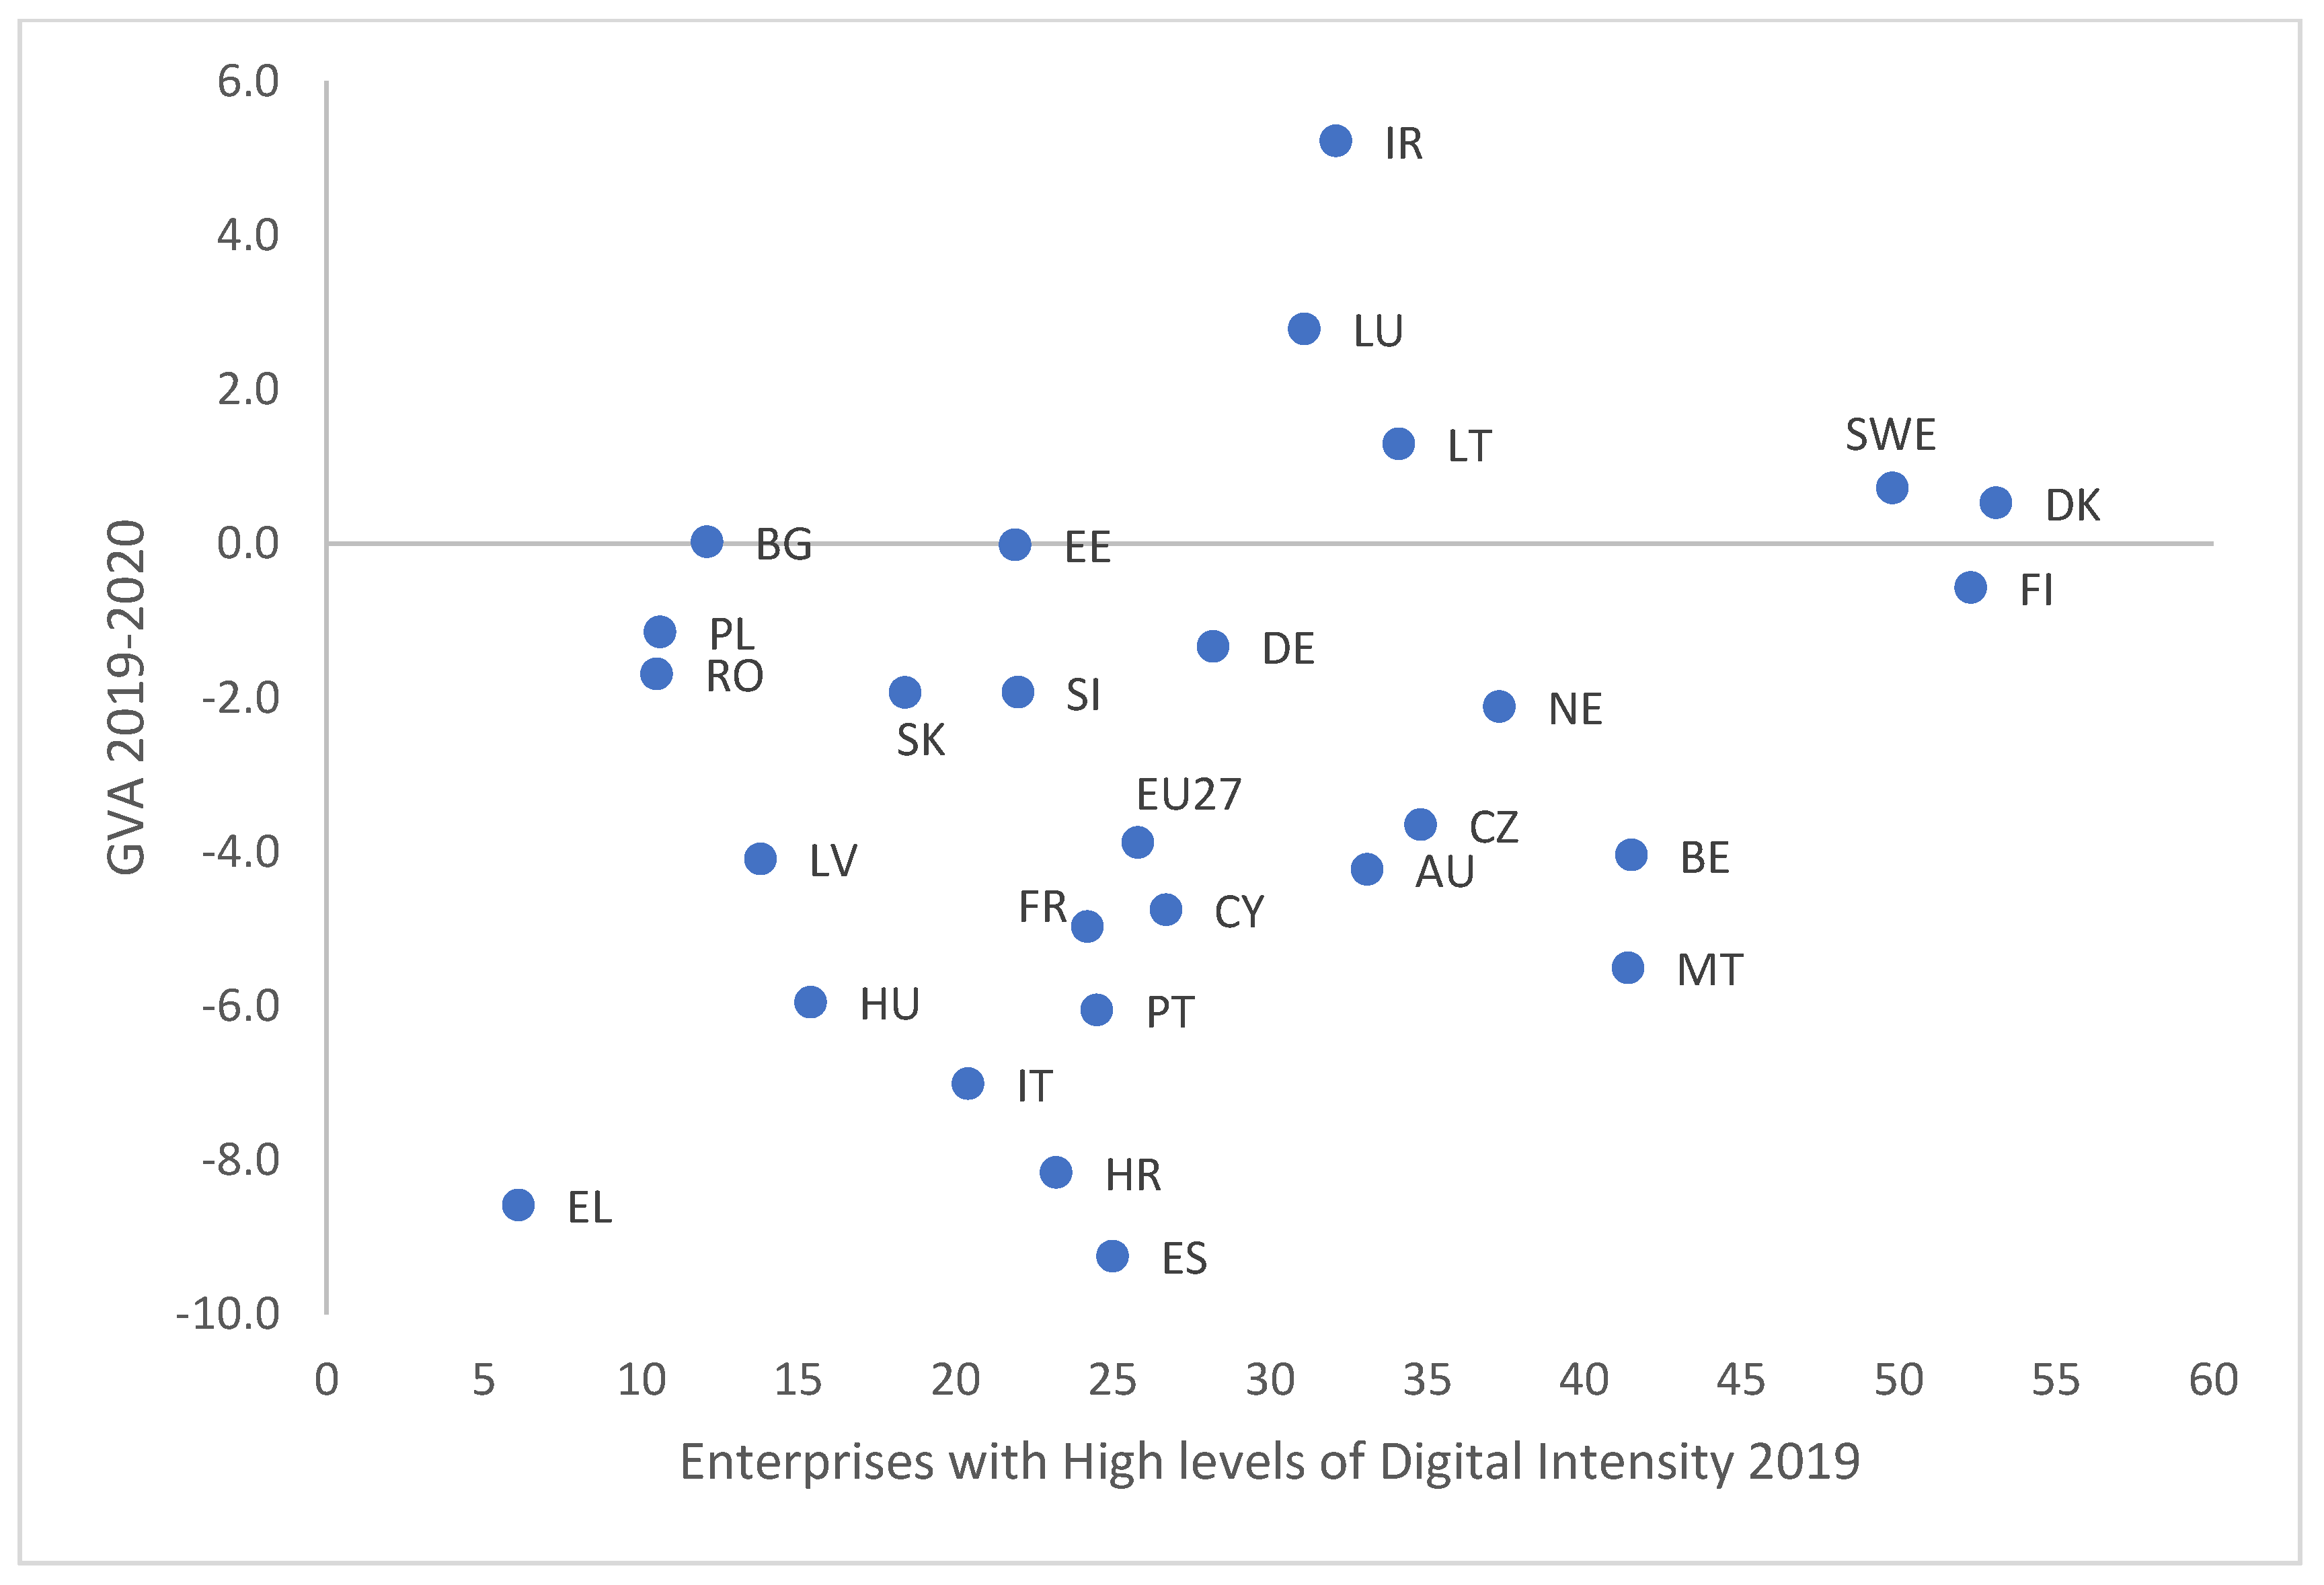
First, in
Figure 1, we showed that there is rather a positive relationship between the dynamics of gross value added (GVA) during the COVID-19 shock and the share of companies that used digital tools including e-sales, in their business activity. Thus, in two Nordic countries (Sweden and Denmark), but also in Lithuania, Luxembourg, and Ireland, the GVA actually increased during the COVID-19 shock in 2020 compared with 2019, and e-commerce and other digital technologies contributed to the business activity: high broadband speed, mobile devices, presence in social media, software products or sending e-Invoices, and tools that should increase de adaptability of companies during turbulent periods.
However, the performance of a country during the pandemic was also determined by a number of factors, both structural (for example, the share of tourism, restaurants and hotels in GDP, the severity of restrictions measures adopted by the authorities, the degree of health sector resilience, etc.) and the fiscal or monetary policies.
For example, in countries such as Portugal, Spain, Croatia or Italy—where the share of tourism (accommodation, food services, recreation, etc.) in GDP is important, despite a good level of companies’ digitalization, the impact of the pandemic shock was significant, as the physical presence of tourists (also consumption, transport) was impossible. At the same time, in Greece, the impact of the GVA decrease was extremely high, while the share of companies with high digital intensity was very low. Moreover, some government had the fiscal space to adopt bold stimulus measures for SMEs or income support measures for households, while in countries with high fiscal deficits, the support measures were more limited (for example, in Romania).
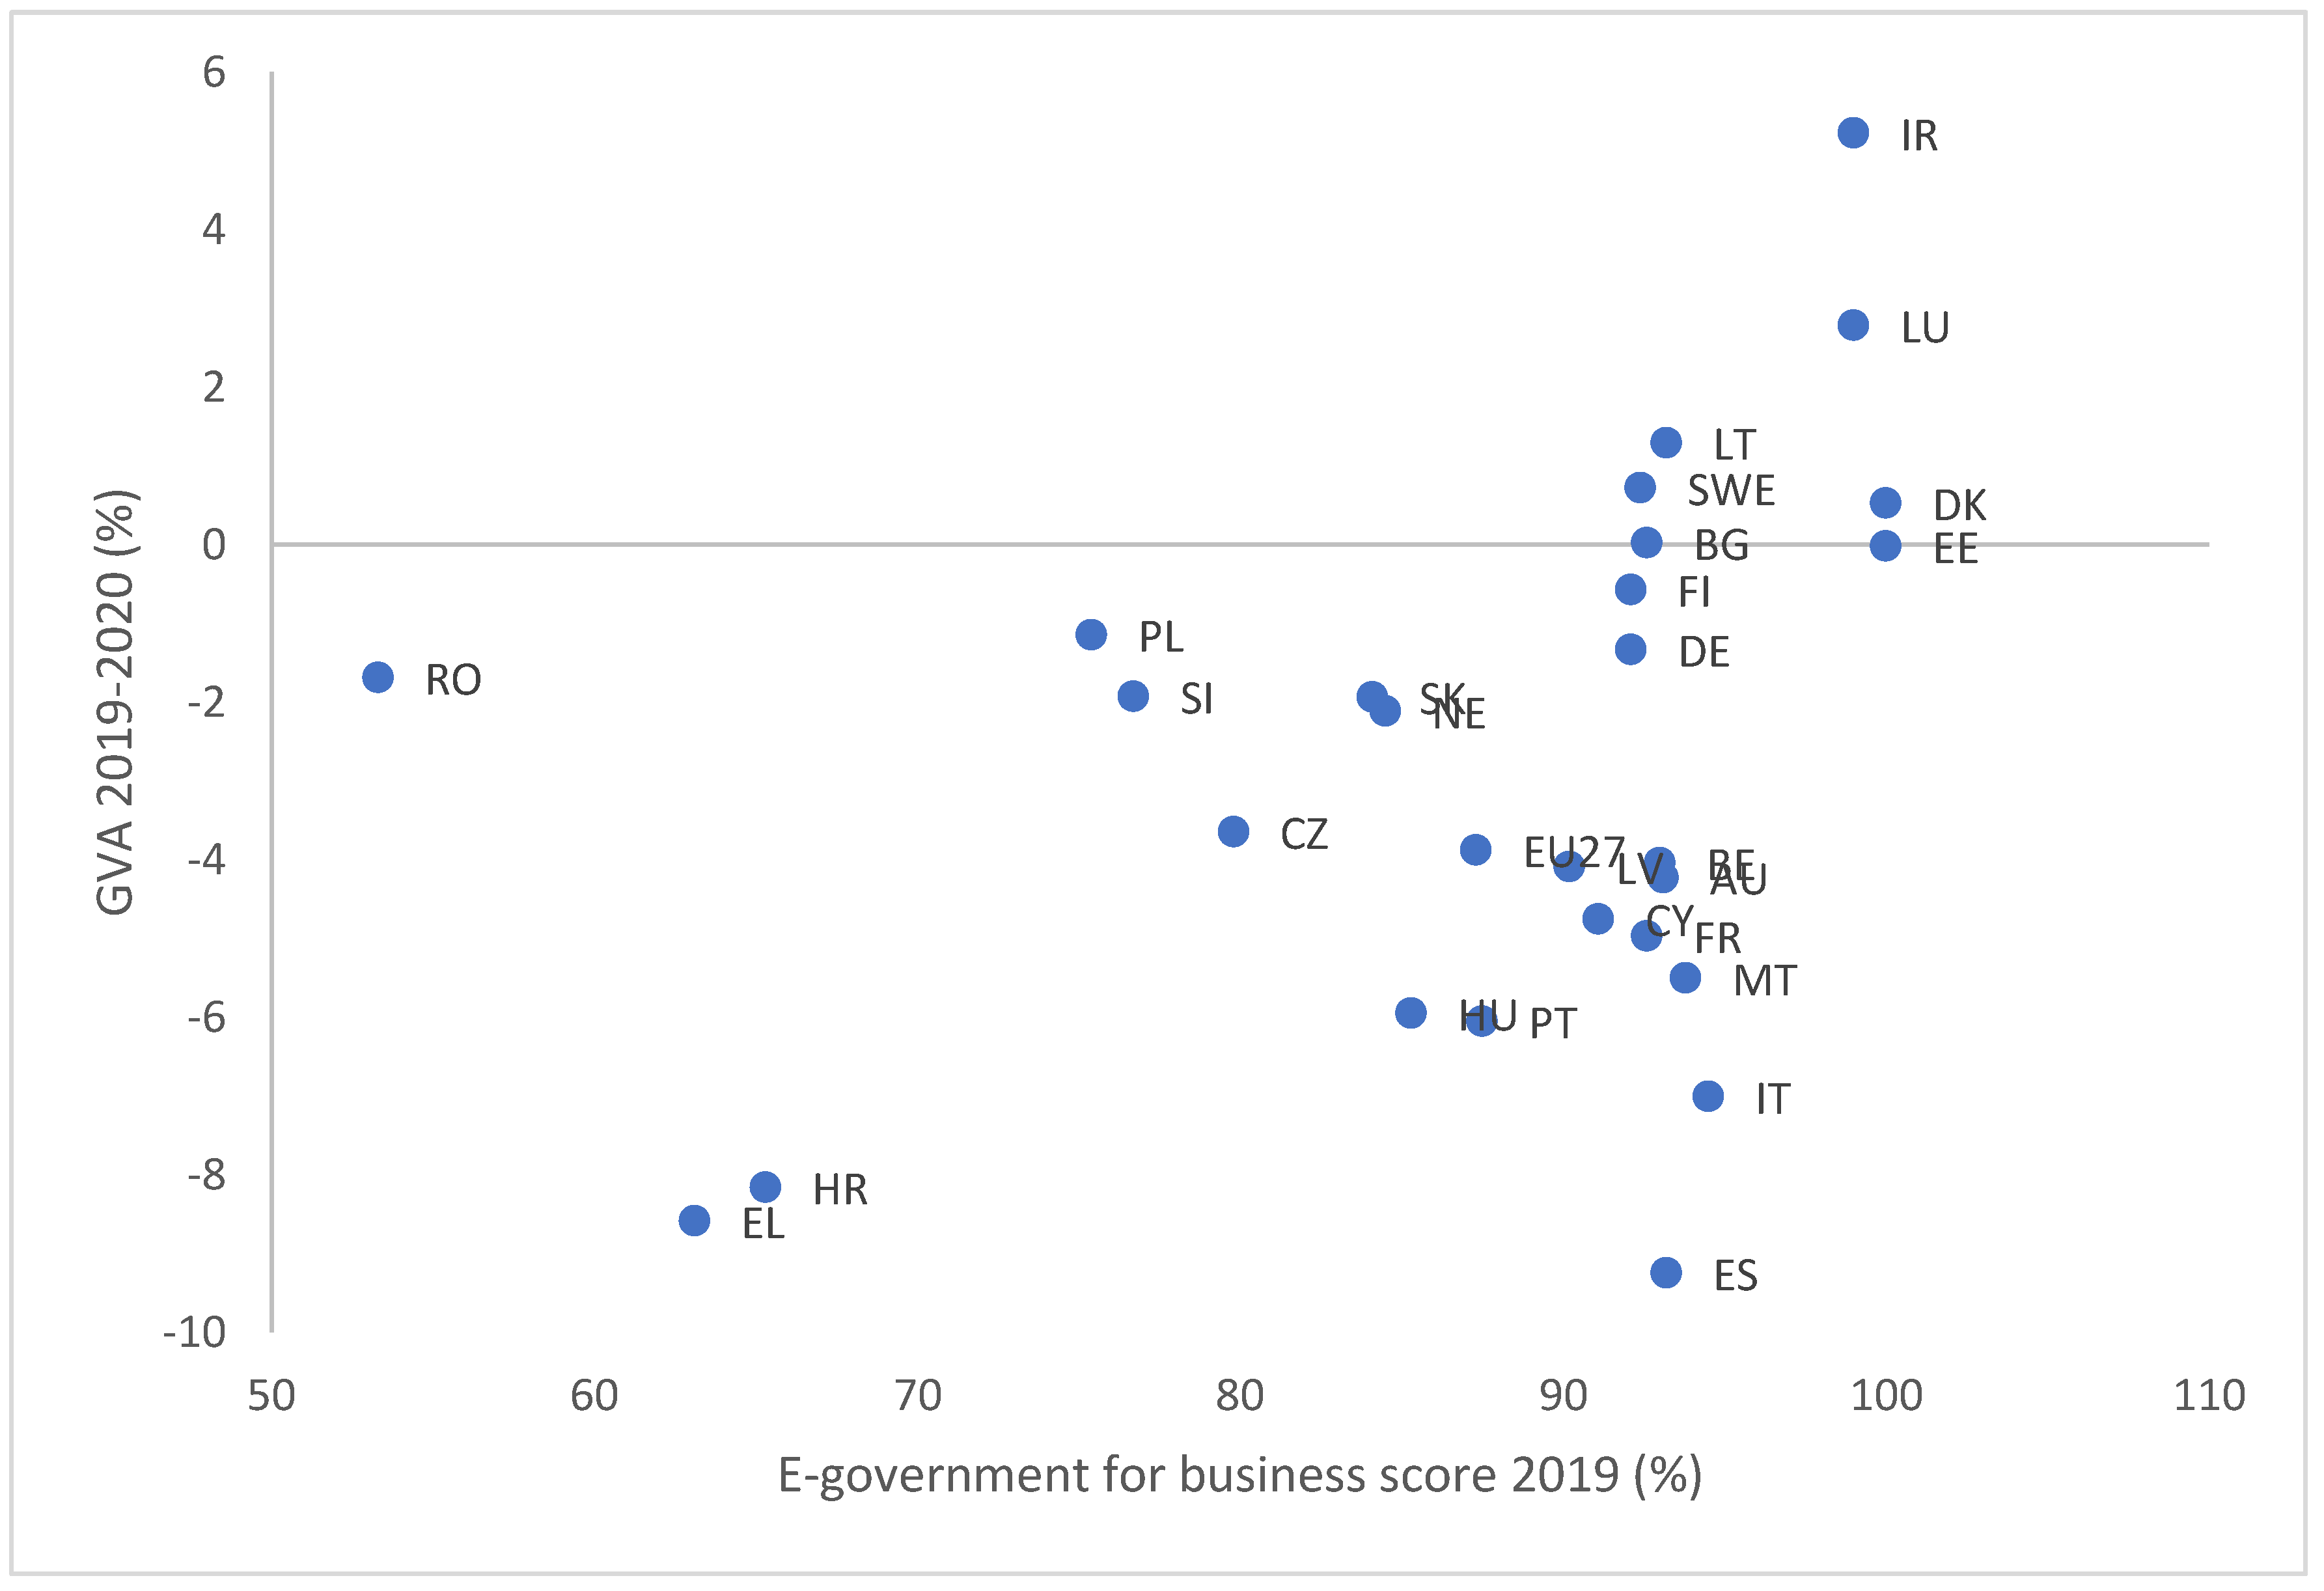
In a similar manner, the degree of e-government for individuals and, especially for companies, was vital. The COVID-19 pandemic forced many public administrations around the world to rapidly adapt to new working conditions and remote communication in order to continue providing essential services to their citizens, while those who had already adapted and intensely used digital tools before the COVID-19 shock supported better the economy in the new conditions.
As the mobility restrictions expanded, the role of e-government public services for companies (and citizens was essential for the economic and institutional activity.
Usually, many public services that previously required in-person visits or manual paperwork were digitized during the pandemic, such as online applications for benefits, permits and licenses. This allowed citizens and businesses to access services from their residences and reduced the need for physical interactions with government offices.
Available data show that the GVA loss was usually lower in countries where public administration services were digitalized or even the GVA increased (see the
Figure 2 below): Ireland, Luxembourg, Lithuania, Sweden, and Estonia.
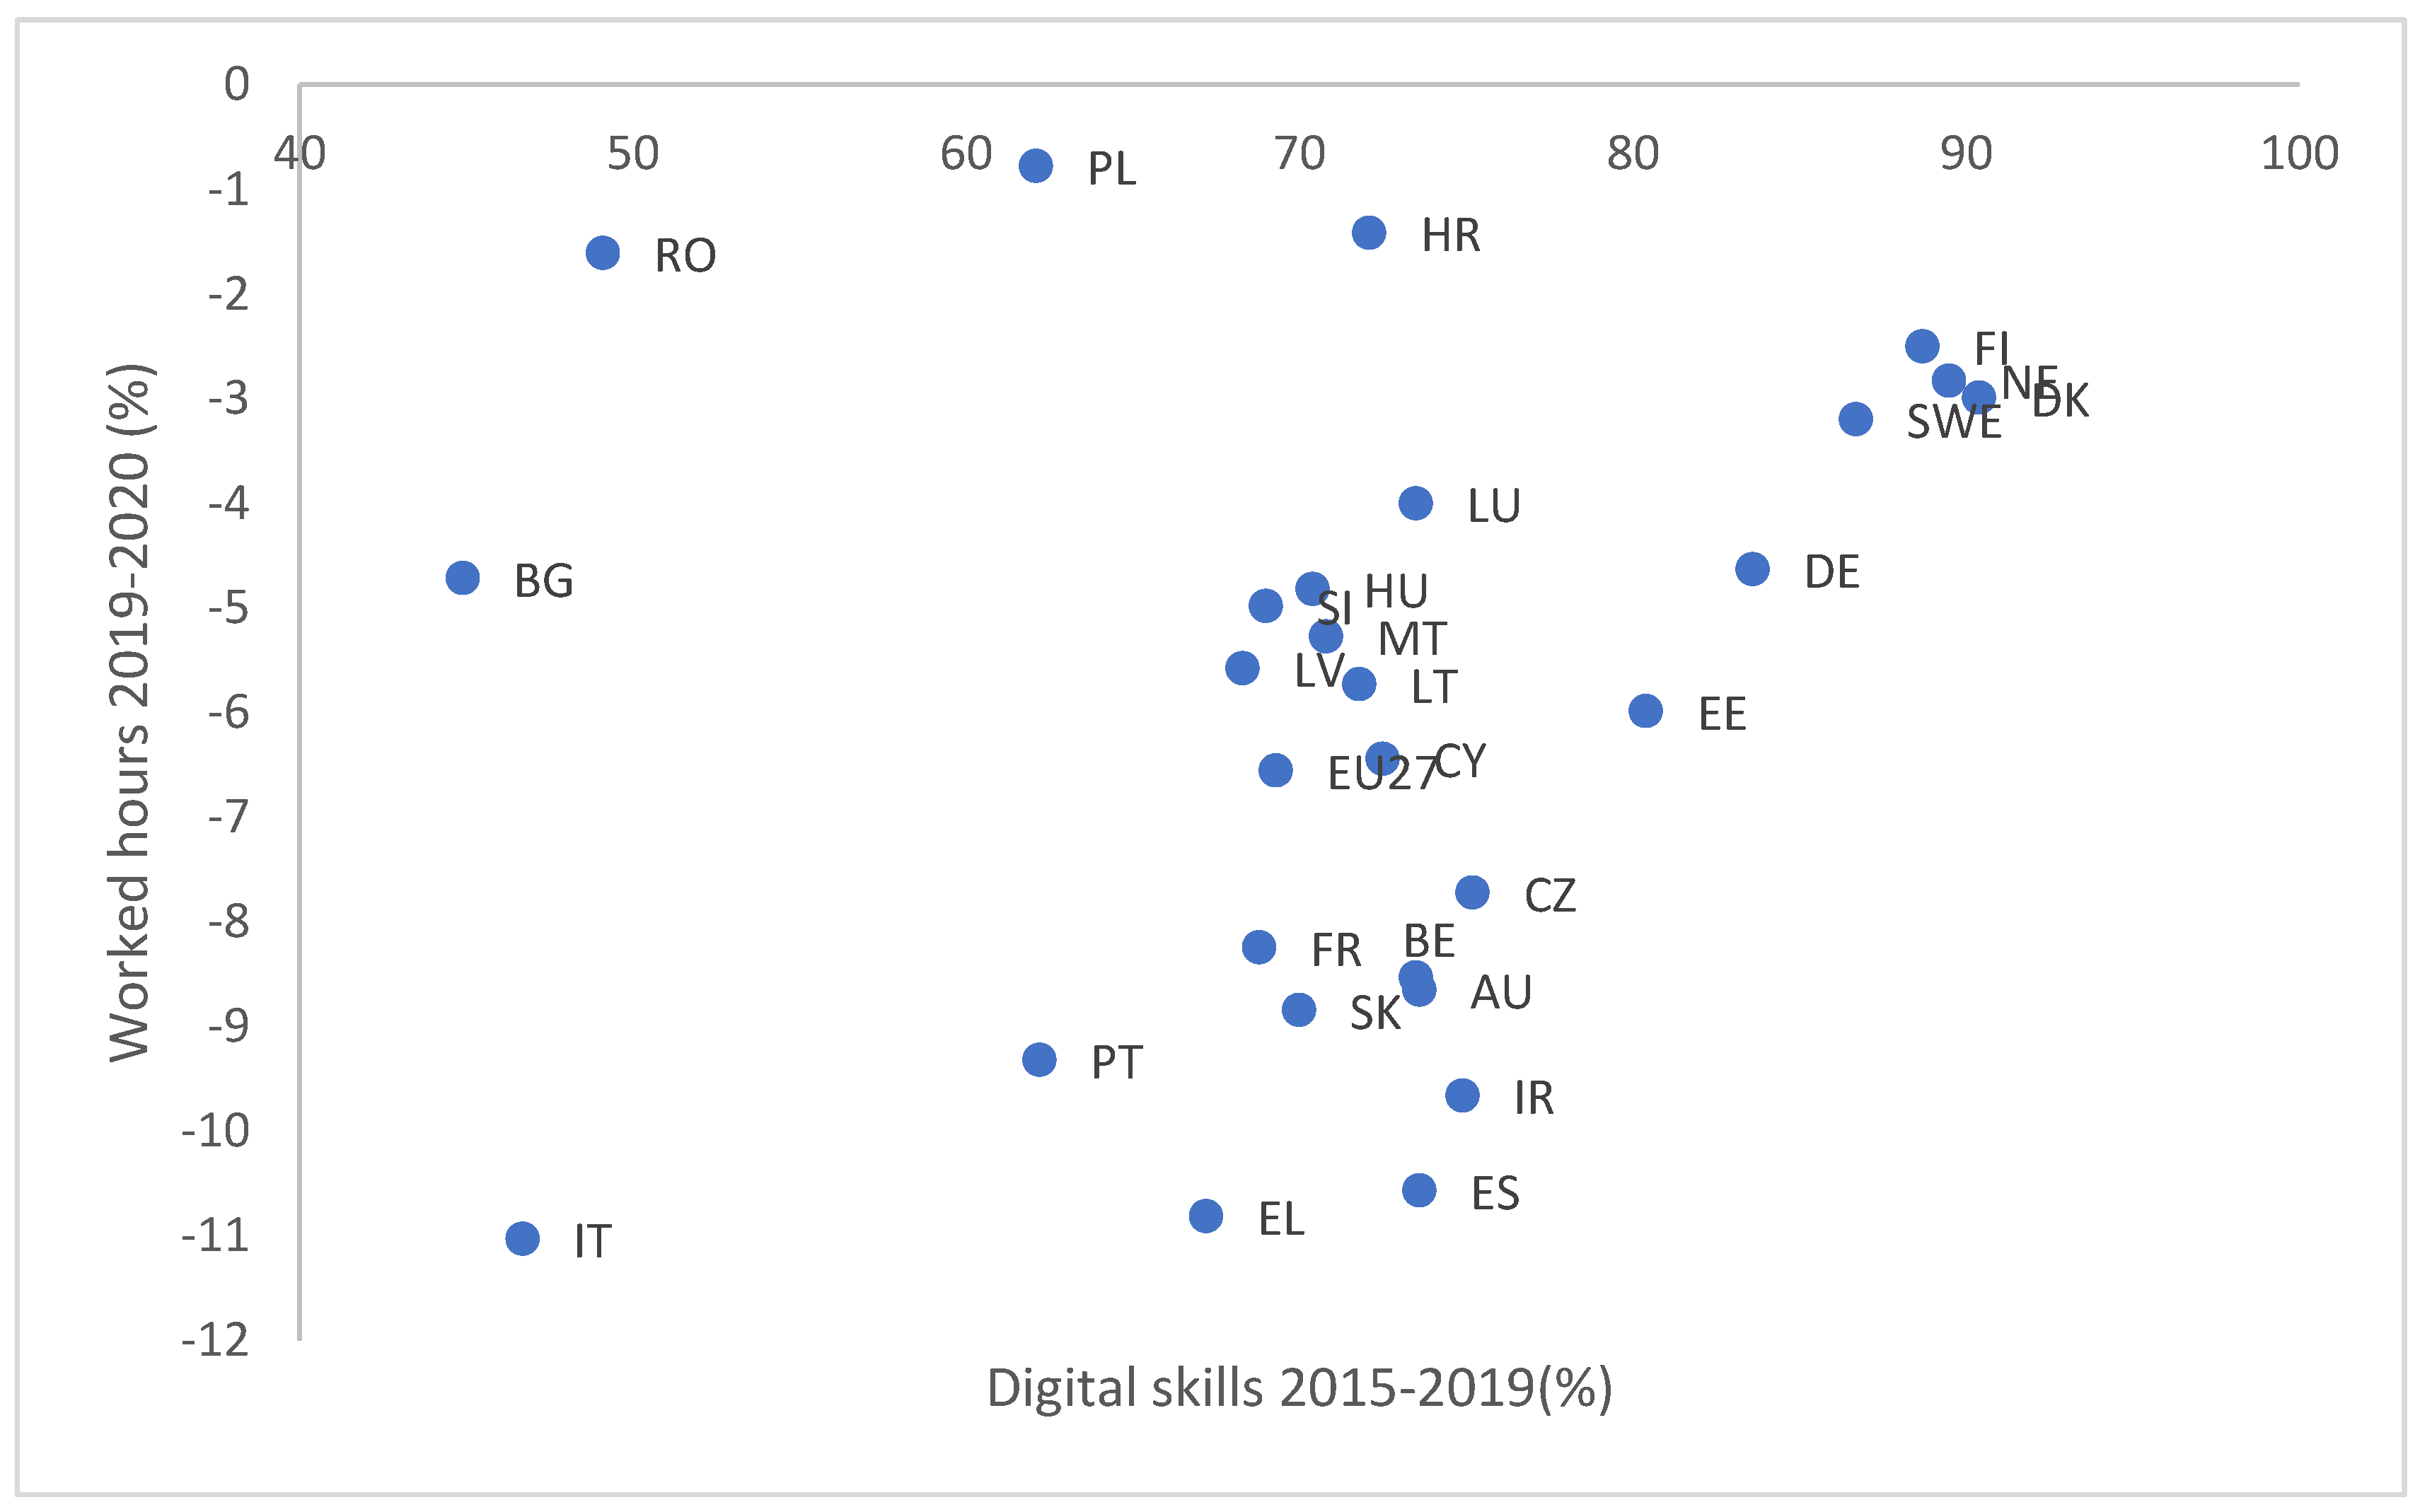
Another significant factor for digitalization and economic resilience (measured by a lower decline in GVA in 2019−2020) is the individual digital skills (see
Figure 3). For the latter, we take account the share of persons that have been using the internet during last three months and they have digital competences above the basic level in four areas: information, communication, content creation and problem-solving.
The digital skills of the general population reflect the flexibility to switch work programs to teleworking, where is possible, and, thus, a better absorption of mobility restrictions shock without a high decline in production, especially where the digital skills are high.
Generally, there was a negative correlation between the share of individuals with digital skills above the basic level (in information, communication, content creation and problem-solving domains, in line with the European Commission and Eurostat assessment, and the change in working hours during COVID 2020 pandemic among EU member states.
Countries such as Finland, Netherlands, Denmark, and Sweden are a cluster of countries with a lower decline in working hours. The same trend was seen in countries such as Romania or Poland, where the working hours slightly reduced despite the low share of individuals with digital skills above basic. However, this is also a matter of economic activity structure (GDP composition in terms of production and value chain integration and export’s geographical structure), as there are countries with a high and low share of individuals above basic digital skills, such as Bulgaria and Germany, but with a similar decline in working hours during 2020 relative to 2019.
Further, we used a correlation matrix based on the Pearson correlation coefficient (r coefficient) to assess the relationship between economic indicators and several digitalization-specific indicators. This measures the strength and direction of a linear relationship between two variables. Values always range between −1 (strong negative relationship) and +1 (strong positive relationship). Usually, a value higher than +/−0.5 is considered strong enough, while values below +/−0.4 are weak. At the same time, correlations are considered significant at the 0.01 and 0.05 levels.
where
r = correlation coefficient;
Xi = values of the X-variable;
Xm = mean of the values of
X-variable;
Yi = values of the Y-variable;
Ym = mean of the values of
Y-variable.
4. Results and Discussions
Table 1 presented below shows our Pearson correlation coefficients (
r) regarding (macro)economic variables gross value added (GVA), employment (EMPL) and working hours (H_work) in 2020 compared to 2019 in correlation with several quantifiable features of digitalization: ITC employment (ITC_EMPL) share in total employment, ITC share in GDP (ITC_GDP), the share of companies with a high level of digital intensity (EnterpH_GTintensity), the share of the population with digital skills above basic (SKILLS), E-government public services for business (EGOVbusiness) and e-government public services for population (EGOVindivid).
Our analysis showed that there is a direct but moderate positive correlation between the GVA change and the share of ITC employment in total national employment. This is the only statistically significant correlation coefficient between a macroeconomic indicator and an indicator relevant to digitalization. At the same time, it seemed that the change in working hours is not positive or negative statistically significant correlated with our selected digital indicators.
Moreover, there is a strong positive correlation between the share of ITC employment and the share of ITC in GDP, the level of digital skills for individuals, and the share of companies with high intensity of digitalization. Nonetheless, the share of individuals with digital skills above basic and the ITC employment share are strongly positively correlated with enterprises with high digital intensity and e-government public services for the general population, as well.
5. Cluster Analysis
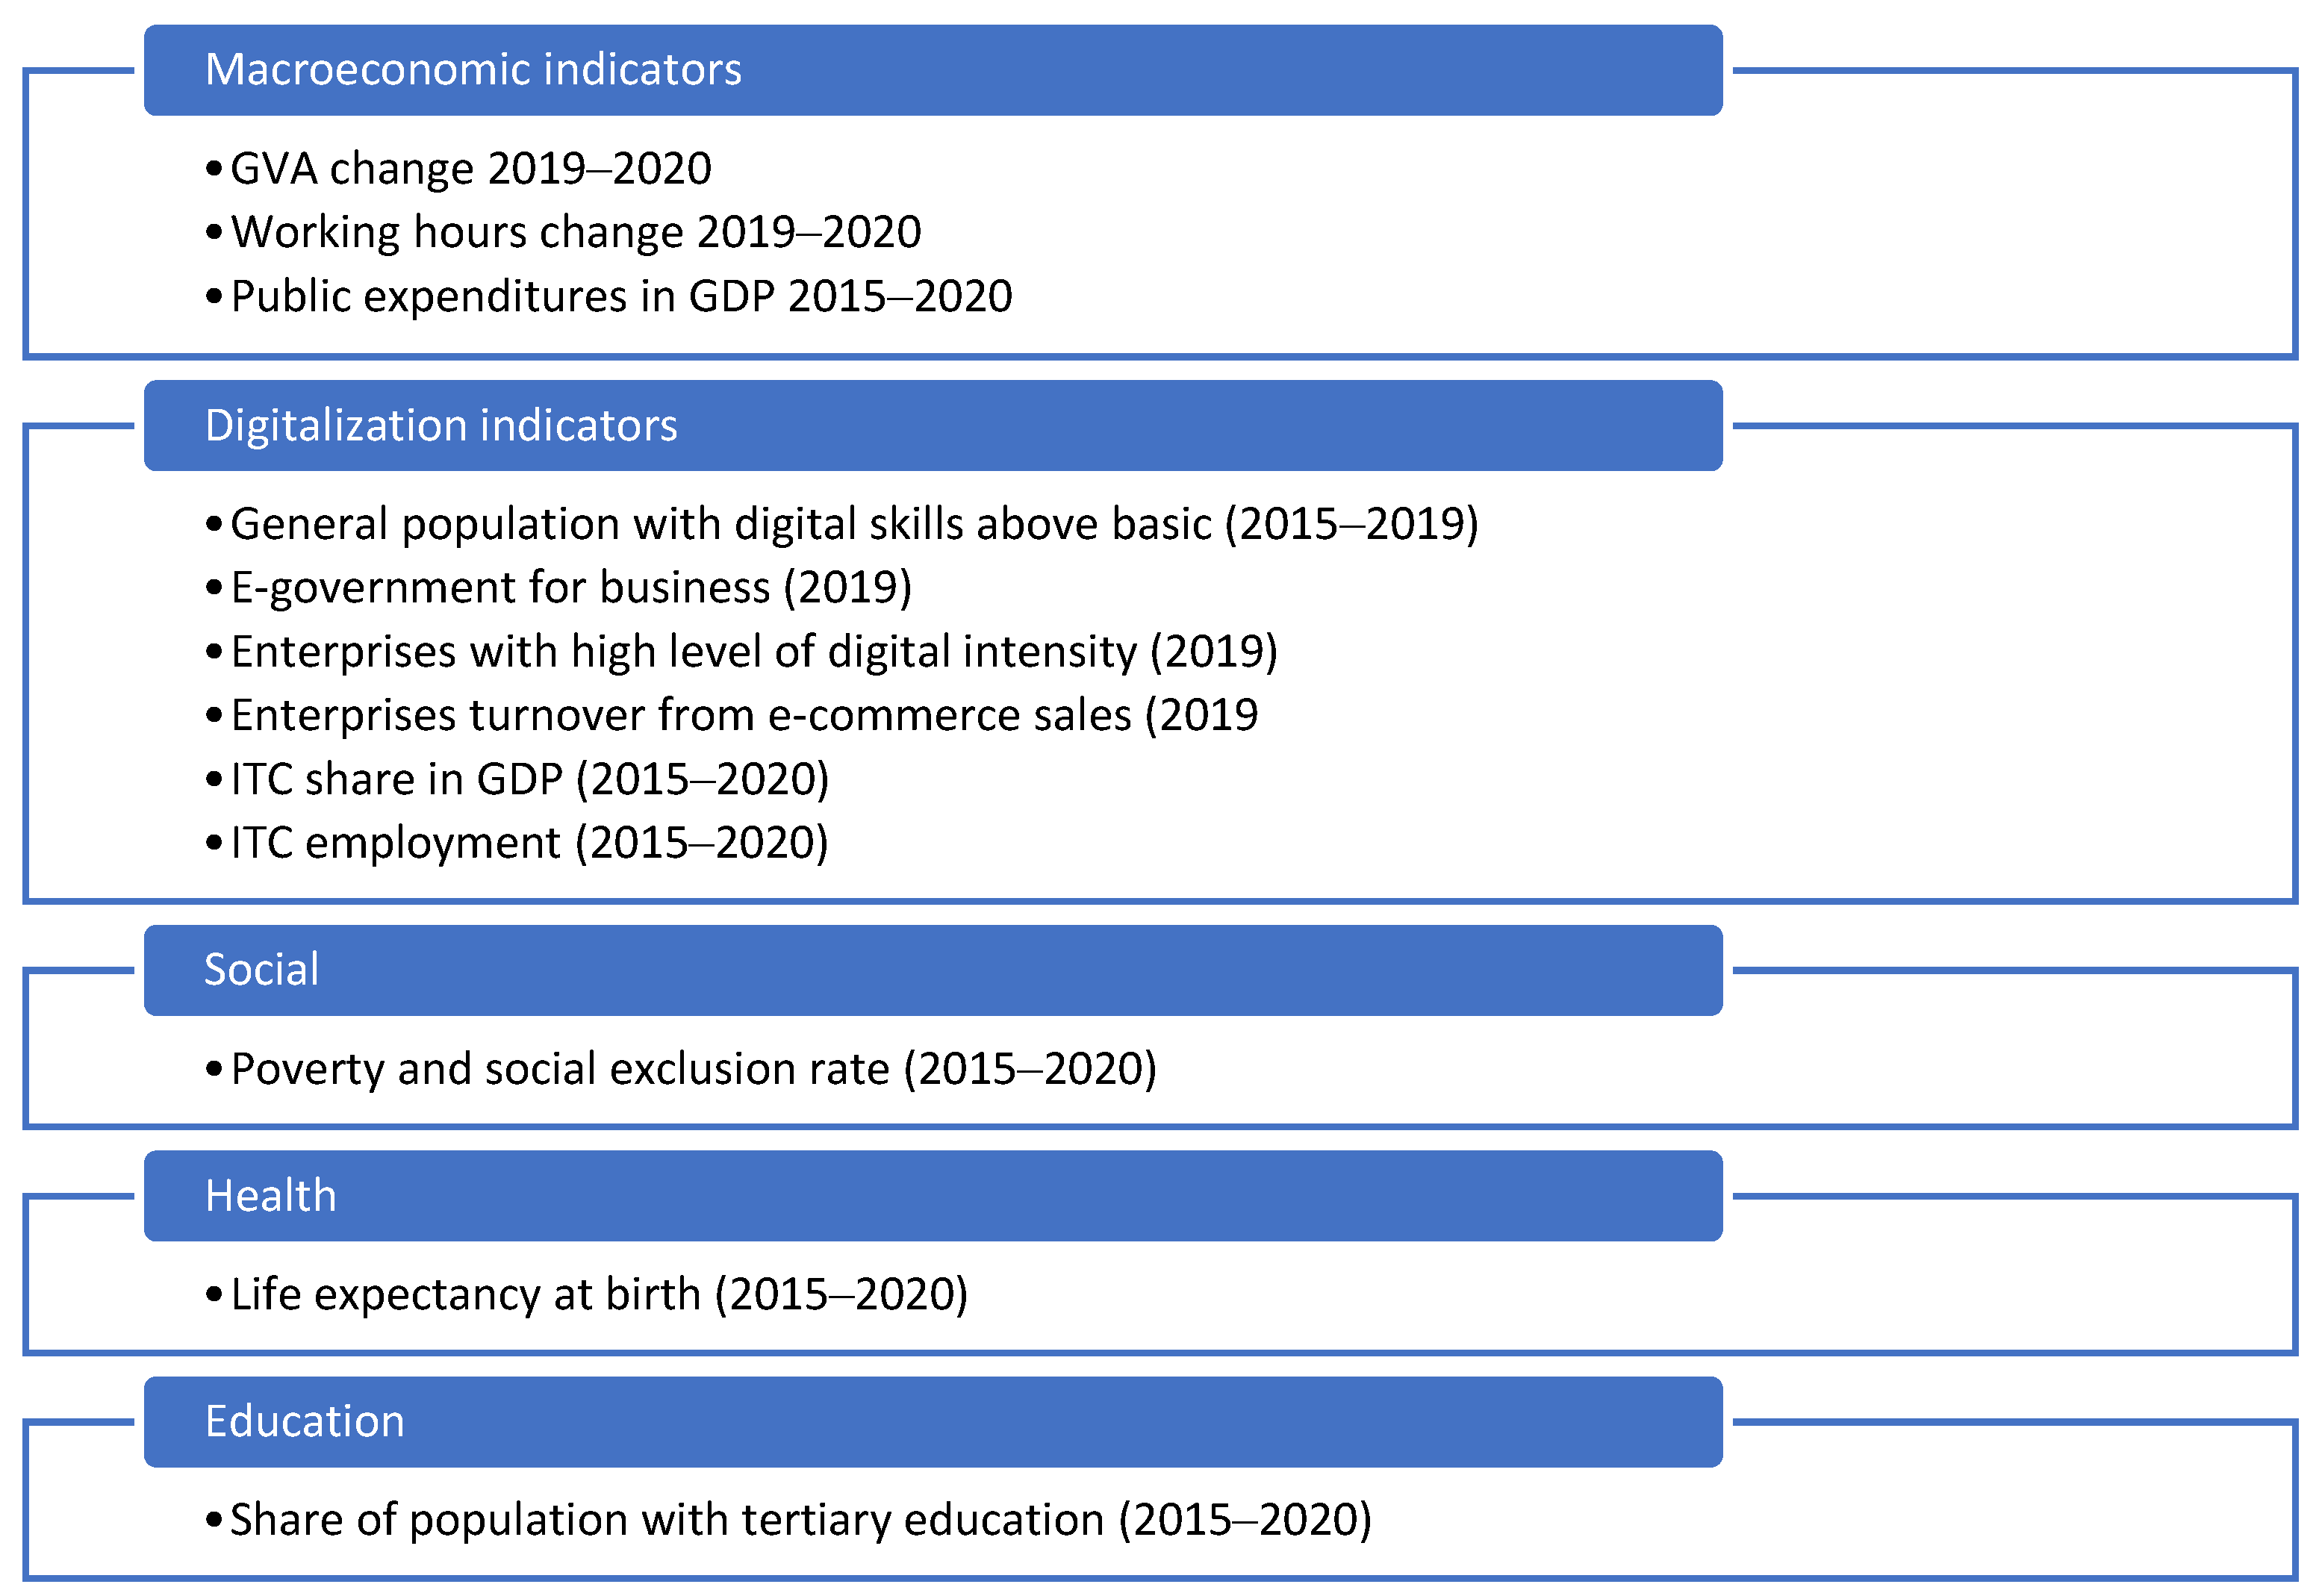
Further, we selected the indicators considering their relevance for resilience based on the literature review for economic resilience, but also on the data availability. We designed the analysis based on five main categories of variables: macroeconomic indicators, digitalization, social, health and education. The data map is presented below (
Figure 4):
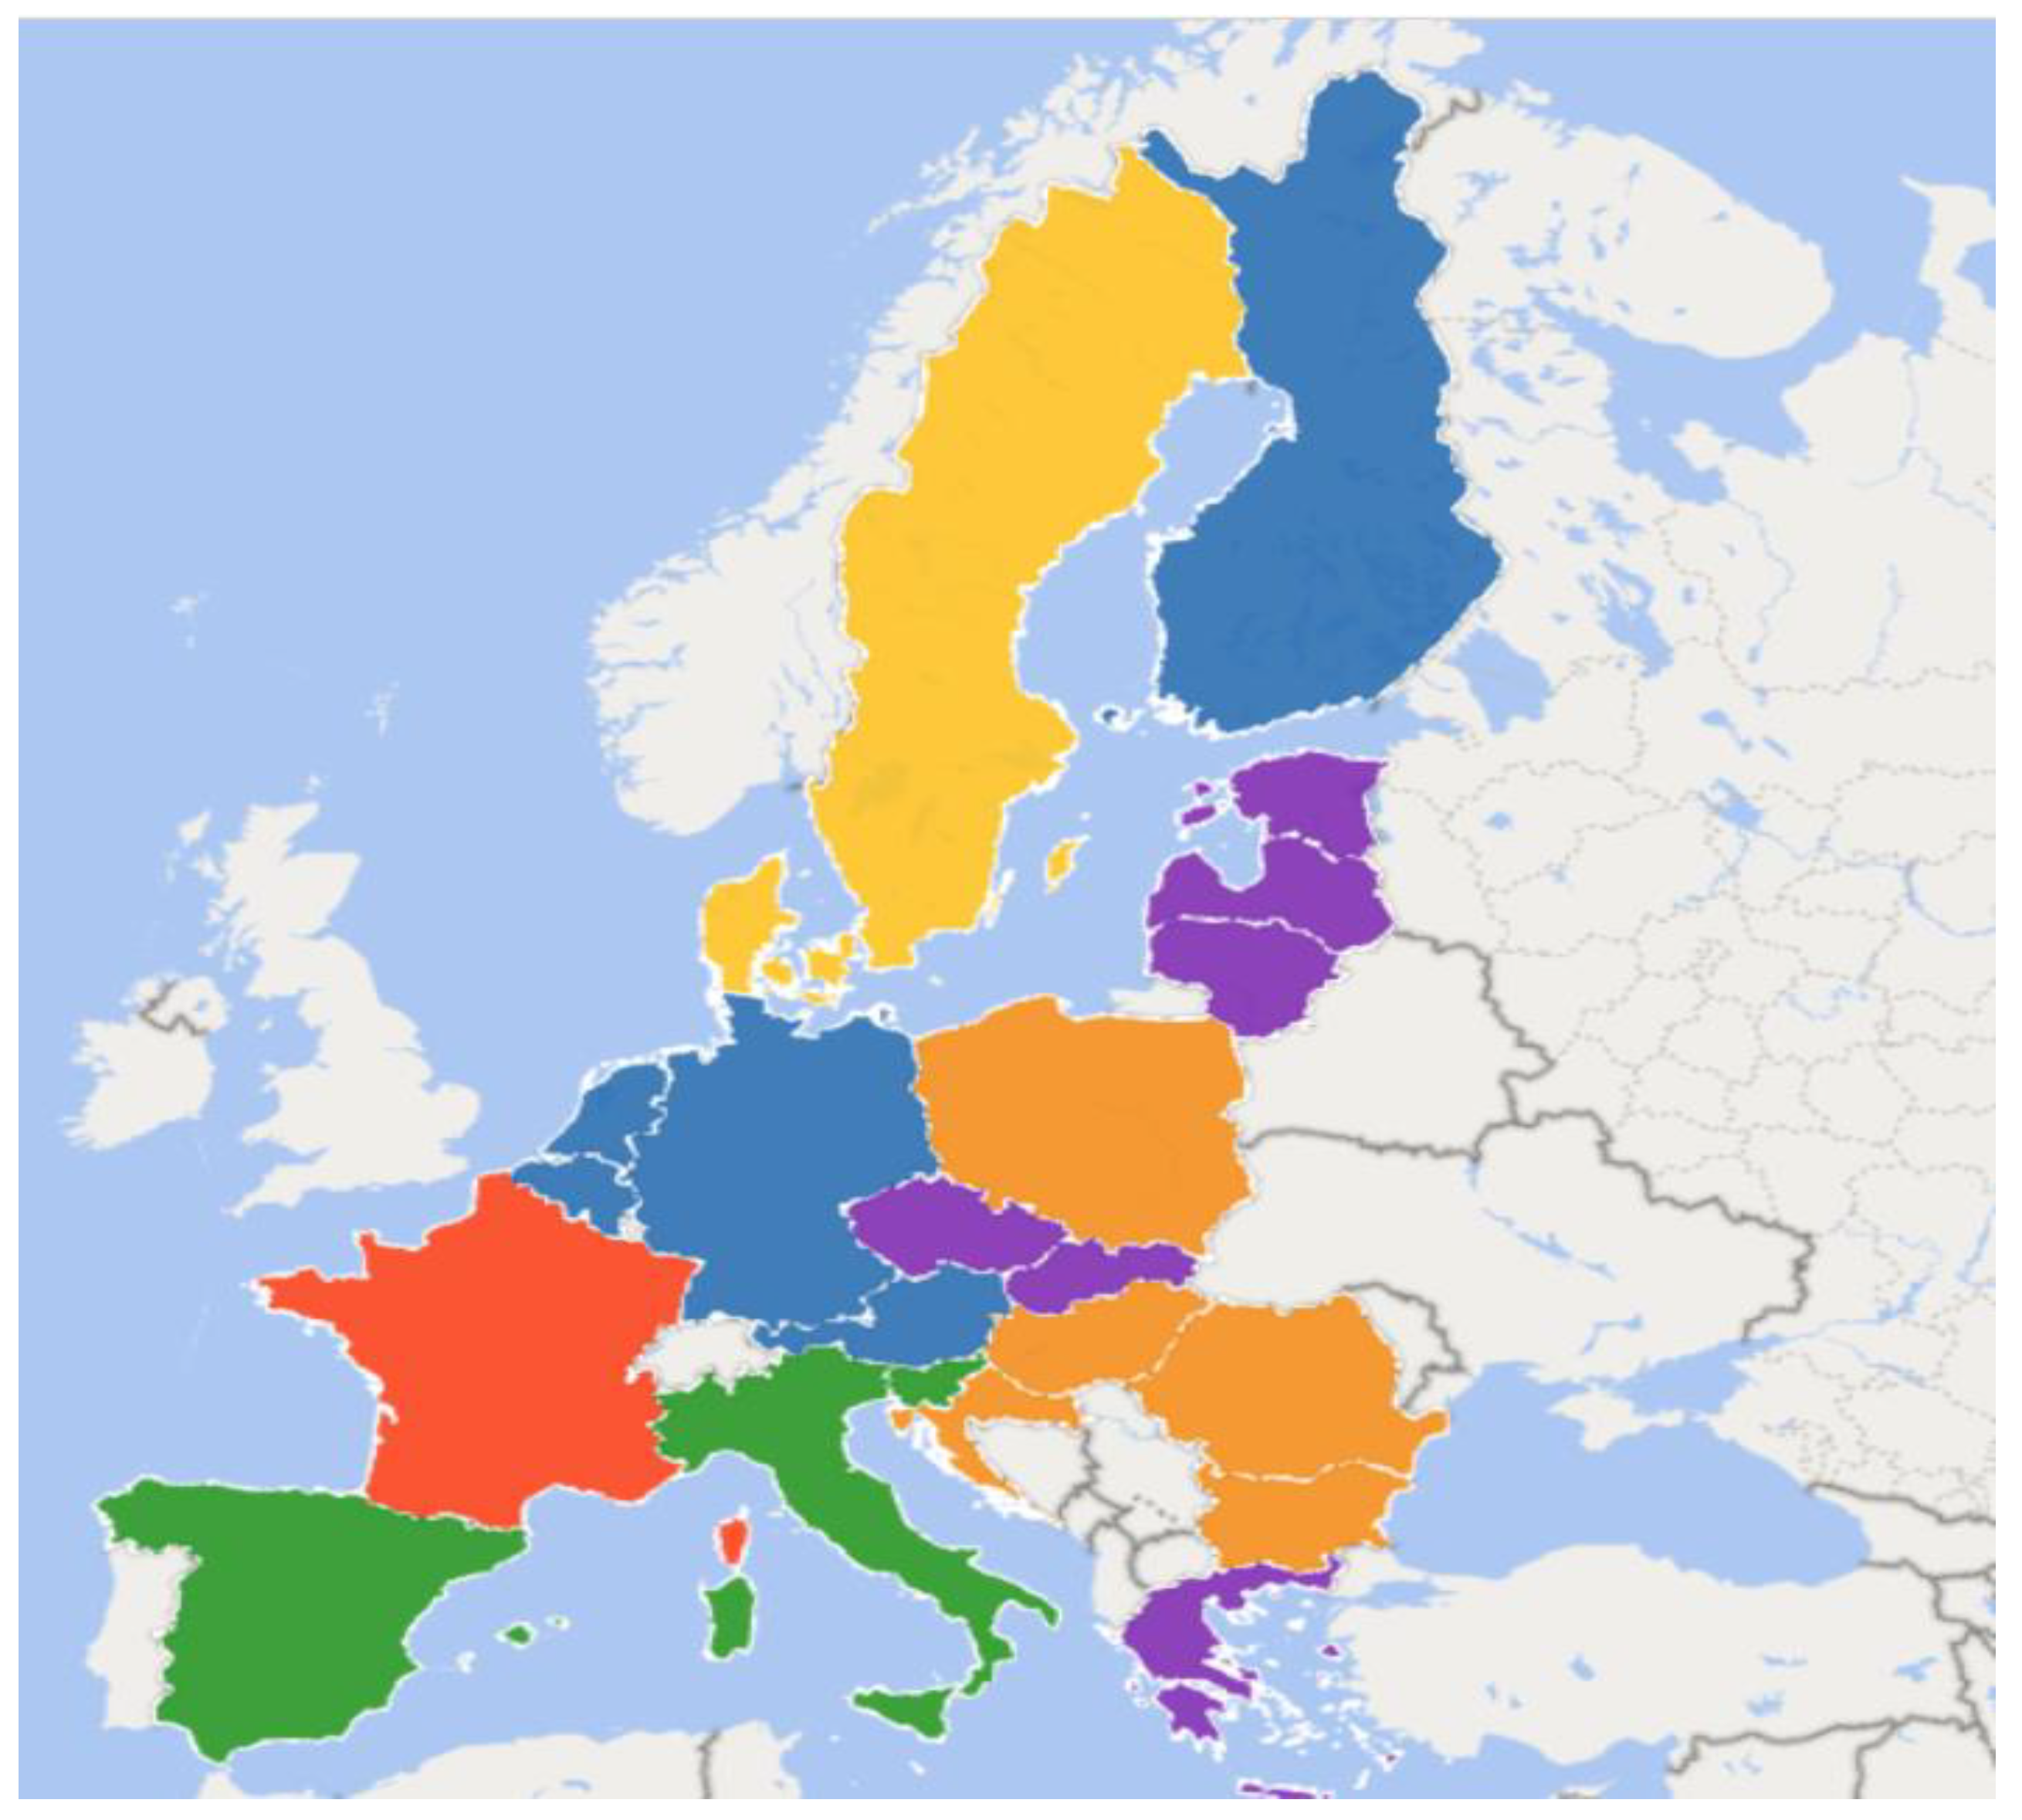
Based on the statistical analysis performed using the SPSS program for all five categories of data included in our research, we constructed six main clusters of countries from the EU Member States (see
Figure 5). Moreover, based on the hierarchical cluster analysis, we obtained the dendrogram which presents the hierarchical relationships between all six clusters (
Figure 6).
For the entire dataset, the source was Eurostat and the European Commission, DESI index components and subcomponents. However, four countries (Ireland, Cyprus, Luxembourg, and Portugal) were excluded from the clusters due to no data available for the ITC employment and share of ITC in GDP.
First cluster: Finland, Austria, Netherlands, Germany and Belgium.
Second cluster: Bulgaria, Croatia, Hungary, Poland and Romania.
Third cluster: Czechia, Estonia, Greece, Latvia, Lithuania and Slovakia.
Fourth cluster: Sweden and Denmark.
Fifth cluster: Spain, Italy, Malta and Slovenia.
Sixth cluster: France.
6. Conclusions
The COVID-19 pandemic highlighted the need for companies to reinvent themselves; otherwise, the risk was of falling victim to market competition. The measures introduced by the governments to tackle the pandemic crisis, such as social distancing, working from home or closing schools, affected all people and all companies. In this context, resilience became a central element of internal evaluations of member states’ capabilities and vulnerabilities.
The objective of this research paper was to see the economic resilience during the COVID-19 pandemic in the current EU Member States. For that, we used two methods. First of all, we used a Pearson correlation analysis applied to several indicators obtained from Eurostat and the European Commission for different aspects of macroeconomic and digitalization dimensions in both private and public sectors to see if countries with more intense use of digitalization and a high share of ITC in GDP registered a lower decline of the economy (including unemployment, number employees and incomes) in downward periods, as the economic flexibility of a country or a group of countries is supported by the use of ITC.
The analysis highlighted that there is a positive relationship between the dynamic of gross value added (GVA) during the COVID-19 shock and the share of companies that use digital tools, including e-sales, in their business activity, but also in relation to public administration via e-government services (see for example the Germany case presented in Fischer et al., 2022).
Thus, in two Nordic countries, Sweden and Denmark, but also in Lithuania, Luxembourg and Ireland, the GVA actually increased during the COVID-19 shock in 2020 compared to 2019, and the e-commerce and other digital technologies contributed to business activities: high broadband speed, mobile devices, presence in social media, software products or sending e-Invoices, and tools that should increase de adaptability of companies during turbulent periods. This conclusion is in line with the study by Abidi et al. (2022), which shows that digitally enabled firms faced a lower decline in sales during the pandemic compared to digitally constrained firms.
In the second part of the research, we used a hierarchical cluster analysis model based on several structural socio-economic and digitalization indicators to identify several regional economic models within the EU.
Based on the statistical analysis using the SPSS program for all five categories of data included in the analysis, we constructed six main clusters of countries from EU Member States: first cluster: Finland, Austria, Netherlands, Germany and Belgium; second cluster: Bulgaria, Croatia, Hungary, Poland and Romania; third cluster: Czechia, Estonia, Greece, Latvia, Lithuania and Slovakia; fourth cluster: Sweden and Denmark; fifth cluster: Spain, Italy, Malta and Slovenia; sixth cluster: France. The entire analysis highlighted the importance of digitalization features for economic resilience in front of crises.
However, our study has some important limitations. We considered only a small sample of countries, even without including some EU Member States due to unavailable data (Ireland, Cyprus, Luxembourg, and Portugal), and we emphasized only one type of shock, the COVID-19 pandemic impact on business activity and public administration. In addition, although correlation analysis can be a useful tool for exploring relationships between variables, it is important to acknowledge its limitations as it only identifies associations between variables and cannot determine a causality relationship. At the same time, it is sensitive to outliers and can be influenced by extreme values as there could be other variables and other alternative explanations for the behavior of some aggregate indicators, such as GDP or gross value added.
Further research with larger sample sizes and different research designs in terms of explicative variables is needed to confirm and expand upon these findings. For example, we excluded other relevant social indicators alongside poverty and social exclusion rate (i.e., inequality aspects or labor market flexibility) or for the digitalization category (i.e., Internet speed and broadband penetration among households and firms). Another possible direction for future research would be to test the stability of the identified clusters over time and during other economic or non-economic shocks. Lastly, we considered that further research could also investigate the variables that had the most influence on the clustering results for business resilience and public administration resilience during shocks. This could help to identify key common features or factors that define each cluster and provide insights for targeted interventions.
7. Managerial Application
From a managerial point of view, our study supported the efforts towards digitalization at the company level due to general improvements that it generates in terms of financial rentability and productivity, but also as a pillar of financial/economic resilience during downward periods, including aspects that involve customer retention.
For example, digital scheduling tools and workflow automation increase productivity by reducing the amount of time to complete tasks. Moreover, digitalization tools can provide access to real-time data, facilitate data analysis, and supports quicker data-driven decisions during a shock, boosting the firm’s capacity to adapt to new business conditions. Moreover, digitalization tools facilitate synchronic or a-synchronic collaboration among team members, regardless of their locations (document sharing tools, video conferencing, and collaboration platforms).
Finally, for the external business environment, we considered that digitalization tools could help management to provide a better customer experience, offering companies the ability to engage with customers and provide support remotely, even when face-to-face interactions are not possible, also better-customized offers to the client’s needs.


 ,
, 


