


Analysis of Disparities in Internet Purchases by Individuals at the EU State Level


1
Department of Finance and Accounting, Faculty of Economic Sciences, Constantin Brancusi University of Targu Jiu, 210185 Targu Jiu, Romania
2
Department of Cybernetics, Economic Informatics, Finance and Accounting, Faculty of Economic Sciences, Petroleum-Gas University of Ploiesti, 100680 Ploiesti, Romania
*
Author to whom correspondence should be addressed.
Electronics 2023, 12(4), 982; https://doi.org/10.3390/electronics12040982
Submission received: 23 November 2022
/
Revised: 13 February 2023
/
Accepted: 14 February 2023
/
Published: 16 February 2023
(This article belongs to the Special Issue Recent Applications of Emerging Digital Technologies in Economy and Society)
Abstract
:In recent years, the trend of digital transformation of commerce has been extremely dynamic, and the COVID-19 pandemic has generated a strong impetus for the development of digitalization. However, there is a large difference in the use of e-commerce in European Union (EU) countries. The objective of this article is to explain the complex evolution of e-commerce in terms of B2C using econometric methods, especially regarding Internet purchases made by individuals according to six social and technological factors considered basic factors in purchase decisions. Thus, we propose a conceptual model for the analysis of disparities in Internet purchases, taking into account both factors related to demand (consumer) and factors related to supply (supplier). Based on the data provided by Eurostat for all 27 EU countries for the period 2012–2021, the empirical findings of cluster analysis suggest changes in the grouping of countries at the beginning and end of the analysed period. Socioeconomic factors that can explain the transition of EU states from one group to another in terms of development level of Internet purchases by individuals were identified. The results of this study can serve as a starting point for future adaptation strategies of e-commerce in the context of global economic development with a focus on increasing digitisation, the existence of for which a digital convergence in the process of digital transformation is essential.
1. Introduction
E-commerce is the engine of the digital economy, exerting a positive impact on the process of economic development and growth. The importance of e-commerce has determined the appearance of numerous studies in the specialized literature regarding multiple aspects, from the outlining of the concept of e-commerce [1,2,3,4,5,6,7,8,9,10,11,12] to the nature of transactions [13,14], consumer behaviour [15,16] and determinants [17,18,19,20,21,22,23,24,25,26], mainly focusing on the challenges and opportunities offered by the COVID-19 pandemic for the last two years [27,28,29].
For individuals, online transactions are an efficient way to make purchases due to the reduction in time allocated to the procurement procedure on the one hand, as well as the reduction in expenses on the other hand.
The research problem addressed in the article is the reluctance of individuals to use the Internet for acquisitions and, at the same time, their reluctance to adopt technologies in order to optimize and streamline the acquisition procedure. In general, individuals are open to the new, and reluctance is determined by social and technological factors.
There are few studies on the e-commerce phenomenon in terms of Internet purchases made by individuals, and our research objective is to cover these gaps [30,31,32].
The aim of this paper is to study the effects of the main social variables (educational level) and ICT (Internet access and Internet use) on Internet purchases made by individuals within the EU member states that lead to differences between groups of EU countries regarding the development level of Internet purchases made by individuals.
In examining the possibilities of making online purchases, Internet access is a sine qua non condition. There is no doubt that making online purchases is closely linked to Internet access, without which it would not be possible. On the one hand, individuals whose households have access to the Internet may not use the Internet because of certain barriers (education, religion, desires, etc.). On the other hand, a barrier to online purchasing may even be a limited offer of enterprises, their relationships with customers and their reluctance to carry out e-commerce. Therefore, the following variables were introduced in the analysis: enterprises with e-commerce sales and e-commerce enterprises, customer relationship management and secured transactions.
This paper is structured in five sections. After Section 1, Section 2 presents a review of the literature on the determinants of the evolution and development of e-commerce, focusing on transactions carried out by individuals. Section 3 is dedicated to the research methodology specific to econometric methods of the cluster type. Section 4 contains the empirical study focused on modelling Internet purchases made by individuals according to six social and technological factors selected using data collected over time. The analysis was performed at the level of EU member countries in the period of 2012–2021 using cluster analysis. Section 5 presents the conclusions drawn from the conducted analysis and a discussion of research limitations and possible future directions for research on the addressed topic.
2. Literature Review
E-commerce has many definitions in the specialized literature. The lack of an unanimously accepted definition, as well as the problems face by researchers in this field, was emphasized by Ngai and Wat [7], who analysed articles published in this field between 1993 and 1999; by Wareham et al. [9], who identified the main research subfields and the most important themes based on 582 articles published between 1997 and 2003; and by Bai and Li [11], who analysed the evolution of research themes in this field in the last two decades.
Dearlove [6] defined e-commerce as the “proactive management” of information flow and of the databases that manage this information.
Kalakota and Whinston [8] provided four definitions of e-commerce, describing this concept in terms of communications, business processes, services and online activities.
Turban et al. [10] proposed two definitions of this concept. In the narrower sense, e-commerce “refers to using the Internet and other networks (e.g., Intranet) to purchase, sell, transport or trade data, goods and services”. In a broader sense, e-commerce also comprises activities related to all types of online business (customer relationship management, collaboration with business partners, provision of e-learning and achievement of online transactions for the company).
Eurostat [33] defines e-commerce in its narrower sense as “sale or purchase of goods or services between businesses, households, individuals or private organisations, through electronic transactions conducted via the internet or other computer-mediated networks”.
A detailed analysis of the way the concept has been defined over time was published by Semerádová and Weinlich [12].
Currently, within companies, there is a tendency to move from traditional business management systems to intelligent digital systems. This has led to the digital revolution, with information technologies playing a significant role in this context.
Based on the analysed data, Singh et al. [21] declared that in 2000, Europe was “one to four years behind United States” in terms of e-commerce. Jędrzejczak-Gas et al. [34] suggested that e-commerce in Europe has become increasingly important and plays a key part in the total trade. Europeans use this type of trade increasingly often, and with the development of society and its digitisation, it has an increasing share of the economy. According to a report of the Ecommerce Europe association, the European market overtook that of the US as of 2010 [35].
In 2020, 22% of EU firms had e-commerce sales, and 19% reported that their online sales reached at least 1% of their total turnover—an increase of 1 percentage point (pp) compared to 2019 and up 6 pp from 13% in 2010. The steady increase in the use of e-commerce sales in many countries has been accentuated by the coronavirus pandemic and movement restrictions that have led to an increased interest in online sales for both customers and businesses [36].
According to the 2022 Ecommerce Europe Report [37], in 2021, overall e-commerce across Europe recorded an increase in turnover of B2C e-commerce, although some countries reported a decrease in sector-wide sales due to the easing of restrictions caused by the COVID-19 pandemic. According to the trend of recent years, in 2021, eastern European countries recorded higher increases in sales from B2C e-commerce than western European countries. However, western Europe still has the largest share of the total turnover (63%), compared to only 2% for eastern Europe.
Many studies have focused on identifying factors that could contribute to the widespread adoption of e-commerce [21,22,23,24,25,26,38,39,40,41,42,43,44,45,46]. In order to achieve the main objective of this paper, we conducted an analysis of the specialized literature on e-commerce with respect to the Internet purchases made by individuals according to six social and technological factors considered basic factors in purchasing decisions.
Among studies identified in the specialized literature about online purchases made by individuals, most researchers chose to carry out studies using qualitative research methods, studying opinions expressed either through face-to-face interviews or online. Such studies [21,22,23,24,25,26,38,39,40,41,42,43,44,45,46] demonstrate that many social, demographic, economic and technological factors influence the e-commerce activities of individuals.
Singh et al. [21] performed a comparative analysis of e-commerce in the US and Europe, taking into account the following factors: the level of implementation and use of IT technology, the economic environment, the business environment, the cost of Internet access, online security, consumer concerns, government regulations, venture capital for startups and some cultural factors (language, lifestyle and risk aversion).
Javalgi and Ramsey [22] proposed a model for analysing aspects regarding the transformation of the Internet into a global distribution tool. They identify the key factors that influence e-commerce development:
- IT and telecommunications infrastructure;
- Sociocultural infrastructure;
- Commercial infrastructure;
- Political and legal infrastructure.
Rana Tassabehji [23] suggested that in order to evaluate the level of development of e-commerce between different countries, it is important to identify its key factors, which can be grouped into the following categories: technological factors (telecommunications infrastructure, access to new technologies, bandwidth, and development and implementation speed of new technologies), political factors (the number of government incentives that support the use of new technologies and the number of laws and policies that regulate electronic data, contracts and financial transactions), social factors (the IT skills of the population, the number of online users, the number of households with computers and the education level of the population) and economic factors (economic growth, the average income of the population, the cost of acquiring new technologies, the cost of access to telecommunications infrastructure, the level of commercial infrastructure development and the state of innovative business models).
Ho et al. [24] conducted a study on the development of e-commerce in seventeen European countries between 2000 and 2004. According to this study, the factors on which the development of e-commerce depends are GDP, geographical characteristics, demographic characteristics, the degree of urbanization, IT infrastructure, Internet connection costs, appropriate financial resources, cosmopolitanism, education level and human capital. The key variables used by the researchers in their analysis based on panel regression models were the percentage of the population that used the Internet, the level of telecommunications investments, the availability of venture capital, the availability of credit cards and the education level of the population.
Eppright and Hawkins [25] proposed a model for analysing the effects of different factors on the growth of emerging B2C e-commerce markets. They divided these factors into three categories: factors related to suppliers, factors related to products and factors related to consumers.
Dominici et al. [26] analysed the sociodemographic and situational factors that influence individuals to buy food. Using a logit model on the data received from 34,488 respondents from Italy, they concluded that online food purchases are influenced by the following factors:
- Sociodemographic factors: age, level of education, standard of living, household size and marital status of individuals;
- Situational factors: distance to grocery stores, working time, individual health problems, degree of obesity and practice of regular physical activities.
The advantages and disadvantages of e-commerce are also presented in the specialized literature [6,12,47].
Technological progress has influenced the lives of every individual, from social networks and smartphone technology to e-commerce. The main characteristic of e-commerce are that geographical location is no longer a competitive advantage, and the main factor is represented by the use of digital technologies such as cloud computing, mobile devices and smart contracts [48].
The age, education level and experience of the client are closely related to the tendency of people to use state-of-the-art technologies, and these factors have a positive impact on technological readiness that takes into account four dimensions: innovation, optimism, uncertainty and discomfort [49].
Garrido-Lora et al. [43] studied the use of ICT in Spain by adults and children at home and at school, noting that there is a digital gap between generations. According to this study, adults use ICT for professional purposes, and young people use these technologies for informal purposes, such as social networking.
Bayo-Moriones and Lera-Lopez [44] analysed the use of ICT within Spanish companies, concluding that it is important to implement ICT in the industry and to establish the use of these technologies as strategic objectives, especially for the development of activities such as e-commerce.
Garín-Muñoz et al. [45] proposed a model that analyses individuals’ decisions regarding the adoption of Internet services (e-commerce, e-banking and e-government) in Spain. Based on the data collected from 16,209 respondents in 2016, they identified the factors that influence the use of these services by individuals. These factors are represented by gender, age, level of education, level of trust in the Internet, household income and individuals’ skills in using the Internet and computers.
The model was improved in a study by the same team [39] wherein they used a set of data collected between 2008 and 2016 to which they applied different panel logistic regression techniques.
Alderete [46] analysed the factors that determine the adoption of e-commerce at the country level based on data collected in 2018. According to this article, income is the most important factor that directly influences Internet access by fixed and mobile broadband and indirectly influences the adoption of e-commerce.
Information technology has played an important role in the development of business in Europe and worldwide. E-commerce has many benefits that we have seen during the COVID-19 pandemic. This type of commerce is constantly growing because interactions with customers have been decreased due to COVID-19.
Thus, the COVID-19 pandemic has highlighted the competitive advantage offered to national economies by the implementation of policies dedicated to the digitisation of society and the economy [50].
However, van Kessel et al. [51] consider that Europe’s digital climate since the start of the pandemic “has left much to be desired”, emphasizing large discrepancies between countries in Internet access and digital skills.
The analysed articles [24,25,26,38,39,40,41,42,43,44,45,46,52,53,54,55,56] from the specialized literature related to the disparities in Internet purchases between countries, especially European countries, are enumerated in Table 1.
Starting from the studies presented in the specialized literature and summarized in Table 1, we propose a model for analysing the disparities in Internet purchases, taking into account two of the three categories of factors identified by Eppright and Hawkins [25]:
- Factors related to demand (consumer): the percentage of population with tertiary education, the percentage of households with Internet access and the percentage of individuals who used Internet in the last twelve months;
- Factors related to supply (supplier): the percentage of enterprises with e-commerce sales and the percentage of e-commerce enterprises, customer relationship management and secured transactions.
3. Materials and Methods
This study is based exclusively on data provided by Eurostat [57] that were obtained through a survey technique applied annually by the National Statistics Institutes in order to reflect the use of ICT in households and by individuals [58] and to monitor digital goals of the EU for 2030 [59].
For the analysis of the purchases characteristics made by individuals in the online environment at the EU level, the selected variables were Internet purchases by individuals (PIPID), population by educational attainment level—tertiary education (levels 5–8) from 15 to 74 years (PTEL), households with Internet access (PHIA), individuals who used the Internet in the last 12 months (PIUI), enterprises with e-commerce sales (PEES) and E-commerce, customer relationship management and secure transactions (PECRM) (Table 2).
The first stage of the analysis targeted, on the one hand, determination of correlations between the evolution of the main analysed variable (percentage of Internet purchases by individuals) and the other variables included in the analysis and, on the other hand, evaluation of the characteristics of their data series in the period of 2012–2021.
Taking into account the fact that the values of the bivariate correlation coefficients between the variables included in the analysis revealed significant correlations, the use of panel regression models was excluded, and a cluster analysis [60,61,62] was adopted for the two moments of time that delimit the analysed period in order to capture the similarities and disparities between EU member states regarding the evolutions of the percentage of Internet purchases by individuals.
The choice of cluster analysis was also strengthened by the fact that between the EU member states, there are significant differences regarding the evolution of the variables included in the analysis (Table 3). With the exception of the PHIA and PIUI variables, the coefficient of variation (VC) values highlight that the data series are not homogeneous, and consequently, the mean values are not significantly representative.
Accordingly, starting from the matrix obtained by standardizing the variables, a proximity matrix was determined as:
Ward’s method was used to generate clusters.
Let A and B be two clusters of each nA and nB element with the centroids mA and mB, respectively and an item (xi); then:
The statistical significance of the obtained results was tested for a grouping with k clusters using the Welch test, the statistics of which are:
The condition for acceptance of the null hypothesis (H0: the means do not differ significantly) is or a p-value > α = 0.05 (95% confidence level), where the degree of freedom (df2) is:
The 27 member states of the European Union in the years 2012 and 2021 were grouped into three categories in terms of the level of development of Internet purchases by individuals based on the values of the variables included in the analysis: A (leaders), B (adepts) and C (novices). Starting with these groups and taking into account the evolution of the values of the six variables during the period of 2012–2021, aim of the analysis was to identify the factors that determined the transition of EU states from one group to another in terms of the percentage of Internet purchases by individuals.
4. Results and Discussion
4.1. Results
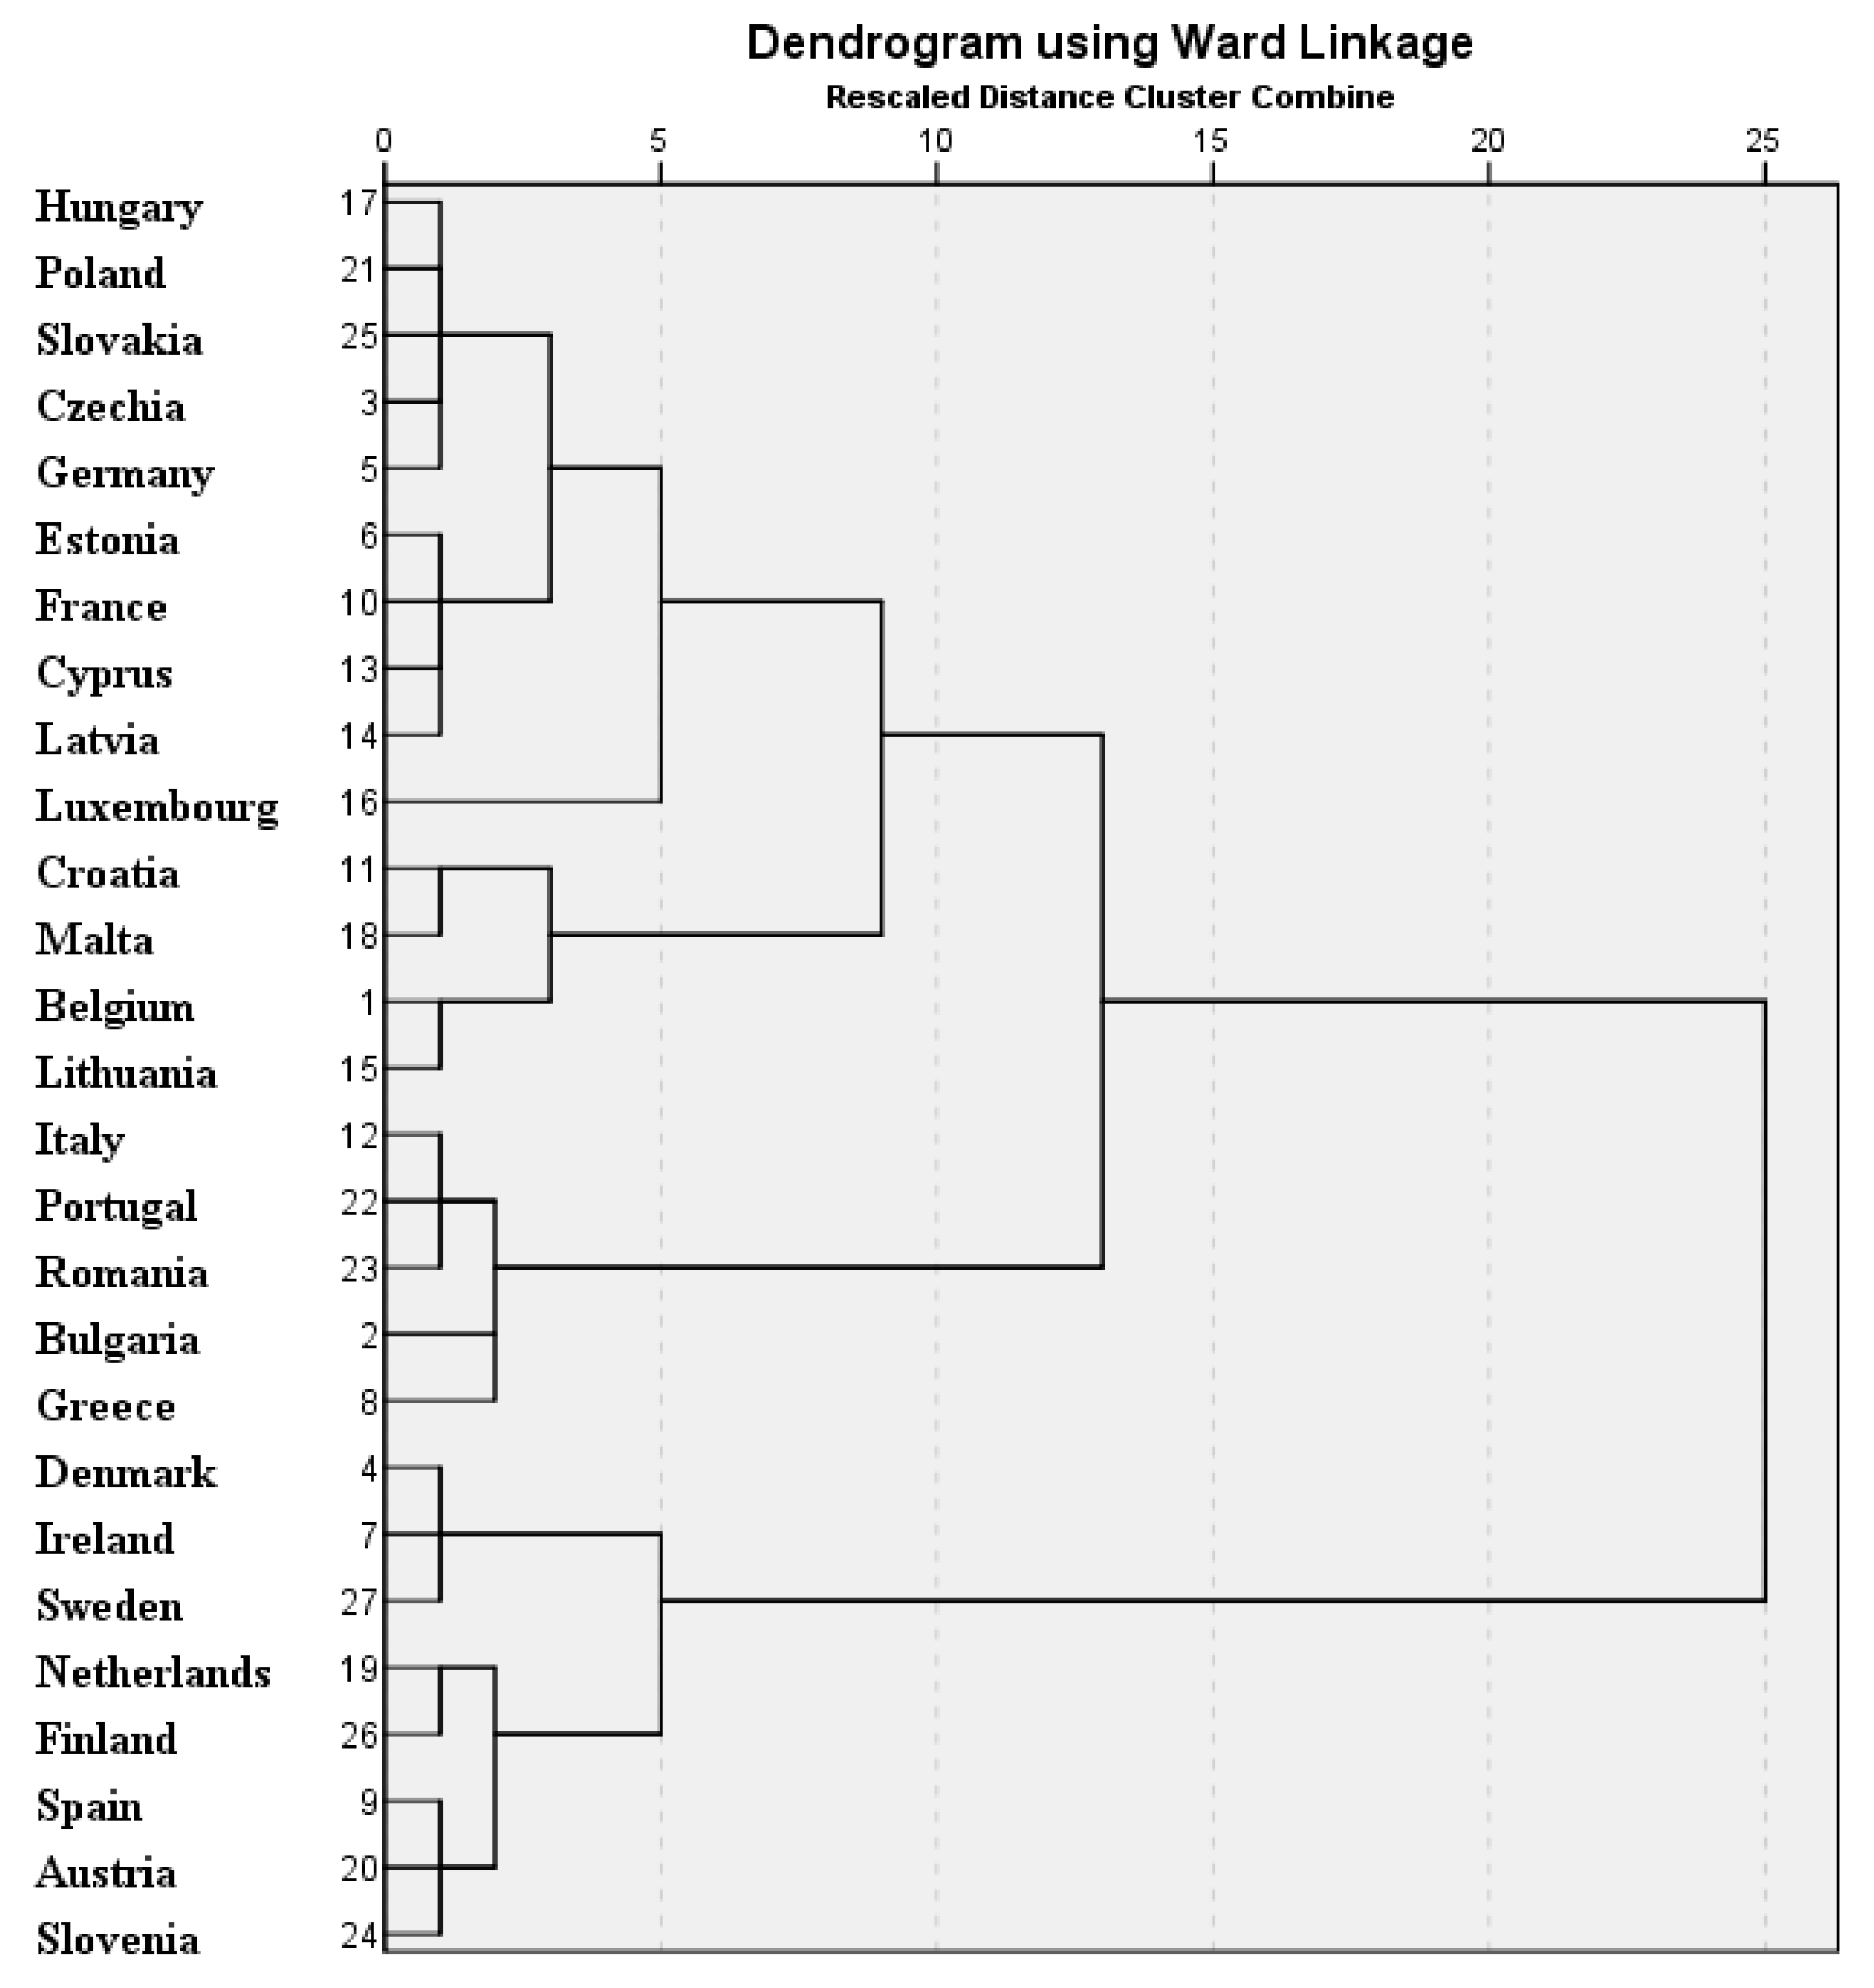
At the level of 2012, after generating the clusters using the SPSS application (Figure 1), three groups of countries were obtained: group A included eight states, group B included fifteen states and group C included four states (Table 4).
Taking into account the appearance of the dendrogram and following the conducted analyses in the light of the six considered variables, a structure with three clusters was chosen (Table 4) characterised by statistically significant differences along the critical dimensions in terms of Internet purchases made by individuals. Thus, a behavioural profile was defined for each cluster characterised by individuals’ participation in the online purchasing process.
To test the statistical significance of the six variables belonging to the clusters, Welch’s test was used (robust tests of equality of means).
Taking into account the results of Welch’s robust test of equality of means for the three clusters according to the values of the variables recorded at the 2012 level (Table 5), the null hypothesis (H0: the means do not differ significantly) is rejected; consequently, the information obtained regarding the characteristics of the clusters (Table 6) is relevant.
Table 6 shows the descriptive statistical parameters associated with the variables under consideration.
Each of the three clusters is characterised by an average value of each variable calculated as the average of the values for the countries in that group (Table 6), indicating a certain online acquisition behaviour.
Analysis of the average values for each of the three groups according to the six variables (Table 6) shows that the highest average values for all six variables associated with cluster A, which includes countries located in northern and western Europe. On the other hand, the lowest average values for all six variables are associated with cluster C, which includes less mature countries in terms of e-commerce, countries there are located in southern and southeastern Europe.
At the 2021 level, after generating the clusters (Figure 2), while the number of states in the first group according to level of development of Internet purchases did not change (Table 7), the number of group B states (adepts) decreased, and that of the states in group C (novices) increased.
In this case, the results of Welch’s robust test of equality of means (Table 8) led to the rejection of the null hypothesis; consequently, the information obtained regarding the characteristics of the clusters at the 2021 level (Table 9) is relevant.
The average values for each of the three clusters according to the six variables at the 2021 level are presented in Table 9. As in 2012, in 2021, cluster A was associated with the highest average values for all six variables, with the lowest mean values for all six variables associated with cluster C.
Comparative analysis of the structures of the groups in terms of level of development of Internet purchases at the 2021 level with those for 2012 revealed a series of changes (Table 10).
Most countries remained in the same cluster for both analysed years, i.e., 2012 and 2021. Thus, we can state that the top five countries have achieved a high degree of maturity in terms of online purchases made by individuals, namely Denmark, Ireland, Netherlands, Finland and Sweden. At the opposite pole are countries located in southern and southeastern Europe, i.e., Bulgaria, Greece, Italy and Romania.
At the 2021 level, Belgium, Germany and Luxembourg moved from the first group in terms of the level of e-commerce development (group A) to group B, with their places now occupied by Spain, Austria and Slovenia from group B. Another change took place in group C, where, along with the four states included in this group in 2012, Portugal, which was previously in group B, was now included.
4.2. Discussion
The main purpose of this article is to examine the gap within the European Union in terms of B2C, specifically online purchases made by individuals considering the main key elements that support them: Internet access, education, Internet use, e-commerce enterprises, customer relationship management and secure transactions.
Comparative analysis of EU countries in terms of e-commerce has become increasingly important as the issue of consolidation and development of a single market continues to become more pressing.
Digital convergence, an important aspect in the process of digital transformation, was analysed for the EU countries in terms of DESI index between 2015 and 2020 [63]. Using sigma and beta convergence methods described in the literature [64,65], researchers demonstrated that economic development plays an important role in eliminating the differences between countries.
The digitisation of trade is a process that started before the COVID-19 pandemic and it is expected to continue more intensively after its end.
In 2021, at the peak of the pandemic, the digital sector had grown in all EU countries, and the main challenge associated with a high level of e-commerce development was the speed of adaptation to a complex ecosystem with the buyer at its centre. Starting from the analysis of the buyers’ needs, including their profile and access to the virtual environment, companies have adapted and integrated their e-commerce offerings.
The pandemic has cultivated a new generation of consumers interested in participating more in the process of marketing products or services, while technological innovations from the field of AI, machine learning and the Internet of Things can be used by companies to make predictions and recommendations.
Along with the opportunities offered by the virtual environment, there are also numerous difficulties. Thus, in order to develop everything necessary in e-commerce, companies required additional investments, especially in digital infrastructure, cyber security and staff with advanced digital skills.
The results of this study highlight the key variables needed to achieve greater adoption of e-commerce by individuals in EU countries. Understanding these variables allows each country either to maintain its position (the case of leaders) or to mobilize its resources and efforts to achieve a certain level for one or more variables so that they can move to a higher cluster (the case of novices).
As shown in Table 10, of the 27 EU countries, 7 have undergone mutations from one cluster to another, i.e., a decrease in the level of e-commerce development in countries such as Belgium, Germany, Luxembourg and Portugal and an increase in the level of e-commerce development in Spain, Austria and Slovenia, moving from an average level to a higher level.
Below, we further comment on the variables that led to these mutations for each country.
In 2021, for Belgium, five of the six analysed variables had values below the cluster A average: PHIA (90% versus 96.88%), PIUI (94% versus 95.50%), PEES and PECRM (31% versus of 32%, respectively) and PIPID (75% versus 79.25%). In 2012, the year in which Belgium was in cluster A, only three of the variables were below the cluster A average: PHIA (76% versus 89.88%), PIUI (82% versus 88.50%) and PIPID (45% versus 62.63%). Although there was an obvious increase in the level of all six variables in the ten years under analysis, the highest percentage increase being recorded for PIPID variable (an increase of 30 percentage points compared to only 16.63% at the level of the average of the states in cluster A), Belgium was relegated to cluster B because the increase in the level of the PEES and PECRM variables was only 7%, which is below the value of the average increase in these variables for the states from cluster A (9%).
In the case of Germany, in 2012 only three of the six variables were below the cluster A average: PTEL (24.4% versus 29.53%), PHIA (89% versus 89.88%) and PIUI (84% versus 88.50%), whereas in the year 2021, all six variables had values below the average of cluster A, four of which were even below the average of cluster B (PTEL, PHIA, PEES and PECRM). The values recorded for the six variables in 2021 compared to the cluster A average were: PTEL (26.9% versus 35.51%), PHIA (93% versus 96.88%), PIUI (92% versus 95.50%), PEES and PECRM (22% versus 32%, respectively) and PIPID (76% versus 79.25%). In the ten analysed years, three of the six variables registered a percentage increase although below the percentage increase in the cluster A average: PTEL (2.5% compared to 5.99%), PHIA (4% compared to 7%) and PIPID (11% compared to 16.63%). However, the variable relating to the percentage of individuals who used the Internet in the last 12 months registered an increase of 8%, i.e., 1 percentage point above the average of cluster A. The PEES and PECRM variables also registered a decrease of 2% compared to 2012.
The third country that was relegated from cluster A in 2012 to cluster B in 2021 is Luxembourg. Only two of the six analysed variables had values below the cluster average in 2021: PEES and PECRM (12% versus 32%). The same variables were also below the cluster A average in 2012 (16% versus 23%). It is noted that whereas in 2012, these values were only 7% less than the average of cluster A, in 2021 the values for these two variables were 20% lower than the average of cluster A and even below the average of the values recorded by these variables in clusters B and C (22.64% and 16.20%). The other four variables registered values above the cluster A average in 2021: PTEL (42.7% compared to 35.51%), PHIA (99% compared to 96.88%), PIUI (99% compared to 95.50%) and PIPID (81% compared to 79.25%). The variables related to individuals who used the Internet in the last 12 months and to households with Internet access reached 99%, with an increase of 7% and 4%, respectively, compared to 2012, and the highest percentage increase of 11% was registered at the level of the variable related to online purchases made by individuals. An approximately equal increase (10.60%) is also noticeable at the level of the population with tertiary education, with a value approximately 5% above the average growth of the variable in the ten years at the level of cluster A. Although it was relegated to cluster B in 2021, Luxembourg registered the highest value for the variable related to households with Internet access (99%), alongside the Netherlands, as well as the highest value for the variable related to individuals who used the Internet in the last 12 months (99%), together with Denmark and Ireland.
Portugal is the only country that, in the ten analysed years, was downgraded to cluster C because of the decrease in the level of e-commerce development. In 2021, all six analysed variables registered values below the average of cluster B: PTEL (26% versus 30.94%), PHIA (92% versus 93.14%), PIUI (83% versus 90.50%), PEES and PECRM (17% versus 22.64%, respectively) and PIPID (52% versus 68.07%). Furthermore, in 2012, the values of these variables were below the average of cluster B, but the percentage differences were smaller, varying between 0.33 percentage points for the PEES and PECRM variables and 10.13 percentage points for the PIPID variable. In 2021, the negative percentage differences increase considerably, varying between 1% for the PHIA variable and 16% for the PIPID variable.
Spain is one of the countries that moved to a higher level in 2021, moving from cluster B in 2012 to cluster A in 2021. In 2012, four of the analysed variables had values below the cluster B average: PHIA (70% compared to 75.73%), PEES and PECRM (14% compared to 15.33%, respectively) and PIPID (30% compared to 32.13%), whereas in 2021, only one variable had a value below the average of cluster B, i.e., the variable related to purchases made on the Internet by individuals (PIPID). All six variables registered percentage increases compared to 2012, five of which experienced increases greater than the percentage increase in average for cluster B: PHIA (27% compared to 17.41%), PIUI (22% compared to 18.70%), PEES and PECRM (14% compared to 7.31%, respectively) and PIPID (37% compared to 35.94%). Although the PIPID variable experienced the largest percentage increase, it remained below the average of cluster B. Although five of the six variables had values below the average of cluster A in 2021, the negative percentage differences were small, varying between 1.11% for the PTEL variable and 4% for the PEES and PECRM variables, except for the PIPID variable, for which the negative difference was 12.25%. Whereas in 2012, 70% of households had access to the Internet, in 2021, 97% of households in Spain had access to the Internet, exceeding the average of cluster A by 0.12%. However, the confidence of Spaniards in online purchases is low (only 67%), an aspect highlighted by the PIPID variable.
In the year 2021, Austria was upgraded from the adepts cluster to the leaders cluster. Two of the variables under analysis had values below the cluster B average: PTEL (30.4% versus 30.94%) and PIPID (63% versus 68.07%). The PTEL variable also had values below the average of cluster B in 2012, but the negative percentage difference was higher: 5.41 percentage points compared to the average of the variable for cluster B. Although in 2021 the negative percentage difference for the PIPID variable was only 5.07%, in 2012, Austria recorded a value of 48%, i.e., 15.87% above the average of cluster B. Therefore, it is noted that although Austrians’ interest in Internet purchases increased by 15% compared to 2012, the increase was lower than the mean of the PIPID variable for cluster B.
Slovenia is the second country in central Europe that, in the ten years under analysis, advanced from cluster B to cluster A, representing the only country with a communist past comprising part of the leaders cluster. It was also the first formerly communist country to join the Eurozone in 2007. In 2012, as well as in 2021, the only variable that had values below the mean of cluster B was the PIUI variable relating to individuals who had used the Internet in the last 12 months. Whereas in 2012, the negative percentage difference was 1.8 percentage points compared to the average of cluster B (70% compared to 71.80%), the difference decreased in 2021, reaching only 0.5 percentage points compared to the average of cluster B (90% versus 90.50%). All the analysed variables registered percentage increases compared to 2012, five of which experienced increases greater than the percentage increase in the cluster B variables average: PTEL (10.90% compared to 9.14%), PIUI (20% compared to 18.70%), PEES and PECRM (11% compared to 7.31%, respectively) and PIPID (37% compared to 35.94%). The only variable that experienced a lower percentage increase than the average percentage increase in the variable for cluster B is the variable related to households with Internet access (PHIA), with a negative percentage difference of only 0.41 percentage points less (17% compared to 17.41%). Compared to the average of the variables for cluster A, in 2021, all six variables had values below the average of the leaders cluster, but the negative percentage differences were small, ranging between 0.88% for the PHIA variable and 8.25% for the PIPID variable.
5. Conclusions
E-commerce development generates additional studies on the state and behaviour of Internet purchases at any level: individual, regional, national and international. Previous studies on the development level of Internet purchases have focused more on identifying the factors that influence Internet purchase behaviour and less on the correlated demand and supply analysis.
To fill the gap in the specialized literature, in this research, we investigated this topic in terms of demand and we analysed it according to Internet access that is a sine qua non condition, the Internet use by individuals and the education level of the population. We also investigated the topic in terms of supply, taking into account the percentage of enterprises with e-commerce sales, as well as the percentage of e-commerce enterprises, customer relationship management and secured transactions
In order to identify the stage of e-commerce adoption by individuals at the level of the European Union, in this paper, we analysed the similarities and differences between 27 EU member countries in terms of online purchases in 2012 and 2021.
In both analysed years, the application of the hierarchical clustering method according to six indicators (Internet purchases by individuals, population with tertiary education level from 15 to 74 years, households with Internet access, individuals who used the Internet in the last 12 months, enterprises with e-commerce sales, e-commerce enterprises, customer relationship management and secured transactions) led to the identification of three clusters with specific profiles and characteristics regarding the adoption of e-commerce for making purchases by individuals as follows:
- Cluster A (leaders): This group includes countries located in northern and western Europe and is characterised by high percentages for all six variables taken into account, which indicates mature markets in terms of B2C e-commerce transactions;
- Cluster B (adepts): This group includes most countries located in central and western Europe, with all six variables showing average values;
- Cluster C (novices): This group includes countries that are less mature in terms of online purchases made by individuals located in southern and southeastern Europe.
The cluster method was used according to [66] in the context of regionalization and globalization, representing a useful tool for decision makers to identify vulnerable countries because market independence can lead to the emergence of a contagion effect.
Evaluation of similarities and disparities between states in terms of Internet purchases made by individuals creates opportunities for digital convergence and the development of efficient policies to support such convergence.
In the virtual environment, companies require a strengthening of digital infrastructure, strong cyber security and the ability to provide access to this type of commerce, which is centred on the needs of customers and which guarantees the quality of traded products and services, in addition to securing transactions.
This article describes an empirical analysis and provides opportunities for competitive advantages, especially for practitioners in the e-commerce field. Our study can provide corporate managers with a clear view of the specific characteristics regarding e-commerce adoption for Internet purchasing by individuals from the EU, which is a key factor in decision making.
Socioeconomic and technological inequalities create important barriers to the sustainable development of e-commerce. The growth of any form of inequality leads to the concentration of decision-making power in privileged countries, which can stimulate tensions in the European Union. The quantification and monitoring of inequalities must be permanently in the sights of the authorities. Moreover, this quantification should not be carried out divided by domains because the regression of one domain can be reflected in the success of another. That is why we consider that it is opportune to find a composite index to quantify inequality in several areas. Thus, a limitation of the current study is the limited number of variables taken into account.
Due to the limitations of data availability, we would like to emphasize the fact that our variable set is not exhaustive in terms of expressing the level of development of Internet purchases by individuals, but we consider that these can efficiently and significantly evaluate Internet purchases by individuals at the level of EU states.
Taking into account the fact that the survey sample is represented only by individuals between the ages of 16 and 74, another limitation of the current research is the fact that it does not cover the entire population; however, this particularization which avoids vulnerable people (children and the elderly) provides a high response rate.
The current research also only covered a certain period, so in order to establish longitudinal trends, it is recommended to update the data.
For future research, discriminant analysis and a composite index can be used for a set of variables related to e-commerce. A composite index approach would also work well with time series data, leading to dynamic analytical insights.
Author Contributions
Conceptualization, A.B. and A.P.; methodology, A.B.; software, A.B.; validation, A.B. and A.T.; formal analysis, A.B. and A.T.; investigation, A.B., A.P. and A.T.; resources, A.P. and A.T.; data curation, A.B.; writing—original draft preparation, A.B. and A.P.; writing—review and editing, A.T.; visualization, A.P. All authors have read and agreed to the published version of the manuscript.
Funding
This research received no external funding.
Data Availability Statement
The data used in this study and the data dictionary are openly available through the Eurostat portal (https://ec.europa.eu/eurostat/web/digital-economy-and-society/data/database accessed on 15 June 2022).
Conflicts of Interest
The authors declare no conflict of interest.
References
- Vulkan, N. Economic implications of agent technology and e-commerce. Econ. J. 1999, 109, 67–90. [Google Scholar] [CrossRef]
- Lefebvre, L.A.; Lefebvre, E. E-commerce and virtual enterprises: Issues and challenges for transition economies. Technovation 2002, 22, 313–323. [Google Scholar] [CrossRef]
- DeLone, W.H.; McLean, E.R. Measuring e-commerce success: Applying the DeLone & McLean information systems success model. Int. J. Electron. Commer. 2004, 9, 31–47. [Google Scholar] [CrossRef]
- Laudon, K.C.; Traver, C.G. E-commerce 2021–2022: Business Technology. Society, 17th ed.; Pearson: Harlow, UK, 2021. [Google Scholar]
- Schneider, G.P. Electronic Commerce, 12th ed.; Cengage Learning: Boston, MA, USA, 2016. [Google Scholar]
- Dearlove, M. The adoption of electronic trading in Western Europe. Comput. Commun. 1994, 17, 369–374. [Google Scholar] [CrossRef]
- Ngai, E.W.T.; Wat, F.K.T. A literature review and classification of electronic commerce research. Inf. Manag. 2002, 39, 415–429. [Google Scholar] [CrossRef]
- Kalakota, R.; Whinston, A.B. Electronic Commerce: A Manager’s Guide; Addison-Wesley Professional: Boston, MA, USA, 1997. [Google Scholar]
- Wareham, J.; Zheng, J.G.; Straub, D. Critical themes in electronic commerce research: A meta-analysis. J. Inf. Technol. 2005, 20, 1–19. [Google Scholar] [CrossRef]
- Turban, E.; Outland, J.; King, D.; Lee, J.K.; Liang, T.P.; Turban, D.C. Electronic Commerce 2018: A Managerial and Social Networks Perspective, 9th ed.; Springer: Cham, Switzerland, 2018. [Google Scholar] [CrossRef]
- Bai, Y.; Li, H. Mapping the evolution of e-commerce research through co-word analysis: 2001–2020. Electron. Commer. Res. Appl. 2022, 55, 101190. [Google Scholar] [CrossRef]
- Semerádová, T.; Weinlich, P. The Broad and Narrow Definition of E-Commerce. In Achieving Business Competitiveness in a Digital Environment; Semerádová, T., Weinlich, P., Eds.; Springer: Cham, Switzerland, 2022; pp. 1–26. [Google Scholar] [CrossRef]
- Chen, S.; He, Q.; Xiao, H. A study on cross-border e-commerce partner selection in B2B mode. Electron. Commer. Res. 2022, 22, 1–21. [Google Scholar] [CrossRef]
- Tang, H.; Lin, X. Curbing shopping cart abandonment in C2C markets—An uncertainty reduction approach. Electron. Mark. 2019, 29, 533–552. [Google Scholar] [CrossRef]
- Song, P.; Liu, Y. An XGBoost algorithm for predicting purchasing behaviour on E-commerce platforms. Tehn. Vjes. 2020, 27, 1467–1471. [Google Scholar] [CrossRef]
- Trzebiński, W.; Marciniak, B. Meaning or importance? E-commerce consumers interest in product features presented in online offerings: The role of self-Relevance and information processing. J. Internet Commer. 2022, 1–20. [Google Scholar] [CrossRef]
- Gong, X.; Razzaq, A.; Wang, W. More Haste, Less Speed: How Update Frequency of Mobile Apps Influences Consumer Interest. J. Theor. Appl. Electron. Commer. Res. 2021, 16, 2922–2942. [Google Scholar] [CrossRef]
- Adam, I.O.; Alhassan, M.D. Social Media and E-Commerce at the Global Level: Do ICT Access and ICT Skills Matter? Int. J. E-Bus. Res. 2021, 17, 1–18. [Google Scholar] [CrossRef]
- He, Y.; Wang, J. A Panel Analysis on the Cross Border E-commerce Trade: Evidence from ASEAN Countries. J. Asian Financ. Econ. Bus. 2019, 6, 95–104. [Google Scholar] [CrossRef]
- Darsono, J.T.; Susana, E.; Prihantono, E.Y.; Kasim, E.S. Strategic policies for small and medium businesses in marketing through e-commerce. Entrep. Sustain. Issues 2019, 7, 1230–1245. [Google Scholar] [CrossRef] [PubMed] [Green Version]
- Singh, T.; Jayashankar, J.V.; Singh, J. E-Commerce in the U.S. and Europe--Is Europe Ready to Compete? Bus. Horiz. 2001, 44, 6–16. [Google Scholar] [CrossRef]
- Javalgi, R.; Ramsey, R. Strategic issues of e-commerce as an alternative global distribution system. Int. Mark. Rev. 2001, 18, 376–391. [Google Scholar] [CrossRef]
- Tassabehji, R. Applying E-Commerce in Business, 1st ed.; Sage Publications: London, UK, 2003. [Google Scholar]
- Ho, S.C.; Kauffman, R.J.; Liang, T.P. A growth theory perspective on B2C e-commerce growth in Europe: An exploratory study. Electron. Commer. Res. Appl. 2007, 6, 237–259. [Google Scholar] [CrossRef]
- Eppright, D.; Hawkins, R. Determinants of emerging e-commerce markets: A developmental perspective. J. Internet Commer. 2009, 8, 113–134. [Google Scholar] [CrossRef]
- Dominici, A.; Boncinelli, F.; Gerini, F.; Marone, E. Determinants of online food purchasing: The impact of socio-demographic and situational factors. J. Retail.Cons. Serv. 2021, 60, 102473. [Google Scholar] [CrossRef]
- Hoang, T.D.L.; Nguyen, H.K.; Nguyen, H.T. Towards an economic recovery after the COVID-19 pandemic: Empirical study on electronic commerce adoption of small and medium enterprises in Vietnam. Manag. Mark. Chall. Knowl. Soc. 2021, 16, 47–68. [Google Scholar] [CrossRef]
- Orji, I.J.; Ojadi, F.; Okwara, U.K. The nexus between e-commerce adoption in a health pandemic and firm performance: The role of pandemic response strategies. J. Bus. Res. 2022, 145, 616–635. [Google Scholar] [CrossRef]
- Mouratidis, K.; Papagiannakis, A. COVID-19, internet, and mobility: The rise of telework, telehealth, e-learning, and e-shopping. Sustain. Cities Soc. 2021, 74, 103182. [Google Scholar] [CrossRef] [PubMed]
- Ciupac-Ulici, M.; Beju, D.-G.; Bresfelean, V.P.; Zanellato, G. Which Factors Contribute to the Global Expansion of M-Commerce? Electronics 2023, 12, 197. [Google Scholar] [CrossRef]
- Scutariu, A.L.; Șuşu, Ș.; Huidumac-Petrescu, C.E.; Gogonea, R.M. A Cluster Analysis Concerning the Behavior of Enterprises with E-Commerce Activity in the Context of the COVID-19 Pandemic. J. Theor. Appl. Electron. Commer. Res. 2022, 17, 47–68. [Google Scholar] [CrossRef]
- Castelo-Branco, I.; Cruz-Jesus, F.; Oliveira, T. Assessing Industry 4.0 readiness in manufacturing: Evidence for the European Union. Comp. Ind. 2019, 107, 22–32. [Google Scholar] [CrossRef]
- Eurostat, Glossary: E-Commerce. Available online: https://ec.europa.eu/eurostat/statistics-explained/index.php?title=Glossary:E-commerce (accessed on 15 December 2022).
- Jędrzejczak-Gas, J.; Barska, A.; Siničáková, M. Level of development of e-commerce in EU countries. Manage 2019, 23, 209–224. [Google Scholar] [CrossRef] [Green Version]
- Ecommerce Europe, European B2C E-Commerce Report 2016. Available online: https://ecommerce-europe.eu/wp-content/uploads/2016/07/European-B2C-E-commerce-Report-2016-Light-Version-FINAL.pdf (accessed on 1 July 2022).
- Eurostat, Online Sales Continue to Grow among EU Enterprises. 2021. Available online: https://ec.europa.eu/eurostat/web/products-eurostat-news/-/ddn-20211228-1 (accessed on 15 September 2022).
- Ecommerce Europe, European E-Commerce Report 2022. Available online: https://ecommerce-europe.eu/wp-content/uploads/2022/06/CMI2022_FullVersion_LIGHT_v2.pdf (accessed on 23 August 2022).
- Alkan, Ö.; Küçükoglu, H.; Tutar, G. Modeling of the factors affecting e-commerce use in turkey by categorical data analysis. Int. J. Adv. Comput. Sci. Appl. 2021, 12, 95–105. [Google Scholar] [CrossRef]
- Pérez-Amaral, T.; Valarezo, Á.; López, R.; Garín-Muñoz, T.; Herguera, Í. E-commerce by individuals in Spain using panel data 2008–2016. Telecommun. Policy 2020, 44, 101888. [Google Scholar] [CrossRef]
- Fernández-Bonilla, F.; Gijón, C.; De la Vega, B. E-commerce in Spain: Determining factors and the importance of the e-trust. Telecommun. Policy 2022, 46, 102280. [Google Scholar] [CrossRef]
- Cheba, K.; Kiba-Janiak, M.; Baraniecka, A.; Kołakowski, T. Impact of external factors on e-commerce market in cities and its implications on environment. Sustain. Cities Soc. 2021, 72, 103032. [Google Scholar] [CrossRef]
- Kawasaki, T.; Wakashima, H.; Shibasaki, R. The use of e-commerce and the COVID-19 outbreak: A panel data analysis in Japan. Transp. Policy 2022, 115, 88–100. [Google Scholar] [CrossRef]
- Garrido Lora, M.; Busquet Duran, J.; Munté Ramos, R.À. De las TIC a las TRIC. Estudio sobre el uso de las TIC y la brecha digital entre adultos y adolescentes en España. Anàl. Quad. Comun. Cult. 2016, 54, 44–57. [Google Scholar] [CrossRef] [Green Version]
- Bayo-Moriones, A.; Lera-López, F. A firm-level analysis of determinants of ICT adoption in Spain. Technovation 2007, 27, 352–366. [Google Scholar] [CrossRef]
- Garín-Muñoz, T.; López, R.; Pérez-Amaral, T.; Herguera, Í.; Valarezo, Á. Models for individual adoption of eCommerce, eBanking and eGovernment in Spain. Telecommun. Policy 2019, 43, 100–111. [Google Scholar] [CrossRef] [Green Version]
- Alderete, M.V. Explaining e-commerce adoption at country level. Int. J. Technol. Learn. Innov. Develop. 2021, 13, 318–340. [Google Scholar] [CrossRef]
- Nath, R.; Akmanligil, M.; Hjelm, K.; Sakaguchi, T.; Schultz, M. Electronic commerce and the internet: Issues, problems, and perspectives. Int. J. Inf. Manag. 1998, 18, 91–101. [Google Scholar] [CrossRef]
- Sturgeon, T.J. Upgrading strategies for the digital economy. Glob. Strateg. J. 2021, 11, 34–57. [Google Scholar] [CrossRef]
- Blut, M.; Wang, C. Technology readiness: A meta-analysis of conceptualizations of the construct and its impact on technology usage. J. Acad. Mark. Sci. 2020, 48, 649–669. [Google Scholar] [CrossRef] [Green Version]
- Bălăcescu, A.; Pătrașcu, A.; Păunescu, L.M. Adaptability to Teleworking in European Countries. Amfiteatru Econ. 2021, 23, 683–699. [Google Scholar] [CrossRef]
- van Kessel, R.; Wong, B.L.H.; Rubinić, I.; O’Nuallain, E.; Czabanowska, K. Is Europe prepared to go digital? Making the case for developing digital capacity: An exploratory analysis of Eurostat survey data. PLoS Dig. Health 2022, 1, e0000013. [Google Scholar] [CrossRef]
- dos Reis, A.D.; Machado, M.A. E-commerce in Emerging Markets: Internationalization factors of Brazilian footwear in South America. Rev. Gestão Tecn. 2020, 20, 116–140. [Google Scholar] [CrossRef]
- Jaković, B.; Ćurlin, T.; Miloloža, I. Enterprise digital divide: Website e-commerce functionalities among European Union Enterprises. Bus. Syst. Res. 2021, 12, 197–215. [Google Scholar] [CrossRef]
- Karczmarczyk, A.; Wątróbski, J.; Jankowski, J.; Ziemba, E. Comparative study of ICT and SIS measurement in Polish households using a MCDA-based approach. Proc. Comp. Sci. 2019, 159, 2616–2628. [Google Scholar] [CrossRef]
- Končar, J.; Grubor, A.; Vučenović, S.; Marić, R. Exploring E-retailing in the Danube Region countries: A study on internet purchasing. J. Retail. Cons. Serv. 2021, 59, 102383. [Google Scholar] [CrossRef]
- Lucero Ortiz, A.; Rodríguez, J.C.; Gómez, M. E-commerce Development in Europe: A Panel Data Analysis 2003–2017. E&M Econ. Manag. 2020, 23, 89–101. [Google Scholar] [CrossRef]
- Eurostat, E-Commerce Statistics. 2022. Available online: https://ec.europa.eu/eurostat/statistics-explained/index.php?title=E-commerce_statistics (accessed on 15 June 2022).
- Eurostat, ICT Usage in Households and by Individuals. Available online: https://ec.europa.eu/eurostat/cache/metadata/en/isoc_i_esms.htm#stat_pres1663939007812 (accessed on 10 October 2022).
- European Commission, Europe’s Digital Decade: Digital Targets for 2030. Available online: https://commission.europa.eu/strategy-and-policy/priorities-2019-2024/europe-fit-digital-age/europes-digital-decade-digital-targets-2030_en (accessed on 15 October 2022).
- King, R.S. Cluster Analysis and Data Mining: An Introduction; Mercury Learning and Information: Dulles, VA, USA, 2015. [Google Scholar]
- Zaharia, M.; Pătrașcu, A.; Gogonea, M.R.; Tănăsescu, A.; Popescu, C. A cluster design on the influence of energy taxation in shaping the new EU-28 economic paradigm. Energies 2017, 10, 257. [Google Scholar] [CrossRef] [Green Version]
- Scitovski, R.; Sabo, K.; Martínez-Álvarez, F.; Ungar, Š. Cluster Analysis and Applications; Springer: Cham, Switzerland, 2021. [Google Scholar] [CrossRef]
- Andrei, J.V.; Chivu, L.; Sima, V.; Gheorghe, I.G.; Nancu, D.; Duică, M. Investigating the digital convergence in European Union: An econometric analysis of pitfalls and pivots of digital economic transformation. Econ. Res.-Ekon. Istraž. 2022, 1–27. [Google Scholar] [CrossRef]
- Barro, R.J.; Sala-i-Martin, X. Convergence. J. Pol. Econ. 1992, 100, 223–251. [Google Scholar] [CrossRef]
- Barro, R.J.; Sala-i-Martin, X. Technological diffusion, convergence, and growth. J. Econ. Grow. 1997, 2, 1–26. [Google Scholar] [CrossRef]
- International Monetary Fund. Enhancing surveillance: Interconnectedness and clusters–background paper. Policy. Paper 2012, 15, 1–27. [Google Scholar] [CrossRef]
Figure 1.
Cluster generation dendrogram corresponding to 2012.

Figure 2.
Cluster generation dendrogram corresponding to 2021.


Table 1.
Internet purchases, especially, in EU countries, as well as in non-EU countries.
| Reference | Objective | Type of Analysis |
|---|---|---|
| Ho et al. [24] | Analysis of e-commerce development in seventeen European countries | Panel regression model applied to data collected from seventeen European countries between 2000 and 2004 |
| Eppright and Hawkins [25] | Analysis of effects of different factors on the growth of emerging e-commerce markets | Regression analysis performed on twenty-five product categories sold online in 2000 in the US |
| Dominici et al. [26] | Analysis of factors that influence Internet food purchases by individuals from Italy | Logit analysis performed on data collected in 2016 from Italy |
| Alkan et al. [38] | Identifying the factors that influence the Internet purchases made by individuals in Turkey | Multinomial logistic regression analysis and multinomial probit regression analysis conducted on data collected from Turkish households between 2014 and 2018 |
| Pérez-Amaral et al. [39] | Assessing the differences in e-commerce adoption in Spain | Panel logistic regression techniques applied to data collected in Spain between 2008 and 2016 |
| Fernández-Bonilla et al. [40] | Identifying the factors that affect e-commerce development in Spain | Logit analysis of data collected in 2014 and in 2019 |
| Cheba et al. [41] | Detecting the relationships between factors that have a strong impact on the sustainable development of e-commerce in EU cities | Promethee technique, a multicriteria decision method, was used on data collected in 2018 from EU countries |
| Kawasaki et al. [42] | Analysis of consumer behavioural changes toward e-commerce in Japan | Panel data analysis applied to data collected in November 2020 from Japan |
| Garrido-Lora et al. [43] | Study of ICT use in Spain by adults and children | Qualitative analysis performed by fourteen researchers from five different universities in Spain |
| Bayo-Moriones and Lera-López [44] | Analysis of factors that determine ICT adoption in Spain | Tobit regression model applied to data collected in Spain in 2002 |
| Garín-Muñoz et al. [45] | Identifying the factors that influence individuals’ decisions regarding e-commerce | Logistic regression techniques performed on data collected in 2016 from 16,209 respondents |
| Alderete [46] | Analysis of factors that determine e-commerce adoption in Spain | Statistical analysis of data collected from international institutions in 2018 |
| dos Reis and Machado [52] | Assessing the factors that determine the development of e-commerce in South America | Qualitative analysis of data taken from footwear producers in Brazil in 2016 |
| Jaković et al. [53] | Detecting the disparities in e-commerce functionalities among EU countries | K-means cluster analysis performed on Eurostat data for the year 2019 regarding enterprises from twenty-eight European countries |
| Karczmarczyka et al. [54] | Analysis of ICT adoption in Polish households | An analytic hierarchy process was used to assess data collected from 679 polish households in 2016 |
| Končar et al. [55] | Assessing the differences in Internet purchases of consumers from Danube region countries | Frequency analysis was performed on data obtained in 2019 from 819 respondents |
| Lucero Ortiz et al. [56] | Study of e-commerce development in Europe | Panel data analysis of data collected between 2003 and 2017 from European countries |
Table 2.
List of used variables.
| Indicator | Signification | Unit |
|---|---|---|
| PIPID | Percentage of Internet purchases by individuals. | % |
| PTEL | Percentage of population with tertiary education level from 15 to 74 years. | % |
| PHIA | Percentage of households with Internet access. | % |
| PIUI | Percentage of individuals who used the Internet in the last 12 months. | % |
| PEES | Percentage of enterprises with e-commerce sales. | % |
| PECRM | Percentage of e-commerce enterprises, customer relationship management and secured transactions. | % |
Table 3.
Characteristics of the analysed variables.
| Variable | Range | Min | Max | Mean | Std. Dev. | Skewness | Kurtosis | VC |
|---|---|---|---|---|---|---|---|---|
| PTEL | 30.60 | 12.60 | 43.20 | 27.00 | 7.16 | −0.10 | −0.93 | 26.53 |
| PHIA | 33.00 | 66.00 | 99.00 | 86.37 | 7.94 | −0.55 | −0.51 | 9.19 |
| PIUI | 49.00 | 50.00 | 99.00 | 82.45 | 10.63 | −0.57 | −0.28 | 12.89 |
| PEES | 35.00 | 5.00 | 40.00 | 19.60 | 7.40 | 0.38 | −0.41 | 37.75 |
| PECRM | 35.00 | 5.00 | 40.00 | 19.60 | 7.40 | 0.38 | −0.41 | 37.75 |
| PIPID | 86.00 | 5.00 | 91.00 | 51.24 | 20.03 | −0.13 | −0.94 | 39.08 |
Table 4.
Structure of the groups of EU member states in terms of the development level of Internet purchases by individuals in 2012.
Table 4.
Structure of the groups of EU member states in terms of the development level of Internet purchases by individuals in 2012.
| Group | States |
|---|---|
| A (Leaders) | Belgium, Denmark, Germany, Ireland, Luxembourg, Netherlands, Finland and Sweden |
| B (Adepts) | Czechia, Estonia, Spain, France, Croatia, Cyprus, Latvia, Lithuania, Hungary, Malta, Austria, Poland, Portugal, Slovenia and Slovakia |
| C (Novices) | Bulgaria, Greece, Italy and Romania |
Table 5.
Welch’s robust test of equality of means for 2012 clusters.
| Variable | Statistics | df1 | df2 | Sig. |
|---|---|---|---|---|
| PTEL | 15.856 | 2 | 8.601 | 0.001 |
| PHIA | 21.629 | 2 | 9.011 | 0.000 |
| PIUI | 75.752 | 2 | 11.489 | 0.000 |
| PEES | 48.690 | 2 | 13.727 | 0.000 |
| PECRM | 48.690 | 2 | 13.727 | 0.000 |
| PIPID | 42.493 | 2 | 10.239 | 0.000 |
Table 6.
Average characteristics of groups by level of development of Internet purchases in 2012.
| Cluster | Variable | Mean | Std. Deviation | Std. Error | 95% Confidence Interval of Mean | |
|---|---|---|---|---|---|---|
| Lower | Upper | |||||
| A | PTEL | 29.53 | 3.09 | 1.09 | 26.94 | 32.11 |
| PHIA | 89.88 | 6.62 | 2.34 | 84.34 | 95.41 | |
| PIUI | 88.50 | 5.88 | 2.08 | 83.58 | 93.42 | |
| PEES | 23.00 | 4.07 | 1.44 | 19.60 | 26.40 | |
| PECRM | 23.00 | 4.07 | 1.44 | 19.60 | 26.40 | |
| PIPID | 62.63 | 11.15 | 3.94 | 53.31 | 71.94 | |
| B | PTEL | 21.81 | 6.18 | 1.60 | 18.38 | 25.23 |
| PHIA | 75.73 | 5.09 | 1.31 | 72.91 | 78.55 | |
| PIUI | 71.80 | 6.98 | 1.80 | 67.93 | 75.67 | |
| PEES | 15.33 | 5.31 | 1.37 | 12.39 | 18.28 | |
| PECRM | 15.33 | 5.31 | 1.37 | 12.39 | 18.28 | |
| PIPID | 32.13 | 11.36 | 2.93 | 25.84 | 38.43 | |
| C | PTEL | 16.65 | 4.53 | 2.26 | 9.45 | 23.85 |
| PHIA | 69.25 | 3.95 | 1.97 | 62.97 | 75.53 | |
| PIUI | 54.75 | 3.40 | 1.70 | 49.33 | 60.17 | |
| PEES | 6.75 | 1.71 | 0.85 | 4.03 | 9.47 | |
| PECRM | 6.75 | 1.71 | 0.85 | 4.03 | 9.47 | |
| PIPID | 12.75 | 6.95 | 3.47 | 1.70 | 23.80 | |
Table 7.
The structure of the groups of EU member states in terms of the development level of Internet purchases by individuals in 2021.
Table 7.
The structure of the groups of EU member states in terms of the development level of Internet purchases by individuals in 2021.
| Group | States |
|---|---|
| A (Leaders) | Denmark, Ireland, Spain, Netherlands, Austria, Slovenia, Finland and Sweden |
| B (Adepts) | Belgium, Czechia, Germany, Estonia, France, Croatia, Cyprus, Latvia, Lithuania, Luxembourg, Hungary, Malta, Poland and Slovakia |
| C (Novices) | Bulgaria, Greece, Italy, Romania and Portugal |
Table 8.
Welch’s robust test of equality of means for 2021 clusters.
| Variable | Statistics | df1 | df2 | Sig. |
|---|---|---|---|---|
| PTEL | 9.376 | 2 | 10.795 | 0.004 |
| PHIA | 20.832 | 2 | 12.017 | 0.000 |
| PIUI | 18.525 | 2 | 10.442 | 0.000 |
| PEES | 19.652 | 2 | 13.201 | 0.000 |
| PECRM | 19.652 | 2 | 13.201 | 0.000 |
| PIPID | 16.784 | 2 | 9.854 | 0.001 |
Table 9.
Average characteristics of groups according to level of development of Internet purchases in 2021.
Table 9.
Average characteristics of groups according to level of development of Internet purchases in 2021.
| Cluster | Variable | Mean | Std. Deviation | Std. Error | 95% Confidence Interval of Mean | |
|---|---|---|---|---|---|---|
| Lower | Upper | |||||
| A | PTEL | 35.51 | 3.94 | 1.39 | 32.22 | 38.81 |
| PHIA | 96.88 | 1.55 | 0.55 | 95.58 | 98.17 | |
| PIUI | 95.50 | 3.12 | 1.10 | 92.89 | 98.11 | |
| PEES | 32.00 | 5.15 | 1.82 | 27.69 | 36.31 | |
| PECRM | 32.00 | 5.15 | 1.82 | 27.69 | 36.31 | |
| PIPID | 79.25 | 10.93 | 3.86 | 70.12 | 88.38 | |
| B | PTEL | 30.94 | 7.24 | 1.93 | 26.76 | 35.12 |
| PHIA | 93.14 | 2.21 | 0.59 | 91.86 | 94.42 | |
| PIUI | 90.50 | 3.90 | 1.04 | 88.25 | 92.75 | |
| PEES | 22.64 | 6.73 | 1.80 | 18.76 | 26.53 | |
| PECRM | 22.64 | 6.73 | 1.80 | 18.76 | 26.53 | |
| PIPID | 68.07 | 8.44 | 2.26 | 63.20 | 72.95 | |
| C | PTEL | 22.20 | 6.01 | 2.69 | 14.73 | 29.67 |
| PHIA | 91.40 | 1.52 | 0.68 | 89.52 | 93.28 | |
| PIUI | 82.40 | 4.04 | 1.81 | 77.39 | 87.41 | |
| PEES | 16.20 | 3.70 | 1.66 | 11.60 | 20.80 | |
| PECRM | 16.20 | 3.70 | 1.66 | 11.60 | 20.80 | |
| PIPID | 45.60 | 9.45 | 4.23 | 33.87 | 57.33 | |
Table 10.
Comparative analysis of the structure of the groups of EU states regarding the level of development of Internet purchases by individuals between 2012 and 2021.
Table 10.
Comparative analysis of the structure of the groups of EU states regarding the level of development of Internet purchases by individuals between 2012 and 2021.
| Cluster | EU Member States | |
|---|---|---|
| 2012 | 2021 | |
| A (Leaders) | Belgium, Denmark, Germany, Ireland, Luxembourg, Netherlands, Finland and Sweden | Denmark, Ireland, Spain, Netherlands, Austria, Slovenia, Finland and Sweden |
| B (Adepts) | Czechia, Estonia, Spain, France, Croatia, Cyprus, Latvia, Lithuania, Hungary, Malta, Austria, Poland, Portugal, Slovenia and Slovakia | Belgium, Czechia, Germany, Estonia, France, Croatia, Cyprus, Latvia, Lithuania, Luxembourg, Hungary, Malta, Poland and Slovakia |
| C (Novices) | Bulgaria, Greece, Italy and Romania | Bulgaria, Greece, Italy, Romania and Portugal |
Disclaimer/Publisher’s Note: The statements, opinions and data contained in all publications are solely those of the individual author(s) and contributor(s) and not of MDPI and/or the editor(s). MDPI and/or the editor(s) disclaim responsibility for any injury to people or property resulting from any ideas, methods, instructions or products referred to in the content. |
© 2023 by the authors. Licensee MDPI, Basel, Switzerland. This article is an open access article distributed under the terms and conditions of the Creative Commons Attribution (CC BY) license (https://creativecommons.org/licenses/by/4.0/).
Share and Cite
MDPI and ACS Style
Bălăcescu, A.; Pătrașcu, A.; Tănăsescu, A. Analysis of Disparities in Internet Purchases by Individuals at the EU State Level. Electronics 2023, 12, 982. https://doi.org/10.3390/electronics12040982
AMA Style
Bălăcescu A, Pătrașcu A, Tănăsescu A. Analysis of Disparities in Internet Purchases by Individuals at the EU State Level. Electronics. 2023; 12(4):982. https://doi.org/10.3390/electronics12040982
Chicago/Turabian StyleBălăcescu, Aniela, Aurelia Pătrașcu, and Ana Tănăsescu. 2023. "Analysis of Disparities in Internet Purchases by Individuals at the EU State Level" Electronics 12, no. 4: 982. https://doi.org/10.3390/electronics12040982
Note that from the first issue of 2016, this journal uses article numbers instead of page numbers. See further details here.