1. Introduction
Lithium-ion batteries have been widely used in many applications, such as electric vehicles, portable devices, and so forth. Compared with traditional batteries, lithium-ion batteries have a larger capacity, higher safety performance, and a longer service life [
1]. The state of charge (
SOC) has been one of the most basic and important functions in the Battery Management System (BMS), playing a decisive role in battery performance and safety, while enabling the battery power and usage to be ascertained more quickly and clearly. Accordingly, how to effectively estimate the power battery charge state is a very important issue, which can help ensure the efficient and safe operation of power batteries [
2].
Traditional
SOC estimation methods are mainly divided into the ampere–time integration method, open-circuit voltage method, data-driven method, and the model method [
3]. When using the ampere–time integration method, it is difficult to obtain the initial value of the
SOC, which may easily form cumulative errors and is not suitable for working conditions [
4]. The open-circuit voltage method requires the battery to be resting and in equilibrium, which is not suitable for online measurement of the
SOC [
5]. The data-driven method requires a large amount of training data, and estimation accuracy is greatly influenced by the training sample and method [
6]. Meanwhile, the modeling method considers the battery as a system, achieving the identification of the state space by modeling and estimating the lithium-ion battery
SOC by carrying out discrete recursion of the state space. According to the different methods of parameters, identification can be divided into two approaches: the time-domain equivalent circuit model and frequency-domain equivalent circuit model [
7]. Among them, the time-domain equivalent circuit model is divided into the internal resistance model (Rint model), the Davinan equivalent circuit model (Thevenin model), and the multi-order Resistor-Capacitance (RC) model. However, the time-domain equivalent circuit model has certain problems, such as low accuracy, unsuitability for long time simulation, and having complex models [
5]. The frequency-domain equivalent circuit model, which is also known as the electrochemical impedance model, is an adaptive model that is based on the electrochemical kinetic characteristics of a lithium-ion battery system. This is characterized by the electrochemical impedance spectroscopy (EIS) in order to correspond to circuit elements, which encompasses the electrochemical model and the time-domain equivalent circuit model. The electrochemical impedance spectroscopy (EIS) is a nondestructive parameter measurement and an effective method for determining the dynamic behavior of the battery. The measurement of the EIS of the battery can be divided into an online and offline measurement. The online measurement method mainly applies a small amplitude sine wave voltage to the lithium-ion battery through the BMS, so that the battery system produces a sine wave current response. The change of the ratio of the excitation voltage to the response current is the impedance spectrum of the electrochemical system. The offline measurement method uses a professional electrochemical impedance meter to measure the battery impedance spectrum, which requires offline measurements and has a high detection accuracy. The electrochemical impedance spectrum (EIS) is able to clearly reflect the characteristics of the batteries’ spectrum, and thus, analyzes the dynamic characteristics and kinetic processes inside the battery.
According to the literature [
8], the relationship between the
SOC and the impedance phase with temperature has been established using the battery impedance phase at a specific frequency as the
SOC estimation parameter combined with a linear fitting algorithm. Accordingly, it has shown to provide a novel perspective for the
SOC estimation of lithium iron phosphate batteries and can provide a theoretical basis for the application of EIS-based
SOC estimation algorithms in vehicles. However, the study had errors in the temperature measurement, which led to large errors in the
SOC estimation. In another study [
9], parameters in the second-order RC equivalent circuit model were identified using offline parameter identification and online parameter identification with recursive least squares and a forgetting factor, respectively. Moreover, the extended Kalman filter method was used to achieve the estimation of a batteries’
SOC. However, it did not take into account the effects of the external temperature and noise variations in the EKF algorithm on the
SOC estimation during the estimation. One study [
10] developed and trained a neural network model to estimate the state of charge of the battery using the results of the batteries’ discharge current and electrochemical impedance spectrum. However, its estimation accuracy was dependent on the number of neurons in the hidden layer. Moreover, this method attained an estimation of the
SOC solely based on a single neural network, without considering the problem of dynamic changes of the battery parameters due to aging during the whole life-cycle of the battery. The parameters of the model change according to the usage conditions (different aging degrees and working conditions).
In order to solve the bottleneck of a single electrochemical impedance spectrum model algorithm in the
SOC estimation, the Interacting Multiple Model (IMM) algorithm can better describe the system’s uncertainty caused by dynamic changes in the model parameters. In addition, the model can be added, subtracted, or changed at any time according to the actual situation, with a strong adaptive variable structure capability. Currently, IMM has been used in battery
SOC estimation, and [
11] two different parameters of the Davinan equivalent circuit have been used to describe the dynamic characteristics of lithium-ion batteries, which then utilized IMM-EKF and traditional EKF for a battery
SOC estimation. The corresponding results demonstrated that the accuracy of the
SOC values estimated based on the IMM-EKF algorithm is much higher than that of traditional EKF. Another study [
12] employed IMM combined with the Unscented Kalman Filter (UKF) and applied a genetic algorithm in order to optimize the battery model with different parameter space states for the battery
SOC estimation, whose results were found to be more accurate. Additionally, another study [
13] showed that for issues pertaining to when a single-model cannot capture the dynamic changes of the battery at different temperatures, a joint algorithm of IMM and the Square Root Unscented Kalman Filter (SRUKF) was used to achieve an accurate estimation of the battery
SOC at different temperatures based on the first-order Davinan equivalent circuit. One study [
14] also demonstrated that the parameters of the second-order RC battery equivalent model can be identified online using the recursive least squares method with a forgetting factor, in which the identified parameters were simulated jointly with the IMM-UKF algorithm to achieve an accurate estimation of the battery
SOC at different discharge multipliers. Moreover, in [
15], the parameters of the stable fusion model have also been determined based on the assumption of a normal distribution, for which the Proportional-integral observer (PIO) and Proportional-integral-differential observer (PIDO) fusion models jointly estimated the battery
SOC, showing that the estimation results were more accurate and noise-resistant under different aging width temperatures. In a separate study [
16], a first-order RC equivalent circuit model combined with the Preisach discrete model was established, where the FRISCH scheme was used to estimate and filter noise. Finally, the extended Kalman filter combined with the traceless Kalman filter was used to achieve real-time parameter updates and an accurate estimation of the batteries’ single
SOC. The aforementioned results show that the accuracy and robustness of the battery
SOC estimation can be improved to a certain extent by using the traditional IMM model combined with an improved algorithm of Kalman filter.
In summary, this paper proposes an IMM filtering algorithm based on the electrochemical impedance spectrum and combines it with UKF to achieve the accurate estimation of the Li-ion battery. As previously mentioned, this is done in order to address issues in which the single-model filtering algorithm has to deal with dynamic changes of the parameters of the equivalent circuit model of the battery, which can result in a poor single-model filtering accuracy and a difficult filtering divergence due to the different states of the Li-ion battery under various aging conditions of the equivalent circuit model, thereby affecting the SOC estimation accuracy. UKF can estimate the charge state statistics of a Li-ion battery in real time by introducing a Markov chain state transfer probability matrix. Moreover, it can be combined with the electrochemical impedance spectrum model in the frequency domain so as to reflect the internal dynamic characteristics of a Li-ion battery accurately and intuitively. A filtering algorithm using UKF may also be able to better approximate the nonlinear characteristics of the SOC estimation with moderate computational effort. Accordingly, the final experiments and simulations show that the IMM-UKF algorithm can achieve an effective estimation of the battery SOC while improving the convergence speed of the filtering algorithm and ensuring the accuracy of the SOC estimation, even when the state parameters of the lithium-ion battery are uncertain.
3. Interactive Multi-Model Algorithm Based on the Electrochemical Impedance Spectrum Model
Suppose the battery had r
SOC estimation models, which can be described by a set, i.e.,
, where the system equation of state and measurement equation of the
jth model is:
where
is the state variable of the system,
is the observed variable of the system,
and
are nonlinear functions, respectively,
is the process noise matrix of the system, and
is the measurement noise matrix of the system, and both conform to the Gaussian distribution with variances
and
, respectively, and both are known. Meanwhile, each model contained a separate UKF to track its state, in which the probability of each model was adjusted in real time using the hidden Markov chain. In order to improve the adaptive and self-learning capability of the algorithm, an unsupervised learning method was used to estimate the parameters of the hidden Markov model and establish a time-varying hidden Markov probability transfer matrix that can be corrected in real time, which was adopted the BaumWelch algorithm and the estimated probability transfer matrix
as [
21].
is the probability of the model at the time, and is the probability that the model was transferred from, at the time. To ensure the accuracy and real time nature of the model, the probability transfer matrix at the time was used as the current transfer probability.
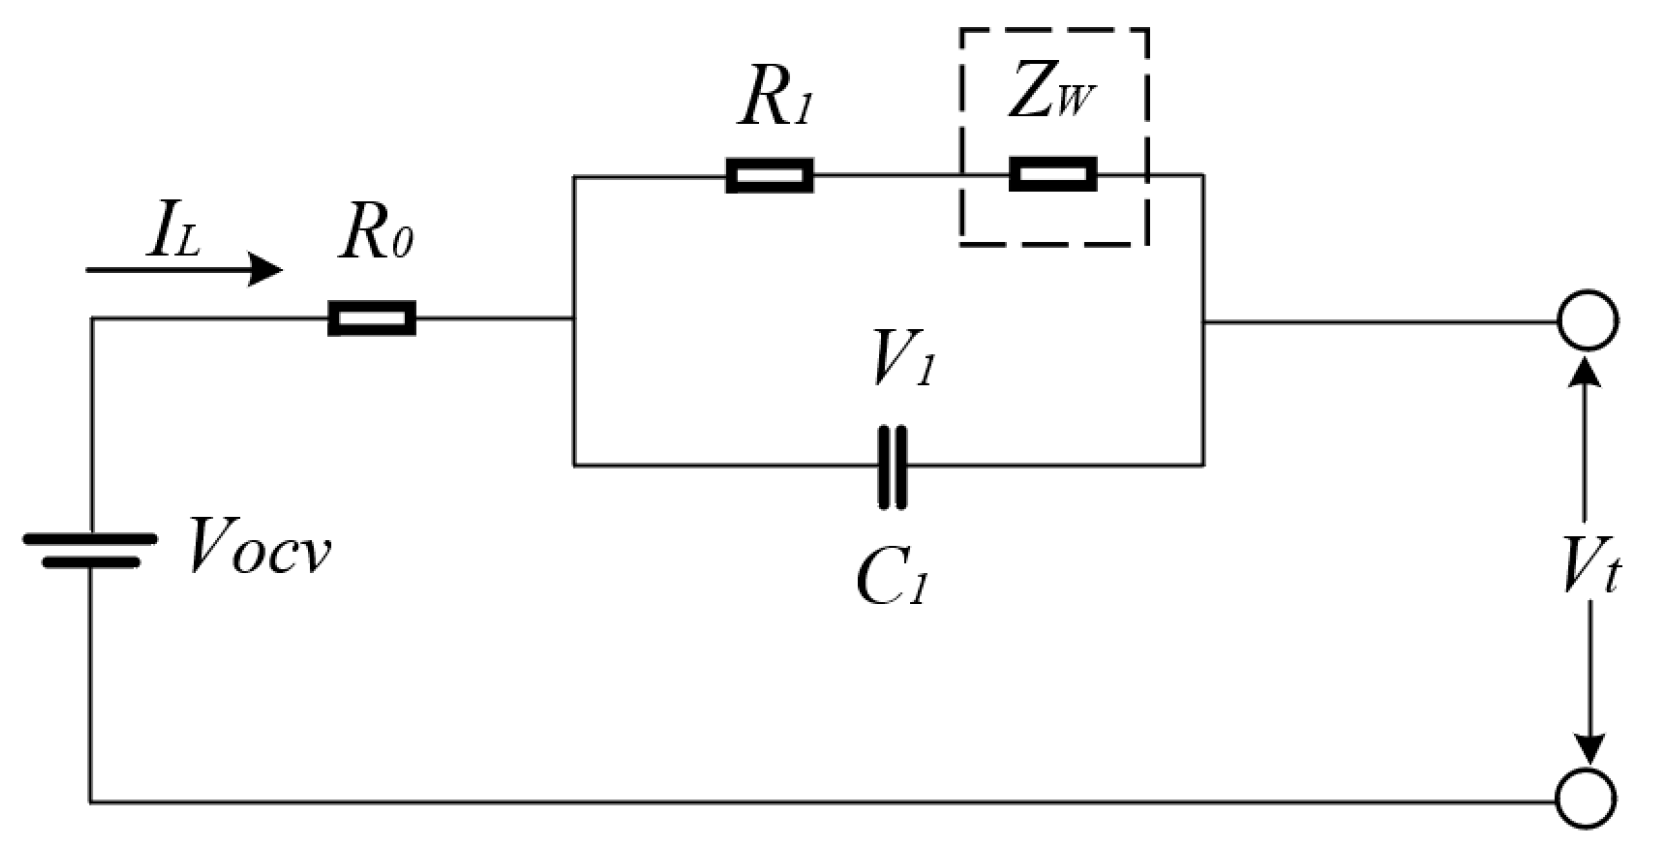
In
Figure 3, the Warburg impedance could not be easily measured due to its variation with frequency. Moreover, the resistance value was too small when compared with the resistance to be negligible. As seen in
Figure 3, the electrochemical impedance spectrum equivalent circuit yielded the cell terminal voltage
as:
and are positive when charging and negative when discharging.
The voltages across capacitor
are:
SOC can be calculated as:
where
is the initial state of
,
is the Coulomb efficiency, and
is the rated capacity of the battery.
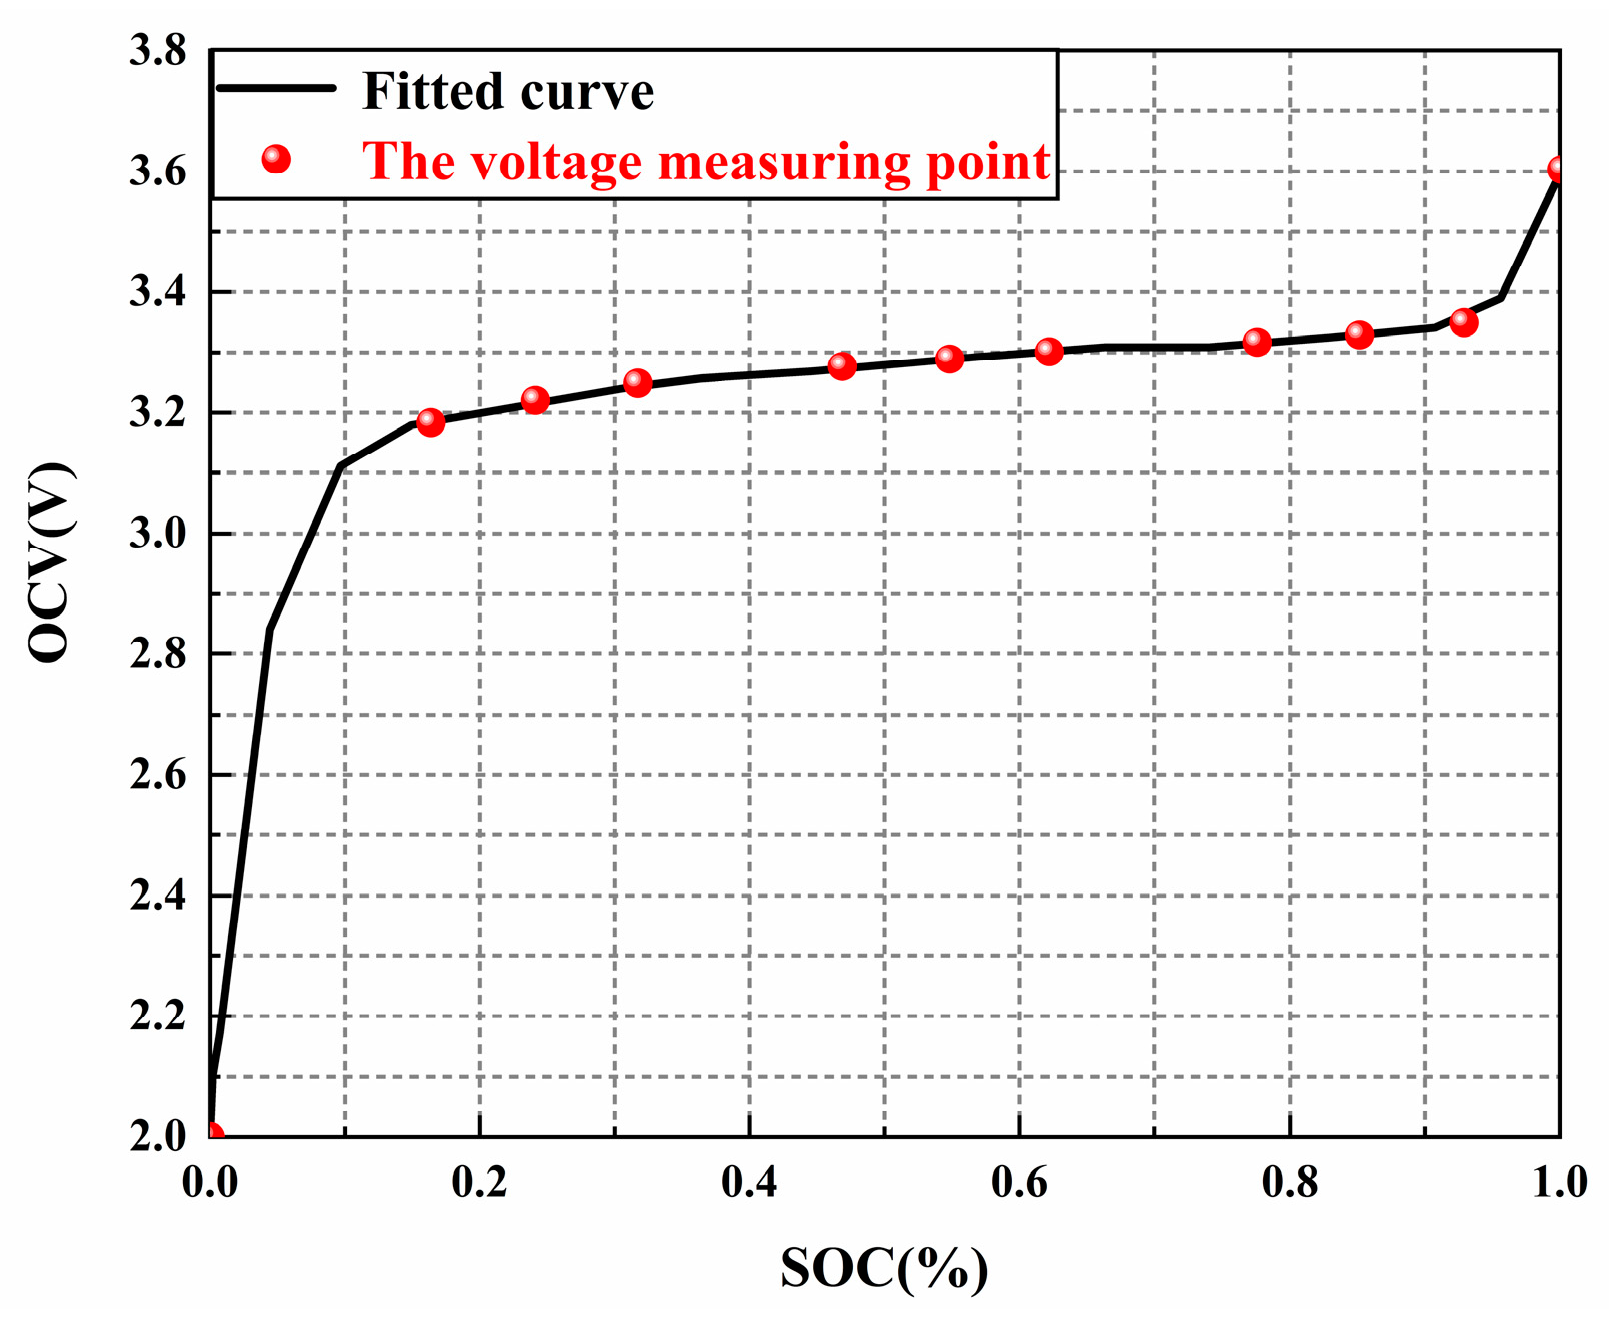
The open-circuit voltage
of the battery was basically equal to the electric potential of the battery, which is an important parameter that characterizes the energy of the battery. In addition, a functional relationship exists with the batteries’ state of charge (state of charge,
SOC), which can be expressed as:
This study used the constant current discharge method in order to fit the equation of the 9th order matrix to
and
as:
The obtained
curve can be shown in
Figure 5 [
22]:
Combining the discrete forms of (15), (16), and (17), the battery state equation and measurement equation can be obtained as:
where
,
.
The state variable is , the control variable is , and the measurement variable is .
In summary, and combined with the electrochemical impedance spectrum equivalent circuit model in
Section 2, the equation of state and the observation equation matrix coefficients of the cell for any first model are thus:
Comparing Equation (14), the coefficients , , , and of the equation were then determined, after which the estimated value of the was calculated.
During the initialization of the equations, the initialization parameters included the state transfer probability matrix in the IMM, the probability matrix μ of the model, coefficients A, B, C, the covariance matrix of the state, and the measurement equations, which were incorporated into the estimation algorithm of IMM-UKF.
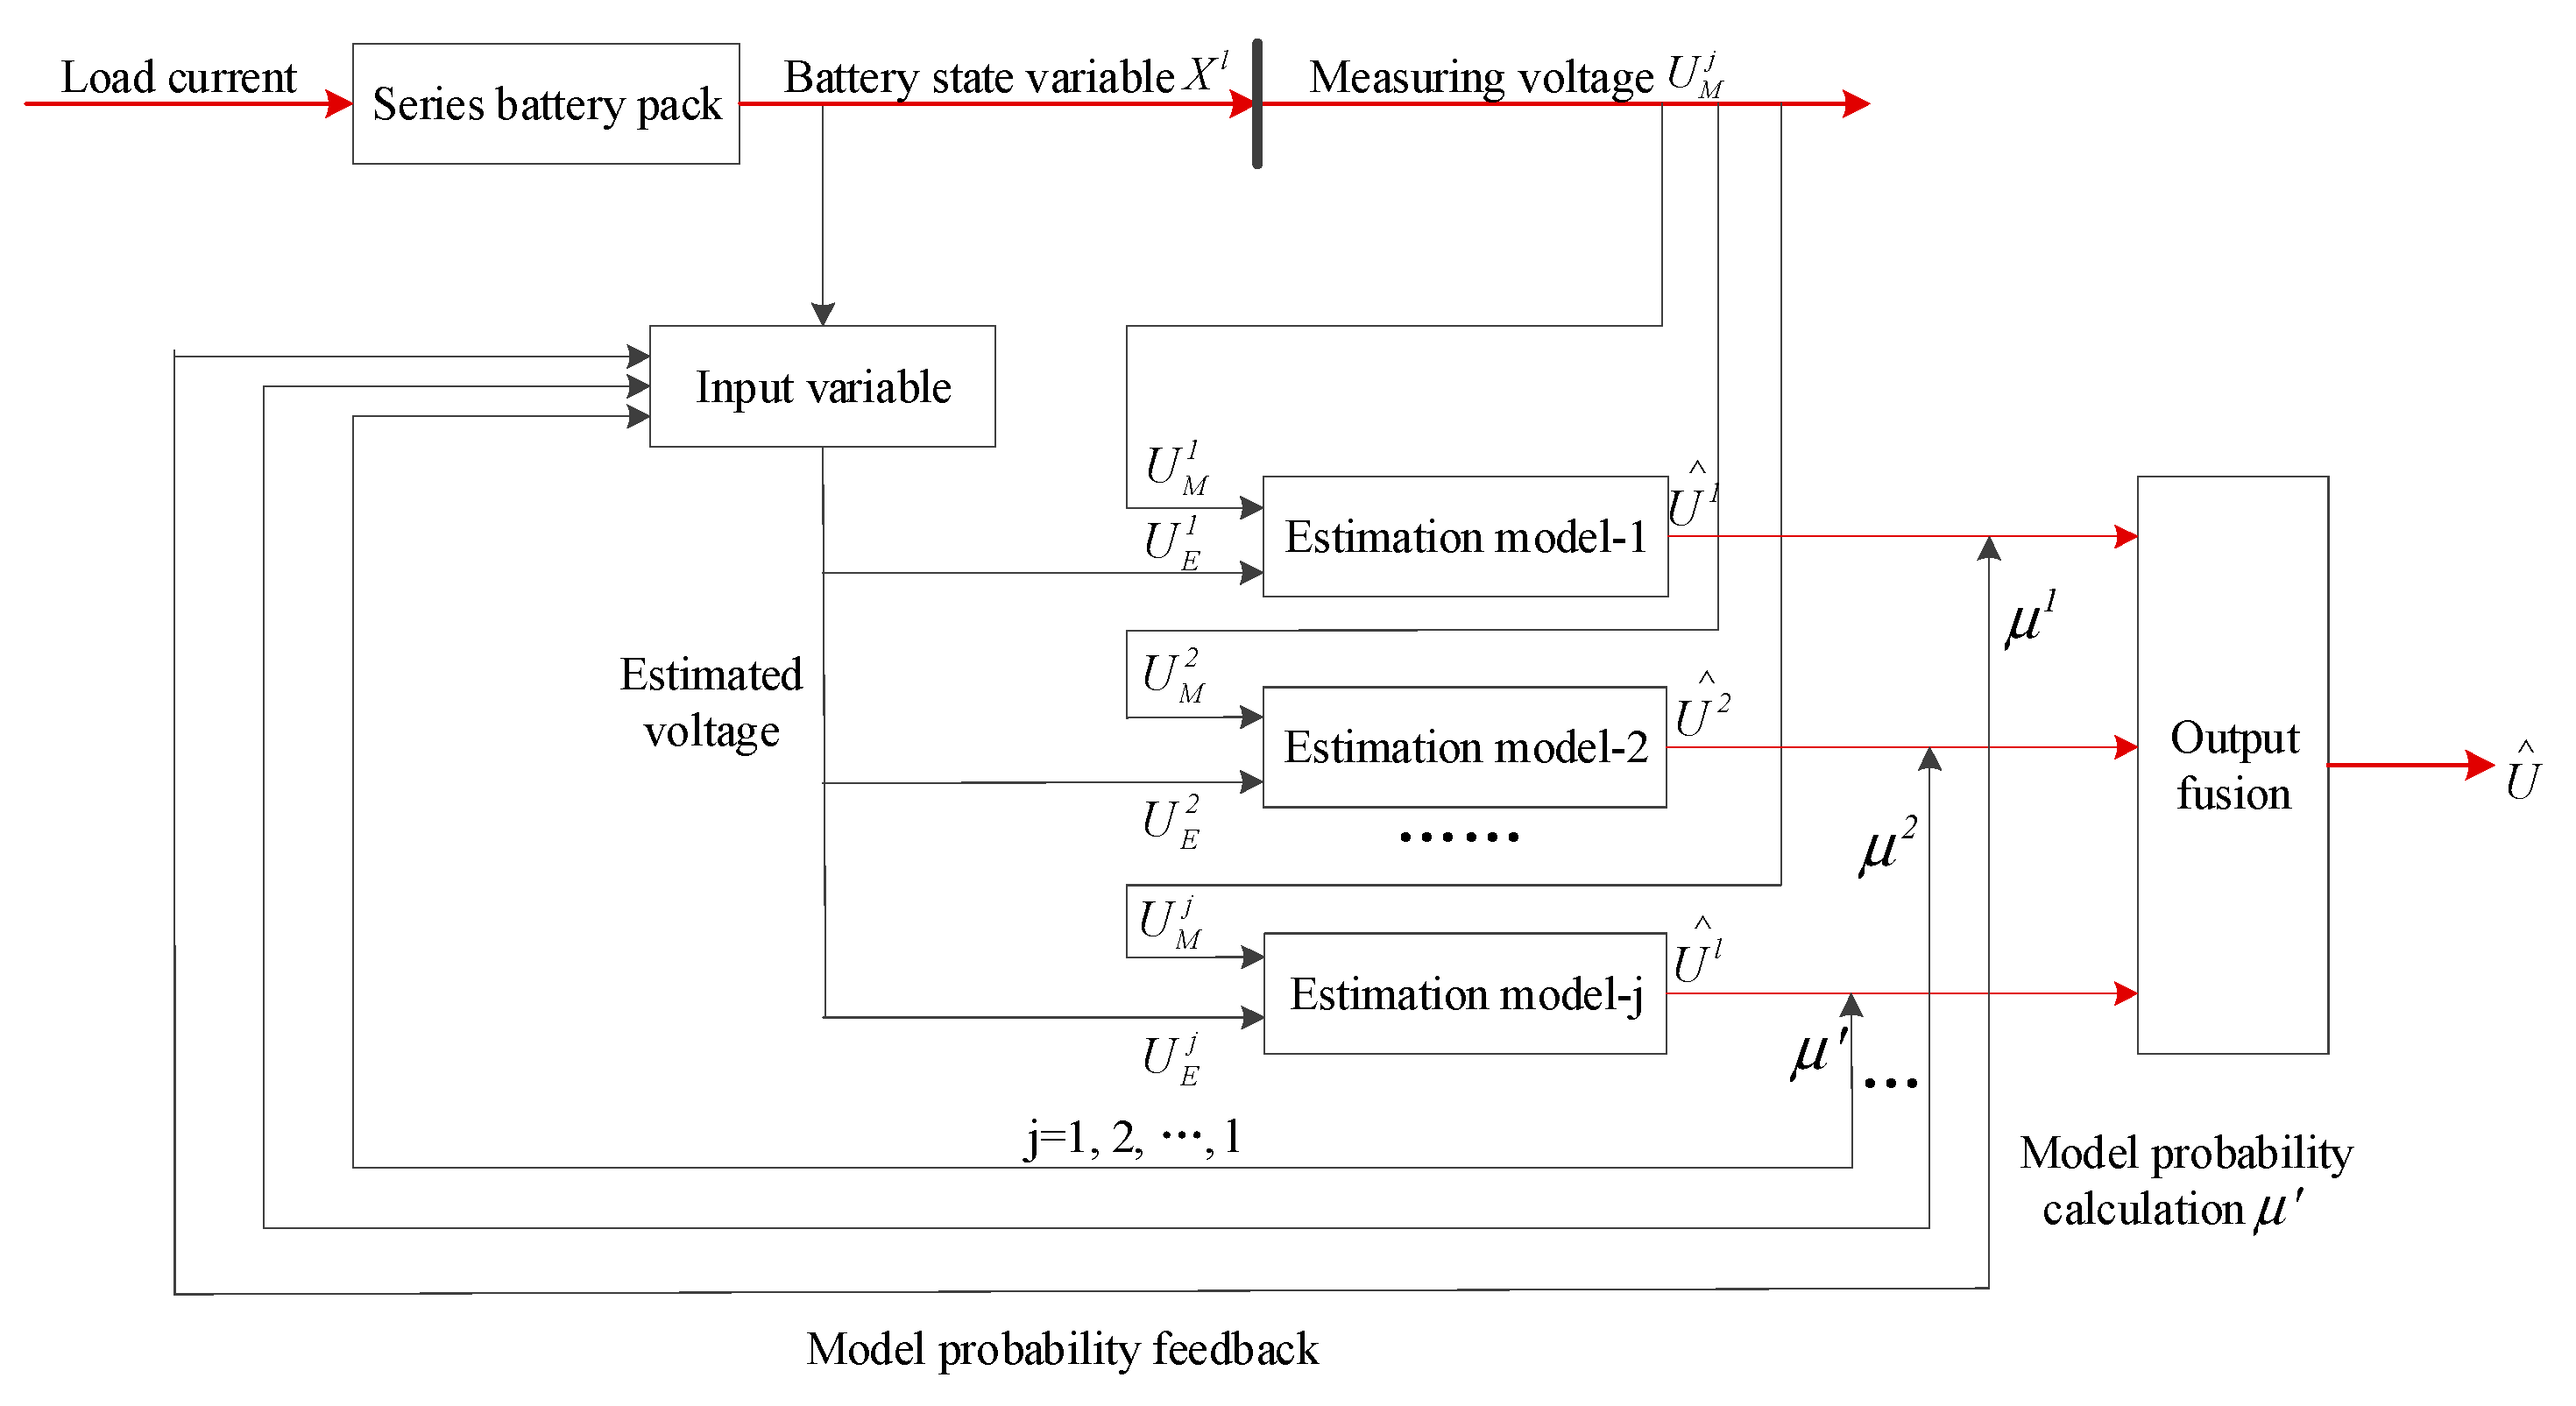
The overall flowchart is shown in the following
Figure 6.
According to
Figure 6, the parameters of the
models were first separately identified, after which the associated state equations were initialized. The initial interaction of the individual fault model information based on the IMM was then performed so that each model probability was updated at each cycle. The UKF filter estimator of each model estimated and corrected the posterior unknown process and measurement noises in real time, in order to adapt to the current environment while enhancing the convergence speed of the model. Additionally, the UKF was filtered so as to obtain the optimal estimate of the current lithium-ion battery
SOC. Finally, the updated model probability was fed back to the input for the input to fuse the historical information of the output and reduce the complexity of the optimal estimation method.
4. Experimental Study Based on Interactive Multi-Model SOC Estimation Model
Three kinds of experimental platforms were used: the Arbin BT-ML-30 V/10 A power battery tester produced by Arbin USA, ZM3000E; the battery internal resistance tester produced by Harbin Zeemoo Technology Co., Ltd.; and the CHI650D electrochemical workstation produced by Shanghai Chenhua Instrument Co. This study used different batteries in the Arbin experimental platform cycle aging test. The voltage measurement range of the Arbin equipment was 0–30 V; the current measurement range was 0–10 A; and the resolution of voltage and current measurement were able to reach 0.1 mV and 0.1 mA, respectively. Meanwhile, the voltage scan range of CHI650D was 0.05–3 V, and the scan rate was 0.5 mV/s. The specific experimental platform is shown in
Figure 7.
The experimental battery was a 18,650-type lithium-ion phosphate battery with a nominal capacity of 1.4 Ah. In order to obtain a lithium-ion battery with different model parameters, this study adopted the cycling test method in FreedomCar to cycle the battery for aging. The new battery, the battery with 300 cyclings, and the battery with 500 cyclings were then taken as the objects of the study, after which the batteries were discharged at a constant current with a discharge multiplier of 1C for the three cycling states. The discharge curves for the three cycling times are shown in
Figure 8 [
23].
As shown in
Figure 8, as the number of battery cycles rose, the discharge plateau of the battery became increasingly lower, the discharge capacity became smaller, and the battery health (state of health, SOH) reduced.
Table 1 shows the battery capacity and SOH values for the three cycling states. The models for the three cycling times were abbreviated as Model 1, Model 2 and Model 3, which are shown in
Table 1.
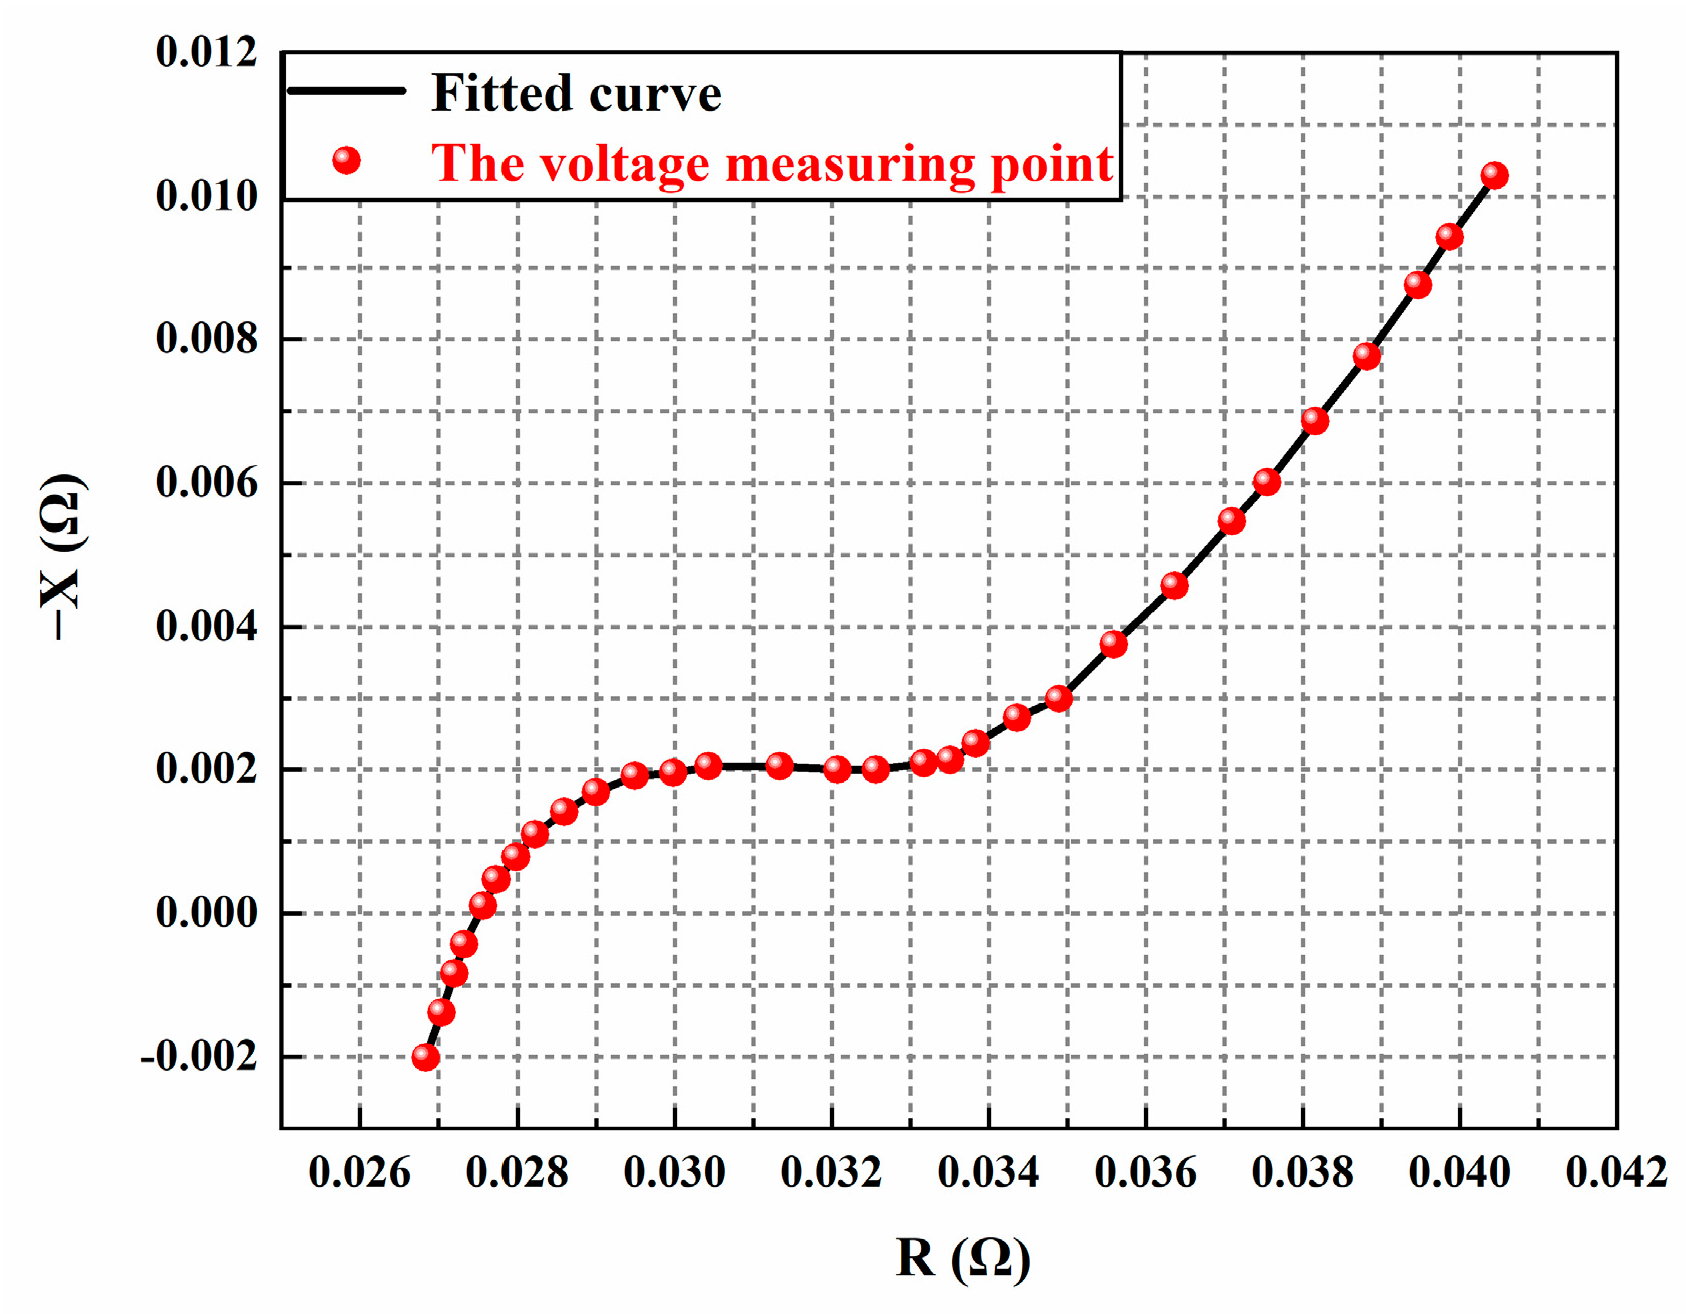
The resistance and capacitance parameters were identified for the three batteries under SOH using the electrochemical impedance spectra, as shown in
Figure 9. Moreover, the identification method was that as described in
Section 2.2, and the specific parameter values were obtained, as shown in
Table 2. According to
Figure 9, the electrochemical impedance spectra of the Li-ion battery shifted to the right with a rise in the number of cycles, indicating that the rise in cycles of the Li-ion battery increased its ohmic internal resistance and polarization resistance. As a result, three different models of lithium-ion batteries for the
SOC estimation were obtained.
From
Table 2, as the number of cycles rose, the internal resistance parameter of the battery was shown to increase while the capacitance parameter decreased; hence, the equivalent model of the battery also changed dynamically.
Based on the above three resistance–capacitance parameter models, the IMM-UKF algorithm was used in order to establish the corresponding three battery equivalent models. The highest matching degree demonstrated that the model was the current actual operating model.
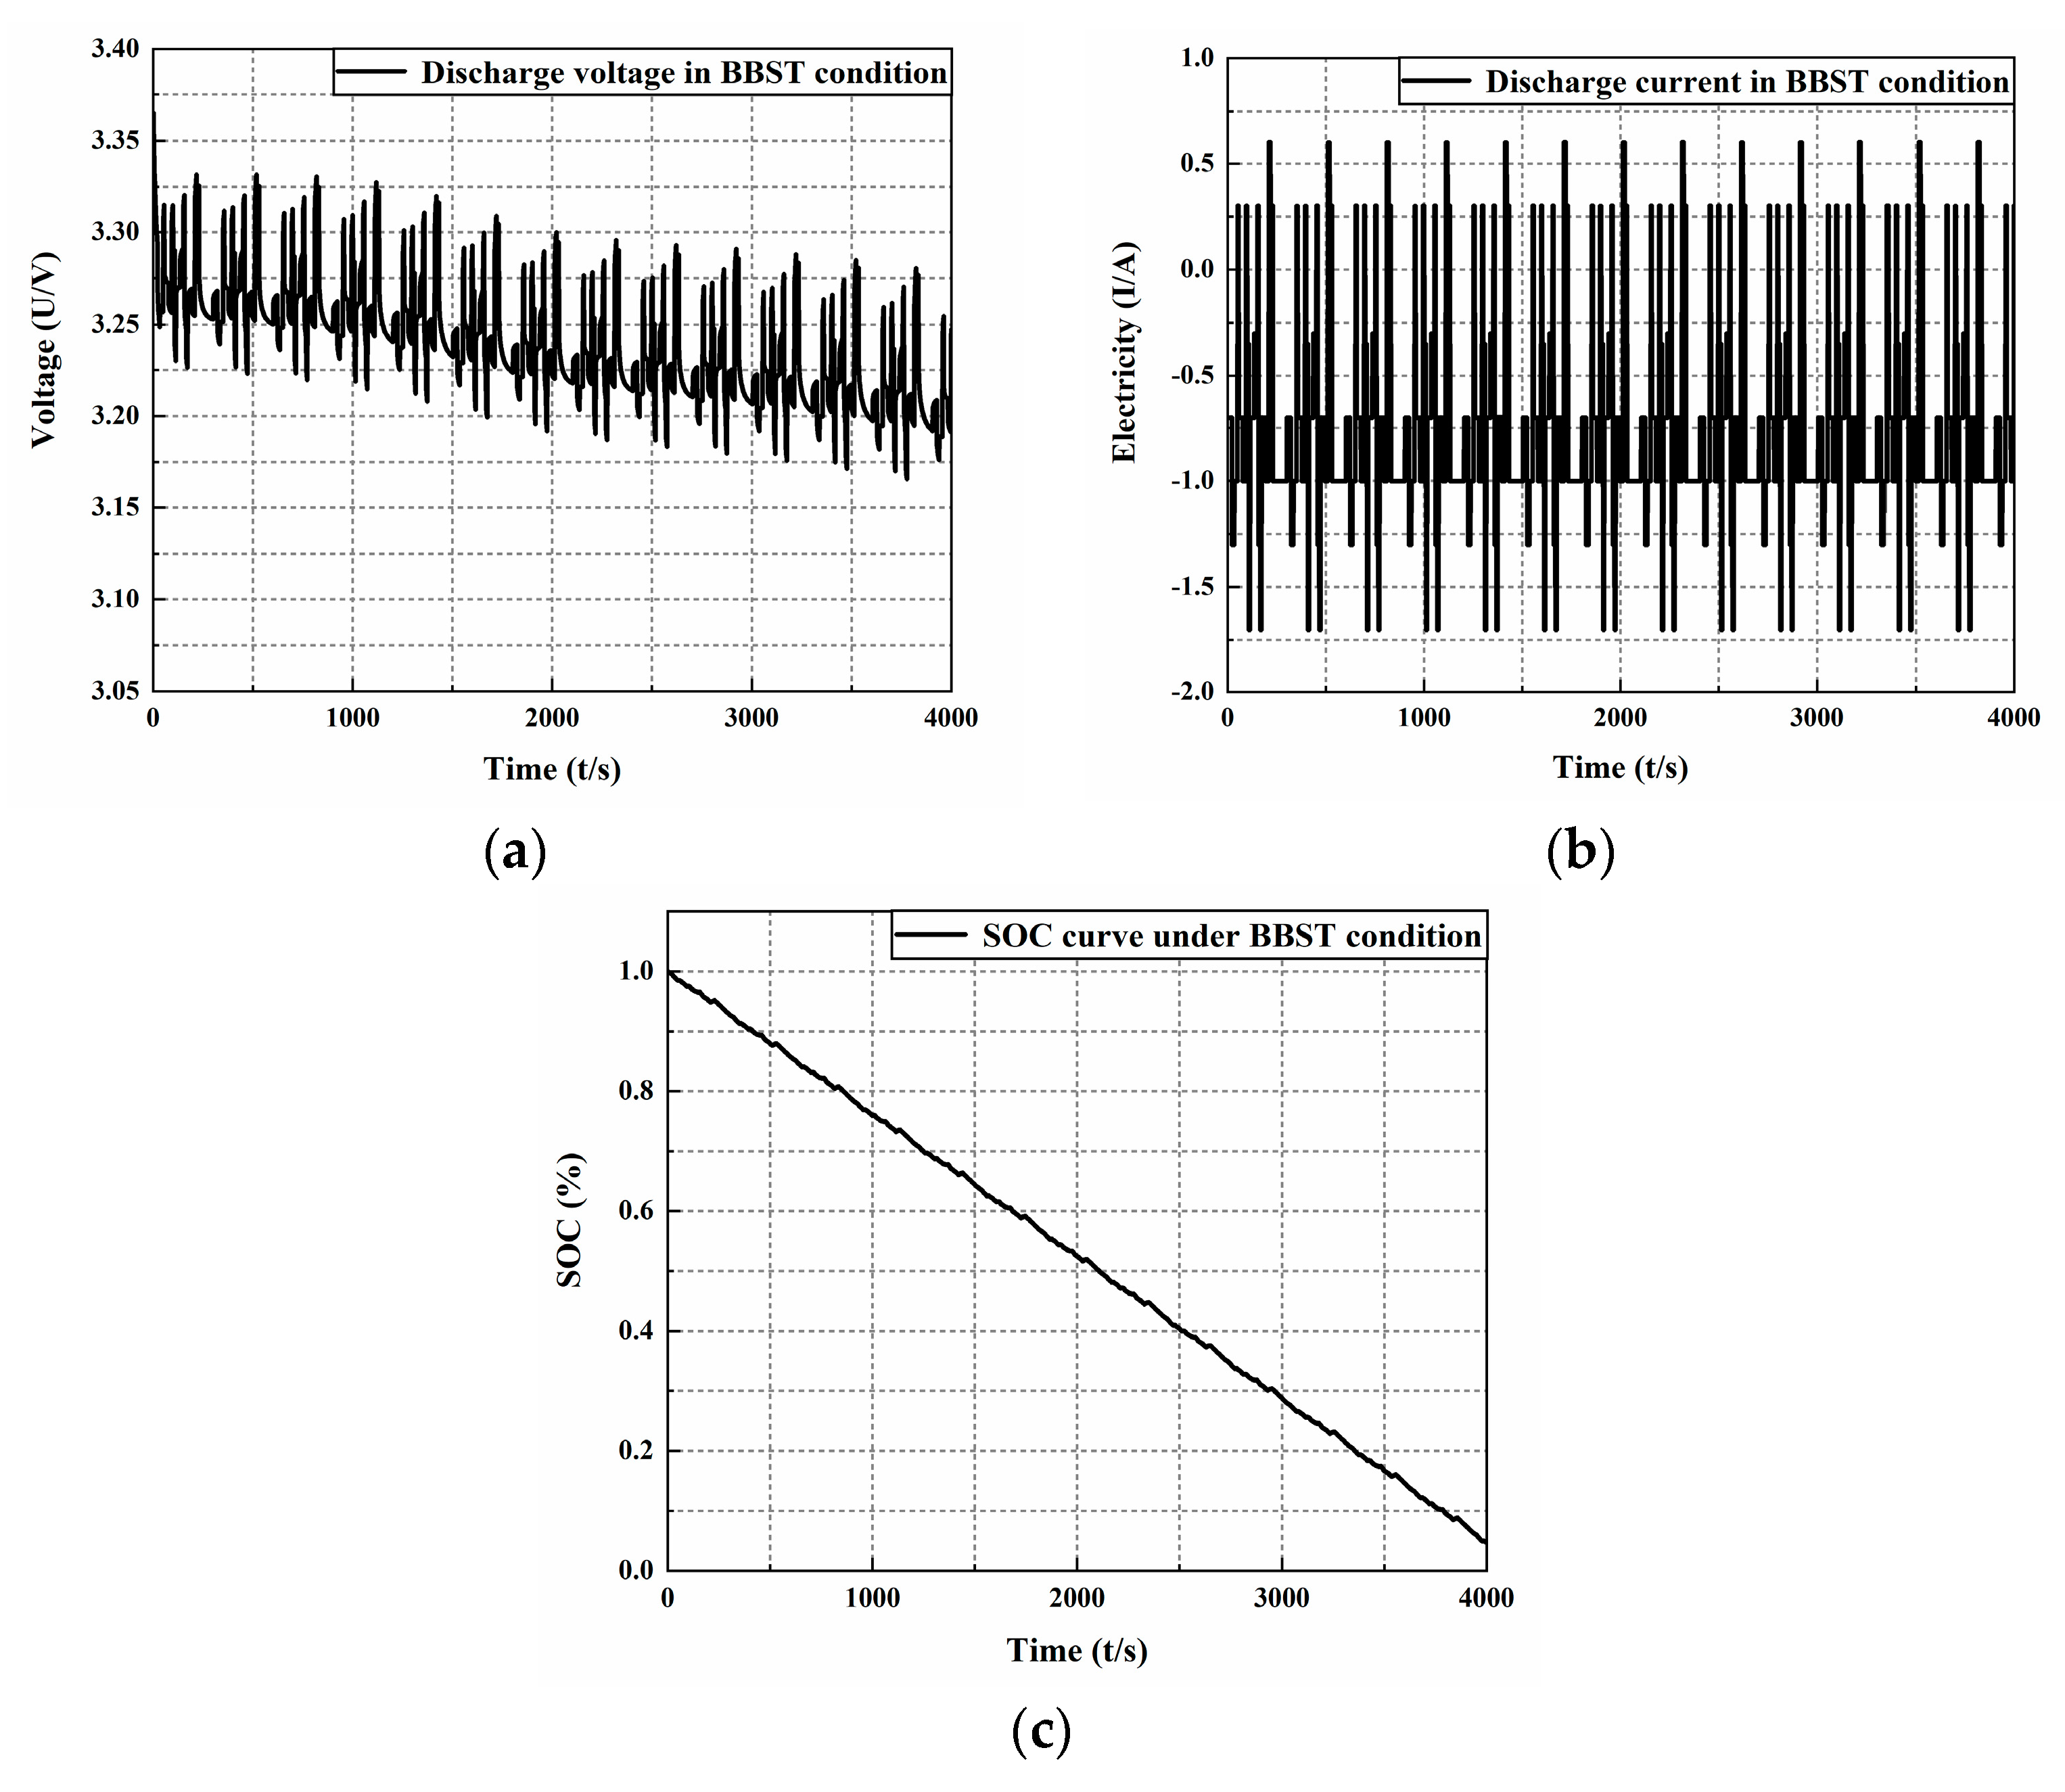
The power demand value was then scaled down to the allowable output power of a single battery, and the fully charged battery (
SOC = 1) was then placed in a 25 °C thermostat and left for 2 h. A programmable DC electronic load was used to simulate the above demanded power sequence, of which the power of the programmable load was set to “1” when the battery was discharged under working conditions. The battery discharge current, terminal voltage, and battery
SOC are shown in
Figure 10.
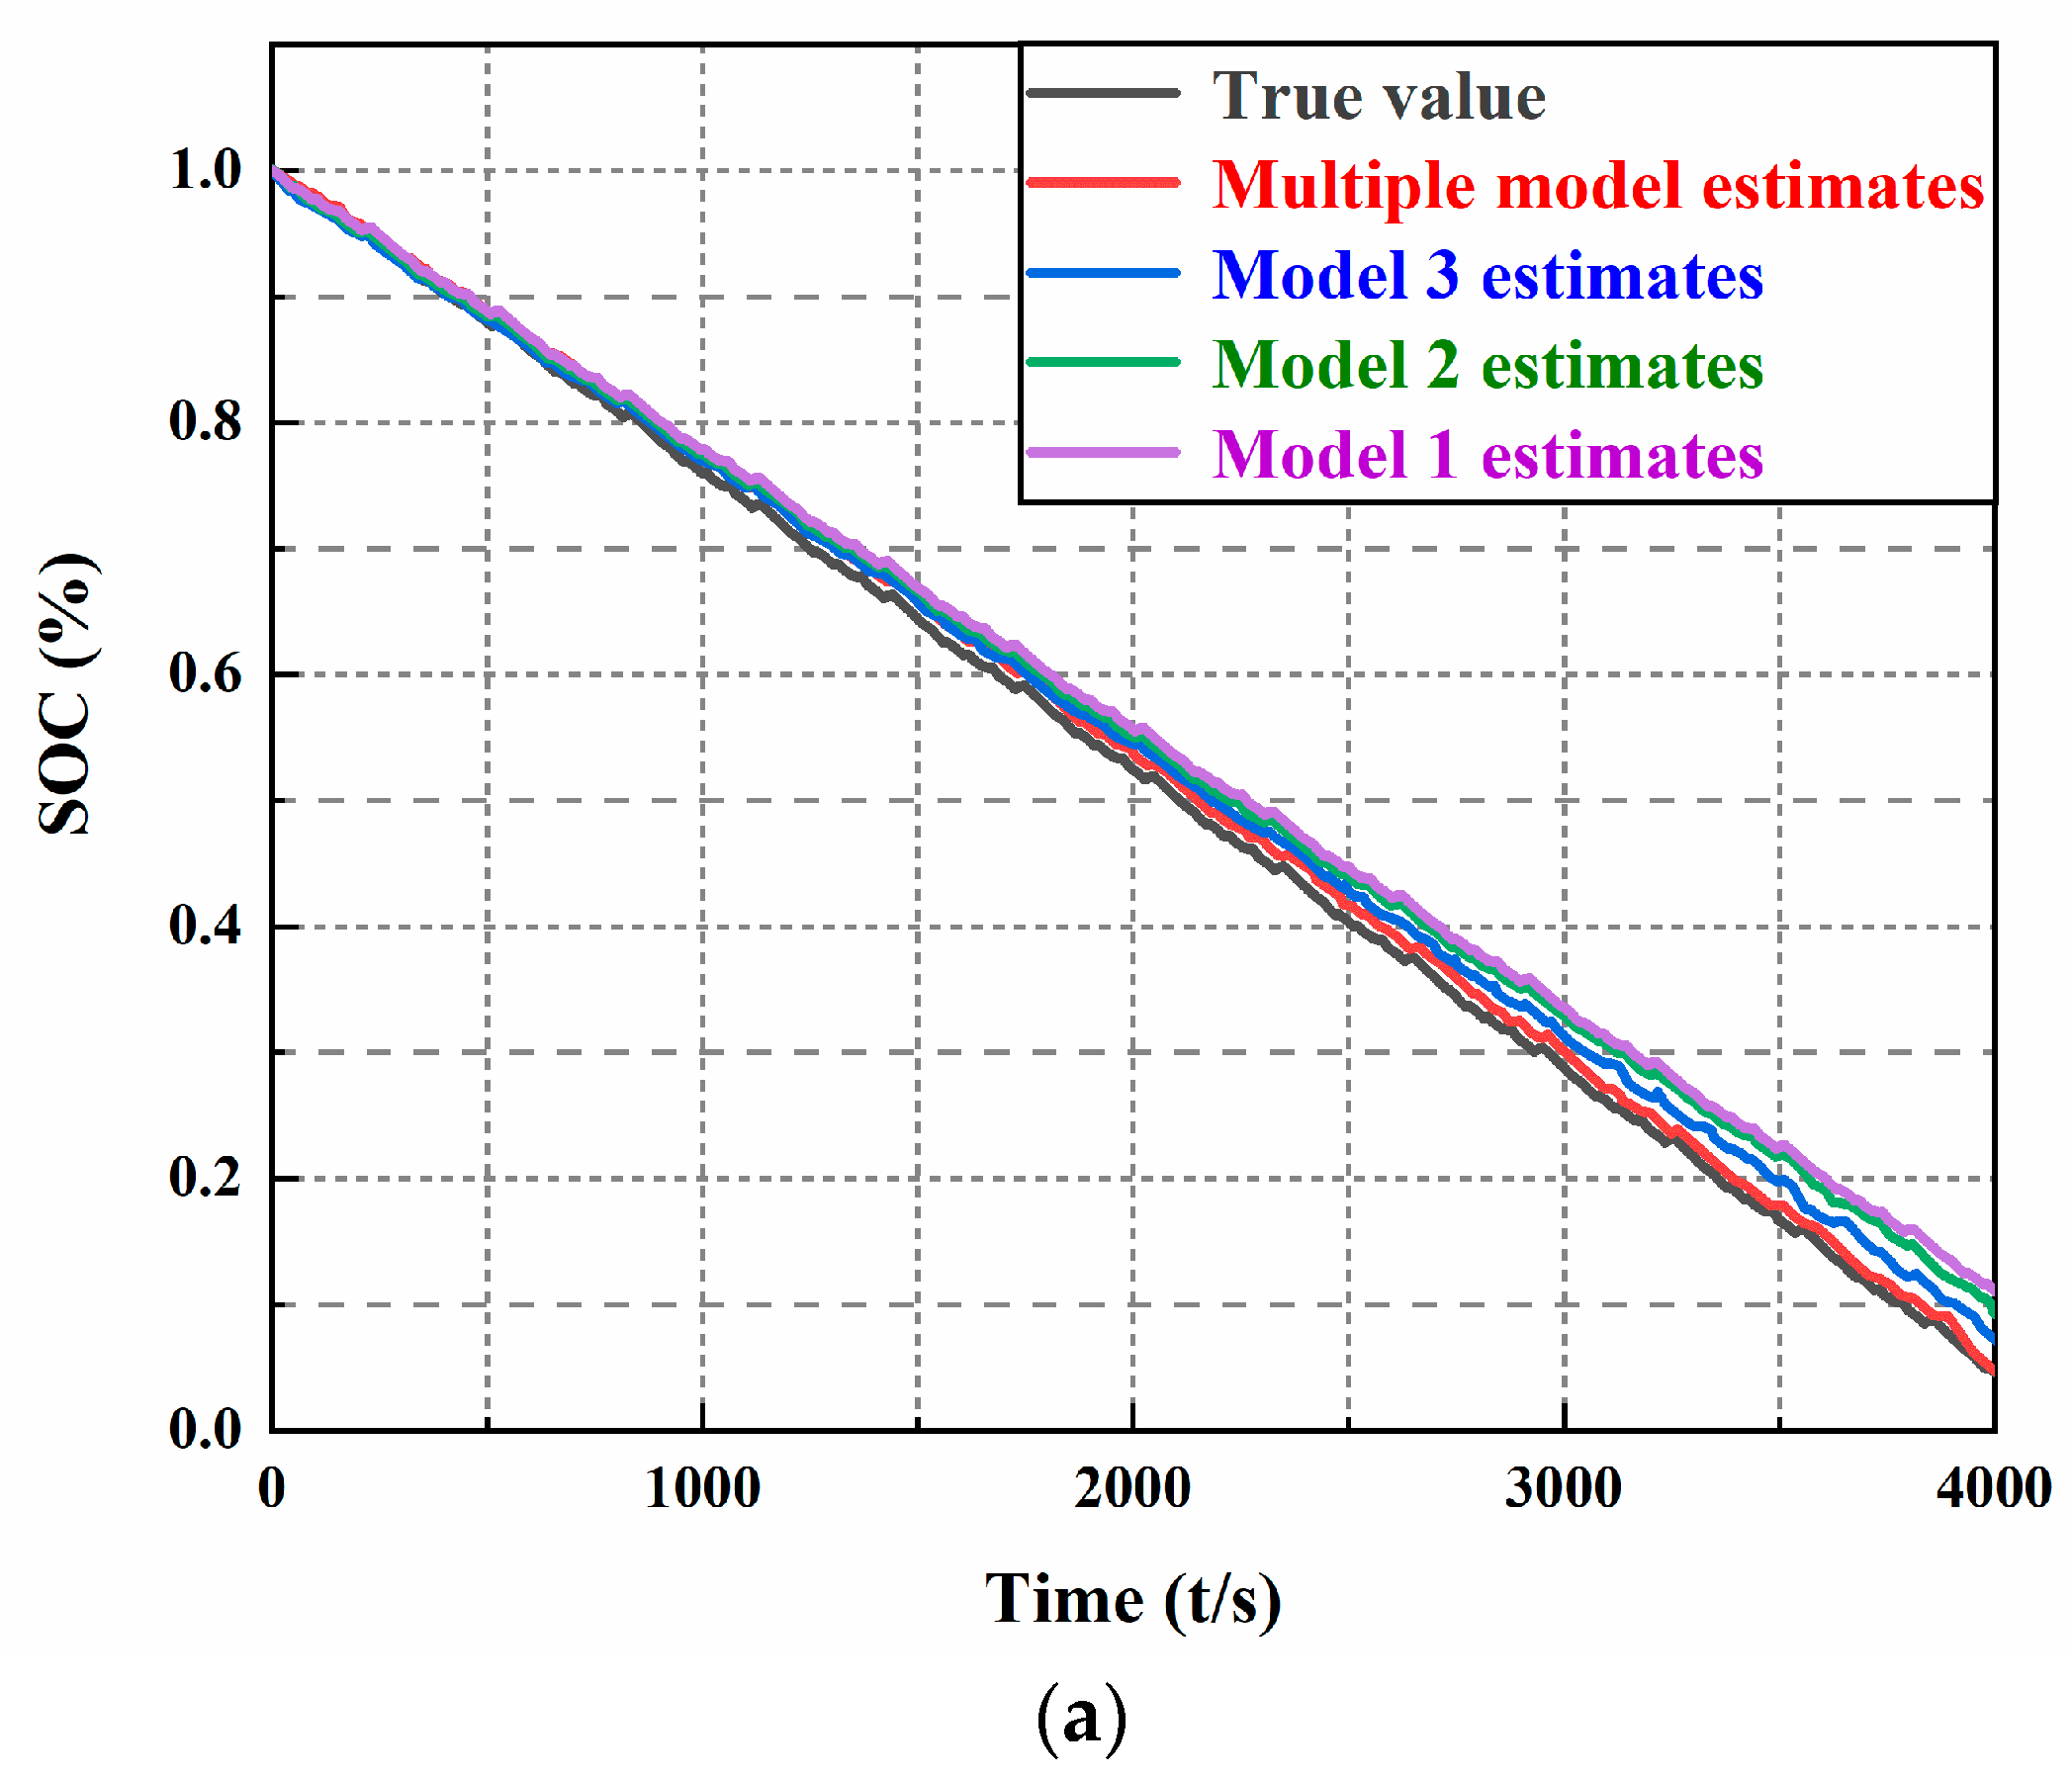
The calculation results using a single-model and multi-model are shown in
Figure 11. The curve is the
SOC estimation diagram of the sample battery in 238 cyclings. A comparison of the three single-model and multi-model estimates is shown in
Figure 11a, in which the estimated value of Model 3 better matched the true
SOC value, while the estimated values of Model 1 and Model 2 did not match the true
SOC value that well. Therefore, the three Model 3 estimates, the multi-model estimates, and the true
SOC were then compared, as shown in
Figure 11b, where the majority of the blue boxes were enlarged.
The multi-model estimation results in
SOC estimation in
Figure 11 was found to be similar to the real
SOC values, demonstrating that the algorithm can accurately and effectively accomplish the
SOC estimation for Li-ion batteries when the parameters dynamically change under multiple models.
Meanwhile, the results of the multi-model estimation were noted to be gradually close to overlapping with those of Model 3, indicating that the weights of Model 3 were gradually close to one in multi-model estimation. Meanwhile, the gradual deviation of Model 1 and Model 2 from the multi-model estimation indicated that the weights of Model 1 and Model 2 were gradually close to zero in multi-model estimation.
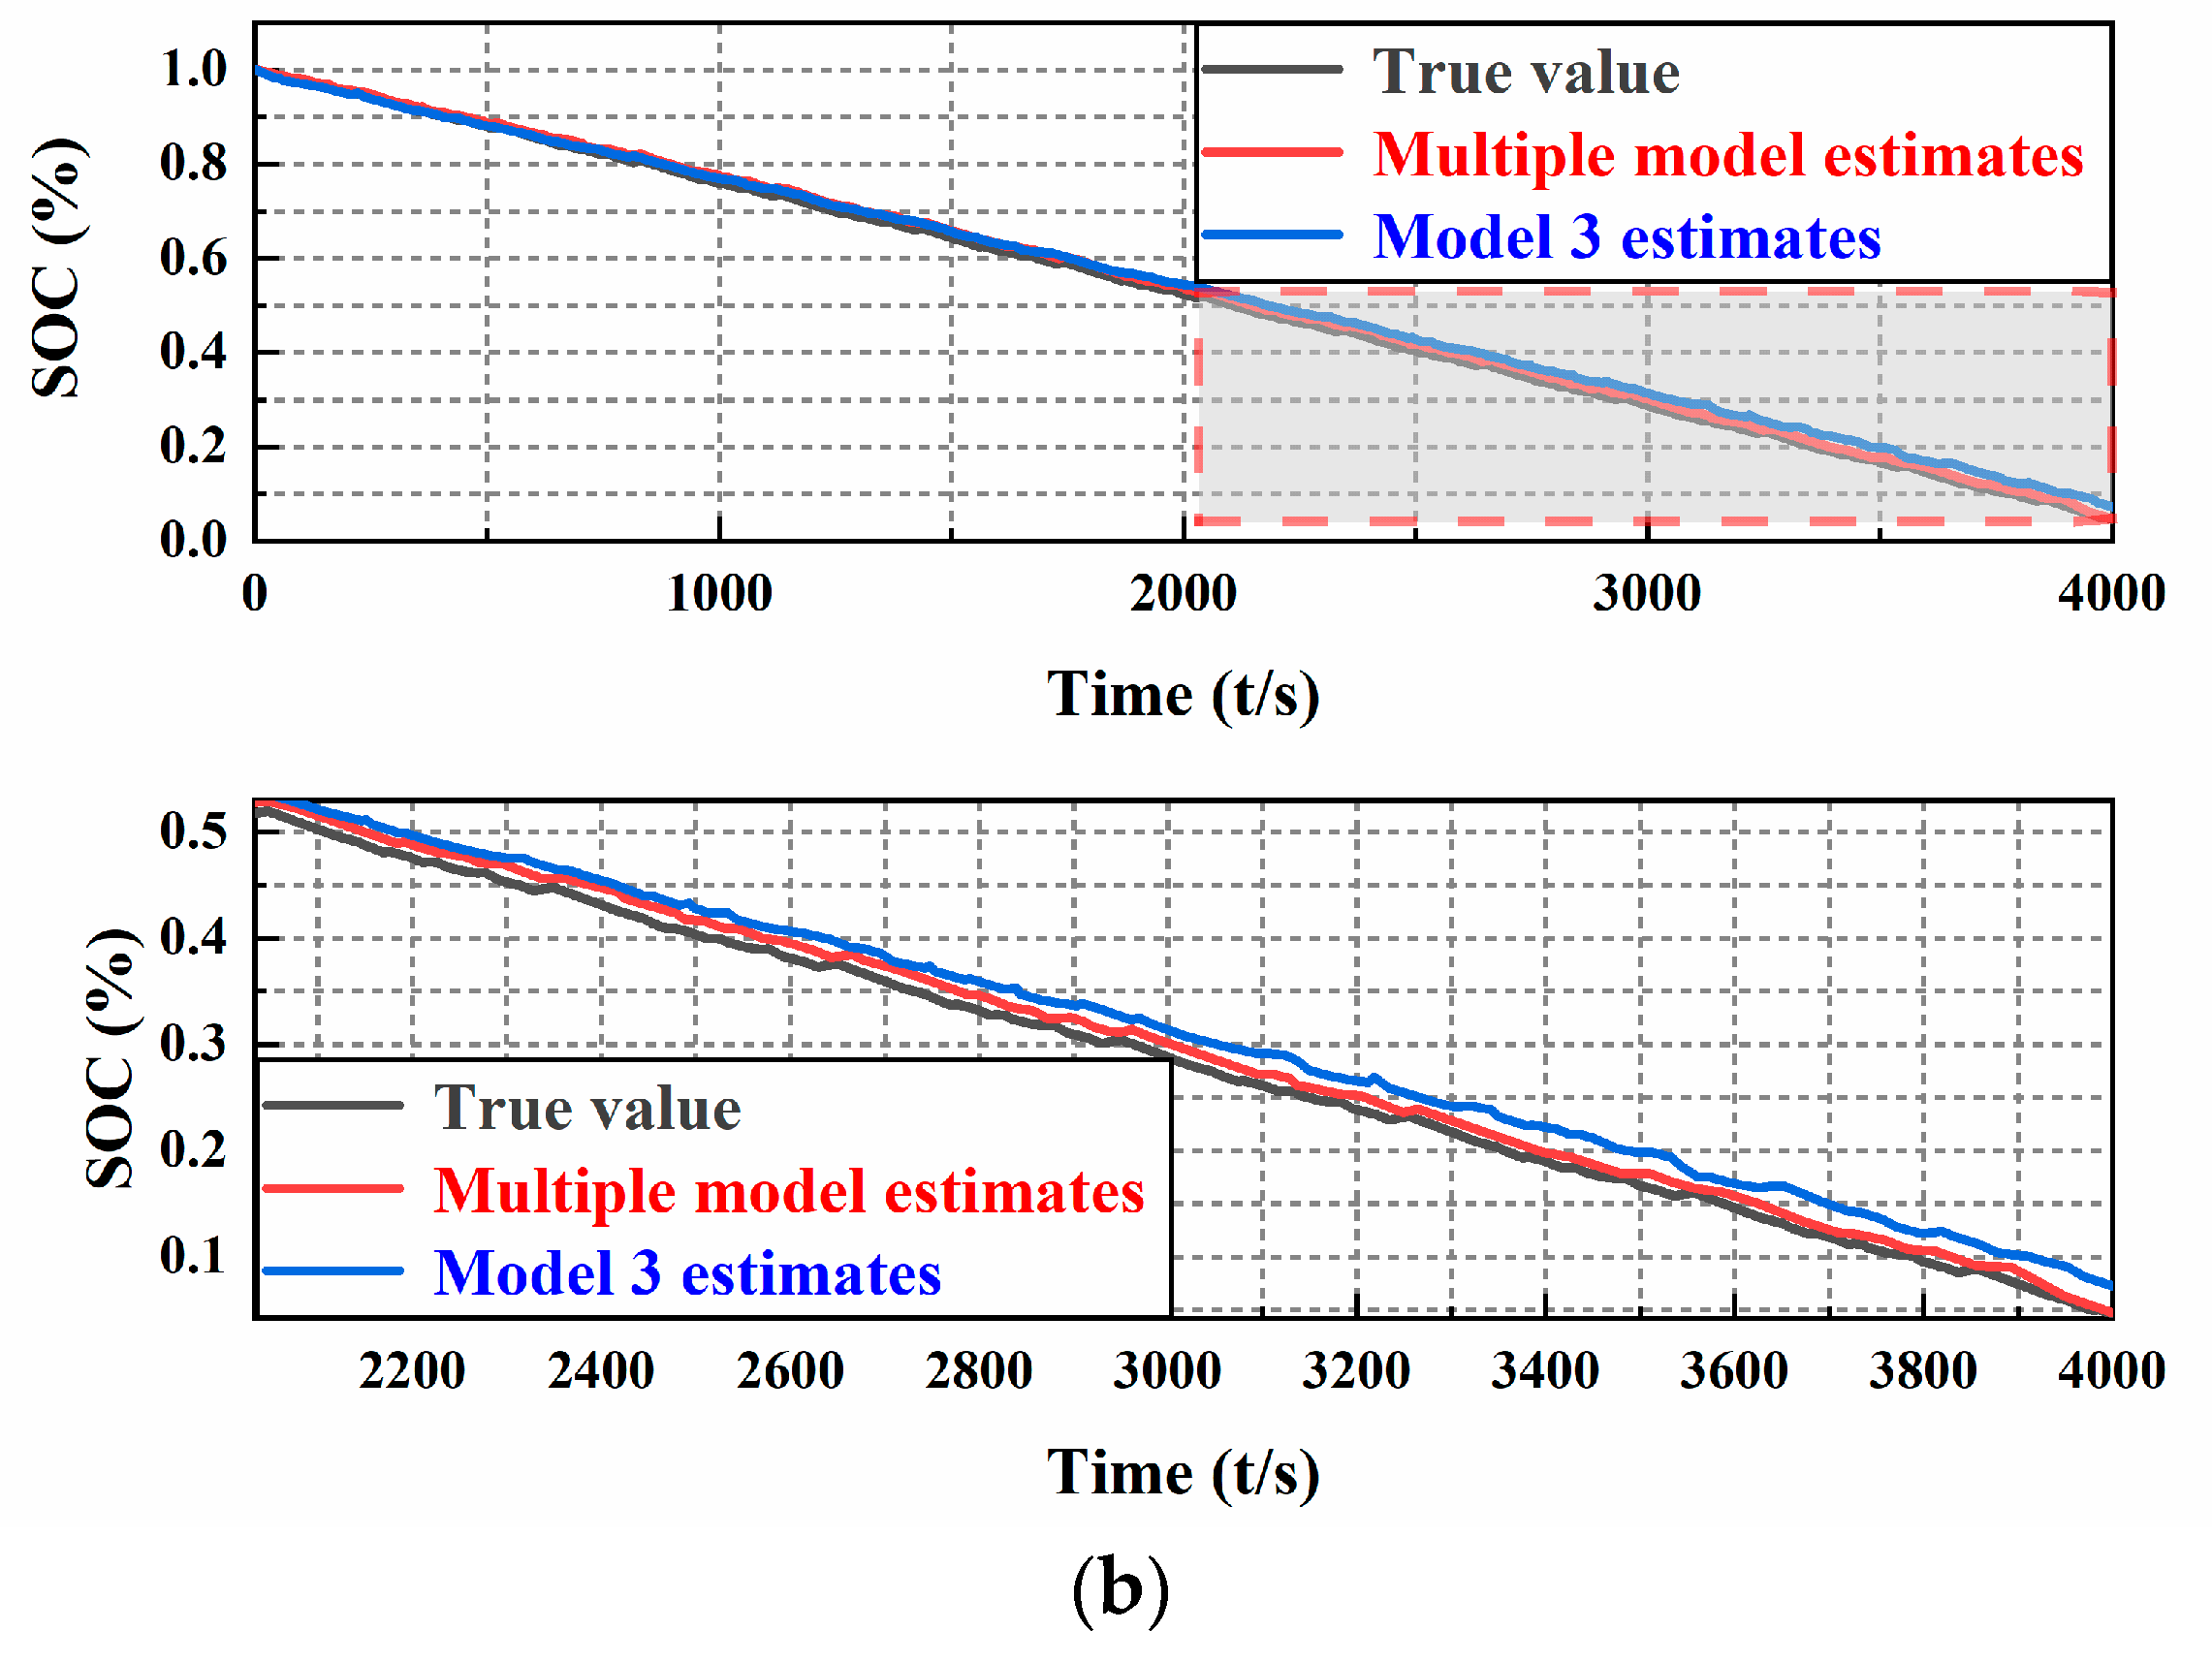
Figure 12 shows the conditional probabilities of the three models.
Based on the above analysis of the multi-model and single-model
SOC estimation, the conditional probabilities of Model 1 and Model 2 were shown to rapidly drop to 0 within 100 s after the start of the operation, while the conditional probability of Model 3 rapidly climbed to 0.95 within the same time. A further analysis was performed using the multi-model and single-model
SOC estimation errors, as illustrated in
Figure 13.
As seen in
Figure 13, regarding the three single-model
SOC estimation and the multi-model estimation errors, the estimation error of the
SOC using the traceless Kalman filter of Model 1 and Model 2 was larger, while using the multi-model traceless Kalman filter algorithm reduced the error and increased accuracy, thereby improving the robustness of the system. Meanwhile, the maximum estimation error of Model 1 was found to be 28.9%, while the maximum estimation error of Model 2 was 6.5%, which was larger than the real
SOC value. In addition, the maximum estimation error of Model 3, which was observed to be similar to the multi-model estimation, was 1%. The multi-model estimation had an error of less than 1% due to the integration of information from multiple aging cells, which was the smallest method among the three single-model
SOC estimation errors.
According to the comparison, the estimation error of the UKF algorithm was noted to be much larger than that of the IMM-UKF algorithm, demonstrating that the average error was three times higher than that of the latter, with the maximum error also being 0.7% higher. This caused UKF to be in a divergent state for the vast majority of the filtering time, thus affecting the estimation accuracy of the overall SOC. In contrast, IMM-UKF had minimal limitations in estimating the SOC of different Li-ion batteries, with an average error only 0.08% higher and a maximum error 0.43% higher after fusing other aging batteries’ information. Accordingly, this illustrates that the algorithm can guarantee the accuracy and validity of the SOC estimation of Li-ion battery states.


