Article

Reliability Analysis of Failure-Dependent System Based on Bayesian Network and Fuzzy Inference Model

School of Transportation and Logistics Engineering, Wuhan University of Technology, Wuhan 430063, China
*
Author to whom correspondence should be addressed.
Electronics 2023, 12(4), 1026; https://doi.org/10.3390/electronics12041026
Submission received: 21 January 2023 / Revised: 10 February 2023 / Accepted: 16 February 2023 / Published: 18 February 2023

Abstract

:
With the rapid development of information and automation technology, the manufacturing system is evolving towards more complexity and integration. The system components will inevitably suffer from degeneration, and the impact of component-level failure on the system reliability is a valuable issue to be studied, especially when failure dependence exists among the components. Thus, it is vital to construct a system reliability evaluation mechanism that helps to characterize the healthy status of the system and facilitate wise decision making. In this paper, a reliability analysis framework for a failure-dependent system is proposed, in which copula functions with optimized parameters are used for the description of different failure correlations, and a fuzzy inference model is constructed to derive the subsystem reliability based on the component-level failure correlation. Finally, a Bayesian network is applied to infer the system reliability based on the system structure combined with the impact of failure correlation inside. Simulation results of the proposed method show that the inference results of system reliability are reasonable and effective in different cases. Compared with the copula Bayesian network method, the proposed method shows better adaptability to failure-dependent systems to varying degrees. This work can provide theoretical guidance for evaluating the reliability of manufacturing systems of different types.

1. Introduction

The industrial manufacturing system is a complex system composed of various components, which may suffer from failure during the production activities. From a system perspective, component-level failure would have some influence on system reliability, which is generally reflected by the system performance. With the rapid development of information and sensing technology, data collection from system components has become more and more convenient, and the failure model of a component can be constructed and analyzed through various technical methods. However, determining how to evaluate system reliability based on the information of component-level failure is still a challenging problem, especially when failure correlation exists between the system components, which is always referred to as a failure-dependent manufacturing system. Actually, failure dependence exists in most practical engineering applications due to reasons including, but not limited to, standby redundancy mechanisms, load sharing, failure with a common cause, and cascade. Therefore, it is necessary to consider such failure dependence in practical manufacturing systems, to therefore propose new requirements for accurate failure correlation description and inspire further research on how to embed this correlation into the framework of system reliability analysis.
Through careful study of the related literature, it can be found that different research works have their own concerns, such as failure correlation description, derivation from component-level reliability to system-level reliability, or simulation techniques for reliability evaluation. Nonetheless, few existing works focus on constructing a systematic framework of reliability analysis for failure-dependent manufacturing systems and providing comprehensive analysis of the key functions, including failure correlation description, and reliability derivation from components to the subsystem and the whole system. This motivates us to spend effort on formulating such a reliability analysis framework. The major contributions of this paper are summarized as follows:
(1) We take advantage of both copula functions and fuzzy inference methods to model the failure correlation between the components and the impact of this failure correlation on the subsystem, respectively. Furthermore, the fuzzy inference model is integrated into the Bayesian network model to achieve rational and effective reliability evaluation results for failure-dependent manufacturing systems. In this way, a reliability analysis framework based on copula functions, a fuzzy inference model, and a Bayesian network is proposed.
(2) Specifically, the copula function is carefully selected based on the goodness of fit of each tested type of copula function, and the corresponding parameter is optimized to obtain the most appropriate characterization of the failure correlation between different system components.
(3) By introducing the fuzzy inference model into the reliability analysis framework, we can avoid the obstacles of directly deriving the reliability values without precise knowledge about the system operation mechanism, while also taking advantage of the expert knowledge and experiences. It also has advantages such as the adaptability to derive system reliability values in the cases of various degrees of failure correlation among components in manufacturing systems.
(4) Generally, a manufacturing system has four structures, namely, series, parallel, series–parallel, and cycles, which can be modeled by production lines or networks. Our case study considers a typical series–parallel system in which failure processes of some components are independent, while failure correlation can exist between a pair of components in series or in parallel. Focusing on this general scenario, we comprehensively simulate and analyze the failure correlation description, and evaluate the subsystem reliability and system reliability, as well as the machine importance in the system. The reliability evaluation results of the proposed method are also compared with the copula Bayesian network method, and the rationality and effectiveness are verified. The proposed reliability analysis method can also be extended for different cases of failure-dependent manufacturing systems.
The reminder of this paper is organized as follows. Section 2 provides a review of the related work. Section 3 introduces the proposed system reliability analysis framework for failure-dependent manufacturing systems, including the copula description of the failure correlation among the system components, the fuzzy inference model to derive the impact of component-level correlation on the subsystem reliability, and the Bayesian network for the final inference of the system reliability. To show the validity and effectiveness of the proposed method, Section 4 applies it to a typical example of a manufacturing system, and provides comprehensive simulation and analysis results. Section 5 concludes this paper and discusses some future research directions.

2. Literature Review

System reliability analysis has been a popular research issue in recent years, especially for complex manufacturing systems including multiple components where failures of the components can be correlated. There is already a lot of research on component-level fault diagnosis methods. Model-based fault diagnosis methods are widely used in simple systems, while data-driven approaches are more preferred for complex systems, which are difficult to model. Thanks to the rapid development of the Internet of Things (IoT) techniques, various kinds of data can be collected from the running equipment, which can be further used to acquire accurate knowledge about the health status and the remaining useful life (RUL) of the equipment and facilitate predictive maintenance decisions. Zhao et al. provided a comprehensive review of the early fault diagnosis methods focusing on vibration signals [1]. Wu et al. delivered an effective intelligent fault diagnosis method for rolling bearings to ensure the machinery’s stability and reliability [2]. Zhou et al. applied the Adabelief-BP neural network together with fuzzy decision making to study the multi-granularity faults of the production equipment, and further designed an intelligent prediction maintenance system [3]. Zheng et al. proposed a novel maintenance decision-making method for equipment based on Long Short-Term Memory and Markov decision process, which can provide specific maintenance strategies in different degradation stages of the system [4]. These models always make use of the data collected from sensors or other measurement instruments, while user data are rarely used [5]. Baptista et al. used the autoregressive moving average (ARMA) model and data-driven technology to build a fault prediction framework [5]. D. Yu et al. applied the data-driven deep confidence network to realize wind turbine fault detection and diagnosis [6]. In [7], Li et al. proposed a data-driven method for fault diagnosis and isolation of wind turbines, where long-term and short-term memory networks are used for learning and a random forest algorithm is used for decision making.
With the prediction results of the component-level failure, as well as information about the RUL or mean time between failure (MTBF), a credible reliability evaluation of the component can be achieved. However, for a multi-component system, the system reliability not only depends on the reliability of the constituent components, but also the relationship among them, since failures of some components will affect the reliability of the system as a whole. For simplicity, the component-level RULs are assumed to be independent, but this assumption may not hold when considering failure-dependent manufacturing systems, resulting in unsatisfactory evaluation of the system reliability. There are some commonly used methods to consider the correlation between component life [8]: (1) multivariate distribution such as multivariate lognormal distribution [9], Marshall–Olkin Weibull distribution [10], and multivariate Birnbaum–Saunders distribution [11]; (2) combined effects of positive and negative correlations [12]; and (3) copula functions. In recent years, modeling the failure correlation between components via copula functions has attracted a lot of attention from researchers, mostly due to its advantage of flexibility. Meng et al. combined the mixed copula function and nested copula function to establish a comprehensive failure correlation analysis model of mechanical systems, and studied the time-varying reliability of mechanical structures based on performance degradation [13]. Zuo et al. combined copula theory to analyze the system reliability of gear transmissions under three failure modes [14]. In [15], Wang et al. established a reliability model of CNC lathes considering the subsystem fault correlation, and analyzed the reliability allocation method considering the fault correlation. Zhang et al. illustrated the influence of dependency structure on system reliability and component importance using a copula function and simulations [16]. Sun et al. used nonparametric copula entropy and network deconvolution methods to discover the cause and effect of complex manufacturing systems, revealing the causal relationship between the parameters of complex systems [17]. In [18], Zhang et al. applied the copula-based hierarchical correlation method to analyze the impact of a redundancy allocation strategy and statistical correlation on the reliability of typical series–parallel systems. Moreover, the copula function was used to describe the statistical correlation between external subsystems and internal components.
Some scholars use Bayesian networks to study the system reliability considering the failure correlation. Song et al. proposed an improved Bayesian network combined with the probability box copula method to evaluate the system’s reliability [19]. Ding et al. used the copula function to represent the relationship between variables, introduced the copula function in the traditional Bayesian network, and used the CBN structure to infer system reliability [20]. Sun et al. used the copula Bayesian network to model and analyze the system reliability [21].
The fuzzy inference model can deal with uncertain and imprecise information while also considering the logic of human knowledge. Therefore, it is regarded as an effective tool for manufacturing systems to infer and control production information in the production planning and scheduling process. Considering energy-saving operations, Wang et al. designed fuzzy rules based on real-time data, and applied fuzzy inference to the production information to control the production process of the manufacturing system [22]. Lu et al. proposed a dynamic scheduling strategy with a multi-performance index based on fuzzy inference [23].
The fuzzy logic approach has also been applied to other fields. Li et al. utilized a fuzzy model to predict the evolution of surface scratching in sheet metals subject to contact sliding. In order to improve the prediction accuracy, the fuzzy model was further refined by the improved quantum-behaved particle swarm optimization (QPSO) algorithm [24]. Zhang et al. proposed a fuzzy PD control scheme based on a Back-Propagation Neural Network (BPNN) for the control problem of a three degrees of freedom manipulator. Combined with the BPNN, the performance of the traditional fuzzy PD algorithm was optimized by calibrating the overlap rate of membership functions online [25].
To sum up, a large number of research works have been conducted on system reliability analysis with different concerns. Some have focused on describing failure correlation between different components, while some have been interested in the derivation from component reliability to system reliability. Simulation methods are preferred by the researchers in this area due to the limitations of acquiring system reliability data from practical manufacturing systems. However, few existing methods show their adaptability to different manufacturing systems with various degrees of failure dependency, which motivates us to take advantage of both copula functions and the fuzzy inference method, to model the failure correlation between the components and the failure impact on the system, respectively. Furthermore, the fuzzy inference model is integrated into the Bayesian network to achieve a better reliability evaluation result for failure-dependent manufacturing systems. This work aims to advance the research of system reliability evaluation, providing theoretical guidance for evaluating the reliability of manufacturing systems of different types.

3. The Developed Method

3.1. The Proposed Framework

The proposed framework of system reliability analysis for failure-dependent manufacturing systems is shown in Figure 1. Firstly, machine reliability data are collected from the manufacturing system. Based on data preprocessing and analysis, an appropriate data distribution is used to fit the historical data and construct the failure model of the machine. Moreover, information about failure independence or correlation can be obtained. Second, we use proper copula functions to describe the failure correlation between the machines, including smart selection of copula type and parameter optimization. Based on the above two steps, a Bayesian network combined with a fuzzy inference model is constructed to evaluate the system reliability, where the fuzzy inference model is specially designed to derive the reliability values of the subsystems with different types of failure correlation. Furthermore, Birnbaum importance is introduced to evaluate the machine importance in the system characterized by the Bayesian network. The results of system reliability analysis can be compared with the actual system reliability data measured by system performance, and reliable analysis results can act as a solid basis for further system fault diagnosis and maintenance decision making. The important details of the proposed framework regarding the failure correlation description, fuzzy inference model, and Bayesian network model are described in the following sections, respectively.

3.2. Failure Correlation Description Based on Copula Function

Reliability refers to the probability that a product can complete the specified function under specified conditions within a given time. Reliability can also be expressed as a function of time t, denoted by R ( t ) . From the definition of the failure rate and the expression of the exponential distribution, the reliability can be described as follows:
R ( t ) = e λ ( t ) t
In contrast with reliability, the cumulative failure probability refers to the probability that a product fails to complete the specified function under specified conditions within a given time, which is also known as unreliability, commonly denoted by F ( t ) with the following expression:
F ( t ) = 1 R ( t ) = P ( T t ) = 0 t f ( t ) d t
where f ( t ) is the failure probability density function.
Considering a series of random variables with different marginal distributions, modeling their joint distribution will be difficult if they are not independent. To represent the joint distribution of such random variables, the concept of the copula function was proposed by Sklar in 1959 [26]. Let X = ( X 1 , X 2 , , X n ) T be a random vector with marginal CDFs F 1 ( x 1 ) , F 2 ( x 2 ) , , F n ( x n ) , define their joint distribution as H ( x 1 , x 2 , , x n ) = P ( X 1 x 1 , X 2 x 2 , , X n x 2 ) . Then, according to Sklar’s Theorem, there exists a copula function C such that:
C ( F 1 ( x 1 ) , F 2 ( x 2 ) , , F n ( x n ) ) = H ( x 1 , x 2 , , x n )
The theorem provides a method for modeling a multivariate joint distribution by utilizing marginal distributions. Firstly, we can construct a marginal distribution for each variable; then, we try to find an appropriate copula function and determine the corresponding parameters, as an effective tool to characterize the correlations among different variables.
There are various types of copula functions, among which Archimedes copula and Elliptic copula are the most widely used copula families in academic research. In the Elliptic copula family, commonly used copula functions include t copulas and Gaussian copulas. Both t copulas and Gaussian copulas have symmetric tail correlations. They seem to be similar in central areas, while the main difference exists in the thickness of the tail. For simplicity, we consider two variables u , v in the copula expressions in the following.
t copula:  t copula function for two variables u , v can be expressed by:
C t ( u , v ; ρ , k ) = t k 1 ( u ) t k 1 ( v ) 1 2 π 1 ρ 2 ( 1 + s 2 2 ρ s t + t 2 k ( 1 ρ 2 ) ) k + 2 2 d s d t
where ρ is the linear correlation coefficient between the variables, and ρ ϵ [ 1 , 1 ] . t k 1 ( · ) is the inverse function of the univariate t-distribution with the degree of freedom k .
Gaussian copula: Gaussian copula function for two variables u , v can be expressed by:
C G a ( u , v ; ρ ) = ϕ 1 ( u ) ϕ 1 ( v ) 1 2 π 1 ρ 2 e x p ( s 2 2 ρ s t + t 2 2 ( 1 ρ 2 ) ) d s d t
where ρ is the linear correlation coefficient between the variables, and ρ ϵ [ 1 , 1 ] . ϕ 1 ( · ) is the inverse function of the standard normal distribution.
The Archimedes copula family has the uniform function expression C ( u , v ) = φ 1 ( φ ( u ) + φ ( v ) ) , where φ   ( · ) is the generator function of the Archimedes copulas. According to different generator functions, different Archimedes copulas can be obtained, among which the most commonly used ones include Gumbel copulas, Clayton copulas, and Frank copulas.
Gumbel copula: Gumbel copula for two variables u , v is expressed as:
C G ( u , v ; θ ) = e x p ( [ ( ln u ) θ + ( ln v ) θ ] 1 / θ )
where θ ϵ [ 1 , + ) . It is a preferable option when describing variables with upper-tail correlation.
Clayton copula: Clayton copula for two variables u , v is expressed as:
C C ( u , v ; θ ) = ( u θ + v θ 1 ) 1 / θ
where θ ϵ ( 0 , + ) . It is more suitable for describing variables with lower-tail correlation.
Frank copula: Frank copula for two variables u , v is expressed as:
C F ( u , v ; θ ) = 1 θ ln ( 1 + ( e θ u 1 ) ( e θ v 1 ) e θ 1 )
where θ ϵ ( , 0 ) ( 0 , + ) . It is commonly used to describe variables with both upper-tail and lower-tail correlations.
Since there are various types of copula functions, and different types of copula functions are suitable for describing different kinds of correlation, smart selection of the most proper copula is of great importance for an accurate description of failure correlation.
In this paper, the Akaike information criterion (AIC) is adopted to estimate the correlation parameters between different variables and identify the most appropriate copula function. AIC is a standard means of measuring the goodness of fit of statistical models, proposed by Akaike, a Japanese statistician, in 1973, which is defined as:
AIC = 2 k 2 ln ( L )
where k is the number of the unknown parameters in the model, and L is the value of the maximum likelihood function. Considering a pair of machines M 1 ,   M 2 in the failure-dependent manufacturing system, L can be expressed by:
L = i = 1 n ln ( c ( F 1 ( m 1 i ) , F 2 ( m 2 i ) ) | θ )
where F 1 ( m 1 ) , F 2 ( m 2 ) denote the marginal CDFs of the MTBF of machines M 1 and   M 2 , respectively. The sample set is denoted by { m 1 i , m 2 i }   ( i = 1 , 2 , , n ), where n is the total number of samples. In general, the difference between two statistical models is mainly reflected by L ; however, when the difference in L is insignificant, the model complexity measured by k becomes dominant. When applying AIC to determine the best model, the model with the smallest AIC is usually considered to be the best among a group of available models.

3.3. Subsystem Reliability Evaluation Based on Fuzzy Inference Model

In this paper, the fuzzy inference model is applied to evaluate the subsystem reliability. The structure of the fuzzy inference system is shown in Figure 2:
(A) Fuzzification: In this step, the clear values of the input data are converted to fuzzy values according to the membership functions, where different forms of membership functions are able to describe different cases of fuzziness. In this paper, the Gaussian membership function is used due to its wide application and advantage in smoothness, as well as better characterization of human thinking. Moreover, the shape of the Gaussian membership function can approximate triangular, trapezoidal, and other membership functions. The Gaussian membership function is expressed by:
f ( x ; σ , c ) = e ( x c ) 2 2 σ 2
where c denotes the abscissa value corresponding to the peak value of the Gaussian membership function, and the standard deviation σ represents the width of the Gaussian membership function curve. The double Gaussian membership function is composed of two Gaussian membership functions, where each Gaussian function defines the one-sided shape of the membership function, and the connection part between the two Gaussian membership functions is defined by f ( x ) = 1 . The images of the Gaussian membership function and double Gaussian membership function are shown in Figure 3.
(B) Fuzzy rule base: Fuzzy rules play the key role in a fuzzy inference system, which are also referred to as if–then rules.
(C) Inference engine: It integrates the input fuzzy sets based on fuzzy rules and exports the integrated output fuzzy sets. Widely used fuzzy inference models include the Sugeno fuzzy inference model and the Mamdani fuzzy inference model. In this paper, the Mamdani fuzzy inference model is applied for logical inference.
(D) Defuzzification: In this step, the fuzzy value obtained by the inference engine is converted back to a clear value, acting as the inference output of the fuzzy inference system. Commonly used defuzzification methods include the maximum membership method and centroid defuzzification method. Considering that the centroid defuzzification method has better sensitivity, which can even respond to a slight change in input, and it also can achieve a smoother output, we apply the centroid defuzzification method in this paper. Specifically, the centroid of the area enclosed by the membership function curve and the horizontal axis is taken as the output value of the fuzzy inference system, which is expressed by:
v 0 = X   x μ V ( x ) d x X   μ V ( x ) d x

3.4. System Reliability Analysis Based on Bayesian Network Model

As pointed out by Lloyd DK et al. in 1962, for a series system composed of n   identical components, the system reliability R n takes the value between the reliability of each component (denoted by R ) and the product of individual reliability (denoted by R n ), with the assumption that the reliability of each component is the same [27]. When the failures of various components are mutually independent, the system-level reliability can be obtained directly from the product of the component-level reliability. However, in most cases, the independent property is not satisfied due to the interaction between failures, thus the effect of such failure dependency needs to be considered for the system reliability. With the assumption that the failures are positively correlated, G. Fang et al. proved that the system reliability satisfies the following properties [28].
  • For a series failure-dependent system,
    i = 1 n R i R m i n R i
  • For a parallel failure-dependent system,
    m a x R i R 1 i = 1 n ( 1 R i )
    where n     is the number of components consisting of the series or parallel system.
Based on the above analysis of the system reliability, a Bayesian network can be used to further analyze the system performance, and is applied in this paper. The Bayesian network is a directed acyclic graph model, which is used to describe the dependence among the variables. It is composed of a series of variable nodes and directed edges connecting these nodes, where the nodes represent the random variables, and the directed edges describe the relationship between these random variables. The strength of the relationship is measured by the conditional probability.
For subevents A , B and the joint event A B in a Bayesian network, the conditional probability P ( A | B ) is denoted by:
P ( A | B ) = P ( A B ) P ( B )
The joint probability P ( X 1 , X 2 , , X n ) of the Bayesian network is expressed by:
P ( X 1 , X 2 , , X n ) = i = 1 n P ( X i | p ( X i ) )
where p ( X i ) denotes the parent node of the current node, and P ( X i | p ( X i ) ) is the conditional probability of the current node with the specified parent node.
A Bayesian network can be used for bidirectional inference, including both causal inference and diagnostic inference. Causal inference is a forward inference procedure starting from priori probability, while diagnostic inference is helpful in dealing with a case with a known result, but where the possible reason for this result is of interest.
(A)
System reliability evaluation
According to the structural relationship between the system components and their failure distributions, the nodes and edges of the Bayesian network, as well as the corresponding parameters, can be determined. Considering a typical series–parallel system consisting of 10 components, in which failure correlation exists in Machine pair 5–6 and Machine pair 7–8, while the failure distributions of the other machines are assumed to be independent, then the construction of the Bayesian network can be described in the following, as shown in Figure 4.
After constructing the Bayesian network according to the manufacturing system, the system reliability can be obtained through Bayesian network inference based on knowledge about the reliability values of the consisting nodes. However, this inference will become quite complicated as the size of the network increases. Generally, the assumption of the conditional independence of nodes can apparently simplify the analysis process of the Bayesian network. Let S denote the event of system failure and W i denote the event of node failure; the probability of system failure can be obtained from Bayesian forward inference, which is expressed as:
P ( S ) = P ( S | W 1 , W 2 , , W n ) · P ( W 1 ) · P ( W 2 ) · · P ( W n )
Combined with Equation (16), and according to the known failure probabilities of the network nodes, the inference results of the system reliability can be achieved. Considering the 10-component system shown in Figure 4, the system reliability can be obtained from the Bayesian network model:
R ( S ) = P ( S = 1 | S 1 = 1 , S 2 = 1 , S 3 = 1 , S 4 = 1 ) · P ( S 1 = 1 ) · P ( S 2 = 1 ) · P ( S 3 = 1 ) · P ( S 4 = 1 ) = R ( S 1 ) · R ( S 2 ) · R ( S 3 ) · R ( S 4 )
For subsystems S 1 and S 2   consisting of failure-independent components, the subsystem reliability can be calculated as:
R ( S 1 ) = P ( S 1 = 1 | M 1 = 1 ) · P ( M 1 = 1 ) = R ( M 1 = 1 )
R ( S 2 ) = 1 P ( S 2 = 0 | M 2 = 0 , M 3 = 0 , M 4 = 0 ) · P ( M 2 = 0 ) · P ( M 3 = 0 ) · P ( M 4 = 0 ) = 1 ( 1 R ( M 2 ) ) · ( 1 R ( M 3 ) ) · ( 1 R ( M 4 ) )
For subsystem S 3 consisting of failure-correlated components Machine 5 and Machine 6, where the failure correlation is descripted by copula functions, the reliability value can be calculated as:
R ( S 3 ) = R ( M 56 ) = R ( M 5 ) + R ( M 6 ) C 56
where   C 56 denotes the value of the copula function describing the failure correlation of Machine pair 5–6.
For subsystem S 4 consisting of subsystem S 5 and failure-correlated components Machine 7 and Machine 8, where the failure correlation is descripted by copula functions, the reliability of Machine pair 7–8 needs to be calculated first:
R ( M 78 ) = C 78
where C 78 denotes the value of the copula function describing the failure correlation of Machine pair 7–8. Then the reliability value of subsystem S 4   can be calculated as:
R ( S 4 ) = 1 P ( S 4 = 0 | M 78 = 0 , S 5 = 0 ) · P ( M 78 = 0 ) · ( 1 P ( S 5 = 1 | M 9 = 1 , M 10 = 1 ) · P ( M 9 = 1 ) · P ( M 10 = 1 ) ) = 1 ( 1 R ( M 78 ) ) · ( 1 R ( M 9 ) · R ( M 10 ) )
(B)
Component importance analysis
Moreover, by applying the reverse inference function of the Bayesian network, the node importance can be obtained, which can be used to judge which components have a vital impact on the system reliability. Birnbaum importance is used to describe the impact of a change in component reliability on the change in the system reliability. It can measure the difference in system reliability when a component in working state turns to failure. For system component i , the Birnbaum importance can be calculated as:
I B   ( i ) = P r { ϕ ( S ) = 1 | M i = 1 } P r { ϕ ( S ) = 1 | M i = 0 }
Taking Machine 1 as an example, the Birnbaum importance is expressed by:
I B   ( 1 ) = P r { ϕ ( S ) = 1 | M 1 = 1 } P r { ϕ ( S ) = 1 | M 1 = 0 } = P ( S = 1 | S 1 = 1 , S 2 = 1 , S 3 = 1 , S 4 = 1 ) · [ P ( S 1 = 1 | M 1 = 1 ) · P ( M 1 = 1 ) ] · P ( S 2 = 1 ) · P ( S 3 = 1 ) · P ( S 4 = 1 ) / P ( M 1 = 1 ) = R ( S 2 ) · R ( S 3 ) · R ( S 4 )
Similarly, for each machine in the manufacturing system modeled by the Bayesian network, the corresponding Birnbaum importance can be obtained in this way:
I B   ( 2 ) = R ( S 1 ) · R ( S 3 ) · R ( S 4 ) R ( S 1 ) · ( 1 ( 1 R ( M 3 ) ) · ( 1 R ( M 4 ) ) ) · R ( S 3 ) · R ( S 4 )
I B   ( 3 ) = R ( S 1 ) · R ( S 3 ) · R ( S 4 ) R ( S 1 ) · ( 1 ( 1 R ( M 2 ) ) · ( 1 R ( M 4 ) ) ) · R ( S 3 ) · R ( S 4 )
I B   ( 4 ) = R ( S 1 ) · R ( S 3 ) · R ( S 4 ) R ( S 1 ) · ( 1 ( 1 R ( M 2 ) ) · ( 1 R ( M 3 ) ) ) · R ( S 3 ) · R ( S 4 )
I B   ( 56 ) = R ( S 1 ) · R ( S 2 ) · R ( S 4 )
I B   ( 78 ) = R ( S 1 ) · R ( S 2 ) · R ( S 3 ) R ( S 1 ) · R ( S 2 ) · R ( S 3 ) · ( R ( M 9 ) · R ( M 10 ) )
I B   ( 9 ) = R ( S 1 ) · R ( S 2 ) · R ( S 3 ) · ( 1 ( 1 R ( M 78 ) ) · ( 1 R ( M 10 ) ) ) R ( S 1 ) · R ( S 2 ) · R ( S 3 ) · R ( M 78 )
I B   ( 10 ) = R ( S 1 ) · R ( S 2 ) · R ( S 3 ) · ( 1 ( 1 R ( M 78 ) ) · ( 1 R ( M 9 ) ) ) R ( S 1 ) · R ( S 2 ) · R ( S 3 ) · R ( M 78 )
Based on the analysis results of system reliability and component importance, further system fault diagnosis can be undertaken, as well as timely maintenance decisions, as shown in the proposed system reliability analysis framework in Figure 1. For maintenance decision making, an intuitive and effective solution is comparing the obtained evaluation results of system reliability to a properly pre-set threshold, and maintenance operations are recommended when the reliability evaluation result falls below the threshold. Liu et al. studied the dynamic preventive maintenance strategy of the continuous degradation system of components. When the system reliability is lower than a certain threshold, the maintenance operation is triggered [29]. D. Valis et al. modeled the field data of a drinking water distribution system, and predicted the behavior and future state of water mains, providing a reference and guidance for the maintenance model [30]. In future study, we will attempt to make full use of the system reliability evaluation results to decide the optimal time of maintenance intervention. Moreover, based on the analysis results of component importance, which can highlight the components that should be paid more attention and recommended for further diagnosis, appropriate and timely maintenance decisions can be made.

4. Case Study

4.1. Experiment Description

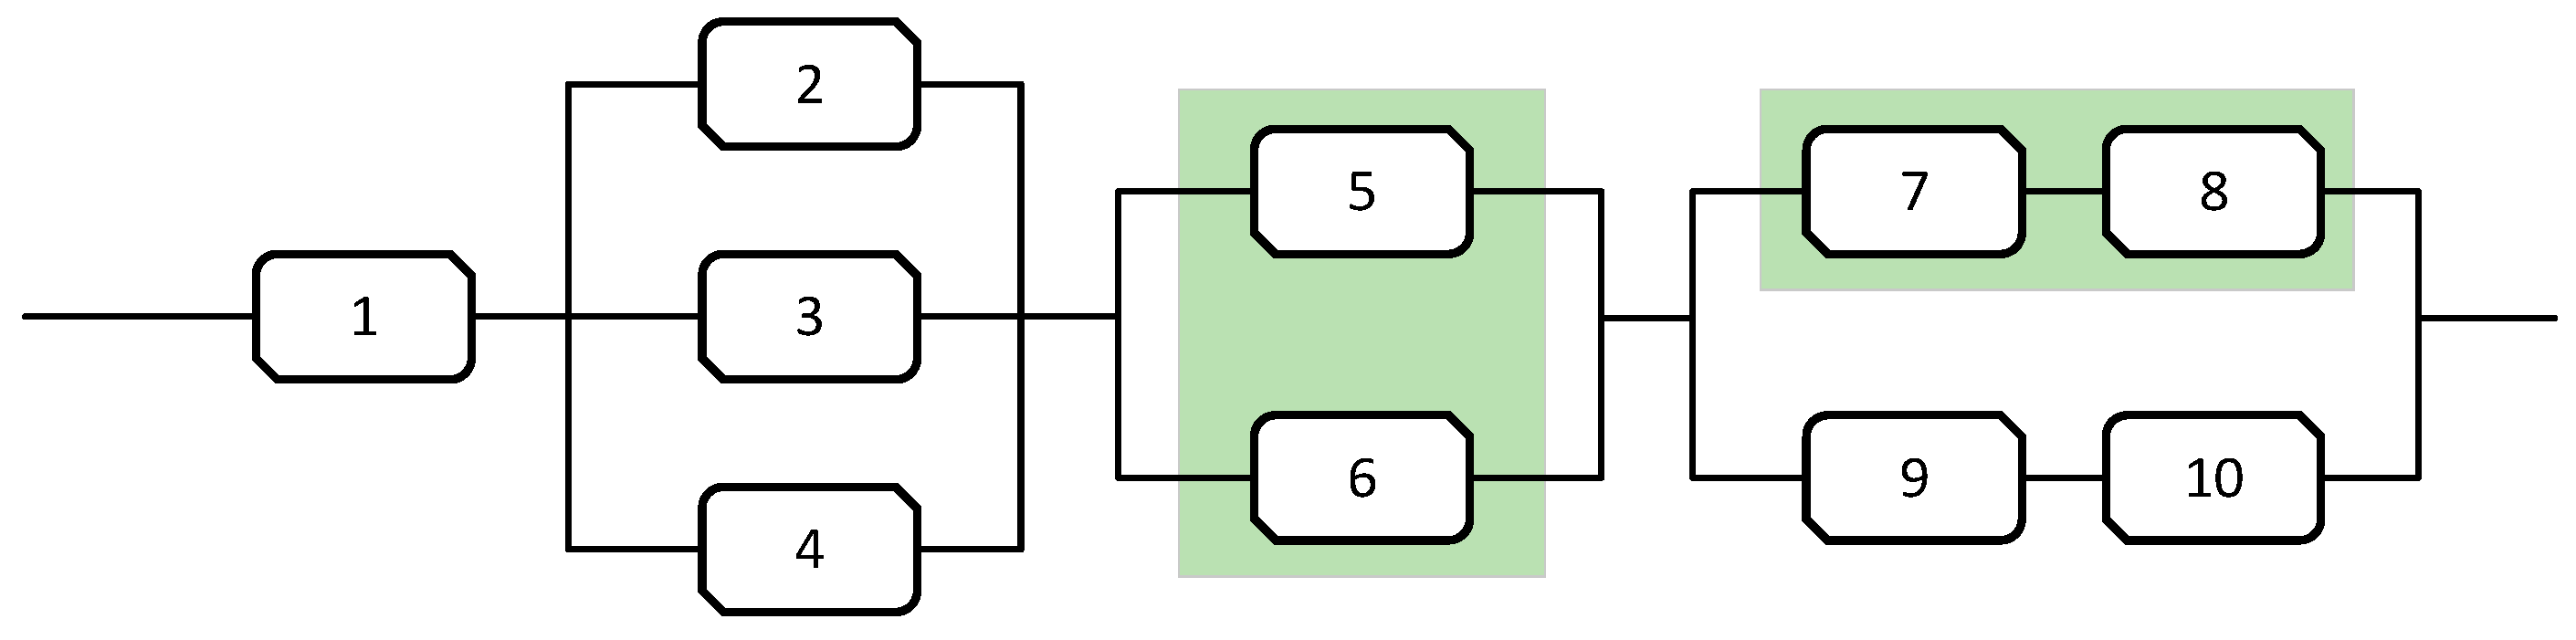
In this section, we show how the proposed reliability analysis framework can be applied in a typical series–parallel manufacturing system through a 10-component system with the structure sketched in Figure 5. Note that the structure is general, and can be extended to any combinations of series, parallel, or series–parallel configurations.
As shown in Figure 5, the manufacturing system consists of 10 machines numbered from 1 to 10. To model the degradation process of the machines, data of the “Predictive Useful Life based into telemetry” project are used, which includes plentiful information, such as the age and RUL of each machine, as well as the reasons of failures. Here, the RUL data measure the time interval between two consecutive failures of a machine, and are equivalent to the MTBF data. Part of the project data is shown in Table 1.
Based on the collected machine MTBF data, data analysis and data distribution fitting for each machine can be undertaken. In this paper, the widely used Weibull distribution is used to fit the MTBF data of each machine with the corresponding age, which has the following expression:
f ( x ; β , η ) = { β η ( x η ) β 1 e ( x η ) β ,   x < 0 0 ,   x 0
where β is the shape parameter and η is the size parameter. Through investigation of the data distributions of the machines, failure-correlated machines can be identified. In this paper, due to the limit of acquiring failure-correlated machine data, we assume that prior knowledge of failure correlation is available, and parallel Machine pair 5–6 and series Machine pair 7–8 are assumed to be failure-correlated, while the failure distributions of the other machines are assumed to be independent. In this case, we also generate some MTBF data using Monte Carlo simulation and apply Weibull distributions for data distribution fitting of the failure-correlated machine pairs.
For general considerations in our case, the age of Machines 1, 2, 3, 4, 9, 10 are assumed to be 14, while those of Machine 5 and Machine 7 are assumed to be 15 and 18, respectively.
It can be obtained from the data that the degradation of Machines 1, 2, 3, 4, 9, 10 obeys a Weibull distribution with β = 2.2042, η = 58.7760; the degradation of Machine 5 obeys a Weibull distribution with β = 2.4571, η = 54.2726; and the degradation of Machine 7 obeys a Weibull distribution with β = 3.6041, η = 50.0640. Due to the existence of fault correlation in Machine pair 5–6, as well as Machine pair 7–8, we generate the MTBF data of Machine 6 based on the data of Machine 5 using Monte Carlo simulation. Similarly, the MTBF data of Machine 8 are generated based on the data of Machine 7. After data distribution fitting by the Weibull distribution, it can be obtained that the degradation of Machine 6 obeys a Weibull distribution with β = 2.7815, η = 52.0825, and the degradation of Machine 8 follows a Weibull distribution with β = 3.4973, η = 46.1239 through Monte Carlo simulation.
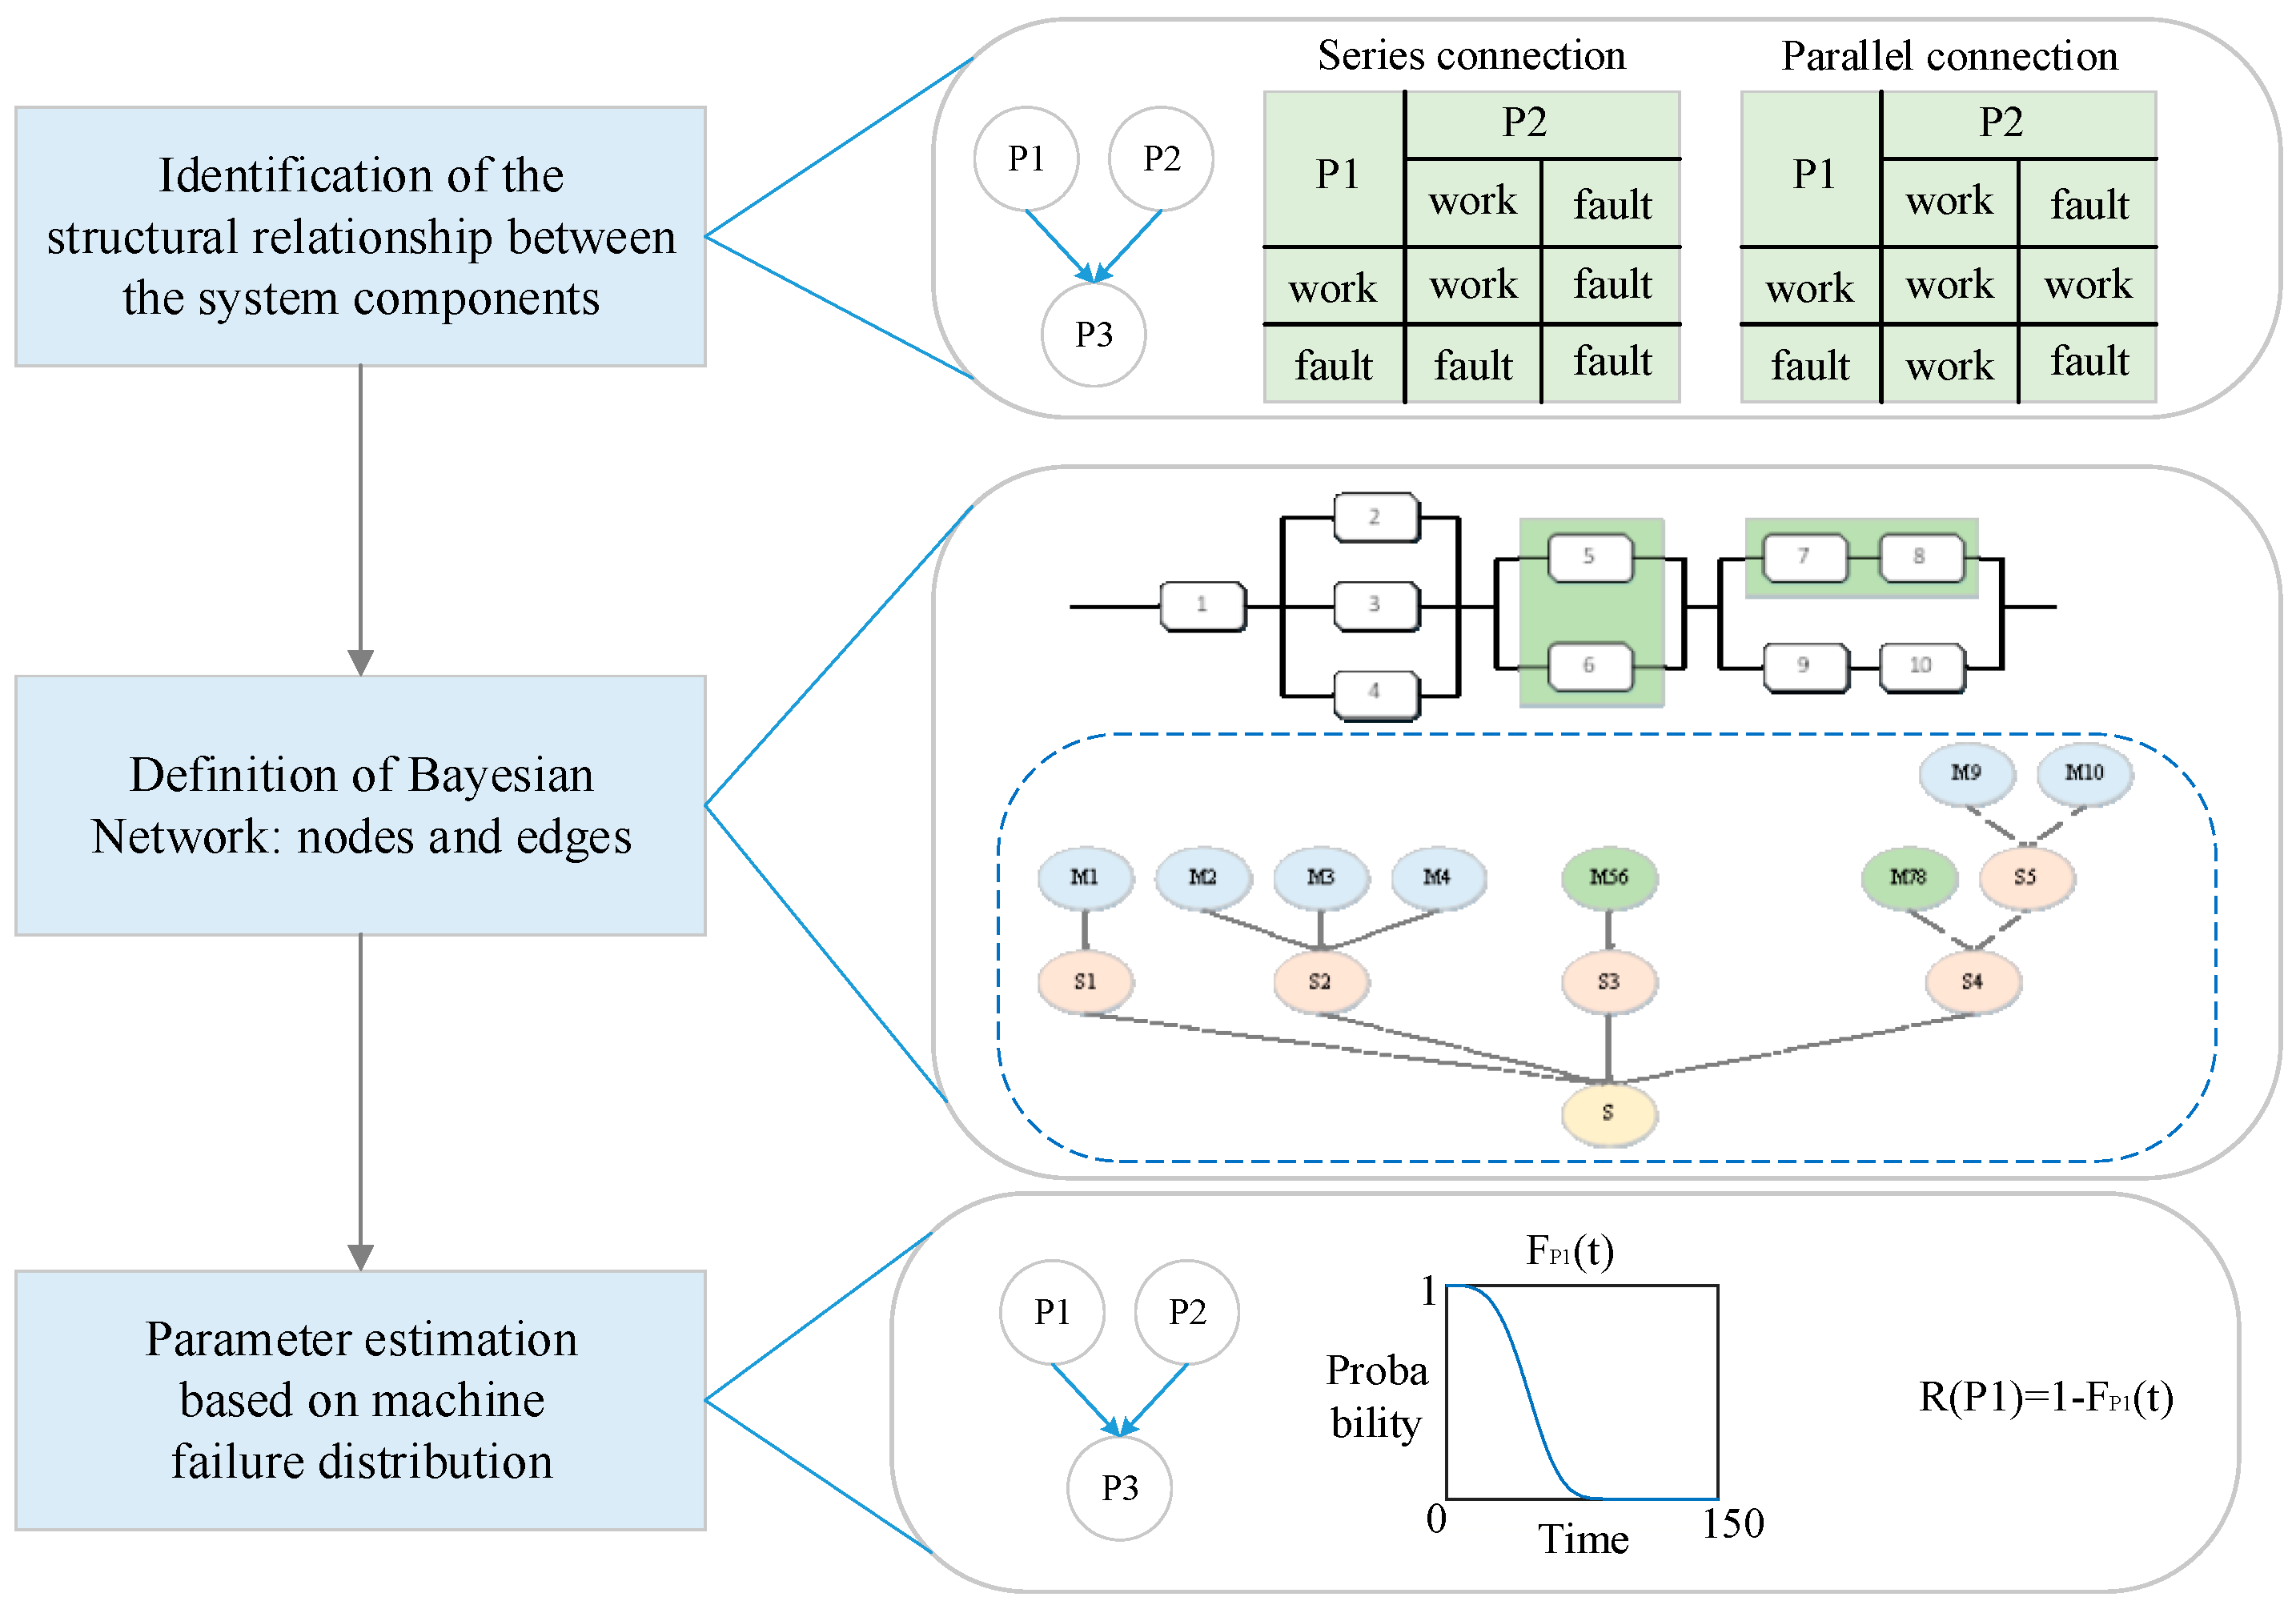
According to Figure 4 regarding the Bayesian network construction in Section 3.4, a Bayesian network based on the 10-component system can be constructed.

4.2. Failure Correlation Analysis

In this section, copula functions are used to characterize the failure correlations of Machine pair 5–6 and of Machine pair 7–8. Firstly, proper types of copula functions are selected to describe the failure correlation between the machines, based on the AIC value introduced in Section 3.2. Then, the corresponding parameters of the selected copula functions are optimized to achieve more appropriate descriptions of the failure correlations.
(A)
Copula function selection
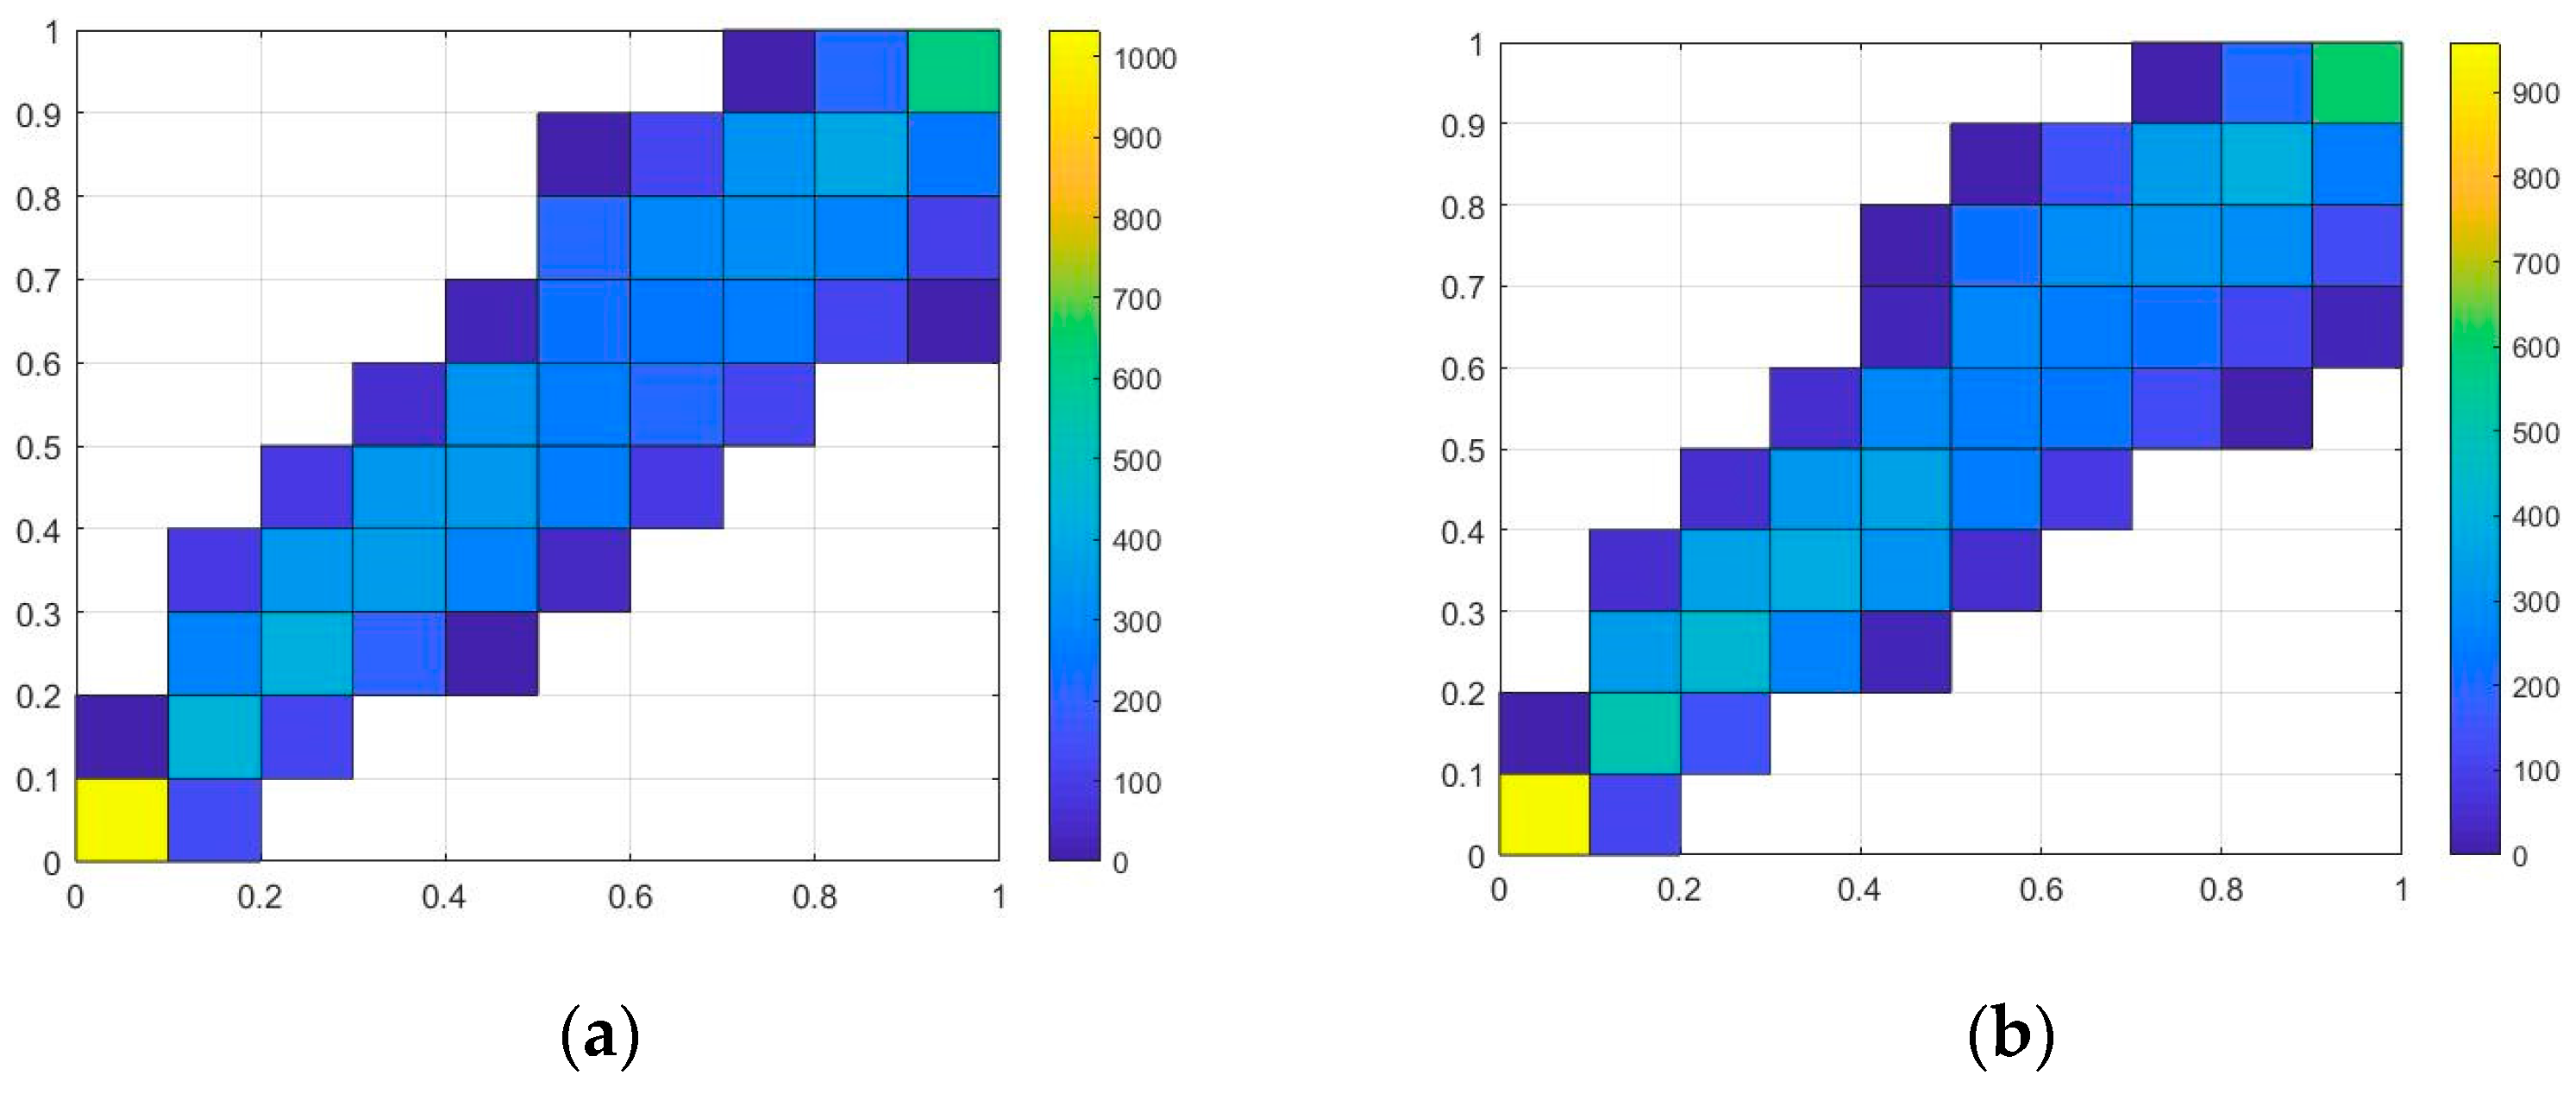
Through investigating the binary histogram of reliability values of Machine pair 5–6 and of Machine pair 7–8, as shown in Figure 6, it can be seen that there exists an apparent upper-tail correlation and a less obvious correlation in both binary histograms. According to the introduction of different types of copula functions in Section 3.2, the Frank copula function, which is commonly used to describe variables with both upper-tail and lower-tail correlations, seems a suitable choice.
To verify this hypothesis, different types of copula functions, including Clayton copula, Frank copula, Gumbel copula, Gaussian copula, and t copula, are applied to describe the correlations between reliability values of Machine pair 5–6 and Machine pair 7–8. Then, the AIC values corresponding to the five types of copula functions are calculated for both machine pairs. The calculation results for Machine pair 5–6 and Machine pair 7–8 are presented in Table 2 and Table 3, respectively. It can be seen that for Machine pair 5–6, the Frank copula with the smallest AIC value is considered to be the best model to describe the correlation between Machine 5 and Machine 6. Similarly, the AIC value of the Frank copula is the smallest for Machine pair 7–8, indicating that the Frank copula is the most appropriate model for describing the correlation between Machine 7 and Machine 8. The verification results coincide with our preliminary conclusions from reading the binary histograms of reliability values as shown in Figure 6.
(B)
Parameter optimization of copula function
So far, the Frank copula with the form expressed by Equation (8) has been selected as the most proper type of copula function to model the failure correlation for Machine pair 5–6 and Machine pair 7–8. For the next step, the value of parameter θ in Equation (8) must be optimized for a reliable description. By applying the maximum likelihood estimation method, we can determine that θ takes the value in the range [13.1812, 13.8507] in a 95% confidence interval for Machine pair 5–6, while for Machine pair 7–8, θ takes the value in the range [15.5882, 16.4106] in a 95% confidence interval.
With the objective of minimizing the AIC value corresponding to θ , the optimal value of θ can be achieved. For Machine pair 5–6, the optimal parameter θ * = 13.5193 , while for Machine pair 7–8, the optimal parameter θ * = 15.9952 
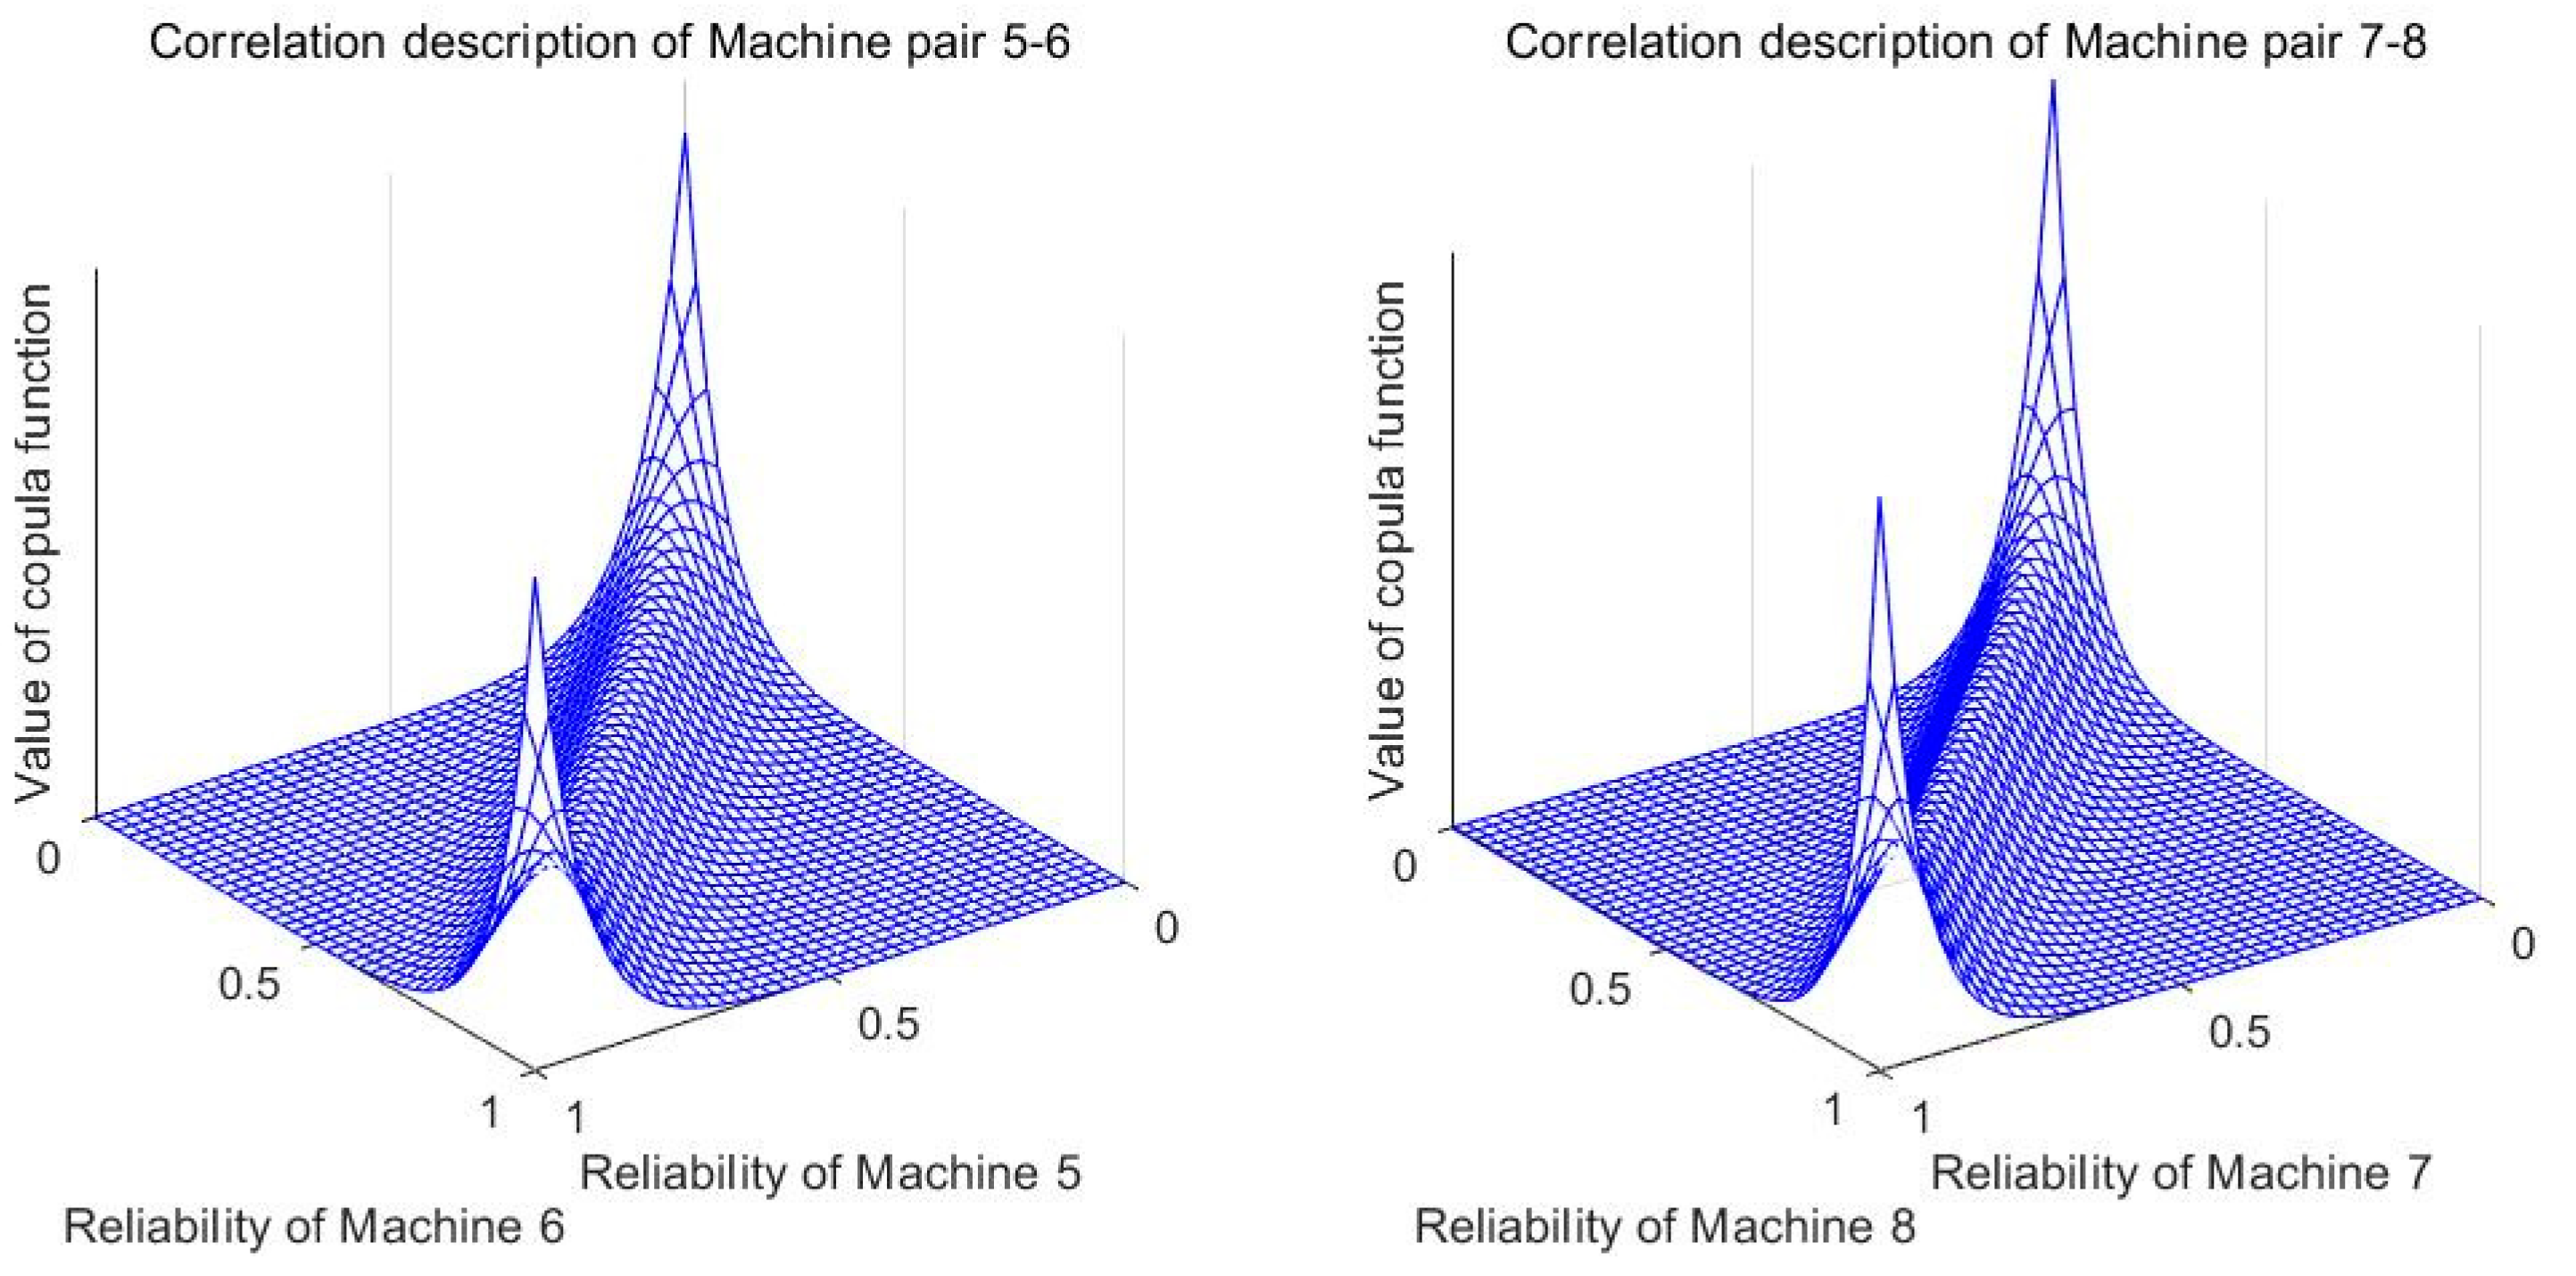
. The images of Frank copula functions with optimized parameters for Machine pair 5–6 and Machine pair 7–8 are shown in Figure 7. It can be seen that the images show apparent lower-tail correlation and upper-tail correlation, which are in accordance with the binary histograms shown in Figure 6. To summarize, Frank copula functions with optimized parameters can provide an appropriate description of the failure correlations.

4.3. Construction of the Fuzzy Inference System

According to Figure 2 regarding the fuzzy inference system for the evaluation of subsystem reliability in Section 3.3, a fuzzy inference system is constructed for the 10-component system. The details are provided in the following.
(A)
Fuzzification: membership function design
In the considered system with the structure shown in Figure 5, assuming that all the machines are independent of each other, i.e., no failure correlation exists in this system, then the reliability value of the subsystem consisting of Machine 5 and Machine 6 can be obtained by:
R 56 = 1 ( 1 R 5 ) · ( 1 R 6 )
Under the same assumption, the reliability value of the subsystem consisting of Machine 7 and Machine 8 is given by:
R 78 = R 7 · R 8
However, the failure correlation actually exists in the system; let R 56 and R 78 denote the reliability value of the failure-correlated parallel subsystem consisting of Machine 5 and Machine 6 and that of the failure-correlated series subsystem consisting of Machine 7 and Machine 8, respectively. Let   C 56 and C 78 
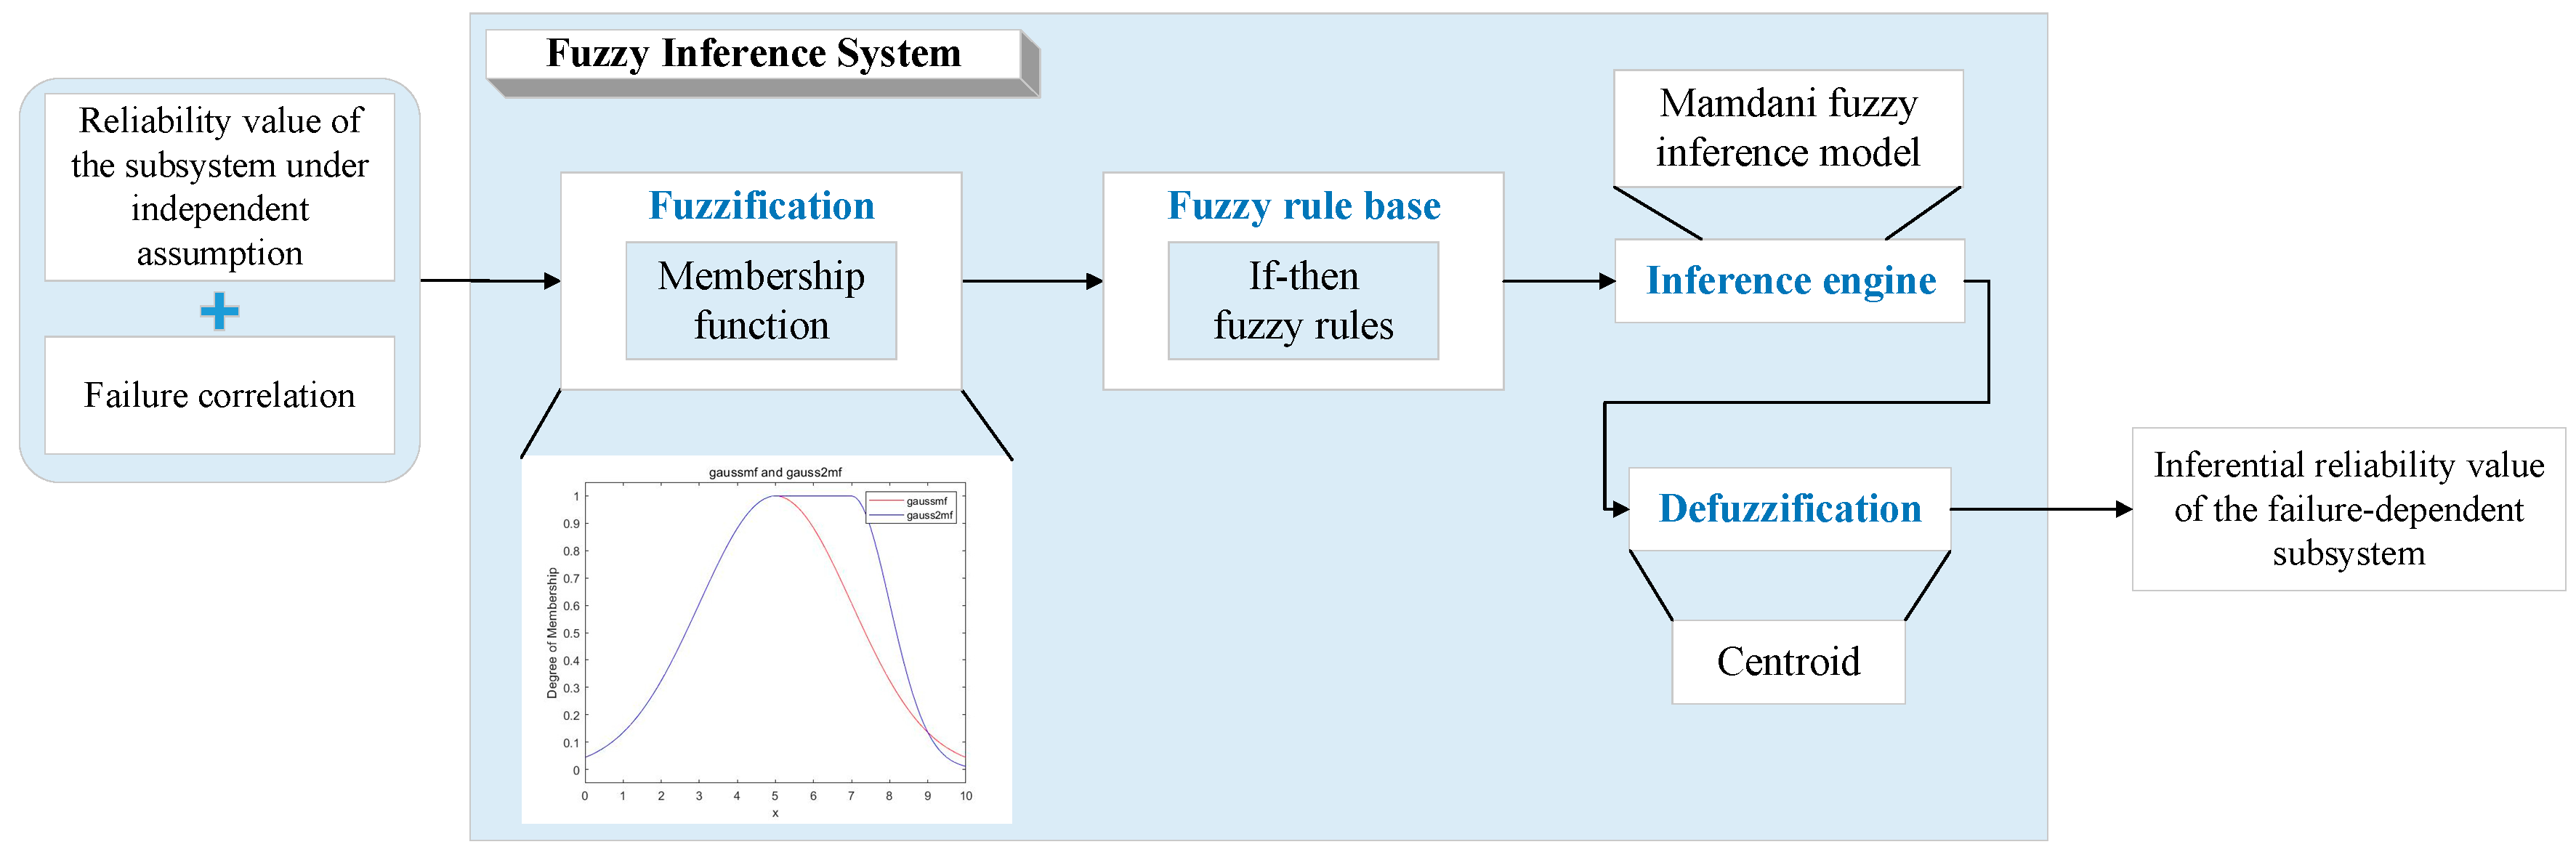
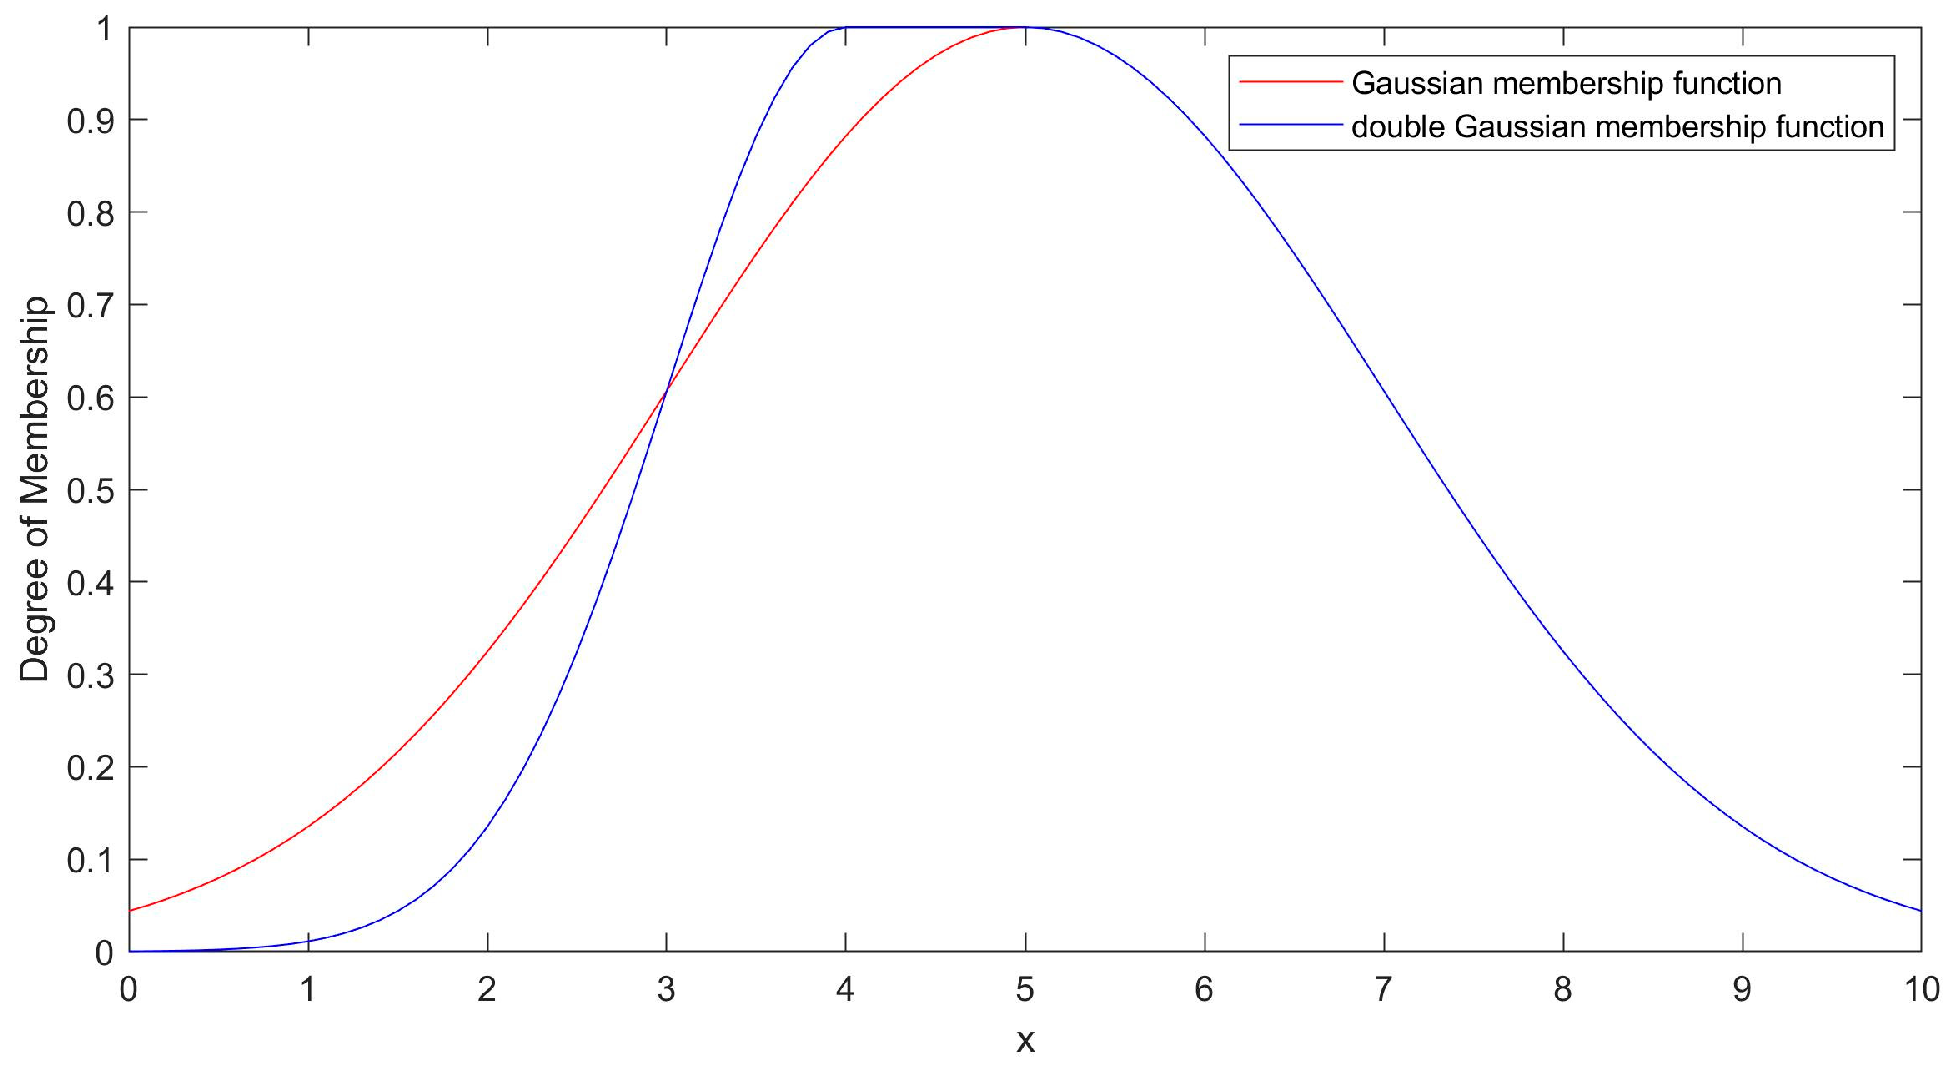
denote the value of the copula function describing the failure correlation in Machine pair 5–6 and Machine pair 7–8, respectively. In this paper, we use the Gaussian membership function and the double Gaussian membership function to describe the fuzziness of data. As introduced in Section 3.3, the Gaussian membership function has two parameters c and σ , while for the double Gaussian membership function, parameters c 1 , σ 1 describe the left-hand shape of the membership function, and c 2 , σ 2 describe the right-hand shape of the membership function. In our case study, the parameters of the membership functions composed of the Gaussian function and double Gaussian function designed for   C 56 and C 78 are presented in Table 4. The parameters of the membership functions composed of the Gaussian function and double Gaussian function designed for   R 56 and R 78 , R 56 and R 78 are exhibited in Table 5 and Table 6, respectively.
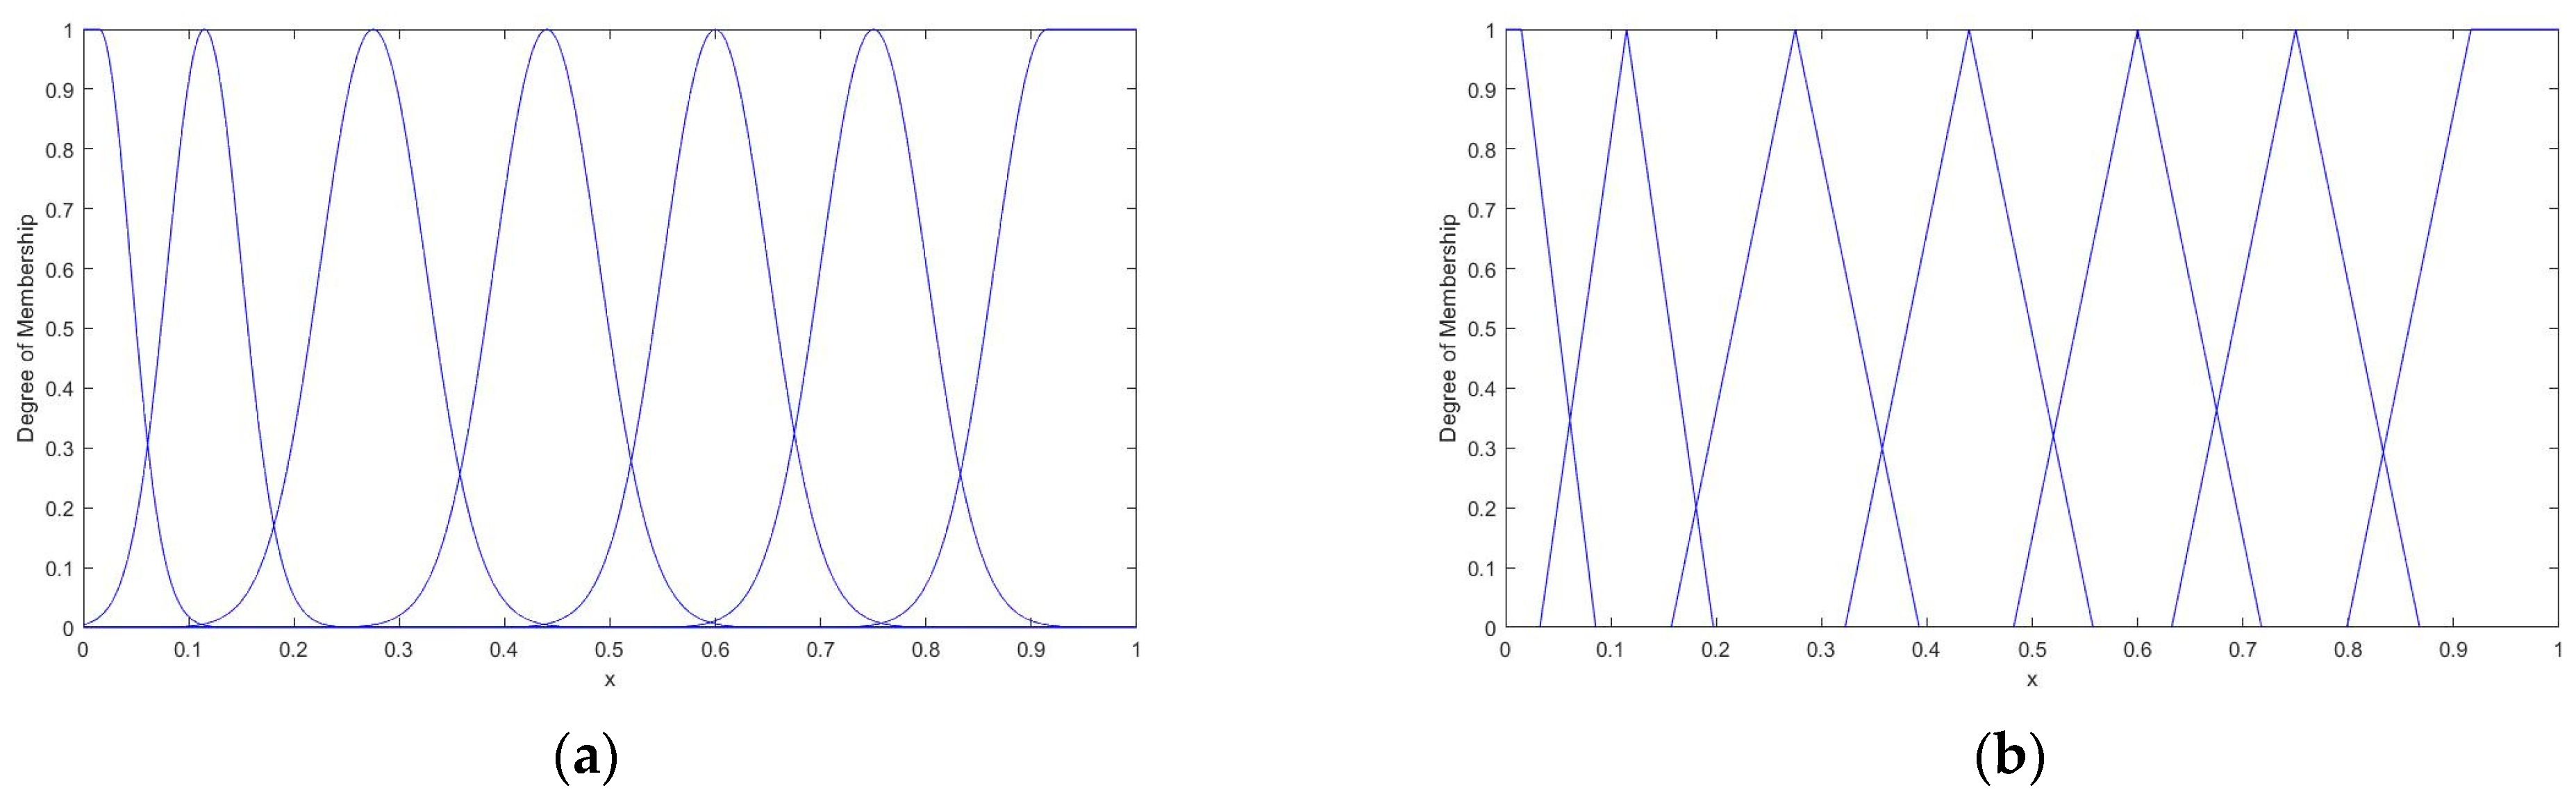
Alternatively, other types of membership functions, such as the triangular membership function and trapezoidal membership function, can be used in the fuzzification step. Taking   C 56 as an example, the failure correlation description by different choices of membership functions is shown in Figure 8. Further comparison results of reliability evaluation based on different descriptions of failure correlation will be provided in Section 4.4.
(B)
Fuzzy rule design
As a key part in a fuzzy inference system, fuzzy rules need to be properly designed. From Equation (13), it can be found that for a series system, the system reliability takes the minimum value when all components are independent. When failure correlation exists in the system, the system reliability inferred by the fuzzy inference system should take a larger value than that of a failure independent system. Combined with Equation (22) introduced in Section 3.4, it can be found that as the failure correlation measured by copula function increases, the inference result of the system reliability is supposed to increase. For a parallel system, it can be seen from Equation (14) that the system reliability takes the maximum value when all components are independent. With failure correlation, the system reliability inferred by the fuzzy inference system should take a smaller value when compared with a failure independent system. Combined with Equation (21) introduced in Section 3.4, it can be concluded that the inferred value of the system reliability is supposed to decrease as the failure correlation measured by the copula function increases. Our fuzzy rule design follows these conclusions. Moreover, expert experience is integrated in fuzzy rule design, especially for practical systems.
For Machine pair 5–6 connected in parallel, the fuzzy rule has the form “if R 56 = A and C 56 = B , then R 56 = C ”. Similarly, for Machine pair 7–8 connected in series, the fuzzy rule has the form “if R 78 = A and C 78 = B , then R 78 = C ”. In order to model various degrees of failure correlation among components in practical systems, we take two cases as examples, namely, weak failure correlation and strong failure correlation, to show our fuzzy rule design according to different degrees of failure correlation.
The fuzzy rules designed for weak and strong failure correlation of Machine pair 5–6 are shown in Table 7 and Table 8, respectively, while the fuzzy rules designed for weak and strong failure correlation of Machine pair 7–8 are shown in Table 9 and Table 10, respectively.
(C)
Inference engine
In this paper, the inference engine obtains the fuzzy inference results of the system reliability based on the membership function and fuzzy rule design introduced in (A) and (B).
(D)
Defuzzification
In this step, the piecewise defuzzification method is applied to achieve better results for extreme cases. The steps are shown as follows:
(1) For the part with subsystem reliability R 0.98 under the independence assumption, the maximum value of the membership function when the membership degree is 0.99 is used for defuzzification.
(2) For the part with subsystem reliability R 0.02 under the independence assumption, the minimum value of the membership function when the membership degree is 0.99 is used for defuzzification.
(3) For the part of subsystem reliability 0.02 < R < 0.98 under the independence assumption, the centroid method is used for defuzzification.

4.4. System Reliability Analysis

In this section, the evaluation results of subsystem reliability for Machine pair 5–6 and Machine pair 7–8 by applying the proposed method are presented. Comparison results with the copula Bayesian network method are also provided. Based on the Bayesian network construction of the 10-component system and the subsystem reliability evaluation results for Machine pair 5–6 and Machine pair 7–8, the reliability evaluation results of the whole system in different cases are presented. Additionally, we conduct the machine importance analysis as introduced and calculated in Section 3.4.
(A)
Subsystem reliability evaluation
In this section, we focus on parallel Machine pair 5–6 and series Machine pair 7–8 and make subsystem reliability inference. For the proposed method, both cases of weak failure correlation and strong failure correlation are considered.
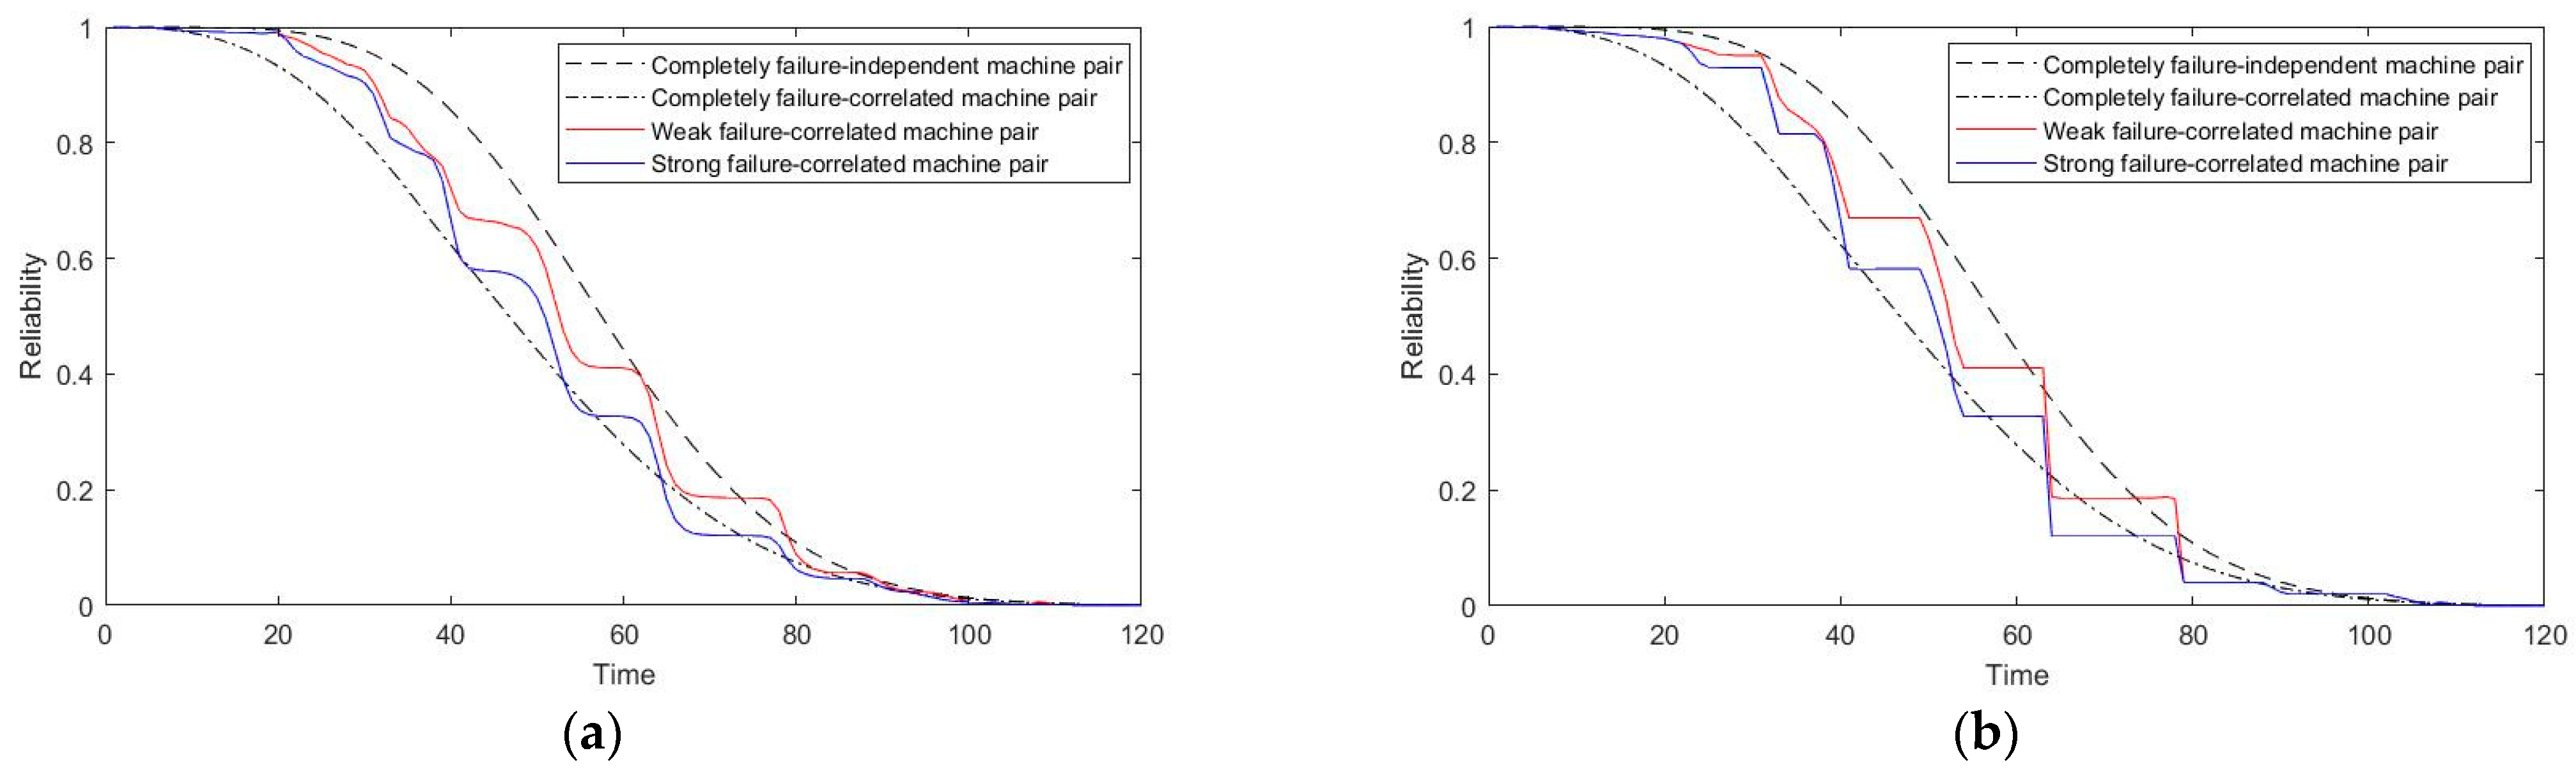
Considering Machine pair 5–6, the subsystem reliability inference results under weak fault correlation and strong fault correlation using the Gaussian membership function and double Gaussian membership function are shown in Figure 9a, while 
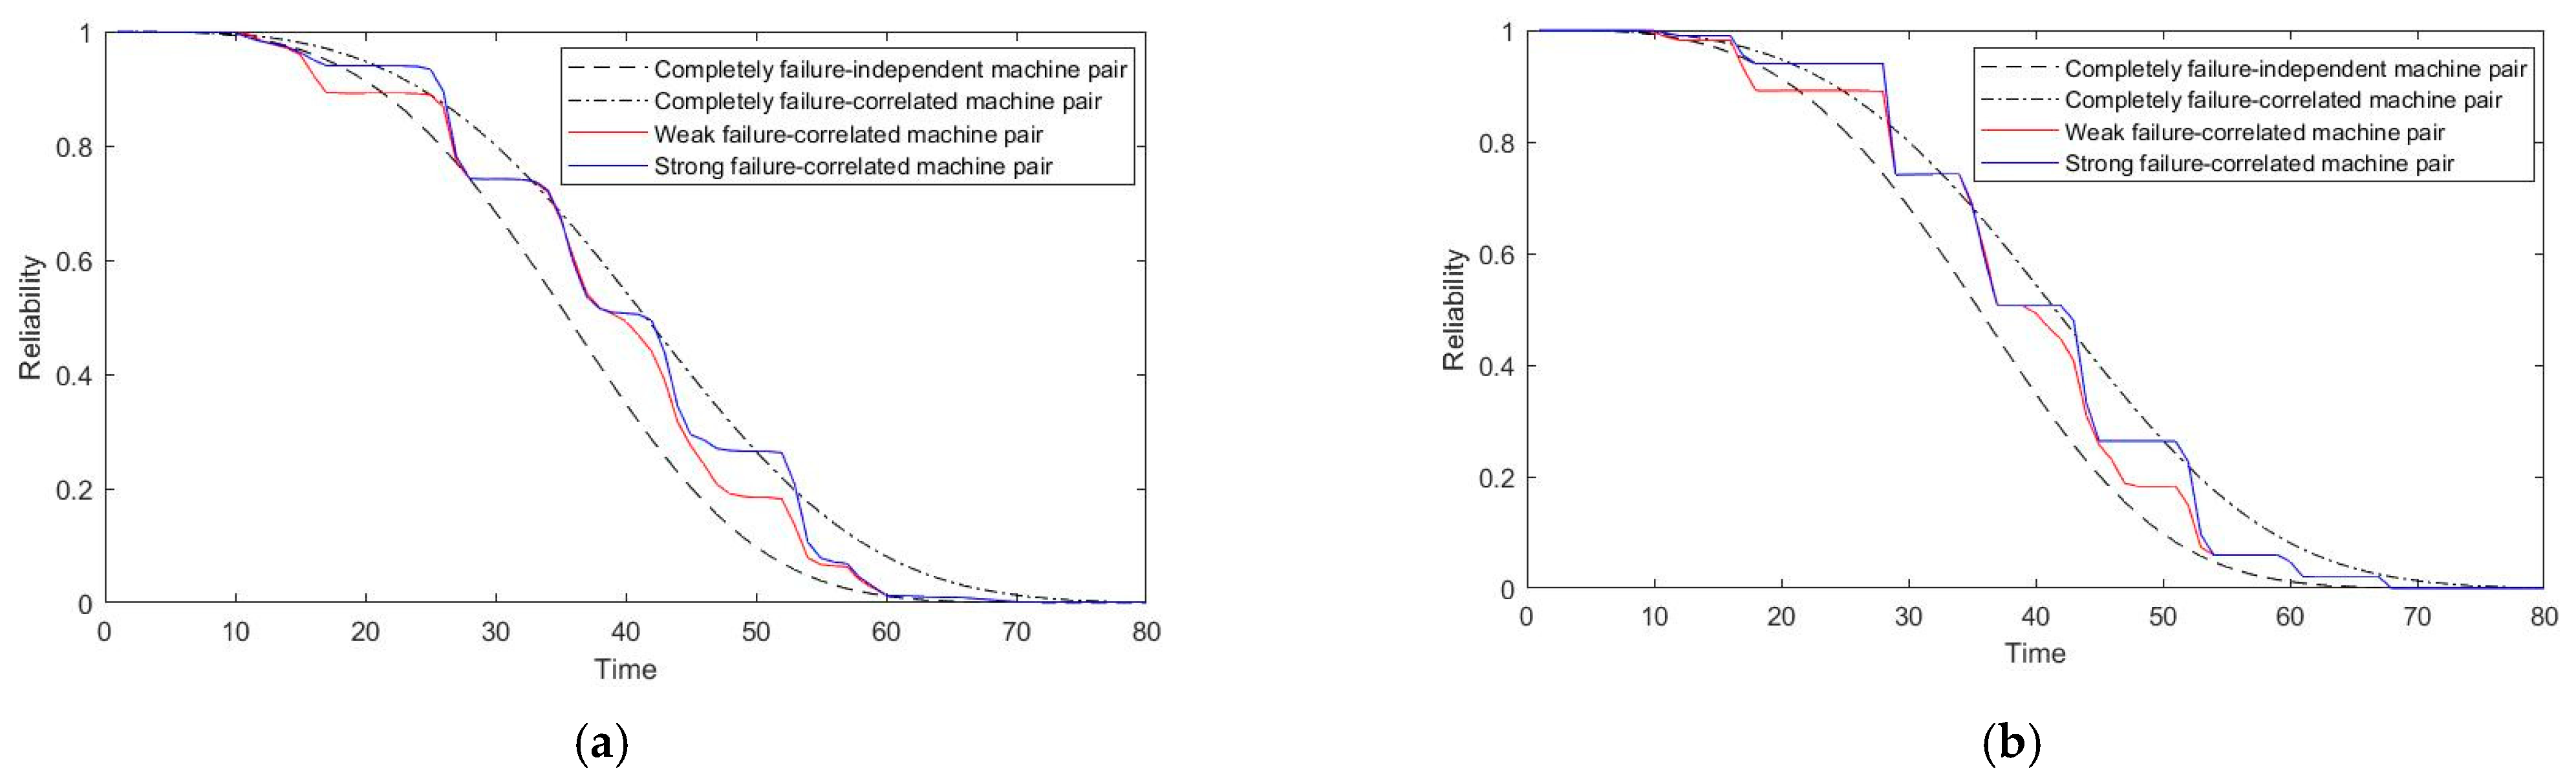
Figure 9b presents the subsystem reliability inference results with different choices of membership functions. Similarly, for Machine pair 7–8, the subsystem reliability inference results under weak fault correlation and strong fault correlation based on different selections of membership functions are exhibited in Figure 10.
It can be seen from Figure 9 and Figure 10 that the proposed method can achieve reasonable and effective inference results of system reliability under different cases. Being capable of describing different degrees of failure correlation among the components within a system, the proposed method can have wide applications in practical manufacturing systems. Moreover, by comparing Figure 9a,b, it is obvious that using the Gaussian membership function and double Gaussian membership function can achieve smoother inference results of subsystem reliability. A similar conclusion can be obtained from the comparison results presented in Figure 10a,b, which also verifies our choice of the Gaussian membership function and double Gaussian membership function in this paper.
The subsystem reliability inference results of the proposed method in different cases, i.e., weak failure correlation and strong failure correlation, are also compared with the reliability of the failure-independent subsystem, and the reliability inference results when the copula Bayesian network method is used. The comparison results are shown in Table 11 and Table 12, respectively.
It can be seen that for parallel systems, the reliability inference results of the proposed method have lower values than the reliability values under independence assumptions, whereas for series systems, the subsystem reliability inference results of the proposed method have higher values than the reliability values under independence assumptions. This is also the case for the copula Bayesian network method. The inference results are reasonable. Moreover, we can find that the piecewise defuzzification method applied in this paper can effectively deal with the extreme cases when the reliability value approximates 1 or 0.
(B)
System reliability evaluation
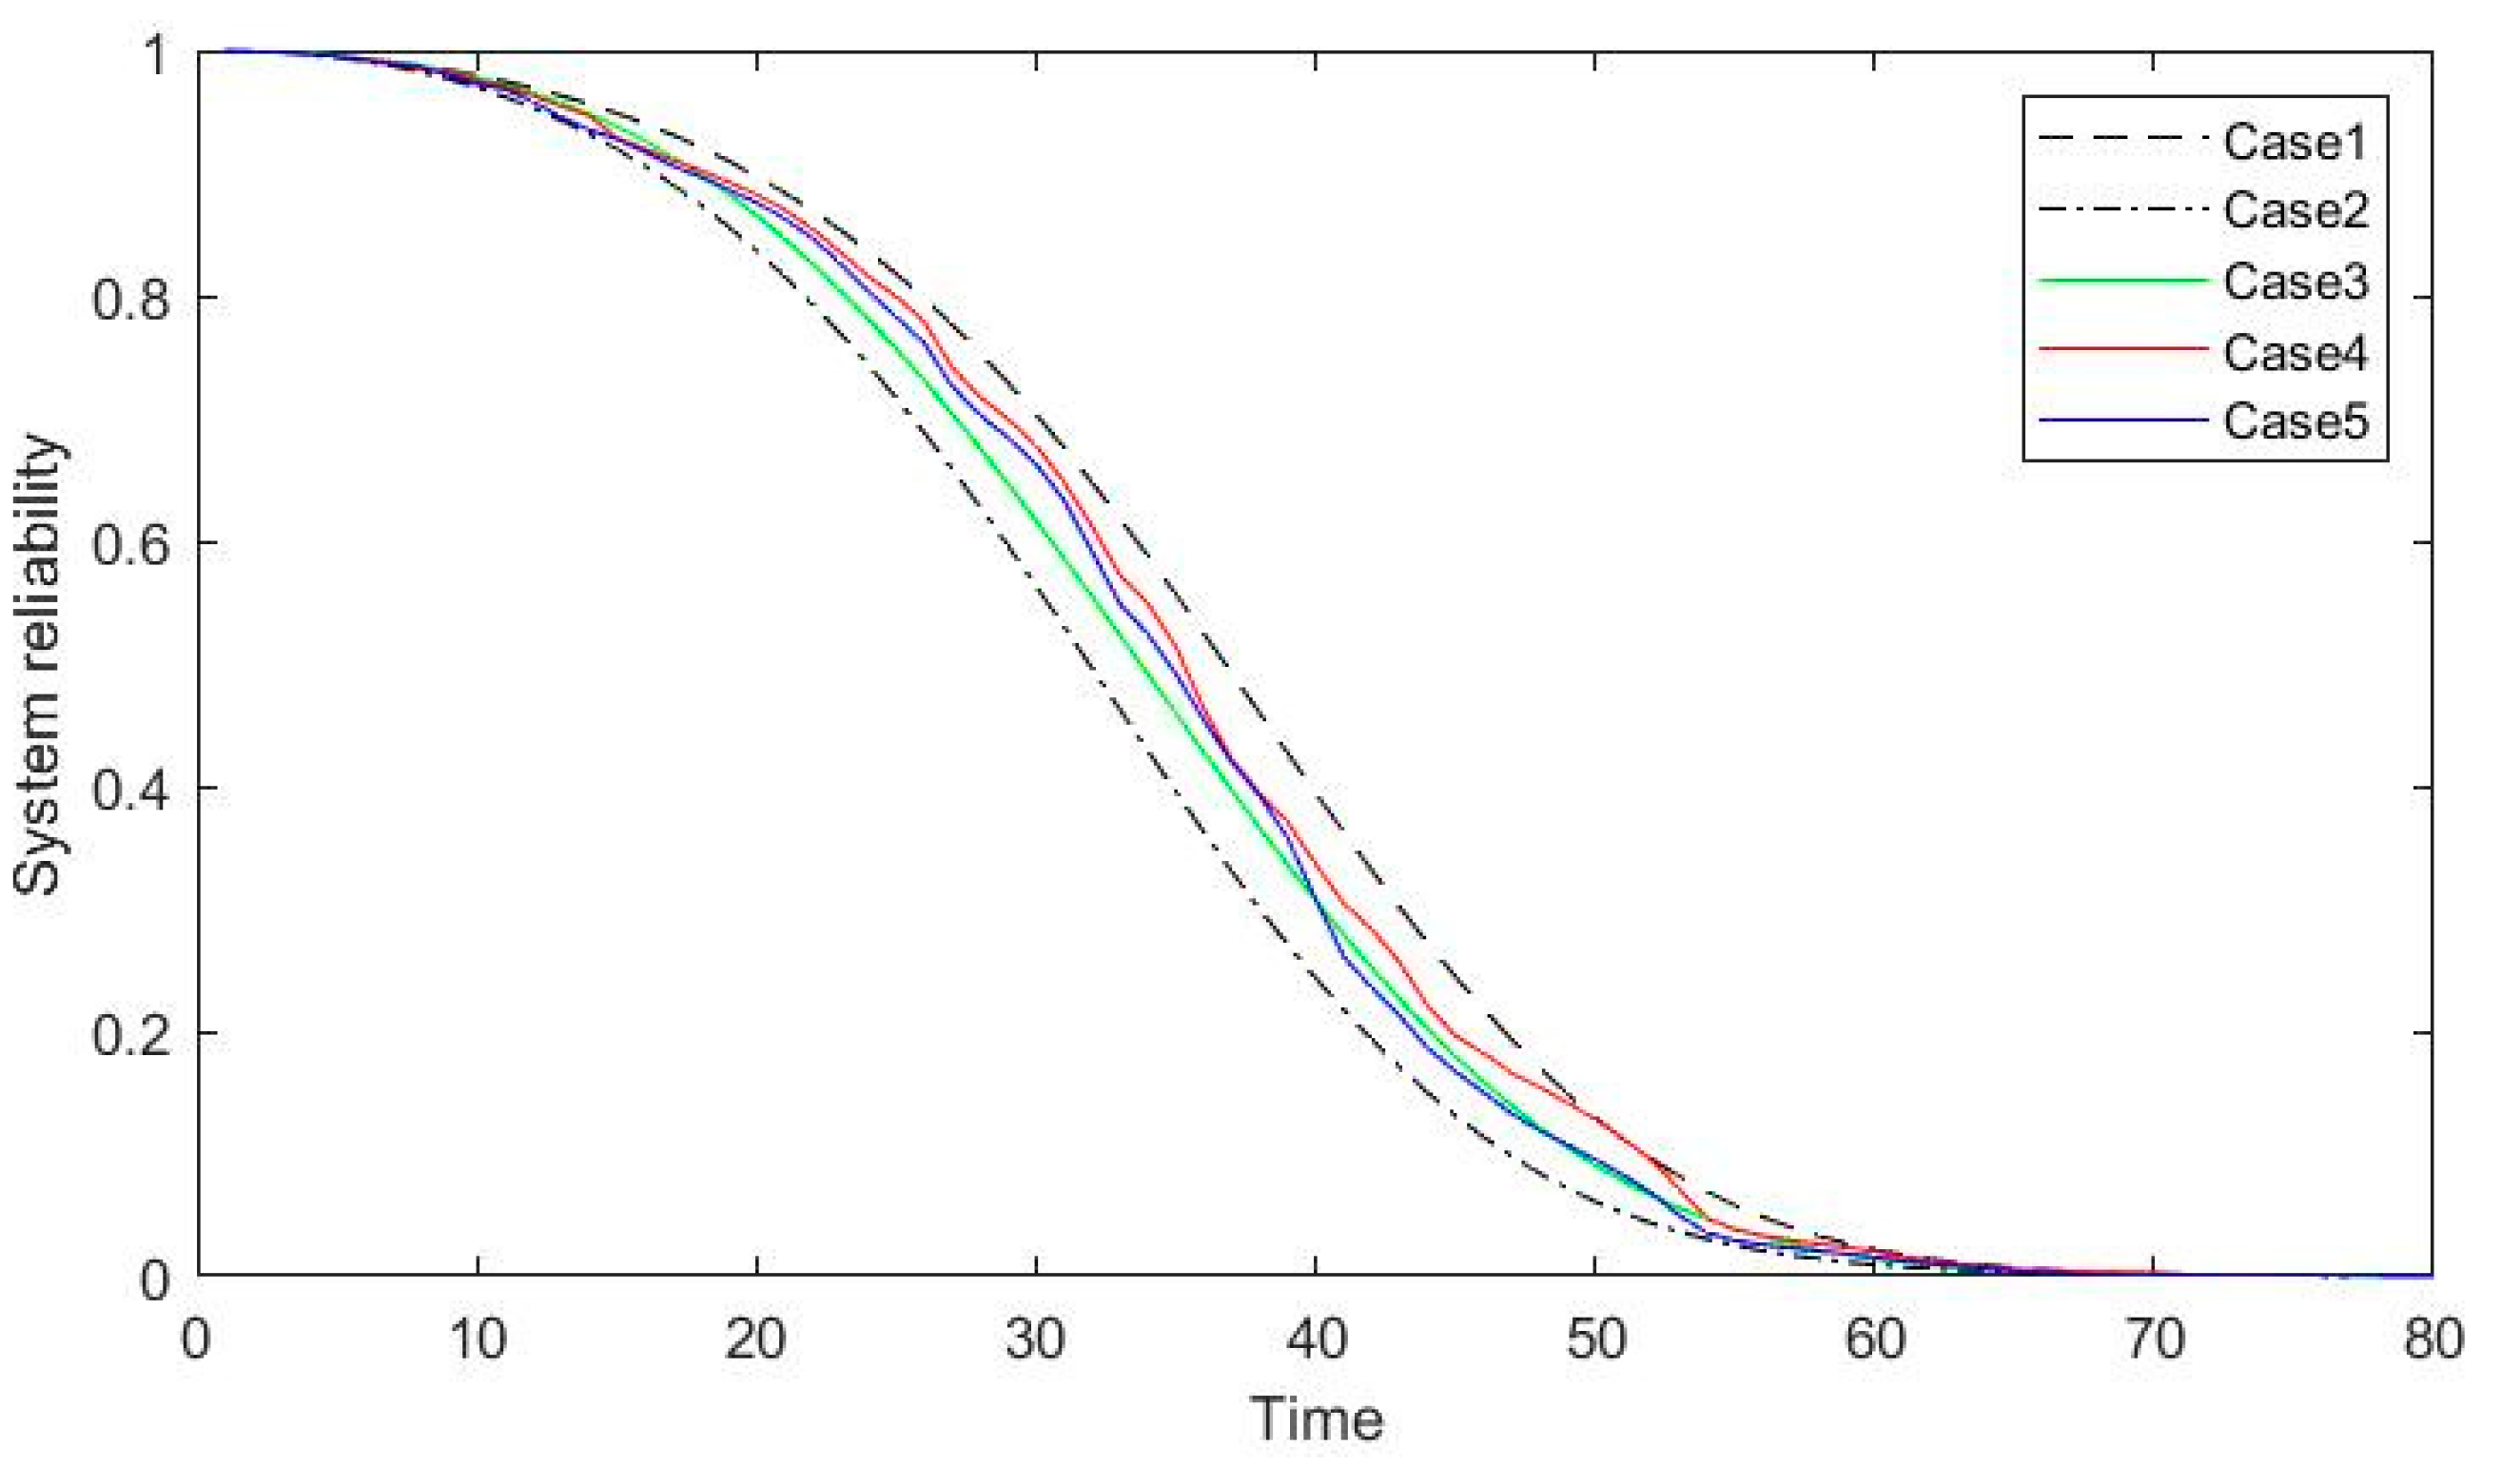
In this section, the reliability inference results of the 10-component system in different cases are compared and analyzed, as shown in Figure 11. We consider the following cases:
(1) Case 1: Failure-correlated system: Machine pair 5–6 independent, Machine pair 7–8 completely related;
(2) Case 2: Failure-correlated system: Machine pair 5–6 completely related, Machine pair 7–8 independent;
(3) Case 3: Failure-correlated system: copula Bayesian network;
(4) Case 4: Failure-correlated system: the proposed method (Machine pair 5–6 weakly failure-correlated, Machine pair 7–8 strongly failure-correlated);
(5) Case 5: Failure-correlated system: the proposed method (Machine pair 5–6 strongly failure-correlated, Machine pair 7–8 weakly failure-correlated).
It can be found that the system reliability inference results derived from the proposed method for both the cases of weak failure correlation and strong failure correlation are between the values in the extreme cases (Case 1 and Case 2); this is also the case for the copula Bayesian network method. The system reliability inference results are reasonable and effective. Compared with the copula Bayesian network method, which cannot distinguish different degrees of failure correlation, the proposed method is capable of describing different types of failure correlation within the system through properly adjusting the fuzzy inference model, and thus shows better adaptability to different types of failure correlation in manufacturing systems.
(C)
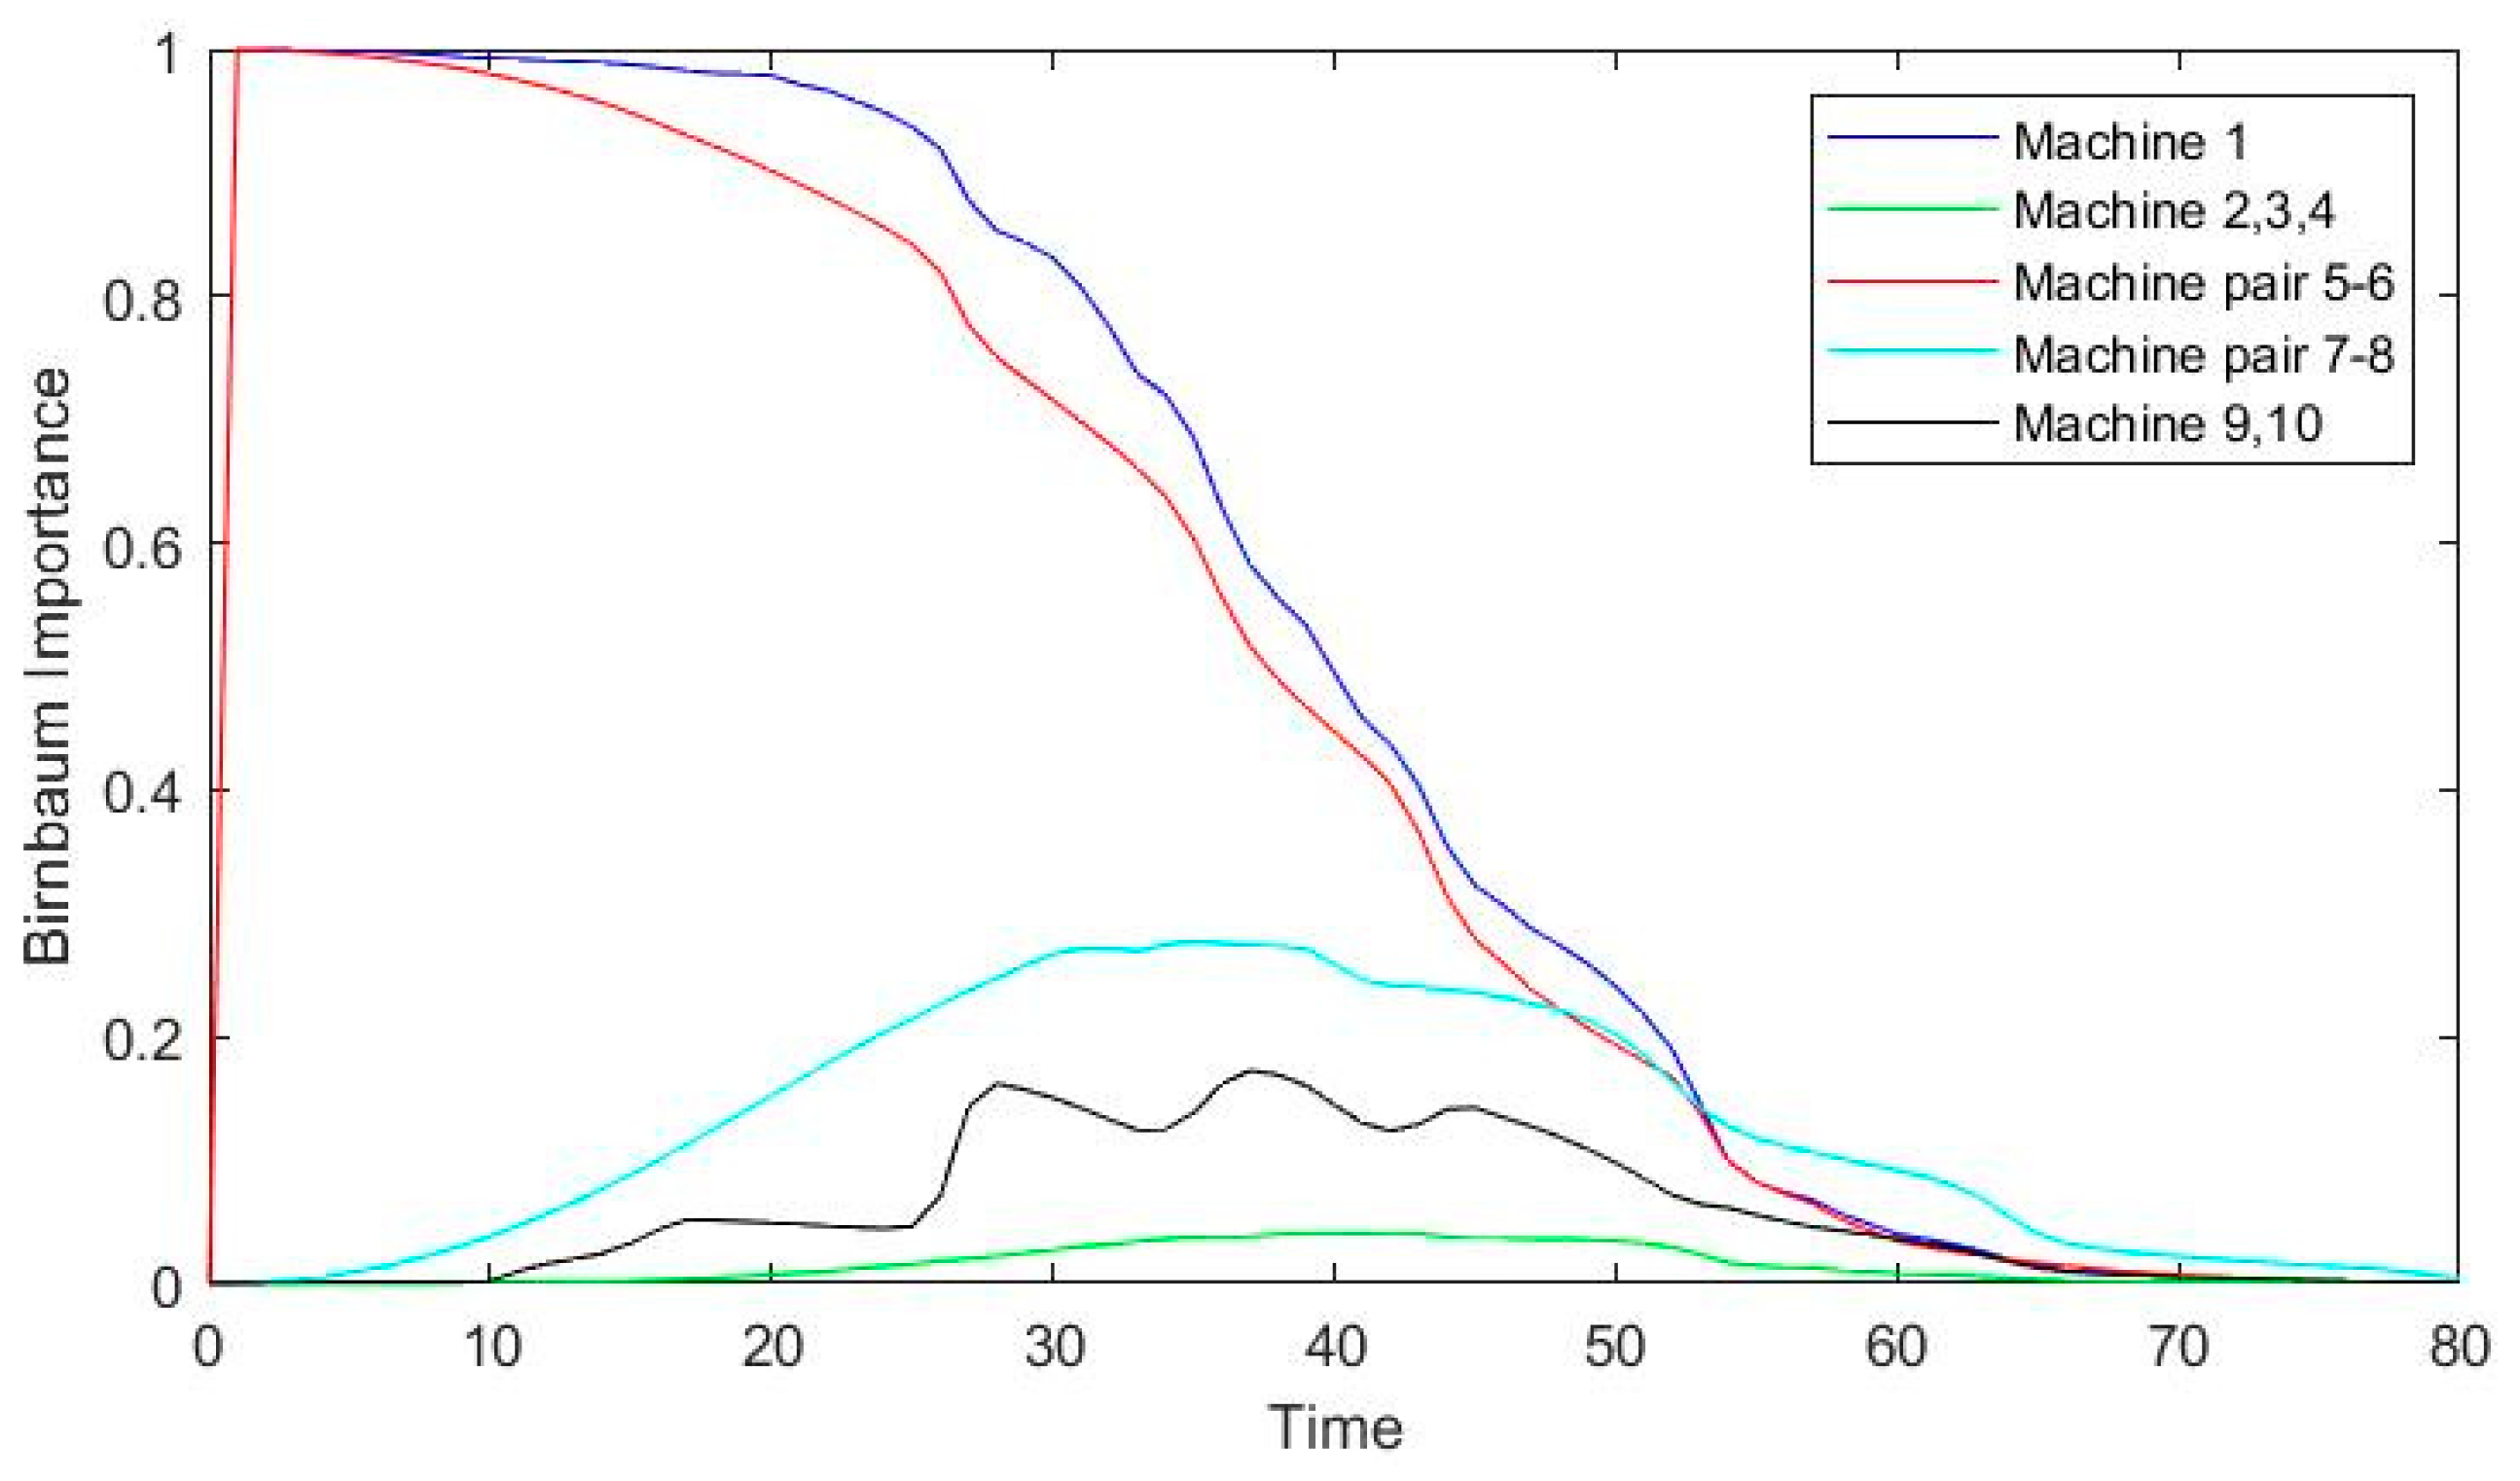
Machine importance analysis
Based on the component importance analysis for each machine in the 10-component system, as introduced in 
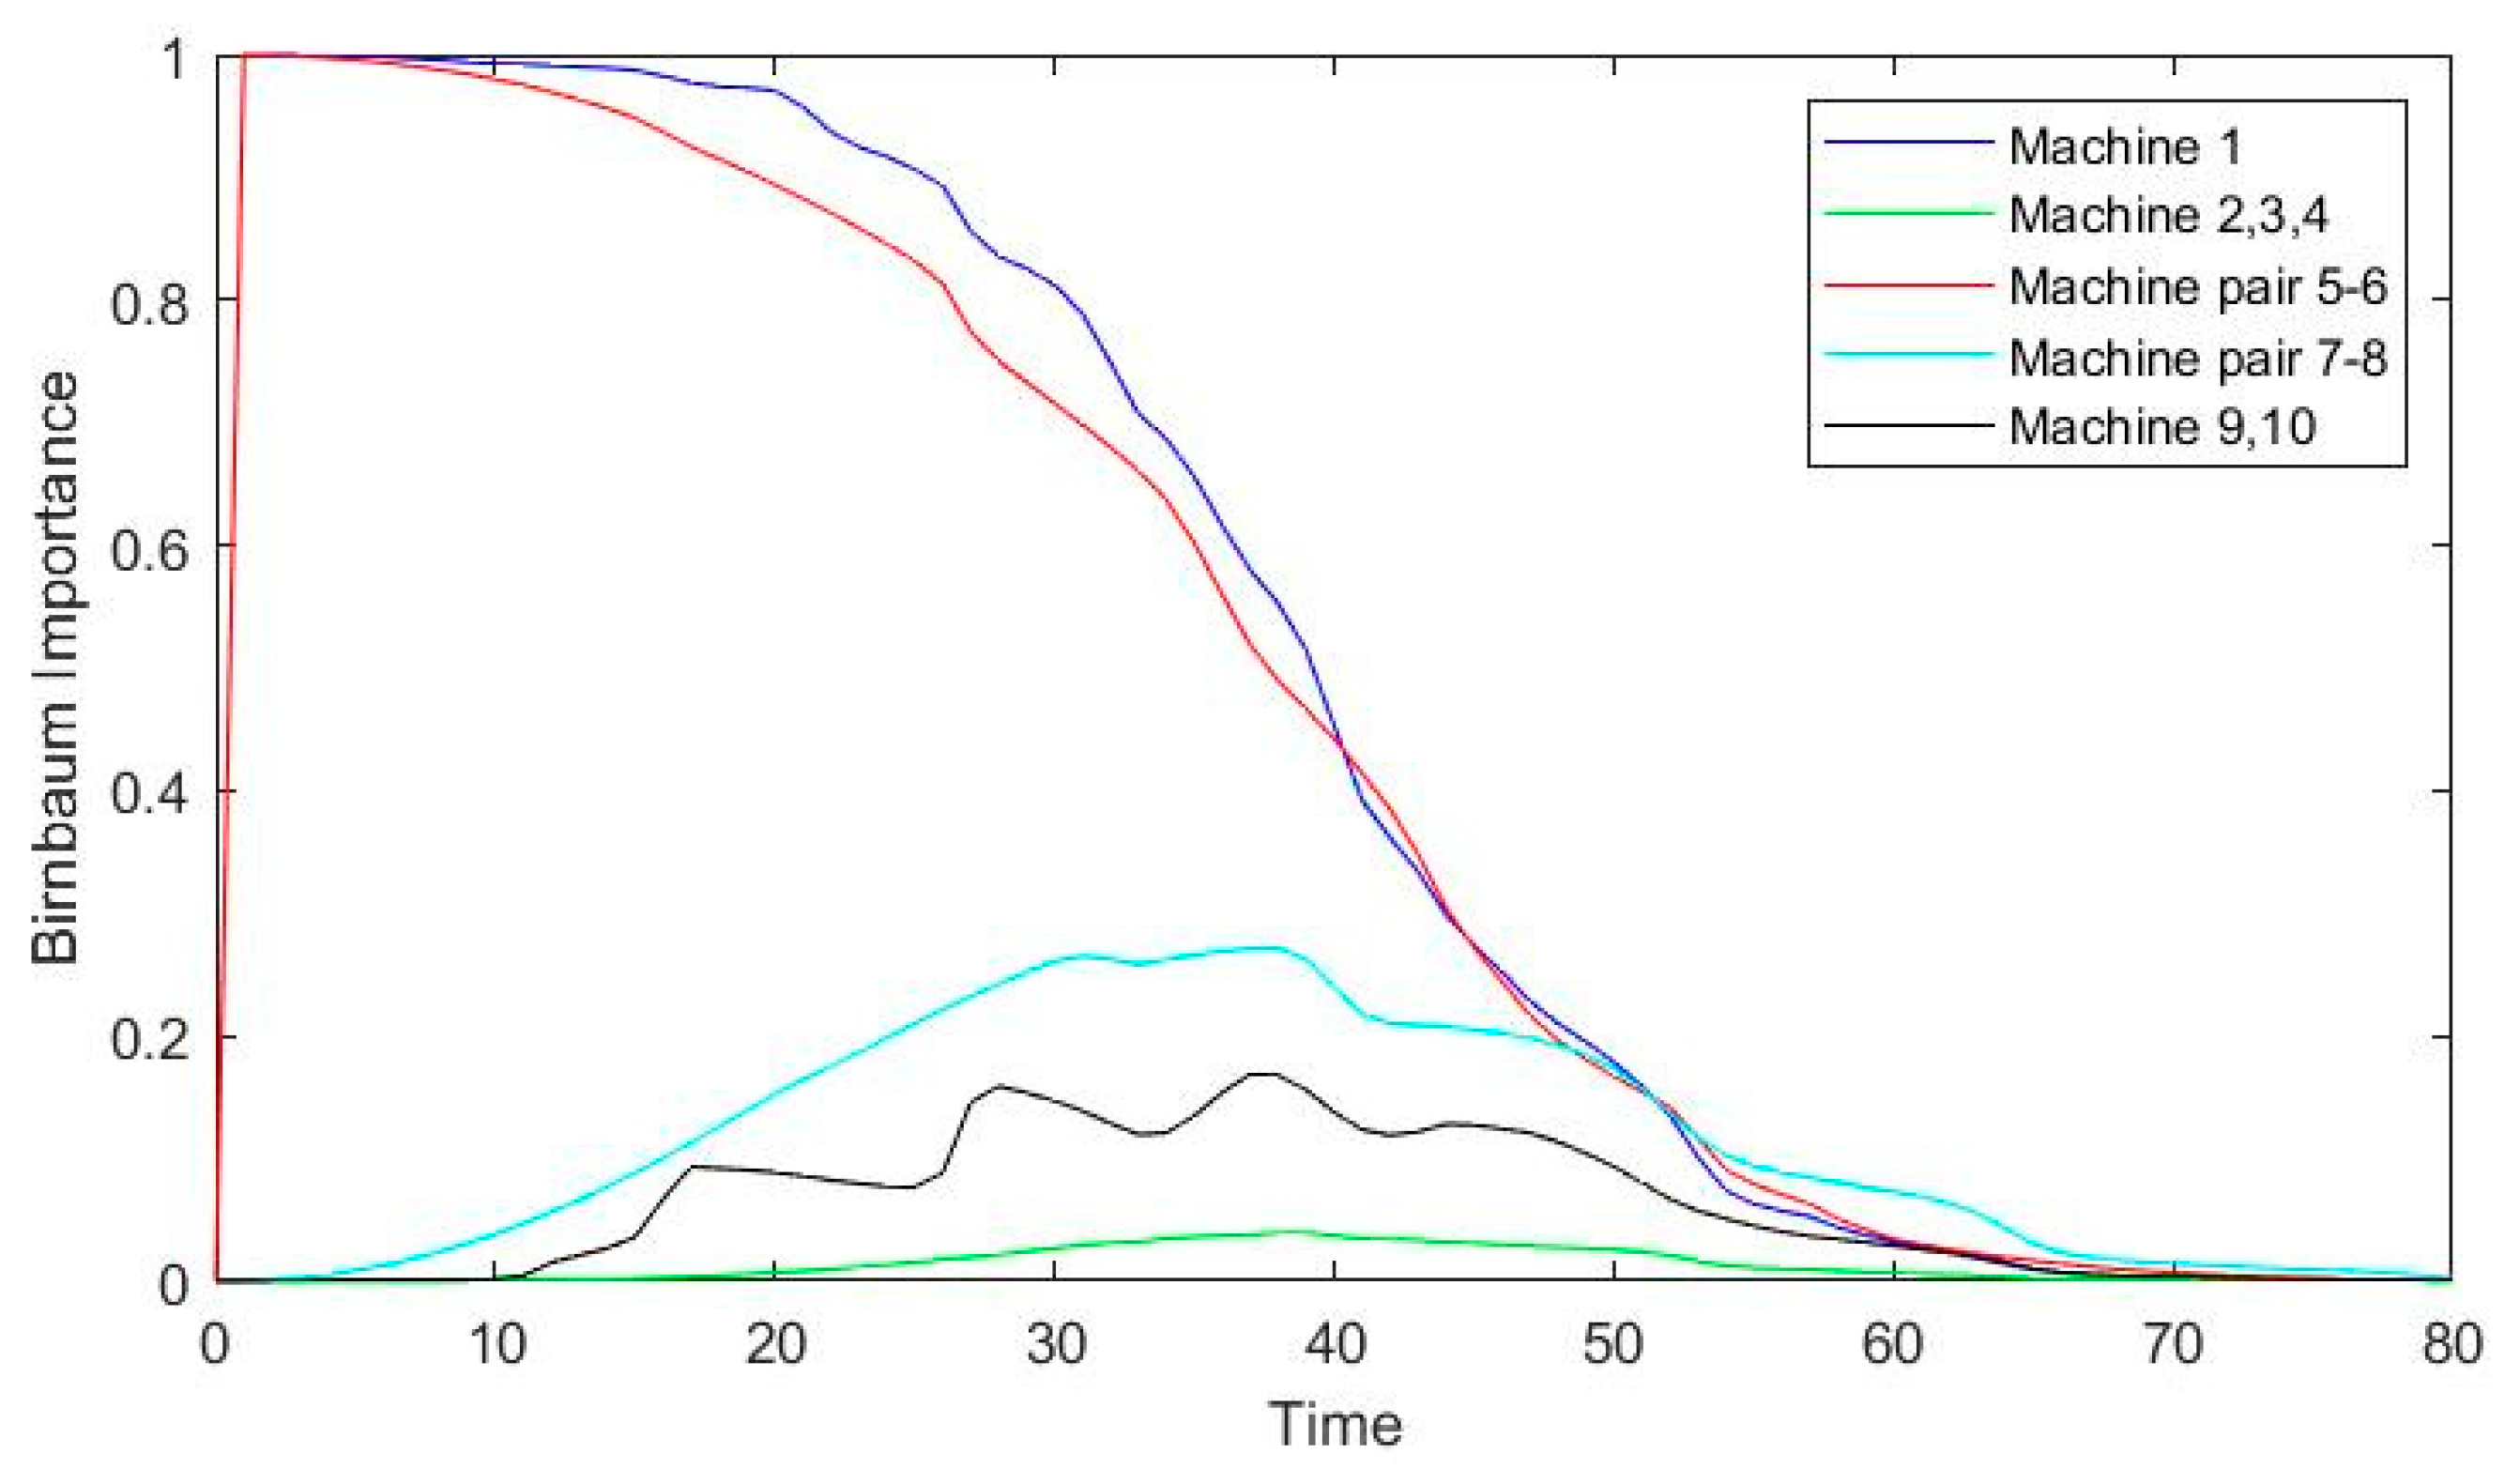
Section 3.4, the Birnbaum importance of each machine can be obtained in different cases of weak failure correlation or strong failure correlation. Take two cases as examples: (1) Case 1: Machine pair 5–6 weakly failure-correlated, Machine pair 7–8 strongly failure-correlated; and (2) Case 2: Machine pair 5–6 strongly failure-correlated, Machine pair 7–8 weakly failure-correlated. The corresponding Birnbaum importance results of the machines are shown in Figure 12 and Figure 13, respectively.
It is observed that the Birnbaum importance values of each machine/machine pair are between 0 and 1. In the beginning, all machines are working normally, thus the system is in a working state with probability 1. Therefore, the Birnbaum importance of all machines is 0 at this time. As the system operation time increases, machines in the system start to suffer from failure and finally the system fails. At this time, a single machine cannot enable the system to work again when it changes from a failure state to a working state. This is the reason why the Birnbaum importance of all machines finally returns to 0. From Figure 12 and Figure 13, it can be seen that Machine 1 and Machine pair 5–6 are of high importance in the system, which indicates that these machines need to be checked first in case of system failure. We also find that under different failure correlations among the components, the Birnbaum importance of each machine/machine pair is different.
To summarize, by introducing the fuzzy inference model, the proposed method can achieve effective subsystem reliability inference results and system reliability inference results, as well as the analysis results of Birnbaum importance for all machines, for different types of manufacturing systems, where the component-level failure correlation can be quite different, indicating failure-dependent systems with varying degrees.

5. Conclusions

In this paper, we propose a reliability analysis method for failure-dependent systems, where copula functions with optimized parameters are used to describe the failure correlation among the system components, and a fuzzy inference model is constructed to derive the impact of the component-level failure correlation on the subsystem reliability. Finally, a Bayesian network is applied for the final inference of the system reliability, and Birnbaum importance is used for analysis of the importance of different system components, which can further facilitate maintenance decision making. Different from the existing works, we focus on constructing a systematic framework of reliability analysis for failure-dependent manufacturing systems. By creatively introducing copula functions, a fuzzy inference model, and a Bayesian network into the analysis framework, both the system structure and the failure correlation among the system components are taken into consideration to achieve rational and effective inference results of system reliability. A notable advantage of applying the fuzzy inference model in the framework is that we can avoid the obstacles of directly deriving the reliability values without precise knowledge about the system operation mechanism, while also taking advantage of expert knowledge and experiences in practice.
We conducted a case study of a typical example of the manufacturing system including different types of component-level failure correlation, and provide comprehensive analysis of the key results including failure correlation description, and reliability derivation from component to subsystem and the whole system. Through simulations, the proposed method achieved inference results of system reliability that were reasonable and effective in different cases. The proposed method also shows better adaptability to failure-dependent systems with varying degrees, when compared with the method of the copula Bayesian network. Due to its advantages in the characterization effect of the manufacturing system reliability, the proposed method has a wide range of applications. This work aims to expand the analysis framework of system reliability, and provides theoretical guidance for evaluating reliability of manufacturing systems with different types, which is valuable for further decision making on system maintenance or scheduling. However, there are still some limitations in this paper. For instance, only the commonly used series–parallel system is investigated, and systems with more complex structures will be discussed in the future. Furthermore, determining how to make maintenance decisions based on the reliability analysis results is another concern that will be addressed in our future work.

Author Contributions

Conceptualization, S.X. and Y.L. (Yaqiong Lv); methodology, S.X., Y.L. (Yaqiong Lv) and Y.L. (Yifan Li); software, S.X.; validation, Y.L. (Yaqiong Lv) and Y.L. (Yifan Li); formal analysis, S.X. and L.Q.; investigation, S.X. and L.Q.; writing—original draft preparation, S.X.; writing—review and editing, Y.L. (Yifan Li) and Y.L. (Yaqiong Lv); visualization, S.X. and Y.L. (Yifan Li); supervision, Y.L. (Yaqiong Lv), Y.L. (Yifan Li) and L.Q.; funding acquisition, Y.L. (Yaqiong Lv) and Y.L. (Yifan Li). All authors have read and agreed to the published version of the manuscript.

Funding

This research was sponsored by the National Natural Science Foundation of China (Project No. 72101194) and the Hubei Provincial Natural Science Foundation of China (Project No. 20221j0065), and partially sponsored by the Humanities and Social Science Foundation of Ministry of Education of China (Project No. 20YJC630096) and the Independent Innovation Research Fund of Wuhan University of Technology (Project No. 2022IVA137), as well as the National Key R&D Program of China (Project No. 2022YFE0125200) and the Natural Science Foundation of Shaanxi Province (Project No. 22020JM-187).

Conflicts of Interest

The authors declare no conflict of interest.

References

  1. Lv, Y.Q.; Zhao, W.Q.; Zhao, Z.Y.; Li, W.D.; Ng, K.K.H. Vibration signal-based early fault prognosis: Status quo and applications. Adv. Eng. Inform. 2022, 52, 101609. [Google Scholar] [CrossRef]
  2. Wu, J.; Lin, M.X.; Lv, Y.Q.; Cheng, Y.W. Intelligent fault diagnosis of rolling bearings based on clustering algorithm of fast search and find of density peaks. Qual. Eng. 2022. [Google Scholar] [CrossRef]
  3. Lv, Y.Q.; Zhou, Q.W.; Li, Y.F.; Li, W.D. A predictive maintenance system for multi-granularity faults based on AdaBelief-BP neural network and fuzzy decision making. Adv. Eng. Inform. 2021, 49, 101318. [Google Scholar] [CrossRef]
  4. Zheng, P.; Zhao, W.Q.; Lv, Y.Q.; Qian, L.; Li, Y.F. Health Status-Based Predictive Maintenance Decision-Making via LSTM and Markov Decision Process. Mathematics 2023, 11, 109. [Google Scholar] [CrossRef]
  5. Baptista, M.; Sankararaman, S.; de Medeiros, I.P.; Nascimento, C.; Prendinger, H.; Henriques, E.M.P. Forecasting fault events for predictive maintenance using data-driven techniques and ARMA modeling. Comput. Ind. Eng. 2018, 115, 41–53. [Google Scholar] [CrossRef]
  6. Yu, D.; Chen, Z.M.; Xiahou, K.S.; Li, M.S.; Ji, T.Y.; Wu, Q.H. A radically data-driven method for fault detection and diagnosis in wind turbines. Int. J. Electr. Power Energy Syst. 2018, 99, 577–584. [Google Scholar] [CrossRef]
  7. Li, M.S.; Yu, D.; Chen, Z.M.; Xiahou, K.S.; Ji, T.Y.; Wu, Q.H. A Data-Driven Residual-Based Method for Fault Diagnosis and Isolation in Wind Turbines. IEEE Trans. Sustain. Energy 2019, 10, 895–904. [Google Scholar] [CrossRef]
  8. Xu, A.C.; Zhou, S.R.; Tang, Y.C. A Unified Model for System Reliability Evaluation Under Dynamic Operating Conditions. IEEE Trans. Reliab. 2021, 70, 65–72. [Google Scholar] [CrossRef]
  9. Fan, T.H.; Hsu, T.M. Statistical Inference of a Two-Component Series System With Correlated Log-Normal Lifetime Distribution Under Multiple Type-I Censoring. IEEE Trans. Reliab. 2015, 64, 376–385. [Google Scholar] [CrossRef]
  10. Kundu, D.; Gupta, A.K. Bayes estimation for the Marshall-Olkin bivariate Weibull distribution. Comput. Stat. Data Anal. 2013, 57, 271–281. [Google Scholar] [CrossRef]
  11. Lemonte, A.J. Multivariate Birnbaum-Saunders regression model. J. Stat. Comput. Simul. 2013, 83, 2244–2257. [Google Scholar] [CrossRef]
  12. Jafary, B.; Mele, A.; Fiondella, L. Component-based system reliability subject to positive and negative correlation. Reliab. Eng. Syst. Saf. 2020, 202, 107058. [Google Scholar] [CrossRef]
  13. Meng, D.B.A.; Lv, Z.Y.; Yang, S.Y.; Wang, H.T.; Xie, T.W.; Wang, Z.H. A time-varying mechanical structure reliability analysis method based on performance degradation. Structures 2021, 34, 3247–3256. [Google Scholar] [CrossRef]
  14. Zuo, F.J.; Yu, L.; Mi, J.H.; Liu, Z.; Huang, H.Z. RELIABILITY ANALYSIS OF GEAR TRANSMISSION WITH CONSIDERING FAILURE CORRELATION. Eksploat. I Niezawodn.-Maint. Reliab. 2015, 17, 617–623. [Google Scholar] [CrossRef]
  15. Wang, H.; Zhang, Y.M.; Yang, Z. A Reliability Allocation Method of CNC Lathes Based on Copula Failure Correlation Model. Chin. J. Mech. Eng. 2018, 31, 111. [Google Scholar] [CrossRef] [Green Version]
  16. Zhang, X.; Wilson, A. System Reliability and Component Importance Under Dependence: A Copula Approach. Technometrics 2017, 59, 215–224. [Google Scholar] [CrossRef]
  17. Sun, Y.N.; Qin, W.; Zhuang, Z.L. Nonparametric-copula-entropy and network deconvolution method for causal discovery in complex manufacturing systems. J. Intell. Manuf. 2022, 33, 1699–1713. [Google Scholar] [CrossRef]
  18. Zhang, J.D.; Yan, R.F.; Wang, J.R. Reliability optimization of parallel-series and series-parallel systems with statistically dependent components. Appl. Math. Model. 2022, 102, 618–639. [Google Scholar] [CrossRef]
  19. Song, Y.F.; Mi, J.H.; Cheng, Y.H.; Bai, L.B.; Chen, K. Reliability assessment for failure-dependent and uncertain systems: A Bayesian network based on copula method and probability-box. Qual. Reliab. Eng. Int. 2021, 37, 1894–1921. [Google Scholar] [CrossRef]
  20. Ding, F.; Wang, Y.H.; Ma, G.L.; Zhang, X.R. Correlation reliability assessment of artillery chassis transmission system based on CBN model. Reliab. Eng. Syst. Saf. 2021, 215, 107908. [Google Scholar] [CrossRef]
  21. Sun, Y.T.; Chen, K.G.; Liu, C.; Zhang, Q.; Qin, X.R. Research on reliability analytical method of complex system based on CBN model. J. Mech. Sci. Technol. 2021, 35, 107–120. [Google Scholar] [CrossRef]
  22. Wang, J.F.; Fei, Z.C.; Chang, Q.; Fu, Y.; Li, S.Q. Energy-saving operation of multistage stochastic manufacturing systems based on fuzzy logic. Int. J. Simul. Model. 2019, 18, 138–149. [Google Scholar] [CrossRef]
  23. Lu, M.S.; Liu, Y.J. Dynamic dispatching for a flexible manufacturing system based on fuzzy logic. Int. J. Adv. Manuf. Technol. 2011, 54, 1057–1065. [Google Scholar] [CrossRef]
  24. Li, W.; Zhang, L.C.; Chen, X.P.; Wu, C.H.; Cui, Z.X.; Niu, C. Predicting the evolution of sheet metal surface scratching by the technique of artificial intelligence. Int. J. Adv. Manuf. Technol. 2021, 112, 853–865. [Google Scholar] [CrossRef]
  25. Zhang, S.; Zhao, Y.; Lee, J. Control of 3-DOF Robotic Manipulator by Neural Network Based Fuzzy-PD. Int. J. Precis. Eng. Manuf. 2019, 20, 2109–2118. [Google Scholar] [CrossRef]
  26. Sklar, A. Random variables, distribution functions, and copulas: A personal look backward and forward. Lect. Notes-Monogr. Ser. 1996, 28, 1–14. [Google Scholar]
  27. Lloyd DK, L.M. Reliability: Management, Methods and Mathematics; Prentice-Hall: London, UK, 1962. [Google Scholar]
  28. Fang, G.Q.; Pan, R.; Hong, Y.L. Copula-based reliability analysis of degrading systems with dependent failures. Reliab. Eng. Syst. Saf. 2020, 193, 106618. [Google Scholar] [CrossRef]
  29. Liu, B.; Xu, Z.G.; Xie, M.; Kuo, W. A value-based preventive maintenance policy for multi-component system with continuously degrading components. Reliab. Eng. Syst. Saf. 2014, 132, 83–89. [Google Scholar] [CrossRef]
  30. Valis, D.; Hasilová, K.; Forbelská, M.; Pietrucha-Urbanik, K. Modelling water distribution network failures and deterioration. In Proceedings of the 2017 IEEE International Conference on Industrial Engineering and Engineering Management (IEEM), Singapore, 10–13 December 2017; pp. 924–928. [Google Scholar]
Figure 1. The proposed framework of system reliability analysis for failure-dependent manufacturing systems.
Electronics 12 01026 g001
Figure 2. Fuzzy inference system for the evaluation of subsystem reliability.
Electronics 12 01026 g002
Figure 3. Gaussian membership function and double Gaussian membership function.
Electronics 12 01026 g003
Figure 4. Bayesian network construction.
Electronics 12 01026 g004
Figure 5. Diagram of a typical series–parallel manufacturing system.
Electronics 12 01026 g005
Figure 6. Binary histograms of reliability values: (a) Machine pair 5–6; (b) Machine pair 7–8.
Electronics 12 01026 g006
Figure 7. Images of Frank copula functions with optimized parameters for Machine pair 5–6 and Machine pair 7–8.
Electronics 12 01026 g007
Figure 8. Description of   C 56 by different types of membership functions: (a) Gaussian membership function and double Gaussian membership function; (b) triangular membership function and trapezoid membership function.
Electronics 12 01026 g008
Figure 9. Subsystem reliability evaluation of Machine pair 5–6: (a) Gaussian membership function and double Gaussian membership function selected; (b) triangular membership function and trapezoid membership function selected.
Electronics 12 01026 g009
Figure 10. Subsystem reliability evaluation of Machine pair 7–8: (a) Gaussian membership function and double Gaussian membership function selected; (b) triangular membership function and trapezoid membership function selected.
Electronics 12 01026 g010
Figure 11. Comparison of the system reliability inference results.
Electronics 12 01026 g011
Figure 12. Machine Birnbaum importance (Case 1).
Electronics 12 01026 g012
Figure 13. Machine Birnbaum importance (Case 2).
Electronics 12 01026 g013
Table 1. Part of the project data used in our case study.
Machine ID DatetimeTime in CycleAgeRUL
12015/6/20167181
12015/6/21168182
12015/7/11781812
12015/7/21791813
12015/7/31801814
12015/9/22411875
Table 2. Parameters and AIC values of different copula functions for Machine pair 5–6.
Copula Function TypeClaytonFrankGumbelGaussian t
Parameter1.099613.51602.66240.93050.8465
AIC−7696.3−18,538−14,798−11,660−16,088
Table 3. Parameters and AIC values of different copula functions for Machine pair 7–8.
Copula Function TypeClaytonFrankGumbelGaussian t
Parameter3.090715.99943.61170.93870.9254
AIC−10,783−19,040−15,774−17,053−17,251
Table 4. Parameters of the membership functions designed for   C 56 and C 78 .
1234567
C 56 (0.03, 0, 0.03, 0.015)(0.035, 0.115)(0.05, 0.275)(0.05, 0.44)(0.05, 0.6)(0.05, 0.75)(0.05, 0.9129, 0.05, 1)
C 78 (0.04, 0, 0.04, 0.05)(0.045, 0.185)(0.04, 0.33)(0.045, 0.465)(0.045, 0.595)(0.045, 0.725)(0.05, 0.9, 0.05, 1)
Table 5. Parameters of the membership functions designed for   R 56 and R 78 .
123456789
R 56 (0.005, 0)(0.01, 0.03)(0.02, 0.09)(0.06, 0.244)(0.09, 0.494)(0.06, 0.758)(0.02, 91)(0.01, 0.97)(0.005, 1)
R 78 (0.0002, 0)(0.003, 0.0095)(0.012, 0.04)(0.045, 0.183)(0.08, 0.425)(0.075, 0.667)(0.03, 892)(0.006, 0.981)(0.004, 1)
Table 6. Parameters of the membership functions designed for R 56 and R 78 .
1234567
R 56 (0.005, 0)(0.01, 0.03)(0.02, 0.09)(0.06, 0.244)(0.09, 0.494)(0.06, 0.758)(0.02, 91)
R 78 (0.0002, 0)(0.003, 0.0095)(0.012, 0.04)(0.045, 0.183)(0.08, 0.425)(0.075, 0.667)(0.03, 892)
891011121314
R 56 (0.025, 0.244)(0.03, 0.327)(0.03, 0.411)(0.03, 0.494)(0.03, 0.582)(0.03, 0.67)(0.025, 0.758)
R 78 (0.015, 0.183)(0.025, 0.264)(0.025, 0.344)(0.025, 0.425)(0.025, 0.506)(0.025, 0.586)(0.025, 0.667)
15161718192021
R 56 (0.02, 0.815)(0.015, 0.88)(0.007, 0.929)(0.006, 0.95)(0.006, 0.975)(0.003, 0.99)(0.002, 1)
R 78 (0.025, 0.742)(0.025, 0.817)(0.02, 0.892)(0.015, 0.94)(0.005, 0.981)(0.003, 0.99)(0.0043, 1)
Table 7. Fuzzy rules designed for weak failure correlation Machine pair 5–6.
C 56 \ R 56 1 R 2 R 3 R 4 R 5 R 6 R 7 R 8 R 9 R
1 C 1 R 3 R 4 R
  2 C 2 R 4 R 7 R
3 C 4 R 7 R 10 R
4 C 6 R 10 R 13 R
5 C 9 R 13 R 16 R
6 C 12 R 16 R 18 R
7 C 15 R 17 R 19 R
Table 8. Fuzzy rules designed for strong failure correlation Machine pair 5–6.
C 56 \ R 56 1 R 2 R 3 R 4 R 5 R 6 R 7 R 8 R 9 R
1 C 1 R 3 R 4 R
2 C 2 R 4 R 6 R
3 C 4 R 6 R 9 R
4 C 6 R 9 R 12 R
5 C 9 R 12 R 15 R
6 C 12 R 15 R 17 R
7 C 15 R 17 R 19 R
Table 9. Fuzzy rules designed for weak failure correlation Machine pair 7–8.
C 78 \ R 78 1 R 2 R 3 R 4 R 5 R 6 R 7 R 8 R 9 R
1 C 1 R 3 R 5 R
2 C 5 R 8 R
3 C 8 R 11 R
4 C 9 R 11 R 14 R
5 C 12 R 14 R
6 C 15 R 17 R
7 C 17 R 19 R 21 R
Table 10. Fuzzy rules designed for strong failure correlation Machine pair 7–8.
C 78 \ R 78 1 R 2 R 3 R 4 R 5 R 6 R 7 R 8 R 9 R
1 C 1 R 3 R 5 R
2 C 5 R 9 R
3 C 9 R 12 R
4 C 9 R 12 R 15 R
5 C 12 R 15 R
6 C 15 R 17 R
7 C 18 R 20 R 21 R
Table 11. Comparison of subsystem reliability of Machine pair 5–6.
TimeReliability of
Failure-Independent Subsystem
Reliability of Failure-Dependent Subsystem
Copula Bayesian NetworkThe Proposed Method for Weak Failure CorrelationThe Proposed Method for Strong Failure Correlation
T = 100.999840.99820.99270.9927
T = 200.99440.96200.98950.9895
T = 300.95970.84820.92500.9041
T = 400.85650.67220.72120.6671
T = 500.67020.47840.61880.5315
T = 600.44210.30710.41030.3263
T = 700.24120.17780.18710.1214
T = 800.10880.09030.08790.0616
T = 900.04120.03820.03830.0316
T = 1000.01340.01310.00540.0054
T = 1100.00380.00380.00020.0002
T = 1200.00090.00090.00010.0001
Table 12. Comparison of subsystem reliability of Machine pair 7–8.
TimeReliability of
Failure-Independent Subsystem
Reliability of Failure-Dependent Subsystem
Copula Bayesian NetworkThe Proposed Method for Weak Failure CorrelationThe Proposed Method for Strong Failure Correlation
T = 100.99230.99250.99800.9980
T = 200.91350.92950.89190.9400
T = 300.68380.78040.74170.7417
T = 400.34890.53250.49300.5065
T = 500.09810.25480.18410.2650
T = 600.01190.06710.01290.0129
T = 700.000480.00550.00180.0018
Disclaimer/Publisher’s Note: The statements, opinions and data contained in all publications are solely those of the individual author(s) and contributor(s) and not of MDPI and/or the editor(s). MDPI and/or the editor(s) disclaim responsibility for any injury to people or property resulting from any ideas, methods, instructions or products referred to in the content.

