1. Introduction
One of the basic measurements when testing explosive substances is the measurement of detonation velocity. Therefore, various measurement methods for detonation velocity have been developed [
1,
2,
3,
4,
5,
6]. One of the methods measures average velocity of detonation (VOD) indirectly as the time interval between two light pulses that are obtained from two different positions from the tested sample at some distance [
2]. This is how the time delay and, indirectly, the speed of detonation through or the speed of the shock wave inside the sample is measured.
The procedure of velocity detonation measurement for explosives for civil use is determined by standard EN 13631-14:2003 [
7]. The standard describes the procedure of measurement, measurement setup, initiating devices and measurement sensors.
Field-use devices have been developed that can be used in the test method described by the standard [
8]. The device is an electronic timer that transfers optical signals from the sample to electrical signals and counts the time between the rising edge of multiple channels, giving average VOD in different segments of the sample. The device can be used in fieldwork, frequently in unfavorable conditions, such as the presence of dust, moisture, water, and at low or high temperatures [
8].
Laboratories that use such devices, especially if they are accredited, need to calibrate and check the instrument properties of the mentioned instruments, which leads to the need to develop a calibration procedure and/or device that can be used for calibration in the laboratory and/or under field conditions.
The instruments can be calibrated by the manufacturer, but this is usually done once a year and takes a couple of weeks due to shipping. During this time, the user cannot make any measurements.
The accuracy and precision of a device depends on the built-in oscillator, and its calibration can be done by measuring the properties of the internal oscillator. Unfortunately, this requires opening the device, which is usually not allowed by the manufacturer.
To overcome these problems and make repeated internal laboratory instrument checks, the following work was conducted with the aim of developing calibration procedures and devices.
At first, comparison was made using a detonating cord as the source of light and an oscilloscope as reference device [
9]. The setup was made in such a way that the propagation of a wave caused the opening of the electrical circuit which gave the measurement signal. The disadvantage of this setup is the accuracy of position and distance of optical and electrical probes. The measurement needs to be conducted inside a protection container, which means that this procedure was very time-consuming and potentially dangerous to the operator.
Then, the comparison was made using a shock tube as the source of light [
10]. The signal was obtained from photodiodes as passive photocells, i.e., without an external power source, which limited the amplitude of the signal. The shock tube is not dangerous for the operator, so this is a safer solution.
Both procedures [
9,
10] lack the repeatability in the timing of light pulses, since the VOD changes inside the sample used as a light source. Additionally, the use of the modern digital oscilloscope leads to the presence of rather high noise in the signal, which sometimes causes difficulties with reading the measured time delay. If the reading is performed by manually setting cursors, it can be time-consuming. If the reading is performed automatically using the built-in function, it will depend on possible noise peaks inside the signal. If there is a peak closer to the higher value of the signal, it will cause the instrument to incorrectly define the level of the signal and lead to error in time delay measurement. This may lead to the development of a device described in this paper that simulates a light signal that comes from detonation inside a sample of explosive material and can create a precise and repeatable time delay between two or more channels of a VOD device, hence enabling the calibration without the need to use real explosive substances. The timing accuracy depends predominantly on the properties of the used oscillator.
The paper is organized as follows.
Section 2 describes the principal ideas, methods and materials (hardware, software, instrumentation and measurement procedures) for the development of the proposed device.
Section 3 presents the results of the measurements, verification of the timing subroutines and presents the discussion of the measurement results.
Section 4 summarizes the conclusions from this study.
2. Materials and Methods
Given that the calibration can be carried out under laboratory conditions, it is possible to use laboratory-type equipment, i.e., a counter instrument that can simultaneously measure the time delay on the device and the reference counter [
11,
12]. However, if the verification is to be carried out under field conditions, it is better to make a special device for this purpose.
The basic problem surrounds making two or more light pulses that will have a repeatable and accurate time delay that can be set in the range of a few microseconds to a few seconds. Times ranging up to tens of microseconds are used to test the detonation speed of explosives. Longer time periods are expected when testing chemical or electronic delay detonators. The principle of measurement of explosives is that optical fibers are placed at a known distance, which is usually 10 cm, so the time required to pass the specified distance, and indirectly the velocity of detonation, is measured.
It is also necessary to ensure that the intensity of light is high enough for the measured device to recognize the light pulse and perform the measurement. That is why use of an LED with high light intensity is suggested.
The task of controlling LEDs can be handled by many options including CLPDs [
13,
14], FPGAs [
15,
16] or a microcontroller [
17,
18]. The latter was chosen solely because of previous experience. Microcontrollers have a small footprint, small price, are easy to program and have low power consumption. According to the specification of LEDs, they consume around 64 mW for short periods of time. The OCXO consumes around 400 mW continuously at room temperature [
19].
A microcontroller was chosen to drive the diodes, which switches on and off the LEDs that serve as light sources. If a PIC microcontroller is used with an assembler editor as a software code tool, the exact time delays can be obtained in the software because the duration of the instruction cycle is known, the programs are short, and it is easy to count the number of cycles. Code for shorter time delays is reused for longer time delays, thus reducing the complexity and length of the code.
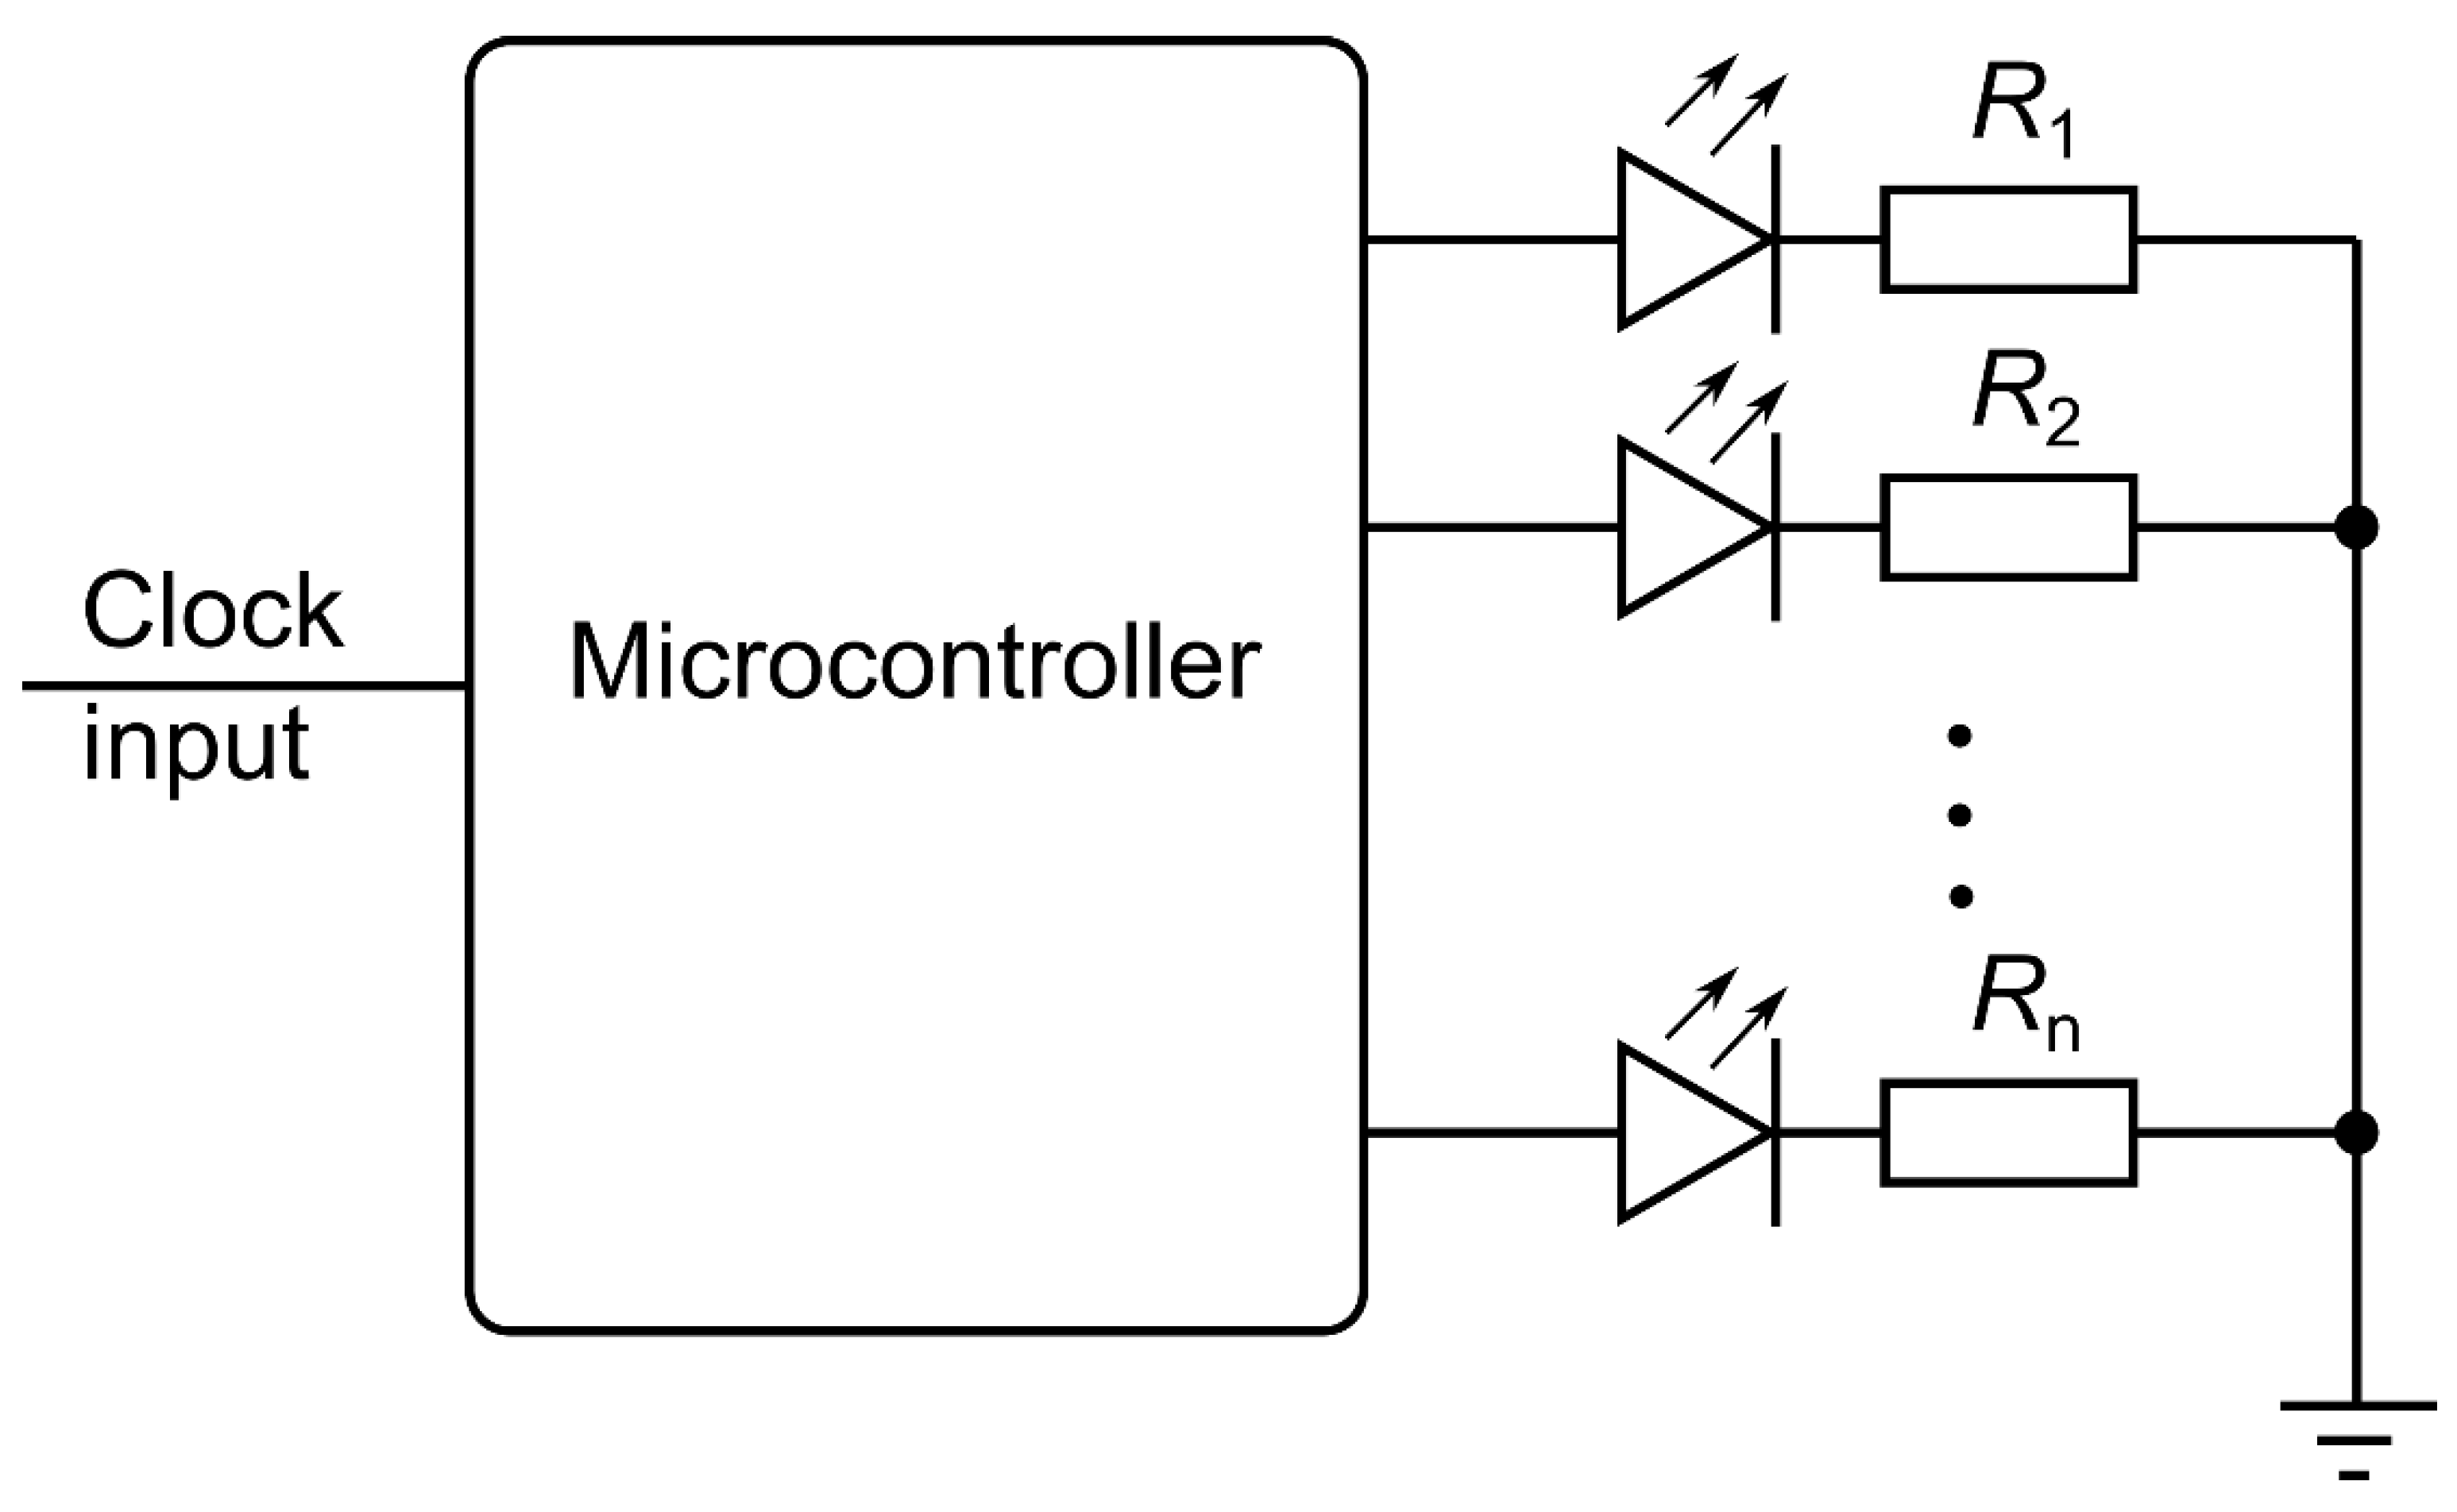
Figure 1 shows the block diagram of the device with the basic components necessary to achieve the desired functionality. Microcontroller with its code is a form of changeable clock signal divider. Signals leading from the device to the counter are obtained as voltage from resistors.
With this design, a software-defined time delay is obtained, and the accuracy depends solely on the characteristics of the oscillator that provides the clock. A high-precision OCXO (Micro Crystal OCXOV-AV5-10.000) with HC MOS output was chosen as the clock source. The frequency stability is stated as 0.2 ppm. This means the frequency can change up to 2 Hz.
To check the software and the required number of cycles for a certain time delay, it was decided to use the counter oscillator output as the microcontroller clock input. This enables the verification of subroutines duration in comparison of the calculated values. Given that the counter has a 10 MHz oscillator, an OCXO with the same frequency was chosen. Programs made for an oscillator frequency of 10 MHz will be compatible for both applications.
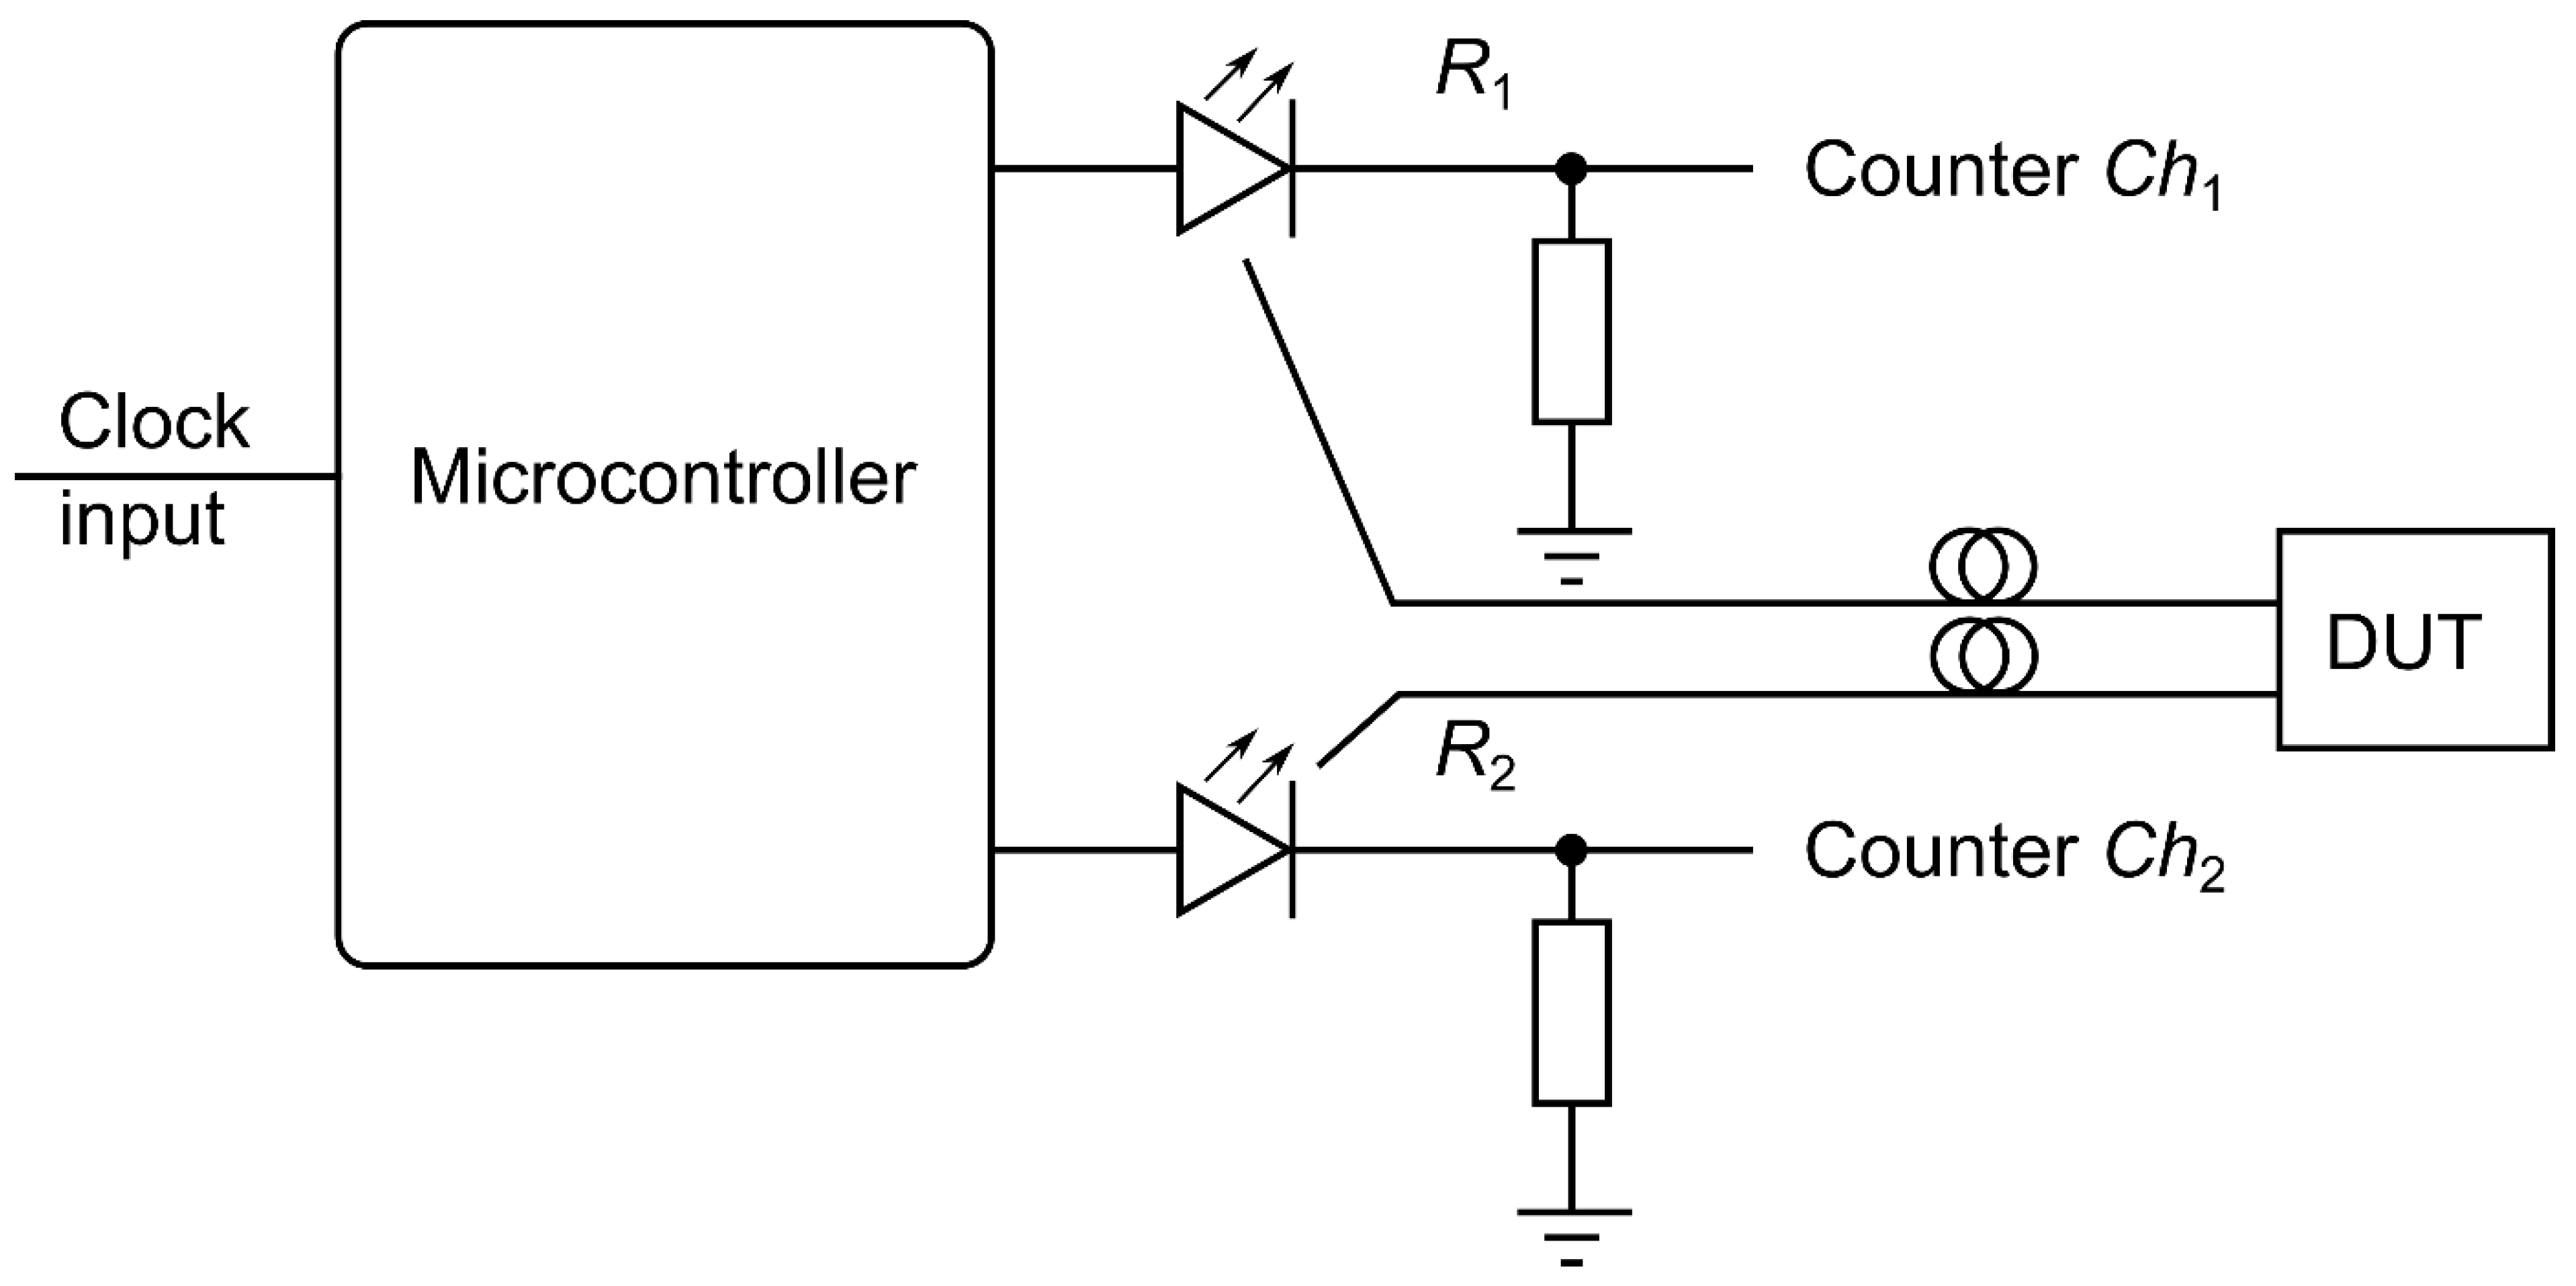
The LEDs are connected to optical fibers and lead to the device under test (DUT), electrical signals can be obtained from resistors, and the measurement can be carried out as in
Figure 2. The reference value is obtained by a counter instrument configured to measure the time delay between two pulses when the signal level exceeds a set voltage level. Given that the LED switch-on time is in the order of nanoseconds [
22,
23], the influence on the operation of the device is negligible.
2.1. Development of the Device for Precisely Timed Optical Puleses
The device consists of hardware and software that give it its function. The device was built and then tested for different time delays.
2.1.1. Hardware
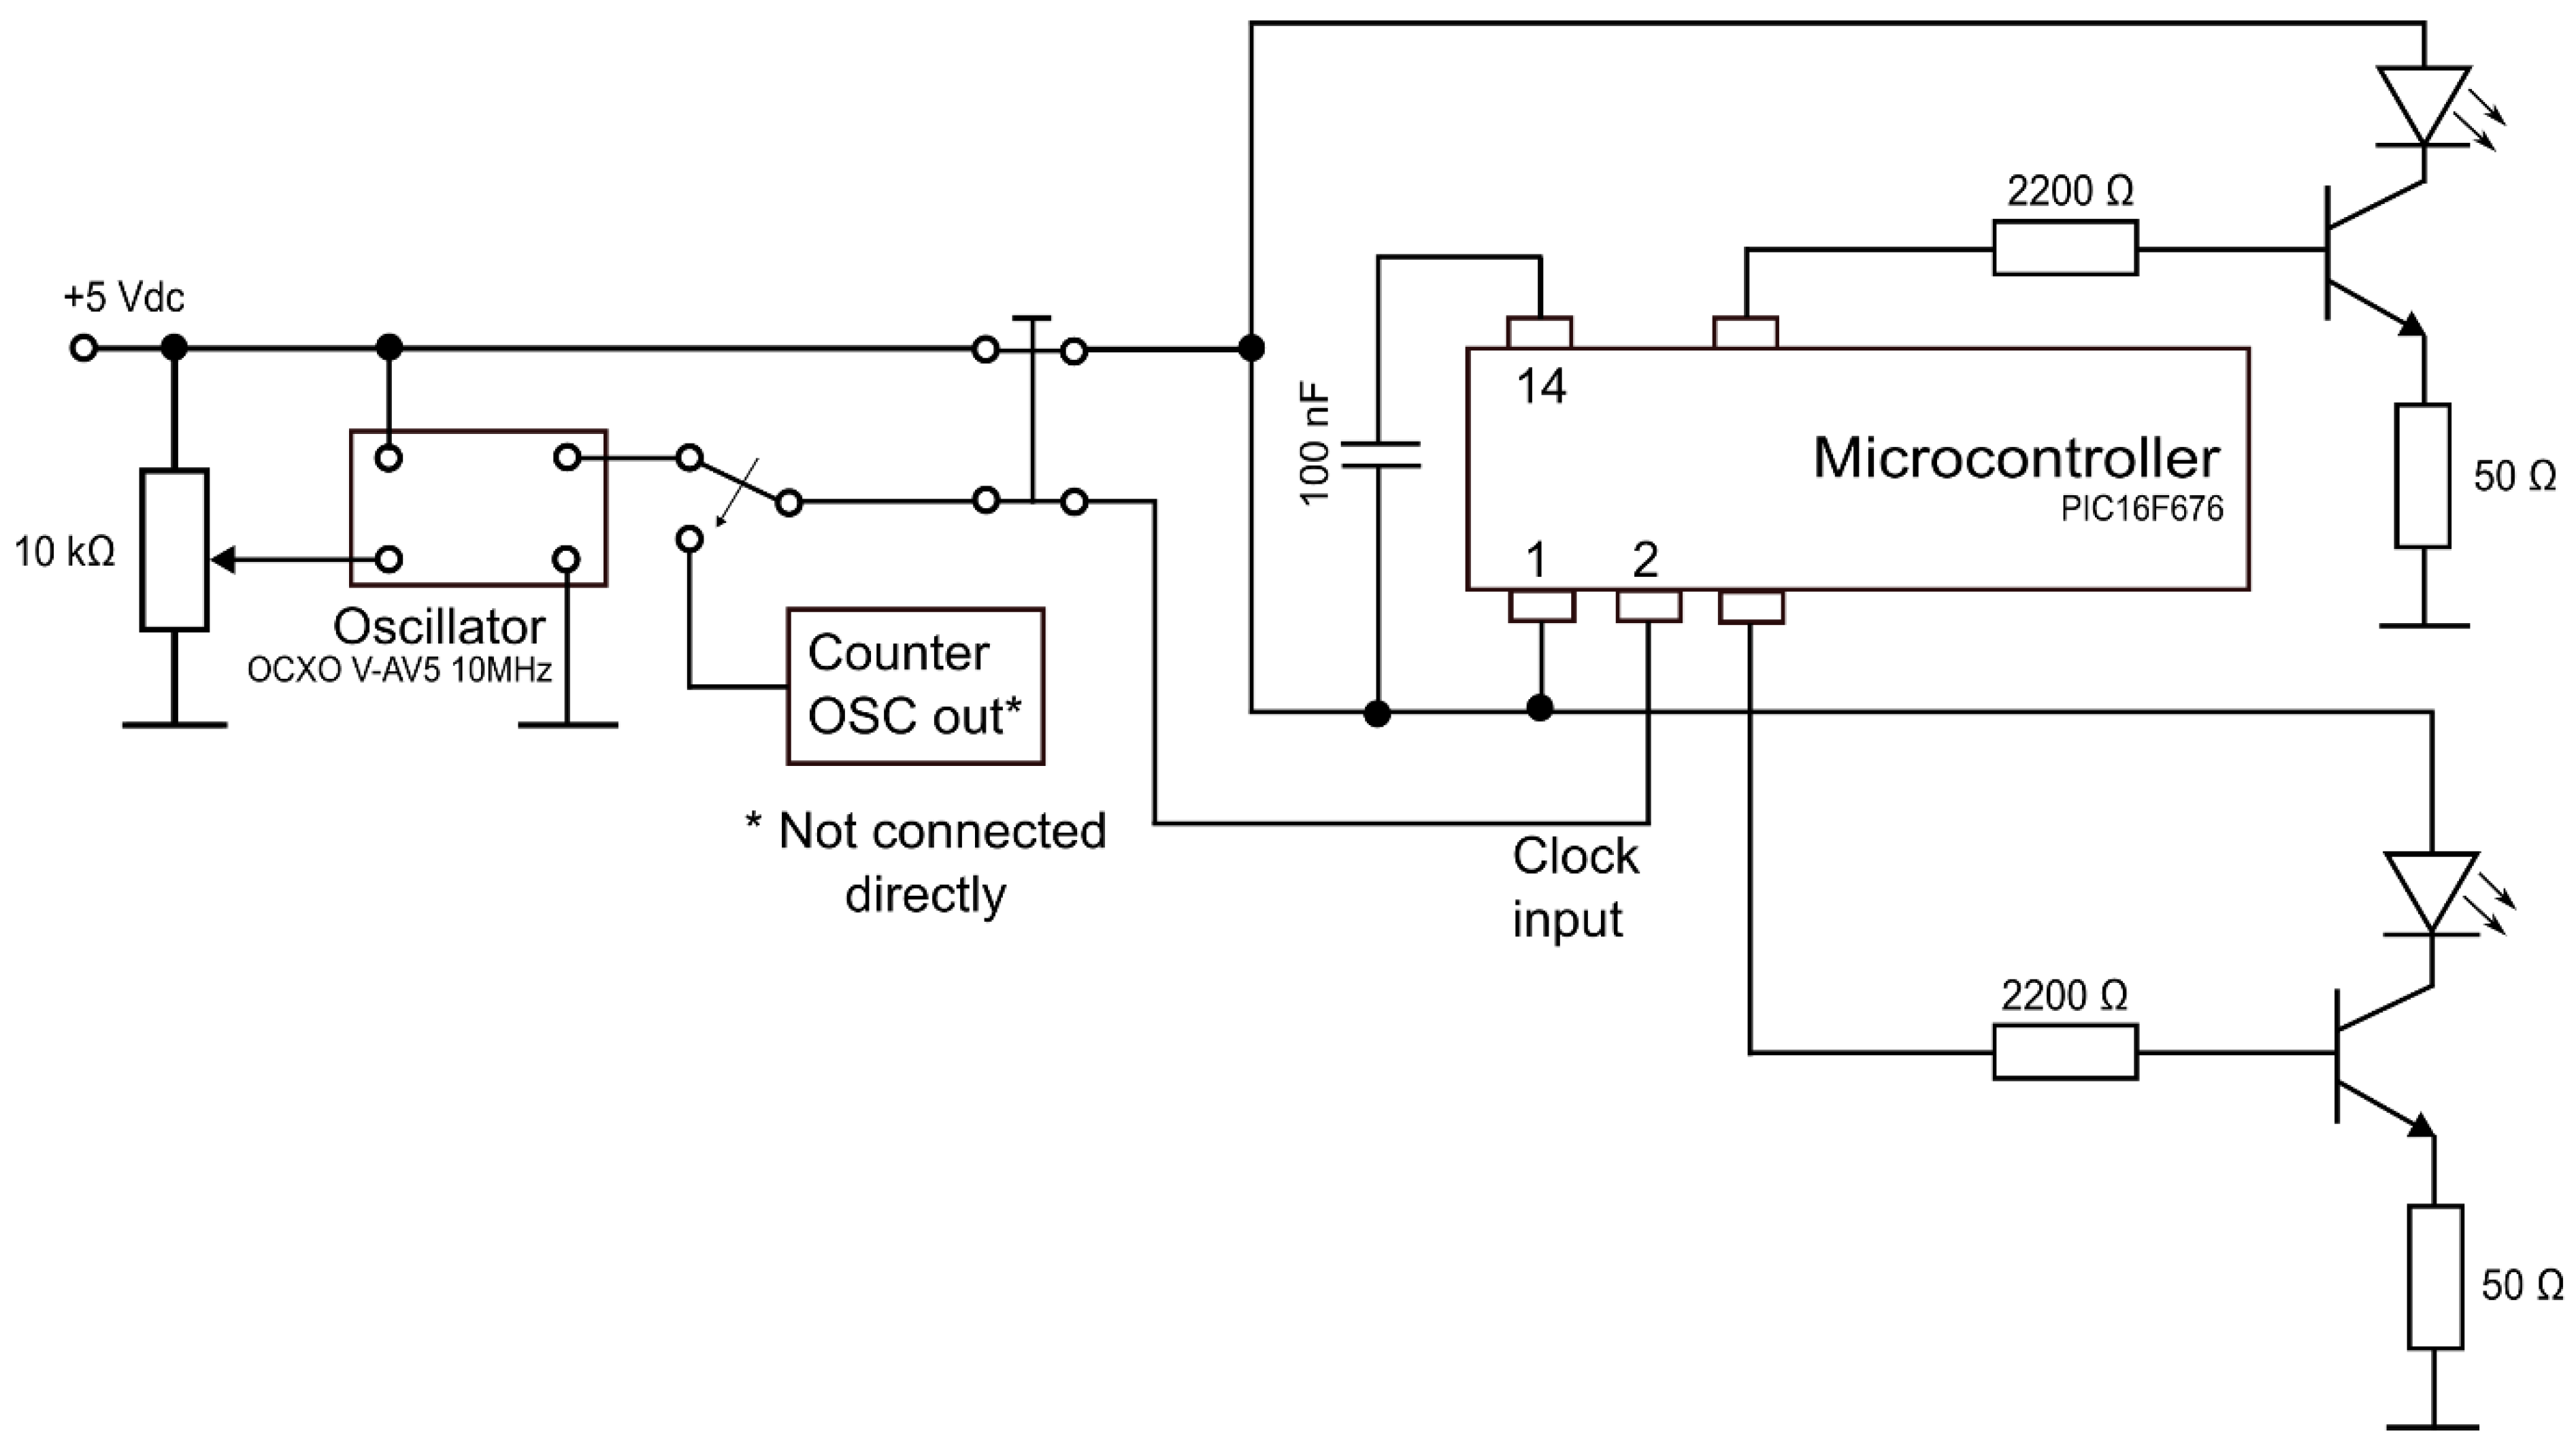
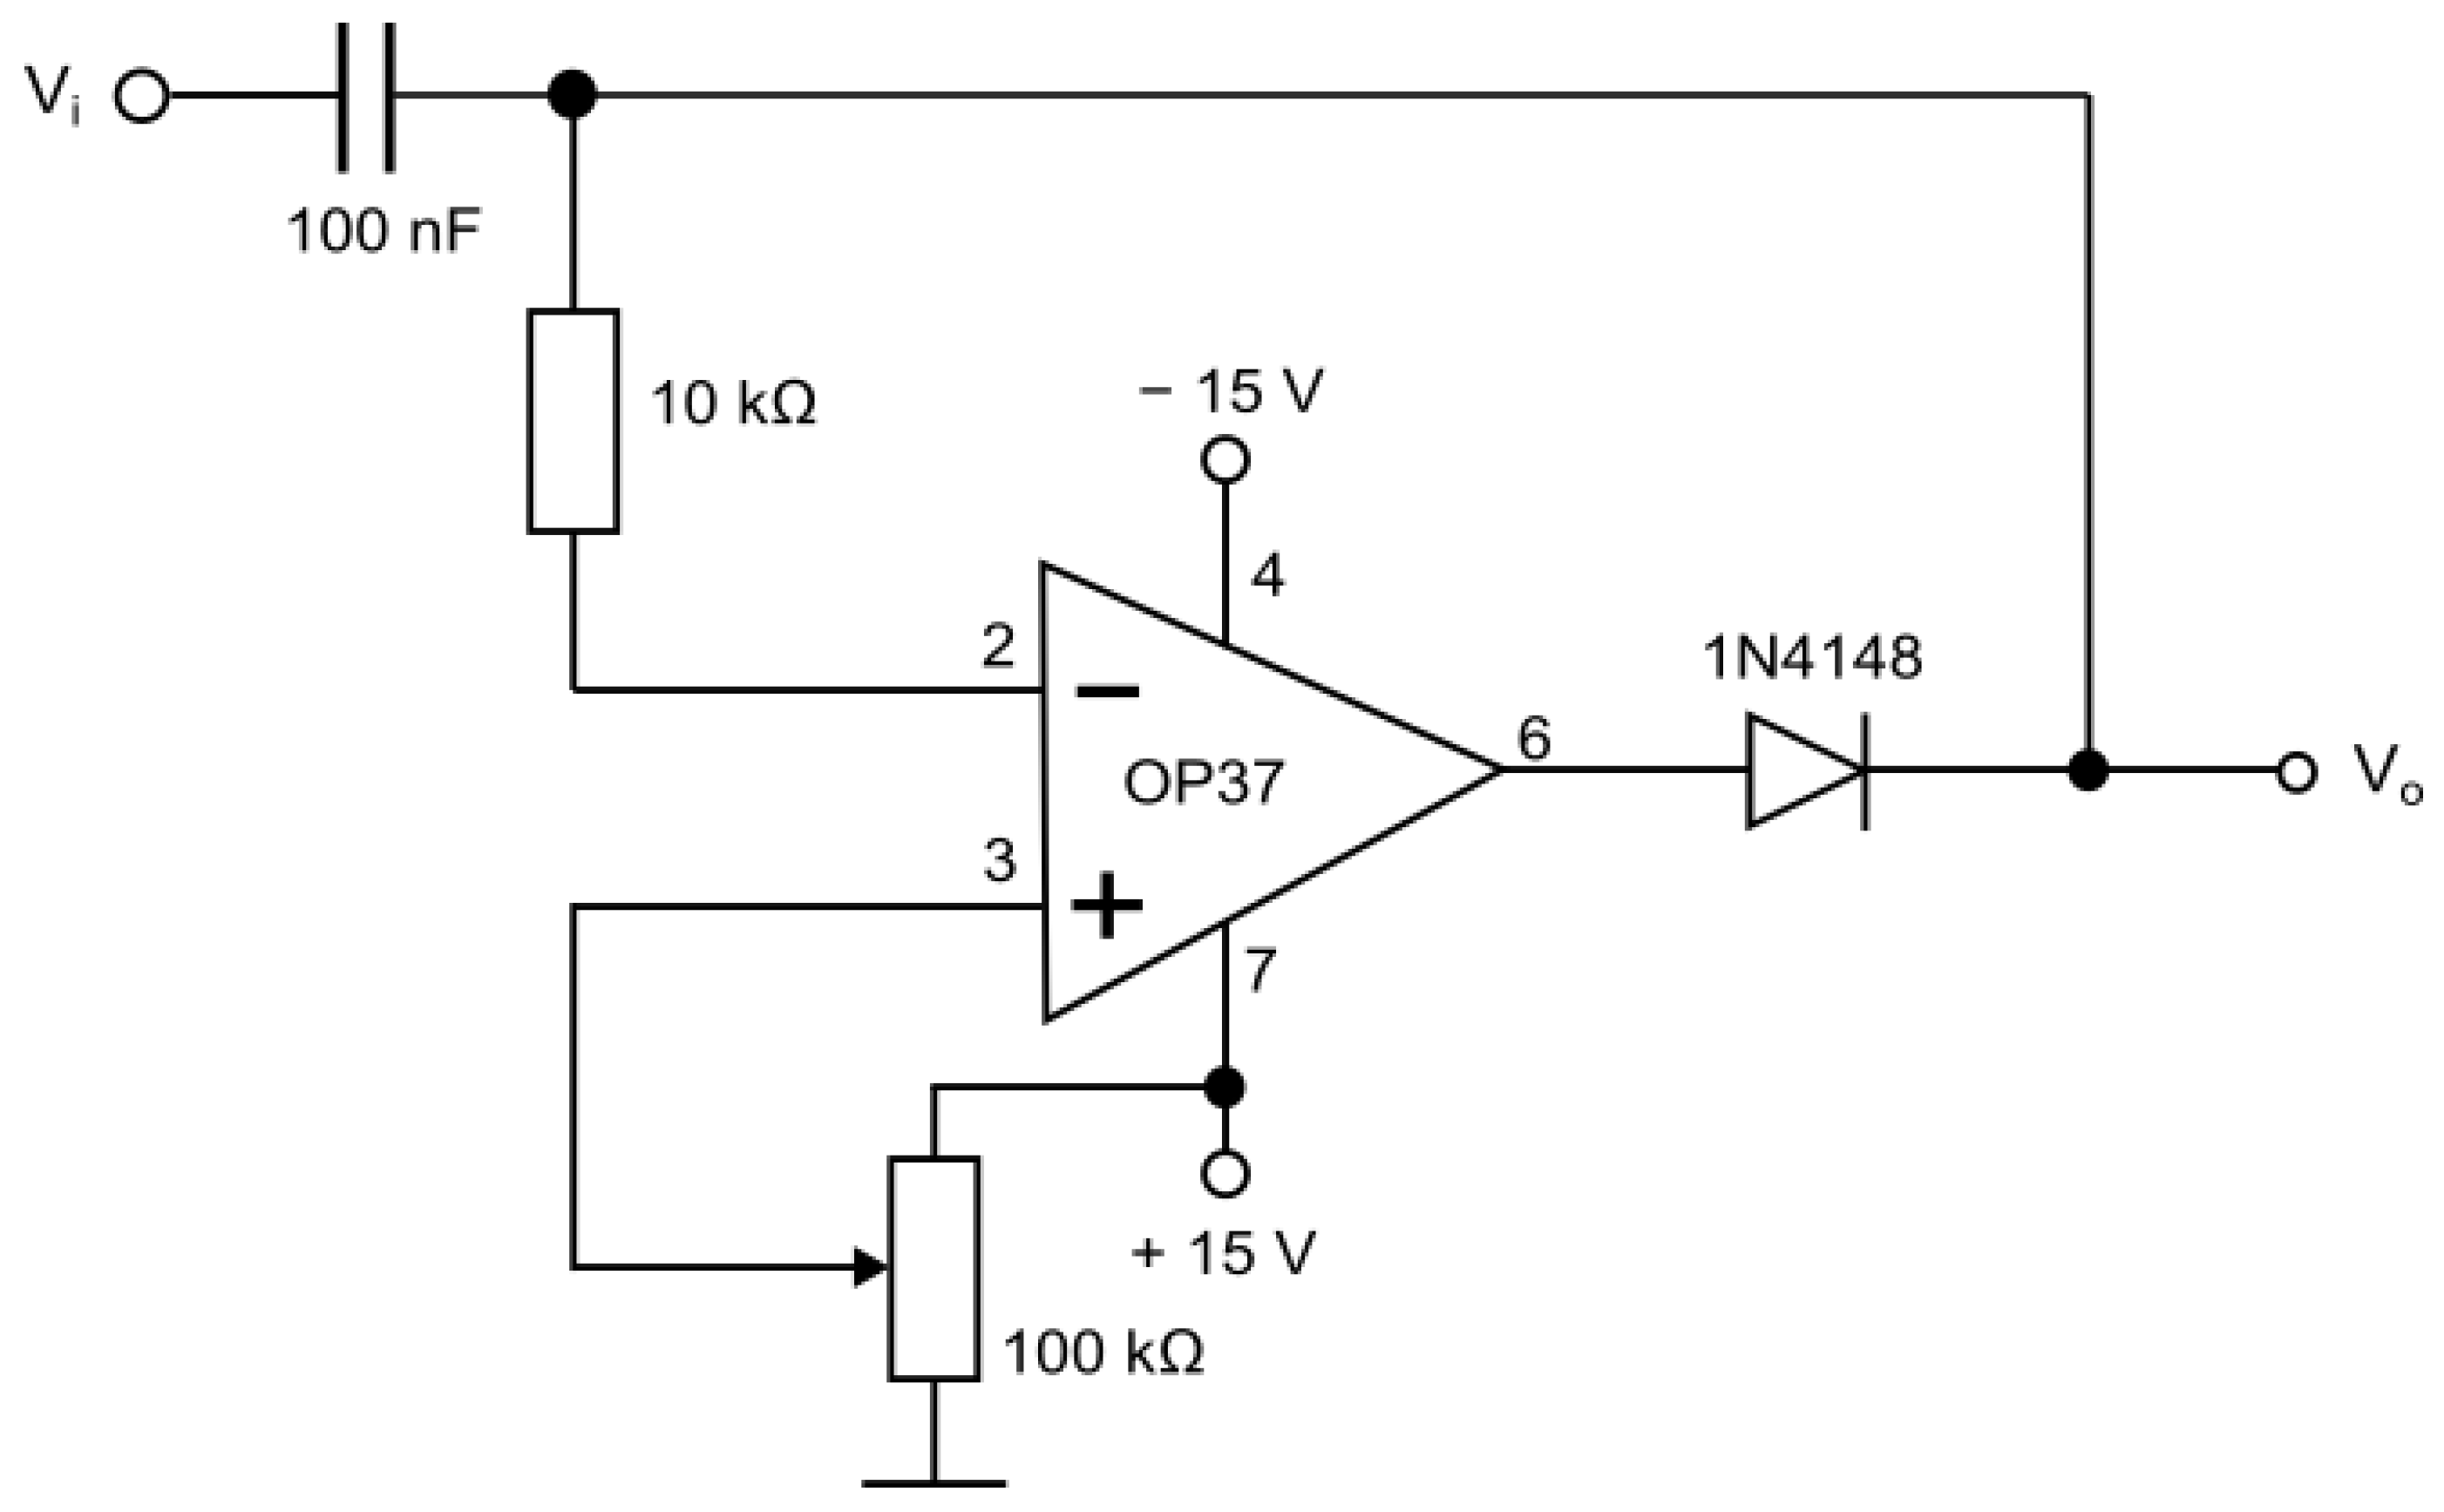
The circuitry part of the device consists of several components. According to
Figure 1, these are clock input, microcontroller, LEDs and current limiting resistors. The Microchip PIC16F676 microcontroller and LEDs with a light intensity of 23,000 mcd were selected (5 mm white LED, Cree C512A-WNN-CZ0B0152). Such diodes have a typical forward voltage of 3.2 V and a forward current of 20 mA, which means that the LEDs can be directly connected to the output port of the microcontroller. If the excitation is pulsed, it is possible to use higher currents. Therefore, the outputs of the microcontroller are connected via a resistor to the high-frequency transistor BC33725-ML with a current gain bandwidth product of 100 MHz. The schematic of the device is presented in
Figure 3.
Regarding the price of developed device components, the most expensive is the oscillator, accounting for 90% of the total component price. Resistors of 50 Ohm account for 6% of the total component price and the remaining components account for 4%.
The device has a port for accessing the internal oscillator signal, so its frequency can be measured without disassembly.
When the software is made according to the proposed solution, the time between switching on the first and the next diode depends solely on the number of cycles in the code. Additional elements that can cause time delays are the switching time of the transistor and the switching time of the diode. The pulse at the output port of the microcontroller is not an ideal rectangular shape, and has a rise time of approximately 250 ns. The signal travels to the transistor, which has the rise time of approximately 480 ns. When the transistor is switched on, current flows through the LED and it starts to give light. Given that two or more LEDs are used, mutual deviations in the characteristics of components can cause the output time delay to differ from that obtained on the microcontroller. Therefore, component properties were measured using a LeCroy 6030A oscilloscope and components with similar properties were used. The rise time of 10 transistors was measured and the two with the most similar results were selected. To prevent errors when triggering counter instrument channels due to different voltage levels, 50 Ohm resistors with 0.1% accuracy were used.
First, a single switch was used for resetting the device, which switches off the power supply for all components on the device. Since this caused disturbances in the operation of the OCXO, the switch was moved to reset only the microcontroller. However, that was not a good solution because the microcontroller is not reset if there is a signal left on the input pin (oscillator in port). That is why a double switch was used, which simultaneously switches off the power supply of the microcontroller and separates the oscillator signal from the microcontroller.
2.1.2. Software
The software part provides the required functionalities to the device. The requirements are to have as little code as possible to fit in the limited memory of the microcontroller.
The basis are the subroutines that give the required time delay and the known duration of each instruction in the program.
One instruction cycle of the microcontroller consists of four oscillator periods; for an oscillator frequency of 10 MHz, this gives a normal instruction execution time of 0.4 µs. All instructions are executed within a single instruction cycle, unless a conditional test is true, or the program counter is changed as a result of an instruction. When this occurs, the execution takes two instruction cycles, with the second cycle executed as a NOP [
24].
The microcontroller can use a clock signal of up to 20 MHz and this would lead to smaller time delay resolution. The disadvantage of this option is that the best oscillators have a frequency of 10 MHz and the code would not be compatible, i.e., time delay would be two times longer with a slower clock.
The program consists of two parts. The first part is the initialization and the second part switches on and off the LEDs and calls one or more subroutines to achieve the desired time delay. The duration of the light pulse is not important because the DUT measures the time delay from the rising edge of light signals.
The principle of creating the code is such that after switching on the first diode, the subroutine is called. At the end of the subroutine, code execution returns to the main program.
Table 1 shows the duration of each instruction and the total duration.
The code for switching on diodes and the delay of 2 µs is shown in
Table 1. The code should have the duration of five instruction cycles because 2 µs/0.4 µs = 5.
The CALL function causes the program to jump to the location of the WAIT2u subroutine and with a duration of two cycles. With the RETURN command, which also has a duration of two cycles, the program returns to the execution of the code located after the function CALL.
The code in rows 2 and 3 of
Table 1 has a duration of three cycles, which means that the WAIT2u subroutine should have 5 − 3 = 2 cycles. The WAIT subroutine consists of a RETURN statement as shown in
Table 2.
Table 3 shows the number of instruction cycles for all subroutines and wanted time delay values.
Table 4 and
Table 5 present the subroutines for 10 µs and 100 µs time-duration intervals.
3. Measurement Results and Discussion
After assembling the device, the programs were created for time delays listed in
Table 3. The measurement was made with an Agilent 53131A counter with coaxial cables. The counter was set to measure a time delay between two channels i.e., time interval between the rising edge of signal on channel one and channel two. An input impedance of 1 Mohm is selected and the DC signal measurement. Edge was set to a positive slope and trigger level 0.1 V.
The microcontroller is switched on using the micro-switch and, after that, the program is started, which sends two switch-on signals to two outputs of the microcontroller with a precisely set time delay delta t between them. Before making measurements, the frequency of the OCXO was measured using a counter instrument and set to 10 MHz using a 20-turn trimmer potentiometer for each of the time delays.
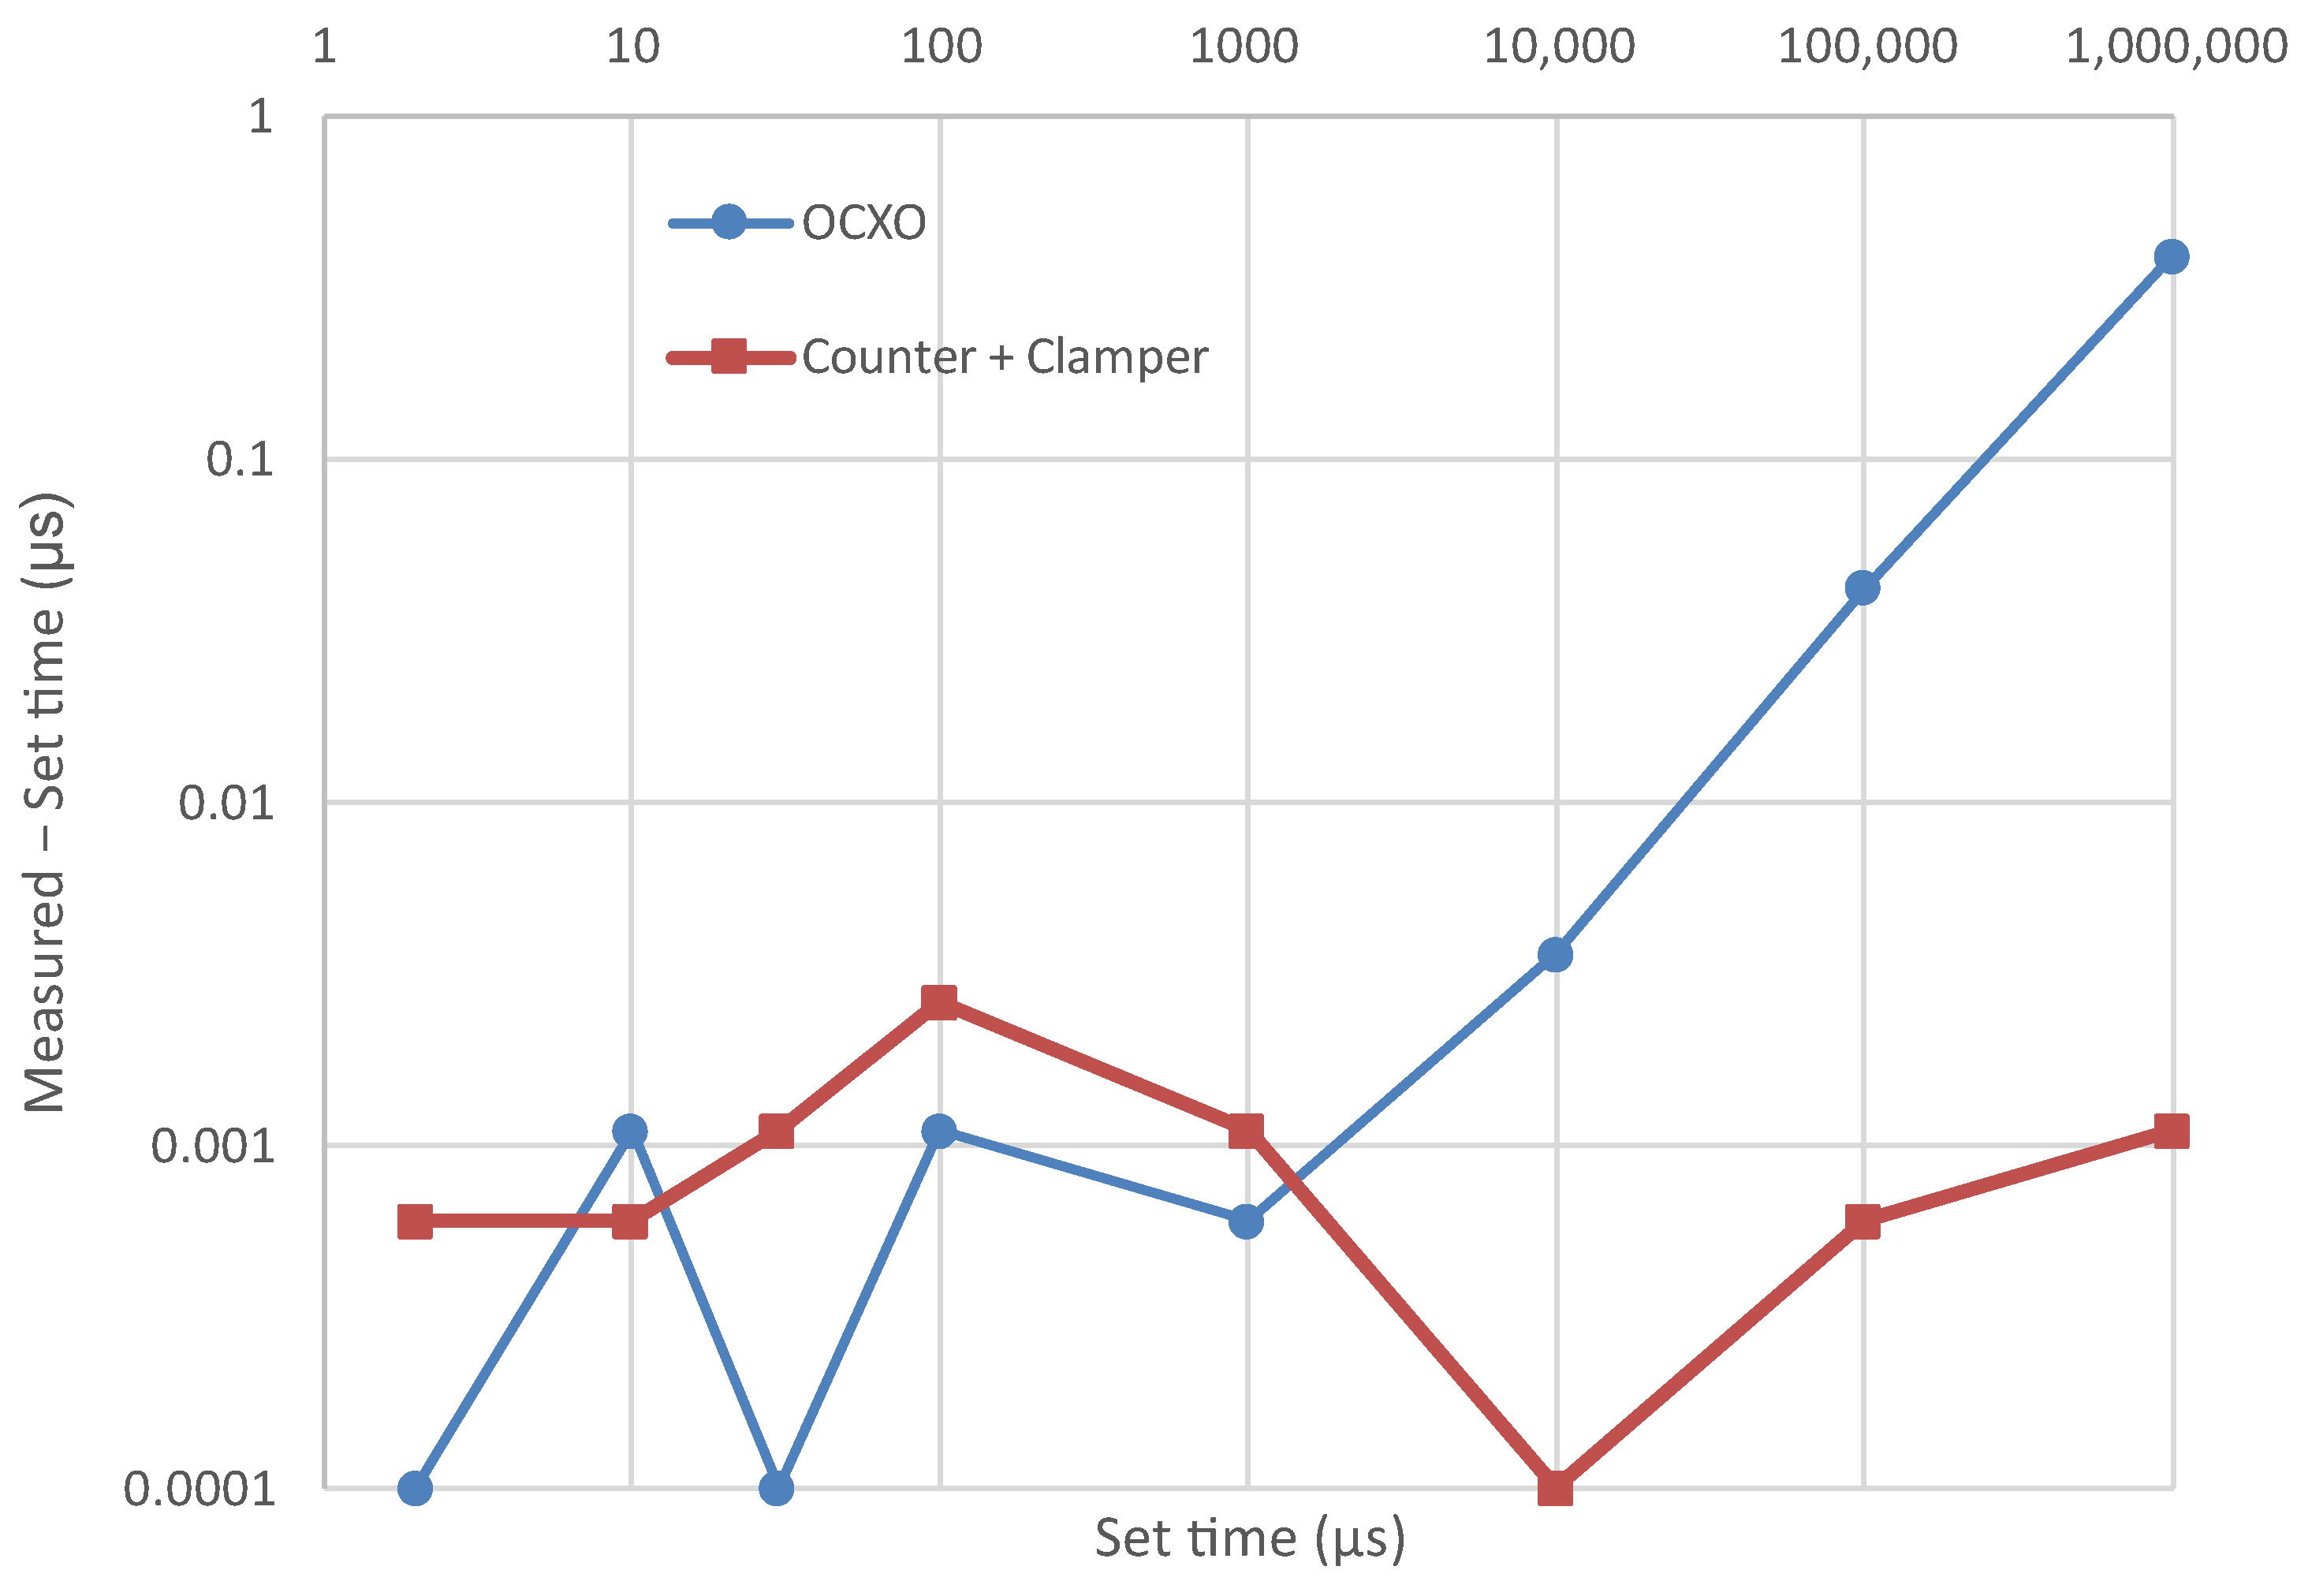
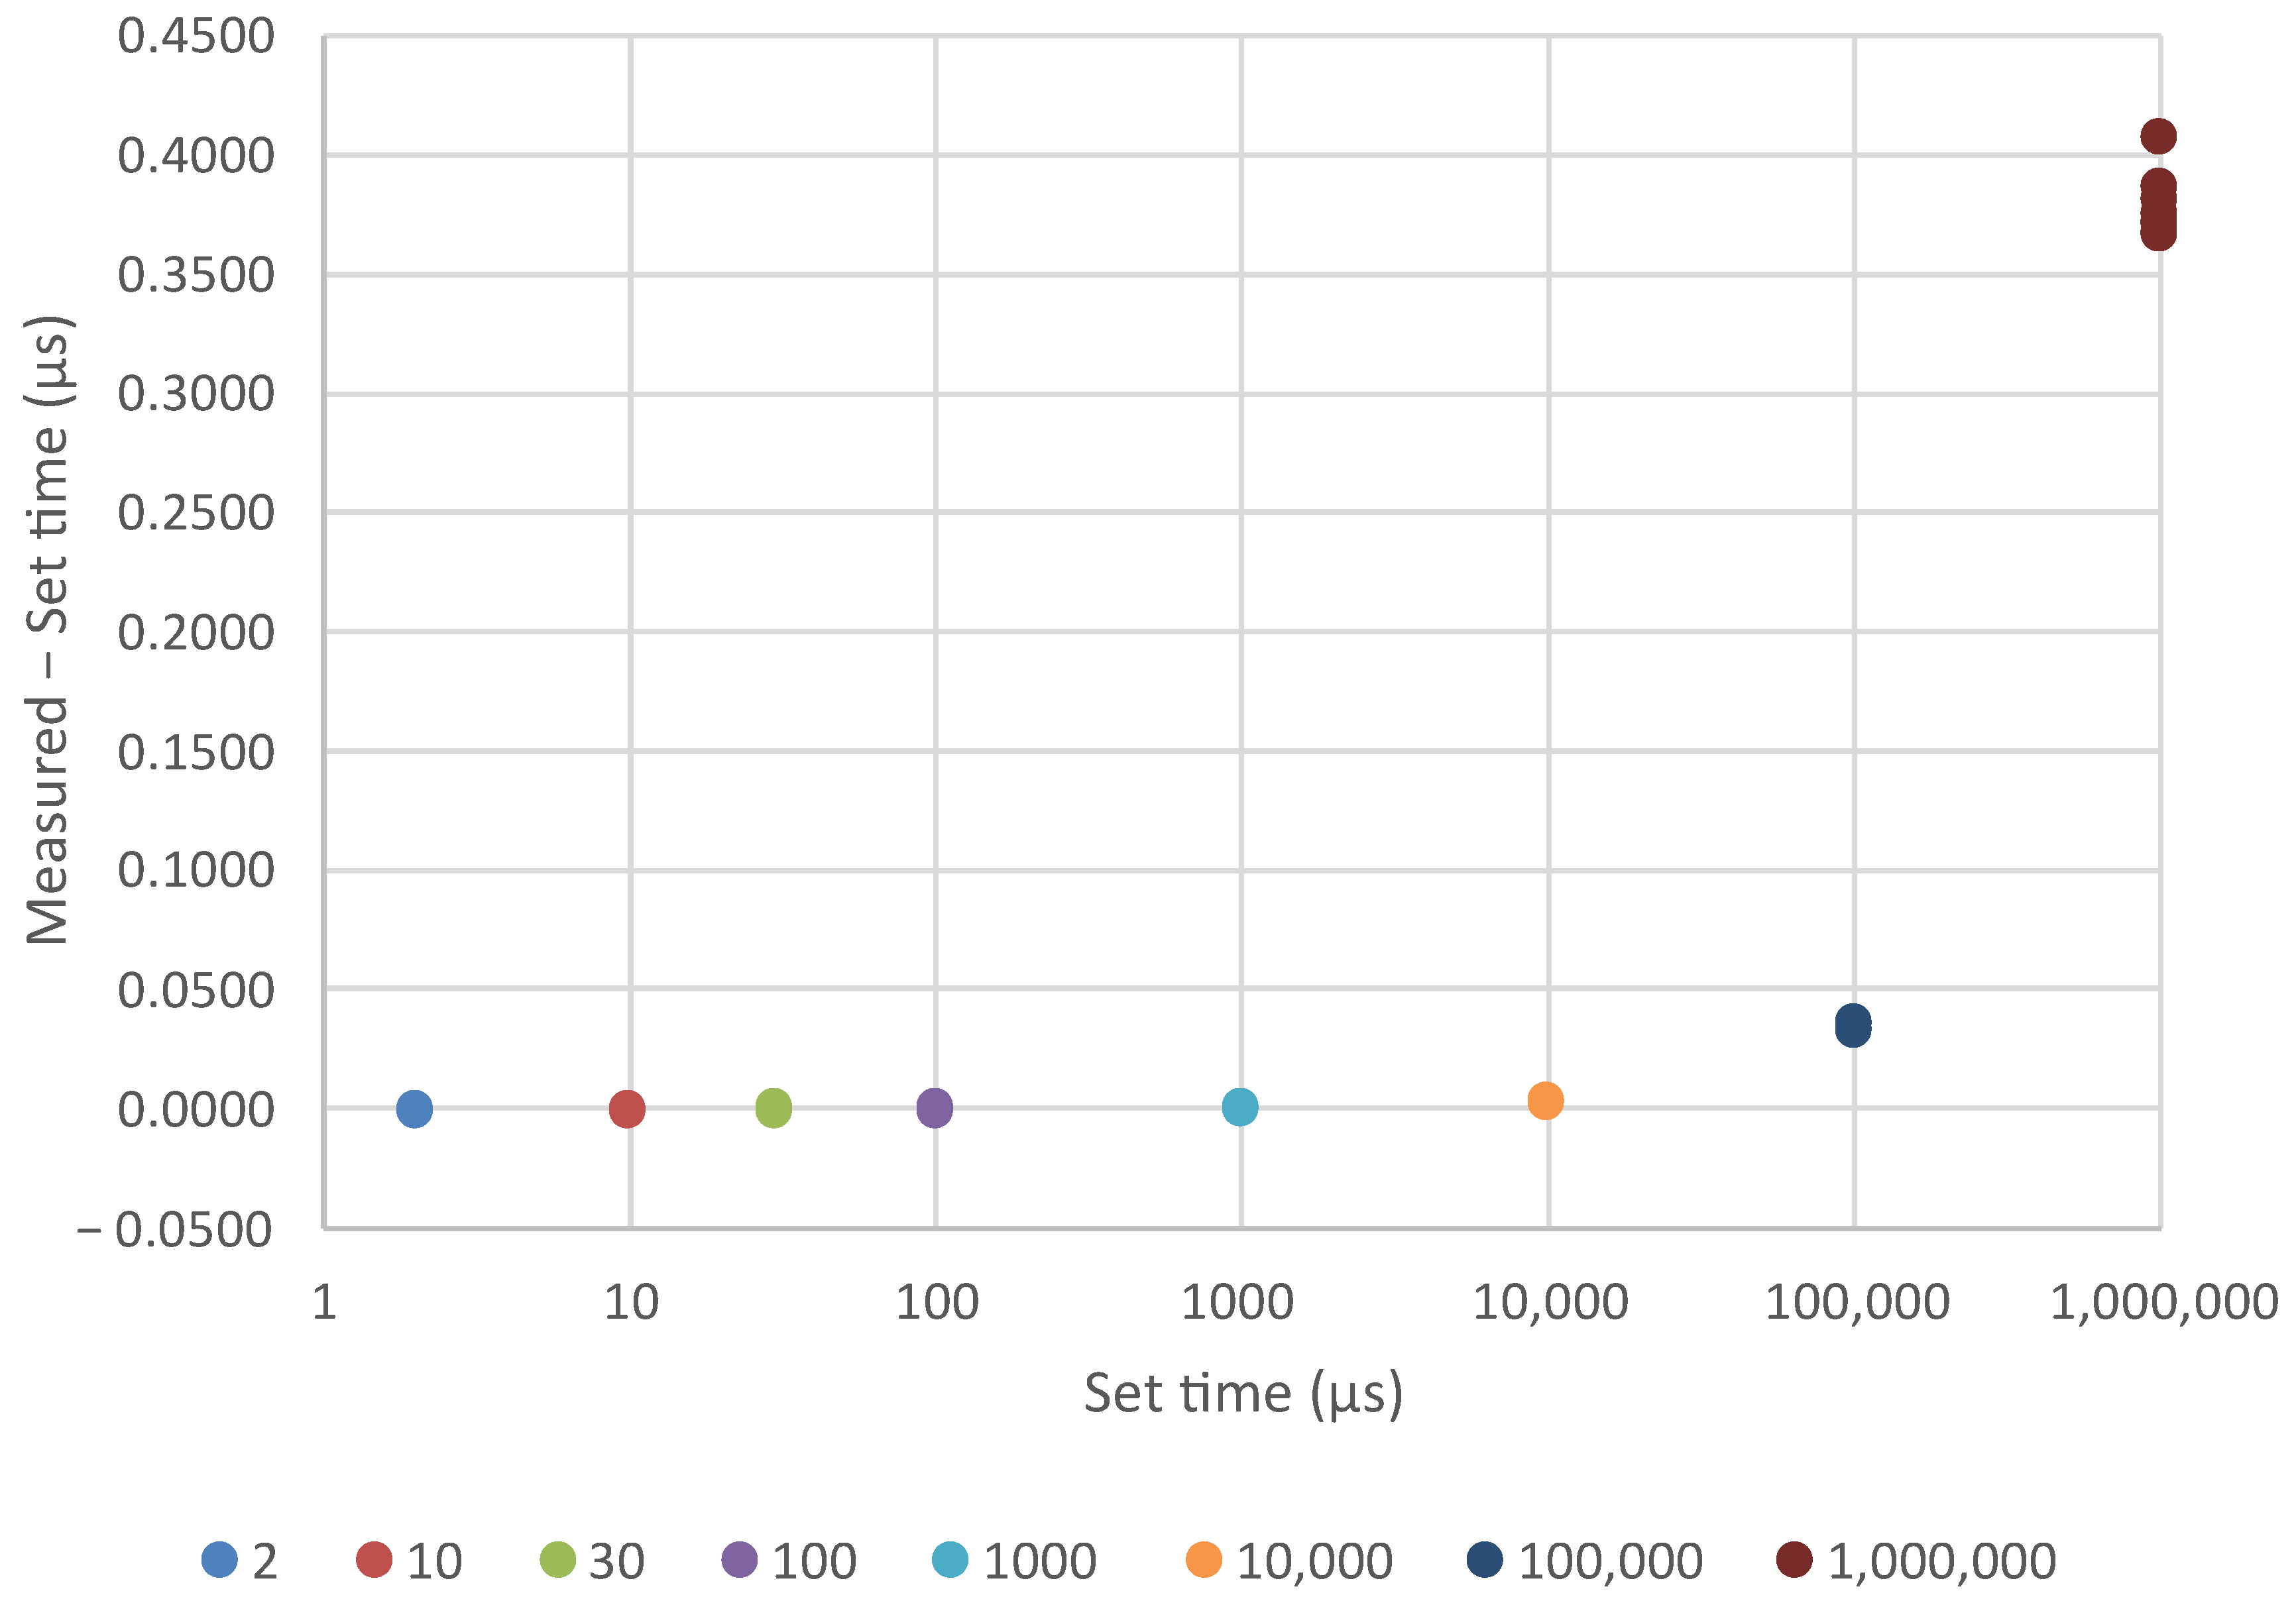
The measurement results are presented in
Table 6 and
Figure 4 marked with a thinner blue line.
Given that the properties of the OCXO and the reference oscillator in the counter are not equal, the difference between the measured and the set time delay is in the range of noise and under resolution for smaller time delays, and then increases proportionally to the set time and at the highest time delays approaches the microcontroller time resolution of 0.4 µs.
To solve that problem, it was decided to use the oscillator clock output from the counter as the input clock of the device. The counter output signal is a sine AC signal. It cannot be connected directly to a microcontroller, since excess negative voltages can damage it. Therefore, the signal needs to be offset so it does not have negative values. The clamper circuit as presented in
Figure 5 was chosen [
25,
26].
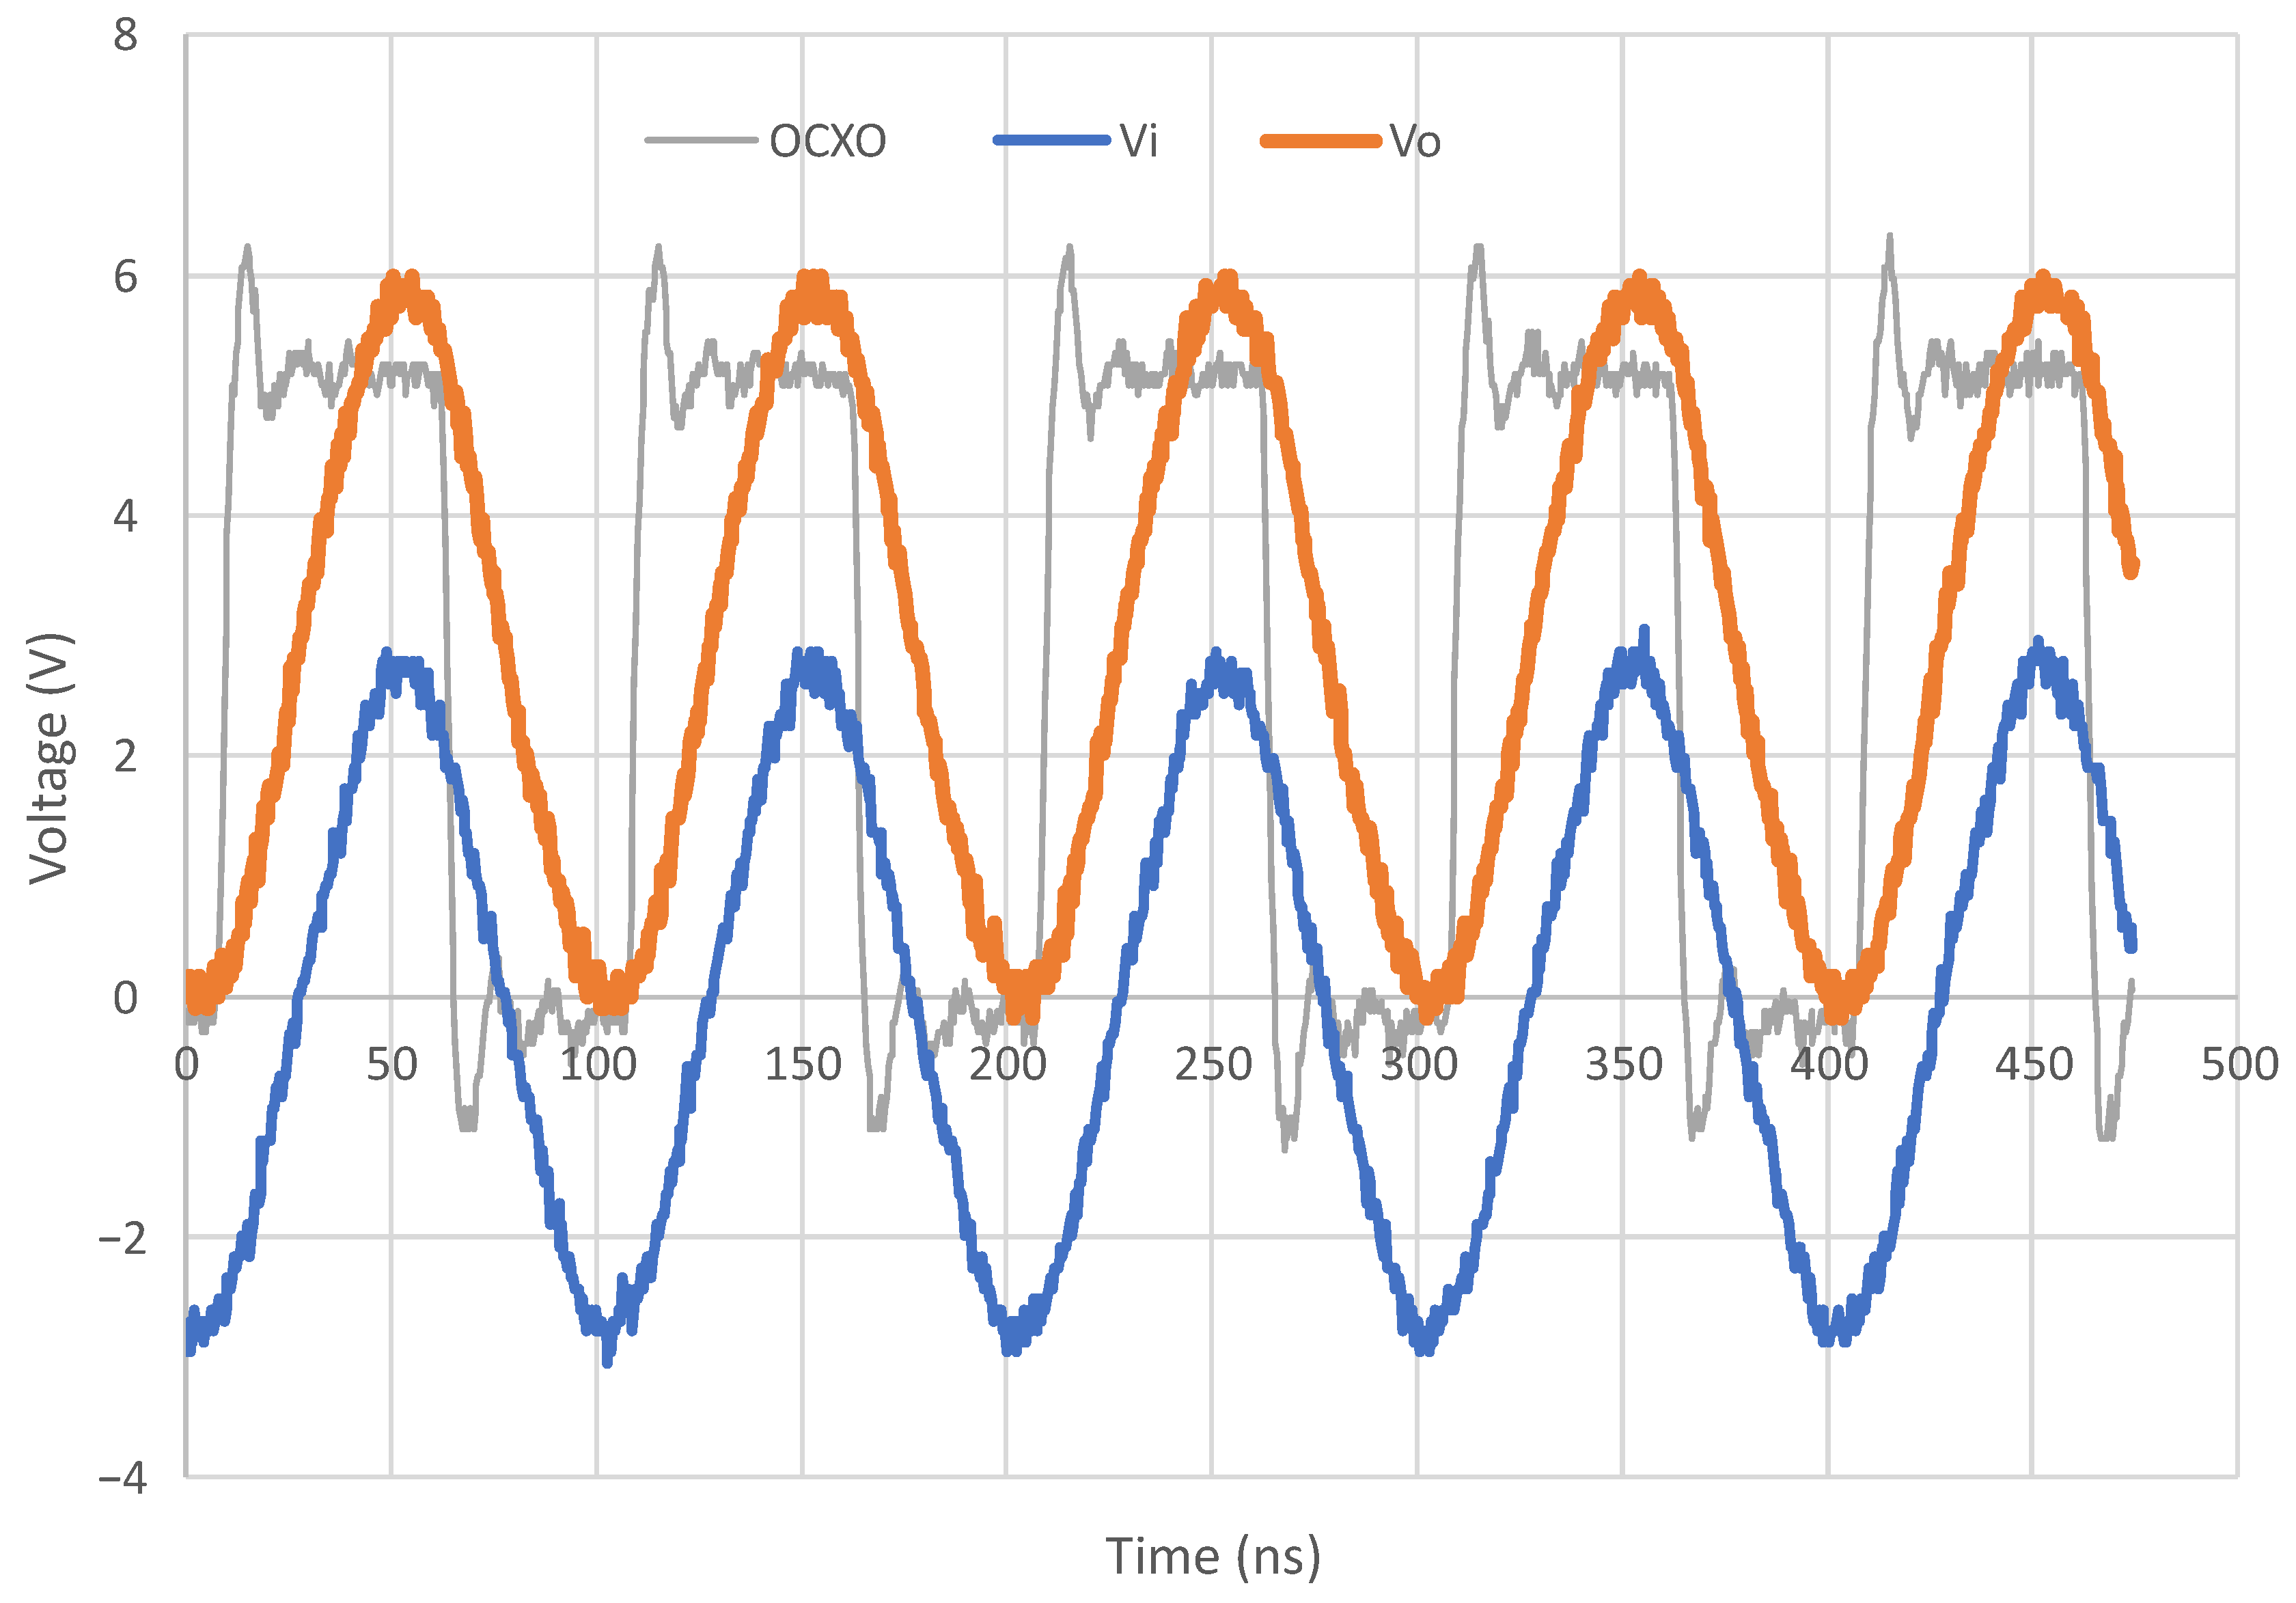
Oscillator signals that were measured with an oscilloscope are presented in
Figure 6. The thin grey line shows the signal from the OCXO, and the thicker (blue) line shows the signal from the counter output port, which is fed to the clamper circuit, and the thickest (orange) line shows the signal at the output of clamper circuit.
The measurements were repeated, and the results are presented in
Table 7 and
Figure 4 with a thicker red line. It can be seen from the results that the calculated and measured values are in good agreement, and thus it is verified that the counting of the instruction cycles in the subroutines, and hence the duration, is appropriate, and this makes it possible to obtain a precise time delay.
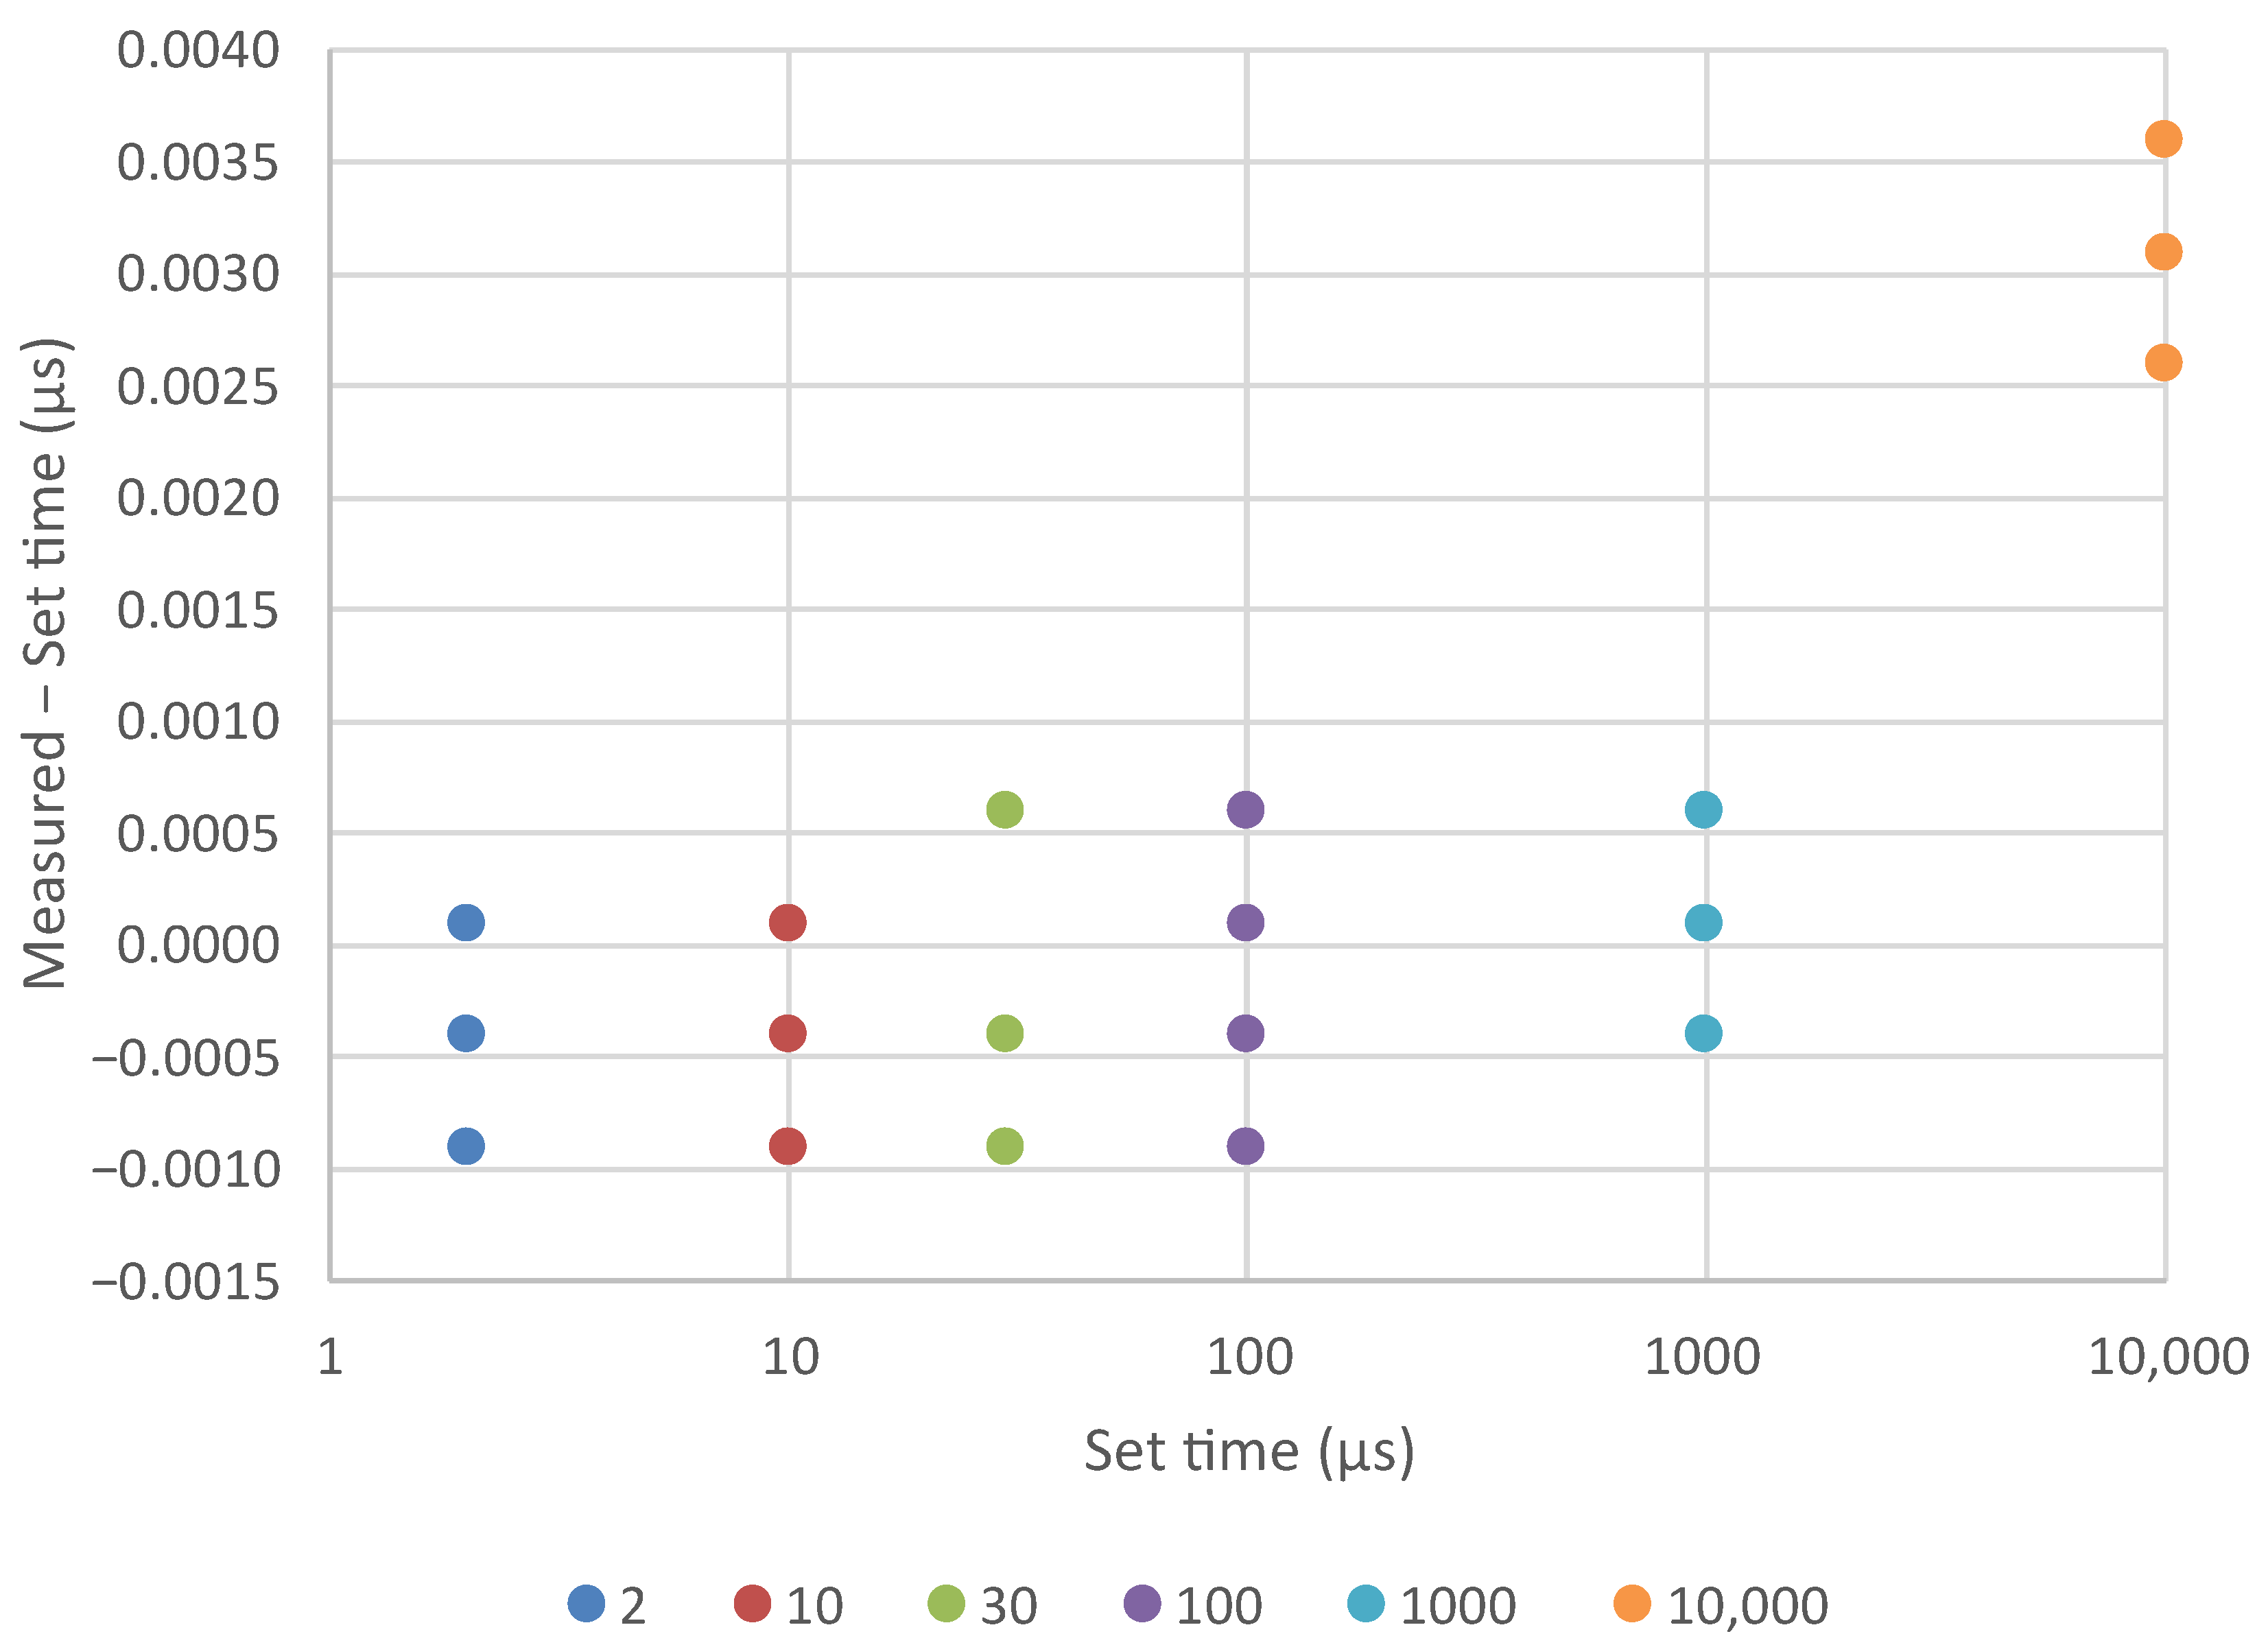
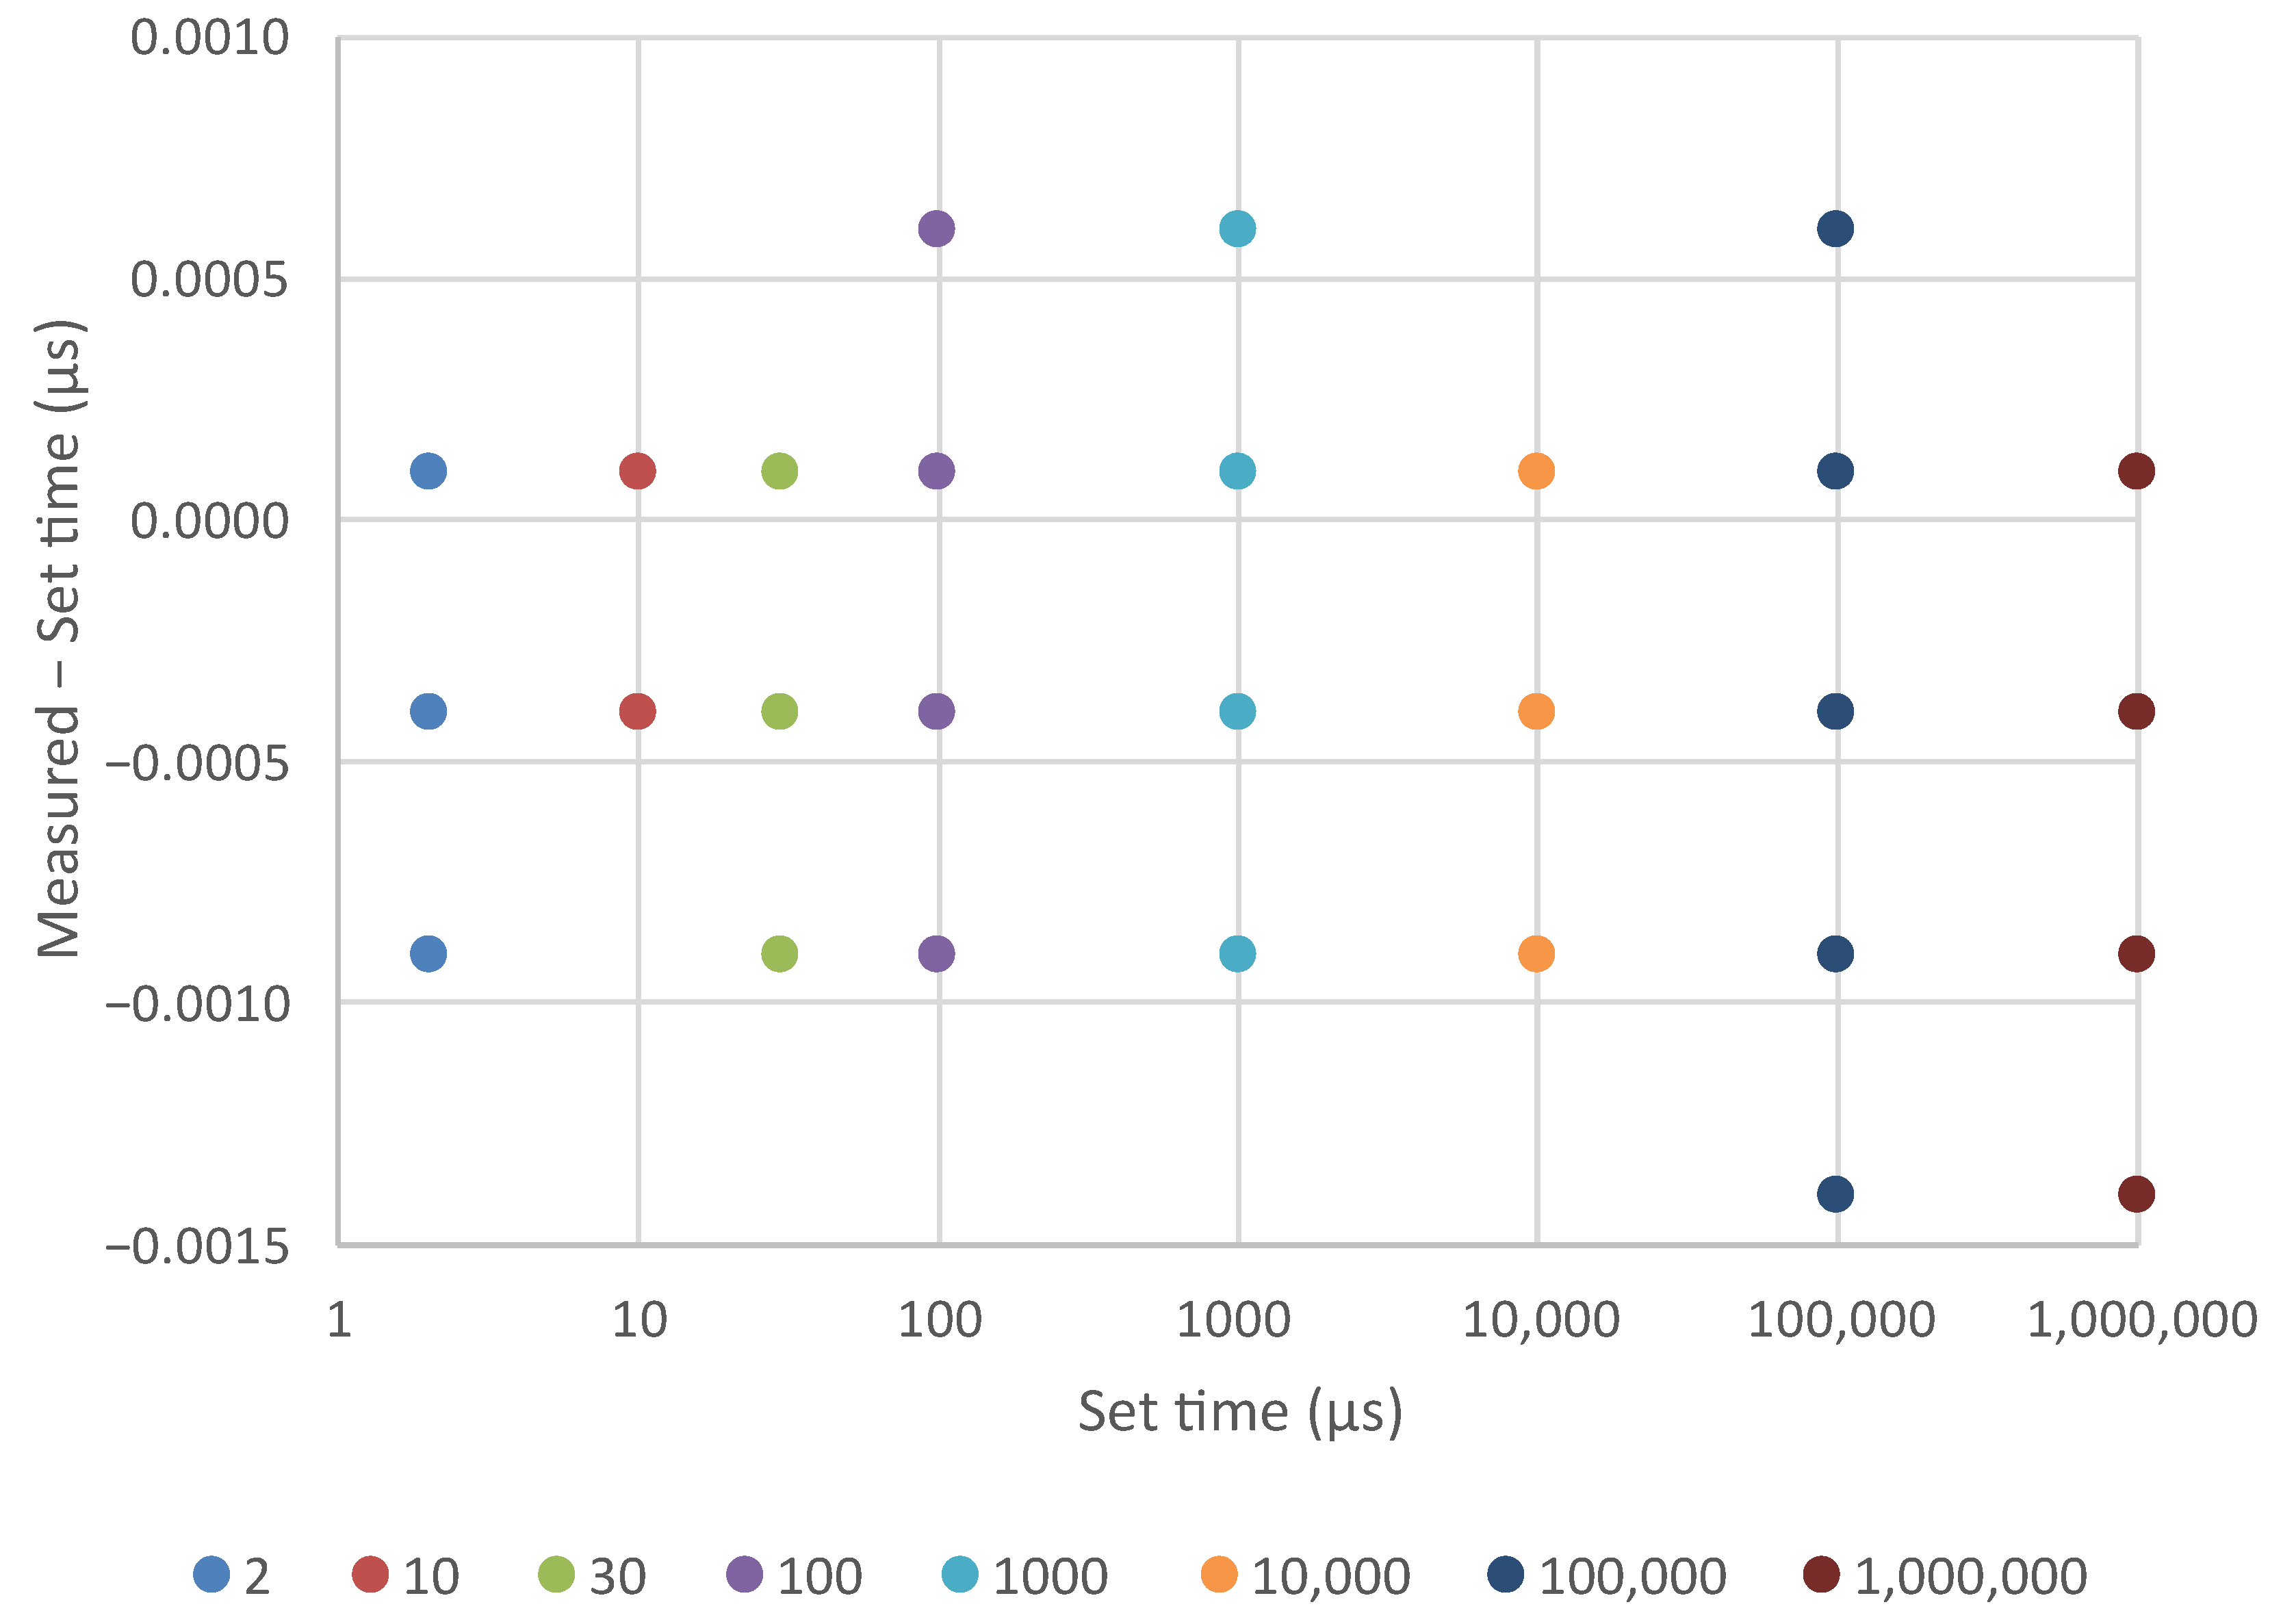
Measurements were repeated to check for repeatability, and ten measurements were made for each time delay and for two input clock options. For OCXO, the frequency was set to 10 MHz for each time delay just before measurement. In
Figure 7, the results for OCXO are presented.
Figure 8 presents the first six results from
Figure 7.
Figure 9 presents the results when using counter and clamper (C and C) as clock input.
For the first six measurements with the OCXO clock, standard deviation is similar (0.5 ns), e.g., only three to four nearest values were obtained. For the last two measurements, standard deviation increases to 10 ns and 12.6 ns. The reason for this is that the measurement of longer time delays consists of more instruction cycles and the values are significantly above counter resolution and can be detected by measurements. For delay times longer than one second, a proportionally larger difference of measured and set time is expected. Since one second time delay difference in measured and set time is approximately one instruction cycle, it was speculated that there was an error in the code.
When the counter and clamper clock input is used, the standard deviation is very similar for all time delays and in the range from 0.3 ns to 0.7 ns. The measurements consist of two to five nearest values. Since the microcontroller clock input is also a clock for the counter instrument, any changes to the oscillator frequency influences equally the execution of the program and time difference of delay measurement, hence the changes cancel themselves out. Therefore, in this option, the difference between measured and set time is almost zero for all time delays (from shortest to longest).
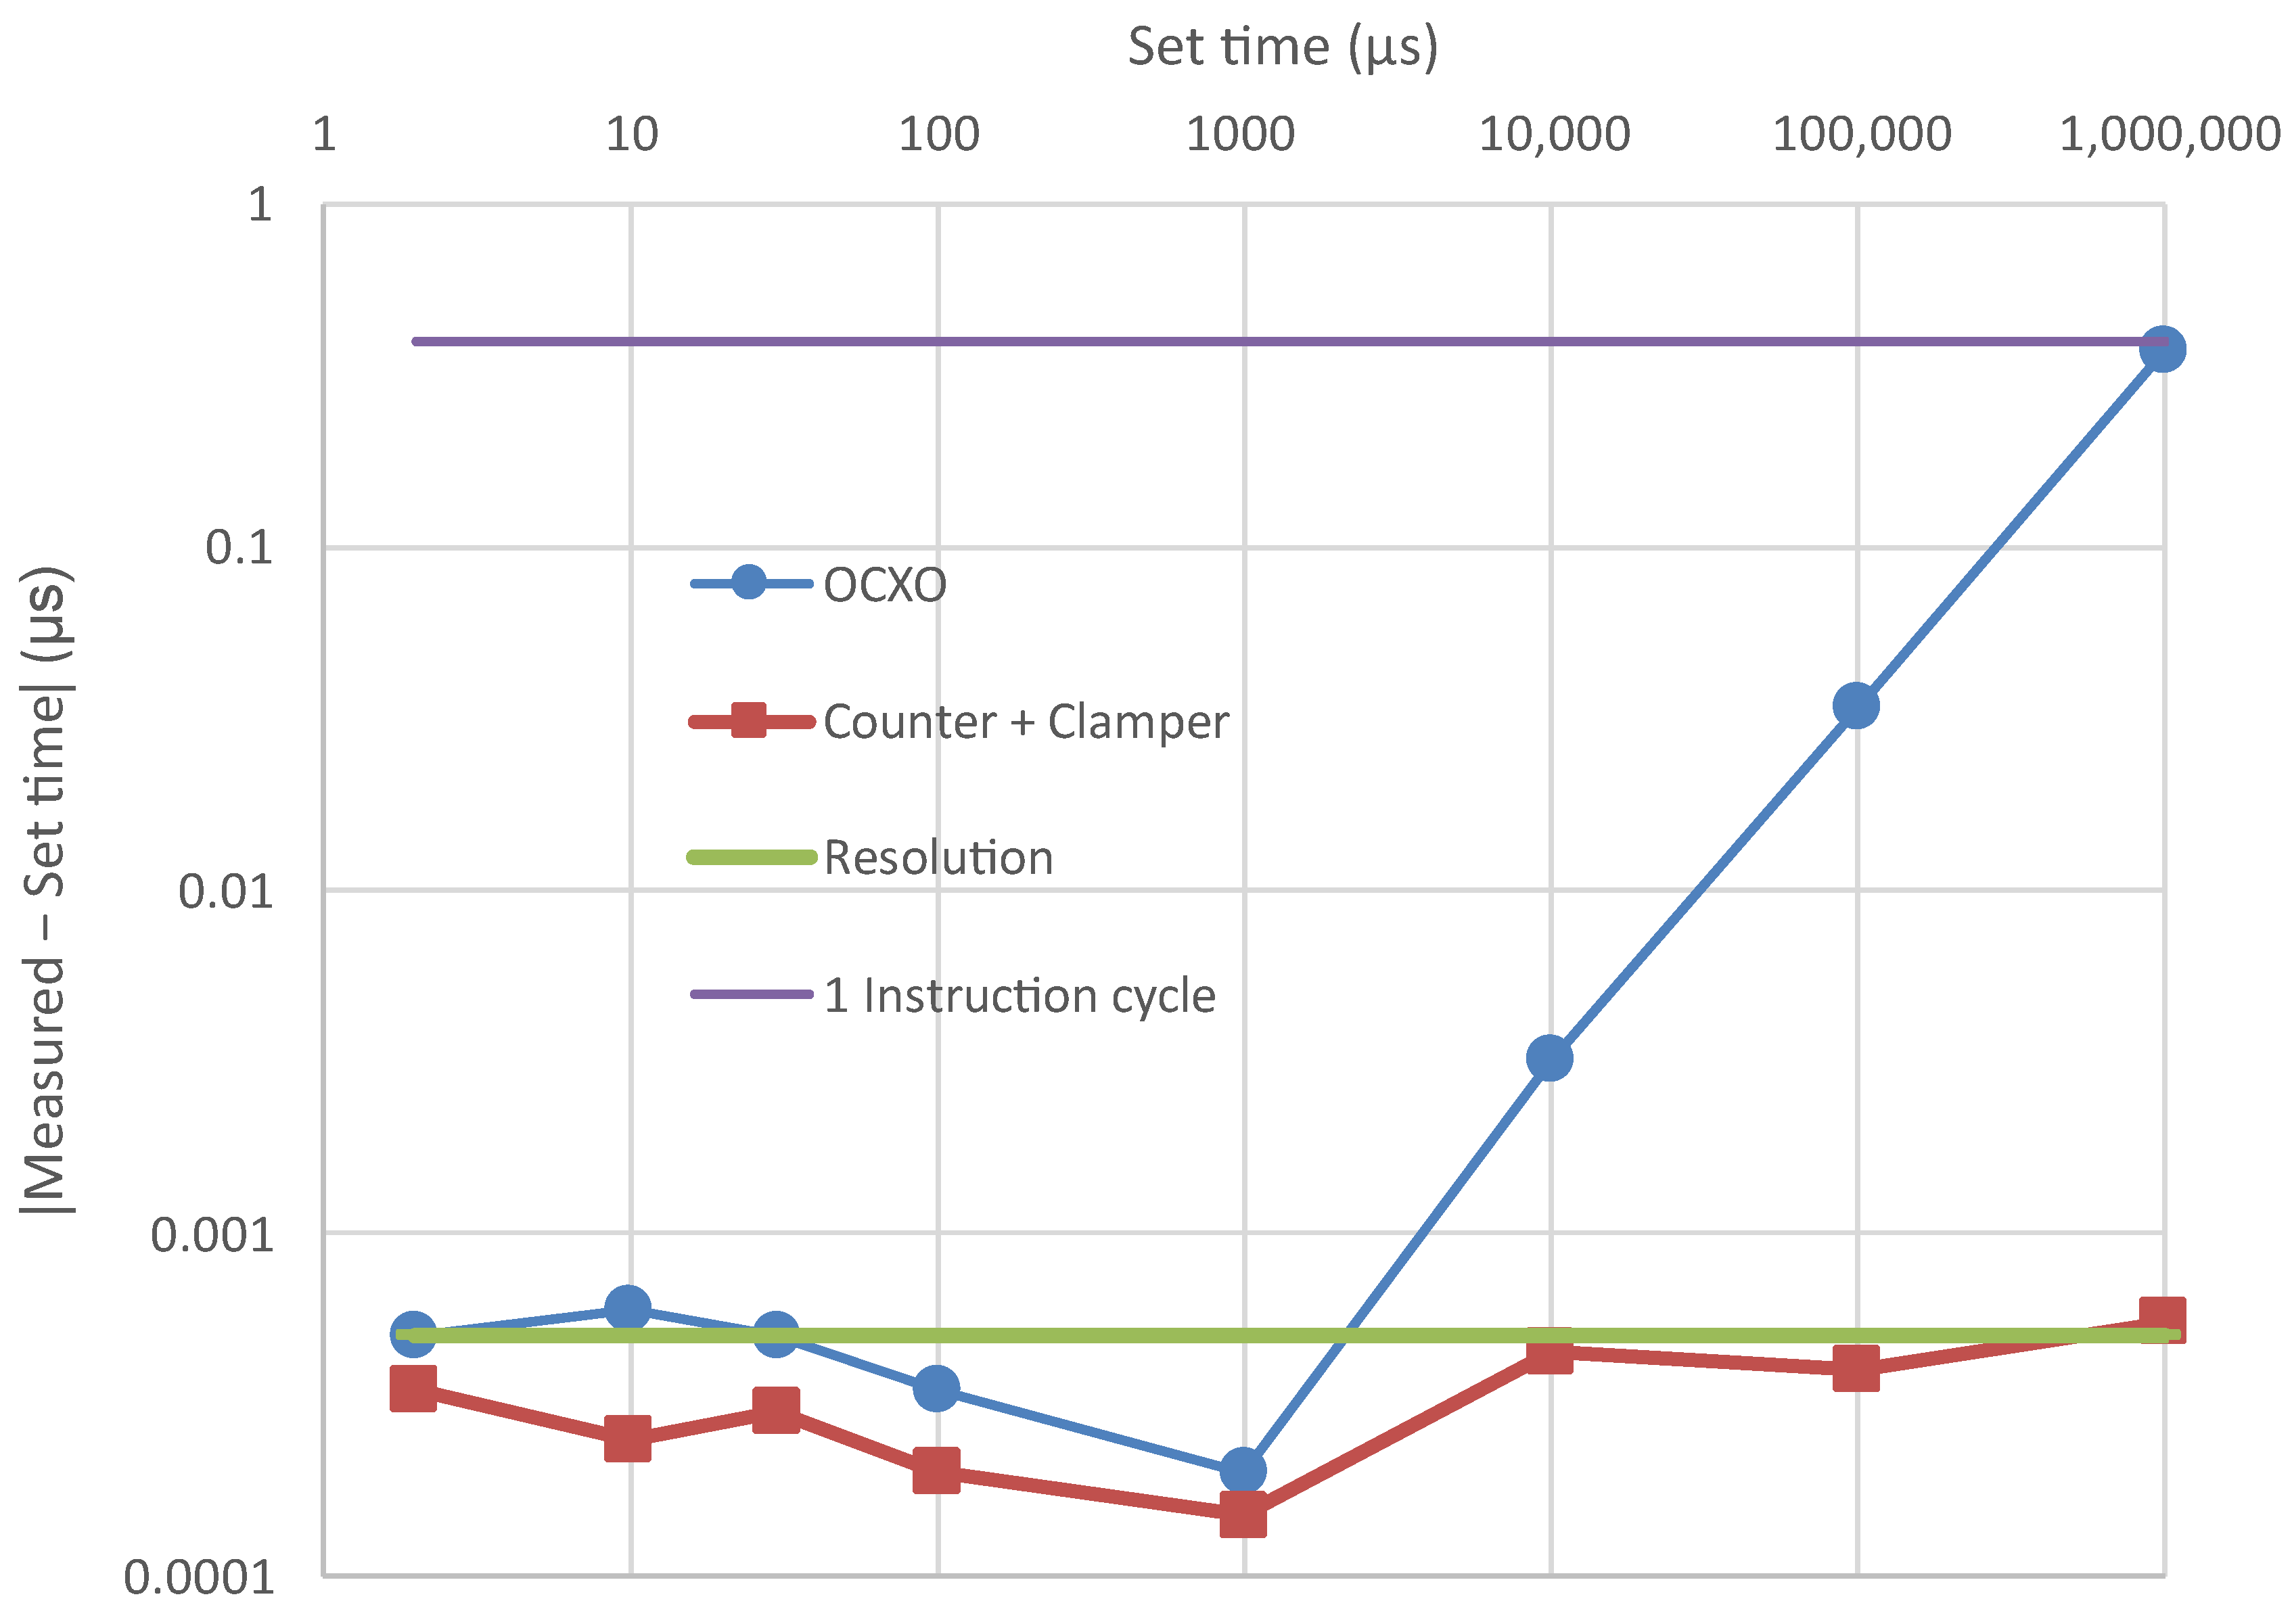
In
Figure 10, the average time delay for both clock input options is presented. Additionally, the resolution of the counter instrument and one cycle for the microcontroller is drawn. The option of using the clamper and counter as input clock shows consistency throughout all time delays, since all values are near or under counter instrument resolution.
It can be concluded that there is no error in the subroutines, and the properties of the complete device are as planned. Measurements have shown that, using the clock of the counter internal oscillator, the required time delays are obtained, i.e., the number of cycles in the created programs and subprograms has been verified.
As stated earlier, the use of an OCXO is the most convenient option for a field-use device, because it makes the device small and portable. There are several properties of the OCXO that influence the total accuracy: warm-up time, long-term aging, short-term stability, temperature dependency and stability versus supply voltage [
19]. If one wants to measure a time delay of up to 10 s with an accuracy of 0.01 µs, it is necessary to use an oscillator with better accuracy, e.g., 1 ppb. This is sufficient for the solution presented in this paper. For the best performance, one should use the best available oscillator.
Two to three devices such as this can be made that will form a group reference in the laboratory. Regular comparison (a few times a year) of its properties can ensure long-term trusted calibration and in-house reference. Regular external calibration (once a year) of device oscillators also contributes to the confidence of the results. An additional option is to use a GPS-disciplined 10 MHz oscillator [
27] as laboratory reference.
4. Conclusions
This paper presents the solution of a developed device that can generate two or more separate light pulses with a desired precision time delay between them. The device can be used in the laboratory or during fieldwork and helps ensure the quality of the results.
The developed device is compact and cost-effective, and can be used in th laboratory or in the field. The use of this device enables the operator to check VOD instruments more often and to increase the confidence in the measured result. Results can be recorded in a control chart that enables the monitoring of variations through time and identification of special events.
Using the proposed solution, a calculable standard of time delay between two light pulses was achieved. The accuracy of the device depends predominantly on clock oscillator properties.
It is possible to add a time delay selection control to the device, which allows all time delays to be obtained without the need to program individual time delays. One of the options is DIP switches for selecting a time delay and creating a complete code.
More diodes can be added to the device, which makes it possible to check the VOD measurement field device with more input channels. The only limitation is the number of ports that the microcontroller has, but there is no obstacle to using a microcontroller that has more ports.


