Article

Does Banking Accessibility Matter in Assuring the Economic Growth in the Digitization Context? Evidence from Central and Eastern European Countries

by
Alina Georgiana Manta
*,
Gabriela Badareu
,
Roxana Maria Bădîrcea
and
Nicoleta Mihaela Doran
Department of Finance, Banking and Economic Analysis, Faculty of Economics and Business Administration, University of Craiova, 200585 Craiova, Romania
*
Author to whom correspondence should be addressed.
Electronics 2023, 12(2), 279; https://doi.org/10.3390/electronics12020279
Submission received: 6 December 2022 / Revised: 31 December 2022 / Accepted: 1 January 2023 / Published: 5 January 2023

Abstract

:
The purpose of this paper is to investigate the nexus between financial (banking) accessibility and economic growth in the context of the digitization process. Thus, we built a panel model to evaluate the correlations between the banking accessibility and economic growth during 2010–2021 period for the Central and Eastern European Countries (CEEC). Furthermore, we applied the Fully Modified Ordinary Least Squares (FMOLS) method with eight independent variables measuring the degree of banking accessibility and the dependent variable for economic growth. The results show that improving financial accessibility positively influences economic growth and greater access to banking services does not necessarily stimulate economic growth. In the digitization context, the results are relevant for the policymakers outlining that investing more in digitization is important, but this does not necessarily help people to have more access to banking services because there is also a lack of will and financial education that restrain them from embracing the digital changes.

1. Introduction

The concept of financial development has been widely discussed in the literature since the last century, due to the role played in the economic progress of a country. According to empirical studies, the macroeconomic performance of a country is inconceivable without giving significant importance to the financial sector and thus, the correlation between financial development and economic growth becomes relevant. There is sufficient evidence to support the view that financial development is essential for economic growth in both developed and developing countries.
Despite eleven decades of debate and scientific research on the financial development-economic growth relationship, there are few studies that have investigated the impact of financial accessibility, as a dimension of financial development, on economic growth. Theoretically, the hypothesis of a positive influence of access on macroeconomic performance has been outlined by increasing incomes and reducing poverty. Empirically, few studies have been carried out to confirm the theory, the main reason being the lack of availability of data that include the appropriate indicators to determine financial accessibility.
The aim of this paper is to explore the impact of financial accessibility (banking accessibility) on economic growth, to test the hypothesis that better financial accessibility leads to economic growth. The sample subject of research is the countries of Central and Eastern Europe. The interest in this group of countries is caused both by the lack of research in this field, but also by the fact that Romania is part of this group of countries and will allow obtaining a more conclusive picture regarding this cointegration relationship. Due to the availability of data, the measurement of financial accessibility will be analyzed through nine indicators specific to the banking sector.
An important role in increasing accessibility on the financial market is played by the technological progress of the last two decades and the rapid digitization of financial services. The free flow of information and the innovations brought along with the digitization era have favored the creation of new opportunities and ideas in the financial development process. Digitization has left its mark considerably in banking, where the traditional physical interaction between the customer and the bank, in its branches, has been replaced by the introduction of ATMs, online banking and call centers. For Mowes et al. [1], the shift to operating web 2.0 technologies is the interplay point of customers and banking. Currently, customers choose to use online services, such as mobile banking and internet banking, and the number of ATMs has decreased from year to year, accentuating customers’ preference for digital services through remote banking. In the last two years, under the influence of the COVID-19 crisis, the need for such services has been accentuated, and special innovations have been made in this regard.
There are multiple contributions of this paper. To begin with, in the study the variables are selected from two perspectives: traditional and digital and in evaluating the influences of these variables on the macroeconomic performances of the CEE countries. Moreover, regarding the measurement of financial development, from the perspective of the accessibility dimension, no research papers could be found for the targeted space, only studies at the global level, and its connection with digitization was little investigated, especially in emerging countries. Therefore, the study covers the gap identified in the literature. Additionally, an added value of this study is given by the analysis of a group of countries with similar economic characteristics and different levels of digitization. Furthermore, the empirical results draw a detailed picture of financial accessibility in CEEC and the impact on macroeconomic performance, from the perspective of banking accessibility for the period 2010–2021 in the context of digitization. The results of the study are useful for policymakers, who should evaluate and employ more carefully different approaches depending on the development level of each country.
To achieve the proposed research goal, we will build an econometric model applying a panel of 12 countries data during 2010–2021 and testing the cointegration nexus through FMOLS estimators.
The study is organized in six sections, as follows: Section 2 provides the theoretical context and describes the literature review; Section 3 elaborates the empirical model, econometric methodology and data sources, Section 4 interprets the findings, Section 5 unravels the discussions and the last section outlines the conclusions, policy implications and limitations of the study.

2. Literature Review

2.1. Financial Development and Macroeconomic Performance

Schumpeter [2] supported first the importance of the development of the financial sector for economic growth stating that the financial sector has a significant contribution to economic growth through technological innovations. Stiglitz and Weiss [3], also supported Schumpeter’s idea, emphasizing that financial market channels are a country’s savings to profitable investments. A few years later, Greenwood and Jovanovic [4] argued the importance of financial development through the advantage of mitigating the cost of information, thus leading to a better allocation of capital. In addition, according to Levine [5], highly developed financial systems contribute to trading, diversification, hedging and risk mitigation, apart from facilitating transactions in goods and services. The positive impact of financial development on macroeconomic performance was also supported by Beck [6] who considered that the level of financial development is one of the most important macroeconomic variables that different research studies on economic growth highlighted on many occasions.
Therefore, we can outline that through institutions, markets and financial instruments, information and possibilities are provided to allocate capital efficiently, to make various profitable investments, with considerable impact on economic growth.
However, the arguments that contradict the favorable impact of financial development on macroeconomic performance were also evidenced by many authors. Thus, Robinson [7] and Lucas [8] argued that finance has a minor role in the evolution of economic growth and rather growth defines financial development.
Nevertheless, recent empirical studies provide sufficient evidence in favor of the hypothesis initiated by Schumpeter [9], and later also supported by McKinnon [10], Shaw [11], King and Levine ([12,13]) and Levine et al. [14], according to which financial development is the engine of economic growth. One of the recent empirical works supporting Schumpeter’s hypothesis is that of Guru and Yadav [15]. Based on the results, it was concluded that there was a strong and positive nexus between financial development and economic growth of the selected economies. Additionally, Bist [16] analyzed the long-term relationship between financial development and economic growth in 16 less developed countries and he emphasized that there was a long-term cointegration relationship between financial development and economic growth in the countries under analysis.
According to the above, we notice that there are numerous studies that have as their objective the analysis of the relationship between financial development and economic growth. Since we propose ourselves to investigate the influence of financial accessibility on economic growth, in the following we will summarize both the studies that measured financial accessibility, as well as those that analyzed the existing relationship between financial development and economic growth.

2.2. Financial Accessibility and Economic Growth

To be able to determine the causal relationship between financial development and economic growth, a good measurement of financial development is first needed. The way in which the financial development of a country can be determined is an equally controversial subject. Due to the complexity of the concept and the multi-dimensions of financial development, its measurement has become equally complex and difficult. Particular attention was paid to this topic because the appropriate definition of financial development serves both in evaluating the progress registered by the financial sector of a country, as well as in determining its impact on economic growth. However, the difficulties appeared from the stage of choosing the key variables, which would be representative and relevant in the measurement of the financial sector. Therefore, Cole [17] tried to explain that the methods used at that time failed to provide a broad and sufficient picture of the size of financial systems. Additionally, Edwards [18] spoke about the difficulty of choosing the appropriate variables for measuring the degree of financial development.
Currently, although the databases have developed and offer more transparency to researchers, there are significant differences between countries regarding: the financial structure, the size of financial institutions, the variety of financial instruments, etc. Thus, it is difficult to say that there is a unique and precise way to measure financial development, which can be applied to all countries. However, in most studies, aggregated variables of financial development are used for quantitative measurement and to determine the depth of financial markets, such as: insurance premiums to GDP ratio, stock market capitalization to GDP ratio, deposits to GDP ratio, and bank credit to GDP ratio. However, different components of the financial system as stock markets, banks or insurance companies have different impacts on economic growth.
Therefore, Arcand, Berkes and Panizza [19] used the credit to GDP ratio to establish that there is a threshold above which financial development no longer has a positive effect on economic growth. Moreover, Beck et al. [20] argued that high levels of private credit as a share of GDP do not necessarily mean high levels of financial development.
Furthermore, according to IMF staff [21], financial development is defined as a combination of depth, accessibility, and efficiency. Moreover, World Bank’s Global Financial Development Database [22] has developed a conceptual framework to measure financial development around the world. This framework identifies four dimensions mentioned above, which are measured for the two major components of the financial sector, namely financial institutions, and financial markets. For the qualitative measurement, dimensions such as: efficiency, stability and access are used, the latter being the dimension that is the object of this research.
Other strands in the literature [23] measure financial development, from the perspective of financial accessibility. Thus, they examined the extent of financial access in developed and developing countries by constructing the financial access index separately for banking and non-banking institutions. Accessibility is addressed in three categories: physical access, ease of transactions and cost of transactions, each category is analyzed incorporating several indicators. Additionally, Kendall et al. [24] measured financial access around the world, comprising a set of financial accessibility indicators for 139 countries, and described the results of a preliminary analysis of this survey based on World Bank data.
Additionally, Boldbaatar and Lee [25] emphasized that high financial accessibility determines high income in general and that an increase in financial access indicators had a more significant impact on economic growth in low-income than in high-income countries. Furthermore, Nguyen et al. [26] confirmed that financial development had a positive effect on economic growth and their nexus is linear. Nevertheless, Bist [16] analyzed the relationship between financial development and economic growth in low-income countries and evidenced that there was a positive long-term relationship between financial development and economic growth.
As for the Central and Eastern Europe, as far as we researched, only Dudian and Popa [27] carried out an empirical analysis of the relationship between financial development and economic growth and they outlined that non-performing loans have a significant and quite large negative influence on economic growth.
Thus, the first hypothesis can be postulated:
Hypothesis 1 (H1). 
Improving financial accessibility positively influences economic growth in CEEC.

2.3. Financial Development and Digitization

Considering the speed with which digitization has developed and infiltrated people’s lives, as well as the importance of financial development on economic growth, debates regarding the relationship between financial development and digitization did not take long to emerge.
Thus, Solow [28] initiated the hypothesis that technological innovation favors the increase in the standard of living more than the accumulation of capital. This hypothesis was also supported by the research of Haibibi and Zabardast [29], through the study conducted in OECD countries, where it was proven that the improvement of technology led to economic growth. Indeed, the remarkable results recorded in the last two decades support and prove the importance of technological progress and digitization in the entire ecosystem of the economy.
Another important aspect regarding the financial development–digitization relationship was identified by Mago and Chitowindo [30], emphasizing that good digitization provides better financial inclusion. Through the mobile banking system, people from remote areas have easier, cheaper, and faster access to performing banking operations and thus stimulating economic growth.
Furthermore, Myovella et al. [31] explored the contribution of digitization to economic and emphasized that digitization had a positive contribution to economic growth, but less advanced technologies created more opportunities in less developed countries because there is more room for improvement. Additionally, Owusu-Agyei et al. [32] found evidence of the positive impact of Internet use on various measures of financial development. Moreover, it has been found that low digitization is a major impediment to the development of financial systems and countries with technological advancements have relatively developed financial systems [33]. Nevertheless, for these developed countries, the impact of digital financial literacy in financial decision making and the perceived financial well-being nexus contribute to a higher digital financial inclusion [34].
In addition to these positive influences, other benefits of digitization on financial development are also identified, such as the reduction of information asymmetries and transaction costs. Alternatively, digitization has allowed the increase in the speed and general security of transactions, as well as the emergence of innovative business models and of personalized services [35,36,37].
Although there are many papers that have analyzed the nexus between financial development and economic growth, there is a small number of studies that investigated this relationship in the Central and Eastern Europe (CEE) countries. Moreover, regarding the measurement of financial development, from the perspective of the accessibility dimension, no research papers could be found for the targeted space, only studies at the global level, and its connection with digitization is little investigated, especially in emerging countries.
As a result, through this research paper, we will create a detailed picture of financial accessibility in CEEC and the impact on macroeconomic performance, from the perspective of banking accessibility for the period 2010–2021 in the context of digitization.
Thus, the second hypothesis can be postulated:
Hypothesis 2 (H2). 
Higher digital financial access to banking services stimulates economic growth in CEEC.

3. Data and Methodology

The study explores the effects that financial accessibility has had on the economic growth in Central and Eastern European countries. The selected period is 12 years (2010–2021). To reach the goal of our study, we selected a group of variables, as presented in Table 1.
Data on financial access indicators were collected from the International Monetary Fund, “Financial Access Survey” (FAS) [21], as well as from the World Bank [22] and Eurostat [38]. To investigate the role of financial accessibility on economic growth, we used eight specific indicators of banking accessibility, because, in most countries, the banking sector is the most representative and dominant in the financial field. Beck et al. [39] stated that it is not only important to provide opportunities for accessing financial services, but also the actual use of these services. Starting from this observation, we will use indicators that measure the ease and possibilities of access to banking services, as well as indicators that refer to the degree of use of banking services.
Due to the accelerated process of the digitization that we are facing nowadays, also as a direct consequence of the pandemic, we considered relevant to split the selected variables into two categories, each connected to the type of financial accessibility we are referring to:
-
Independent variables related to the traditional financial accessibility—the oldest typology of financial access to the banking sector derived from the primary operations of a bank: the number of commercial bank branches per 100,000 adults; the number of commercial bank branches per 1000 km2; outstanding loans from commercial banks (% of GDP); outstanding deposits at commercial banks (% of GDP).
-
Independent variables related to the digital financial accessibility—the newest typology of financial access to the banking sector derived from the necessity to embrace the digital technology and to transpose it into the banks’ activity: the number of credit cards per 1000 adults; number of debit cards per 1000 adults; the number of ATMs per 100,000 adults; the number of ATMs per 1000 km2 and individuals using the internet for internet banking.
The “trade volume” indicator is also an independent variable, but used as a control variable, while the “GDP” indicator is the dependent variable.
We initially intended to also choose other important variables that could better emphasize the financial access to digital instruments, as mobile money but, unfortunately, data were not available on the selected period of the study, nor for all analyzed countries. Therefore, the results would have been inconclusive and impossible to perform with the statistical software.
Thus, in order to assess the causality nexus between the financial accessibility and economic growth we will follow these steps: testing the stationarity of the data series by applying ADF and PP unit root tests, further using Fully Modified Ordinary Least Squares (FMOLS) to identify whether from a statistical point of view the variables included in the model are significant and if there is a cointegration nexus between these variables in the long run. The last step is performing the Dumitrescu and Hurlin test [40] to establish the causal nexus between the variables.
The impact of financial accessibility on the economic growth in the 12 selected CEECs is outlined through a panel data growth model and applied through the FMOLS estimators. We formulate the following economic growth model based on Solow [28], as Equation (1):
Δ Y i t = α Δ Y i t 1 + β j Z i t + γ F A + δ t + ε i t
where Yit is the log level of the real GDP per capita, and Zit is a set of control variables for country i at time t. It includes the log of some conventional variables used in economic growth equations, such as human capital or investment ratio. Financial accessibility is represented by the FA. Furthermore, δt is a time dummy variable to capture time-specific effects of the fixed effect model and εit is a disturbance term.
We can then rewrite Equation (1) as follows:
Y i t = α j F A d i t + β j F A t i t + γ j Z i t + δ t + ε i t
where:
  • Yit = the dependent variable, which is lnGDP, used to quantify the performance of the economic sector,
  • FAdit = the independent variables, which can be lnATMS_AD, lnATMS_KM, lnCREDCARD, lnDEBCARD, lnEBANKING used to quantify the financial accessibility in the banking system through the digital components,
  • FAtit = the independent variables, which can be lnBANKBR_AD, lnBANKBR_KM, lnDEPOSITS, lnLOANS, used to quantify the financial accessibility in the banking system through the traditional components,
  • Z = the control variables, which can be lnTRADE.
  • αj, βj, γj = the associated coefficients of the variables,
  • i = the country,
  • t = the period,
  • δt = the time dummy variable,
  • εit = the standard error of the regression.
The mathematical form of the panel model equation is the following:
lnGDPit = α1lnATMS_ADit + α2lnATMS_KMit + α3lnCREDCARDit + α4lnDEBCARDit + α5lnEBANKINGit + β1lnBANKBR_ADit + β2lnBANKBR_KMit + β3lnDEPOSITSit + β4lnLOANSit + γlnTRADEit + δt + εit

4. Results

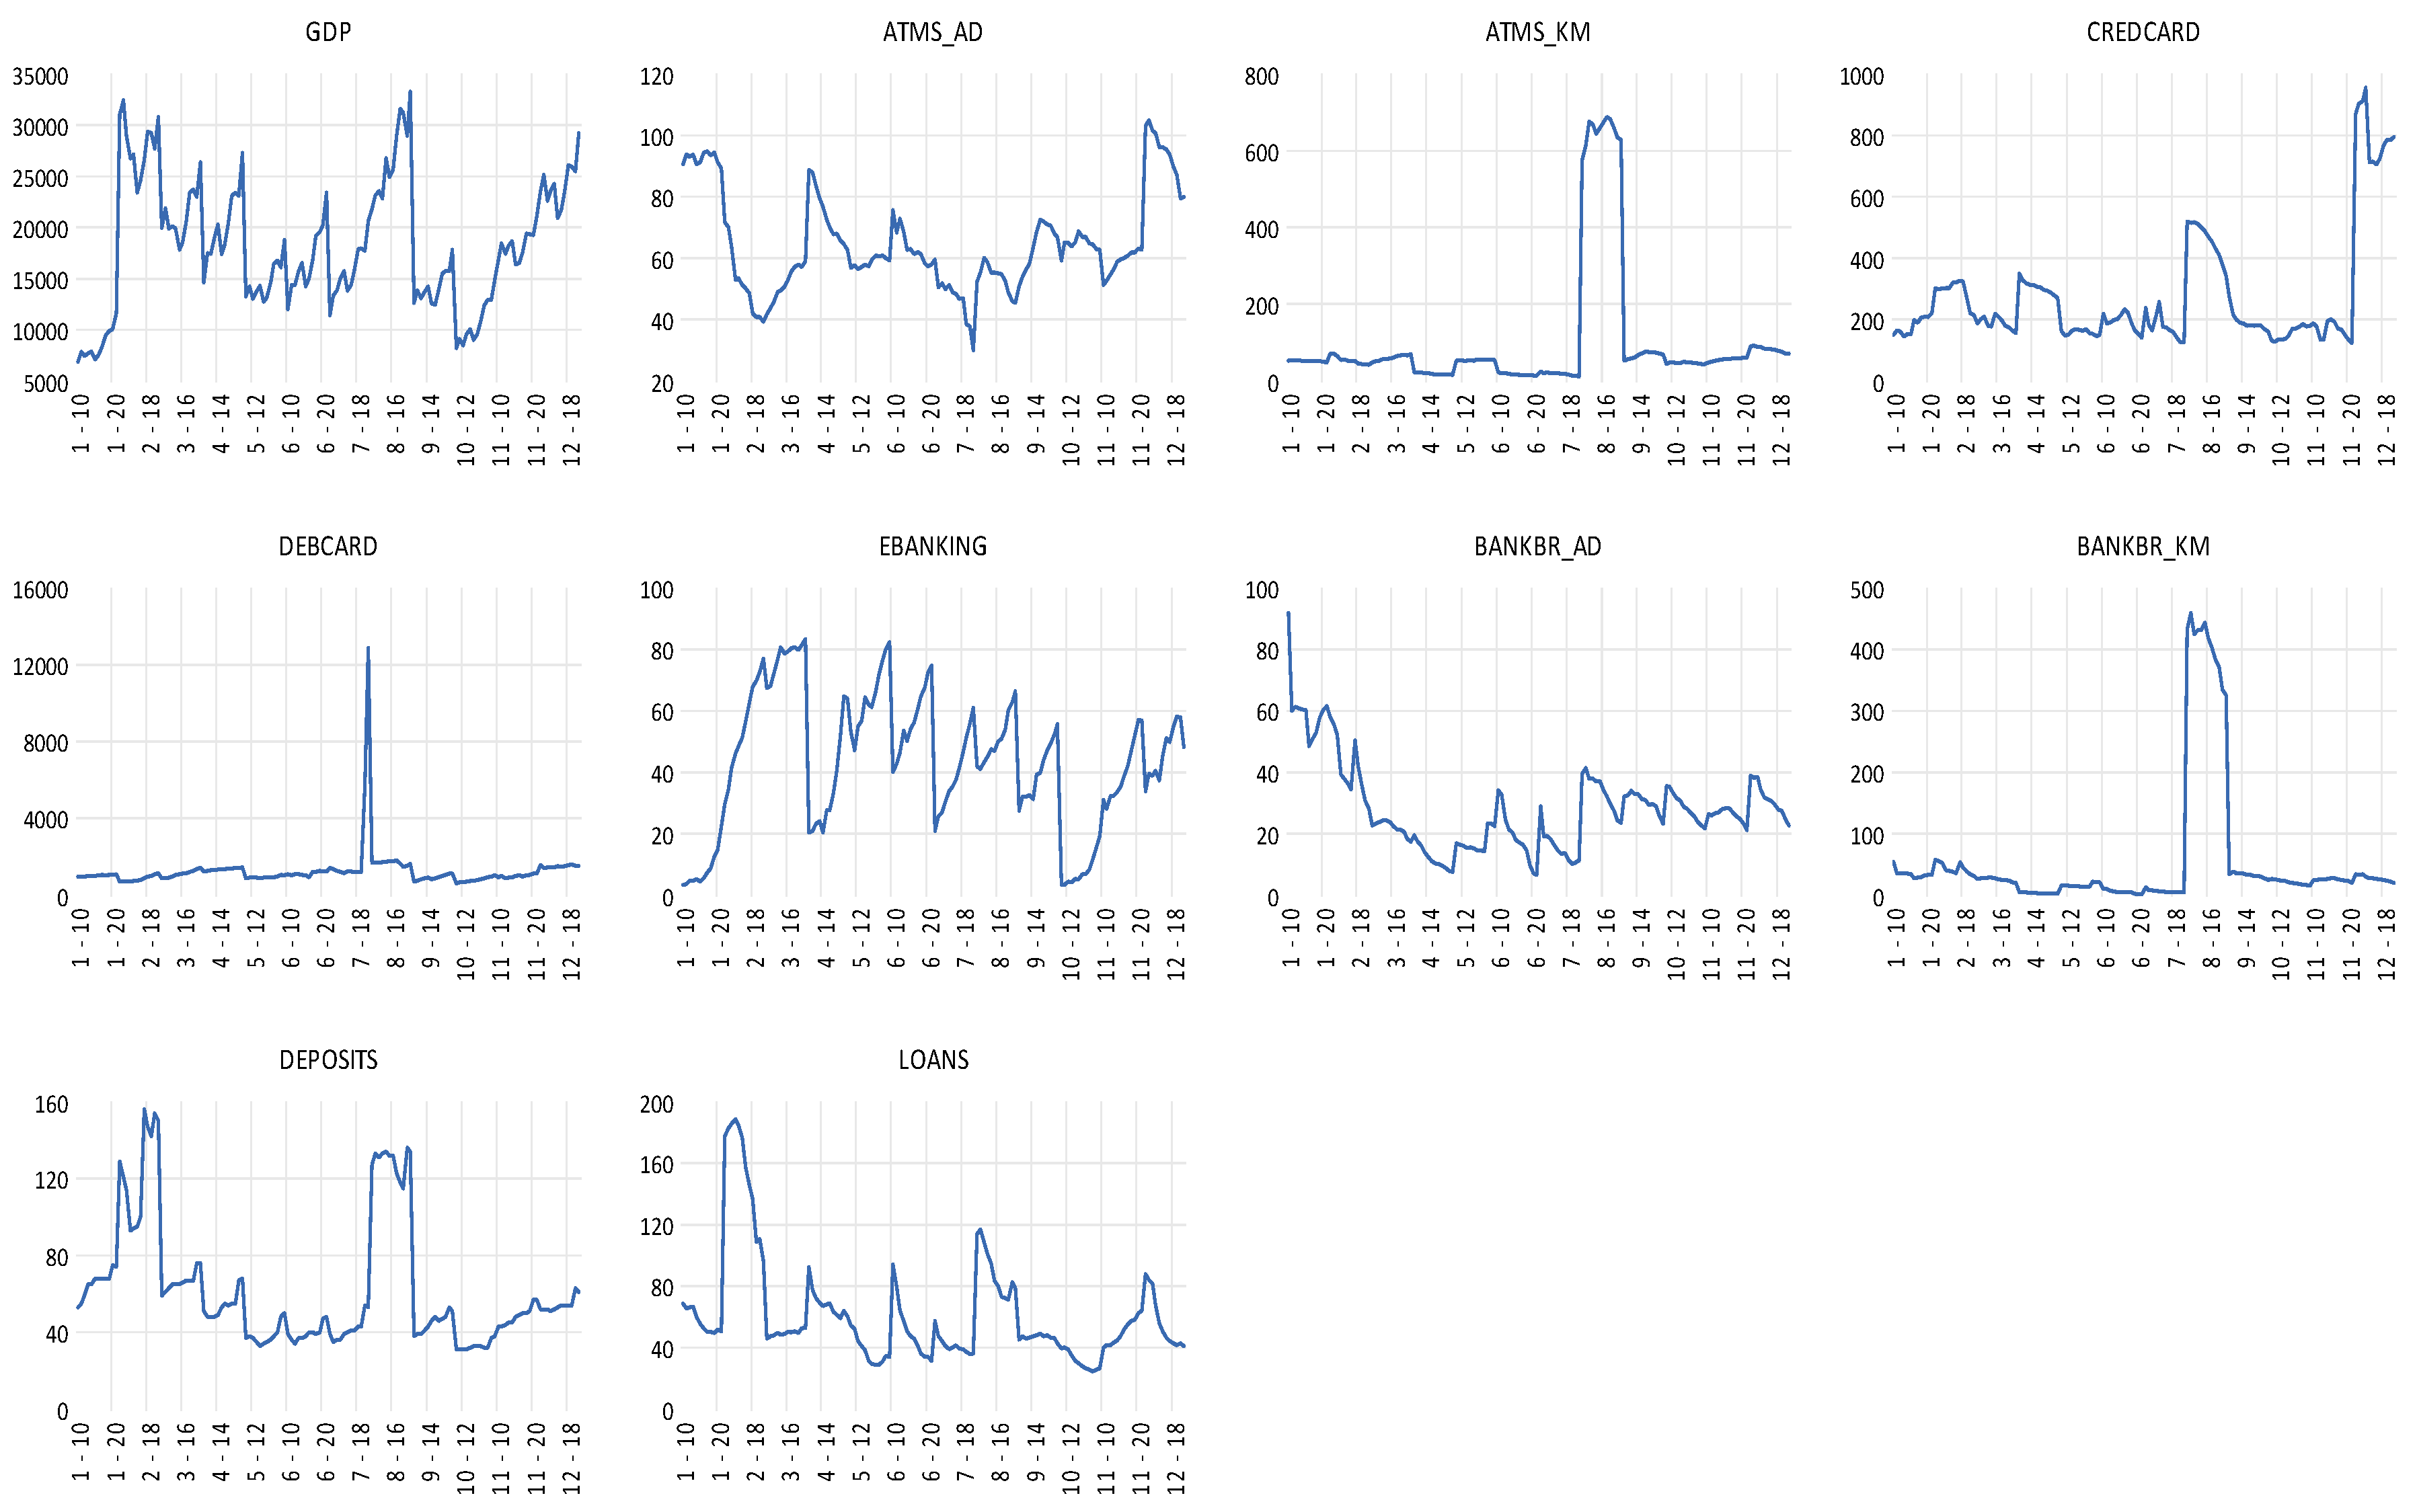
4.1. Evolution of Selected Indicators in CEECs

To capture an overview of the financial performance of the economic sector and of the level of financial accessibility in the 12 CEECs, we used the dependent variable—GDP—as a reference indicator. The evolution of the indicators in the period 2010–2021 is presented in Figure 1 (See Figure 1).
In the case of the dependent variable, namely the GDP per capita [22], until 2014, the highest GDP was registered in Cyprus. From 2015 Malta became the leader of the ranking and the lowest GDP was obtained in Bulgaria, followed by Romania.
According to the data available on the IMF, from the Financial Access Survey section [41], the number of cards per 1000 adults in the analyzed period shows an oscillating trend, but with a slight downward trend in 2021 compared to 2010. The countries that stood out, registering values above the sample average, were Malta, followed by Slovenia.
In the case of debit cards, the trend is slightly increasing over the analyzed interval. In 2021, the number of debit cards increased by nine times [41] compared to 2010. This increase might have been caused by the pandemic conditions, where the preference for online payments using a debit card increased, this being the main reason for the increase in the number of debit cards in the other analyzed countries as well.
Another analyzed indicator refers to the number of ATMs per 100,000 adults, as well as per 1000 km2. In Bulgaria, Cyprus, Estonia, Latvia, Lithuania, Malta and Slovenia, there was a decrease in 2021 compared to 2010 [41]. The other analyzed countries registered an increase in this indicator in 2021 compared to 2010. The evolution of this indicator was influenced both by the introduction of mobile banking applications and other facilities in the online environment, as well as by the evolution of the population. According to the World Bank [22], at the level of the European Union, the average of this indicator in 2010 was 78.61 ATMs per 100,000 adults in 2010, falling in 2020 to 63.13 ATMs per 100,000 adults, Romania recording values below the European average.
As for the indicator number of ATMs per 1000 km2, Malta stands out with an impressive result compared to the other countries [41]. This enormous disparity is also influenced to a small extent by the level of tourism from Malta, where the use of contactless cards was later introduced, in 2016, compared to other countries, thus tourists being forced to withdraw money from ATMs.
In the case of “Individuals using the internet for internet banking” (EBANKING), it is to be noticed that Romania and Bulgaria registered the lowest values over time, but they tripled these values during and after the pandemic [38]. This fact acknowledges the changes in the customers’ behavior who understood the importance of the digitization process. However, according to international authorities reports [42] at least 69% of households have access to broadband in each European region, and over 90% of households are fully connected in most regions. This outlines significant progress reached lately in mitigating gaps in access to digital infrastructure. Still, convergence between regions in the use of digital services has been slow. Even today, in many parts of South-Eastern Europe, less than a third of the population uses the internet to order goods or services, unlike other Western countries, where three quarters of the population shop online [42].
According to the data from IMF [41], the trend for “Commercial bank branches per 100,000 adults” is decreasing for the entire analyzed sample, except for Hungary for the period of 2018–2021, where the trend became upward. One of the reasons that caused this sudden increase in commercial bank branches in Hungary is related to the changes in the financial supervision thus affecting the profitability of the Hungarian banking sector, changes that started in 2013. Bulgaria is the country with the most branches of commercial banks. At the level of the European Union, according to the World Bank [22], the average was 34.2, decreasing in 2020 to 20.9 branches per 100,000 adults. Romania is above this European average for the entire analyzed period.
In the case of “Commercial bank branches per 1000 km2 [41], Malta stands out, for the same reason of density. The decrease in the number of commercial bank branches, was influenced by the acceleration of digital transformations in the banking sector and the preference for the relationship with the remote bank, through mobile banking and internet banking facilities.
As for “Outstanding loans from commercial banks as a percentage of GDP per 1000 adults” [41], a decreasing trend was recorded. This fact denotes an improvement in the situation in this field. The highest values were registered by Cyprus and Malta. In 2021, both countries will halve the number of these non-performing loans. The country with the lowest values is Romania, indicating a good supervision and control of credit risk.
In addition to the volume of non-performing loans as a percentage of GDP, “Outstanding deposits” have a slightly upward trend [41]. The highest values and unusual fluctuations are registered in Cyprus and Malta. As in the case of non-performing loans, Romania registered the lowest values, this fact might be caused by the low degree of saving among the population.

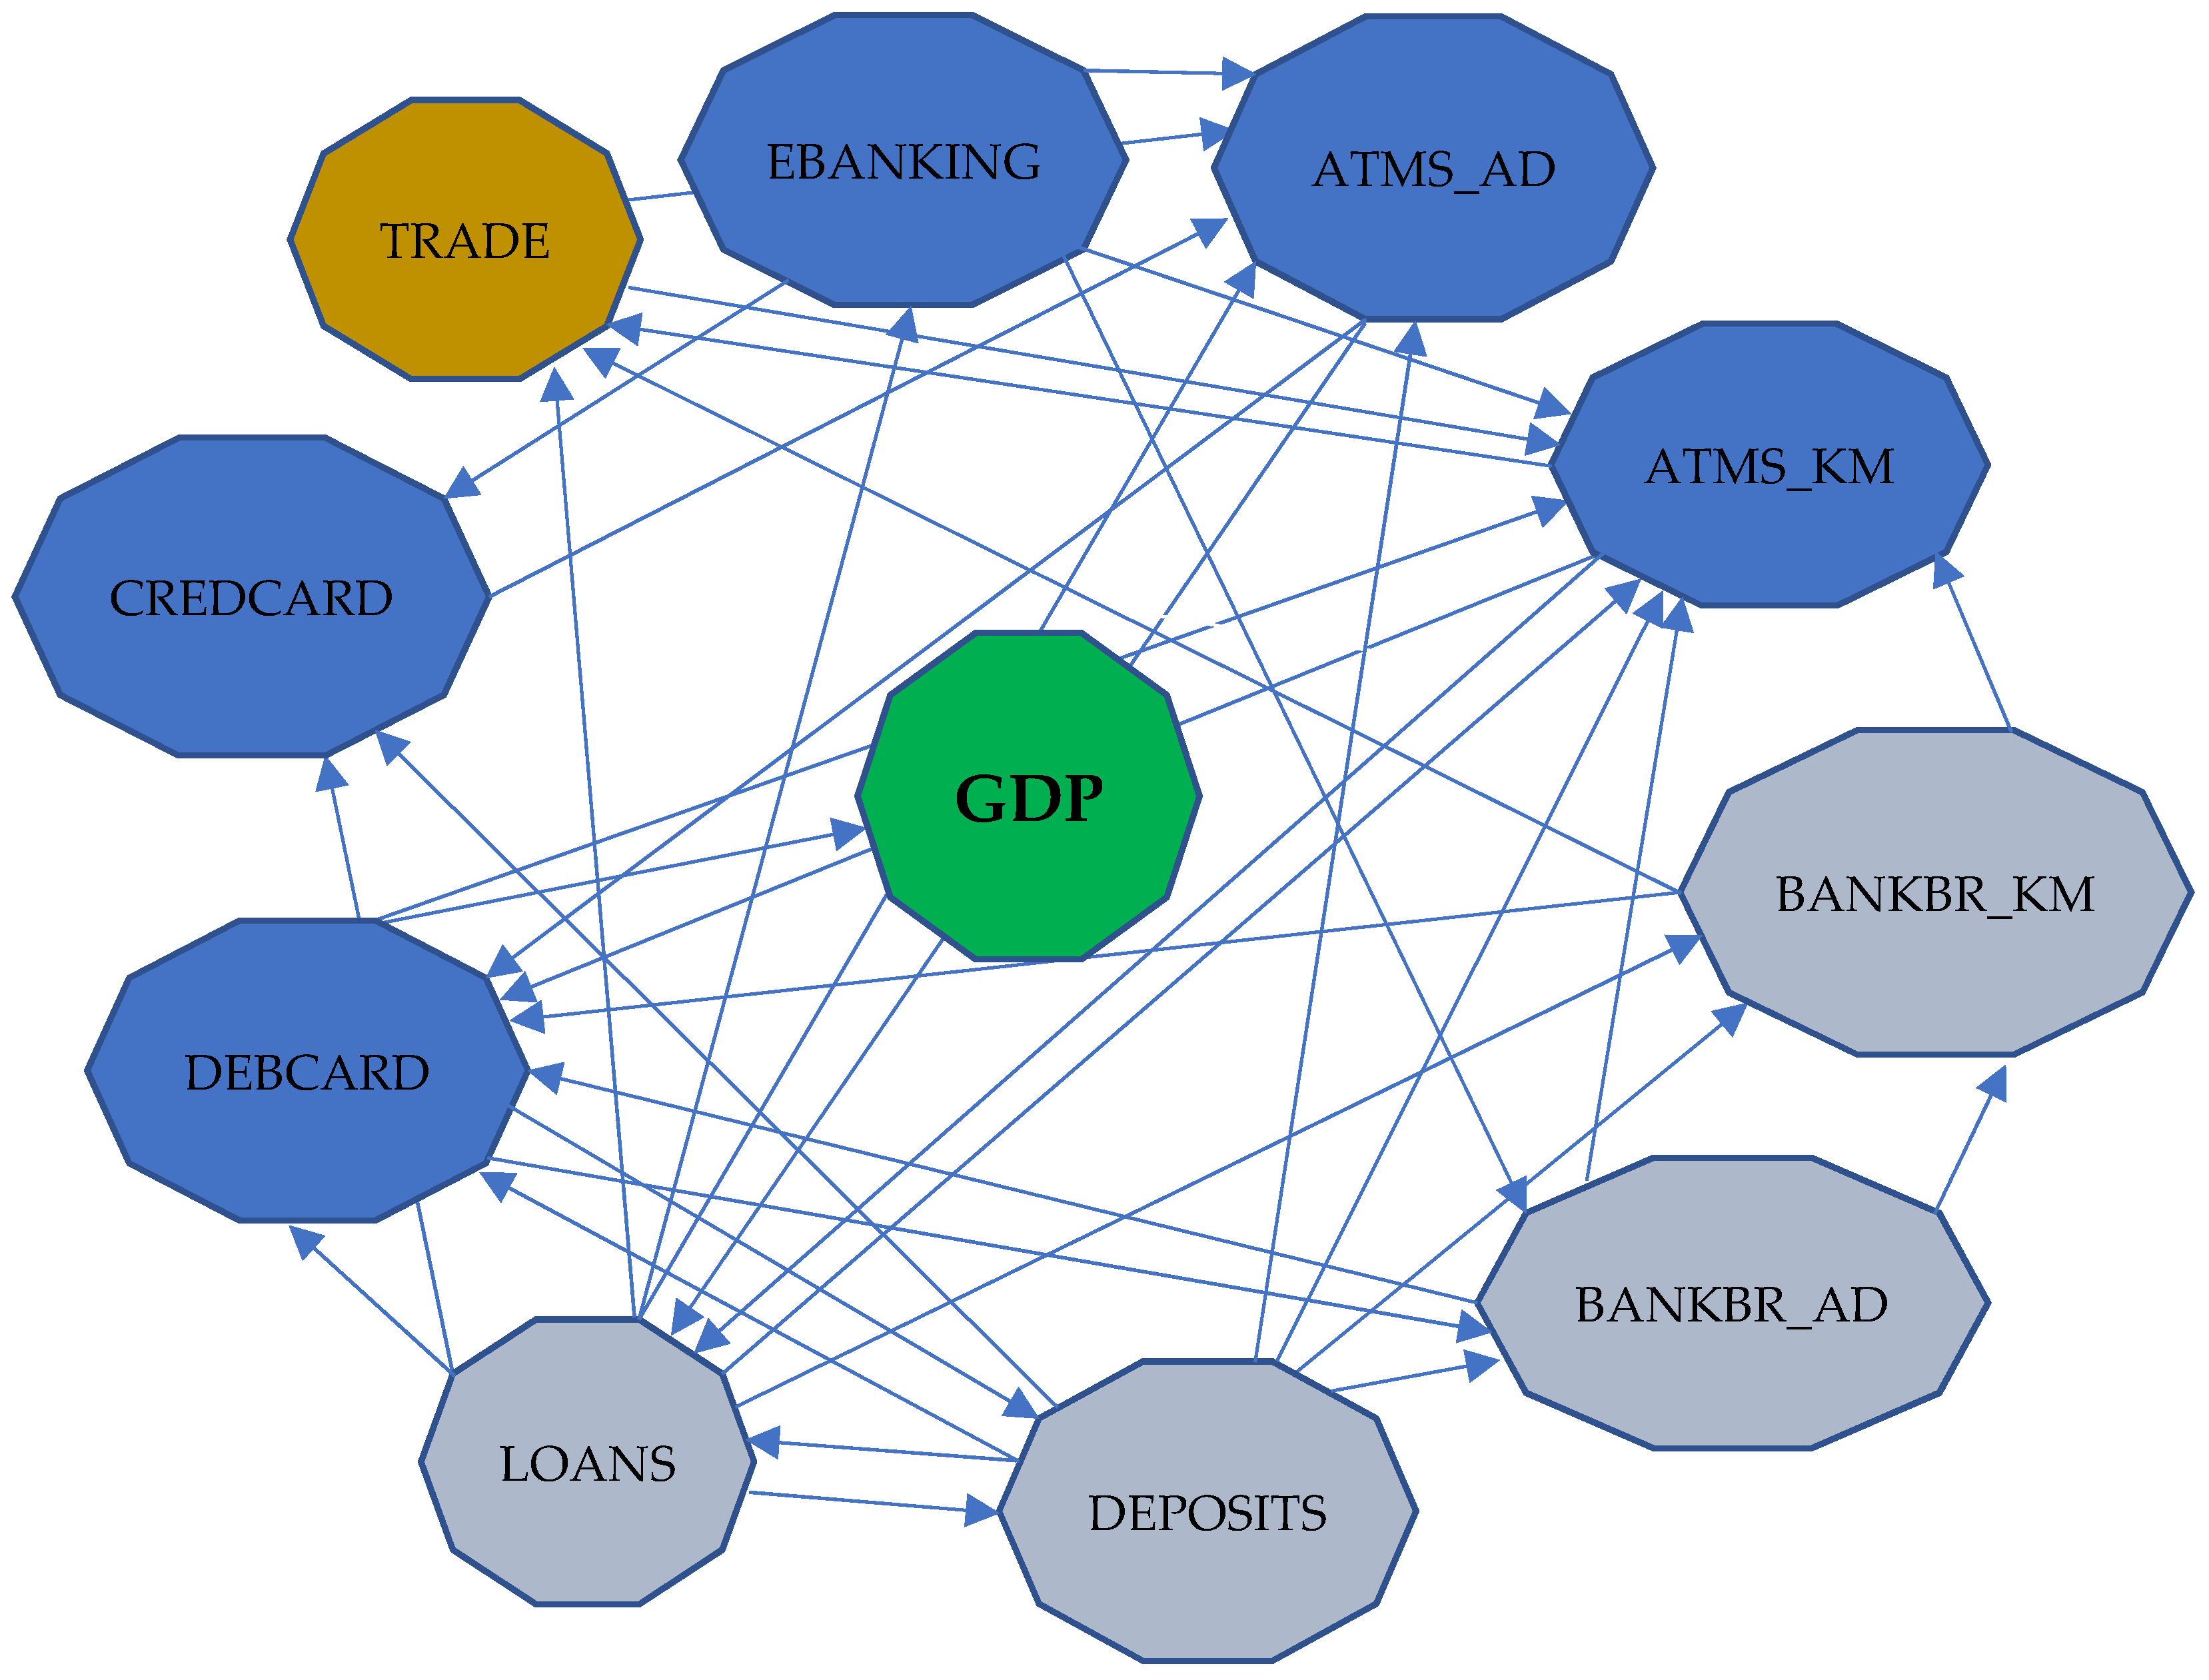
4.2. Estimation of Impact and Causality of Financial Accessibility on the Economic Growth

Before analyzing the panel regression equation, it was necessary to evaluate the autocorrelation between the variables. From Table 2, it can be observed that there was no autocorrelation within the selected model because none of the coefficients associated with the variables was equal to one. However, we noticed a strong positive correlation between LNATMS_KM and LNBANKBR_KM, as well as between LNBANKBR_AD and LNBANKBR_KM, that did not affect the analysis of the panel regression model.
Table 3 describes the summary statistics of the variables for the CEE countries. The descriptive statistics verify the normal distribution of the data series outlined by the analysis of the Skewness and Kurtosis indicators and the probability associated with the Jarque-Bera normality test. A value of the Skewness indicator equal to or close to zero indicates a symmetrical distribution of the data series, as is the case with the data series used in our analysis, excepting LNATMS_KM, LNCREDCARD, LNDEBCARD and LNEBANKING. Kurtosis also indicates a flat distribution for all data series due to the values lower than three, except for most of the variables where the distribution of the series is curved. The null hypothesis of the Jarque-Bera test is that the series is normally distributed. We can reject the null hypothesis of a normal distribution for the variables LNATMS_AD and LNBANKBR_AD in CEE countries.
As we specified in the methodology section, before applying FMOLS method, we proceeded to test the stationarity of the data series. FMOLS is, according to Hamit-Haggar [43], the most suitable technique for the panel, which includes heterogeneous cointegration. The tests performed are Levin-Lin-Chu [44] panel root tests, ADF—Fisher Chi-square and PP—Fisher Chi-square tests applicable for panel data. The results presented in Table 4, outline that data series are stationary at first difference.
As all variables are stationary at first difference, Kao [45] co-integration test is further performed with the results in Table 5 to acknowledge that there is a long-term relationship between the variables.
Therefore, at least one cointegration nexus is found between the variables of the model.
A second co-integration test, Johansen Fisher Panel Cointegration Test, is further used to test the existence of a long-term co-integration relationship between the variables of the model. The result of the test from Table 6 indicates 1 co-integrating equation at the 0.05 level and another co-integrating equation at 0.10 level.
Once the stability of the model was tested, we present the results obtained by applying the FMOLS [46,47] estimation for the proposed model to identify the long-term cointegration coefficients. According to the results presented in Table 7, we noticed that all variables in the model are statistically significant as p-value is 0.0000 in all cases. Therefore, the variables lnATMS_KM, lnBANKBR_AD, lnCREDCARD, lnDEPOSITS and lnTRADE have a negative impact on the economic growth, as an increase in their levels will reduce the economic growth of the countries. On the other hand, the use of the other selected variables highlighted a positive impact through increases in economic growth.
Thus, the negative influence of number of ATMs per 1000 km2 (lnATMS_KM) on GDP (lnGDP) could be interpreted as in making more ATMs more available does not contribute to the increase in the financial services for the population. Moreover, most commonly, the population is unequally distributed on different regions even if geographically speaking, the ATMs are properly assigned. For some vulnerable people, cash is all they know and perhaps all they have access to. Therefore, people on lower incomes and the elderly are more likely to be negatively affected by a change to a cashless society.
Furthermore, number of bank branches per 100,000 adults (lnBANKBR_AD) has also a negative influence on economic growth (lnGDP) revealing the fact that traditional banking channels are not stimulating economic growth as people from the urban areas might prefer to use more the digital banking channels and the bank branches are meaningful only for people from rural or less developed areas. However, with bank branch and ATM numbers falling, access to cash is reducing. Furthermore, despite increasingly accessible online payment platforms, restricted access to cash still penalizes some of the most vulnerable in our society.
Moreover, the variable lnLOANS has a positive influence on economic growth because, in general, also in the CEEC, loans are used for investments and thus the economic growth is enhanced in these countries by increases in the volume of loans. Similarly, the lnTRADE variable is not positively influencing the level of economic growth due to the specifics of this region that is less developed than the Western region.
However, savings cannot be promoted through increases in activity as the lnDEPOSITS variable outlines a negative influence on economic growth. This fact might suggest that economic policies in CEEC have worked in the direction of sending inappropriate signals regarding the need to save. Furthermore, a chain of dependence is created between inappropriate economic policies, because in an environment with low savings, economic policies will have to face external imbalances, generated by the need to replace domestic saving with the saving of other countries. Nevertheless, at the households’ level, there is an inertia in the perception of the notion of “economic cycle”, so that an increase in income is perceived as permanent. That is why economic growth in CEEC is associated with a negative impact on saving. The destination of the saved resources depends on the degree of confidence in the national economy and in the saving instruments, as well as on the purpose pursued when placing the savings. Consequently, the banking system is the first to transmit signals that influence the saving behavior of households.
Regardless, the digital financial accessibility indicators, lnATMS_AD, lnEBANKING and lnDEBCARD confirm that the electronic financial instruments can further contribute to the expansion of financial activity and thus to the macroeconomic performance of the analyzed countries. Therefore, the increasing availability of digital payment systems provides a better solution for businesses and customers, promising transparency, and efficiency. Furthermore, cashless payment systems can enhance economic growth by making payments easier and convenient and, thus, facilitate consumption.
Additionally, to establish the direction of causality between the variables included in the model, we used the causality test proposed by Dumitrescu and Hurlin [40], allowing all coefficients to be different across cross-sections, as presented in Figure 2. The arrows show the multiple interconnections between the selected variables, revealing the predominance of influences on the digital financial accessibility indicators as DEBCARD, CREDITCARD, ATMS_AD and ATMS_KM (See Figure 2).

5. Discussions

The obtained results showed that higher financial accessibility leads to higher income in general, which is in line with the results obtained by Boldbaatar and Lee [25], Nguyen et al. [26] who showed that financial development had a positive effect on economic growth and their relationship is linear, and Bist [16] who indicated that there was a positive long-term relationship between financial development and economic growth. Regarding the impact of the use of banking services in the context of digitization on macroeconomic performance, we emphasized that an increase in the use of ATMs and debit cards generated positive effects on the macroeconomic performance of countries, as was also confirmed in the papers of Myovella et al. [31], Owusu-Agyei et al. [32], Stiglitz [33] and Feyen [35].
However, contradictory results were generated by the variables related to ATMs_KM, BANKBR_AD, CREDCARD and TRADE. Thus, we underlined that an increase in credit cards negatively influenced the macroeconomic performance of countries, which contradicts other studies, while the increase in debit cards led to an increase in macroeconomic performance, but still, this result being in line with the studies of Arcand, Berkes and Panizza [19] who stated that there is a threshold above which financial development no longer has a positive effect on economic growth. Additionally, Beck et al. [20] argued that high levels of private credit as a share of GDP do not necessarily mean high levels of financial development.
Moreover, according to other studies [48], the responsiveness of GDP to increases in card penetration for developed countries is higher than for emerging countries. This is since the card penetration rate is more than two times the size for developed countries, where it averages almost 49%, as it is for emerging economies, where the average penetration rate is 20%. This reality is not astonishing because developed countries have more accredited payment networks, consumers are more confident using cards and cards are accepted by most merchants.

6. Conclusions

As the recent pandemic had deeply stroked not only human wealth but also the economic performance of all countries as well as the digitization field, in this paper, we aimed to analyze the nexus between banking accessibility and economic growth in the context of the digitization process in Central and Eastern European countries. To reach this goal, we formulated two hypotheses which were further validated through the obtained results. The results were provided by applying a FMOLS estimation model using as dependent variable GDP, and a series of independent variables both available for the traditional and digital approach.
The novelty of the study consists of the selection of the variables from two perspectives: traditional and digital and in evaluating the influences of these variables on the macroeconomic performances of the CEE countries. Moreover, regarding the measurement of financial development, from the perspective of the accessibility dimension, no research papers could be found for the targeted space, only studies at the global level, and its connection with digitization was little investigated, especially in emerging countries.
As a result, through this research paper, we created a detailed picture of financial accessibility in CEEC and the impact on macroeconomic performance, from the perspective of banking accessibility for the period 2010–2021 in the context of digitization.
H1: Improving financial accessibility positively influences economic growth in CEEC. The results obtained emphasized that mostly the independent variables have a positive influence on economic growth. Thus, the traditional financial accessibility indicators, as lnBANKBR_KM and lnLOANS, positively impacted lnGDP and all these influences are statistically significant. Consequently, this hypothesis is validated in the case of CEEC.
H2: Higher digital financial access to banking services stimulates economic growth in CEEC. The results showed that the digital financial accessibility indicators, lnATMS_AD, lnEBANKING and lnDEBCARD contributed to the expansion of financial activity and thus to the macroeconomic performance of the analyzed countries. Therefore, this hypothesis is also validated in the case of the CEEC.
However, lnATMS_KM, lnBANKBR_AD, lnDEPOSITS, lnCREDCARD and lnTRADE exerted a negative influence on lnGDP. Therefore, higher financial accessibility promotes economic growth in general but for those countries that already have enough both traditional and digital infrastructure such as ATMs and bank branches, improving financial access will not promote more financial activity and thus higher macroeconomic performance. Nevertheless, the preference for consumption is greater than for the investment as the lnCREDCARD variable has a negative influence on the economic growth.
Regarding the theoretical implications of the conducted study, the literature has mainly focused on other groups of countries. In fact, it turned out that also, CEEC should be further analyzed as their specifics might reveal important and contradictory findings. Thus, there are significant theoretical implications given the different development economic levels of the analyzed countries in the context of digitization.
From a practical point of view, the study highlights the importance that financial authorities or international organizations should give to improving the financial accessibility by developing the digital infrastructure as the new electronic equipment will enhance the usage of financial services. The results of the study are useful for policymakers, who should evaluate and employ more carefully different approaches depending on the development level of each country. Additionally, we consider it highly important that the digital infrastructure be fully implemented if only strengthened with a solid digital financial education for the users of financial services. Thus, CEEC has converged in digital infrastructure, but more measures need to be taken to accelerate the commercial use of digital technologies. Europe has done well in expanding access to broadband [42]. However, in our opinion, policymakers should deploy more efforts in developing the appropriate infrastructure in urban as well as in rural areas and perhaps a more concrete policy in digital education should be further implemented. Moreover, to level the playing field and attract unbanked people, digital payment platforms need to establish trust with customers, including addressing data privacy concerns. In this view, policymakers should take into consideration the fact that countries have different legislation and banking structures which involve serious obstacles for some cashless payment types. Thus, they must address both digital trust and the country-specific issue. Nevertheless, we believe that policymakers should reconsider the role of banks in society and how they can influence the structure of the financial sector and the business model in such a way as to achieve good risk management. Furthermore, good administration of risks leads to higher economic growth by increasing the volume of investments, the development of trade and the creation of new jobs.
However, this study has some limitations as the used financial access indicators only address the banking sector. Therefore, future developments of the study could also include indicators related to the stock and bond markets. Moreover, other digital financial accessibility indicators such as mobile money, might also be included, if the data set is growing and if all the countries make more data available to the public. Nevertheless, the influences of the selected variables on economic growth should also be analyzed for the Western countries as well to explore if the negative influences are still available.

Author Contributions

Conceptualization, A.G.M. and R.M.B.; methodology A.G.M.; software, A.G.M.; validation, G.B. and R.M.B.; formal analysis, N.M.D. and A.G.M.; investigation, R.M.B. and G.B.; resources, G.B.; data curation, N.M.D. and R.M.B.; writing—original draft preparation, A.G.M. and R.M.B.; writing—review and editing, A.G.M.; visualization, G.B.; supervision, N.M.D. and R.M.B.; project administration, R.M.B. and A.G.M. All authors have read and agreed to the published version of the manuscript.

Funding

This research received no external funding.

Data Availability Statement

Publicly available datasets were analyzed in this study. This data can be found here: World Bank. Data Bank. 2022. Available online: https://databank.worldbank.org/source/world-development-indicators (accessed on 2 October 2022). Eurostat. Data Browser. 2022. Available online: https://ec.europa.eu/eurostat/databrowser/view/tin00099/default/table?lang=en (accessed on 20 December 2022). International Monetary Fund. Financial Access Survey (FAS). Available online: https://data.imf.org/?sk=E5DCAB7E-A5CA-4892-A6EA-598B5463A34C&sId=1390030341854 (accessed on 7 September 2022).

Conflicts of Interest

The authors declare no conflict of interest. The funders had no role in the design of the study; in the collection, analyses, or interpretation of data; in the writing of the manuscript; or in the decision to publish the results.

References

  1. Mowes, T.; Puschmann, T.; Alt, R. Service-Based Integration of IT Innovations in Customer-Bank-Interaction; Wirtschaftsinformatik: Zurich, Switzerland, 2011. [Google Scholar]
  2. Schumpeter, J.A. The Theory of Economic Development; Harvard University Press: Cambridge, MA, USA, 1911. [Google Scholar]
  3. Stiglitz, J.E.; Weiss, A. Incentive effects of terminations: Applications to the credit and labor markets. Am. Econ. Rev. 1983, 73, 912–927. [Google Scholar]
  4. Greenwood, J.; Jovanovic, B. Financial development, growth, and the distribution of income. J. Political Econ. 1990, 98, 1076–1107. [Google Scholar] [CrossRef] [Green Version]
  5. Levine, R. Financial development, and economic growth: Views and agenda. J. Econ. Lit. 1997, 35, 688–726. [Google Scholar]
  6. Beck, T. Financial development, and international trade: Is there a link? J. Int. Econ. 2002, 57, 107–131. [Google Scholar] [CrossRef]
  7. Robinson, J. The generalization of the general theory. In The Rate of Interest and Other Essays; Macmillan: London, UK, 1952. [Google Scholar]
  8. Lucas, R.E. On the mechanics of economic development. J. Monet. Econ. 1988, 22, 3–42. [Google Scholar] [CrossRef]
  9. Schumpeter, J.A. A Theory of Economic Development: An Inquiry into Profits, Capital, Credit, Interest, and the Business Cycle; Harvard University Press: Cambridge, MA, USA, 1934. [Google Scholar]
  10. McKinnon, R.I. Money, and Capital in Economic Development; Brookings Institution: Washington, DC, USA, 1973. [Google Scholar]
  11. Shaw, E.S. Financial Deepening in Economic Development; Oxford University Press: New York, NY, USA, 1973. [Google Scholar]
  12. King, R.G.; Levine, R. Finance, and growth: Schumpeter might be right. Q. J. Econ. 1993, 108, 717–737. [Google Scholar] [CrossRef]
  13. King, R.G.; Levine, R. Finance, entrepreneurship, and growth: Theory and evidence. J. Monet. Econ. 1993, 32, 513–542. [Google Scholar] [CrossRef]
  14. Levine, R.; Loayza, N.; Beck, T. Financial intermediation, and growth: Causality and causes. J. Monet. Econ. 2000, 46, 31–77. [Google Scholar] [CrossRef] [Green Version]
  15. Guru, K.B.; Yadav, I.S. Financial Development and Economic Growth: Panel Evidence from BRICS. J. Econ. Financ. Adm. Sci. 2019, 24, 113–126. Available online: https://ssrn.com/abstract=3399728 (accessed on 2 October 2022). [CrossRef] [Green Version]
  16. Bist, J.P. Financial development, and economic growth: Evidence from a panel of 16 African and non-African low-income countries. Cogent Econ. Financ. 2018, 6, 1449780. [Google Scholar] [CrossRef] [Green Version]
  17. Cole, D.C. Financial Development in Asia. In Asian-Pacific Economic Literature; Asia Pacific School of Economics and Government, Australian National University: Canberra, Australia, 1988; Volume 2, pp. 26–47. [Google Scholar]
  18. Edwards, K.D. Prospect theory: A literature review. Int. Rev. Financ. Anal. 1996, 5, 19–38. [Google Scholar] [CrossRef]
  19. Arcand, J.L.; Berkes, E.; Panizza, U. Too much finance? J. Econ. Growth 2015, 20, 105–148. [Google Scholar] [CrossRef]
  20. Beck, T.; Degryse, H.; Kneer, C. Is more finance better? Disentangling intermediation and size effects of financial systems. J. Financ. Stab. 2014, 10, 50–64. [Google Scholar] [CrossRef] [Green Version]
  21. International Monetary Fund. Financial Sector Assessment Program. September 2022. Available online: https://www.imf.org/en/Publications/fssa/financial-sector-assessment-program-faq (accessed on 4 September 2022).
  22. World Bank. Data Bank. 2022. Available online: https://databank.worldbank.org/source/world-development-indicators (accessed on 2 October 2022).
  23. Arora, R.U. Measuring Financial Access. In Discussion Papers in Economics; Griffith University, Department of Accounting, Finance and Economics: Brisbane, Australia, 2010; Available online: https://research-repository.griffith.edu.au/handle/10072/390305 (accessed on 23 October 2022).
  24. Kendall, J.; Mylenko, N.; Ponce, A. Measuring Financial Access around the World. In World Bank Policy Research Working Paper 5253; World Bank: Washington, DC, USA, 2010; Available online: https://elibrary.worldbank.org (accessed on 10 October 2022).
  25. Boldbaatar, M.; Lee, C.L. Financial Accessibility and Economic Growth. J. East Asian Econ. Integr. 2015, 19, 143–166. [Google Scholar] [CrossRef]
  26. Nguyen, H.M.; Le, Q.T.-T.; Ho, C.M.; Nguyen, T.C.; Vo, D.H. Does financial development matter for economic growth in the emerging markets? Borsa Istanb. Rev. 2022, 22, 688–698. [Google Scholar] [CrossRef]
  27. Dudian, M.; Popa, R. Dezvoltarea financiară şi creşterea economică în Europa Centrală şi de Est. Econ. Teor. Şi Apl. 2013, 8, 55–65. [Google Scholar]
  28. Solow, R.M. A Contribution to the Theory of Economic Growth. Q. J. Econ. 1956, 70, 65–94. [Google Scholar] [CrossRef]
  29. Habibi, F.; Zabardast, M.A. Digitalization, Education, and Economic Growth: A Comparative Analysis of Middle East and OECD Countries. Technol. Soc. 2020, 63, 101370. Available online: https://www.sciencedirect.com/science/article/abs/pii/S0160791X20302244 (accessed on 6 November 2022). [CrossRef]
  30. Mago, S.; Chitokwindo, S. The Impact of Mobile Banking on Financial Inclusion in Zimbabwe: A Case for Masvingo Province. Mediterr. J. Soc. Sci. 2014, 5, 221. Available online: https://www.richtmann.org/journal/index.php/mjss/article/view/263 (accessed on 4 November 2022).
  31. Myovella, G.; Karacuka, M.; Haucap, J. Digitalization and economic growth: A comparative analysis of Sub-Saharan Africa and OECD economies. Telecommun. Policy 2020, 44, 101856. [Google Scholar] [CrossRef]
  32. Owusu-Agyei, S.; Okafor, G.; Chijoke-Mgbame, A.M.; Ohalehi, P.; Hasan, F. Internet adoption and financial development in sub-Saharan Africa. Technol. Forecast. Soc. Chang. 2020, 161, 20293. [Google Scholar] [CrossRef]
  33. Mignamissi, D.; Djijo, T.A.J. Digital divide and financial development in Africa. Telecommun. Policy 2021, 45, 102199. [Google Scholar] [CrossRef]
  34. Kumar, P.; Pillai, R.; Kumar, N.; Tabash, M.I. The Tnterplay of Skills, Digital Ffinancial Literacy, Capability, and Autonomy in Financial Decision Making and Well-Being. Borsa Istanb. Rev. 2022. in press. Available online: https://www.sciencedirect.com/science/article/pii/S2214845022000837 (accessed on 31 December 2022).
  35. Stiglitz, J.E. Information and the Change in the Paradigm in Economics, Part 1. Am. Econ. 2003, 47, 6–26. Available online: https://journals.sagepub.com/doi/10.1177/056943450304700202 (accessed on 4 November 2022). [CrossRef]
  36. Feyen, E.; Frost, J.; Gambacorta, L.; Natarajan, H.; Saal, M. Fintech and the Digital Transformation of Financial Services: Implications for Market Structure and Public Policy. In BIS Papers; Monetary and Economic Department: Basel, Switzerland, 2021. [Google Scholar]
  37. Bădîrcea, R.M.; Manta, A.G.; Florea, N.M.; Popescu, J.; Manta, F.L.; Puiu, S. E-Commerce and the Factors Affecting Its Development in the Age of Digital Technology: Empirical Evidence at EU–27 Level. Sustainability 2022, 14, 101. Available online: https://www.mdpi.com/2071-1050/14/1/101 (accessed on 2 November 2022). [CrossRef]
  38. Eurostat. Data Browser. 2022. Available online: https://ec.europa.eu/eurostat/databrowser/view/tin00099/default/table?lang=en (accessed on 20 December 2022).
  39. Beck, T.; Demirguc-Kunt, A.; Laeven, L.; Levine, R. Finance, Firm Size, and Growth. J. Money Credit. Bank. 2008, 40, 1379–1405. [Google Scholar] [CrossRef] [Green Version]
  40. Dumitrescu, E.-I.; Hurlin, C. Testing for Granger Non-causality in Heterogeneous Panels. Econ. Model. 2012, 29, 1450–1460. [Google Scholar] [CrossRef] [Green Version]
  41. International Monetary Fund. Financial Access Survey (FAS). Available online: https://data.imf.org/?sk=E5DCAB7E-A5CA-4892-A6EA-598B5463A34C&sId=1390030341854 (accessed on 7 September 2022).
  42. World Bank Group. Europe 4.0. Addressing the Digital Dilemma. 2020. Available online: https://openknowledge.worldbank.org/handle/10986/34746 (accessed on 31 December 2022).
  43. Hamit-Haggar, M. Greenhouse gas emissions, energy consumption and economic growth: A panel cointegration analysis from Canadian industrial sector perspective. Energy Econ. 2012, 34, 358. [Google Scholar] [CrossRef]
  44. Levin, A.; Lin, C.F.; Chu, C. Unit Root Tests in Panel Data: Asymptotic and Finite-Sample Properties. J. Econom. 2002, 108, 1–24. [Google Scholar] [CrossRef]
  45. Kao, C. Spurious regression and residual-based tests for cointegration in panel data. J. Econom. 1999, 90, 1–44. [Google Scholar] [CrossRef]
  46. Pedroni, P. Fully Modified OLS for Heterogeneous Cointegrated Panels; No 2000-03; Department of Economics Working Papers, Department of Economics, Williams College: Williamstown, MA, USA, 2000. [Google Scholar]
  47. Phillips, P.; Hansen, B. Statistical Inference in Instrumental Variables Regression with I (1) Processes. Rev. Econ. Stud. 1990, 57, 99–125. [Google Scholar] [CrossRef]
  48. Moody’s Analytics. The Impact of Payment Cards on Economic Growth. 2021. Available online: https://www.google.com/url?sa=t&rct=j&q=&esrc=s&source=web&cd=&ved=2ahUKEwiLitHUsqT8AhXKM-wKHTHKClMQFnoECCYQAQ&url=https%3A%2F%2Fusa.visa.com%2Fcontent%2Fdam%2FVCOM%2Fregional%2Fna%2Fus%2Fvisa-everywhere%2Fdocuments%2Fthe-impact-of-payment-cards-on-economic-growth.pdf&usg=AOvVaw0u7ZVHq9OnjwXqpLfUo8Ao (accessed on 31 December 2022).
Figure 1. Evolution of selected indicators in CEECs during 2010–2021. Sources: Author’s processed data from IMF, Financial Access Survey (FAS) database. Available at: https://data.imf.org/regular.aspx?key=61063967 (accessed on 2 October 2022).
Electronics 12 00279 g001
Figure 2. Pairwise Dumitrescu–Hurlin panel causality test.
Electronics 12 00279 g002
Table 1. Variables description and data sources.
Acronym Definition Variable TypeUnit of Measure Time
Period
Data Source
GDPGross Domestic Product per capitaDependent variableCurrent USD2010–2021World Development Indicators
ATMS_ADNumber of Automated teller machines (ATMs) per 100,000 adultsIndependent variable/Digital financial accessibilityPer 100,000 adults2010–2021World Bank, International Monetary Fund
ATMS_KMNumber of Automated teller machines (ATMs) per 1000 km2Independent variable/Digital financial accessibilityPer 1000 km22010–2021World Bank, International Monetary Fund
BANKBR_ADNumber of commercial bank branches per 100,000 adultsIndependent variable/Traditional financial accessibilityPer 100,000 adults2010–2021World Bank, International Monetary Fund
BANKBR_KMNumber of commercial bank branches per 1000 km2Independent variable/Traditional financial accessibilityPer 1000 km22010–2021World Bank, International Monetary Fund
CREDCARDNumber of credit cards per 1000 adultsIndependent variable/Digital financial accessibilityNo. of credit cards2010–2021World Bank, International Monetary Fund
DEBCARDNumber of debit cards per 1000 adultsIndependent variable/Digital financial accessibilityNo. of debit cards2010–2021World Bank, International Monetary Fund
EBANKINGIndividuals using the internet for internet bankingIndependent variable/Digital financial accessibilityPercentage of individuals2010–2021Eurostat
DEPOSITSOutstanding deposits at commercial banksIndependent variable/Traditional financial accessibility% Of GDP2010–2021World Bank, International Monetary Fund
LOANSOutstanding loans from commercial banksIndependent variable/Traditional financial accessibility% Of GDP2010–2021World Bank, International Monetary Fund
TRADESum of exports and imports of goods and services measured as a share of GDPControl variable% Of GDP2010–2021World Bank, International Monetary Fund
Source: Author’s own calculation.
Table 2. Correlation matrix.
Correlation ProbabilityLNGDPLNATMS_ADLNATMS_KMLNBANKBR_ADLNBANKBR_KMLNCREDCARDLNDEBCARDLNDEPOSITSLNEBANKINGLNLOANSLNTRADE
LNGDP 1.00
-----
LNATMS_AD−0.331.00
0.00-----
LNATMS_KM0.300.001.00
0.000.96-----
LNBANKBR_AD−0.230.360.501.00
0.000.000.00-----
LNBANKBR_KM0.19−0.040.940.701.00
0.010.600.000.00-----
LNCREDCARD0.560.330.440.190.341.00
0.000.000.000.010.00-----
LNDEBCARD0.36−0.120.09−0.30−0.030.321.00
0.000.120.280.000.700.00-----
LNDEPOSITS0.60−0.170.590.360.620.450.241.00
0.000.030.000.000.000.000.00-----
LNEBANKING0.76−0.460.08−0.45−0.030.220.300.271.00
0.000.000.330.000.670.000.000.00-----
LNLOANS0.470.000.310.410.400.460.000.750.141.00
0.000.910.000.000.000.000.910.000.07-----
LNTRADE0.56−0.170.54−0.090.400.410.430.550.500.351.00
0.000.030.000.260.000.000.000.000.000.00-----
Source: Author’s own calculation.
Table 3. Descriptive statistics of the variables in CEE countries.
LNGDPLNATMS_ADLNATMS_KMLNBANKBR_ADLNBANKBR_KMLNCREDCARDLNDEBCARDLNDEPOSITSLNLOANSLNEBANKINGLNTRADE
Mean9.744.133.973.213.055.457.024.014.003.534.95
Median9.784.103.973.263.205.266.963.933.913.824.97
Max.10.414.656.534.526.126.869.465.045.244.425.77
Min.8.833.402.421.890.514.816.433.433.201.164.26
Std. Dev.0.370.240.920.501.240.500.340.430.440.830.31
Skewness−0.460.141.25−0.280.451.213.000.900.89−1.480.48
Kurtosis2.622.945.093.033.823.6220.832.913.724.253.79
Jarque-Berra6.060.5064.181.909.1837.592126.1519.5022.1462.399.45
Prob.0.040.770.000.380.010.000.000.000.000.000.00
Sum1403.86595.87571.93463.06439.20785.271011.38578.58576.58509.38713.51
Sum Sq. Dev.20.068.30122.2936.45221.1636.6517.3626.6628.4399.5313.92
Obs.144144144144144144144144144144144
Source: Author’s own calculation.
Table 4. Results for LLC unit root test, ADF—Fisher Chi-square and PP—Fisher Chi-square test.
Methods
Level/First Difference (D)
Statistic (p) in LLCStatistic (p) in ADFStatistic (p) in PP
LNGDP0.4736 (0.6821)6.2068 (0.9999)5.3062 (1.0000)
D(LNGDP)−8.7173 (0.0000)70.2371 (0.0000)89.4848 (0.0000)
LNATMS_AD 2.6172 (0.0044)24.7868 (0.4174)45.2246 (0.0055)
D(LNATMS_AD)−7.33089 (0.0000)64.4144 (0.0000)83.6256 (0.0000)
LNATMS_KM −2.84172 (0.0022)27.4007 (0.2861)42.8472 (0.0104)
D(LNATMS_KM)−8.4312 (0.0000)69.3284 (0.0000)83.5382 (0.0000)
LNBANKBR_AD 0.4462 (0.6723)20.9181 (0.6436)20.1283 (0.6895)
D(LNBANKBR_AD)−8.3415 (0.0000)68.2054 (0.0000)75.7608 (0.0000)
LNBANKBR_KM0.1032 (0.5411)21.7503 (0.5942)21.1466 (0.6301)
D(LNBANKBR_KM)−10.0839 (0.0000)82.8735 (0.0000)81.1151 (0.0000)
LNCREDCARD 7.9084 (1.0000)29.3934 (0.2057)22.1827 (0.5684)
D(LNCREDCARD)−5.8974 (0.0000)73.5488 (0.0000)73.3097 (0.0000)
LNDEBCARD 1.4771 (0.9302)9.3178 (0.9968)9.0017 (0.9976)
D(LNDEBCARD)−7.9310 (0.0000)66.7542 (0.0000)75.4400 (0.0000)
LNEBANKING1.4046 (0.9199)10.4029 (0.9927)30.5927 (0.1659)
D(LNEBANKING)−2.1256 (0.0168)32.5087 (0.1049)124.255 (0.0000)
LNDEPOSITS 1.2943 (0.9022)7.0231 (0.9997)11.8504 (0.9815)
D(LNDEPOSITS)−9.5897 (0.0000)76.4336 (0.0000)83.6066 (0.0000)
LNLOANS −5.6422 (0.0000)43.1841 (0.0095)52.0028 (0.0008)
D(LNLOANS)−5.3438 (0.0000)43.7478 (0.0082)75.5901 (0.0000)
LNTRADE −3.1220 (0.0009)47.4148 (0.0030)67.1239 (0.0000)
D(LNTRADE) −9.7051 (0.0000)85.8288 (0.0000)86.7115 (0.0000)
Source: Author’s own calculation.
Table 5. Results for Kao co-integration test.
t-StatisticProb.
ADF−5.3020680.0010
Residual variance0.005943
HAC variance0.004391
Source: Author’s own calculation.
Table 6. Results for Johansen Fisher Panel Cointegration Test.
Unrestricted Cointegration Rank Test (Trace and Maximum Eigenvalue)
HypothesizedFisher Stat. * Fisher Stat. *
No. of CE(s)(From Trace Test)Prob.(From Max-Eigen Test)Prob.
None809.35150.0000594.86930.0000
At most 1214.48220.365361.008200.1039
At most 2153.47400.847150.844720.2292
At most 3102.62930.993243.041990.3223
At most 459.587281.000024.864840.9686
At most 534.722441.000015.187880.9995
At most 619.534551.000010.026640.9999
At most 79.5079101.00004.8448711.0000
At most 84.6630401.00003.9172680.9995
At most 90.7457721.00000.7450691.0000
At most 100.0007030.98000.0007030.9800
* Probabilities are computed using asymptotic Chi-square distribution. Source: Author’s own calculation.
Table 7. Fully Modified Ordinary Least Squares (FMOLS) estimation results.
Dependent Variable: lnGDP
VariableCoef.Std. Errorz-Stat.Prob.
lnATMS_AD1.040.118.920.00
lnATMS_KM−0.800.11−7.020.00
lnBANKBR_AD−1.000.11−9.110.00
lnBANKBR_KM0.930.118.450.00
lnCREDCARD−0.130.00−15.310.00
lnDEBCARD0.060.0015.410.00
lnEBANKING0.080.017.770.00
lnDEPOSITS−0.120.00−18.900.00
lnLOANS0.240.0058.030.00
lnTRADE−0.390.01−27.660.00
Source: Author’s own calculation.
Disclaimer/Publisher’s Note: The statements, opinions and data contained in all publications are solely those of the individual author(s) and contributor(s) and not of MDPI and/or the editor(s). MDPI and/or the editor(s) disclaim responsibility for any injury to people or property resulting from any ideas, methods, instructions or products referred to in the content.

