Article

Analysis of Image Preprocessing and Binarization Methods for OCR-Based Detection and Classification of Electronic Integrated Circuit Labeling

Department of Signal Processing and Multimedia Engineering, West Pomeranian University of Technology in Szczecin, 70-313 Szczecin, Poland
*
Author to whom correspondence should be addressed.
Electronics 2023, 12(11), 2449; https://doi.org/10.3390/electronics12112449
Submission received: 20 April 2023 / Revised: 24 May 2023 / Accepted: 28 May 2023 / Published: 29 May 2023

Abstract

:
Automatic recognition and classification of electronic integrated circuits based on optical character recognition combined with the analysis of the shape of their housings are essential to machine vision methods supporting the production of electronic parts, especially small-volume ones in the through-hole technology, characteristic of printed circuit boards. Since such methods utilize binary images, applying appropriate image preprocessing and thresholding methods significantly influences the obtained results, particularly in uncontrolled illumination conditions. Therefore, the examination of various adaptive image binarization algorithms for this purpose is conducted in this paper, together with the experimental verification of the proposed method based on the pixel voting approach.

1. Introduction

In recent years, the landscape of computer vision has undergone a tremendous transformation, enabling machines to decode and analyze visual data with unprecedented accuracy and efficiency. This technological leap has broad implications across various sectors, including industrial automation, surveillance, and medical imaging, where effective image preprocessing methods play a critical role in multiple areas such as face recognition [1] or object classification. Yet, there are some applications where reliance on AI-powered tools may not be the most suitable approach.
Considering the continuous development of new electronic elements and integrated circuits, e.g., memory units [2], one of these challenges is the automatic recognition of integrated circuit (IC) decals. Contemporary AI models for object recognition, such as the state-of-the-art optical character recognition (OCR) methods, require substantial amounts of labeled data for training. Unfortunately, the available datasets for IC decals are relatively small, posing a significant limitation to the development of accurate AI models. Furthermore, the variation in size, shape, and color of IC decals introduces additional complexity, potentially undermining the precision of AI models. Given that the information in IC decals is crucial for the functionality of the recognition system, it must demonstrate an exceedingly high level of accuracy, posing a bar that AI models may struggle to meet consistently.
To overcome these challenges, a novel handcrafted approach is proposed in this paper that leverages image preprocessing filters to augment the contrast and clarity of images before their analysis by OCR engines, such as Tesseract or other available solutions [3]. This method eliminates the need for extensive datasets or costly AI models due to the more efficient use of a smaller, more manageable dataset to achieve reliable results. Various filters have been evaluated, and their efficacy in enhancing the accuracy and speed of OCR programs has been investigated. Additionally, the impact of the image binarization algorithm on the recognition accuracy under different illumination conditions has been investigated considering the case of a uniform illumination and the presence of shadows. The proposed approach offers a pragmatic and robust solution for reading the IC decals, demonstrating the potential of handcrafted methods for some applications in an AI-dominated field.

2. Related Work

2.1. The Overview of AI-Based Solutions

A dynamic development of artificial intelligence methods, particularly utilizing deep learning methods, may be observed in many areas of science and industry. Recently, an interesting combination of transfer learning and federated learning has been proposed [4], utilizing the voting scheme to fine-tune the global model with the help of pseudo-labeled samples, similar to a conditional weighting transfer Wasserstein auto-encoder [5] applied for fault diagnosis of machines. Some AI-based solutions are also utilized in semiconductor manufacturing, e.g., for data-driven precise positioning control of wafer stages in photolitography [6].
In this paper, we focus on the automatic optical recognition of integrated circuits (IC), which is a critical task in the electronics industry. The decals visible on the IC packages carry vital information, such as manufacturer, date of production, and part number, which are essential for inventory management and quality control [7]. However, the small size and intricate nature of these decals make it challenging for optical character recognition programs to accurately detect and interpret them. Nevertheless, state-of-the-art OCR solutions are an excellent example of solutions where the use of AI methods has led to a significant improvement in their accuracy for the most typical applications, such as document recognition systems. They may be generally divided into six major groups:
  • Convolutional Neural Networks (CNNs)—have shown excellent performance in OCR tasks, even with challenging texts, due to their ability to learn spatial hierarchies of patterns; however, they require substantial labeled data for training and may struggle with images containing noise or distortions;
  • Recurrent Neural Networks (RNNs) and their variants (e.g., LSTM, GRU)—can model the sequential nature of text data, making them suitable for OCR tasks [8]; however, they may face difficulties in learning long-term dependencies, which could be problematic for complex, hard-to-read texts;
  • Transfer Learning—fine-tuning pretrained models such as BERT [9] and GPT [10] has demonstrated promising results in OCR tasks; they leverage vast amounts of pretraining data, mitigating the need for extensive task-specific data. However, they require expertise for effective fine-tuning and might underperform on extremely noisy or low-resolution images [11];
  • Adversarial Training—can improve the model’s robustness to noise and other distortions [12]; however, this method is computationally demanding and needs careful tuning to prevent overfitting;
  • Multi-Modal Models—incorporate context or metadata demonstrating improved OCR performance [13]; however, they require additional data sources and may be complex to implement;
  • Synthetic Data Generation—GANs and other synthetic data generation techniques can augment limited training data, which is particularly useful for OCR tasks with difficult-to-read text [14]; however, ensuring the real-world applicability of synthetic data remains a challenge.
Although these state-of-the-art methods have shown promising results in many OCR tasks, they are not directly applicable to our task due to a crucial limitation—the unavailability of large, labeled datasets. Convolutional neural networks (CNNs) and recurrent neural networks (RNNs), despite their effectiveness, require large amounts of labeled data for training, that are unavailable for our specific task of reading integrated circuit decals [15,16]. The same limitation applies to transfer learning methods [9,10], as fine-tuning these models effectively still requires a considerable amount of task-specific data. Adversarial training and multi-modal models, though they can enhance model robustness and leverage additional context, respectively, also require substantial data and can be computationally expensive [12,13]. Lastly, while synthetic data generation methods such as GANs provide a way to augment limited data, ensuring the real-world applicability of synthetic data and their diversity is a non-trivial challenge [14]. Therefore, our task requires a different approach that can work effectively with smaller datasets.

2.2. Performance Evaluation of Current Industry Standard OCR Engines

To determine the effectiveness of various OCR engines in recognizing characters on IC packages, a series of tests were conducted using open-source OCR engines, namely Tesseract, GOCR, CuneiForm, Kraken, and A9T9. The performance of these engines was assessed using the Levenshtein distance, a string metric that quantifies the difference between two sequences [17]. Specifically, in the context of OCR, it measures the minimum number of single-character edits (insertions, deletions, or substitutions) required to transform the OCR output into the correct string.
The results of these tests conducted for images used in further experiments revealed that the Tesseract OCR engine outperformed the other engines with the average Levenshtein distance equal to 27.63, assuming no image preprocessing. Tesseract’s superior performance can be attributed to its robust design and comprehensive language support, making it a versatile OCR tool suitable for various tasks. As shown in the paper [18], some of its minor issues related to the segmentation procedure of some types of images may be successfully solved using an appropriate image preprocessing.
On the other hand, GOCR and Kraken led to slightly higher average Levenshtein distances. The GOCR’s performance was likely hampered by its simplicity as it was not designed to handle complex layouts or intricate designs. Similarly, the Kraken package, although powerful, was primarily tailored for processing high-quality scans of printed text, making it less suitable for recognizing small, complicated decals on IC packages.
CuneiForm and A9T9 engines provided the highest average Levenshtein distances. CuneiForm was designed for high-quality book scanning and therefore struggled with the unique challenges posed by IC package images. A9T9, while known for its user-friendly interface and customizability, was not optimized for complex recognition tasks such as ours.
Overall, it was observed that all the OCR engines faced difficulties in accurately recognizing characters on IC packages. The complex designs and small decals on these packages pose unique challenges that these engines struggle to overcome in their current state of development. This highlights the importance of preprocessing steps in enhancing image quality and improving OCR performance. Considering the highest performance of the Tesseract OCR, it was selected as the OCR engine used in further testing. The comparison of the obtained results is presented in Table 1.

3. Image Preprocessing and Binarization Methods

3.1. Basic Image Filtering

Image filtering is essential to enable optical character recognition software to work reliably for decals on integrated circuit (IC) packages. The decals on IC packages are often small, intricate, and vary in color and contrast, making them challenging for OCR software to accurately detect and interpret [18]. Image filtering techniques can enhance the contrast and clarity of the images by removing noise, sharpening edges, and adjusting brightness and contrast. They involve various techniques, including image scaling, straightening, histogram equalization, binarization, and morphological operations, which enhance the readability of these decals [19].
One of the most relevant operations for OCR is image scaling, either upscaling or downscaling. The upscaling usually utilizes bicubic interpolation to improve the clarity of low-resolution images. Downscaling, on the other hand, reduces the computational cost while preserving the most essential details [20,21].
Since the best results of the OCR algorithms are typically achieved for straightened images, the straightening operation based on aligning the image along the horizontal axis improves the OCR accuracy by preventing character skewing or distortion. Typical techniques employed in this preprocessing step include edge detection and Hough transform [22].
Another preprocessing operation that may influence the OCR results is histogram equalization which redistributes pixel intensity levels, enhancing contrast and visibility. The most common approaches are the applications of cumulative distribution function (CDF) and adaptive histogram equalization (AHE). Instead of the basic AHE, its modification, known as contrast-limited adaptive histogram equalization (CLAHE) [23], is often used to prevent noise amplification.
These preprocessing steps can improve the accuracy of OCR software by providing clearer and more easily identifiable character shapes for recognition. Without image filtering, OCR software may struggle to accurately recognize characters from the images, leading to errors in interpreting critical information such as manufacturer, part number, and date of production. Therefore, image filtering is an essential step in the automatic optical recognition of integrated circuits, ensuring the reliability and accuracy of OCR software.

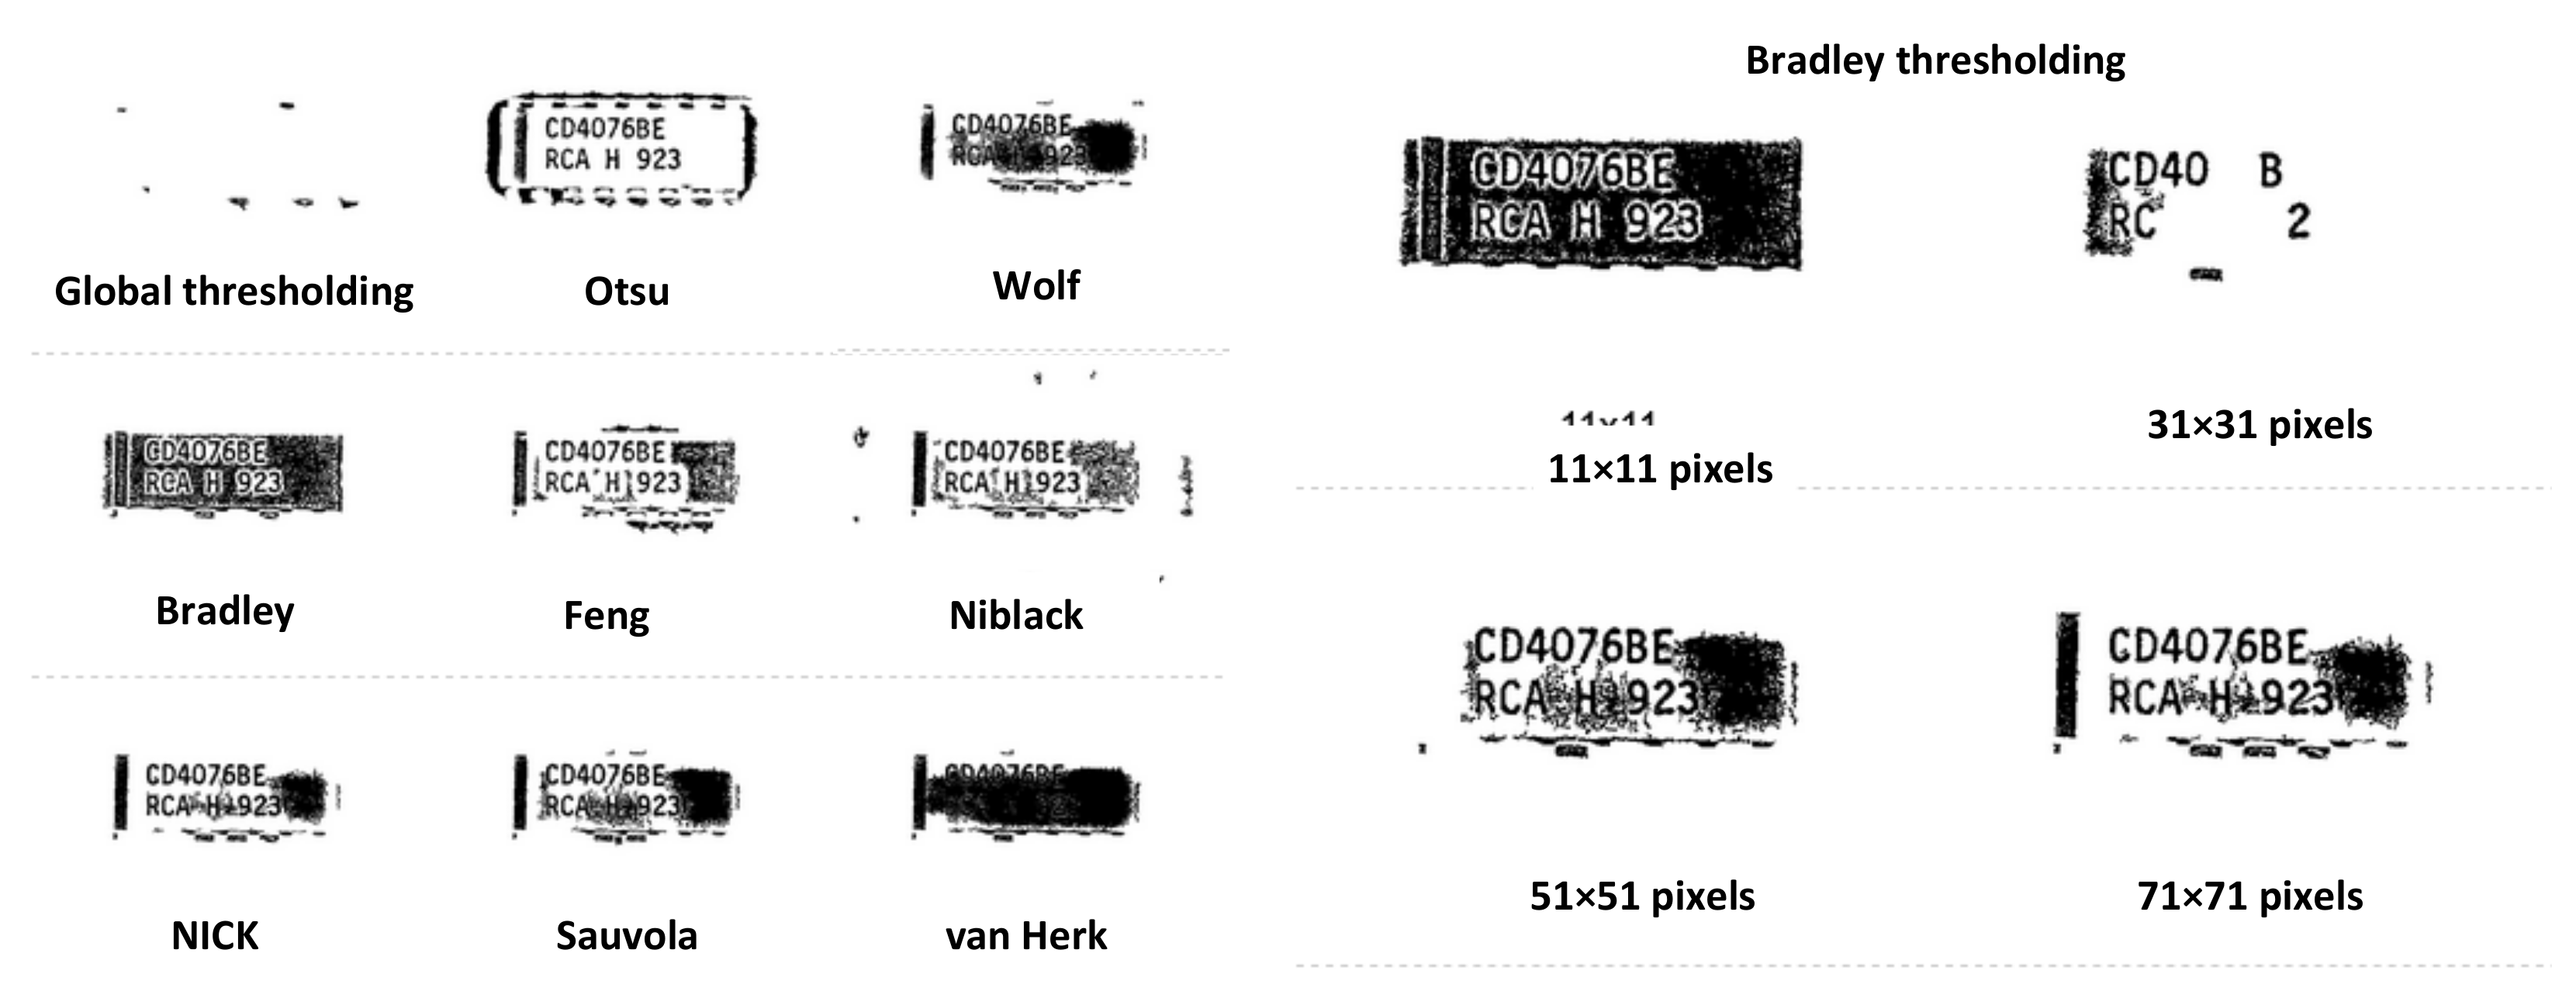
3.2. Image Binarization Methods

Image thresholding, or binarization, is a critical step in many computer vision and machine vision applications, including optical character recognition. The goal of binarization is to separate the foreground (decals on integrated circuits, in our case) from the background by converting grayscale images into binary images with only two color values: black and white [24]. The most popular methods include:
  • Otsu binarization—determines the threshold value by maximizing the between-class variance of the foreground and background pixels [25] as
    T O t s u = arg max t ω 0 ( t ) · ω 1 ( t ) · μ 0 ( t ) μ 1 ( t ) 2 ,
    where ω 0 ( t ) and ω 1 ( t ) are the probability functions for two clusters representing the background and foreground pixels, whereas μ 0 ( t ) and μ 1 ( t ) denote the mean intensities in these both classes;
  • Bernsen thresholding—calculates the threshold value for each pixel based on the local contrast of the neighborhood as the midgrey value [26]:
    T B e r n s e n = I m a x + I m i n / 2
    for pixels where the contrast of their neighborhood is above 15 (default value), where I m a x and I m i n values are determined in the local window; for low-contrast regions, the value is set to 0 or 1 depending on the midgrey value;
  • Van Herk method—utilizes morphological dilation and erosion operations for an adaptive calculation of the threshold value for each pixel:
    T v H = max { min ( I ( x 1 , y ) , I ( x , y ) , I ( x + 1 , y ) ) , min ( I ( x , y 1 ) , I ( x , y ) , I ( x , y + 1 ) ) } ;
  • Bradley thresholding—sets each pixel with brightness T percent lower than the average brightness of the surrounding pixels in the window to 0, and calculates the threshold value for the others as the mean of the neighborhood, weighted by a constant factor [27]:
    T B r a d l e y = m ( x , y ) · ( 1 k ) ,
    where m is the local average calculated in constant time regardless of the neighborhood size using the predetermined integral image;
  • Niblack thresholding—calculates the local threshold value for each pixel based on the mean and standard deviation of the local neighborhood [28]
    T N i b l a c k = m ( x , y ) + k · s ( x , y ) ,
    where m is the local average, s denotes the local standard deviation, and the constant parameter k = 0.2 ;
  • Sauvola method—incorporates both the mean and standard deviation of the local neighborhood to calculate the threshold value with additional use of the dynamic range of the standard deviation:
    T S a u v o l a = m · 1 k · 1 s R ,
    where m denotes the mean local intensity, s stands for the local standard deviation, its dynamic range is R = 128 , and the constant parameter k = 0.5 ;
  • Wolf method—calculates the threshold value for each pixel based on the mean and standard deviation of the local neighborhood, with an additional normalization of contrast and mean intensity:
    T W o l f = ( 1 k ) · m ( x , y ) + k · M + k · s ( x , y ) R · m ( x , y ) M ,
    where M is the minimum gray level in the local window, R = m a x ( s ( x , y ) ) , and the constant parameter k = 0.5 ;
  • Feng thresholding—a modification of Niblack’s method, incorporating a criterion of maximizing local contrast [29]:
    T F e n g = ( 1 α 1 ) · m ( x , y ) + α 2 · s ( x , y ) R s · m ( x , y ) M + α 3 · M ,
    where the dynamic range of standard deviation R s is calculated in an additional larger window, α 2 = k 1 · s ( x , y ) R s 2 , α 3 = k 2 · s ( x , y ) R s 2 , assuming the positive constants: α 1 in the range of [ 0.1 0.2 ] , k 1 in the range of [ 0.15 0.25 ] , and k 2 in the range of [ 0.01 0.05 ] [30];
  • NICK thresholding—with the acronym being the first letter of its authors’ names, determines the threshold value for each pixel using the formula:
    T N I C K = m + k · B + m 2 ,
    where the parameter k = 0.1 , and B denotes the local variance in the current window with its size proposed in the paper [31] equal to 19 × 19 pixels, although it may be changed depending on the specific images.
Some additional morphological operations such as opening, closing, and boundary cleaning modify the shapes of objects visible in the image and its structure, enhancing the image quality before the OCR procedure [32].

3.3. Review of Recent Binarization Methods

Recently, several advanced binarization techniques have been proposed to improve the quality of OCR results, including four such proposals used in experiments.
The first method aims to improve image binarization using image preprocessing with local entropy filtering [33]. Entropy filtering is a technique where the entropy, or the degree of randomness or disorder, is computed within a local neighborhood of an image. This method improves the contrast between text and background by enhancing the high-frequency components in the image. The high-frequency components are usually associated with the edges of characters, and their enhancement improves the performance of subsequent binarization.
The second method proposes an adaptive image binarization based on a multi-layered stack of regions [34]. This technique divides the image into multiple regions and applies different binarization thresholds for each region. Due to the shifts of the regions for each layer, it can adaptively handle variations in text and background characteristics across different regions of the image, resulting in improved binarization, particularly for images with uneven lighting or varying text densities.
The third method is a fast binarization technique for unevenly illuminated document images based on background estimation [35]. This technique estimates the background illumination profile of the image by downsampling it and then upsampling the image back and subtracts it from the original image. This effectively removes the effect of uneven illumination by high-pass filtering, making subsequent binarization more effective. This very fast method is particularly useful for document images where the lighting conditions are not uniform.
Lastly, a deep-learning-based method for binarization proposed by Sami Liedes has been made available on GitHub at https://github.com/sliedes/binarize (accessed on 19 April 2023). This method utilizes a convolutional neural network (CNN) to learn the mapping from the original image to the binarized image. Since the method is trained on a large number of examples, it can handle a wide range of situations and produce high-quality binarizations. However, it requires a substantial amount of computational resources and training data.
Each of these thresholding methods has its unique advantages and weaknesses, and the choice of method depends on the specific characteristics of the image being analyzed. It is essential to carefully evaluate and compare different methods to determine the most effective approach (or their combination) for automatic optical recognition of integrated circuits.

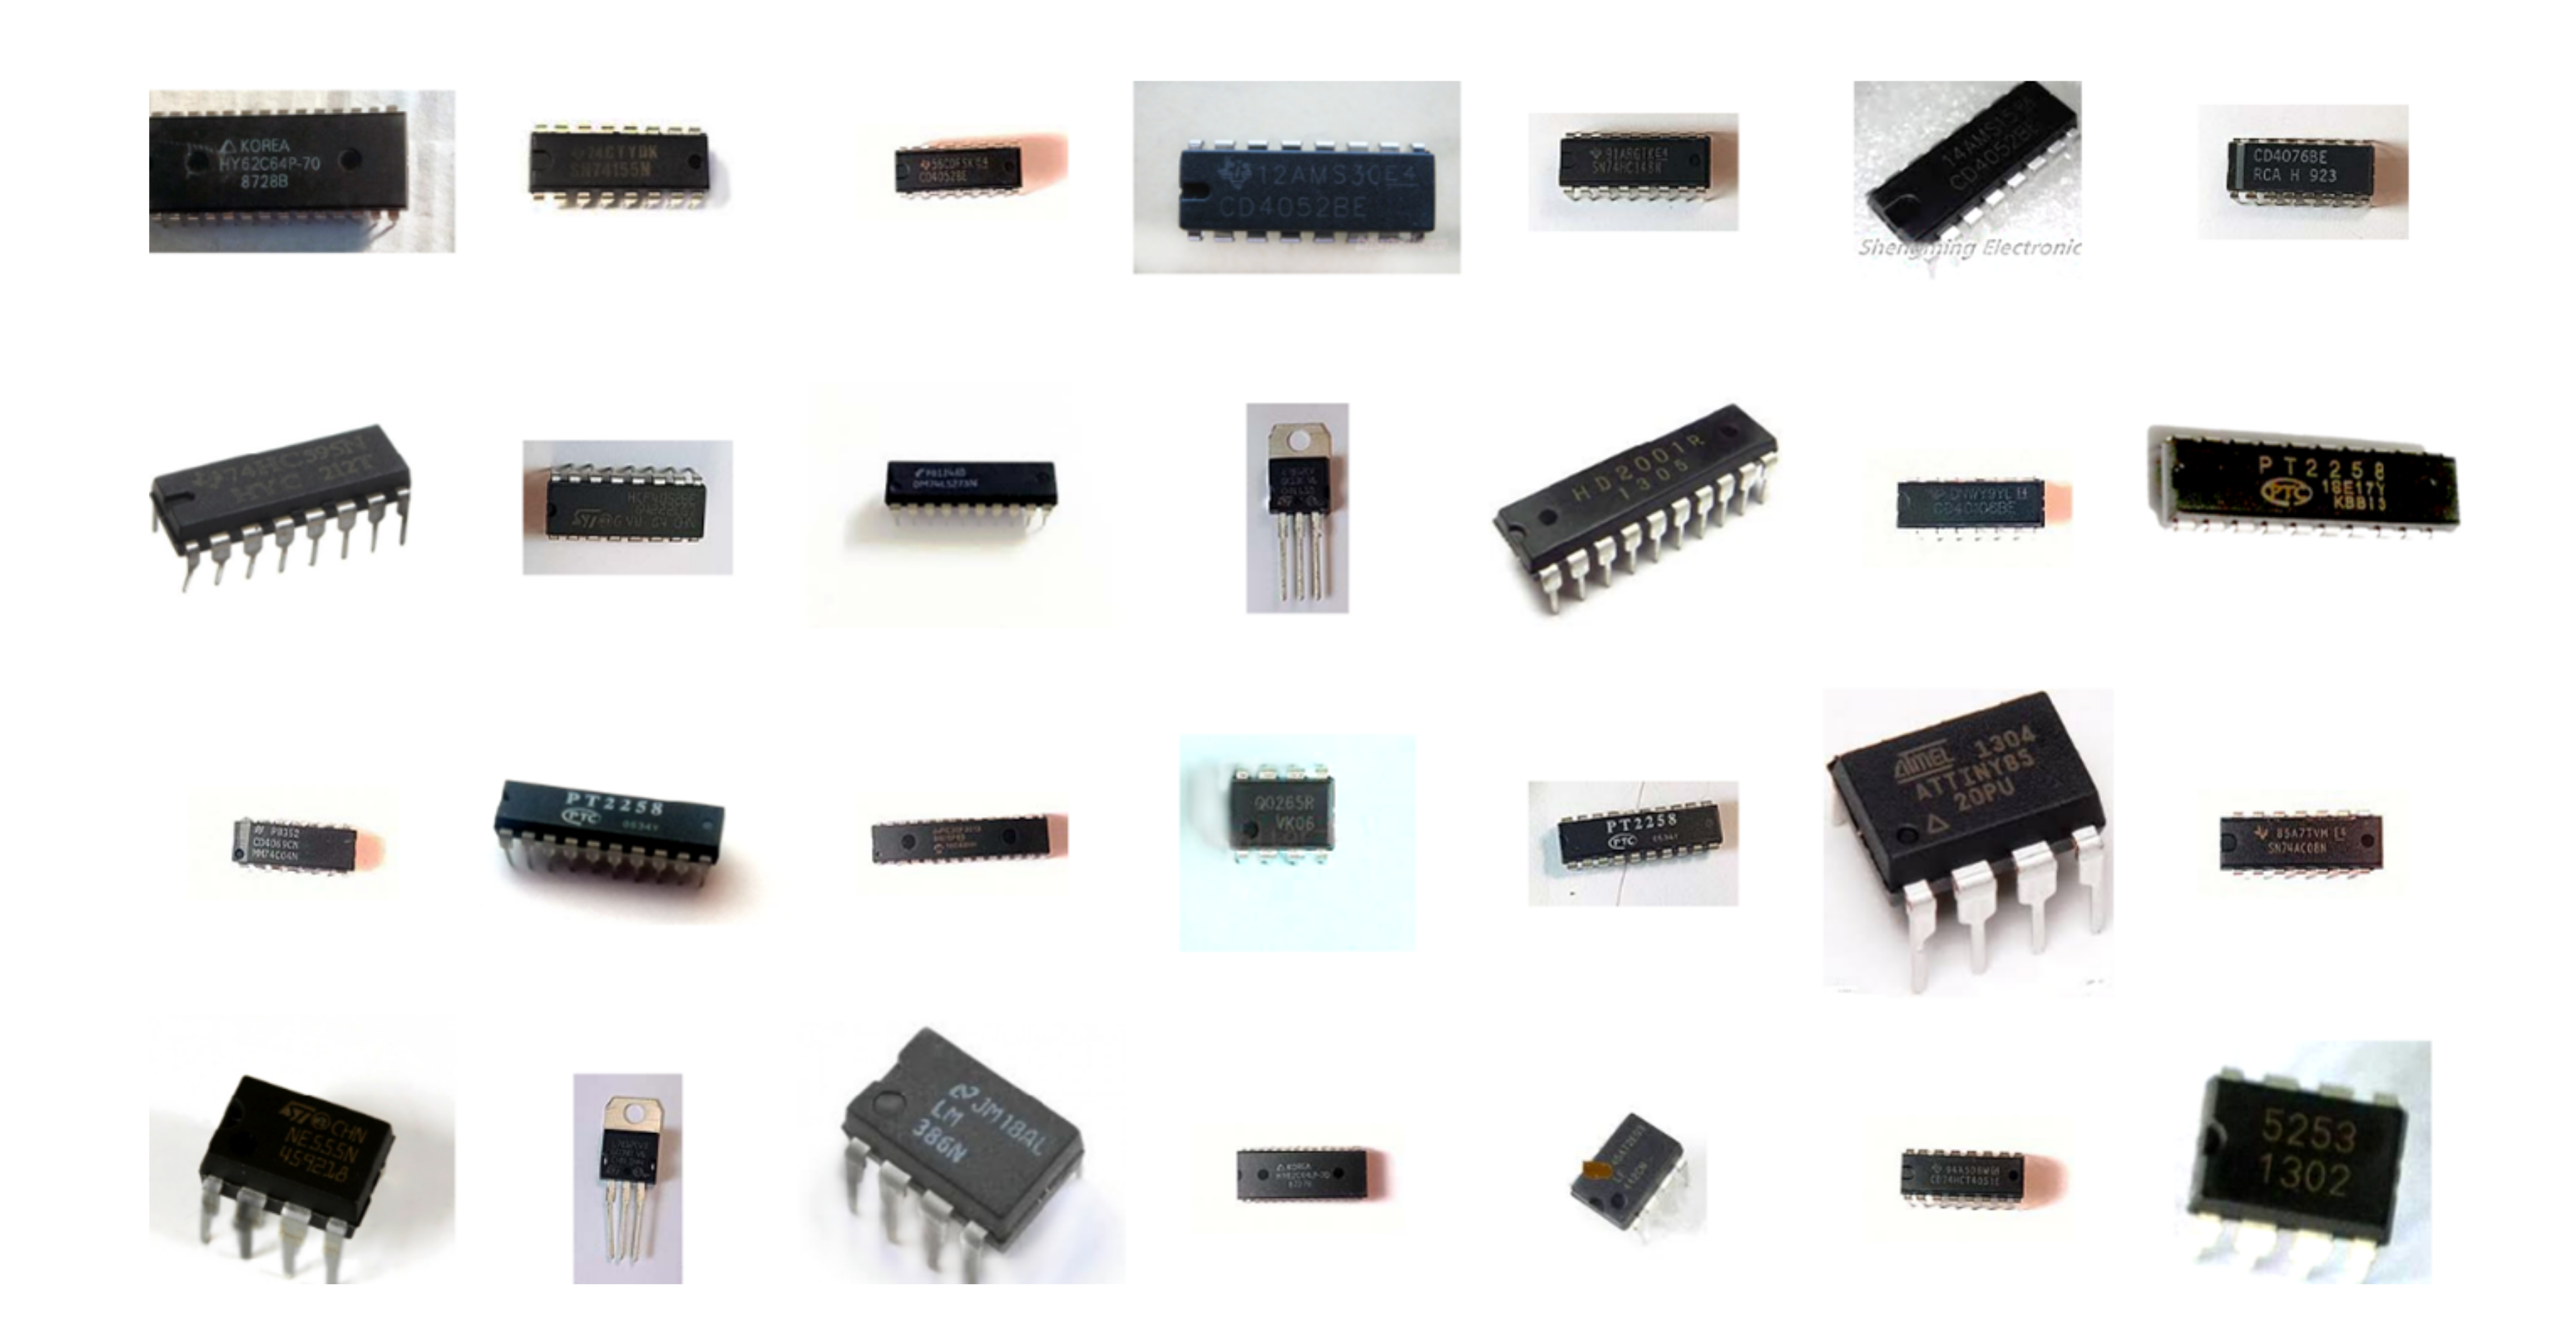
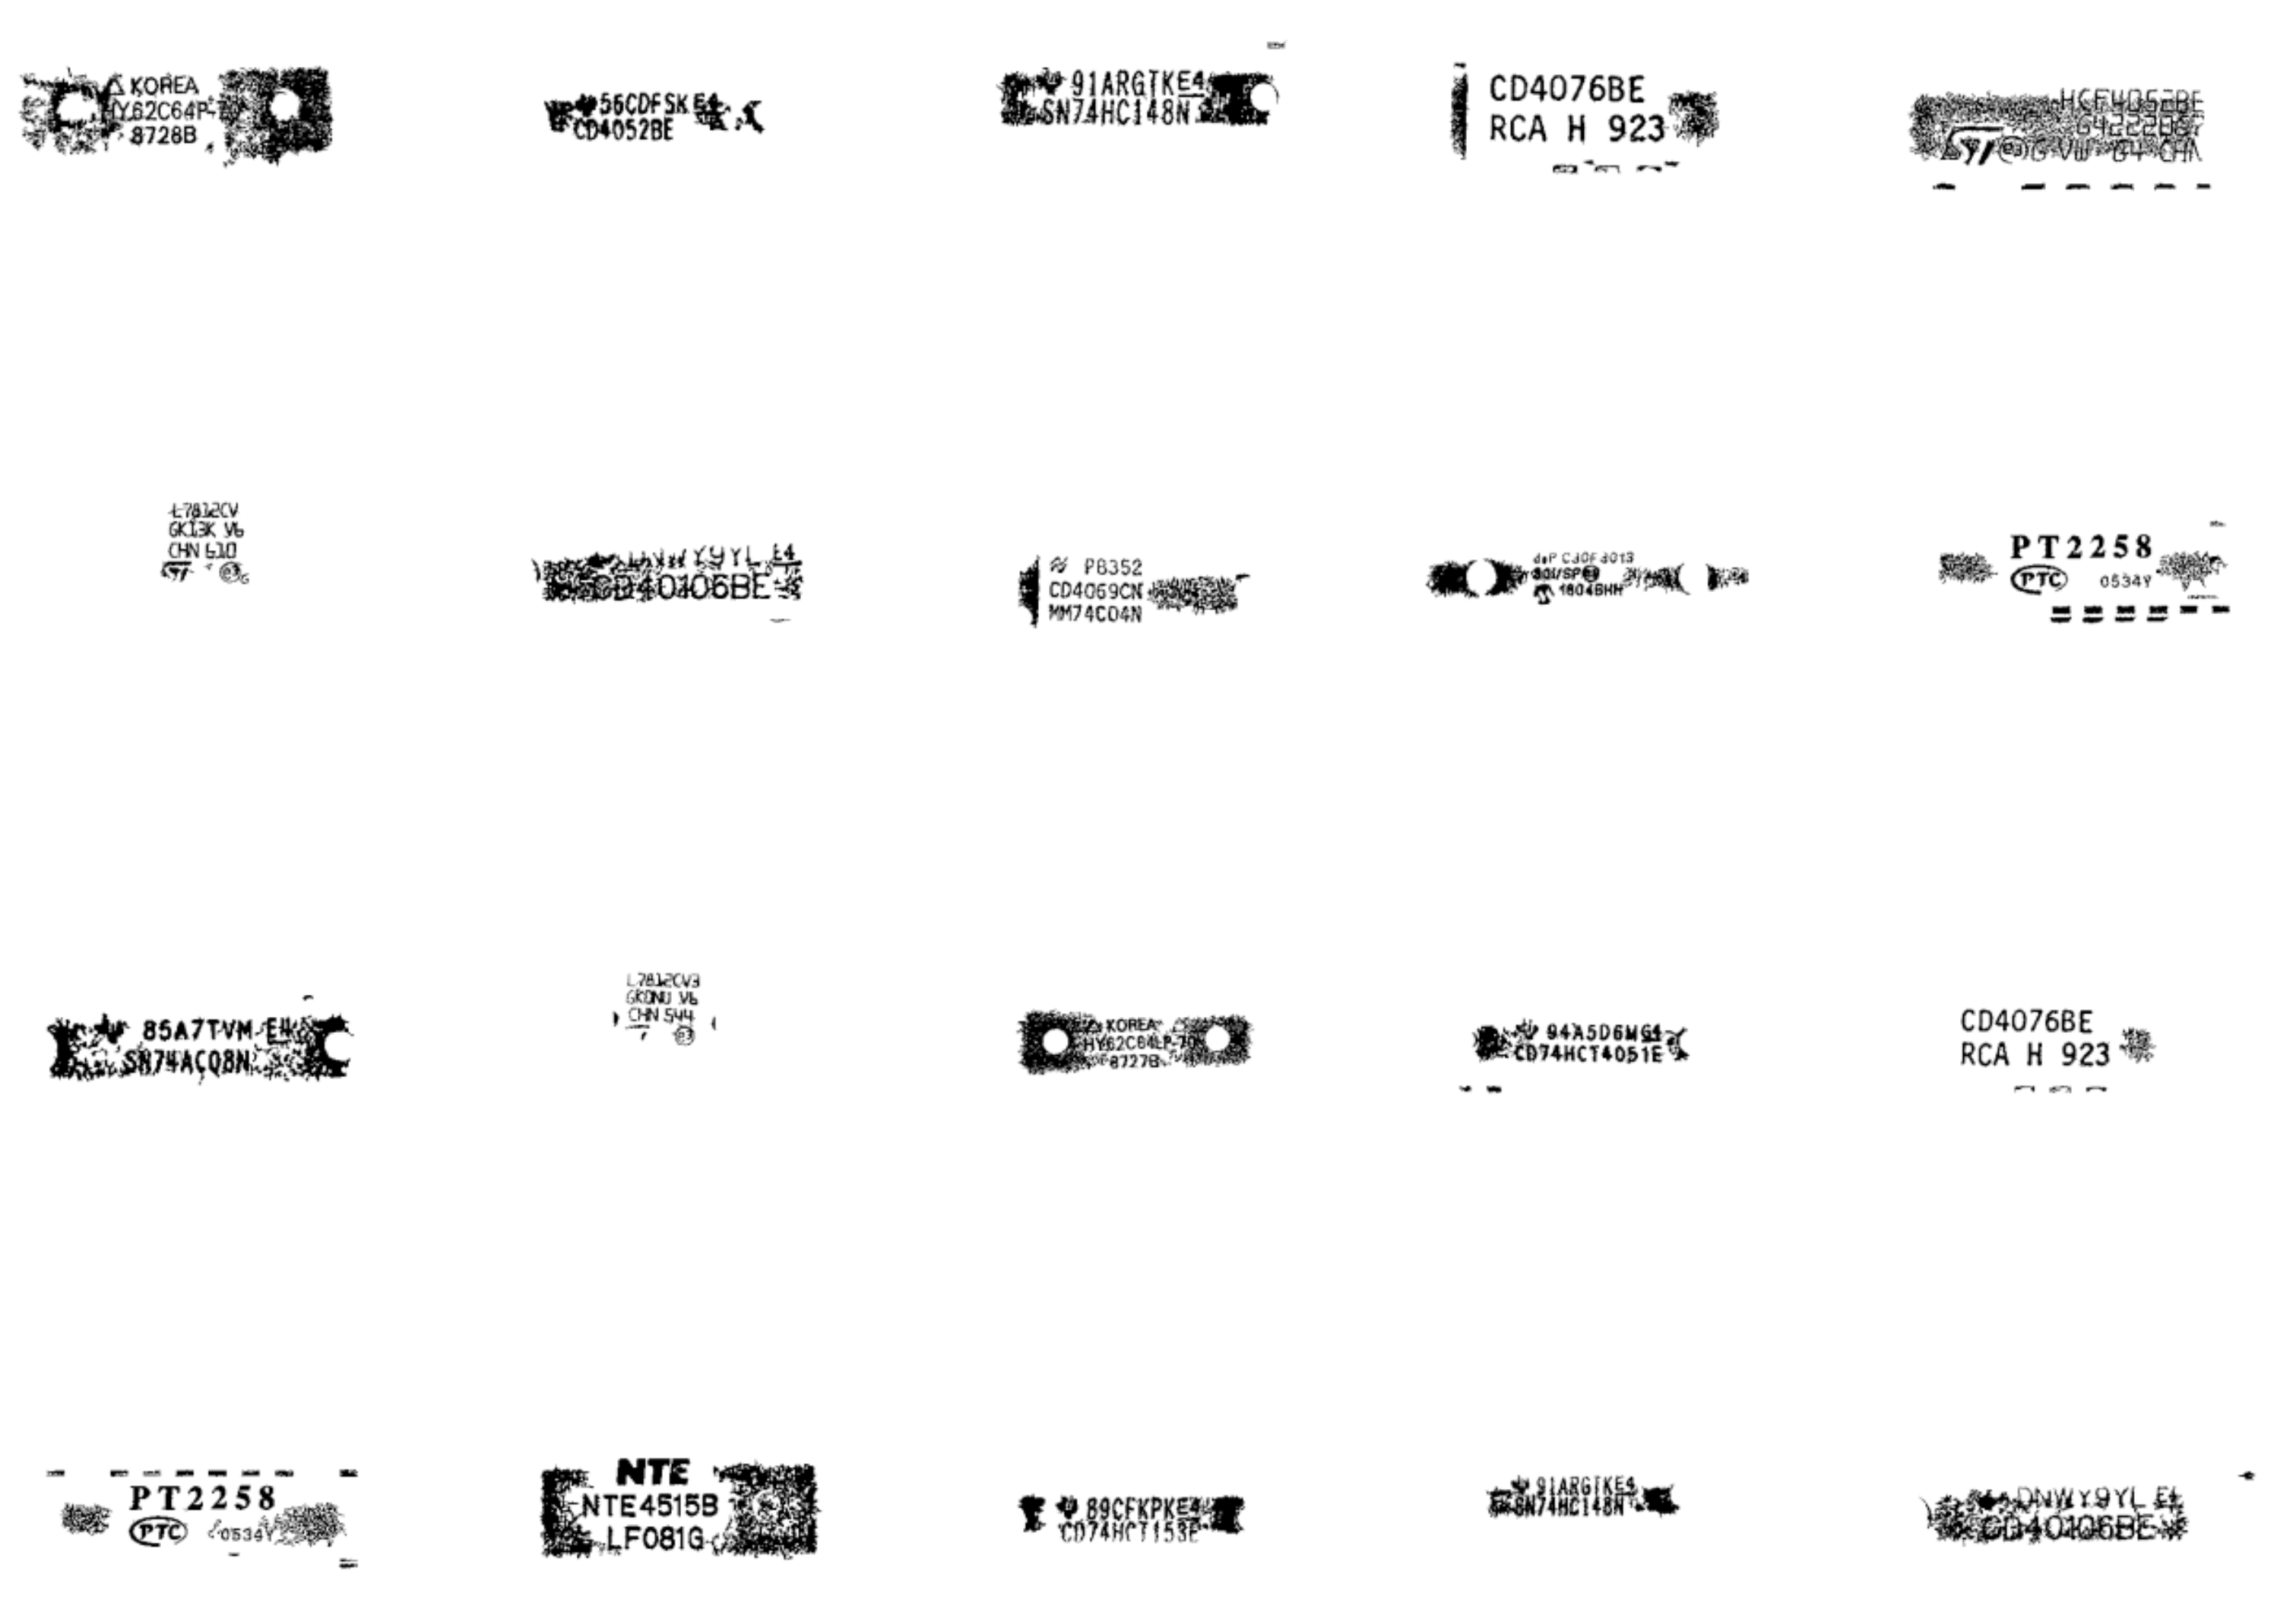
4. Description of the Evaluation Dataset

During this study, we faced a notable lack of comprehensive image databases illustrating integrated circuit (IC) packages with visible decals. Therefore, this research required the creation of a unique dataset, which was utilized to verify the methodology proposed in the paper.
Our dataset consists of 273 images captured under almost uniform lighting conditions to ensure their comparability and consistency of photographs. Unlike many studies that use professionally captured images in laboratory or industrial conditions, the majority of the captured images were taken using typical devices such as mobile phones and compact cameras on a bright background, predominantly paper. This approach better reflects the practical use cases and the challenges that come with them. To avoid bias towards the specific devices used for capturing our images, we supplemented our dataset with approximately 30% royalty-free images from the Internet.
Despite the seemingly modest size of the dataset, the computational burden involved in our study was enormous. Each image from the dataset subjected to filter and parameter combinations generated well over a thousand processed variants. This led to a substantial volume of output images for subsequent analysis. Thus, even with 273 photos, hundreds of thousands of processed versions were obtained to evaluate using the OCR engine. This significant computational task emphasizes the complexity of finding the optimal filter set for image preprocessing.
Despite the availability of various publicly accessible image datasets suitable for tasks such as image quality assessment, object recognition, document image binarization, and optical character recognition, their volume is often too small, particularly considering images containing non-document text. A good example may be the series of well-known DIBCO datasets [36] used for document image binarization purposes. Efficient training of deep convolutional neural networks would require a significantly higher number of training samples, available primarily for high-resolution document images. Hence, the proposed practical approach was the use of a pretrained OCR engine, Tesseract as a tool, supplemented by suitable image preprocessing using conventional methods and described in Section 3, avoiding the need for neural networks.
While datasets for deep learning keep expanding in size, we achieved our goal with a relatively small set of images for development—although still sizeable when compared with other articles related to image binarization topic. Even recent image binarization competitions, such as the DIBCO series mentioned above or time-quality document image binarization competitions [37] utilize datasets containing only several images, even when CNN-based algorithms are proposed. Some recent datasets available on the DIB webpage https://dib.cin.ufpe.br (accessed on 22 May 2023) contain 556, 180, 188, 80, and 176 photographed documents, respectively, and only 35 and 20 real-world documents (datasets Nabuco and LiveMemory). Such datasets are still useful as in some cases the development of larger datasets may be conducted only artificially.
Another example is image quality assessment where relatively small datasets that do not contain millions of images are still used due to the time-consuming process of acquisition of subjective quality scores. Such datasets, such as TID2013, containing 3000 images generated from only 25 reference images [38]; KonIQ-10k, containing over 10k distorted images but generated artificially from 81 reference images [39]; or even the recent PIPAL dataset, containing 29k images generated from 250 relatively small reference image patches of 288 × 288 pixels [40], are still used in recent papers [41,42,43].
The fragment of the database of images utilized to determine the optimal filter set contained two distinct sets of photographs. The first subset referred to as “illuminated”, consists of 20 images of IC packages captured in a well-illuminated environment with strong, uniform lighting. Such photographs were specifically optimized for OCR purposes and are representative of laboratory or industrial production settings. The second subset of 29 images, referred to as “shady”, was taken without control over lighting or backgrounds and closely resembles photographs captured by personal mobile devices. These images are significantly more challenging to process and require extensive research to achieve satisfactory results.
The choice of such a subset, containing diverse representative images, was caused by the significant computational burden of necessary operations and the number of potential filter and parameter combinations. The subset of 20 images, processed using all possible filter combinations, yielded over 30,000 output images which were subsequently analyzed using the OCR engine. The illustration of sample images used in experiments is presented in Figure 1 whereas sample results achieved after each step of the considered method are shown in Figure 2.

5. Implementation and Results

5.1. The Choice of Filters and Binarization Methods

A systematic approach was implemented in the MATLAB environment to find the best combination of preprocessing algorithms and filters with parameters for the recognition of the IC decals. The created script tested various filter combinations and parameters on each image in our database. This allowed us to check various scenarios. Although computationally demanding, this process was crucial for evaluating different combinations. The images processed by this script were then fed into the OCR program to extract necessary data. Then, its outputs were compared with ground truth data to validate the OCR accuracy. The gathered and evaluated results of each filter/parameter combination were then analyzed statistically.
As the result of the experiments, the optimal combination yielding the highest accuracy was found. It was defined by the smallest Levenshtein distance between recognized text and ground truth. This analysis also identified the most effective filters and parameters for enhancing image quality for OCR recognition. These results were used to fine-tune the filter parameters, improving the accuracy and efficiency of character recognition.
Figure 3 illustrates the flowchart of the proposed approach. This systematic methodology enables the evaluation of various filter combinations and parameters for IC decal recognition. It can be applied to other image analysis applications requiring optimal filter and parameter combinations for accurate, reliable results.
The first phase of our experiment concentrated on optimizing filter parameters, particularly the window size for individual algorithms, as well as the ClipLimit and the number of tiles for the CLAHE method. The system was also tested without the use of the CLAHE algorithm. Surprisingly, incorporating CLAHE either had no effect or negatively impacted the results. Hence, we excluded it from further tests. The illustration of consecutive steps of the considered method is presented in Figure 2.
During the conducted experiments, the neighborhood size was systematically varied for adaptive binarization algorithms, assuming the testing of 11 × 11 , 21 × 21 , 31 × 31 , 41 × 41 , 51 × 51 , 61 × 61 , 71 × 71 , and 81 × 81 pixel window sizes. For algorithms that did not require specifying window sizes, default settings were used. The obtained results are presented in Table 2.
The obtained results helped in identifying the most effective methods and their respective parameters for the subsequent phases of the experiments. Hence, the best versions of each algorithm (marked by bold fonts in Table 2) were used in further experiments. The illustrations of the influence of the binarization method and its parameters on the obtained binary images are presented for sample images in Figure 4 and Figure 5.

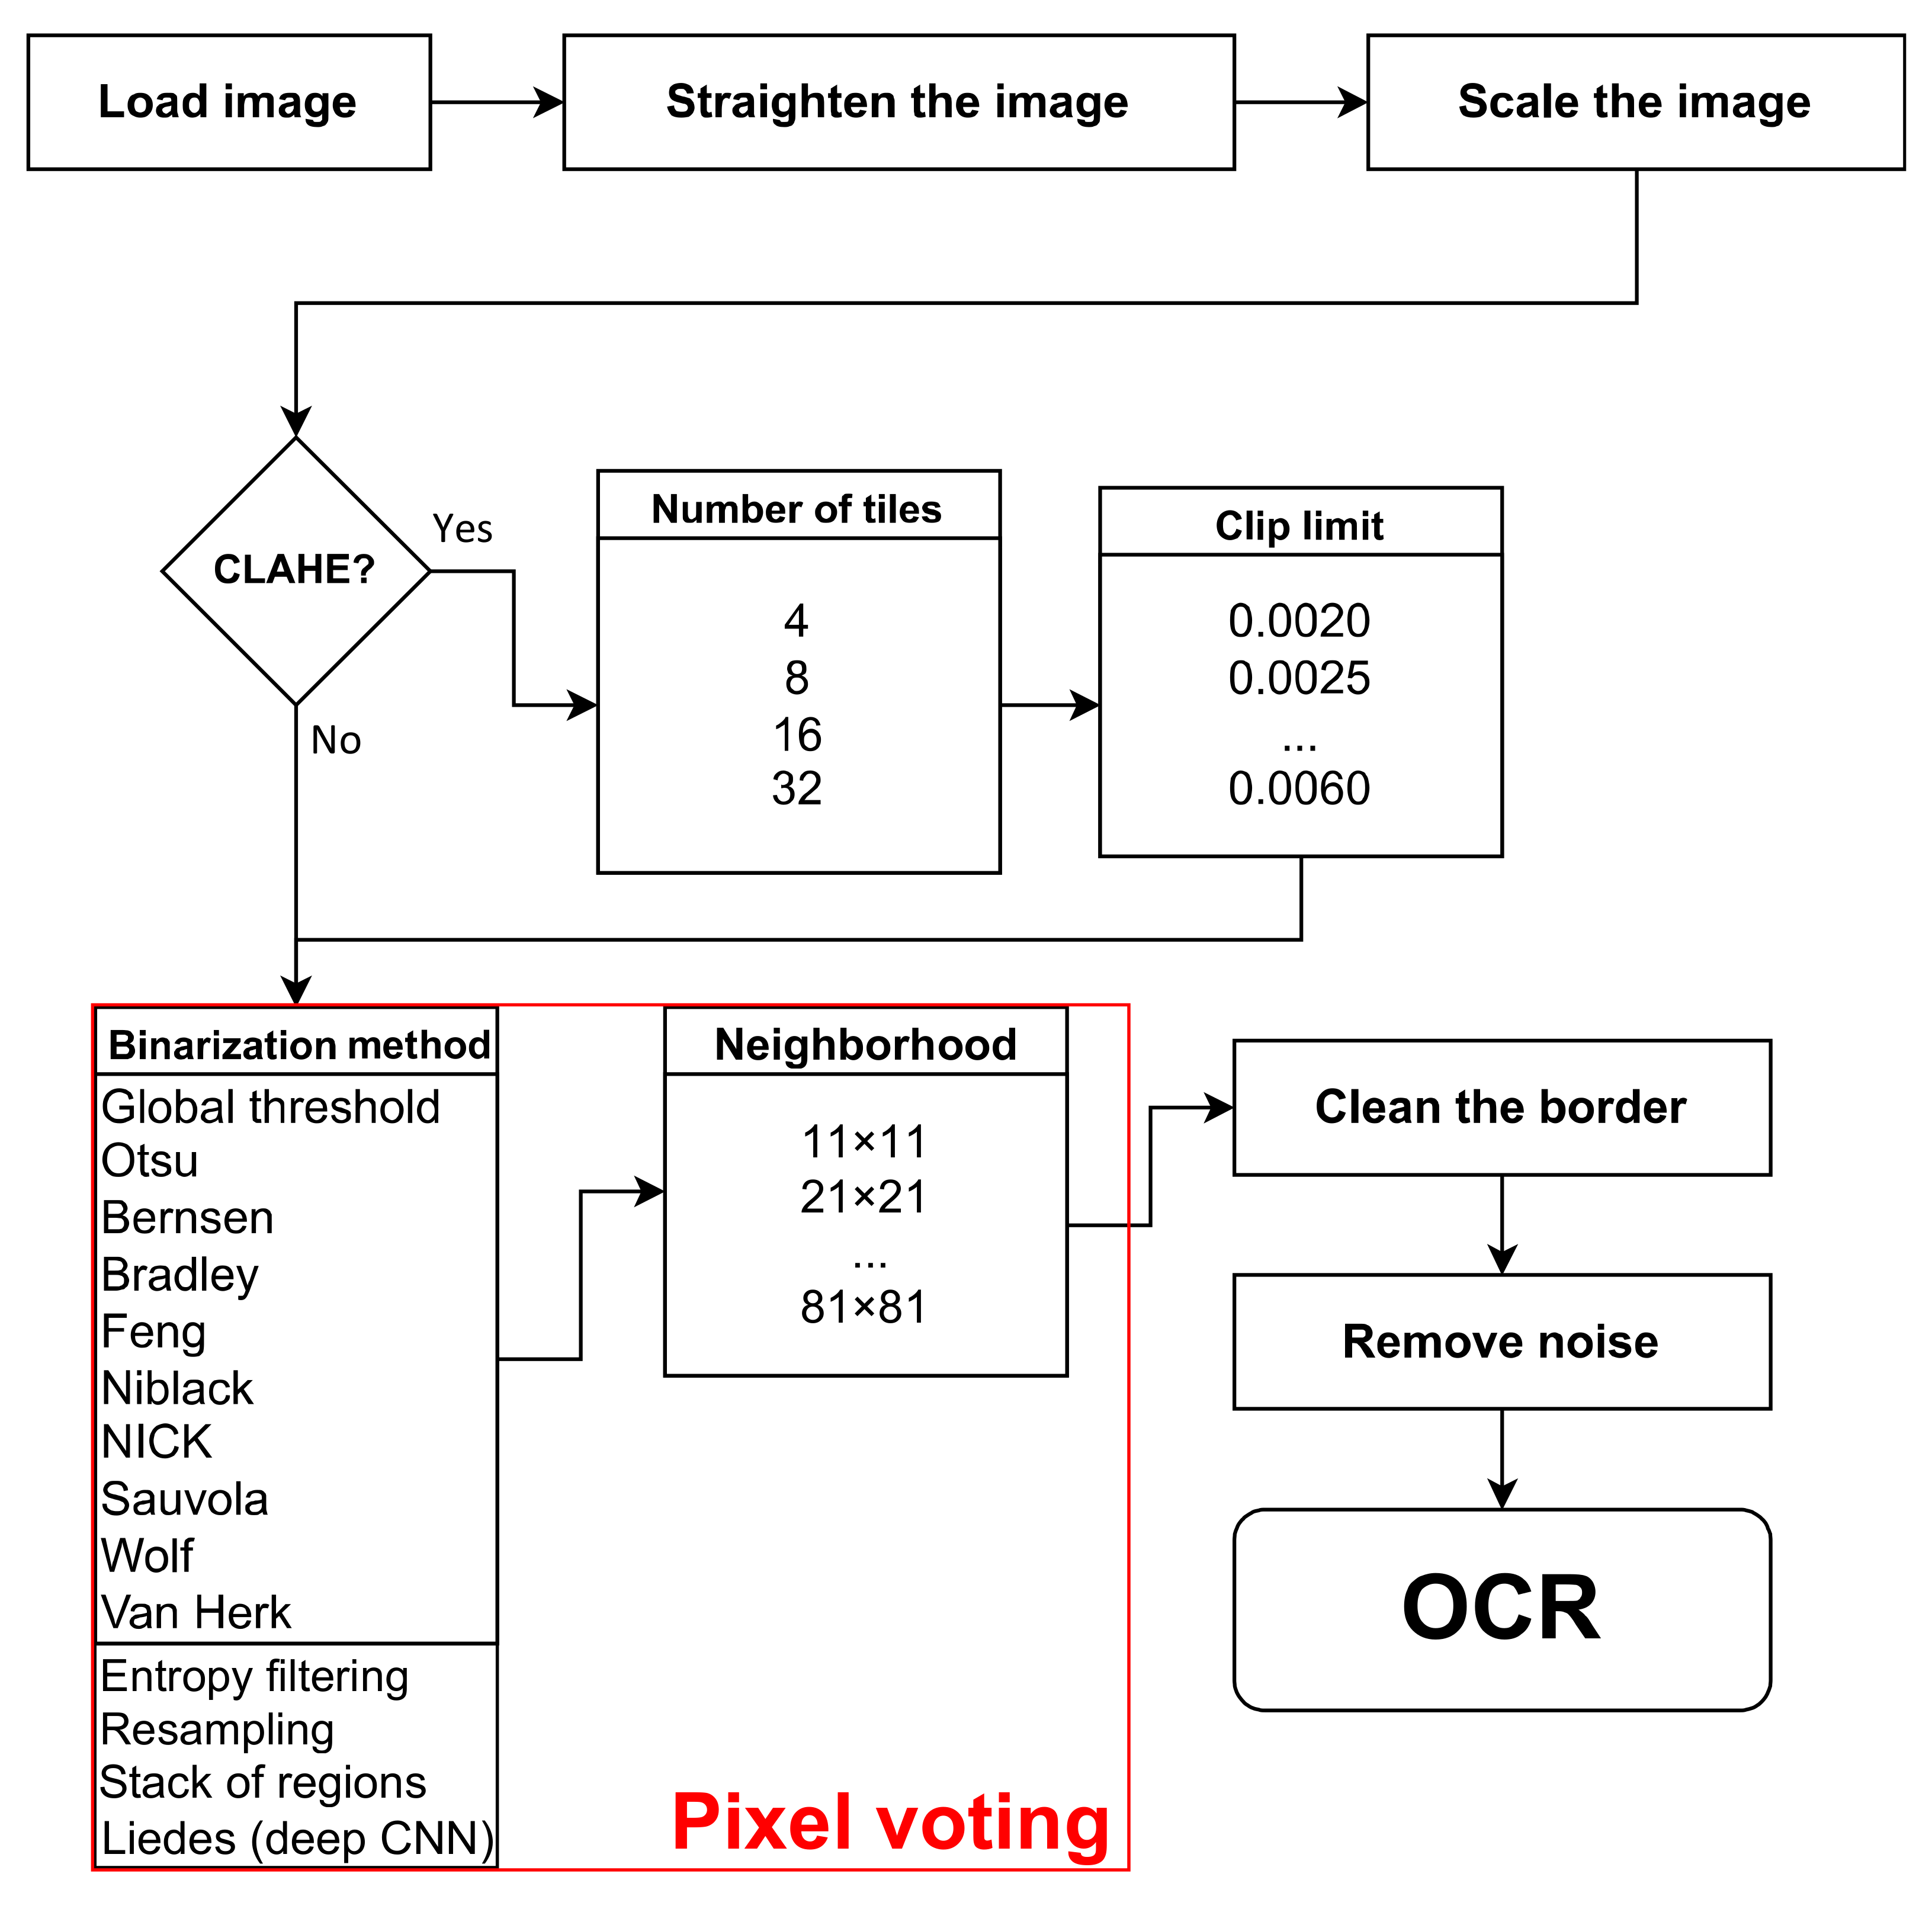
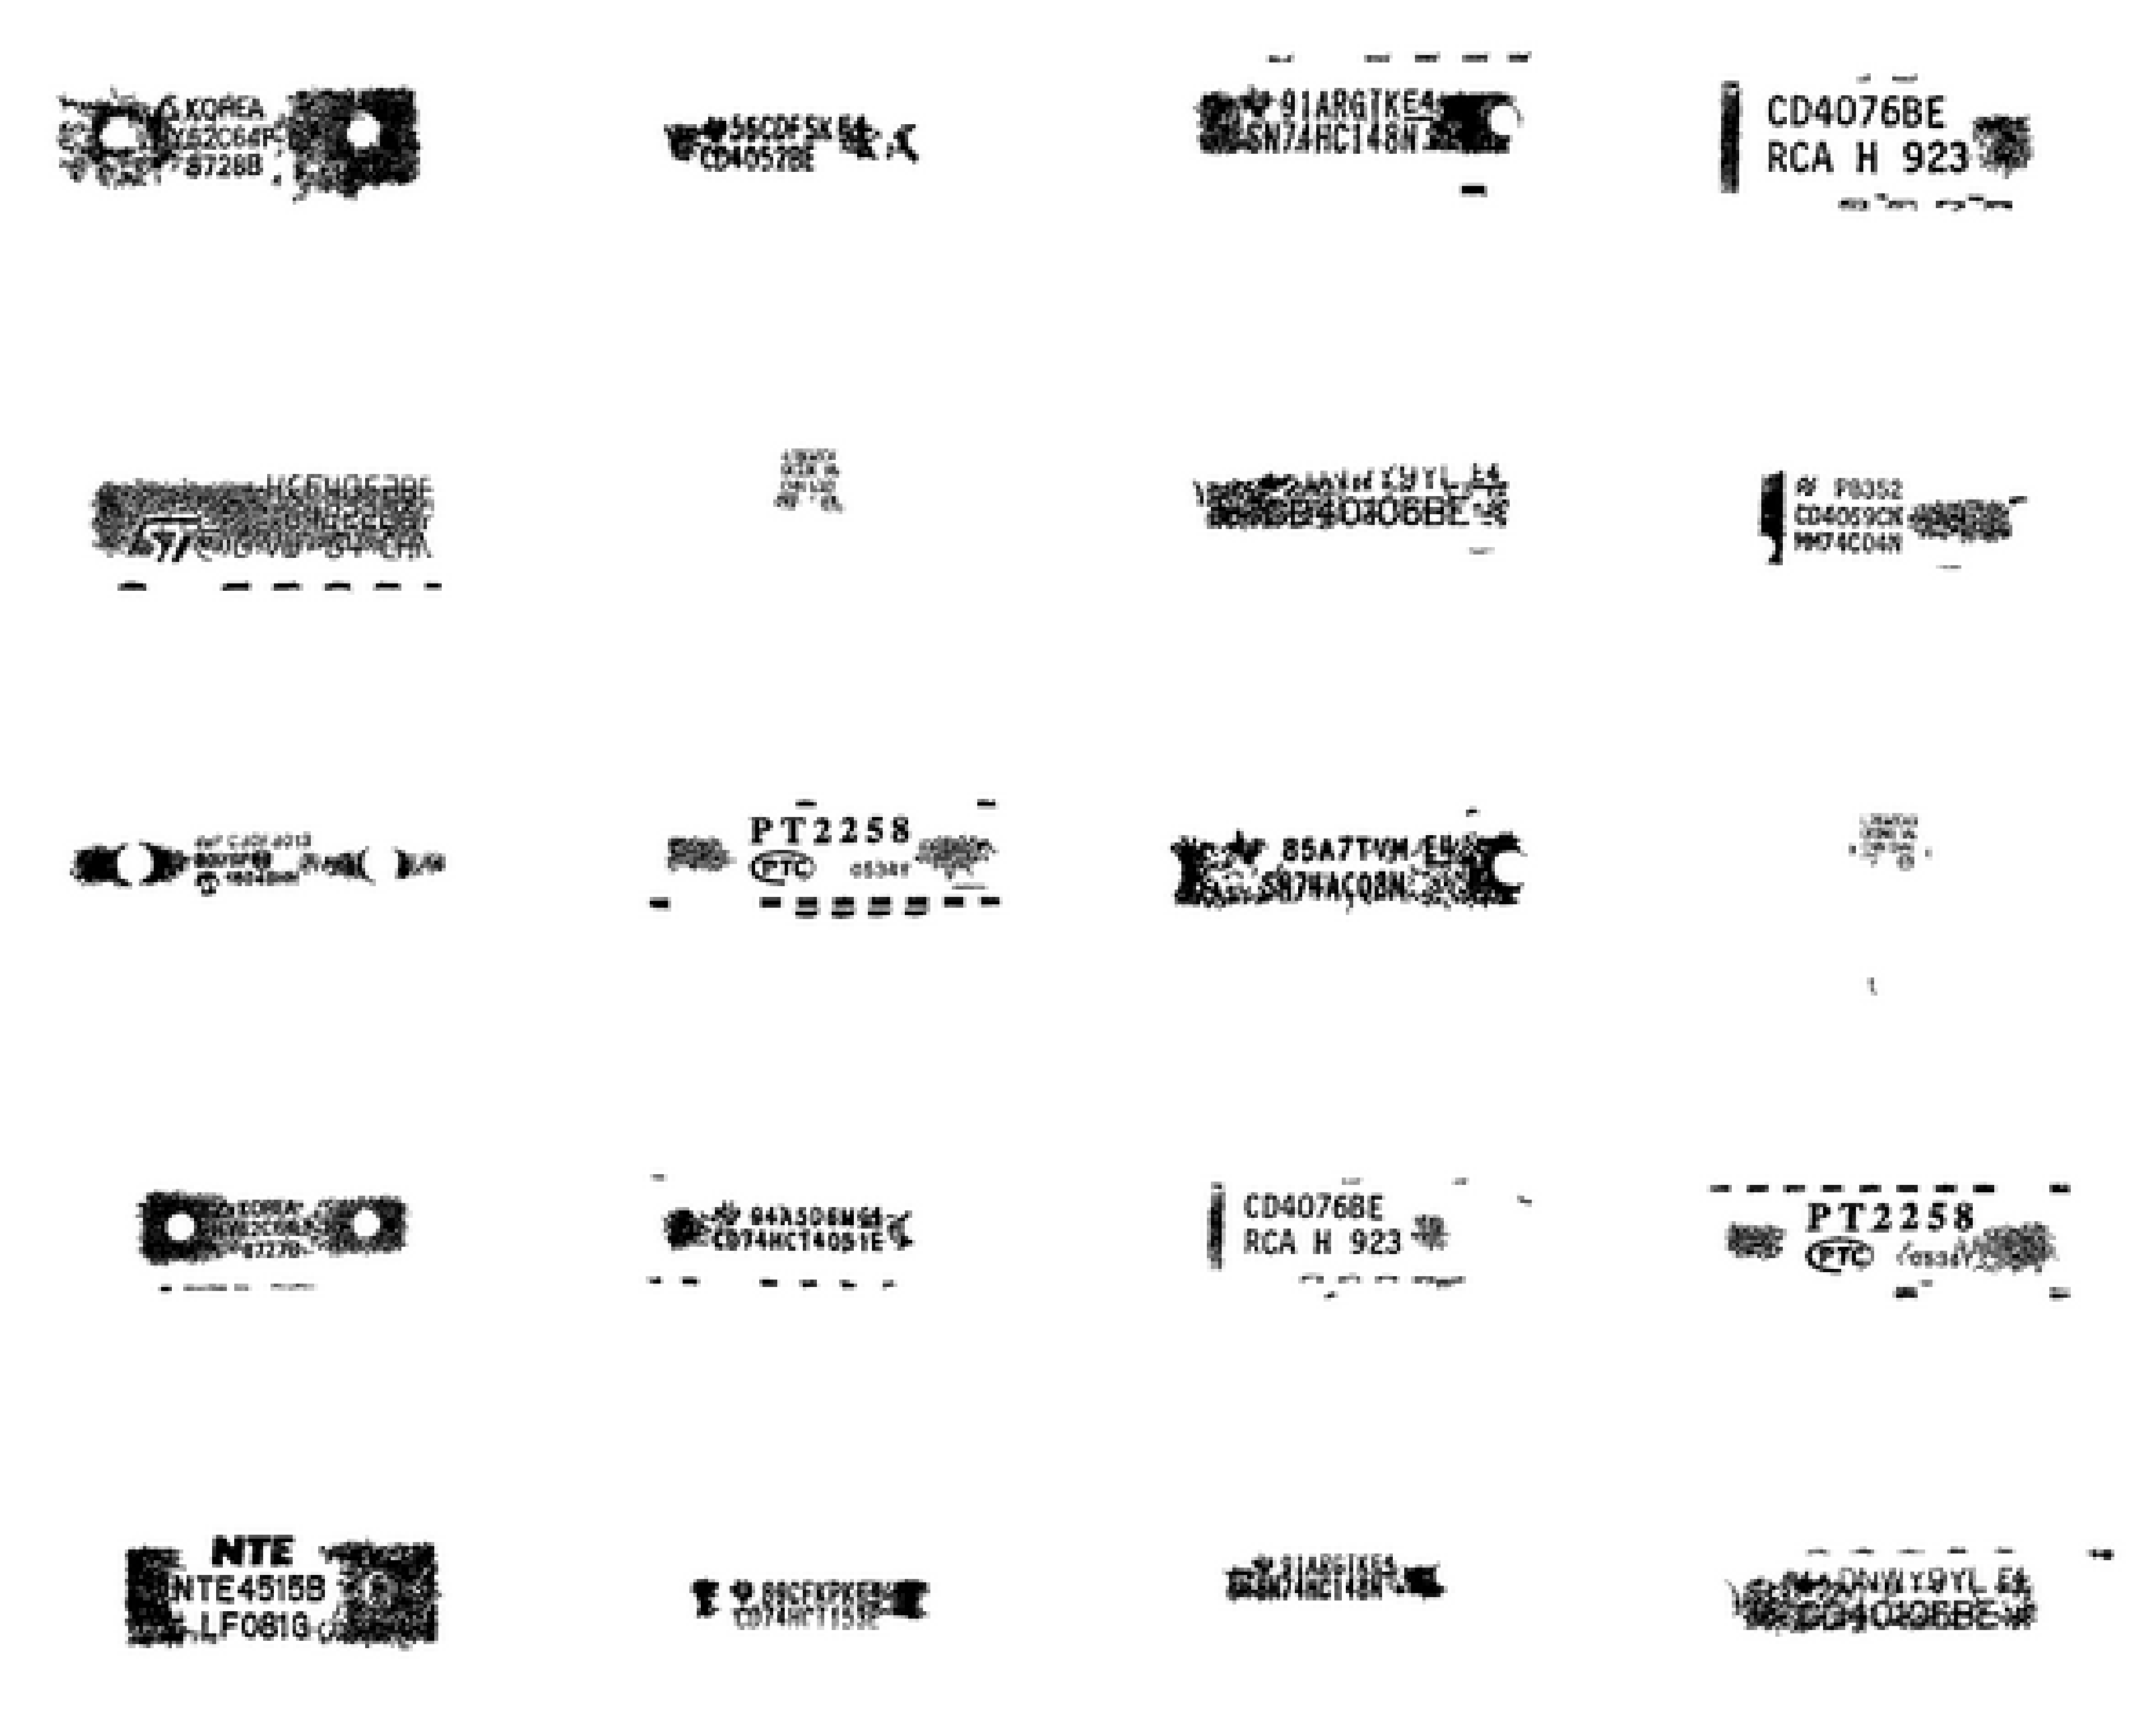
5.2. Application of the Pixel Voting

In the next phase of the experiment, the 11 best-performing algorithms from the previous phase were selected and ranked from best to worst based on their performance. To make the decision-making process more robust and improve the accuracy of binarization for IC decals, a pixel voting mechanism on each pixel with each binarization method was implemented that combines the strengths of different binarization algorithms. The proposed idea of the pixel voting is equivalent to the selection of the median from the vector containing the binarization results obtained using various methods. The voting procedure is applied for each image pixel independently. For example, using seven various binarization methods for each pixel, the vector of seven binary values (zeros or ones) is obtained, and then the major class (equivalent to the median of these seven values) is selected as the result for this pixel.
However, the result obtained for the 11 algorithm voting was unsatisfactory (see Table 3). Therefore, we eliminated the two worst-performing algorithms from the voting process, improving the score to 22.03. Despite this improvement, the result was still not the best possible. Thus, the reduction of the number of voting algorithms was continued until only three algorithms remained. The obtained results are presented in Table 3, whereas the sample images obtained using the proposed pixel voting approach are presented in Figure 6.
The best result was obtained for voting with five algorithms, leading to the average Levenshtein distance equal to 19.32. Interestingly, reducing to three algorithms resulted in a worse score of 22.07, indicating that a minimum set of these five algorithms yielded the optimal results for this phase of the experiments. The obtained set of the individual binarization methods contained:
  • Entropy filtering;
  • Bradley with window size of 71 × 71 pixels;
  • Feng with window size 61 × 61 pixels;
  • Niblack with window size of 61 × 61 pixels;
  • Sauvola with window size of 61 × 61 pixels.

5.3. Analysis of Results and Ablation Study

In the next phase of the experiments, the influence of each step of the processing on the final performance was tested. The considered steps included:
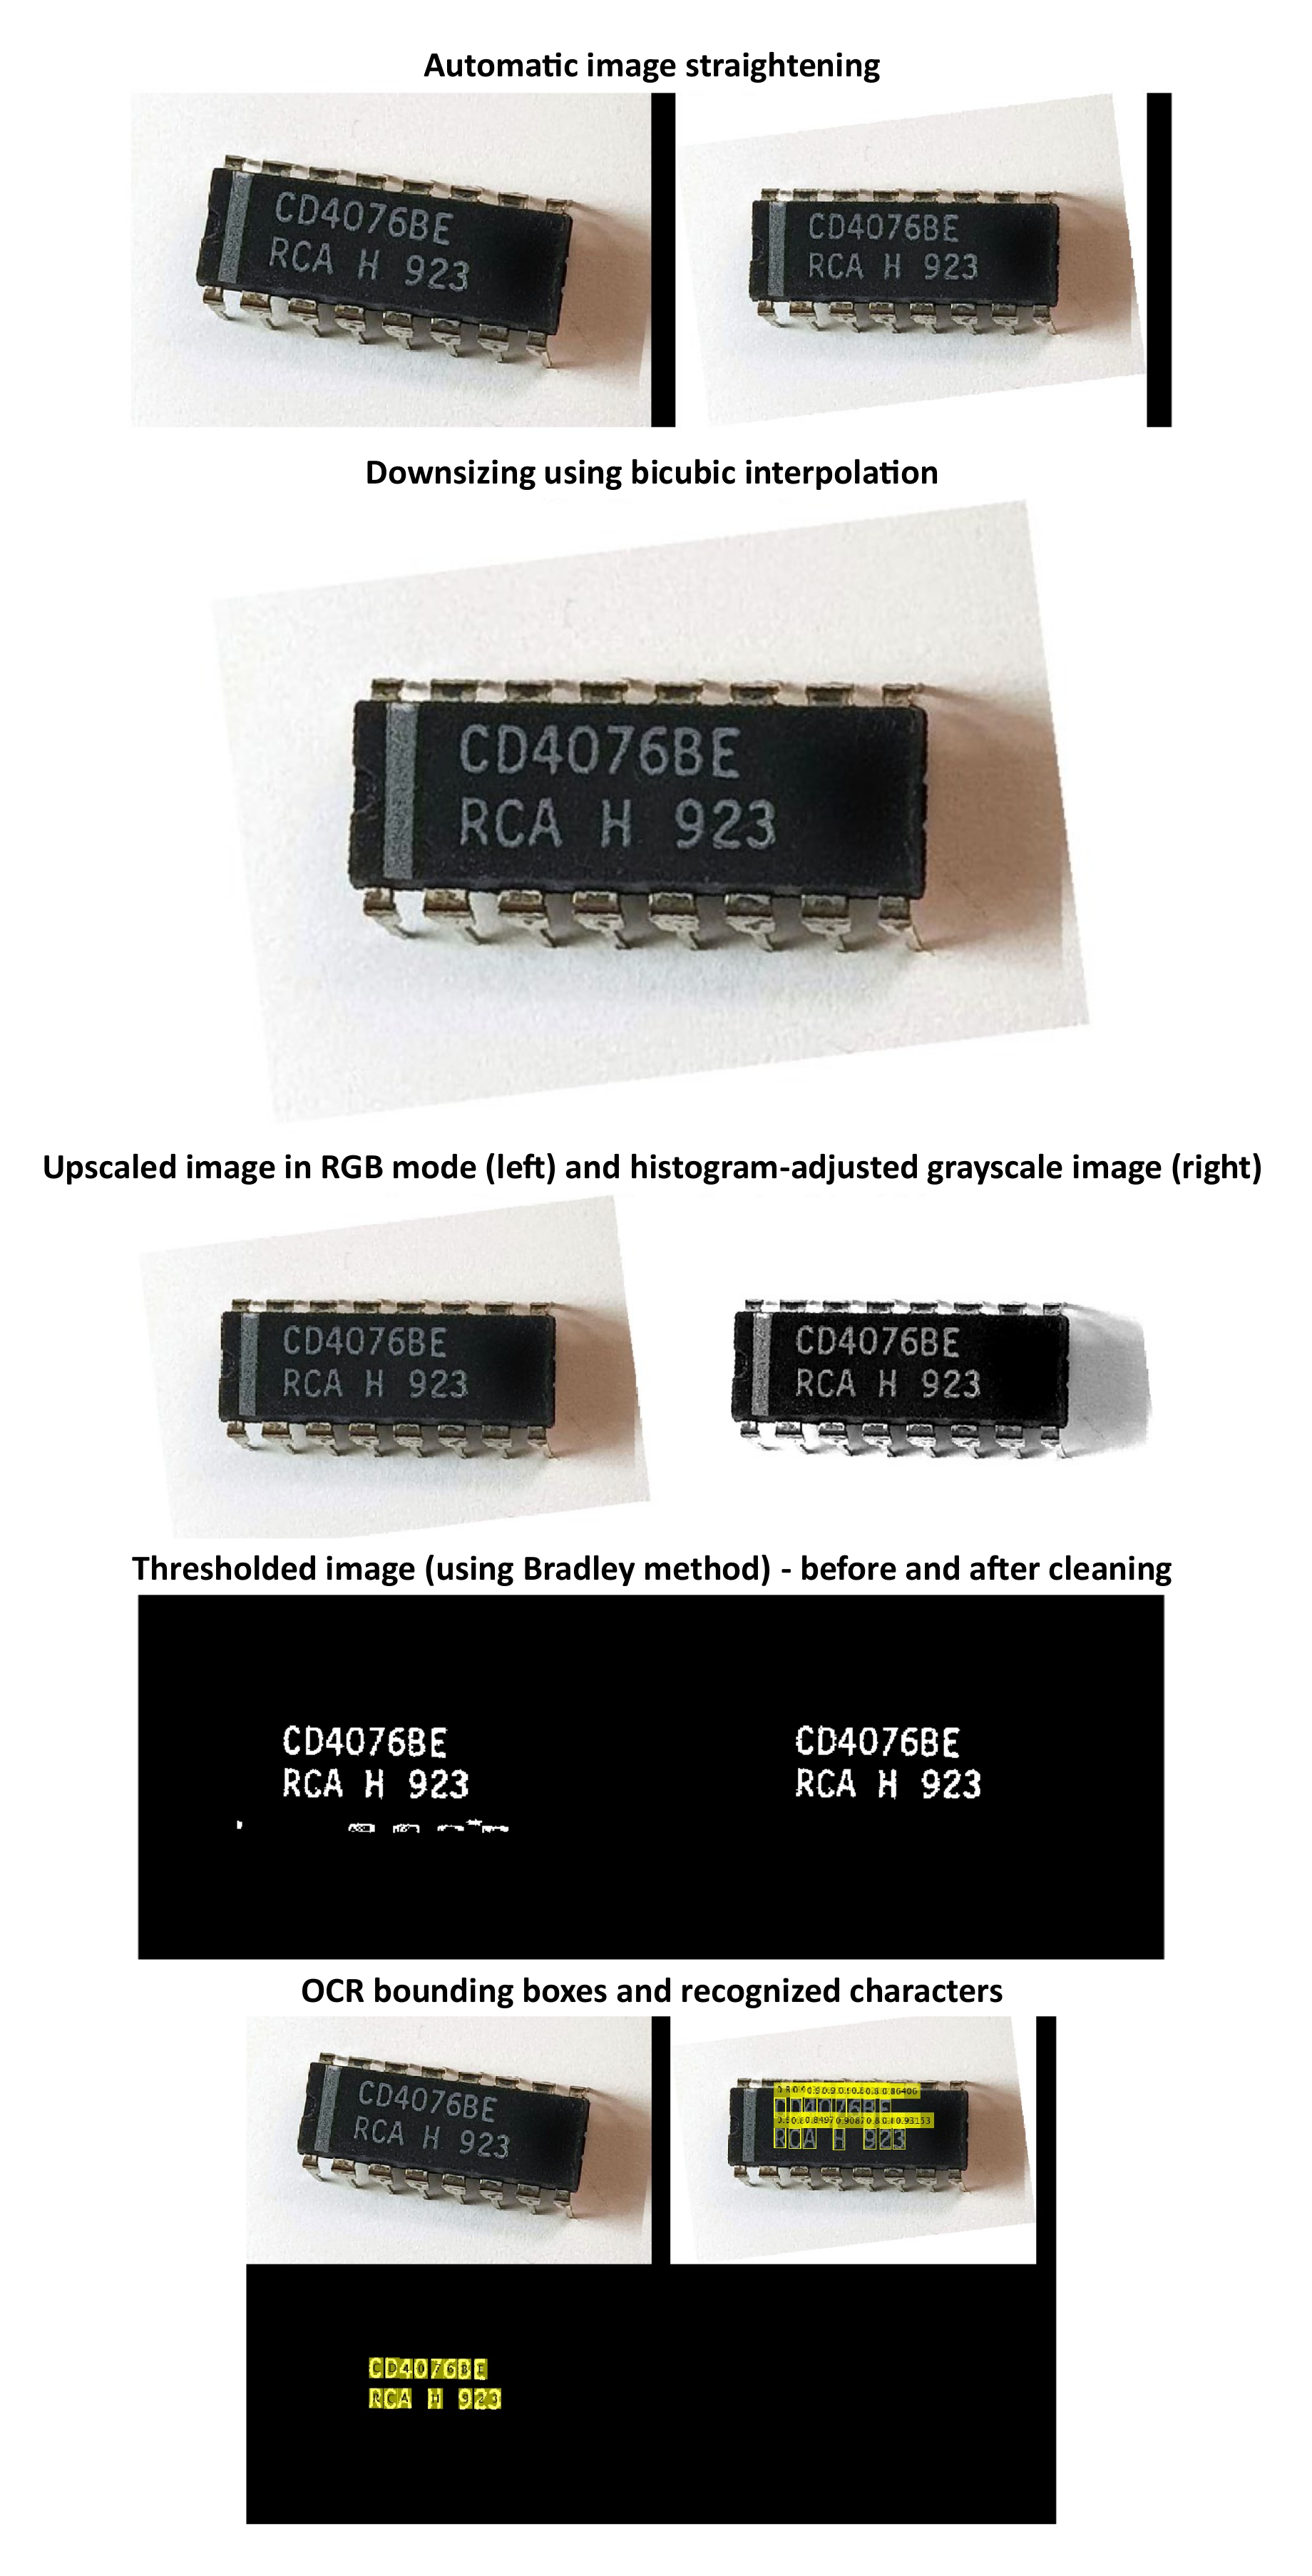
  • Image straightening;
  • Image scaling;
  • Binarization;
  • Morphological border cleaning;
  • Morphological noise removal.
The obtained results were compared to the best result achieved for the pixel voting of five binarization methods with the fill processing pipeline, which included all steps in the process. The results are presented in Table 4.
Reviewing the obtained data, it is evident that all steps contributed to the overall performance, even if some of them had a higher impact than others. The removal of the binarization step or image scaling resulted in the most significant performance drops of nearly 40% and over 28%, respectively, confirming their crucial roles.
The comprehensive analysis of the proposed processing pipeline shows a significant improvement in the performance of the optical character recognition system compared to using the Tesseract OCR engine without preprocessing. The baseline score, achieved using all steps in our processing method, was equal to 19.32. This result significantly outperforms the score achieved by the use of Tesseract OCR without preprocessing, equal to 27.63, demonstrating a considerable improvement in the OCR accuracy, measured using the average Levenshtein distance. Even seemingly minor steps, such as image straightening, morphological border cleaning, and morphological noise removal, contributed to the overall performance. Removing any of these steps led to a decrease in performance, indicating that they play essential roles in achieving the best result. Nevertheless, the major impact on the obtained results was related to the application of the appropriate binarization method as demonstrated in the paper.

6. Conclusions

Even for evenly illuminated images, the task of reading IC decals remains challenging for our current methods. This is expected since the decals are difficult to read even for the human eye. Therefore, future research should focus on developing more advanced OCR algorithms and image processing techniques to accurately recognize IC decals.
One of potential directions for further research is to combine the strengths of different binarization methods into a single approach. The best results may be achieved by using statistical or voting-based approaches [47] to choose the most appropriate binarization method for each image based on the specific characteristics of the image. The combination of five adaptive binarization algorithms based on pixel voting proposed in the paper leads to very promising results.
Another interesting idea is to explore the use of deep neural networks for end-to-end recognition of shapes and IC decals. While this approach would require a large and diverse training dataset, which currently does not exist, it could potentially lead to significant improvements in the accuracy and efficiency of the OCR process.
Despite the advances in AI and machine learning, it is essential to remember that these models often rely on high-quality, preprocessed inputs that are a fundamental condition of their proper working. Thus, supplementing these models with traditional preprocessing techniques remains an important direction of research.
We also intend to integrate this research with our previous work on developing a system for recognizing IC package types [7]. This would allow us to create a more comprehensive system for IC package recognition. Finally, we aim to improve the image filtration methods to make it possible to work with unevenly illuminated images or partially obscured ICs. This could involve exploring new morphological operations or developing more advanced image processing techniques that are robust to different lighting conditions and variations in image quality.

Author Contributions

Conceptualization, K.M. and K.O.; methodology, K.M. and K.O.; software, K.M.; validation, K.M. and K.O.; formal analysis, K.M. and K.O.; investigation, K.M.; resources, K.M.; data curation, K.M.; writing—original draft preparation, K.M. and K.O.; writing—review and editing, K.M. and K.O.; visualization, K.M.; supervision, K.O.; project administration, K.O.; funding acquisition, K.O. All authors have read and agreed to the published version of the manuscript.

Funding

This research received no external funding.

Institutional Review Board Statement

Not applicable.

Informed Consent Statement

Not applicable.

Data Availability Statement

Not applicable.

Conflicts of Interest

The authors declare no conflict of interest. The funders had no role in the design of the study; in the collection, analyses, or interpretation of data; in the writing of the manuscript; or in the decision to publish the results.

Abbreviations

The following abbreviations are used in this manuscript:
AHEAdaptive Histogram Equalization
AIAtrificial Intelligence
BERTBidirectional Encoder Representations from Transformers
CDFCumulative Distribution Function
CLAHEContrast-Limited Adaptive Histogram Equalization
CNNConvolutional Neural Network
DIBCODocument Image Binarization Competition
GANGenerative Adversarial Network
GPTGenerative Pretrained Transformer
GRUGated Recurrent Unit
ICIntegrated Circuit
ITUInternational Telecommunication Union
LSTMLong Short-Term Memory
OCROptical Character Recognition
RNNRecurrent Neural Networks

References

  1. Vukovic, I.; Cisar, P.; Kuk, K.; Bandjur, M.; Popovic, B. Influence of Image Enhancement Techniques on Effectiveness of Unconstrained Face Detection and Identification. Elektron. Elektrotechnika 2021, 27, 49–58. [Google Scholar] [CrossRef]
  2. Yan, A.; Xiang, J.; Cao, A.; He, Z.; Cui, J.; Ni, T.; Huang, Z.; Wen, X.; Girard, P. Quadruple and Sextuple Cross-Coupled SRAM Cell Designs with Optimized Overhead for Reliable Applications. IEEE Trans. Device Mater. Reliab. 2022, 22, 282–295. [Google Scholar] [CrossRef]
  3. Hegghammer, T. OCR with Tesseract, Amazon Textract, and Google Document AI: A benchmarking experiment. J. Comput. Soc. Sci. 2021, 5, 861–882. [Google Scholar] [CrossRef]
  4. Zhao, K.; Hu, J.; Shao, H.; Hu, J. Federated multi-source domain adversarial adaptation framework for machinery fault diagnosis with data privacy. Reliab. Eng. Syst. Saf. 2023, 236, 109246. [Google Scholar] [CrossRef]
  5. Zhao, K.; Jia, F.; Shao, H. A novel conditional weighting transfer Wasserstein auto-encoder for rolling bearing fault diagnosis with multi-source domains. Knowl.-Based Syst. 2023, 262, 110203. [Google Scholar] [CrossRef]
  6. Song, F.; Liu, Y.; Jin, W.; Tan, J.; He, W. Data-Driven Feedforward Learning With Force Ripple Compensation for Wafer Stages: A Variable-Gain Robust Approach. IEEE Trans. Neural Netw. Learn. Syst. 2022, 33, 1594–1608. [Google Scholar] [CrossRef]
  7. Maliński, K.; Okarma, K. Application of CNN-Based Method for Automatic Detection and Classification of the IC Packages. In Proceedings of the 16th International Conference on Control, Automation, Robotics and Vision (ICARCV), Shenzhen, China, 13–15 December 2020; pp. 944–950. [Google Scholar] [CrossRef]
  8. Hochreiter, S.; Schmidhuber, J. Long Short-Term Memory. Neural Comput. 1997, 9, 1735–1780. [Google Scholar] [CrossRef]
  9. Devlin, J.; Chang, M.W.; Lee, K.; Toutanova, K. BERT: Pre-training of Deep Bidirectional Transformers for Language Understanding. In Proceedings of the Conference of the North American Chapter of the Association for Computational Linguistics: Human Language Technologies, NAACL-HLT, Minneapolis, MN, USA, 2–7 June 2019; Burstein, J., Doran, C., Solorio, T., Eds.; Volume 1, pp. 4171–4186. [Google Scholar] [CrossRef]
  10. Radford, A.; Wu, J.; Child, R.; Luan, D.; Amodei, D.; Sutskever, I. Language Models are Unsupervised Multitask Learners. OpenAI Blog 2019, 1, 9. [Google Scholar]
  11. Brown, T.; Mann, B.; Ryder, N.; Subbiah, M.; Kaplan, J.D.; Dhariwal, P.; Neelakantan, A.; Shyam, P.; Sastry, G.; Askell, A.; et al. Language Models are Few-Shot Learners. In Proceedings of the Advances in Neural Information Processing Systems, Virtual Event, 6–12 December 2020; Larochelle, H., Ranzato, M., Hadsell, R., Balcan, M., Lin, H., Eds.; Volume 33, pp. 1877–1901. [Google Scholar]
  12. Madry, A.; Makelov, A.; Schmidt, L.; Tsipras, D.; Vladu, A. Towards Deep Learning Models Resistant to Adversarial Attacks. In Proceedings of the 6th International Conference on Learning Representations, ICLR 2018, Vancouver, BC, Canada, 30 April–3 May 2018; Available online: OpenReview.net (accessed on 18 April 2023).
  13. Ng, H.W.; Nguyen, V.D.; Vonikakis, V.; Winkler, S. Deep Learning for Emotion Recognition on Small Datasets using Transfer Learning. In Proceedings of the 2015 ACM International Conference on Multimodal Interaction (ICMI), Seattle, WA, USA, 9–13 November 2015; pp. 443–449. [Google Scholar] [CrossRef]
  14. Goodfellow, I.; Pouget-Abadie, J.; Mirza, M.; Xu, B.; Warde-Farley, D.; Ozair, S.; Courville, A.; Bengio, Y. Generative Adversarial Nets. In Proceedings of the Advances in Neural Information Processing Systems, Montreal, QC, Canada, 8–13 December 2014; Ghahramani, Z., Welling, M., Cortes, C., Lawrence, N., Weinberger, K., Eds.; Volume 27, pp. 672–2680. [Google Scholar]
  15. LeCun, Y.; Bengio, Y.; Hinton, G. Deep learning. Nature 2015, 521, 436–444. [Google Scholar] [CrossRef]
  16. Krizhevsky, A.; Sutskever, I.; Hinton, G.E. ImageNet Classification with Deep Convolutional Neural Networks. In Proceedings of the Advances in Neural Information Processing Systems, Lake Tahoe, NV, USA, 3–8 December 2012; Pereira, F., Burges, C., Bottou, L., Weinberger, K., Eds.; Volume 25, pp. 1106–1114. [Google Scholar]
  17. Yujian, L.; Bo, L. A Normalized Levenshtein Distance Metric. IEEE Trans. Pattern Anal. Mach. Intell. 2007, 29, 1091–1095. [Google Scholar] [CrossRef]
  18. Sporici, D.; Cușnir, E.; Boiangiu, C.A. Improving the Accuracy of Tesseract 4.0 OCR Engine Using Convolution-Based Preprocessing. Symmetry 2020, 12, 715. [Google Scholar] [CrossRef]
  19. Iskandarani, M.Z. Improving the OCR of Low Contrast, Small Fonts, Dark Background Forms Using Correlated Zoom and Resolution Technique (CZRT). J. Data Anal. Inf. Process. 2015, 3, 34–42. [Google Scholar] [CrossRef]
  20. Keys, R. Cubic convolution interpolation for digital image processing. IEEE Trans. Acoust. Speech Signal Process. 1981, 29, 1153–1160. [Google Scholar] [CrossRef]
  21. Battiato, S.; Gallo, G.; Stanco, F. A locally adaptive zooming algorithm for digital images. Image Vis. Comput. 2002, 20, 805–812. [Google Scholar] [CrossRef]
  22. Mukhopadhyay, P.; Chaudhuri, B.B. A survey of Hough Transform. Pattern Recognit. 2015, 48, 993–1010. [Google Scholar] [CrossRef]
  23. Zuiderveld, K. Contrast Limited Adaptive Histogram Equalization. In Graphics Gems; Elsevier: Amsterdam, The Netherlands, 1994; pp. 474–485. [Google Scholar] [CrossRef]
  24. Sankur, B. Survey over image thresholding techniques and quantitative performance evaluation. J. Electron. Imaging 2004, 13, 146. [Google Scholar] [CrossRef]
  25. Otsu, N. A threshold selection method from gray-level histograms. IEEE Trans. Syst. Man Cybern. 1979, 9, 62–66. [Google Scholar] [CrossRef]
  26. Bernsen, J. Dynamic thresholding of grey-level images. In Proceedings of the 8th International Conference on Pattern Recognition (ICPR), Paris, France, 27–31 October 1986; pp. 1251–1255. [Google Scholar]
  27. Bradley, D.; Roth, G. Adaptive Thresholding using the Integral Image. J. Graph. Tools 2007, 12, 13–21. [Google Scholar] [CrossRef]
  28. Niblack, W. An Introduction to Digital Image Processing; Prentice-Hall International: Hoboken, NJ, USA, 1986; p. 215. [Google Scholar]
  29. Feng, M.L.; Tan, Y.P. Adaptive binarization method for document image analysis. In Proceedings of the 2004 IEEE International Conference on Multimedia and Expo (ICME), Taipei, Taiwan, 27–30 June 2004; Volume 1, pp. 339–342. [Google Scholar] [CrossRef]
  30. Nacereddine, N.; Boulmerka, A.; Mhamda, N. Video Processing and Analysis for Endoscopy-Based Internal Pipeline Inspection. In Image Processing and Communications Challenges 10; Springer International Publishing: Berlin/Heidelberg, Germany, 2018; pp. 46–54. [Google Scholar] [CrossRef]
  31. Khurshid, K.; Siddiqi, I.; Faure, C.; Vincent, N. Comparison of Niblack inspired binarization methods for ancient documents. In Proceedings of the Document Recognition and Retrieval XVI, San Jose, CA, USA, 18–22 January 2009; Volume 7247, p. 7247. [Google Scholar] [CrossRef]
  32. Serra, J.; Soille, P. (Eds.) Mathematical Morphology and Its Applications to Image Processing; Springer: Dordrecht, The Netherlands, 1994. [Google Scholar] [CrossRef]
  33. Michalak, H.; Okarma, K. Improvement of Image Binarization Methods Using Image Preprocessing with Local Entropy Filtering for Alphanumerical Character Recognition Purposes. Entropy 2019, 21, 562. [Google Scholar] [CrossRef]
  34. Michalak, H.; Okarma, K. Adaptive Image Binarization Based on Multi-layered Stack of Regions. In Computer Analysis of Images and Patterns; Springer International Publishing: Berlin/Heidelberg, Germany, 2019; pp. 281–293. [Google Scholar] [CrossRef]
  35. Michalak, H.; Okarma, K. Fast Binarization of Unevenly Illuminated Document Images Based on Background Estimation for Optical Character Recognition Purposes. J. Univers. Comput. Sci. 2019, 25, 627–646. [Google Scholar] [CrossRef]
  36. Pratikakis, I.; Zagoris, K.; Karagiannis, X.; Tsochatzidis, L.; Mondal, T.; Marthot-Santaniello, I. ICDAR 2019 Competition on Document Image Binarization (DIBCO 2019). In Proceedings of the 2019 International Conference on Document Analysis and Recognition (ICDAR), Sydney, NSW, Australia, 20–25 September 2019; pp. 1547–1556. [Google Scholar] [CrossRef]
  37. Lins, R.D.; Bernardino, R.B.; Smith, E.B.; Kavallieratou, E. ICDAR 2021 Competition on Time-Quality Document Image Binarization. In Document Analysis and Recognition—ICDAR 2021; Springer International Publishing: Berlin/Heidelberg, Germany, 2021; pp. 708–722. [Google Scholar] [CrossRef]
  38. Ponomarenko, N.; Jin, L.; Ieremeiev, O.; Lukin, V.; Egiazarian, K.; Astola, J.; Vozel, B.; Chehdi, K.; Carli, M.; Battisti, F.; et al. Image database TID2013: Peculiarities, results and perspectives. Signal Process. Image Commun. 2015, 30, 57–77. [Google Scholar] [CrossRef]
  39. Hosu, V.; Lin, H.; Sziranyi, T.; Saupe, D. KonIQ-10k: An Ecologically Valid Database for Deep Learning of Blind Image Quality Assessment. IEEE Trans. Image Process. 2020, 29, 4041–4056. [Google Scholar] [CrossRef] [PubMed]
  40. Gu, J.; Cai, H.; Chen, H.; Ye, X.; Ren, J.S.; Dong, C. PIPAL: A Large-Scale Image Quality Assessment Dataset for Perceptual Image Restoration. In Computer Vision—ECCV 2020; Springer International Publishing: Berlin/Heidelberg, Germany, 2020; pp. 633–651. [Google Scholar] [CrossRef]
  41. Chemmanam, A.J.; N, S.; Jose, B.A. Fused features for no reference image quality assessment. Imaging Sci. J. 2022, 70, 287–299. [Google Scholar] [CrossRef]
  42. Tsai, P.F.; Peng, H.N.; Liao, C.H.; Yuan, S.M. Full-Reference Image Quality Assessment with Transformer and DISTS. Mathematics 2023, 11, 1599. [Google Scholar] [CrossRef]
  43. Yao, J.; Shen, J.; Yao, C. Image quality assessment based on the perceived structural similarity index of an image. Math. Biosci. Eng. 2023, 20, 9385–9409. [Google Scholar] [CrossRef]
  44. Sauvola, J.; Pietikäinen, M. Adaptive document image binarization. Pattern Recognit. 2000, 33, 225–236. [Google Scholar] [CrossRef]
  45. Wolf, C.; Jolion, J.M. Extraction and recognition of artificial text in multimedia documents. Form. Pattern Anal. Appl. 2004, 6, 309–326. [Google Scholar] [CrossRef]
  46. Van Herk, M. A fast algorithm for local minimum and maximum filters on rectangular and octagonal kernels. Pattern Recognit. Lett. 1992, 13, 517–521. [Google Scholar] [CrossRef]
  47. Michalak, H.; Okarma, K. Robust Combined Binarization Method of Non-Uniformly Illuminated Document Images for Alphanumerical Character Recognition. Sensors 2020, 20, 2914. [Google Scholar] [CrossRef]
Figure 1. A selection of random images from the experimental database.
Electronics 12 02449 g001
Figure 2. The illustration of consecutive steps of the considered method.
Electronics 12 02449 g002
Figure 3. The flowchart of the proposed approach.
Electronics 12 02449 g003
Figure 4. Sample binarization results obtained using Bradley thresholding.
Electronics 12 02449 g004
Figure 5. The illustration of binarization results achieved for various methods (left) and different size of the neighborhood in adaptive Bradley method (right).
Electronics 12 02449 g005
Figure 6. Sample binarization results obtained using the proposed pixel voting approach.
Electronics 12 02449 g006
Table 1. The results of the performance tests conducted for the OCR engines.
OCR EngineAverage Levenshtein Distance
Tesseract27.63
GOCR29.33
CuneiForm38.24
Kraken31.12
A9T936.40
Table 2. The average Levehnshtein distance obtained for 273 images used in experiments for various binarization methods and various size of the local neighborhood (where applicable); bold fonts indicate the best result for each method.
Neighborhood Size (for Adaptive Methods)
Method 11 × 11 21 × 21 31 × 31 41 × 41 51 × 51 61 × 61 71 × 71 81 × 81
Global25.63
Otsu [25]29.43
Bernsen [26]23.77
Entropy filtering [33]20.92
Stack of regions [34]37.01
Resampling [35]24.95
Liedes25.27
Bradley [27]22.7022.6422.4422.1321.9421.9821.5021.67
Feng [29]26.7323.8524.5025.0024.8622.2723.5525.16
Niblack [28]24.3024.1923.6523.6023.4223.8025.4325.60
Sauvola [44]24.1524.1523.5923.7423.3323.0823.2224.69
Wolf [45]24.3624.2823.5924.1824.3624.0124.2324.20
NICK [31]24.3224.5924.2124.2924.1823.8223.3624.19
Van Herk [46]24.3124.3223.9324.3724.1124.2624.1424.21
Table 3. The results obtained using the proposed pixel voting for various number of binarization methods; the best result is shown in bold font.
Number of AlgorithmsAverage Levenshtein Distance
1122.74
922.03
721.13
519.32
322.07
Table 4. The results of the ablation study.
Removed Processing StepAverage Levenshtein
Distance
Change
none—full processing pipeline19.32
image straightening20.144.2%
image scaling24.7928.3%
binarization26.9839.6%
morphological border cleaning19.742.2%
morphological noise removal19.561.2%
Disclaimer/Publisher’s Note: The statements, opinions and data contained in all publications are solely those of the individual author(s) and contributor(s) and not of MDPI and/or the editor(s). MDPI and/or the editor(s) disclaim responsibility for any injury to people or property resulting from any ideas, methods, instructions or products referred to in the content.

