Article

Early-Stage Lung Tumor Detection Based on Super-Wideband Microwave Reflectometry

1
Department of Electrical and Electronic Engineering, Auckland University of Technology, Auckland 1010, New Zealand
2
Biomedical Device Innovation Center, Shenzhen Technology University, Shenzhen 518118, China
3
Hardware Engineering Department, Services and Connectivity Division, Honeywell Aerospace, Yeovil BA20 2YD, UK
*
Author to whom correspondence should be addressed.
Electronics 2023, 12(1), 36; https://doi.org/10.3390/electronics12010036
Submission received: 7 November 2022 / Revised: 17 December 2022 / Accepted: 19 December 2022 / Published: 22 December 2022
(This article belongs to the Special Issue New Technologies for Biomedical Circuits and Systems)

Abstract

:
This paper aims to detect early-stage lung tumors in deep-seated and superficial locations, and to precisely measure the size of the detected tumor using non-invasive microwave reflectometry over a super-wideband (SWB) frequency range. Human lung phantom and lung tumors are modeled using a multi-layer concentric cylinder structure and spherical-shaped inclusions, respectively. Firstly, a study on the dielectric properties of human torso tissues is carried out over an SWB frequency range of 1–25 GHz based on the Cole–Cole dispersion model. Intensive full-wave simulations of the modeled phantom under irradiation by a custom-designed SWB antenna array are then performed. Results show that small tumor sizes from 5 mm radius in both deep-seated and superficial locations of the lung tissue can be detected based on the contrast of reflection coefficients and reconstructed images produced from backscattered signals between normal and anomalous tissues. The potential of using SWB microwave reflectometry to successfully detect the lung tumors in their early stages and at different depths of the lung tissue has been demonstrated.

1. Introduction

Lung cancer is one of the most prevalent cancers in the world. Different stages of this disease are medically identified based on the tumor size and spread of abnormal cell growth in the human body. In the first stage of lung cancer, the tumor size is small and has not spread to any lymph nodes. Early-stage detection of lung cancer enables higher success rates of treatment and prevents the cancerous tissues from further spreading [1,2]. Meanwhile, screening modalities, such as computed tomography (CT) scans and X-ray devices, are one of the diagnostic methods used in revealing lung cancer and for periodic monitoring during the treatment journey. However, the cumulative exposure of patients to such ionizing radiation may result in cancer cell growth and spread. On the other hand, CT image-guided lung biopsy surgery is an invasive detection method that may also pose some risks of complications during or after the surgery [3]. Therefore, there is a critical need to develop a safer, and yet affordable, diagnostic tool for lung cancer detection [4].
Recently, medical imaging based on microwave reflectometry has attracted significant interest as a non-invasive technique for detection of different serious diseases such as breast cancer [5,6,7], brain stroke and tumor [8,9,10,11], chest fluid accumulation [12,13,14], and skin cancer [15,16], and for frequent post-surgery monitoring due to its being low-cost and safe from harmful radiation [17]. Comparatively, fewer works have explored microwave reflectometry for lung cancer detection [18,19,20,21,22,23], in particular for lung tumor in deep-seated locations. In [18], the authors investigated the use of microwave reflectometry in the frequency range of 1.5–3 GHz for lung cancer detection based on the distribution of scattered fields in the imaging domain. However, the detection was performed using a low-gain slot-rotated antenna for detecting tumors in superficial locations with no capability to determine their sizes. In [19], another similar study was conducted but using a small lung phantom, which does not mimic the normal size of a human chest. The authors discussed the effects of lung exhalation/inhalation and selected 10 GHz as the resonant frequency for tumor detection. However, the images of the two superficially placed tumor inclusions were barely distinguishable due to the low resolution of the reconstructed images caused by weak signal penetration inside the phantom. On the other hand, a life-size phantom of a human chest was introduced in [20] and tested using off-the-shelf antennas. However, the phantom was utilized based on tissue equivalent liquids, which does not mimic the anatomical structure and real dielectric properties of human torso tissues. The authors in [21] studied lung tumor detection over 3–4 GHz frequency range using a spherical tumor placed at a depth of 60 mm inside a small square-shaped lung phantom. The results showed that tumors of radius 4 mm and 10 mm can be detected. However, simulations were performed using a single antenna in front of a non-realistic rectangular lung phantom shape with very small size (60 × 60 × 101 mm3) and at a superficial location. In Reference [22], lung tumor detection is investigated using directional elliptical patch antenna operating in a frequency range of 3–10.7 GHz. Simulations were performed using a rectangle-shaped lung phantom with a dimension of 300 × 133 × 130 mm3 and a square-shape lung tumor inclusion. However, this study included a lung phantom without a rib bone layer and the reflection coefficient results were not clear in terms of detecting tumors at superficial depth. Another study in [23] proposed a cupcake-shaped antenna operating in the frequency range of 2.9–12 GHz for lung tumor detection. It was found that the antenna can detect lung cancer from stage II onwards. However, the simulation was again performed using a rectangular-shaped lung phantom without a rib bone layer. Moreover, the size of the proposed lung phantom (60 × 40 × 26.66 mm3) did not mimic the life-sized human torso.
To overcome the above issues in lung cancer detection, this paper proposes the use of the SWB microwave reflectometry technique for improved detection of lung tumors, particularly in their early stages, to increase the chance of a successful treatment. To the best of our knowledge, no previous study has investigated the detection of lung tumors in both deep and superficial positions based on the variance of their backscattered signals from all antenna elements as demonstrated in this work. The key contributions of this paper are:
  • Studying the dielectric properties of human torso tissues over a super-wideband (SWB) frequency range.
  • Custom designing antennas for SWB microwave reflectometry to detect early-stage lung tumors in deep-seated and superficial locations.
  • Enhancing the resolution of reconstructed tumor images using backscattering datasets acquired over a super-wide frequency range.
  • Demonstrating for the first time, the potential of SWB microwave reflectometry in precisely determining the size of early-stage tumors, even in deep locations.
The rest of this paper is organized as follows. Section 2 reviews the related works. Section 3 investigates the human torso dielectric properties over the SWB frequency range. Section 4 models the human lung phantom and determines the optimal separation distance between antenna elements and the lung phantom. Section 5 simulates the lung phantom embedded with tumors at various locations and discusses the reflection coefficient results. The corresponding imaging results for deep-seated lung tumor are presented in Section 6. Finally, Section 7 concludes the paper.

2. Related Works

Generally, microwave reflectometry techniques are based on the dielectric contrast between healthy and unhealthy tissues due to the biological difference between normal and anomalous cells. Their performance depends highly on the employed antenna, which is considered the key element in transmitting and receiving the backscattered signals from the target object. The antenna’s parameters, such as operating frequency range (bandwidth), peak gain, radiation efficiency, and radiation pattern, are the leading factors that determine the capability and efficiency of microwave reflectometry systems. A large, covered bandwidth with low S11 level (<−20 dB), high peak gain, and stable radiation pattern are the utmost desired characteristics when designing the system’s antenna [24]. Several cancer types can be detected using microwave reflectometry, with a proper selection of the operating frequency required for signal penetration into human tissues. Previous studies found that the best operating frequency range for detecting deep cancer types such as breast, brain, and lung cancers is between 1 and 5 GHz to achieve good penetration and accurate detection. In [25], the authors proposed two arrays with rectangular and spiral antennas with operating frequencies between 2 and 4 GHz for breast cancer detection. In [26], a reconfigurable metamaterial antenna was proposed and tested over the frequency range 2.5–3.2 GHz, similar for breast cancer detection. An ultra-wideband (UWB) antenna was further proposed in [27] to detect breast tumor over 2.3–11 GHz.
On the other hand, several researchers have studied the antenna types and frequency ranges for detecting brain injuries (stroke, hemorrhages, and tumors). In Reference [28], the authors proposed a portable three-dimensional (3D) metamaterial antenna structure operating in the frequency range of 1.12–2.5 GHz to detect brain hemorrhage. A wearable head imaging system based on microwave reflectometry was presented in [29] with 12 antenna elements operating between 1 and 4 GHz. The resolution of the imaging system is highly related to the employment of large bandwidths and high frequencies. With high frequencies, a reduced penetration will be obtained, which is preferable for shallow cancer types such as skin cancer, where the required penetration inside human tissues is only a few millimeters (mm) [30]. Several enhancements to the antenna design in microwave reflectometry have also been introduced to improve system proficiency. Recent studies have incorporated UWB and SWB technologies in microwave reflectometry systems, leveraging on their high data rate, interference immunity, low profile, and cost-effective properties [31,32,33]. Tumor detection based on the contrast of reflection coefficients was introduced in [34,35] for quick detection of head strokes with promising results.

3. Investigation of Human Torso Dielectric Properties

This research study has been accomplished in three work stages (WSs), as depicted in Figure 1. The first stage (WS1) conducted a study into the Cole–Cole dispersion model [36] to obtain the dielectric properties of human torso tissues over the SWB frequency range between 1 and 25 GHz. In WS2, two cylindrical structures were designed using a High-Frequency Structural Simulator (HFSS) to model healthy and unhealthy (cancerous) instances of human lung based on the obtained dielectric properties from WS1. Finally, in WS3, we studied the effects of different tumor locations (deep-seated and superficial) on the tumor detection performance by the SWB microwave reflectometry system.
Because radio frequency (RF) signals can penetrate various human body layers with different dielectric characteristics, it is crucial to design a precise human tissue model to assess the backscattered signals from different tissue layers reliably. In this study, a human lung phantom has been modeled using five cylindrical layers: skin, fat, muscle, rib bone (cancellous), and lung (inflated). Each layer has specific thickness and frequency-dependent dielectric properties that can be found over our frequency range of interest (1–25 GHz) for the proposed SWB microwave reflectometry system using the well-known Cole–Cole model [37] based on the experimental data of human tissues. The Cole–Cole model has four dispersion regions with different relaxation parameters that could depict the superposition of different relaxation processes of biological structure. So far, very few studies have been conducted on the dielectric properties of torso tissues over the SWB frequency range.
The dielectric properties of human tissues vary with signal frequency due to the frequency-dependent polarization of atoms, electrons, and ions caused by the E-fields in tissues. The following Cole–Cole equation can describe the frequency dispersion of the dielectric properties of human tissues:
ε ( ω ) = ε 0     ( ε r j   σ ω ε 0 ) = ε s   ( n ) + n Δ ε n 1 + ( j ω τ n ) 1 ( 1 α n ) + σ i j ω ε 0
where ε ,   ε r , and ε 0   are the relative complex permittivity, relative permittivity, and free space permittivity, respectively; σ i is the static ionic conductivity; ε s   ( n ) , τ n , and α n are the static permittivity, relaxation time, and distribution parameter (a measure of dispersion broadening), respectively, where n = {1…4} is the index representing each of the four dispersion types in human tissues; and ∆ ε n = ε s   ( n + 1 ) ε s   ( n )   denotes the dispersion magnitude. Using the parameter values in Table 1 for each tissue of the human torso [38,39], their corresponding dielectric properties can be found using the Cole–Cole equation.
The complex relative permittivity, ε ( ω ) , of each layer can be represented as   ε r j ε r , where   ε r and ε r are the real part and the imaginary part, respectively, and their ratio ( ε r / ε r ) is defined as the loss tangent, tanδ, of each layer. Based on the above model, increasing the frequency decreases the relative permittivity but increases the conductivity and loss tangent. From the above relations, the dielectric properties of unhealthy tissue (tumor) will be higher than healthy tissue due to their higher fluid content. The relative permittivity ( ε r ) , conductivity σ (S/m), loss factor ( ε r ), and loss tangent, tanδ, in the frequency range of interest (1−25 GHz) can be predicted as shown in Figure 2. The numerically obtained results for dielectric properties of human torso tissues are then compared with those measured in [37] at different frequency points, and a very good consistency is observed between them. Consequently, our results have addressed a knowledge gap in the investigation of human torso dielectric properties over the SWB frequency range.

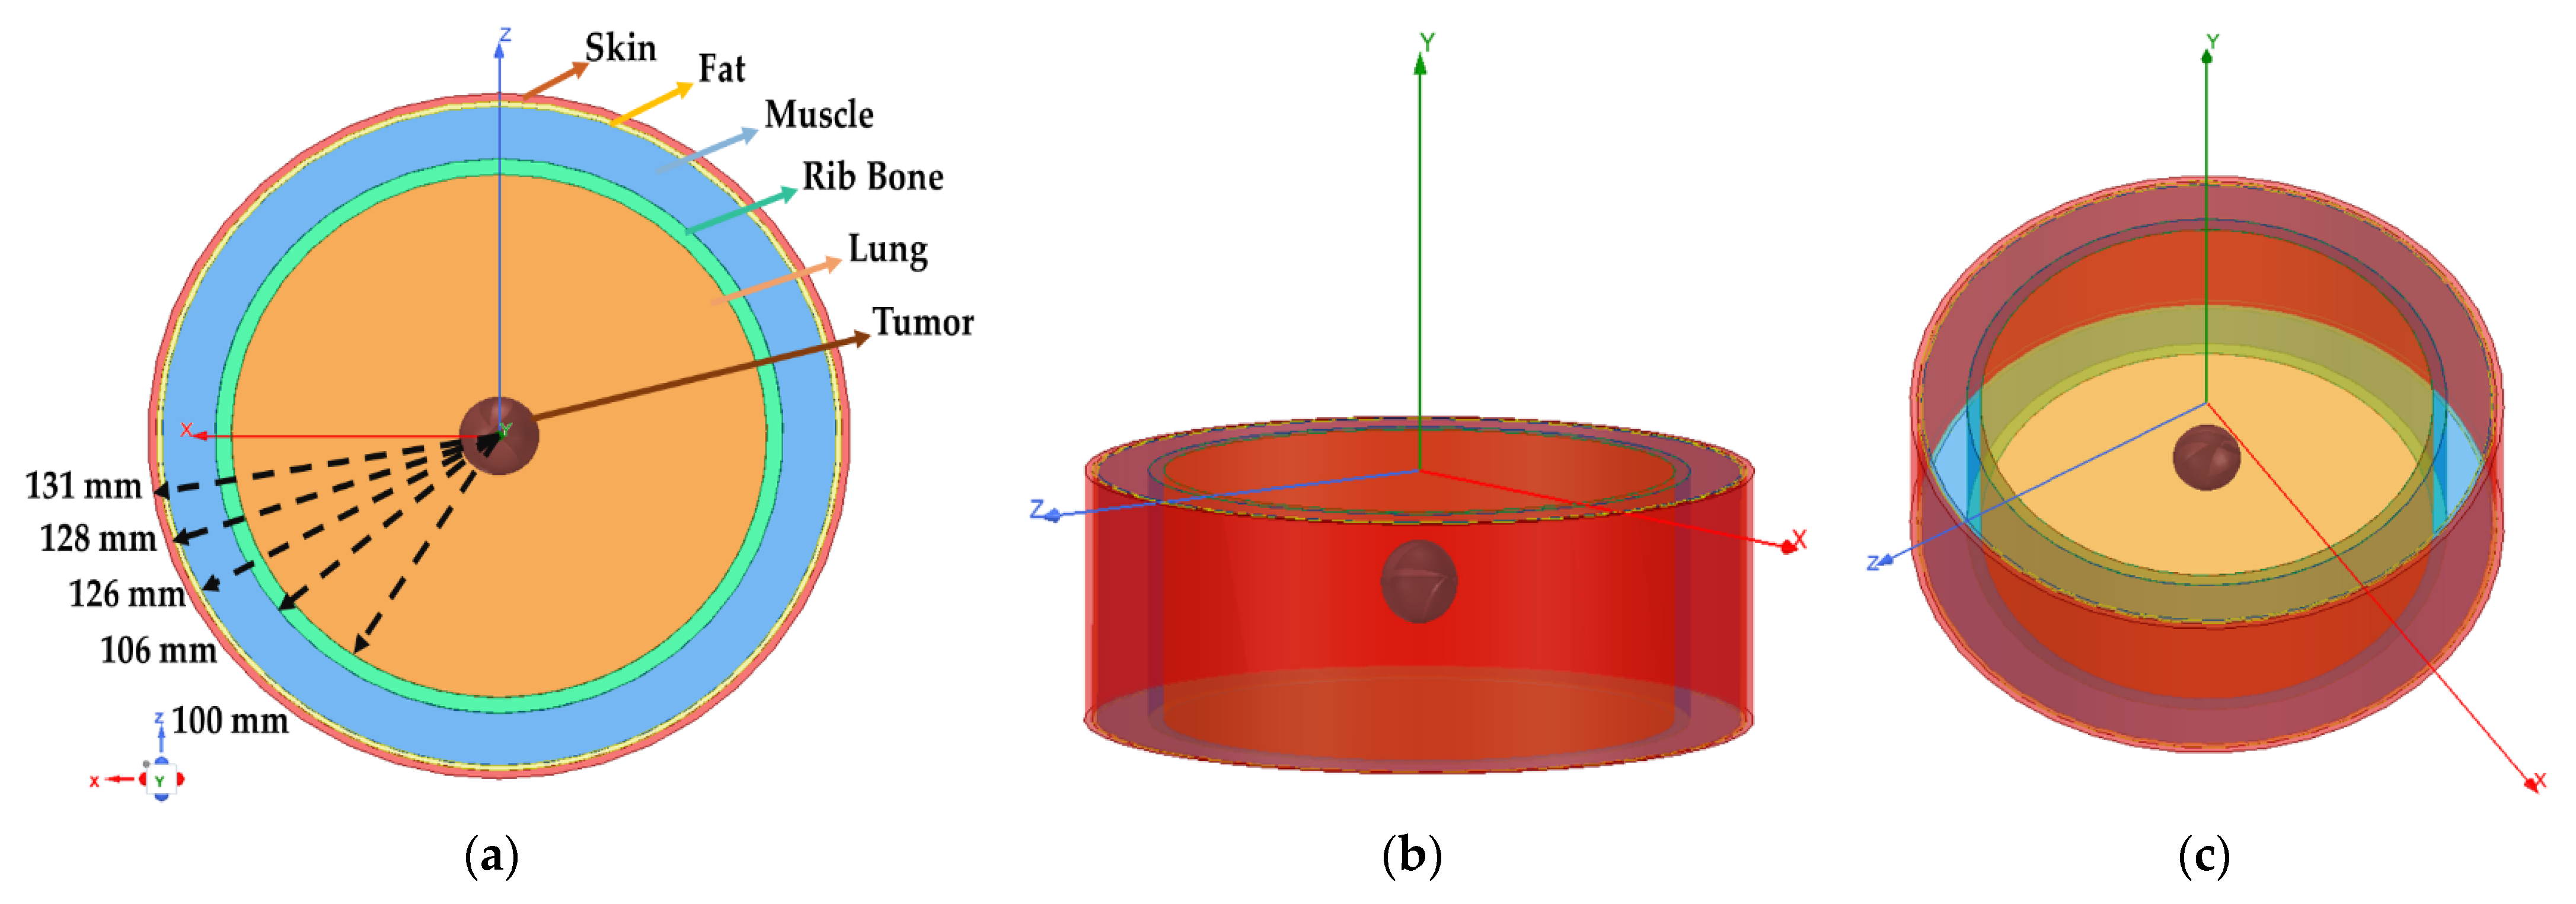
4. Modeling of Human Lung Phantom

In the literature, few works on lung cancer detection using microwave reflectometry can be found due to several limitations. One of them is the lack of studies on lung tissue dielectric properties. Another is the complexity of the torso tissue layers, which makes detection based on RF backscattered signals challenging. In this study, we chose 3.8 GHz as the signal frequency for lung cancer detection based on the contrast of reflection coefficients, as it provides good signal penetration into human tissues. The lung phantom was modeled as a concentric cylinder structure, each layer representing a single human torso tissue with properties given in Table 2. The lung phantom has dimensions of 82.31 cm circumference and 9 cm height, which mimic that of an adult human lung. In addition, a spherical inclusion of radius 5–15 mm was inserted into the phantom to represent an early-stage lung tumor, as shown in Figure 3.
In this section, the optimal separation distance between array antenna elements and the lung phantom boundary is also investigated. Several simulations have been conducted using different separation distances (5, 10, 15 mm) between array elements and lung phantom, along with simulation of array elements placed in free space. The results in Figure 4 show that the first resonant frequency of the array in free space occurs at 3.8 GHz, with a return loss of −32.31 dB. They also show that varying the distance between array elements and lung phantom will mainly affect the first resonant frequency and return loss level. For example, at 5 mm distance, the resonant frequency is shifted to a lower value of 3.6 GHz, and return loss worsens to −30.5 dB due to the higher reflections from the high-permittivity skin layer. These strong reflections represent a clutter that can easily mask the tumor, particularly when it is deep-seated and still small during the early stage of disease. Increasing the distance to 15 mm resulted in shifting the resonant frequency to 3.5 GHz, with a return loss of −48 dB. Here, skin reflections are mitigated, but the increased frequency shift mainly arises from the impedance mismatch between the antenna array and the lung phantom. On the other hand, at 10 mm distance, good impedance matching occurs at the boundary between lung phantom and array, with the first resonant frequency at 3.8 GHz (same as in free space) and return loss level of −36.14 dB. This represents the optimal separation distance that minimizes skin reflection effect while achieving good impedance matching with the lung phantom layer. All subsequent results were thus based on 10 mm separation distance in the simulation setup.

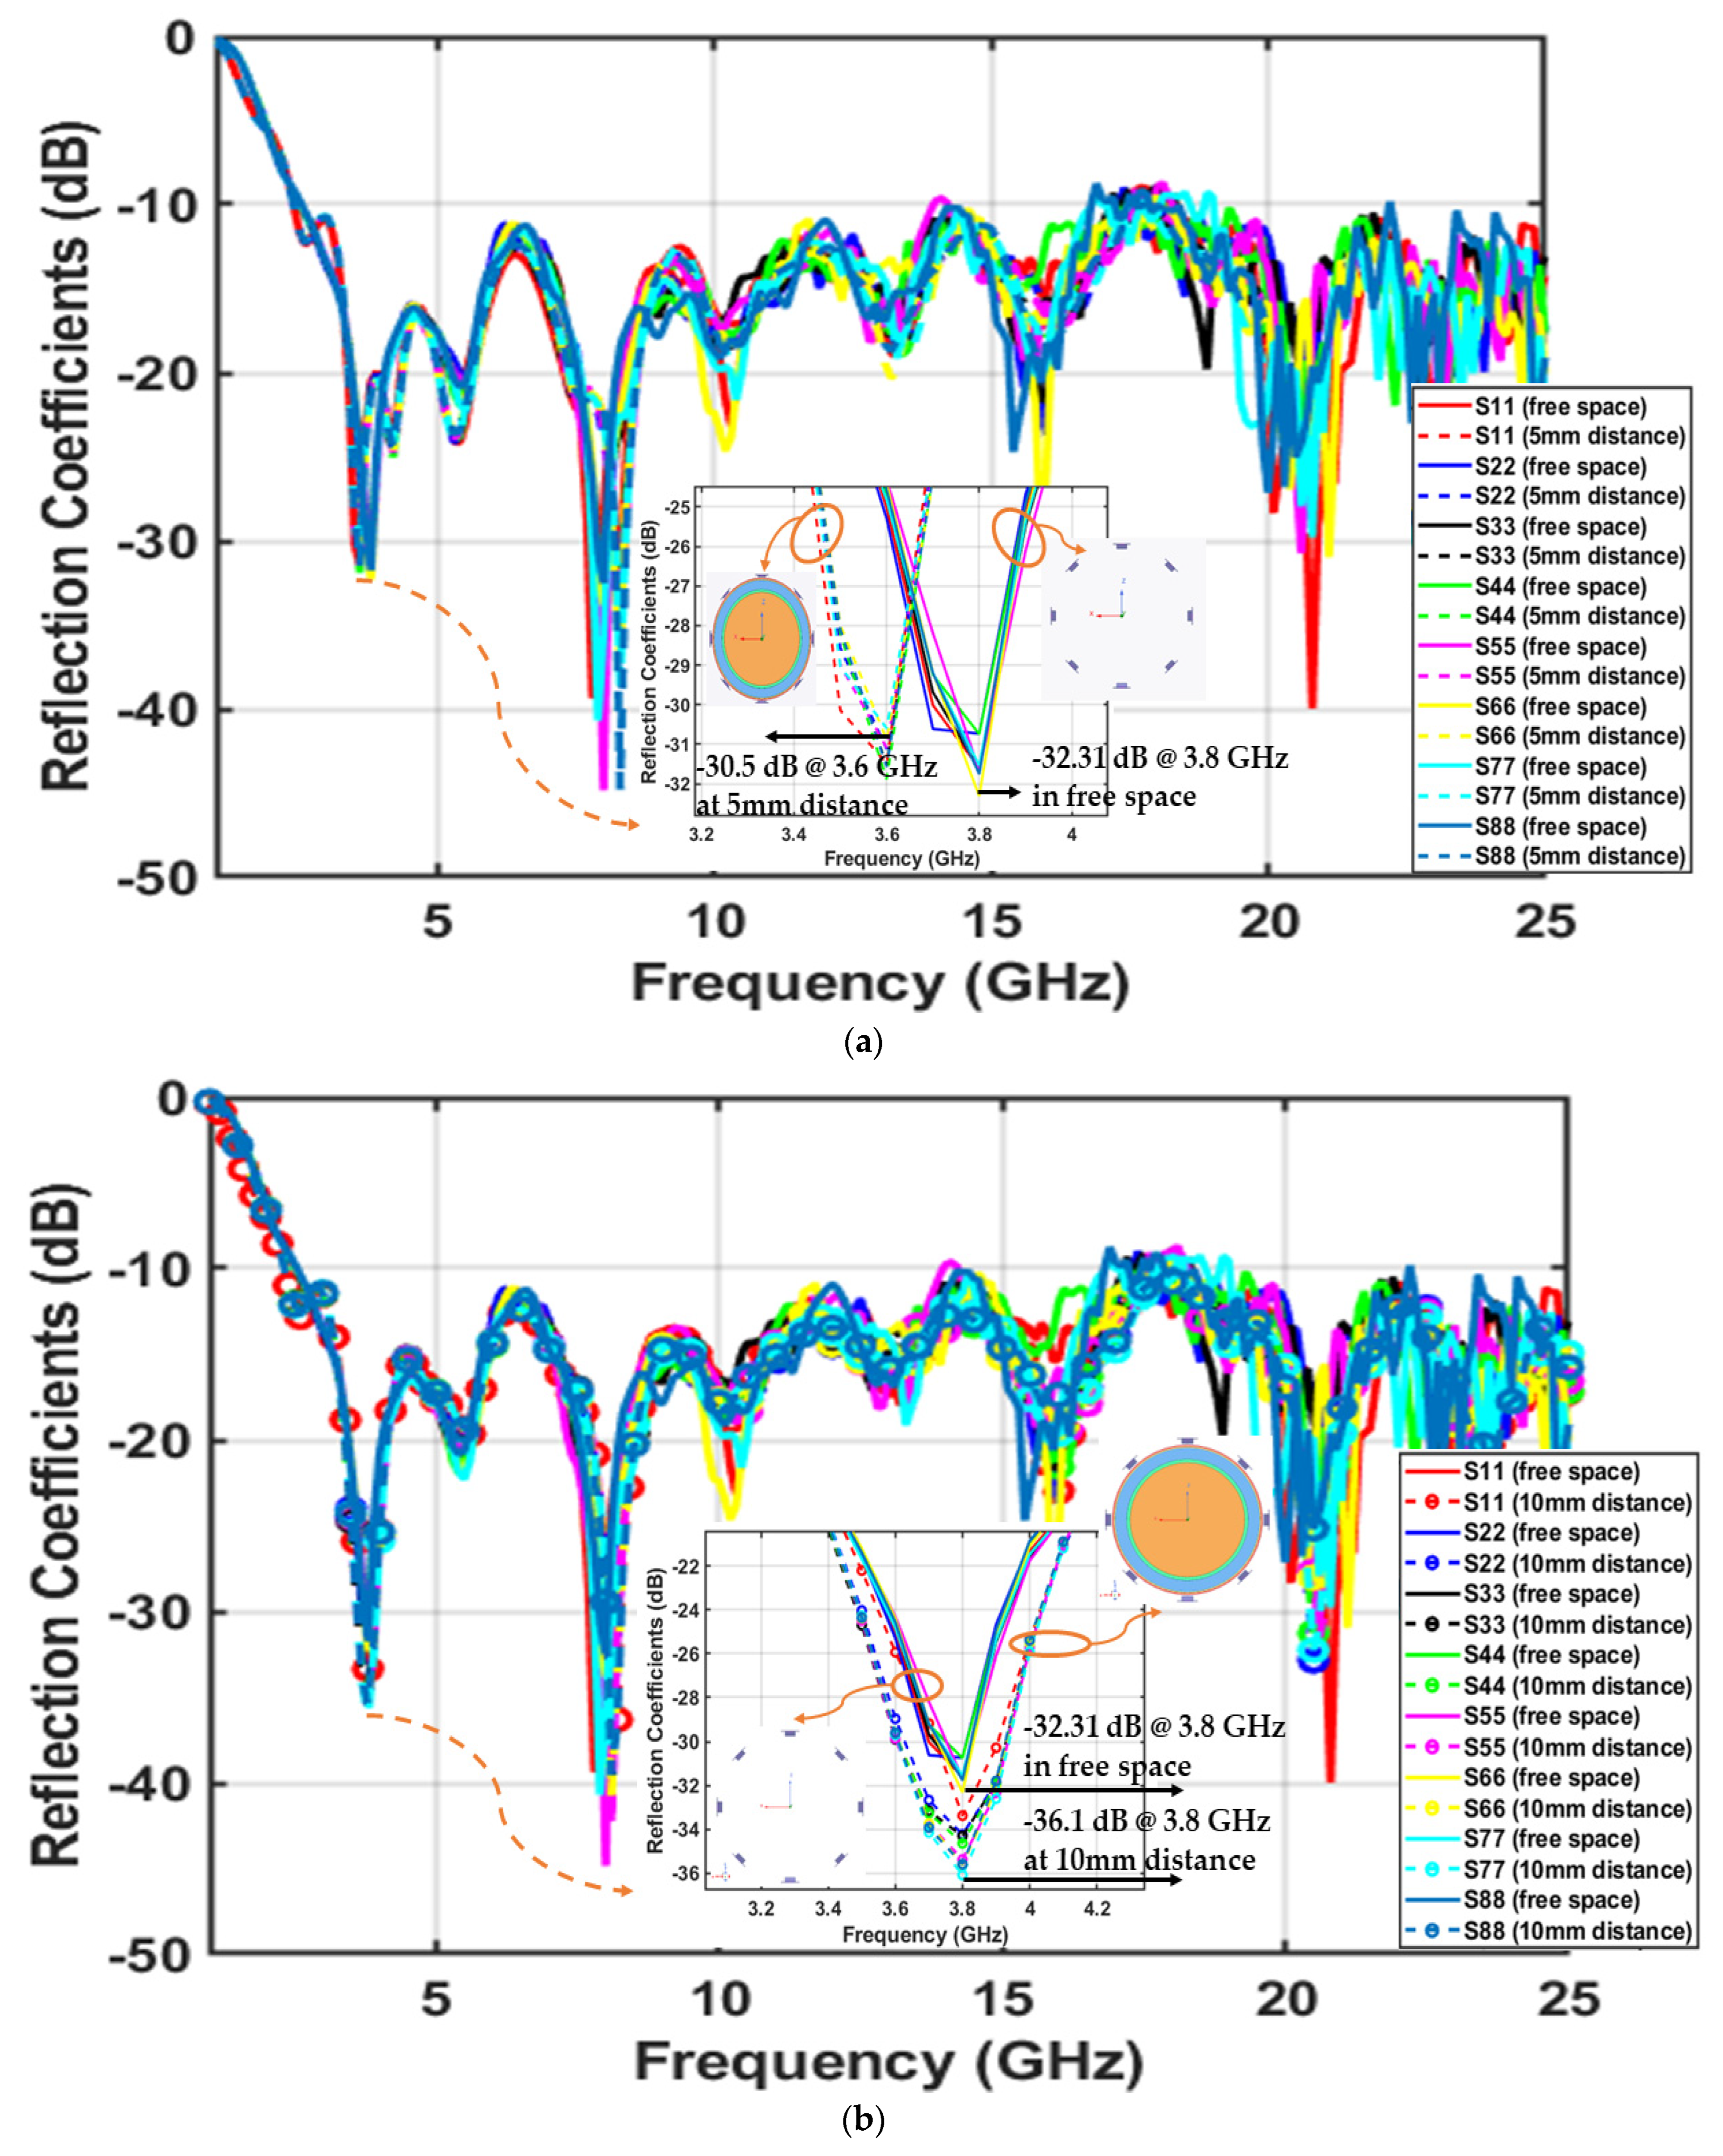
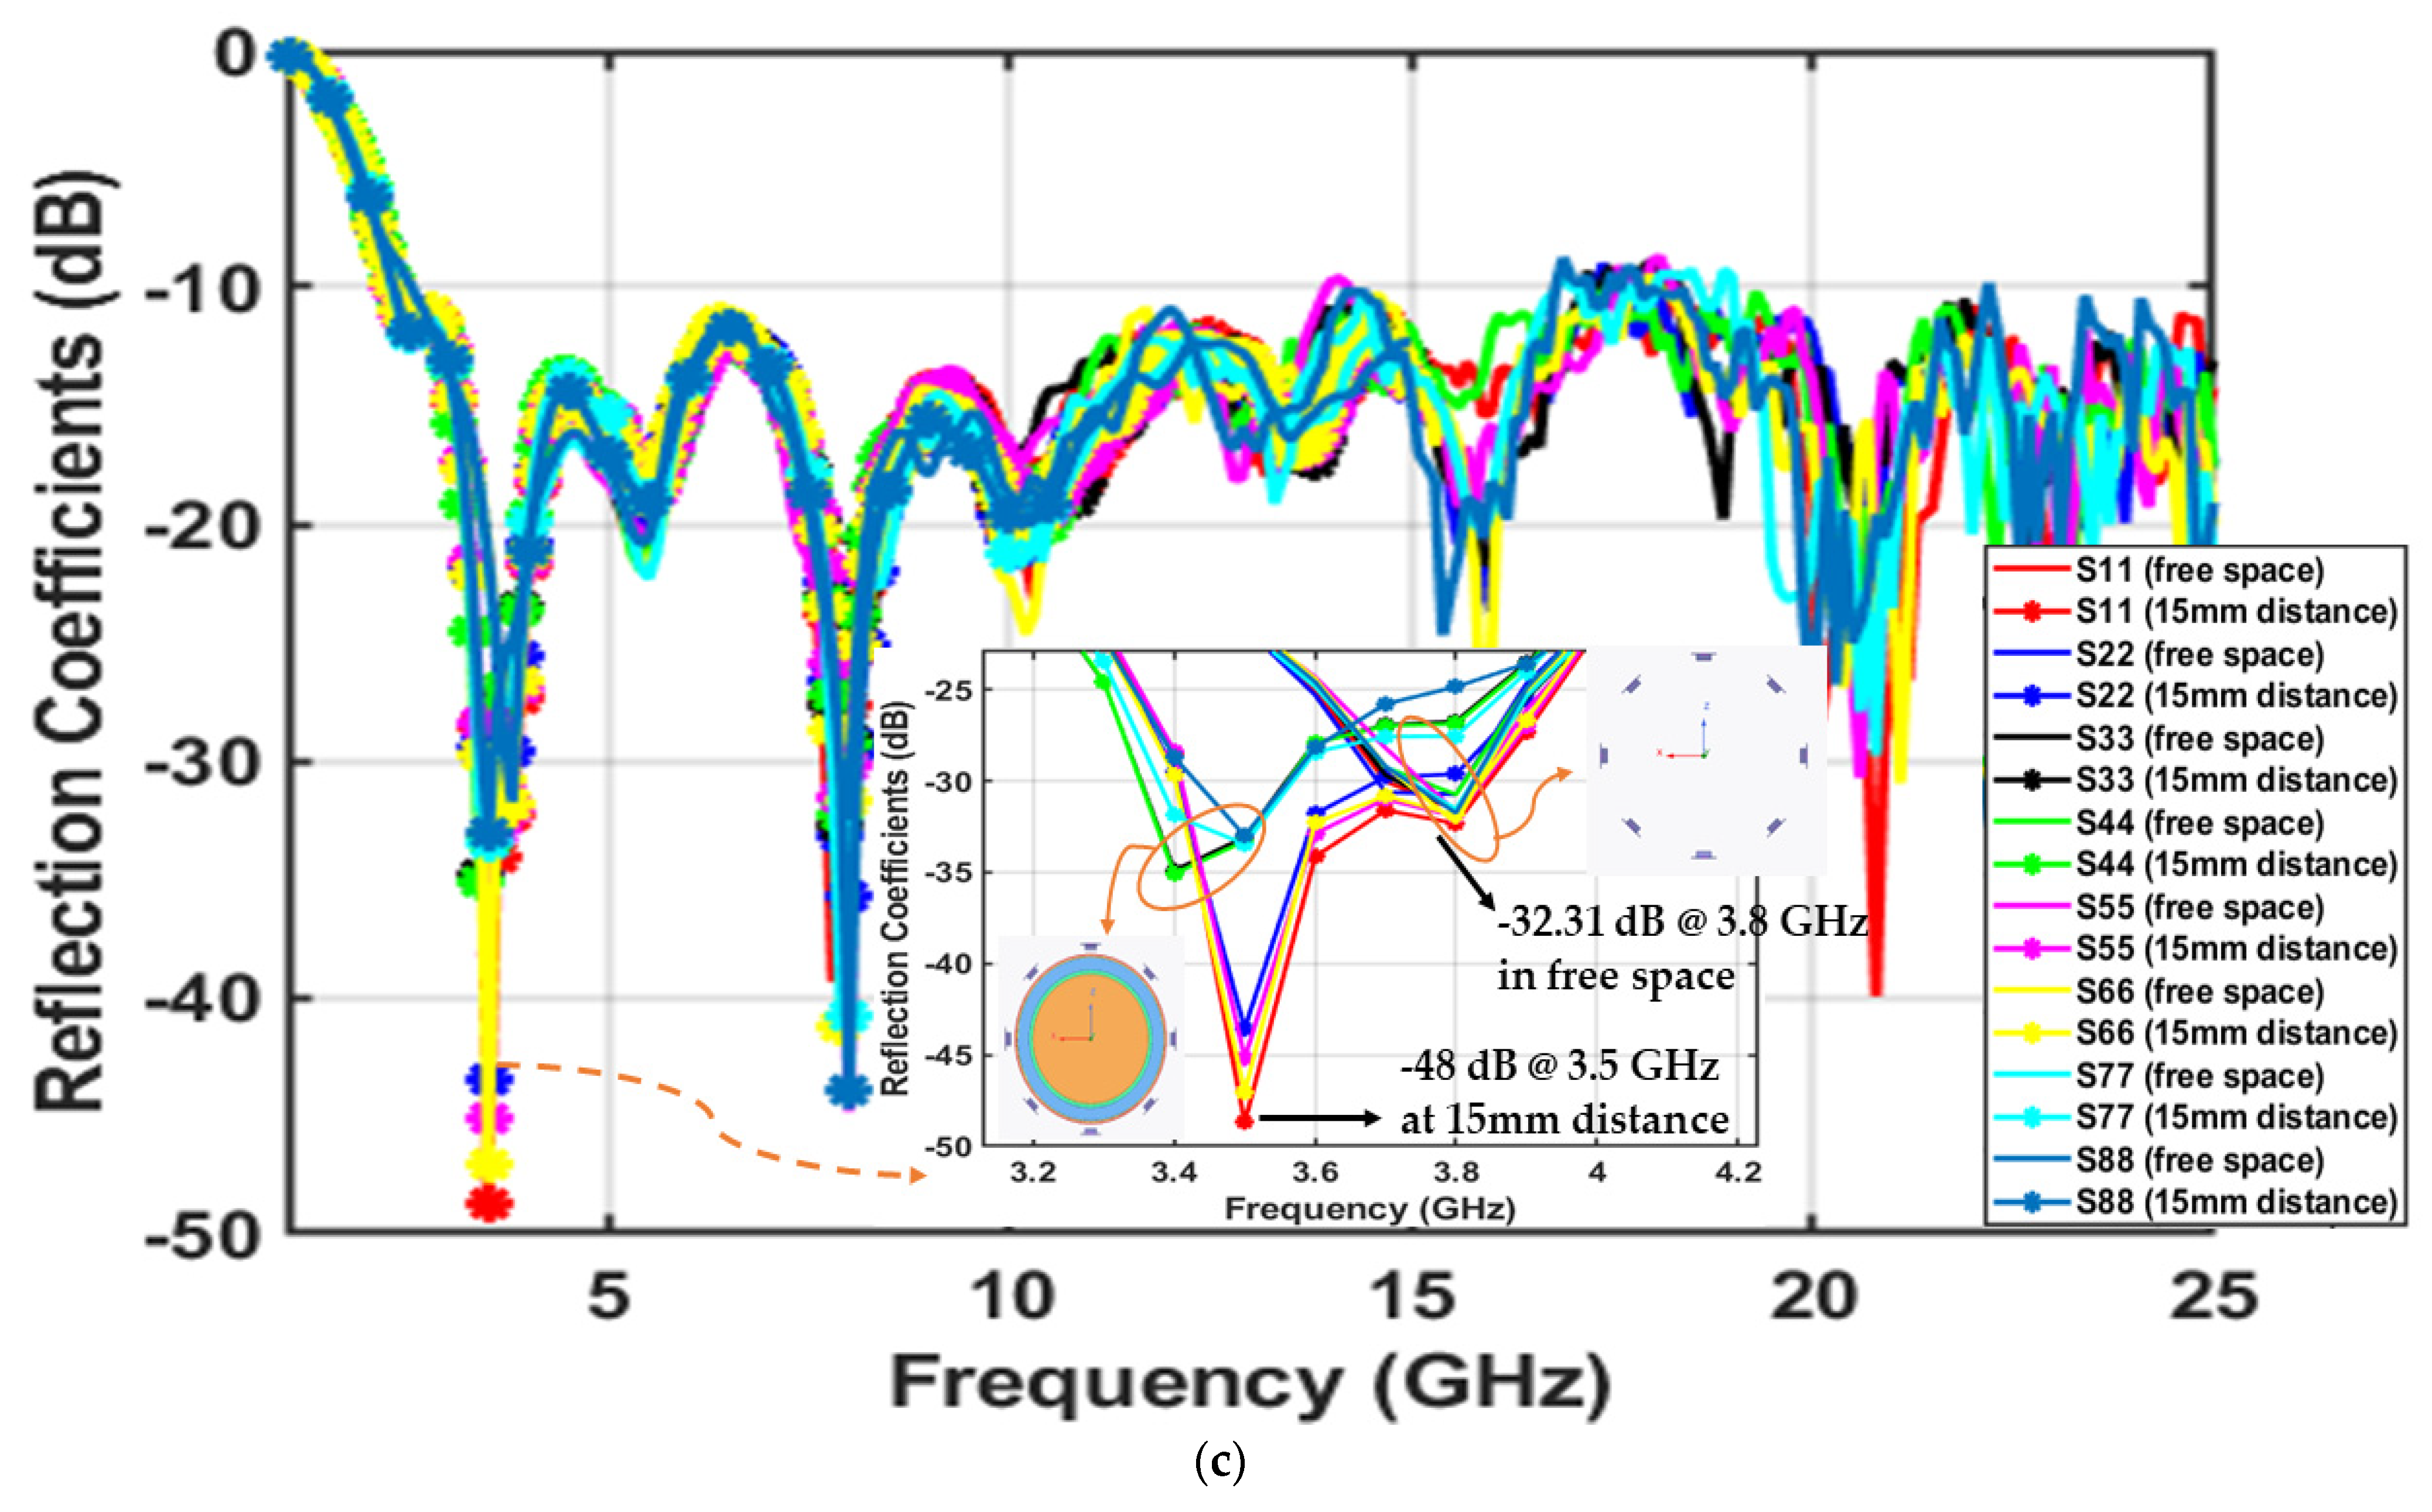
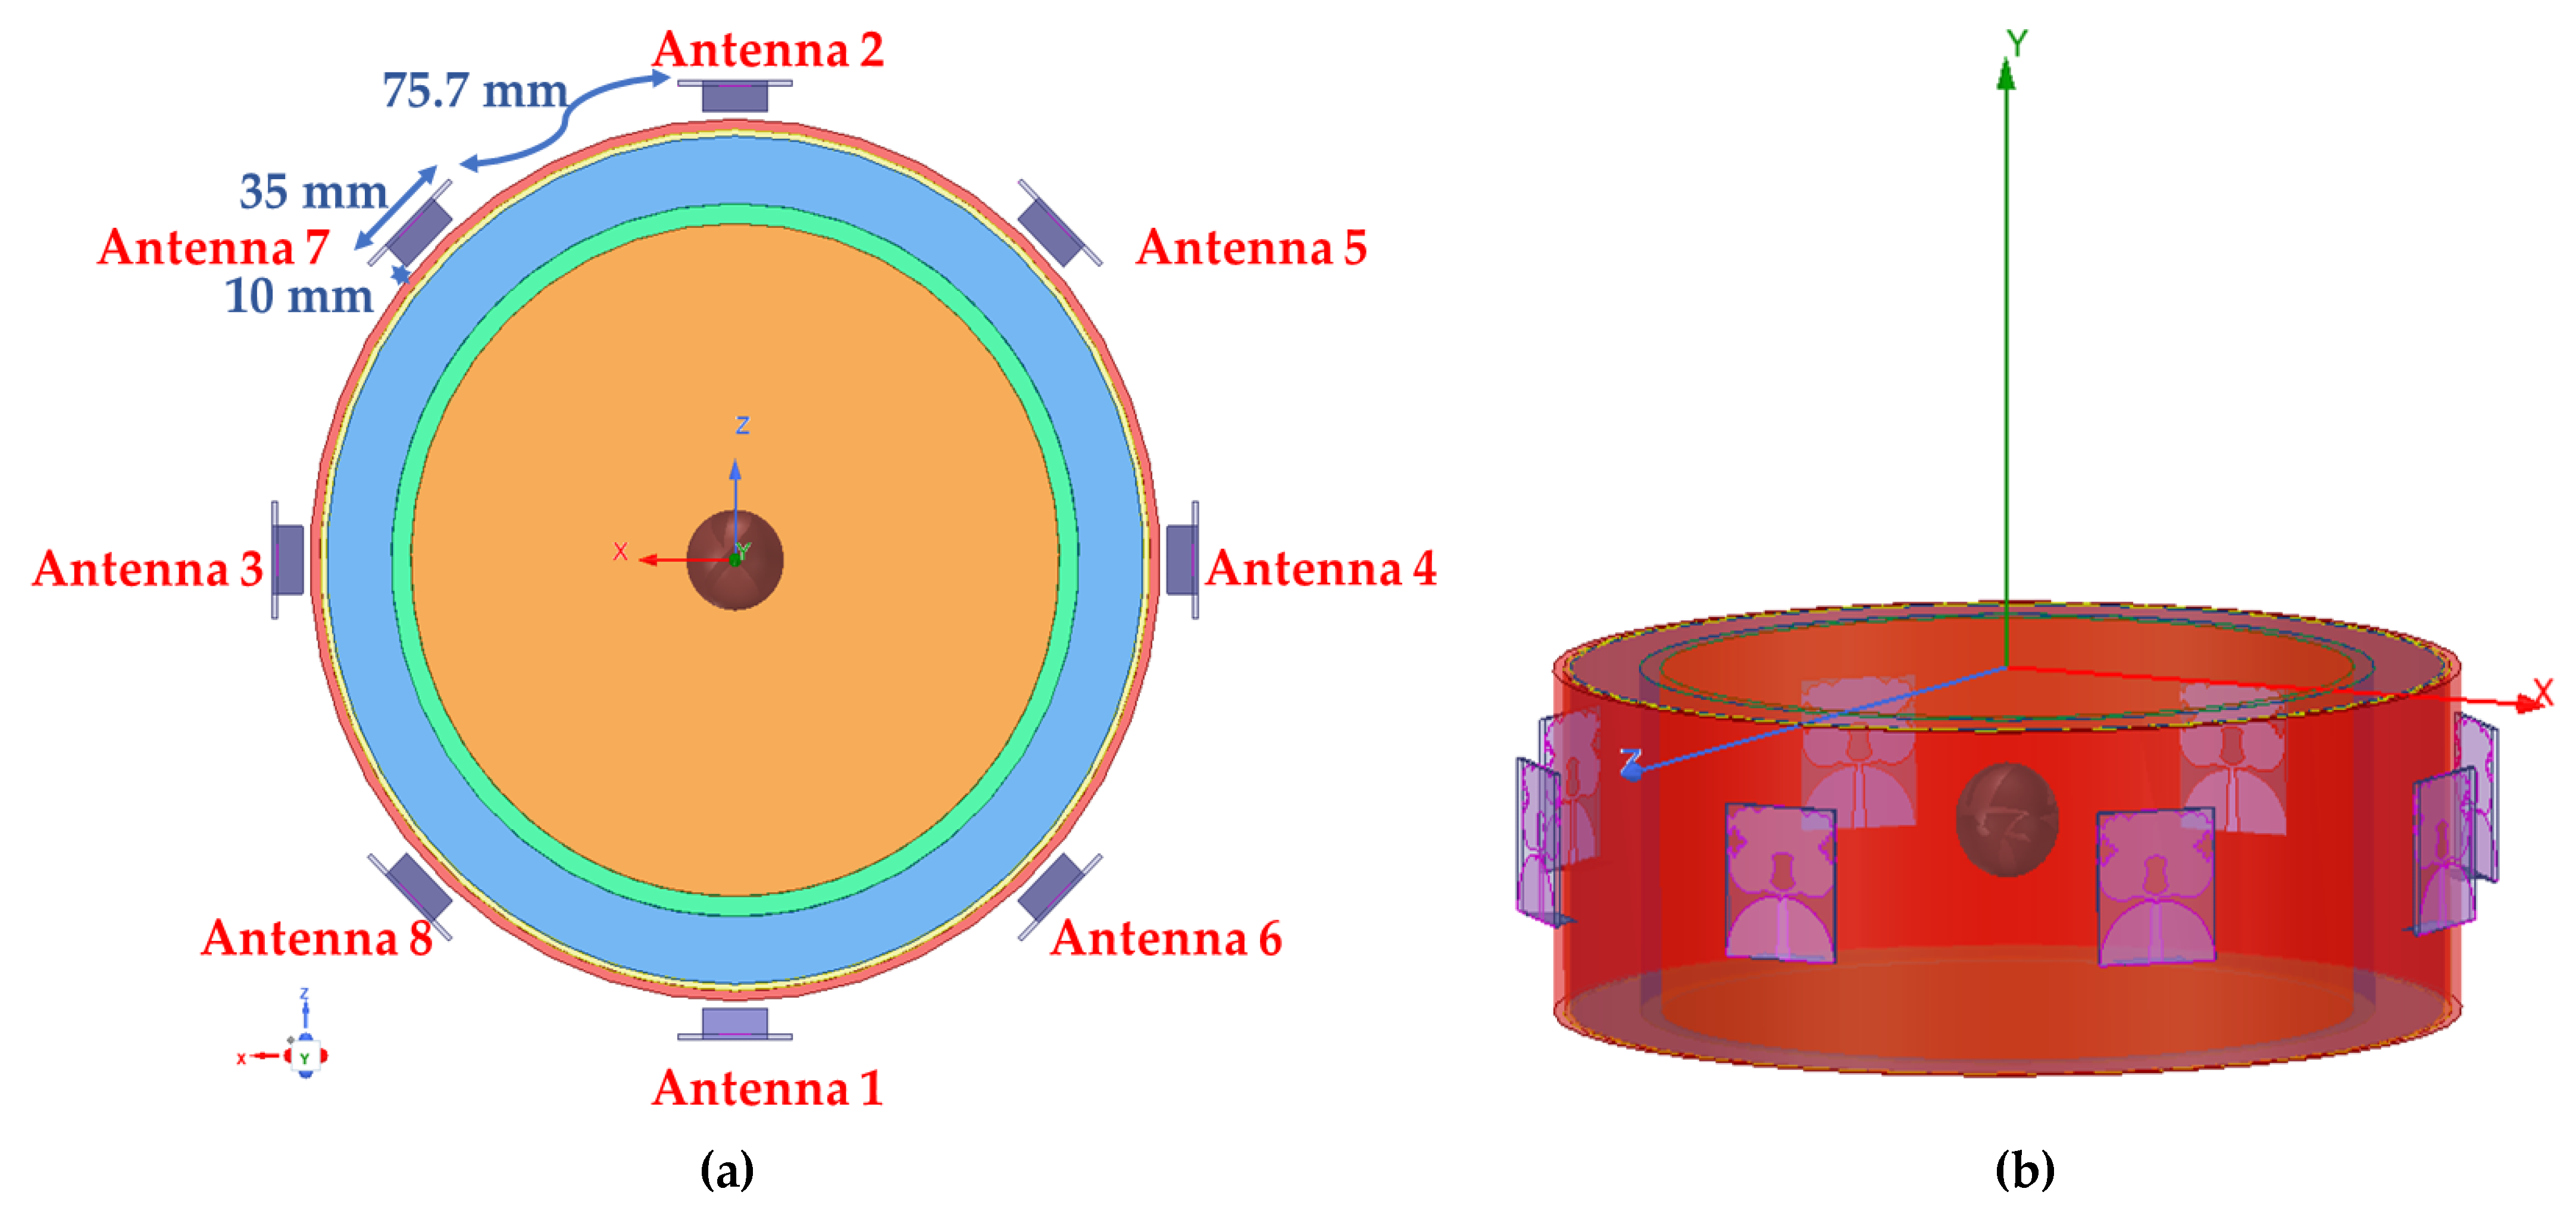
5. Lung Anomaly Detection Based on SWB Microwave Reflectometry

In this section, we will discuss the capability of the SWB microwave reflectometry system in detecting lung anomalies, which can be caused by cancer or other conditions. In this work, we consider the anomaly to be caused by an early-stage tumor of 15 mm radius at different locations of the lung. The detection setup consists of a custom-designed eight-element SWB antenna array [40] operating in the frequency range of 1–25 GHz, 12 dBi peak gain at boresight, and stable radiation pattern over the covered bandwidth. The proposed antenna resonates at 3.8 GHz, with a −36.2 dB return loss (|S11|). Figure 5 shows the setup configuration around the lung phantom at a 10 mm distance from the outermost skin layer. In pursuance of achieving low mutual coupling (<−20 dB) with enhanced isolation between adjacent array elements, the array elements are spaced 45˚ apart with 75.7 mm edge-to-edge separation between adjacent elements. Considering that the signal wavelength, λ, at 3.8 GHz is 78.9 mm, the spacing ratio between array elements is 75.7/78.9 = 0.959, which is approximately equal to λ.
Figure 6 shows the mutual coupling between the eight array elements in terms of their forward transmission coefficients. For improved readability, we plotted only the forward transmission coefficients from antenna 1 to all other array elements (2–8), as representative of the array’s transmission performance, because we found each of the other array elements exhibited a similar performance trend. The results confirm the low mutual coupling between adjacent array elements, resulting in high isolation. In fact, all transmission coefficients, Sij (where i and j = {1…8}; ij), between eight array elements are less than −30 dB over the covered bandwidth. Furthermore, the presence or absence of the tumor inclusion does not seem to impact the isolation performance.

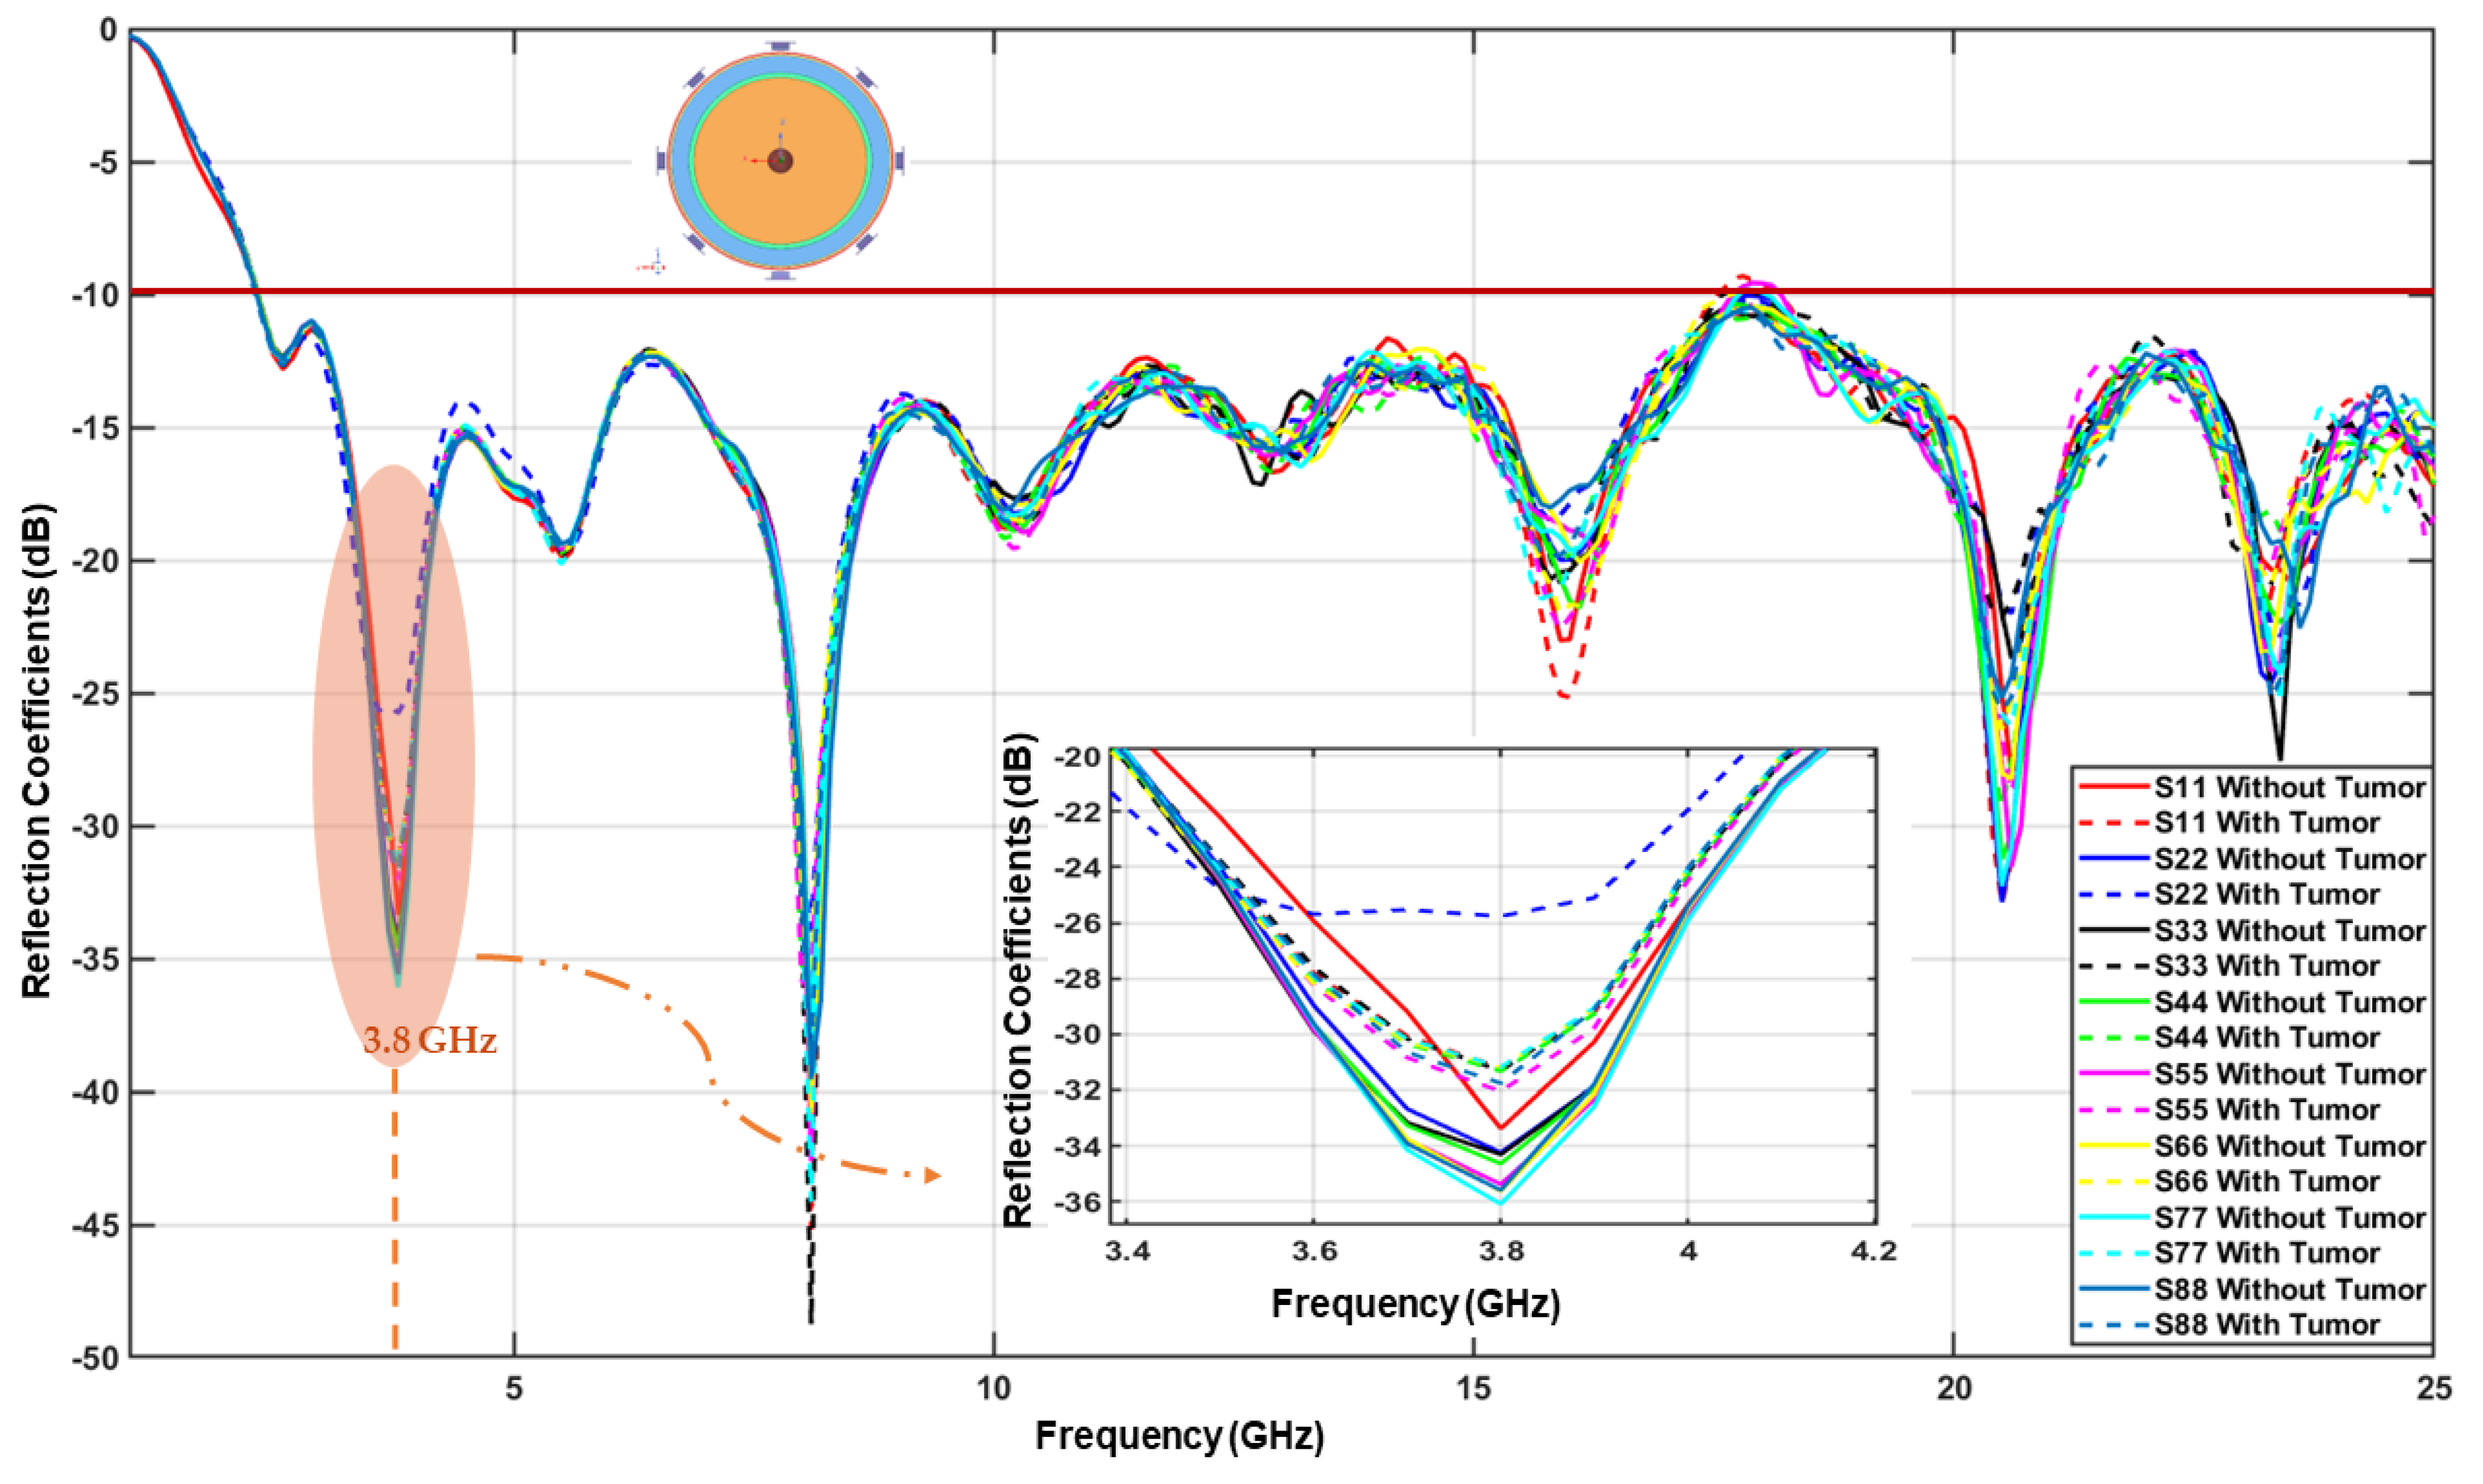
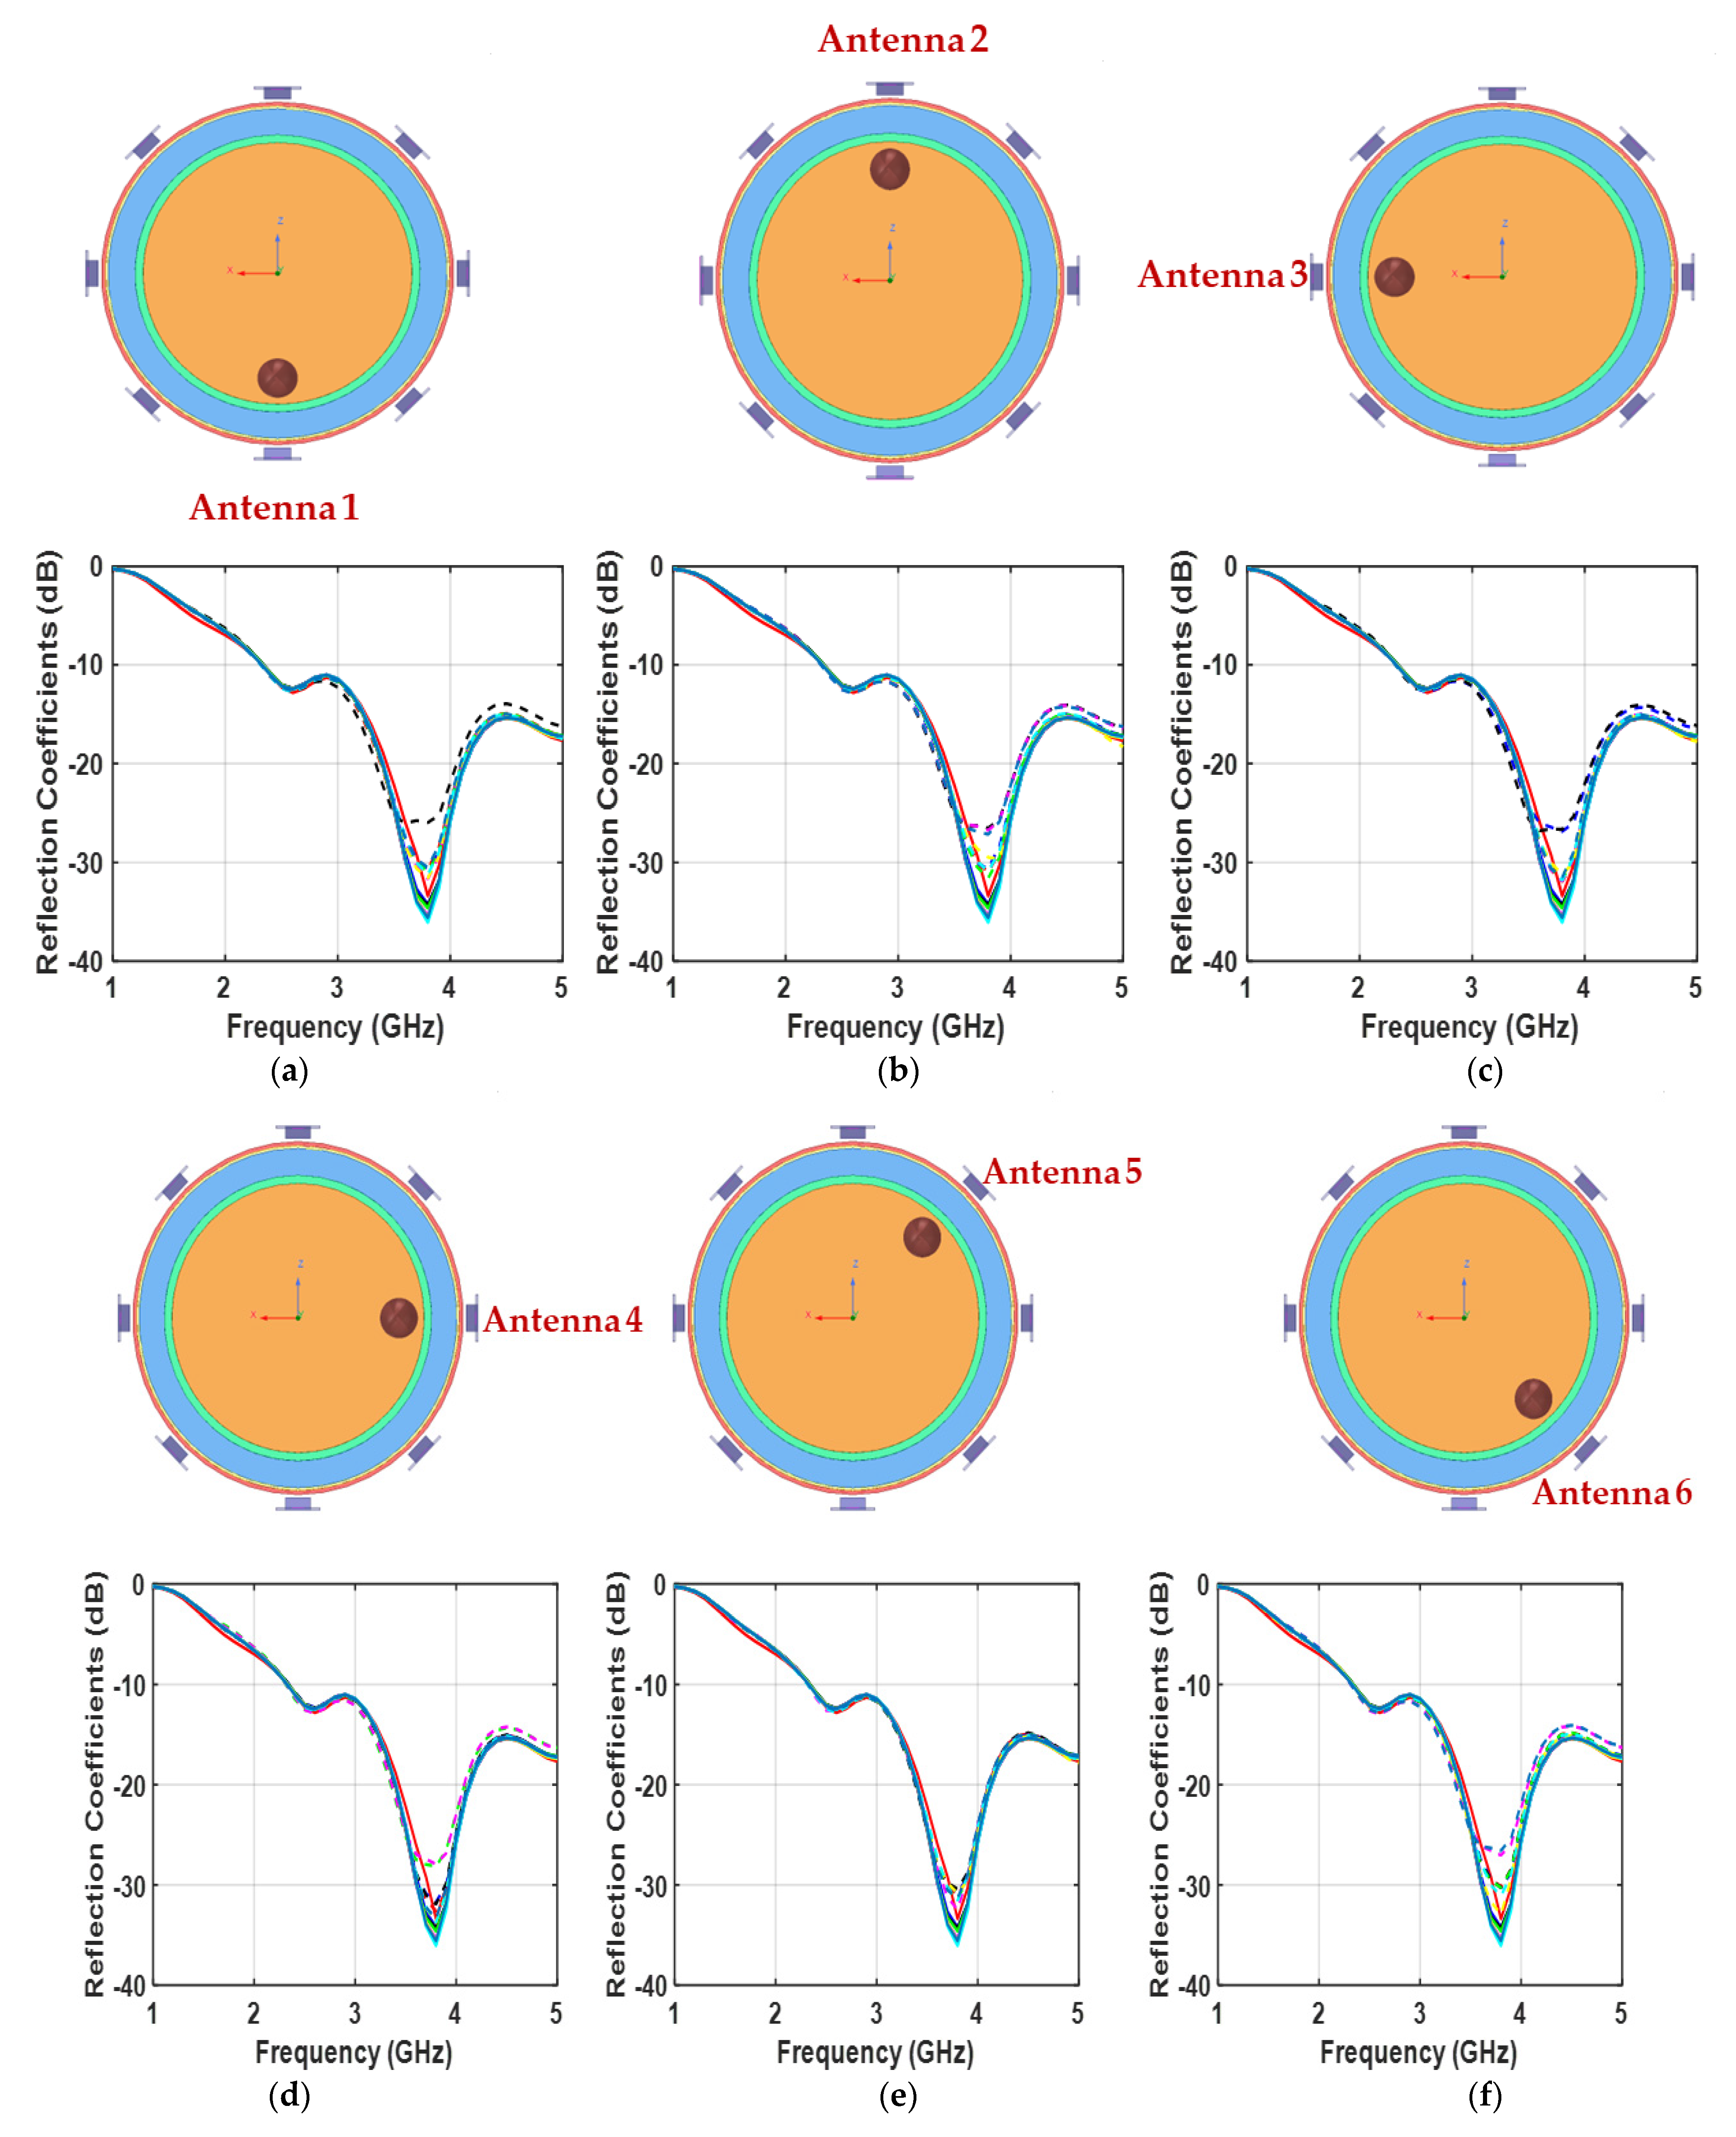
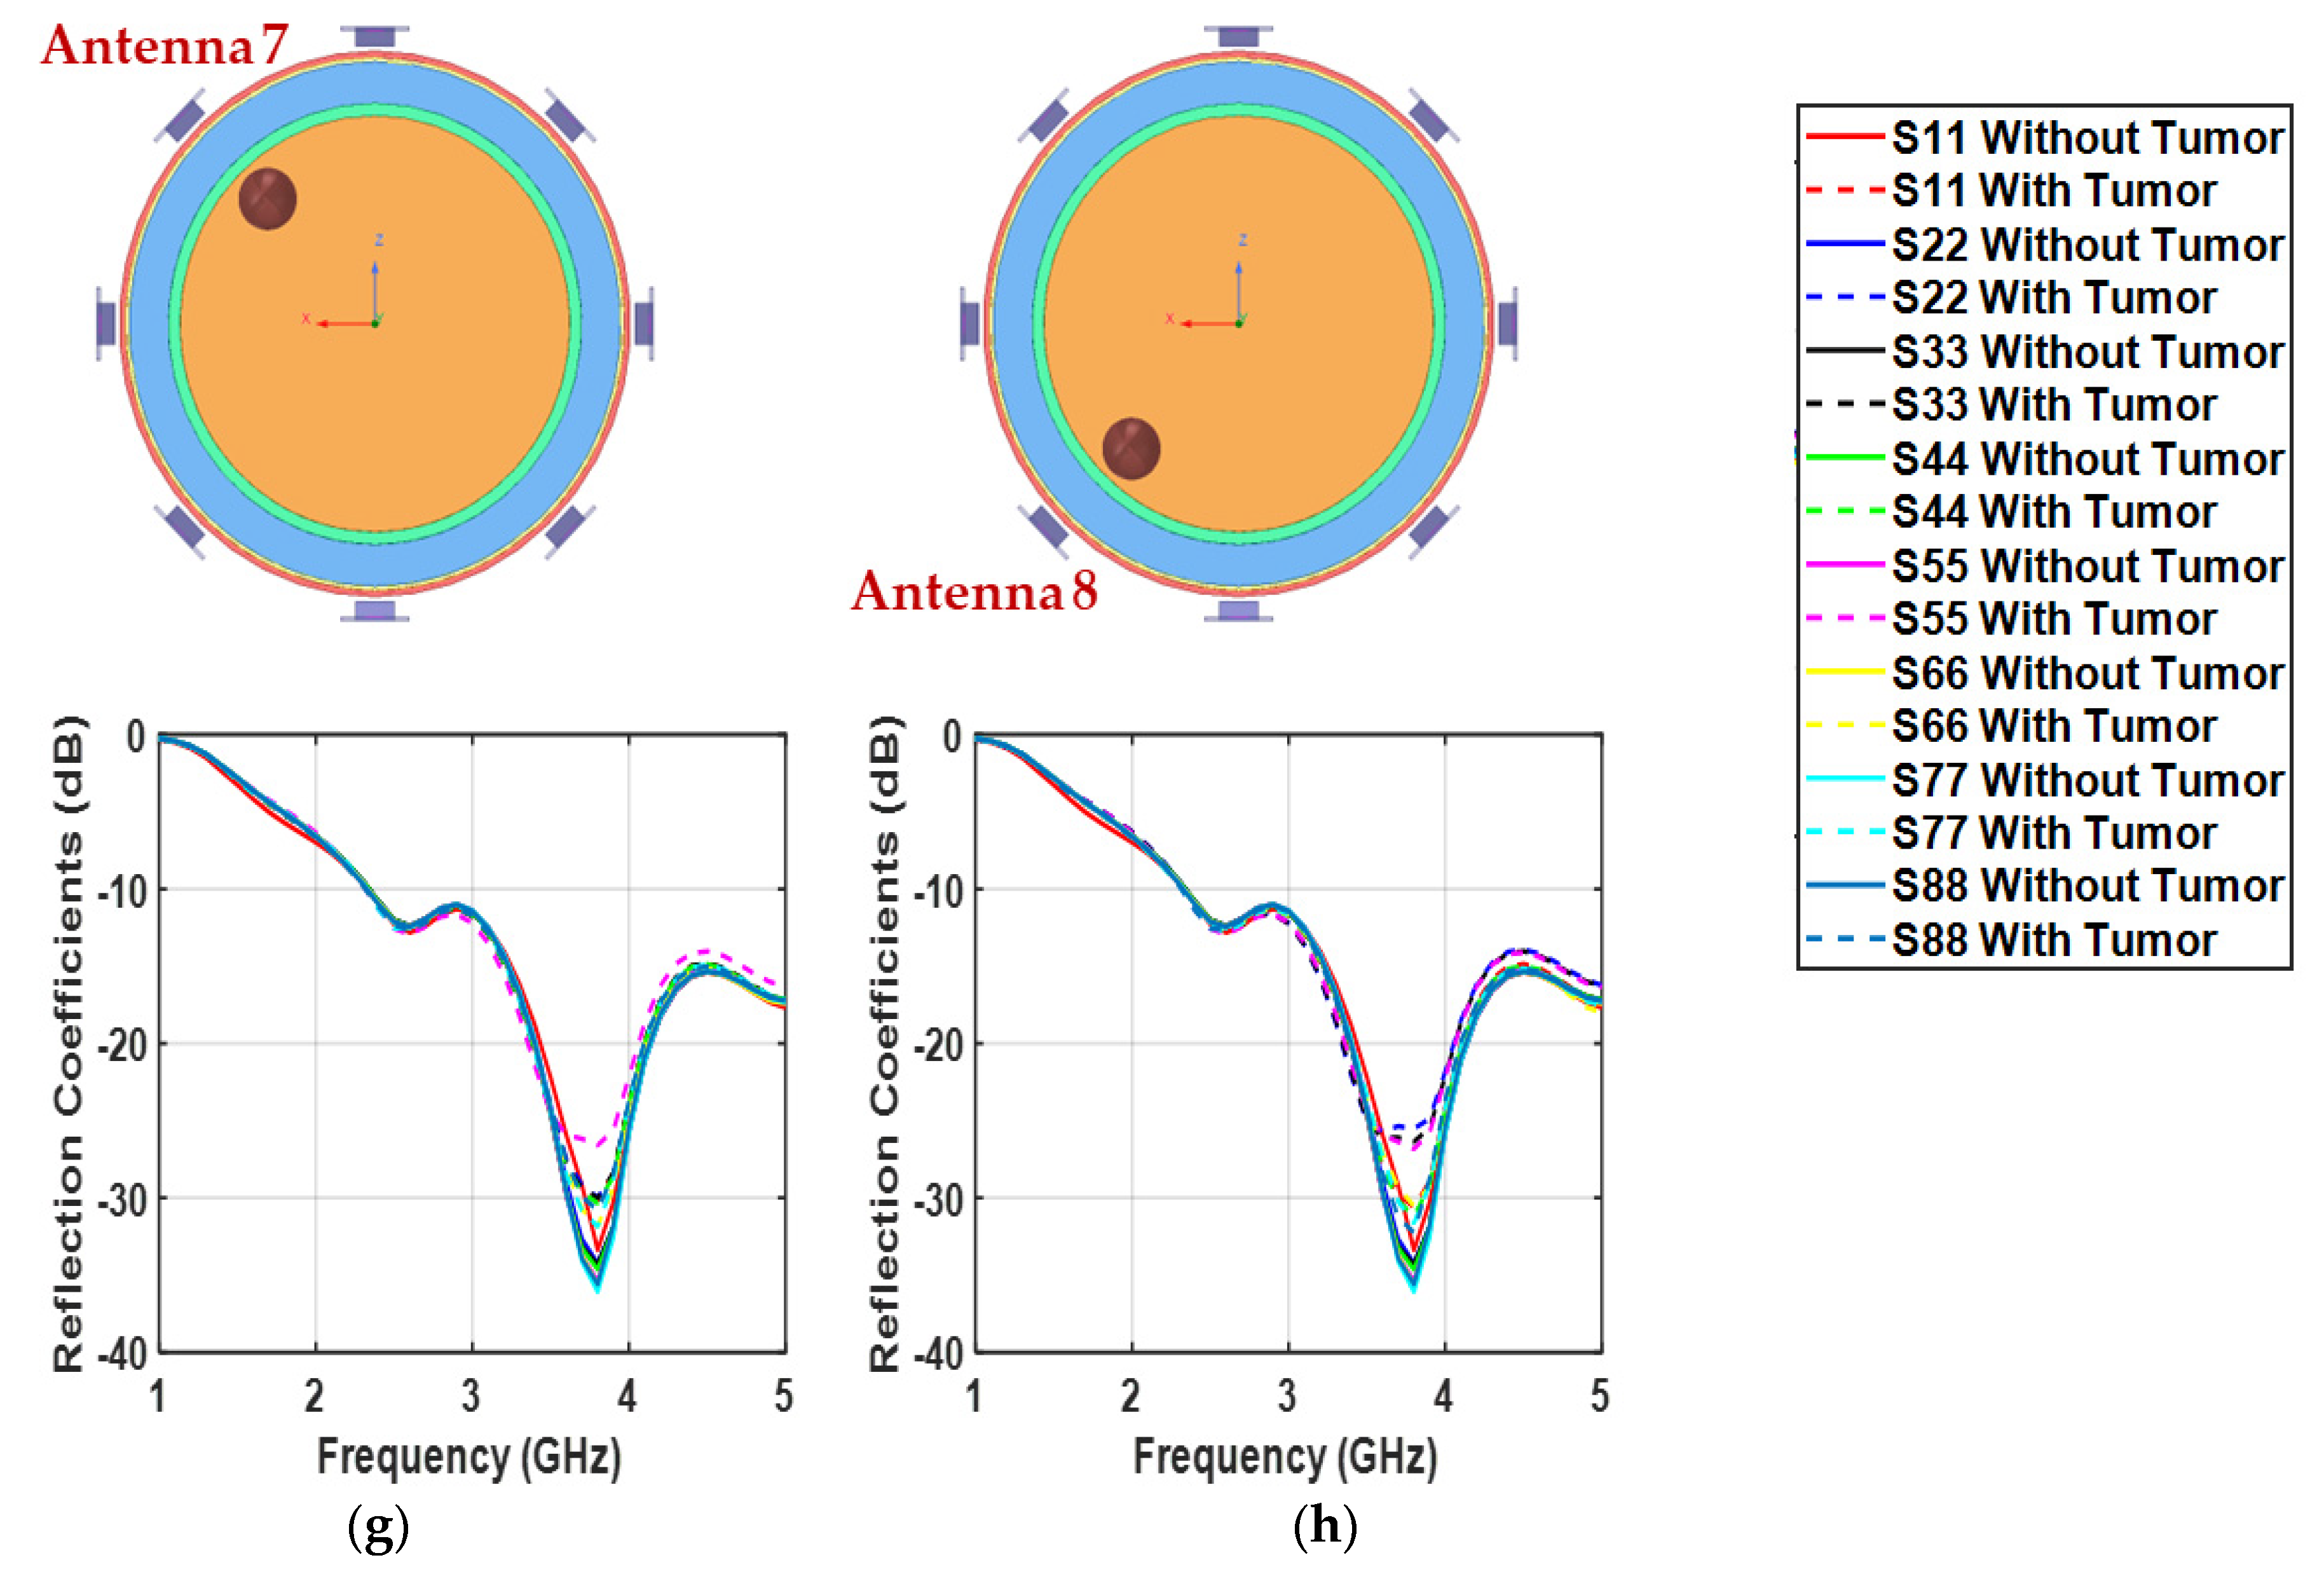
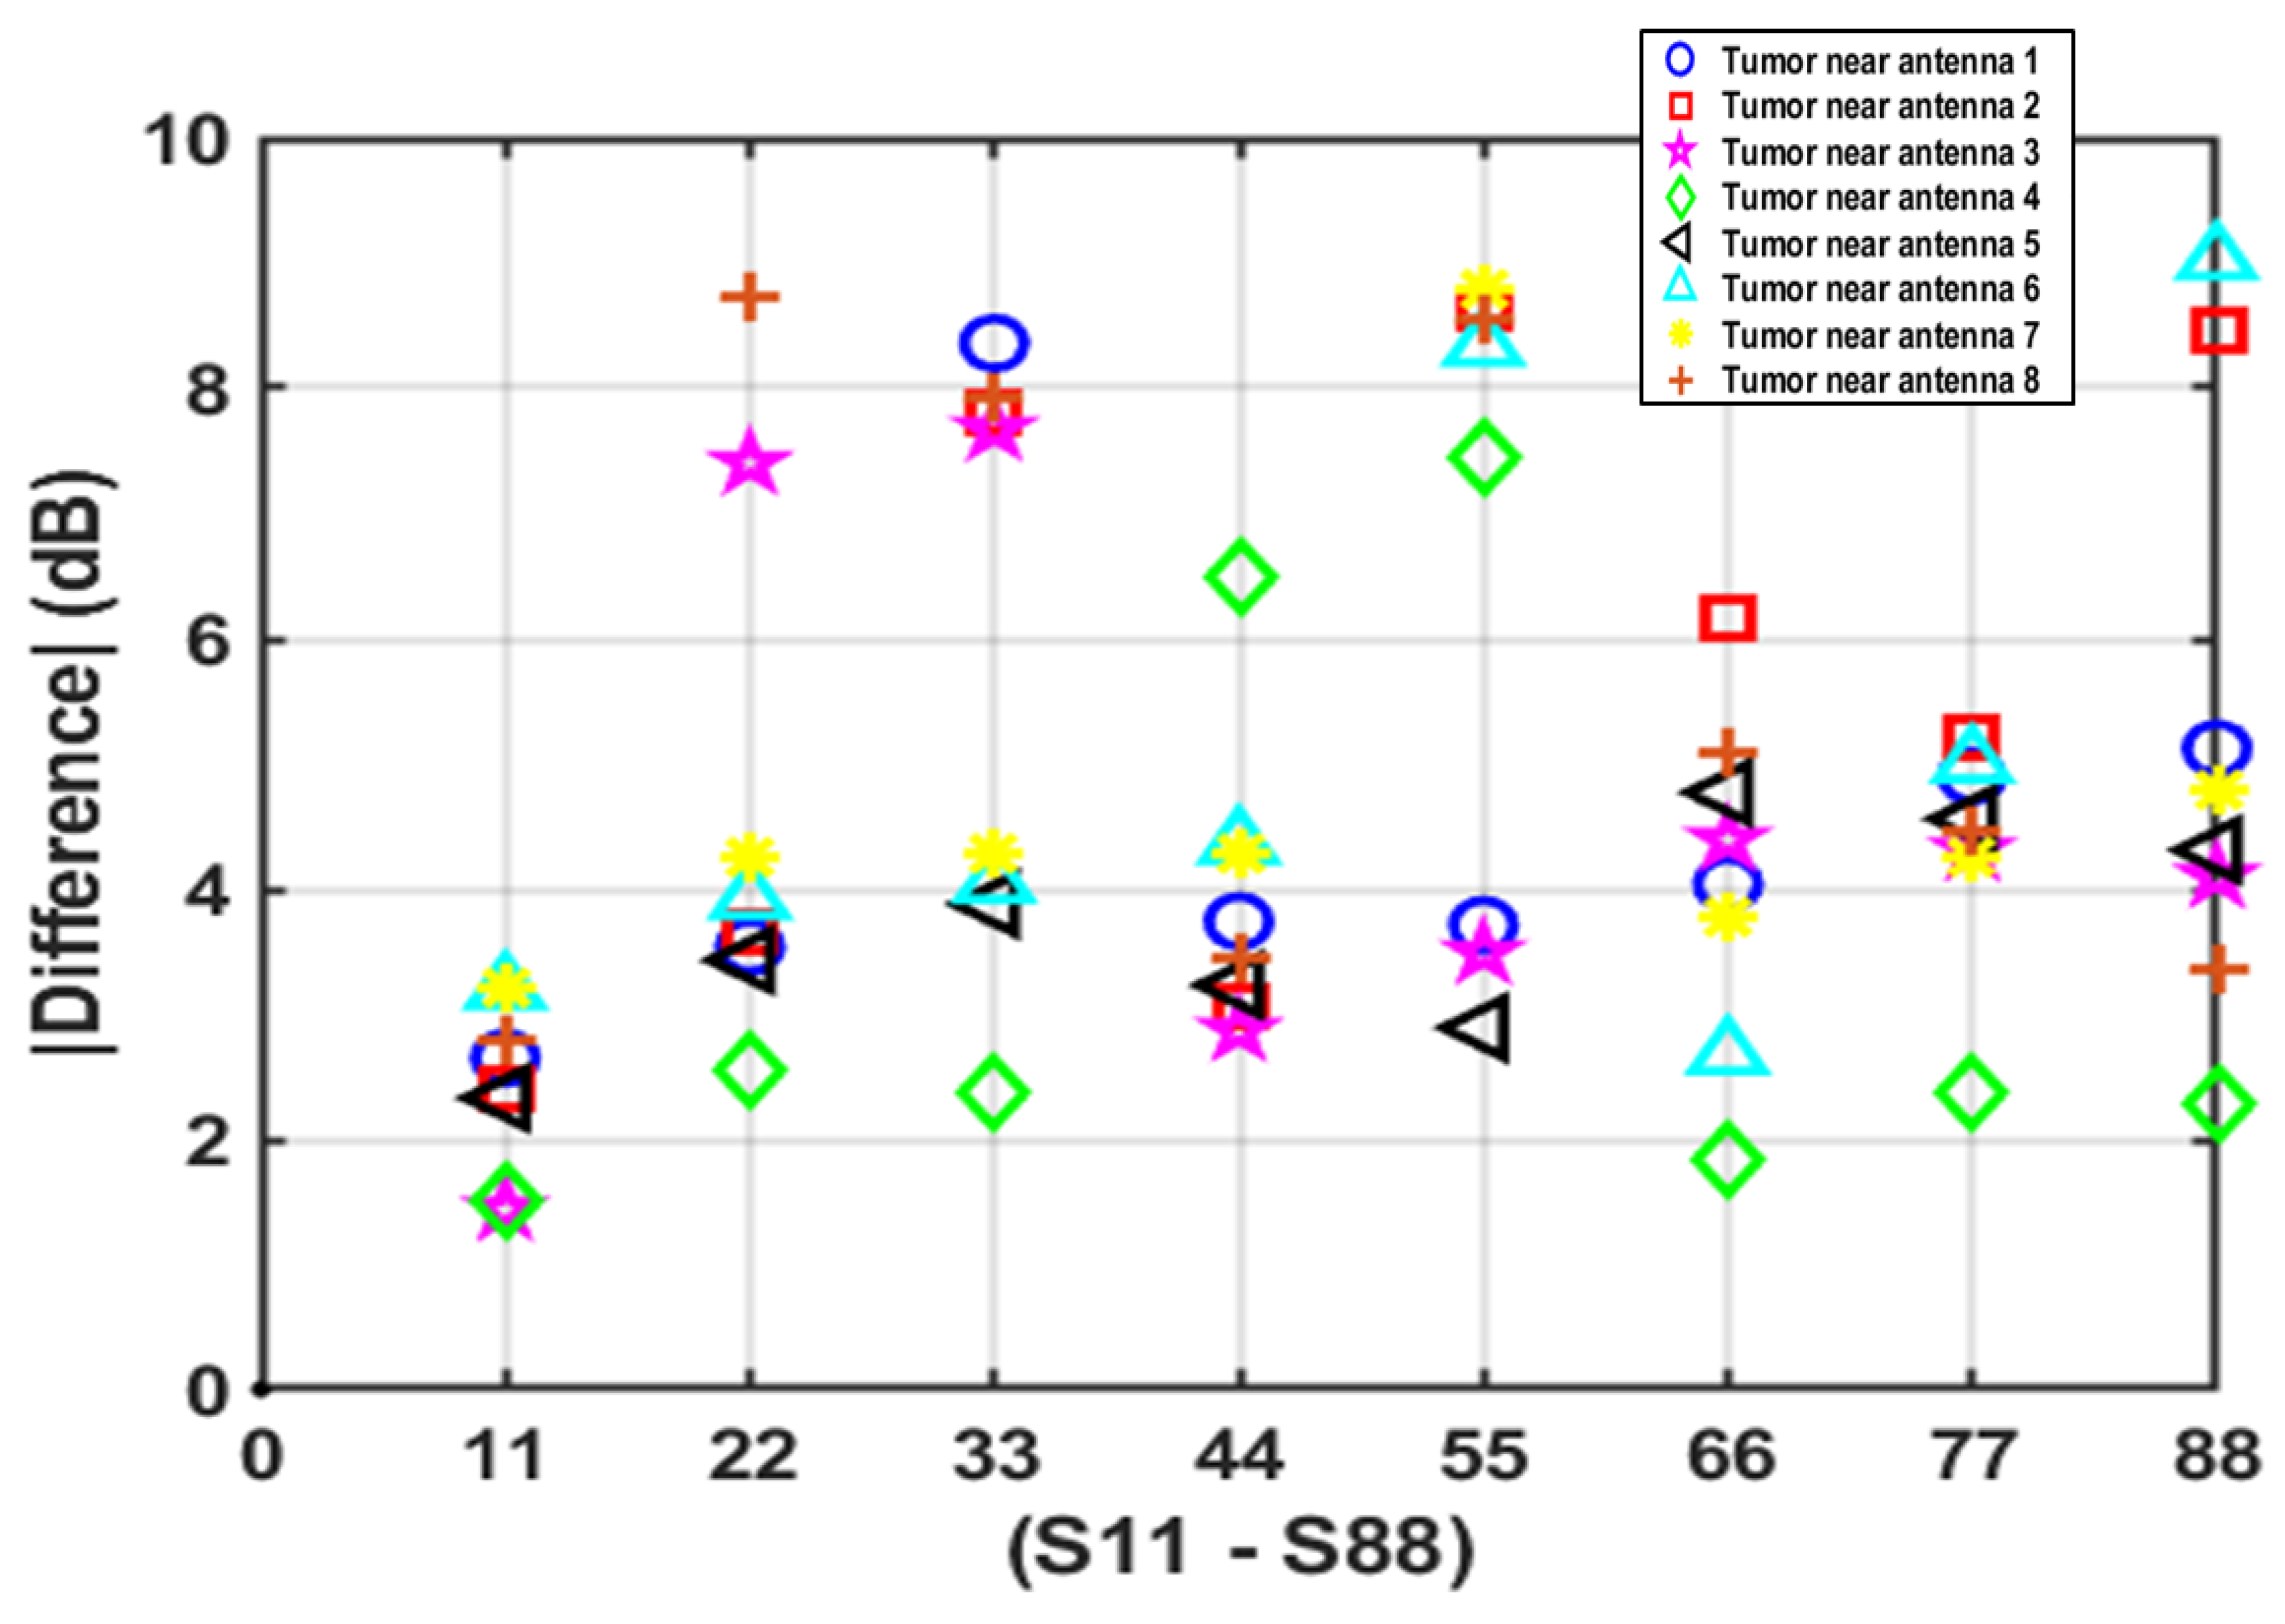
5.1. Detection of Deep-Seated Lung Tumor

Intense simulations were conducted to verify the capability of the above system in detecting early-stage lung tumors of different sizes and in different locations of the lung tissue. Firstly, a 15 mm radius tumor is placed in the deep-seated center location of the phantom, where the tumor center is 131 mm away in depth from each antenna element. Then, a 5 mm radius tumor is placed in the same center location to further verify the capability of the system in detecting smaller-sized tumors. A comparison of the reflection coefficients behavior of eight array elements has been made between those obtained from a healthy and unhealthy phantom for both 15 mm and 5 mm radius tumors, as shown in Figure 7 and Figure 8, respectively.
The results revealed that the unhealthy phantom with different sizes of deep-seated tumor placed at 131 mm depth introduced higher reflection than those from the healthy one, which can be attributed to the higher dielectric properties of the tumor mass compared with healthy tissues. This illustrates that the proposed system can detect tumors as small as 5 mm radius simply based on the contrast of reflection coefficients. Table 3 shows the obtained reflection coefficient values from both phantoms (healthy and unhealthy) and their absolute difference, |∆|, at 3.8 GHz. It can be observed that the minimum and maximum absolute differences in reflection coefficient are 1.86 dB and 7.03 dB, respectively, which enables good differentiation between healthy and unhealthy tissues.

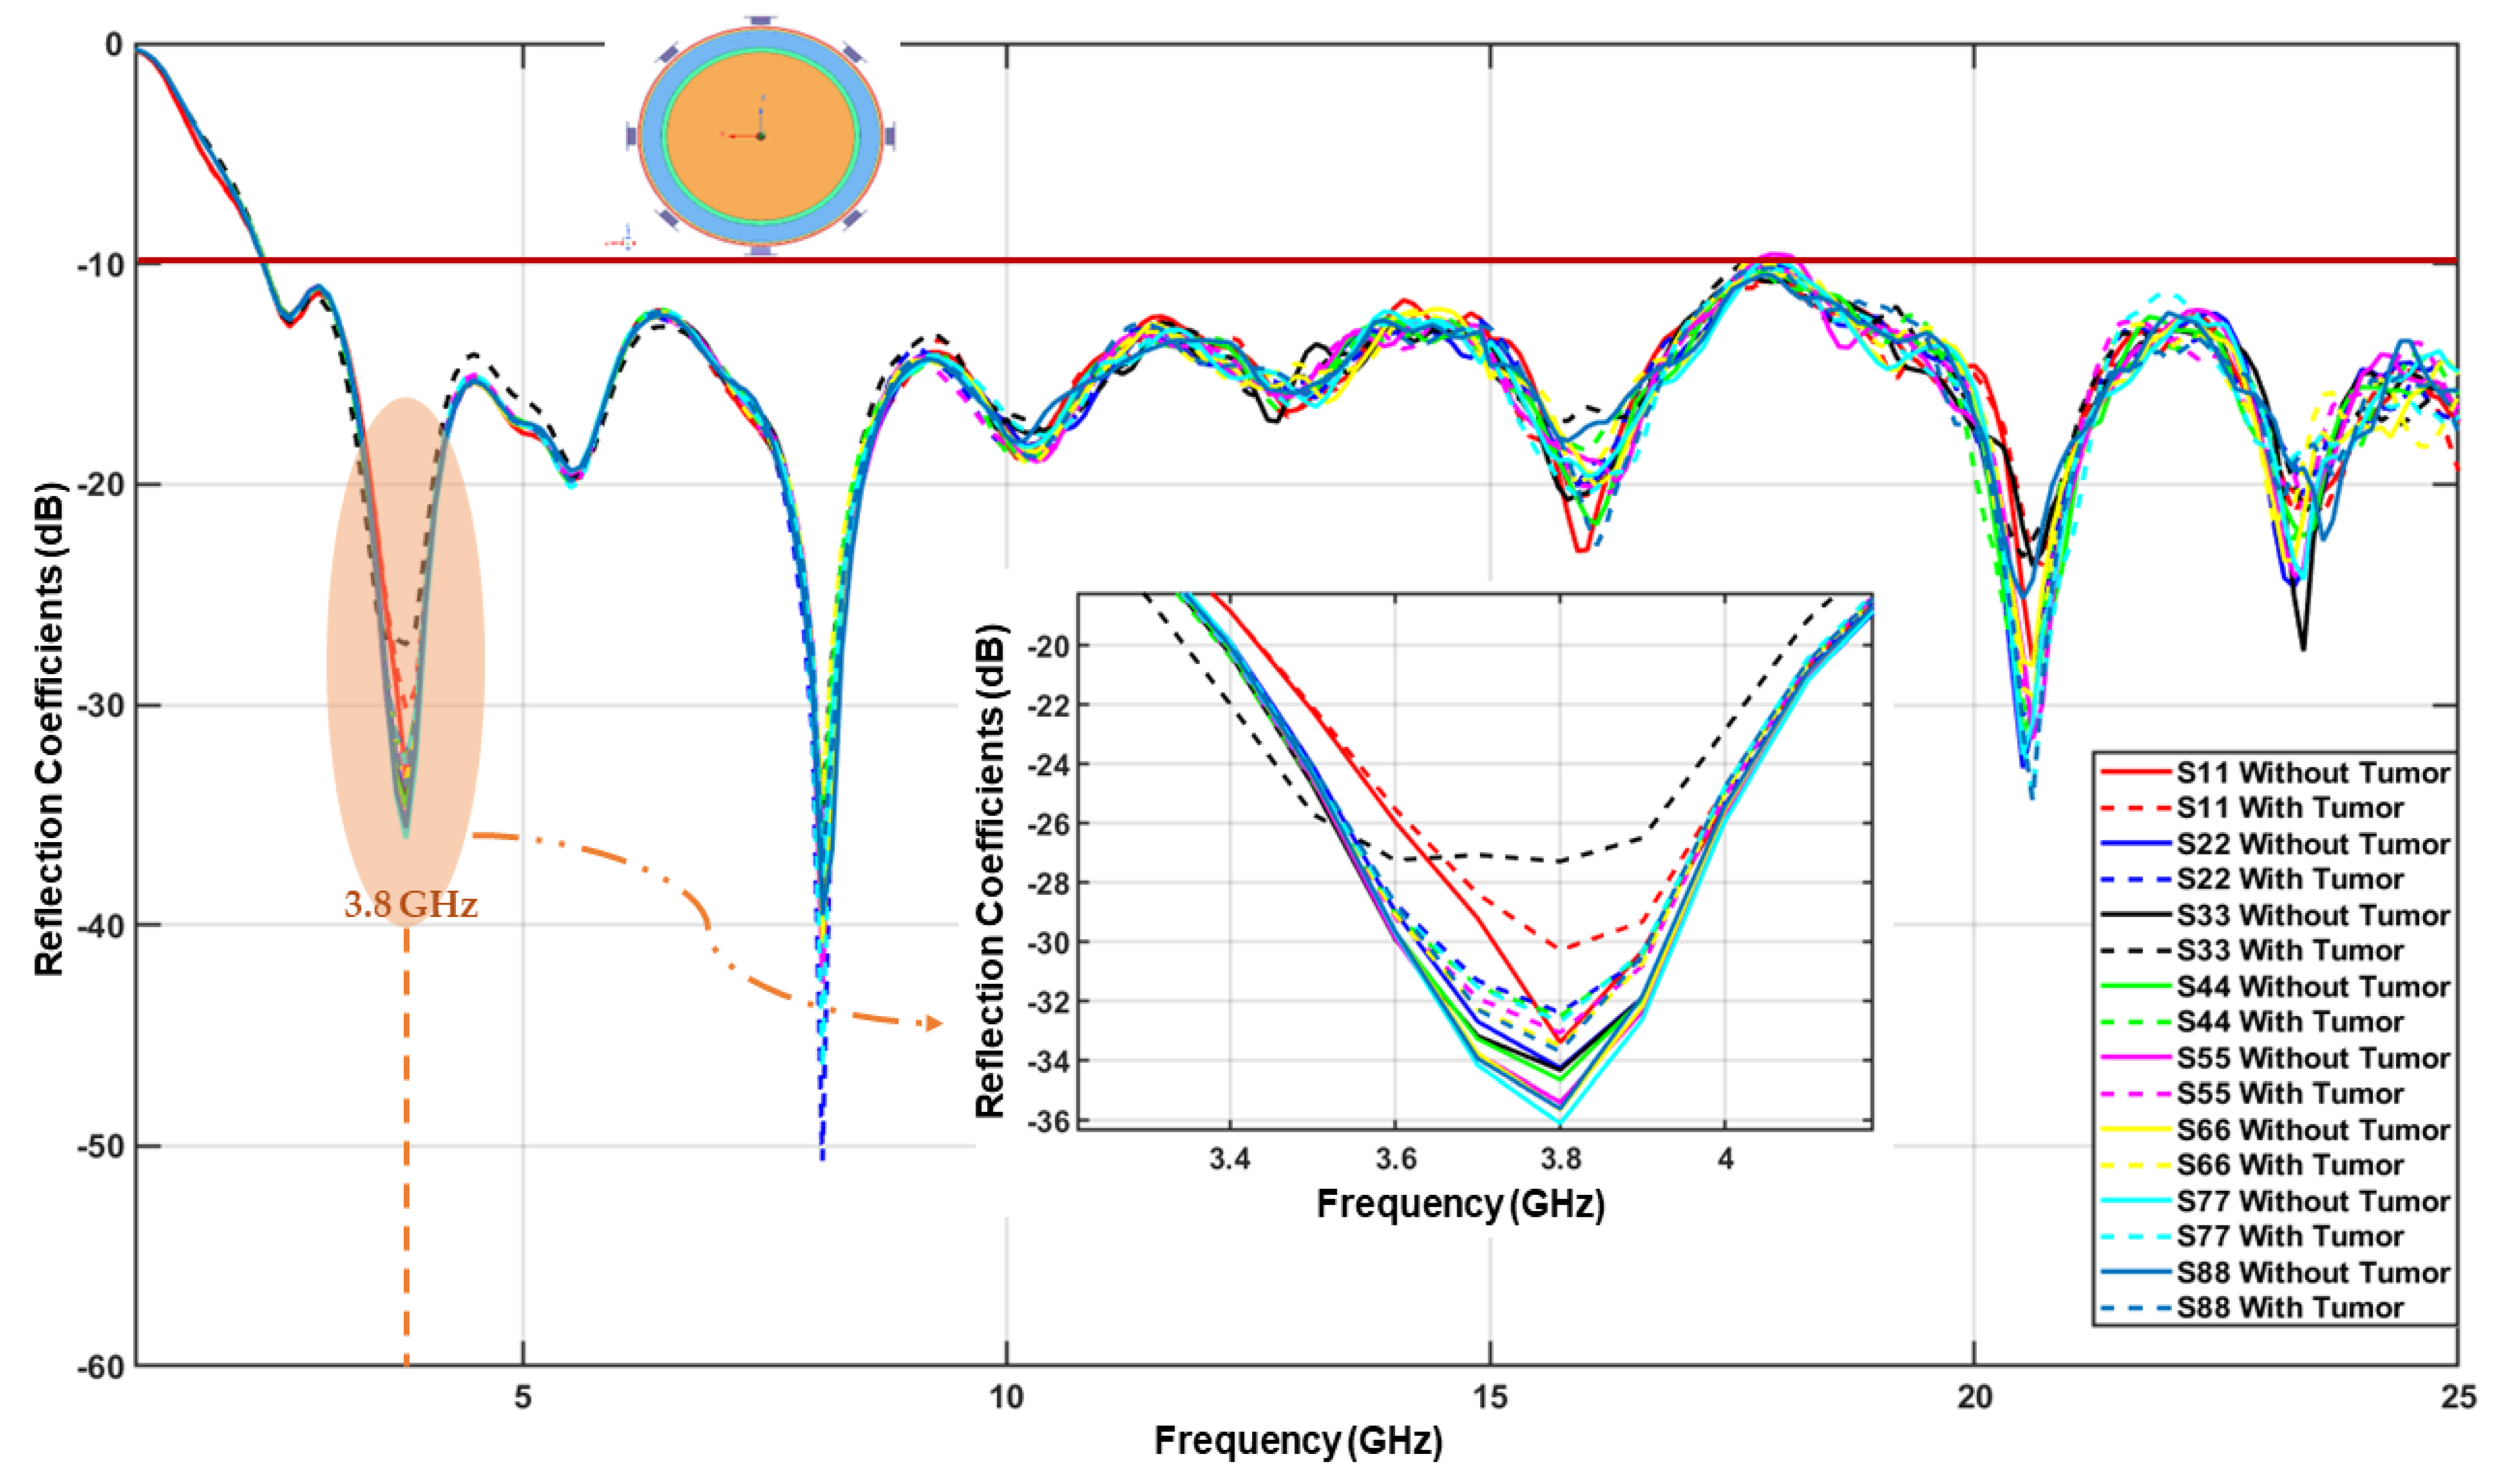
5.2. Detection of Superficially-Located Lung Tumor

Having verified the capability of the proposed system to detect different-sized tumors in the deepest depth of the lung, i.e., in the phantom’s center, we next verify the capability of the system to detect a 15 mm radius tumor at different superficial locations in the lung. We use a frequency from 1 to 5 GHz, which contains the signal frequency of interest at 3.8 GHz. Figure 9 depicts eight superficial locations of the tumor inside the phantom, each corresponding to its proximity to one array element. In each location, the separation between array element and tumor was 61 mm from tumor’s center, i.e., the distance between the tumor edge and the outer surface of the lung layer is 5 mm.
The results show that each array element is capable of lung tumor detection when the tumor is placed close to other array elements. Table 4 lists the difference in reflection coefficient values obtained at 3.8 GHz between phantoms with and without tumor for each location. The minimum and maximum absolute differences in reflection coefficient are found to be 1.44 dB and 9.03 dB, respectively, ensuring good differentiation between healthy and unhealthy tissues. Figure 10 shows the same results but in graphical form to illustrate the concluded data pattern.
It shows the potential of not only detecting the presence of a tumor, but also predicting its location based solely on the reflection coefficient results. This pattern is only valid for the array configuration shown in Figure 5a. It predicts the tumor’s location in terms of its proximity to certain array element that correlates with a high contrast of reflection coefficients (>7 dB). For instance, an obtained high|∆S22|value predicts the tumor could be located near antennas 3 and 8, while a high |∆S88|value predicts the tumor could be in the proximity of antennas 2 and 6, and so on.

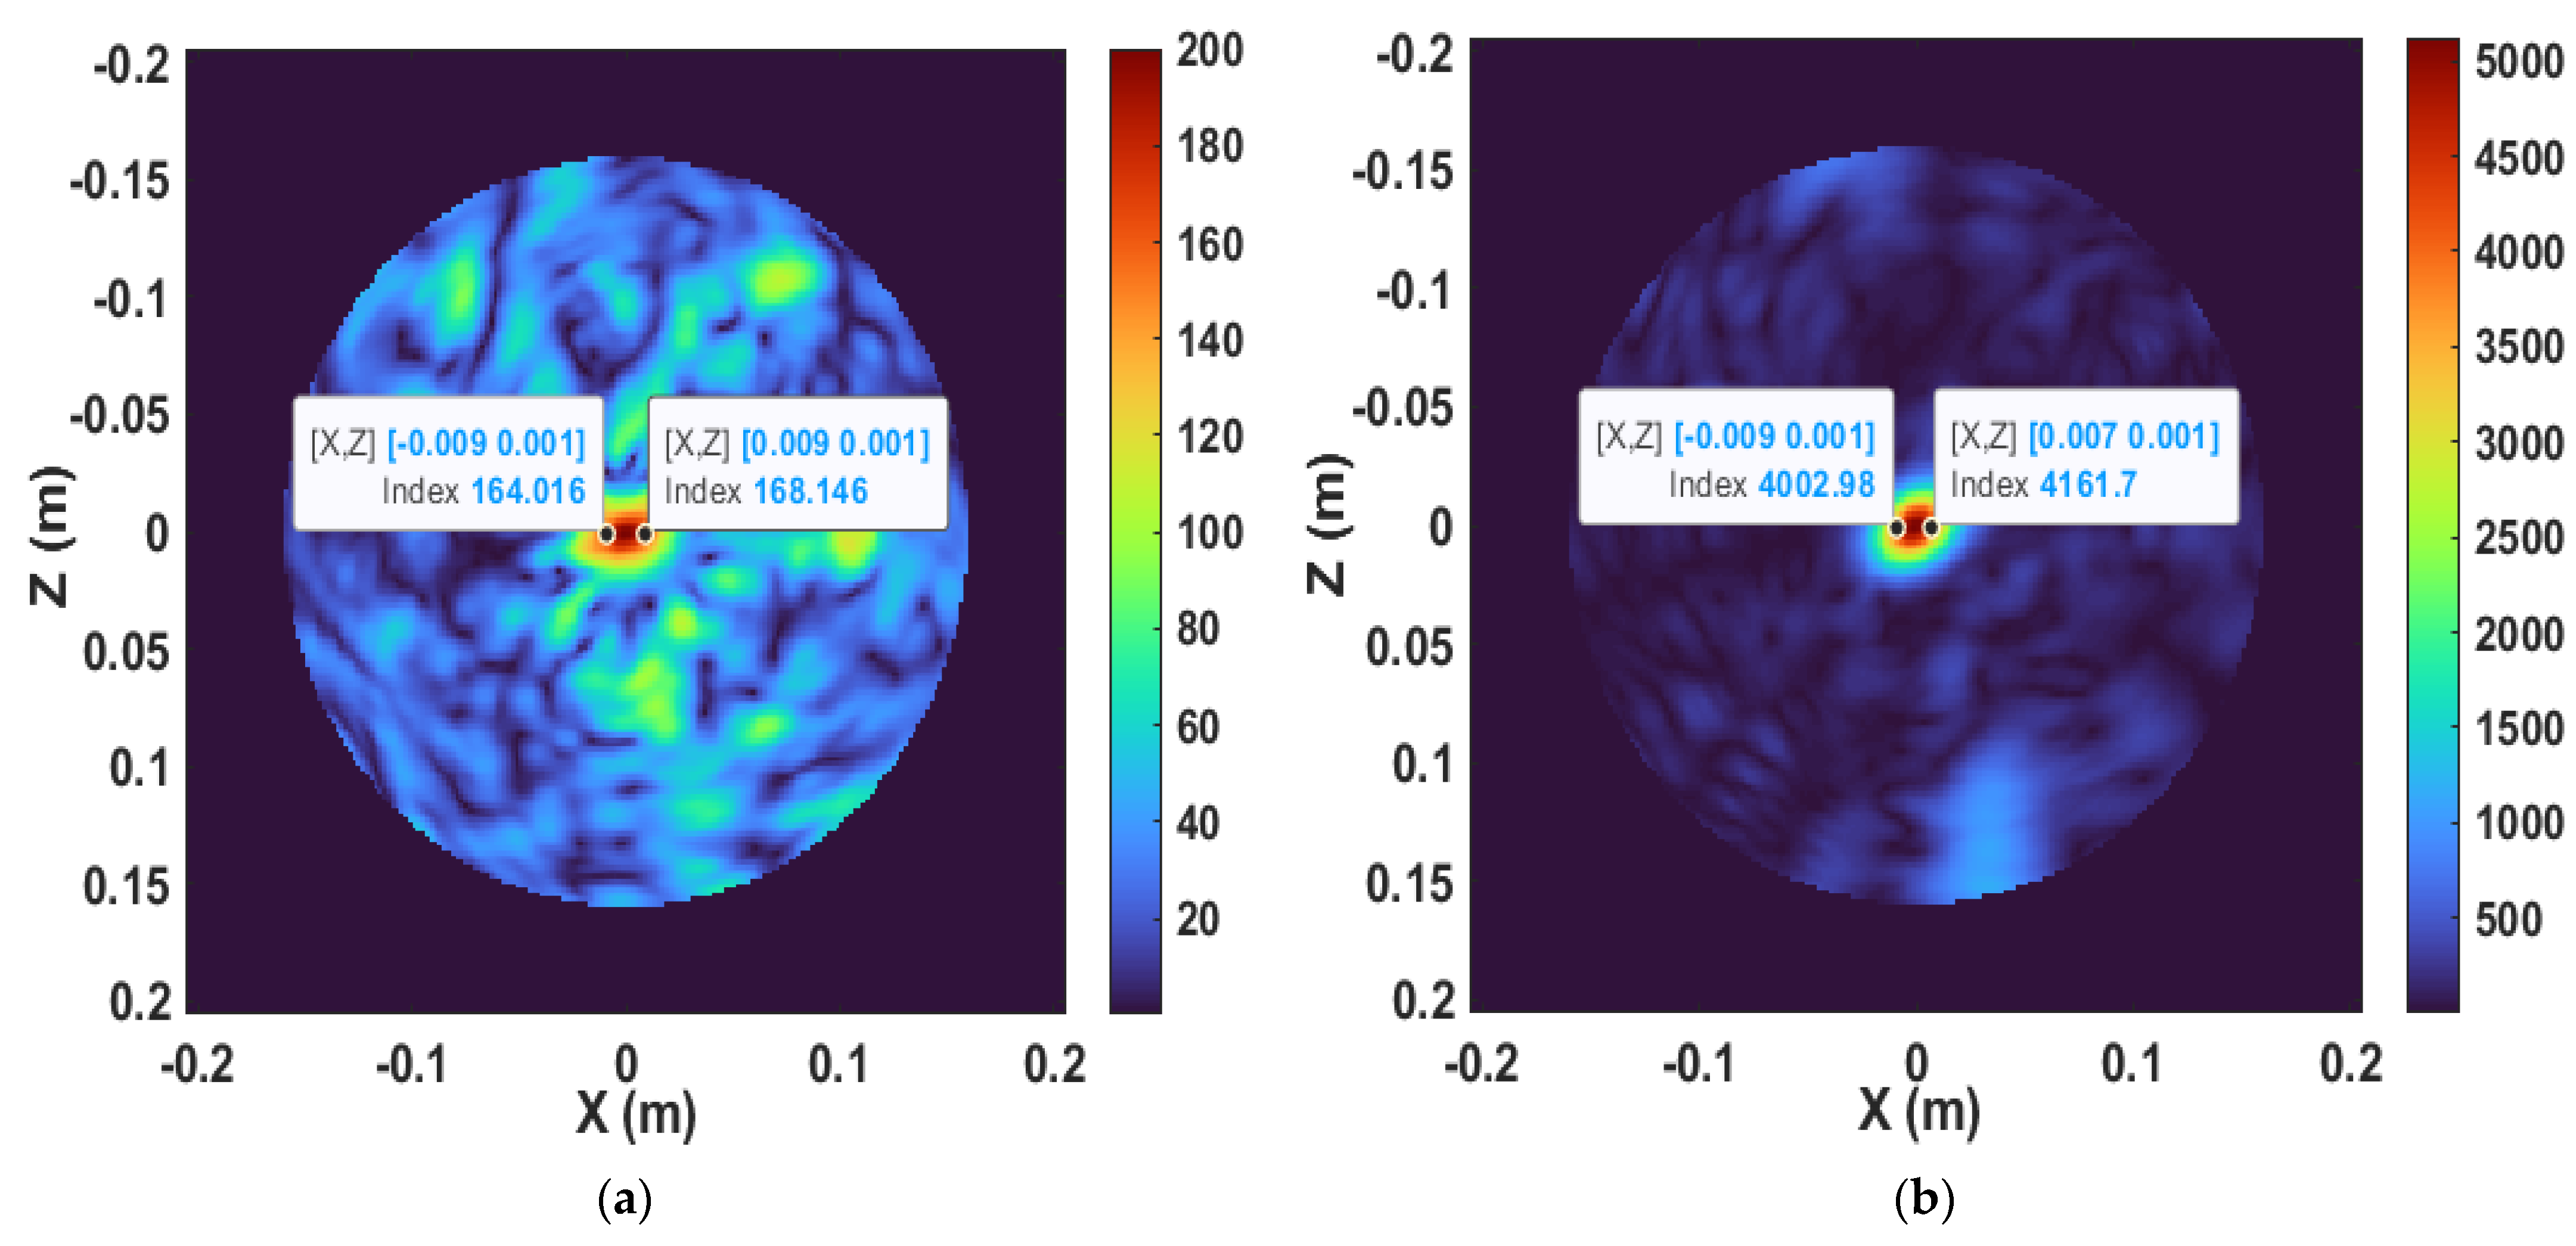
6. Reconstructed Imaging Results

In this section, tumor images were produced using a radar-based imaging technique, which relies on reconstructing an energy map of backscattered signals within the lung phantom. Tumor tissues often exhibit higher water content that corresponds to higher dielectric properties than healthy tissues. Hence, greater signal reflections will occur at the tumor boundaries, and these scatterers will result in high image energy. Image resolution is one of the key factors that potentially controls the efficiency of the microwave imaging system, which in turn is highly dependent on the operating bandwidth of the system antenna. Employing an SWB antenna will result in high-resolution images of the lung phantom, and consequently more accurate detection of lung cancer. Two confocal beamforming algorithms: Delay and Sum (DAS) and Delay Multiply and Sum (DMAS), with subtraction clutter removal based on MERIT open-source software [41,42], were used to reconstruct the images of two deep-seated lung tumors of 5 mm and 15 mm radius located at 131 mm depth of a lung phantom using backscattering datasets (reflection coefficient data) acquired over a super-wide frequency range, as discussed in Section 5. The performance of the above algorithms in locating the tumors and predicting their sizes are shown in Figure 11 and Figure 12. The tumor size is measured from the reconstructed images based on the areas that represent the higher signal scattering, which are indicated in red in both DAS and DMAS images.
In Figure 11a, the location of the 15 mm radius tumor is accurately identified with a slightly higher predicted size of 16 mm radius using the DAS algorithm. A higher resolution of detection can be observed in Figure 11b, and the predicted tumor size is slightly lower at 14 mm radius using the DMAS algorithm. In Figure 12a, the smaller tumor of 5 mm radius is correctly located, but with a much larger predicted size of 9 mm radius using DAS. The same is true for DMAS with a predicted size of 8 mm radius, as shown in Figure 12b.
By analyzing the mean absolute percentage error (MAPE) of the predicted sizes, as shown in Table 5, it can be seen that the system can predict with good accuracy using DAS or DMAS for the larger tumor of 15 mm radius as MAPE is relatively low. However, prediction is still challenging for the smaller tumor of 5 mm radius, although the MAPE results suggest that DMAS could be the better of the two algorithms.
After analyzing the performance of the proposed system for lung tumor detection, a comparison between this work and previous works is given in Table 6. It can be concluded that this work is the first to introduce the concept of SWB microwave reflectometry for lung tumor detection. It is also the first to investigate in depth the lung anomaly detection based on the contrast of reflection coefficients from different array elements, which provided quick detection without the need for complex processing of backscattered data. Furthermore, the capability to measure different tumor sizes in both deep-seated and superficial locations is demonstrated for the first time, which enables the assessment of the disease stage and the corresponding treatment options for lung cancer patients.

7. Conclusions

This paper presented a study of the dielectric properties of human torso and lung cancer detection based on SWB microwave reflectometry. The obtained dielectric and conducting properties were used to design a phantom model that mimics the biological structure of an adult-sized human torso. A custom-designed eight-element SWB array set up around the lung phantom was simulated for detecting tumor lesion in both deep and superficial locations. A quick detection was successfully achieved based on the contrast of reflection coefficients between normal and anomalous tissues. A data pattern was further presented to explore the capability of such a detection method for localizing the tumor with respect to the array element locations. Furthermore, images of the lung phantom with deep-seated tumor inclusion of different sizes were reconstructed with remarkably enhanced resolution due to using backscattering datasets acquired over a super-wide frequency range. Accurate detection, localization, and size measurement of deep-seated tumor inclusion was validated using DAS and DMAS beamforming algorithms.
Our future work will include the fabrication of the designed SWB antenna array and physical experimentation of the proposed system. Work is also underway to extend the current capability of detecting both deep and superficial tumors to achieve a single system that can detect multiple cancer types such as skin, breast, and lung cancers.

Author Contributions

Conceptualization, W.A. and B.-C.S.; methodology, W.A. and B.-C.S.; software, W.A.; validation, B.-C.S., L.W. and P.P.; formal analysis, W.A.; investigation, W.A.; resources, W.A. and B-C.S; data curation, W.A.; writing—original draft preparation, W.A.; writing—review and editing, W.A., B.-C.S., L.W. and P.P.; visualization, W.A., B.-C.S., L.W. and P.P.; supervision, B.-C.S., L.W. and P.P; project administration, B.-C.S. All authors have read and agreed to the published version of the manuscript.

Funding

This research received no external funding.

Data Availability Statement

The data that support the findings of this study are available from the authors upon reasonable request.

Conflicts of Interest

The authors declare no conflict of interest.

References

  1. Beckert, L.; Laking, G. All the cancer you cannot see. N. Z. Med. J. 2022, 135, 8–10. [Google Scholar] [PubMed]
  2. Amin, M.B.; Greene, F.L.; Edge, S.B.; Compton, C.C.; Gershenwald, J.E.; Brookland, R.K.; Meyer, L.; Gress, D.M.; Byrd, D.R.; Winchester, D.P. The Eighth Edition AJCC Cancer Staging Manual: Continuing to build a bridge from a population-based to a more “personalized” approach to cancer staging. CA Cancer J. Clin. 2017, 67, 93–99. [Google Scholar] [CrossRef] [PubMed]
  3. Bao, N.; Chen, Y.; Liu, Y.; Chakraborty, C. Multi-objective path planning for lung biopsy surgery. Multimed. Tools Appl. 2022, 81, 36153–36170. [Google Scholar] [CrossRef]
  4. Alamro, W.; Seet, B.-C. Review of practical antennas for microwave and millimetre-wave medical imaging. In Electromagnetic Waves and Antennas for Biomedical Applications, 1st ed.; Wang, L., Ed.; IET: London, UK, 2021; pp. 185–207. [Google Scholar]
  5. Wang, L. Multi-Frequency Holographic Microwave Imaging for Breast Lesion Detection. IEEE Access 2019, 7, 83984–83993. [Google Scholar] [CrossRef]
  6. Porter, E.; Bahrami, H.; Santorelli, A.; Gosselin, B.; Rusch, L.A.; Popovic, M. A Wearable Microwave Antenna Array for Time-Domain Breast Tumor Screening. IEEE Trans. Med. Imaging 2016, 35, 1501–1509. [Google Scholar] [CrossRef] [Green Version]
  7. Wang, L. Terahertz Imaging for Breast Cancer Detection. Sensors 2021, 21, 6465. [Google Scholar] [CrossRef]
  8. Wang, L. Three-Dimensional Holographic Electromagnetic Imaging for Accessing Brain Stroke. Sensors 2018, 18, 3852. [Google Scholar] [CrossRef] [Green Version]
  9. Tobon Vasquez, J.A.; Scapaticci, R.; Turvani, G.; Bellizzi, G.; Rodriguez-Duarte, D.O.; Joachimowicz, N.; Duchêne, B.; Tedeschi, E.; Casu, M.R.; Crocco, L.; et al. A Prototype Microwave System for 3D Brain Stroke Imaging. Sensors 2020, 20, 2607. [Google Scholar] [CrossRef]
  10. Sohani, B.; Khalesi, B.; Ghavami, N.; Ghavami, M.; Dudley, S.; Rahmani, A.; Tiberi, G. Detection of haemorrhagic stroke in simulation and realistic 3-D human head phantom using microwave imaging. Biomed. Signal Process. Control 2020, 61, 102001. [Google Scholar] [CrossRef]
  11. Inum, R.; Rana, M.; Shushama, K.N.; Quader, A. EBG Based Microstrip Patch Antenna for Brain Tumor Detection via Scattering Parameters in Microwave Imaging System. Int. J. Biomed. Imaging 2018, 2018, 12. [Google Scholar] [CrossRef]
  12. Darvazehban, A.; Rezaeieh, S.A.; Zamani, A.; Abbosh, A.M. Pattern Reconfigurable Metasurface Antenna for Electromagnetic Torso Imaging. IEEE Trans. Antennas Propag. 2019, 67, 5453–5462. [Google Scholar] [CrossRef]
  13. Darvazehban, A.; Rezaeieh, S.A.; Abbosh, A. Pattern-Reconfigurable Loop–Dipole Antenna for Electromagnetic Pleural Effusion Detection. IEEE Trans. Antennas Propag. 2020, 68, 5955–5964. [Google Scholar] [CrossRef]
  14. Rezaeieh, S.A.; Zamani, A.; Bialkowski, K.S.; Mahmoud, A.; Abbosh, A.M. Feasibility of Using Wideband Microwave System for Non-Invasive Detection and Monitoring of Pulmonary Oedema. Sci. Rep. 2015, 5, 14047. [Google Scholar] [CrossRef] [Green Version]
  15. Mirbeik-Sabzevari, A.; Li, S.; Garay, E.; Nguyen, H.-T.; Wang, H.; Tavassolian, N. Synthetic Ultra-High-Resolution Millimeter-Wave Imaging for Skin Cancer Detection. IEEE Trans. Biomed. Eng. 2018, 66, 61–71. [Google Scholar] [CrossRef]
  16. Tripathi, A.C.; Rao, P.K.; Mishra, R. An AMC Inspired Wearable UWB Antenna for Skin Cancer Detection. In Proceedings of the International Conference on Electrical and Electronics Engineering (ICE3), Gorakhpur, India, 14–15 February 2020. [Google Scholar]
  17. Rodriguez-Duarte, D.O.; Vasquez, J.A.T.; Scapaticci, R.; Crocco, L.; Vipiana, F. Brick-Shaped Antenna Module for Microwave Brain Imaging Systems. IEEE Antennas Wirel. Propag. Lett. 2020, 19, 2057–2061. [Google Scholar] [CrossRef]
  18. Zamani, A.; Rezaeieh, S.A.; Abbosh, A.M. Lung cancer detection using frequency domain microwave imaging. Electron. Lett. 2015, 51, 740–741. [Google Scholar] [CrossRef]
  19. Ahmed, A.; Kumari, V.; Sheoran, G. Experimental investigation of microwave holographic reflectometry for lung tumor detection. Measurement 2022, 197, 111336. [Google Scholar] [CrossRef]
  20. Khalesi, B.; Khalid, B.; Ghavami, N.; Raspa, G.; Ghavami, M.; Dudley-McEvoy, S.; Tiberi, G. A Microwave Imaging Procedure for Lung Lesion Detection: Preliminary Results on Multilayer Phantoms. Electronics 2022, 11, 2105. [Google Scholar] [CrossRef]
  21. Alhawari, A.R.H. Lung Tumour Detection Using Ultra-Wideband Microwave Imaging Approach. J. Fundam. Appl. Sci. 2018, 10, 222–234. [Google Scholar]
  22. Ameer, W.; Awan, D.; Bashir, S.; Waheed, A. Use of Directional UWB Antenna for Lung Tumor Detection. In Proceedings of the 2nd International Conference on Advancements in Computational Sciences (ICACS), Lahore, Pakistan, 18–20 February 2019. [Google Scholar]
  23. Abdelhamid, M.M.; Allam, A.M. Detection of Lung Cancer Using Ultra Wide Band Antenna. In Proceedings of the 2016 Loughborough Antennas & Propagation Conference (LAPC), Loughborough, UK, 14–15 November 2016. [Google Scholar]
  24. Alani, S.; Zakaria, Z.; Saeidi, T.; Ahmad, A.; Imran, M.A.; Abbasi, Q.H. Microwave Imaging of Breast Skin Utilizing Elliptical UWB Antenna and Reverse Problems Algorithm. Micromachines 2021, 12, 647. [Google Scholar] [CrossRef]
  25. Bahramiabarghouei, H.; Porter, E.; Santorelli, A.; Gosselin, B.; Popovic, M.; Rusch, L.A. Flexible 16 Antenna Array for Microwave Breast Cancer Detection. IEEE Trans. Biomed. Eng. 2015, 62, 10. [Google Scholar] [CrossRef] [PubMed]
  26. Hossain, K.; Sabapathy, T.; Jusoh, M.; Lee, S.-H.; Rahman, K.S.A.; Kamarudin, M.R. Negative Index Metamaterial-Based Frequency-Reconfigurable Textile CPW Antenna for Microwave Imaging of Breast Cancer. Sensors 2022, 22, 1626. [Google Scholar] [CrossRef] [PubMed]
  27. Hossain, A.; Islam, M.T.; Islam, M.T.; Chowdhury, M.E.H.; Rmili, H.; Samsuzzaman, M. A Planar Ultrawideband Patch Antenna Array for Microwave Breast Tumor Detection. Materials 2020, 13, 4918. [Google Scholar] [CrossRef] [PubMed]
  28. Shahidul Islam, M.; Islam, M.T.; Hoque, A.; Islam, M.T.; Amin, N.; Chowdhury, M.E.H. A Portable Electromagnetic Head Imaging System Using Metamaterial Loaded Compact Directional 3D Antenna. IEEE Access 2021, 9, 50893–50906. [Google Scholar] [CrossRef]
  29. Bashri, M.S.R.; Arslan, T. Low-cost and compact RF switching system for wearable microwave head imaging with performance verification on artificial head phantom. IET Microw. Antennas Propag. 2018, 12, 706–711. [Google Scholar] [CrossRef] [Green Version]
  30. Kaur, K.; Kaur, A. In vitro detection of skin cancer using an UWB stacked micro strip patch antenna with microwave imaging. Int. J. RF Microw. Comput. Eng. 2022, 32, e23407. [Google Scholar] [CrossRef]
  31. Khan, M.A.; Rafique, U.; Savci, H.Ş.; Nordin, A.N.; Kiani, S.H.; Abbas, S.M. Ultra-Wideband Pentagonal Fractal Antenna with Stable Radiation Characteristics for Microwave Imaging Applications. Electronics 2022, 11, 2061. [Google Scholar] [CrossRef]
  32. Ullah, S.; Ruan, C.; Sadiq, M.S.; Haq, T.U.; He, W. High Efficient and Ultra Wide Band Monopole Antenna for Microwave Imaging and Communication Applications. Sensors 2020, 20, 115. [Google Scholar] [CrossRef] [Green Version]
  33. Balani, W.; Sarvagya, M.; Samasgikar, A.; Ali, T.; Kumar, P. Design and Analysis of Super Wideband Antenna for Microwave Applications. Sensors 2021, 21, 477. [Google Scholar] [CrossRef]
  34. Chew, K.M.; Sudirman, R.; Seman, N.; Yong, C.Y. Reflection coefficient detection of simulation models for microwave imaging simulation system. Biomed. Mater. Eng. 2014, 24, 199–207. [Google Scholar] [CrossRef]
  35. Mohammed, B.J.; Abbosh, A.M.; Ireland, D. Stroke detection based on variations in reflection coefficients of wideband antennas. In Proceedings of the IEEE International Symposium on Antennas and Propagation, Chicago, IL, USA, 8–14 July 2012. [Google Scholar]
  36. Hasgall, P.A.; Neufeld, E.; Gosselin, M.C.; Klingenböck, A.; Kuster, N.; Kuster, N.; Hasgall, P.; Gosselin, M. IT’IS Database for Thermal and Electromagnetic Parameters of Biological Tissues, Version 4.0; Science Open: Berlin, Germany, 2018. [Google Scholar]
  37. Gabriel, C.; Gabriel, S.; Corthout, E. The dielectric properties of biological tissues: I. literature survey. Phys. Med. Biol. 1996, 41, 2231–2249. [Google Scholar] [CrossRef] [PubMed]
  38. Sasaki, K.; Wake, K.; Watanabe, S. Development of best fit Cole-Cole parameters for measurement data from biological tissues and organs between 1 MHz and 20 GHz. Radio Sci. 2014, 49, 459–472. [Google Scholar] [CrossRef]
  39. Xuyang, L. Body Matched Antennas for Microwave Medical Applications. In Karlsruher Forschungsberichte aus dem Institut fuer Hochfrequenztechnik und Elektronik; KIT Scientific Publishing: Karlsruhe, Germany, 2014; Volume 72. [Google Scholar]
  40. Alamro, W.; Seet, B.-C.; Wang, L.; Parthiban, P. Compact Super-Wideband Antenna for Medical Imaging Applications. In Proceedings of the IEEE Conference on Antenna Measurements & Applications (CAMA), Antibes Juan-les-Pins, France, 15–17 November 2021. [Google Scholar]
  41. Elahi, M.A.; O’Loughlin, D.; Lavoie, B.R.; Glavin, M.; Jones, E.; Fear, E.C.; O’Halloran, M. Evaluation of Image Reconstruction Algorithms for Confocal Microwave Imaging: Application to Patient Data. Sensors 2018, 18, 1678. [Google Scholar] [CrossRef] [PubMed]
  42. O’Loughlin, D.; Elahi, M.A.; Porter, E.; Shahzad, A.; Oliveira, B.L.; Glavin, M.; Jones, E.; O’Halloran, M. Open-Source Software for Microwave Radar-Based Image Reconstruction. In Proceedings of the 12th European Conference on Antennas and Propagation (EuCAP), London, UK, 9–13 April 2018. [Google Scholar]
Figure 1. Workflow stages for this study.
Electronics 12 00036 g001
Figure 2. Dielectric properties of human torso and tumor issues: (a) Relative permittivity; (b) Conductivity; (c) Loss factor; (d) Loss tangent.
Electronics 12 00036 g002
Figure 3. Concentric cylinder geometry of lung phantom model with spherical tumor inclusion: (a) Top view; (b) Trimetric view; (c) Dimetric view.
Electronics 12 00036 g003
Figure 4. Comparison between reflection coefficients of array elements placed in free space and in front of a lung phantom at a distance of: (a) 5 mm; (b) 10 mm; and (c) 15 mm.
Electronics 12 00036 g004aElectronics 12 00036 g004b
Figure 5. Eight-element array configuration around lung phantom: (a) Top view; (b) Trimetric view.
Electronics 12 00036 g005
Figure 6. Mutual coupling between eight array elements: (a) With tumor; (b) Without tumor.
Electronics 12 00036 g006
Figure 7. Comparison between reflection coefficients of healthy and unhealthy phantoms when a 15 mm radius tumor is placed in the phantom’s center.
Electronics 12 00036 g007
Figure 8. Comparison between reflection coefficients of healthy and unhealthy phantoms when a 5 mm radius tumor is placed in the phantom’s center.
Electronics 12 00036 g008
Figure 9. Comparison between reflection coefficients of healthy and unhealthy phantoms when a 15 mm radius tumor is placed: (a) near antenna 1 (Case 1); (b) near antenna 2 (Case 2); (c) near antenna 3 (Case 3); (d) near antenna 4 (Case 4); (e) near antenna 5 (Case 5); (f) near antenna 6 (Case 6); (g) near antenna 7 (Case 7); and (h) near antenna 8 (Case 8).
Electronics 12 00036 g009aElectronics 12 00036 g009b
Figure 10. Data pattern showing the difference in reflection coefficient values when tumor is placed at different superficial locations.
Electronics 12 00036 g010
Figure 11. Imaging results of lung phantom with deep-seated 15 mm radius tumor using two beamformers: (a) DAS and (b) DMAS.
Electronics 12 00036 g011
Figure 12. Imaging results of lung phantom with deep-seated 5 mm tumor using two beamformers: (a) DAS and (b) DMAS.
Electronics 12 00036 g012
Table 1. Parameter values for each tissue of the human torso.
Tissue ε Δ ε 1     τ 1  
( p s )
α 1 Δ ε 2
( 10 2 )
τ 2
( n s )
α 2 Δ ε 3
( 10 4 )
τ 3
( µ s )
α 3 Δ ε 4
( 10 6 )
τ 4
( m s )
α 4 σ
( 10 3 )
Skin4397.960.12.879.58031.590.160.031.5920.20.4
Fat2.537.960.20.1515.920.13.3159.150.05107.9580.0110
Muscle4507.230.170353.60.1120318.310.1252.2740200
Rib bone2.51813.30.22379.580.252159.150.22015.910700
Lung4.4414.616.10.00016.463.220.1812.2159.150.18107.958084.2
Table 2. Physical and dielectric properties of lung phantom with tumor inclusion.
TissueThickness (mm)Relative Dielectric Constant εrConductivity σ (S/m)tan δ
Skin336.82.150.283
Fat210.40.4530.211
Muscle2051.22.740.259
Rib Bone 617.21.280.361
Lung 10019.71.210.298
Tumor5–15 (radius)61.85.4540.428
Table 3. Difference in reflection coefficient values (in dB) for phantoms with and without tumor in the phantom’s center at 3.8 GHz.
Reflection CoefficientHealthy PhantomWith 15 mm Tumor (|∆|) With 5 mm Tumor (|∆|)
|S11|−33.37−31.20 (2.17)−30.26 (3.11)
|S22|−34.23−25.70 (8.53)−32.37 (1.86)
|S33|−34.30−31.30 (3.00)−27.27 (7.03)
|S44|−34.63−31.32 (3.31)−32.49 (2.14)
|S55|−35.37−32.05 (3.32)−33.05 (2.32)
|S66|−35.62−31.19 (4.43)−33.48 (2.14)
|S77|−36.10−31.18 (4.92)−32.68 (3.42)
|S88|−35.60−31.76 (3.84)−33.68 (1.92)
Table 4. Difference in reflection coefficient values between phantoms with and without tumor for each superficial location.
∆ Reflection CoefficientCase 1 (dB)Case 2 (dB)Case 3 (dB)Case 4 (dB)Case 5 (dB)Case 6 (dB)Case 7 (dB)Case 8 (dB)
|∆S11|2.652.401.441.52.333.23.222.78
|∆S22|3.543.657.42.553.433.924.268.72
|∆S33|8.367.817.672.373.884.054.287.94
|∆S44|3.743.072.876.493.234.364.293.45
|∆S55|3.718.653.497.452.898.348.798.55
|∆S66|4.046.154.391.844.772.683.795.10
|∆S77|4.95.204.312.384.565.014.254.47
|∆S88|5.128.474.12.274.319.034.83.35
Table 5. MAPE of predicted tumor sizes from reconstructed images by DAS and DMAS.
Real Tumor RadiusPredicted Radius (DAS) Predicted Radius (DMAS)MAPE (DAS)MAPE (DMAS)
5 mm9 mm8 mm80%60%
15 mm16 mm14 mm6.66%6.66%
Table 6. Comparison between this work and previous works on microwave reflectometry-based lung tumor detection.
Ref.Freq. (GHz)Tumor
Size
Type of Antenna(s)
Deployed
Tumor Detection
Depth
Tumor Detection Accuracy
[17]1.5−310 mm
radius
1× rotated antenna around the phantomN/AAccurate
[18]105 mm
radius
2× Vivaldi antennaSuperficial (60 mm)Weak detection
[19]1–515 mL
(tube-shaped)
2× horn TX antenna, 2× Vivaldi RX antennaSuperficial (50 mm)Accurate
[20]3–44, 10 mm
radius
1× circular shaped
antenna
60 mmWeak detection
[21]3–10.7N/A2× elliptical shaped
antenna
70 mmWeak detection
[22]2.9–12N/A1× cupcake shaped
antenna
N/AWeak detection
This work2.45–255, 15 mm
radius
8× custom-designed SWB array element around the phantomDeep-seated (141 mm) Superficial (61 mm)Accurate with size measurement
capability
Disclaimer/Publisher’s Note: The statements, opinions and data contained in all publications are solely those of the individual author(s) and contributor(s) and not of MDPI and/or the editor(s). MDPI and/or the editor(s) disclaim responsibility for any injury to people or property resulting from any ideas, methods, instructions or products referred to in the content.

