
The “Coherent Data Set”: Combining Patient Data and Imaging in a Comprehensive, Synthetic Health Record

 ,
,  , , and
Abstract
:1. Introduction
2. Materials and Methods
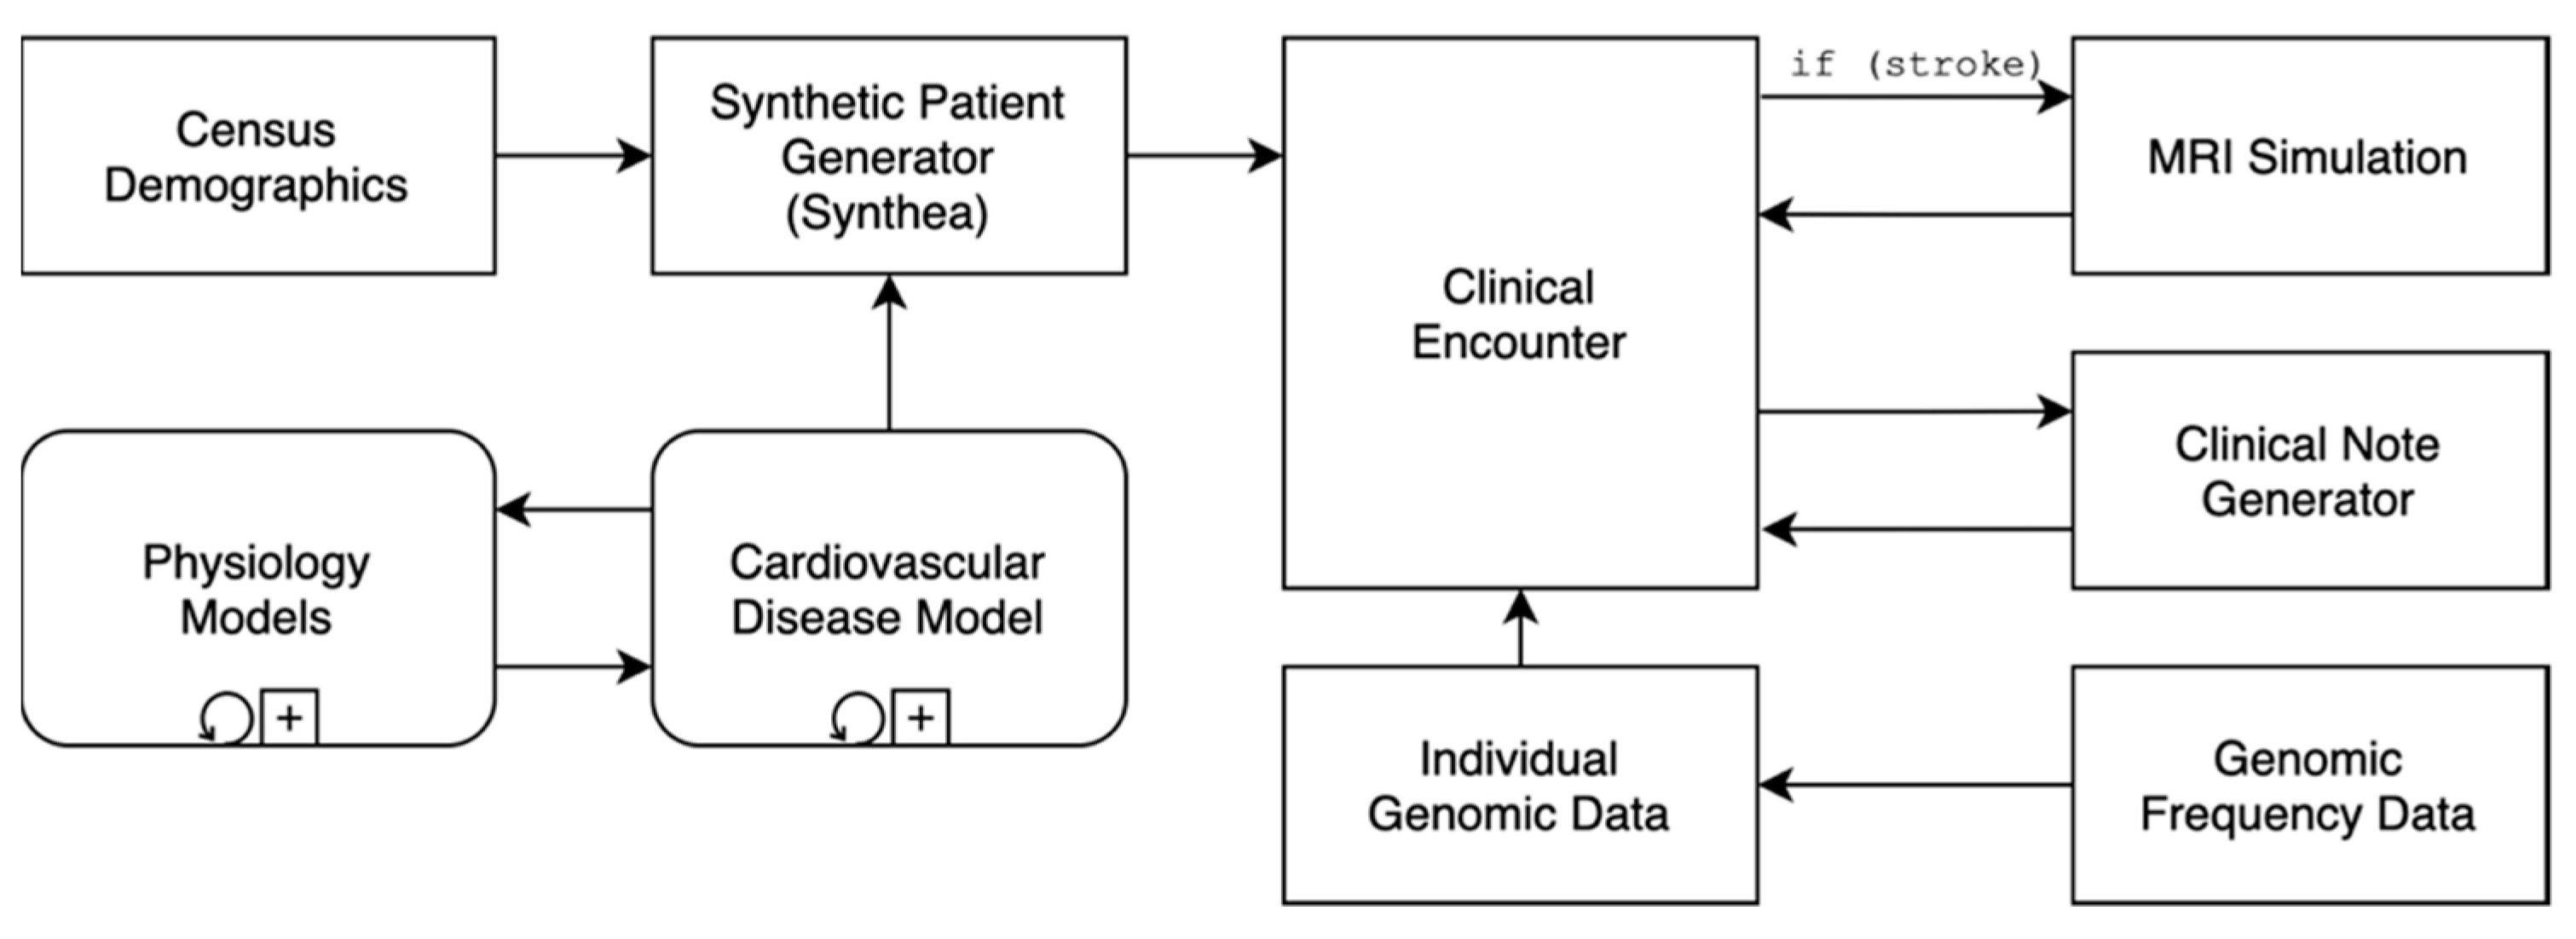
2.1. The Coherent Data Set
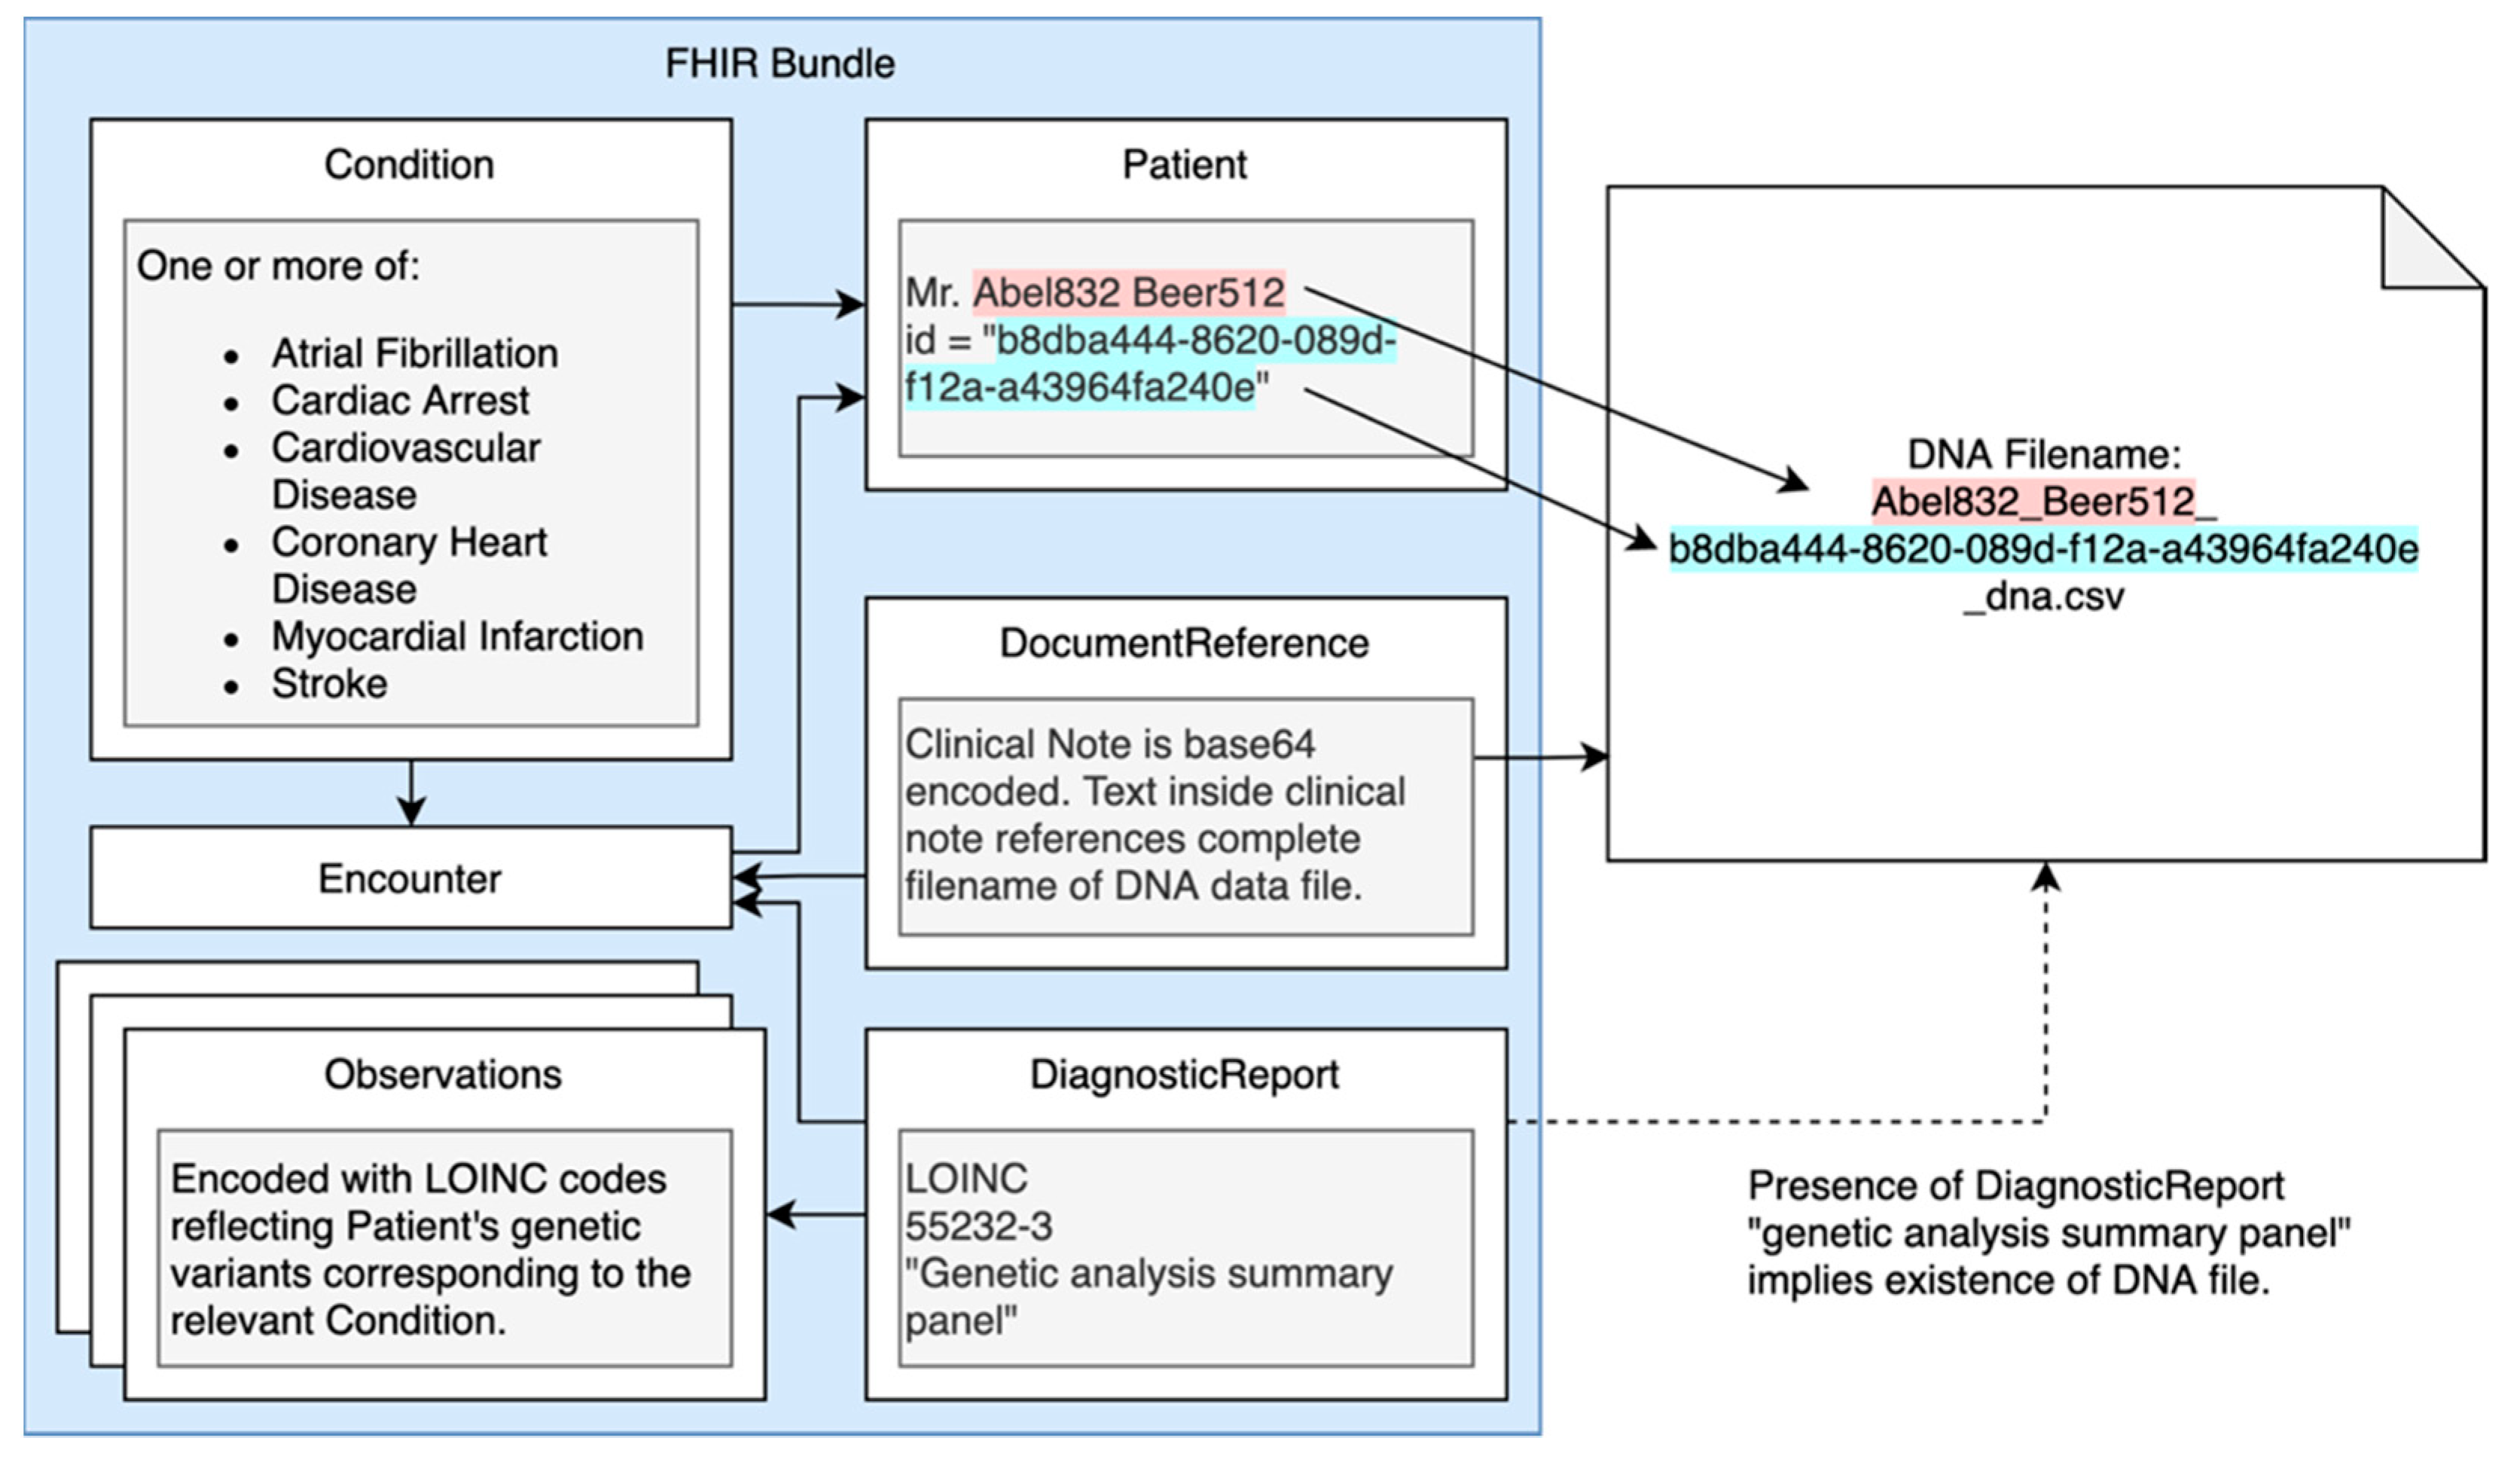
2.2. Genomics
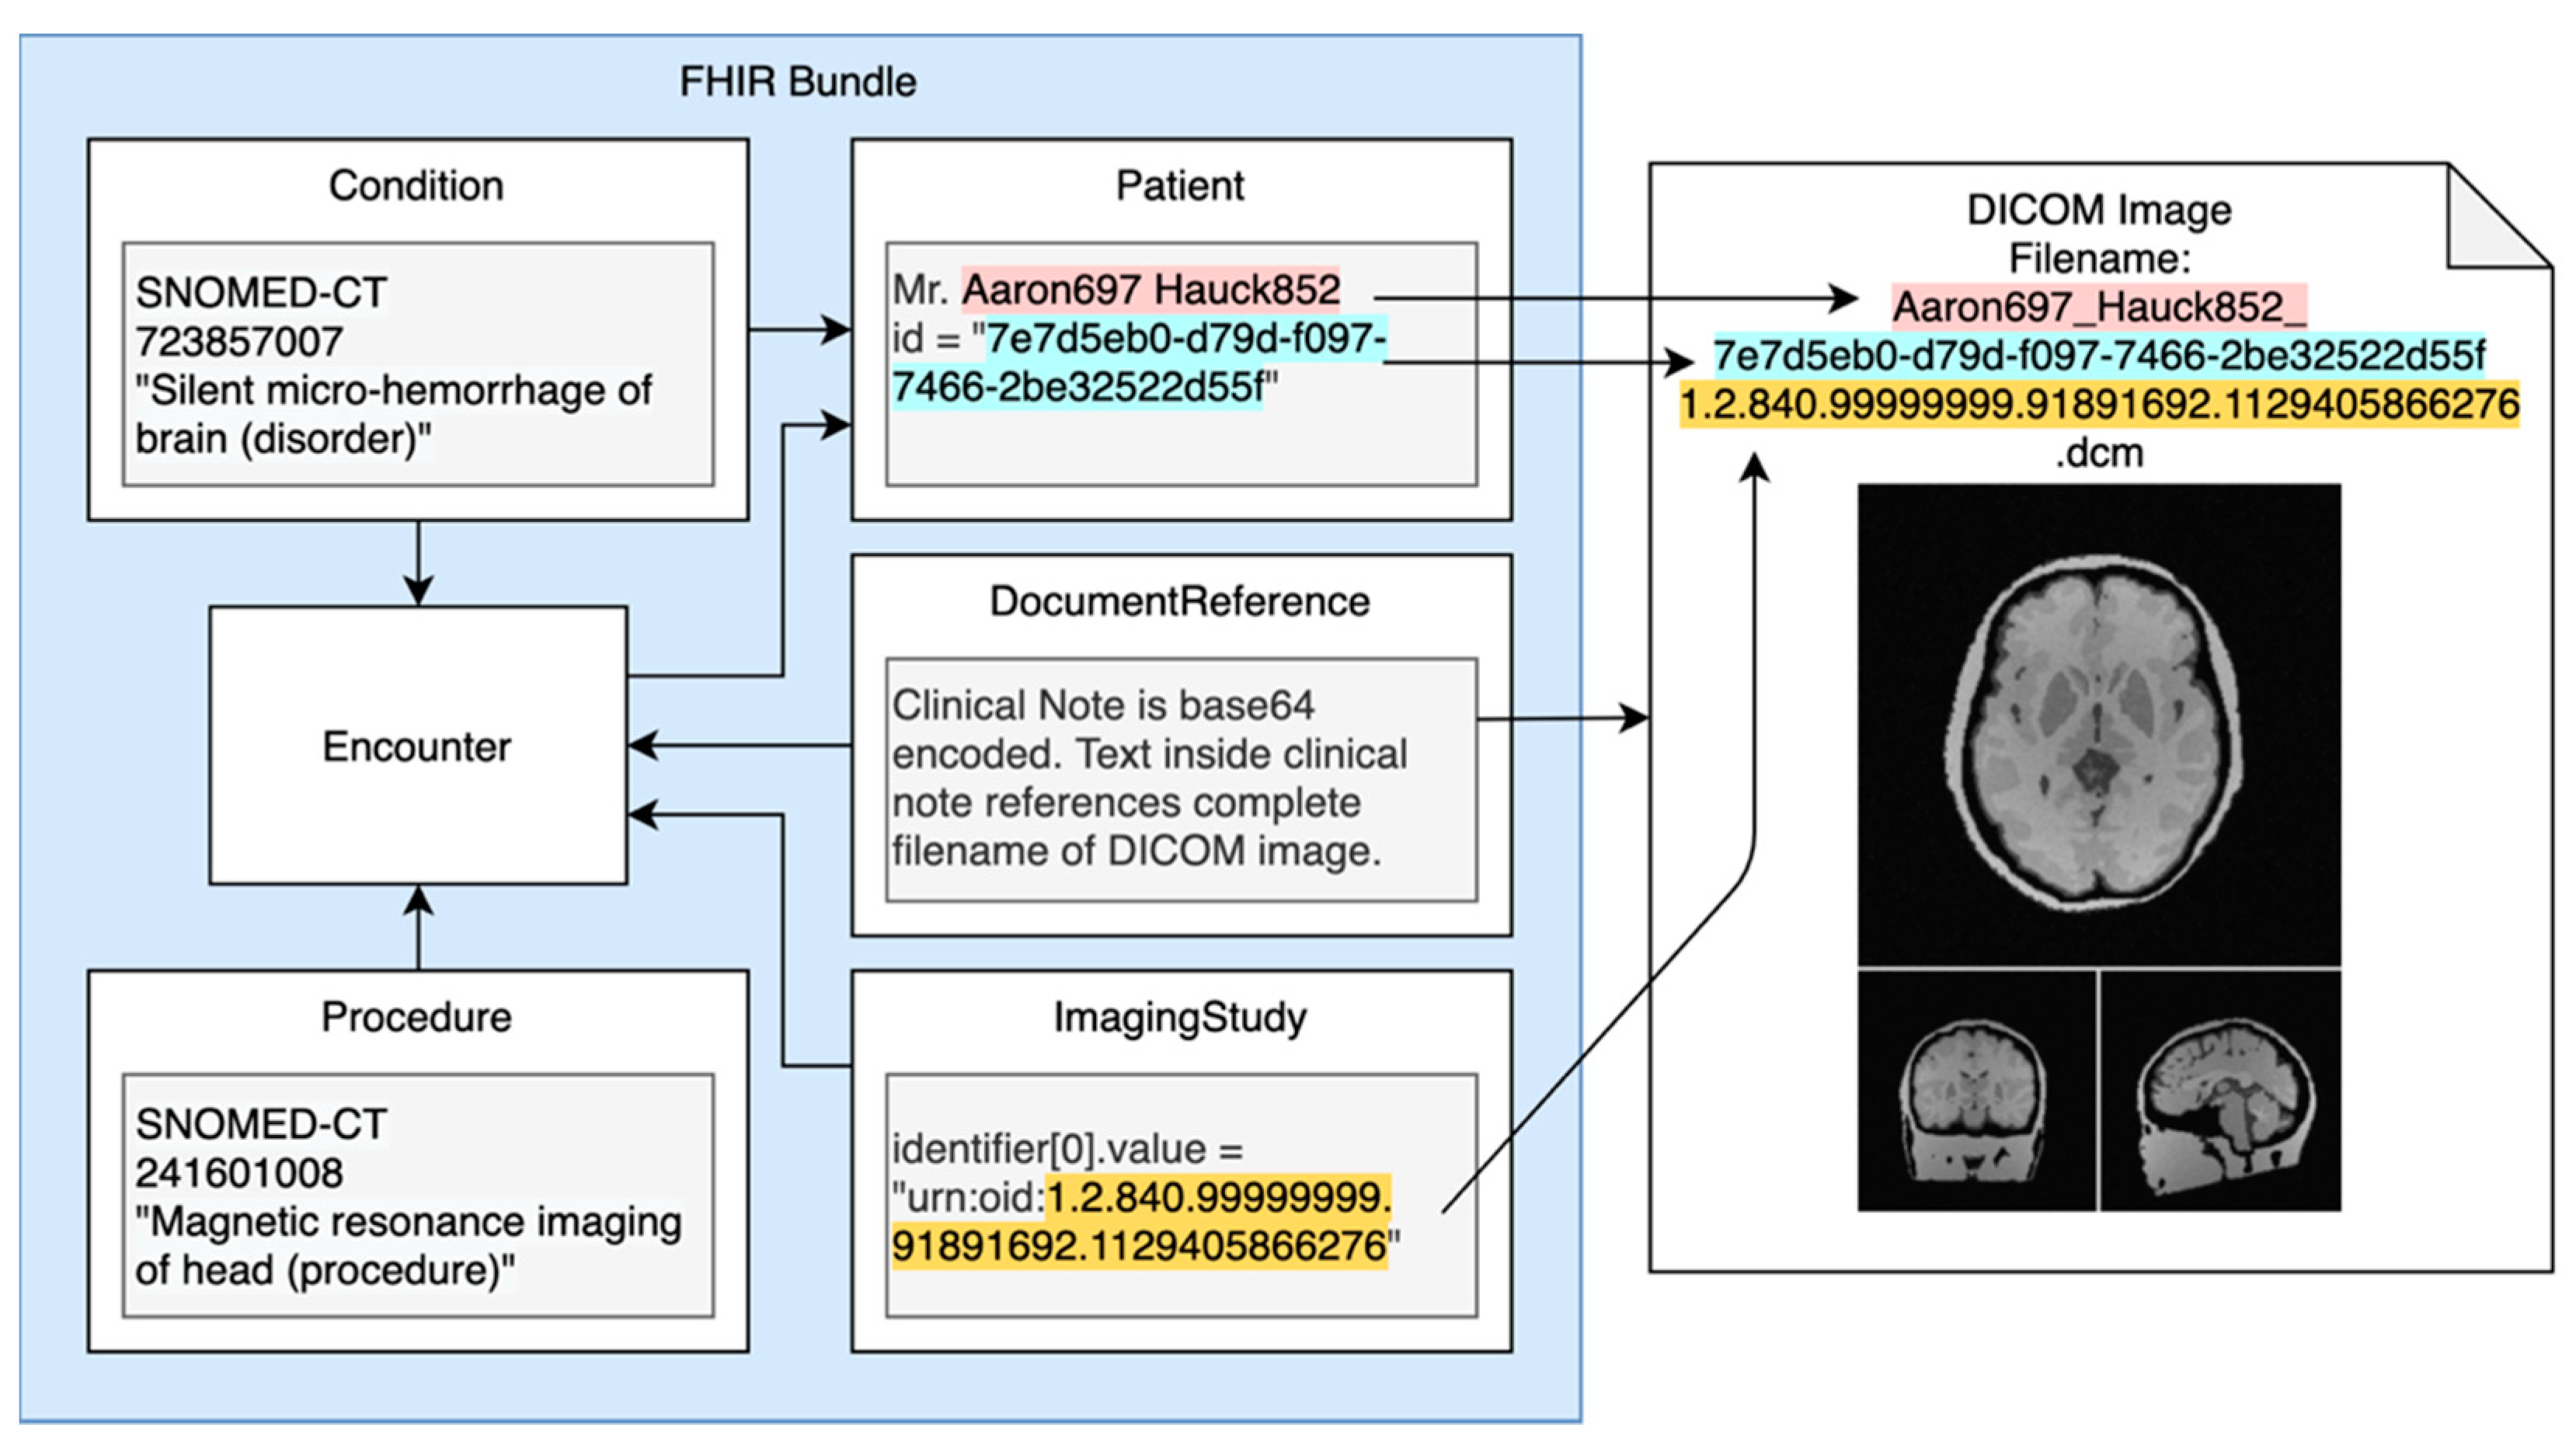
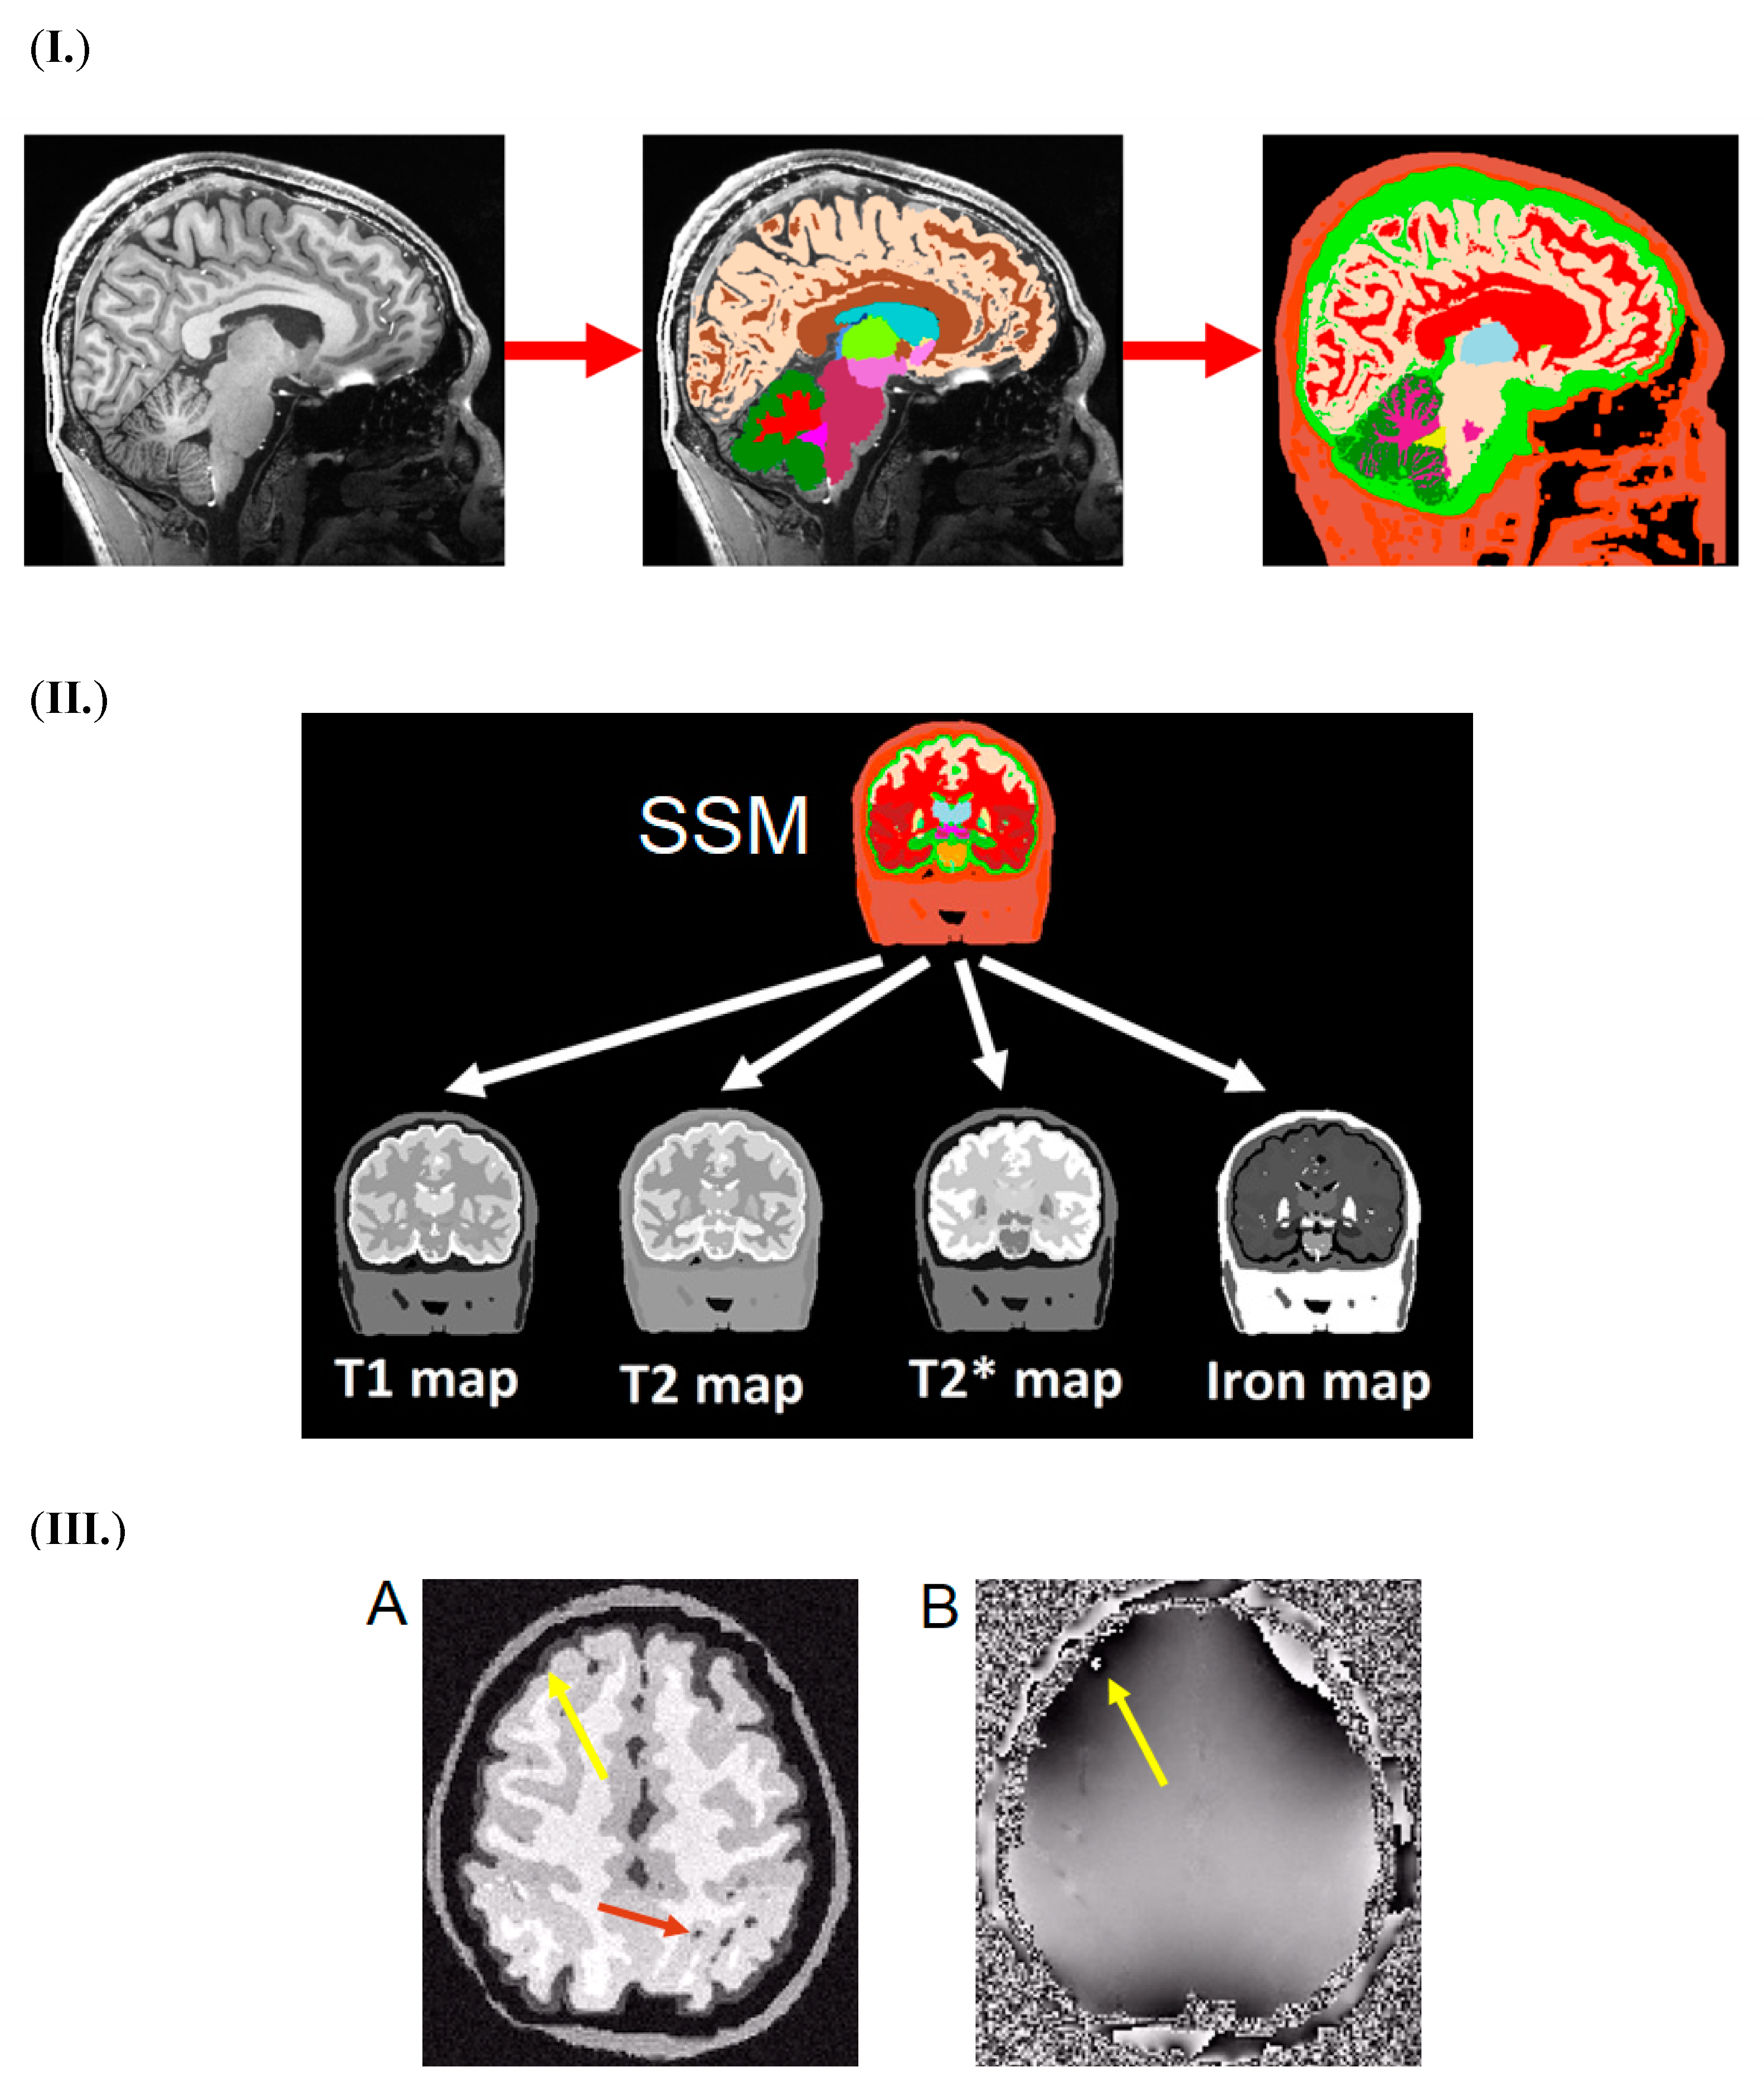
2.3. Imaging
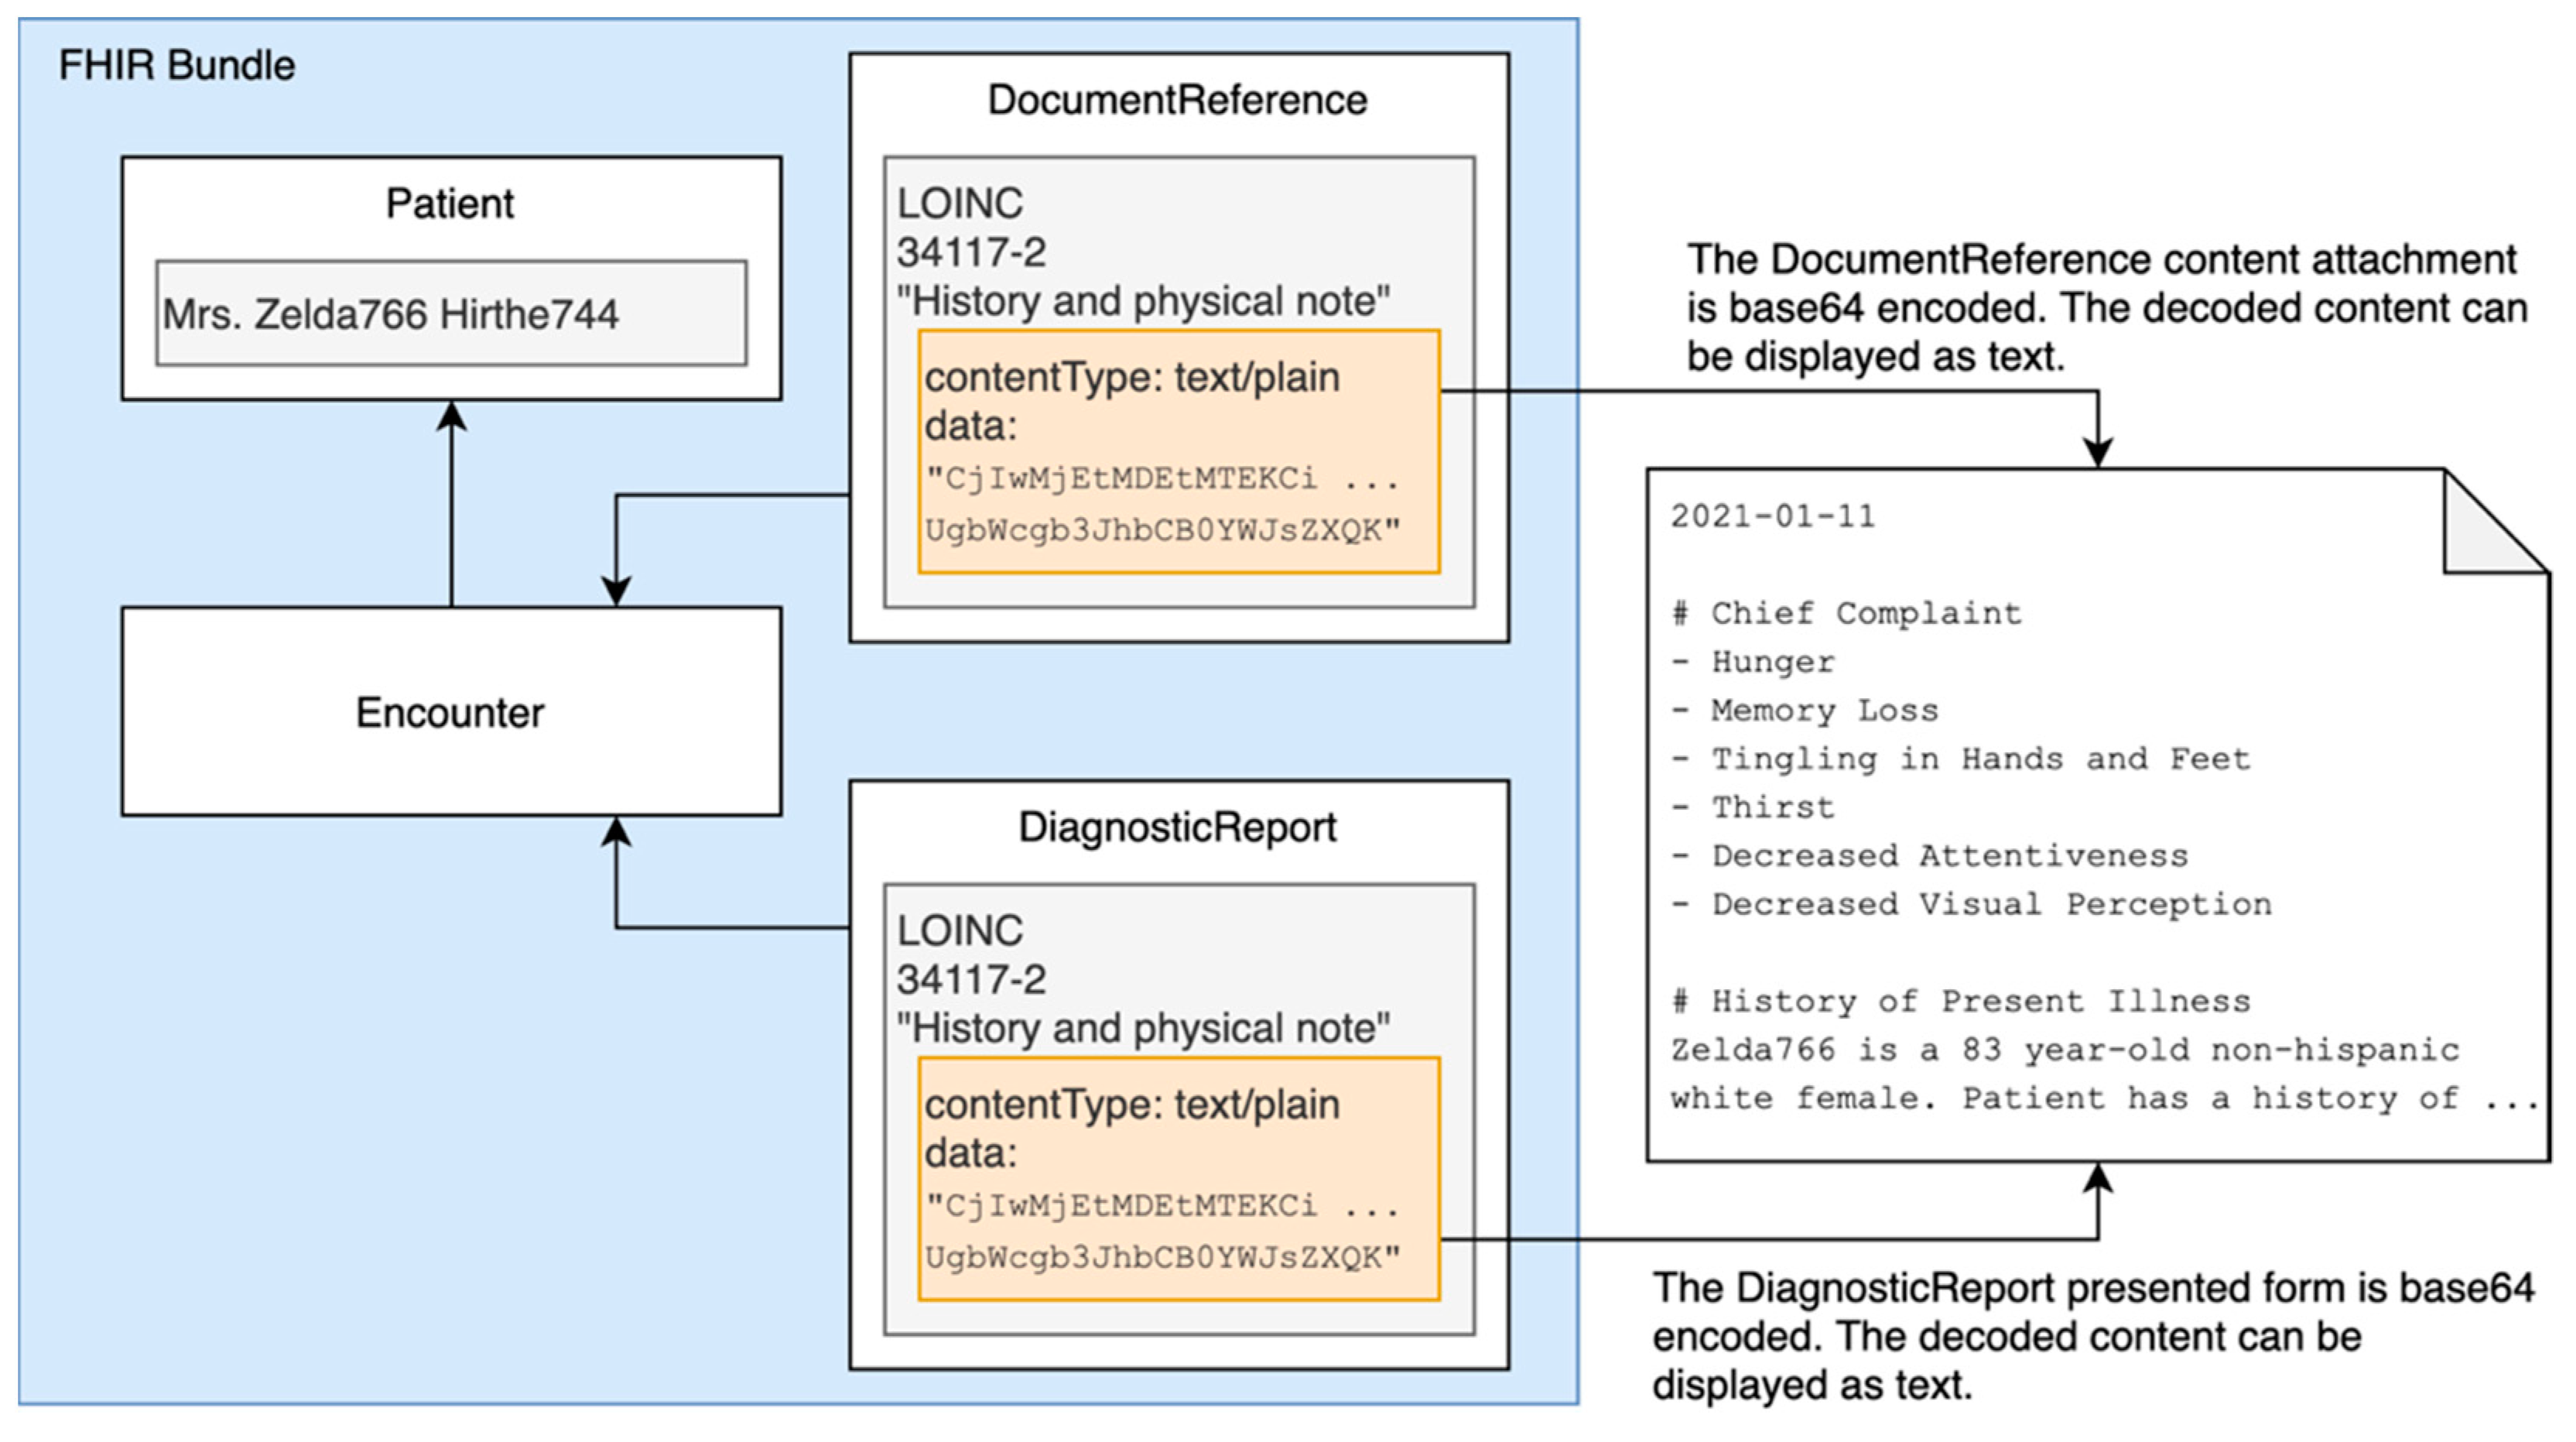
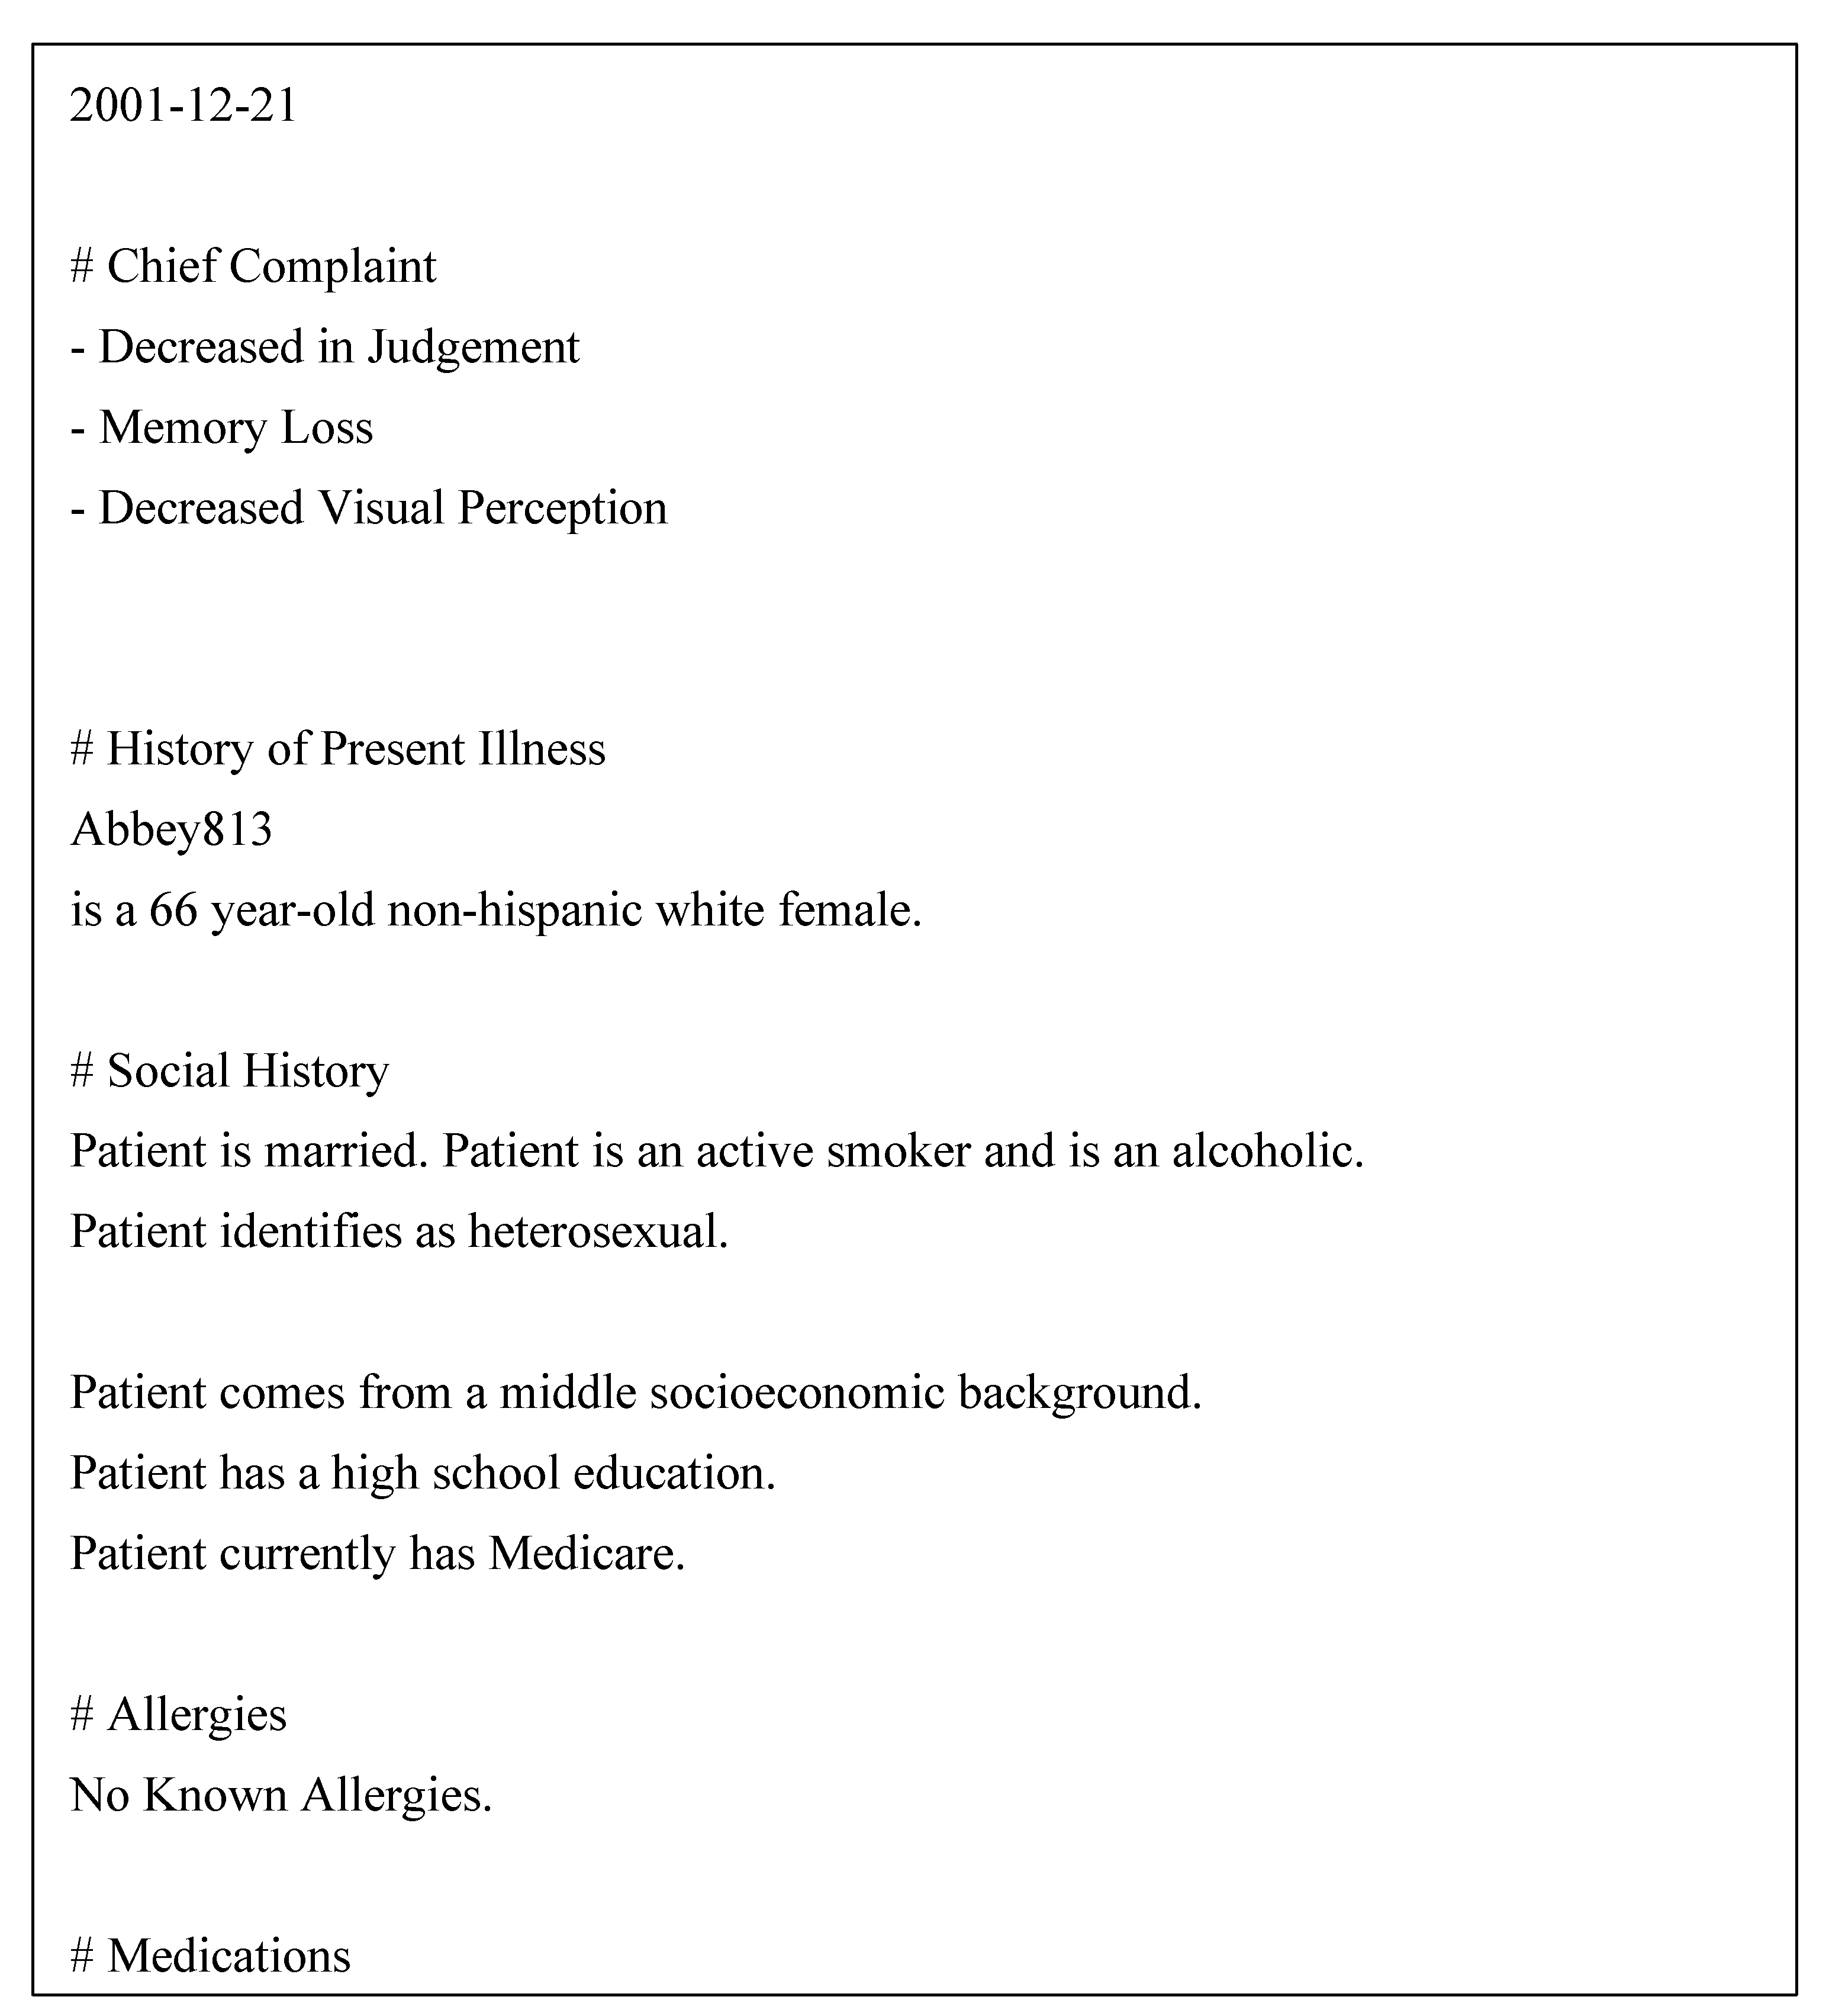
2.4. Clinical Notes
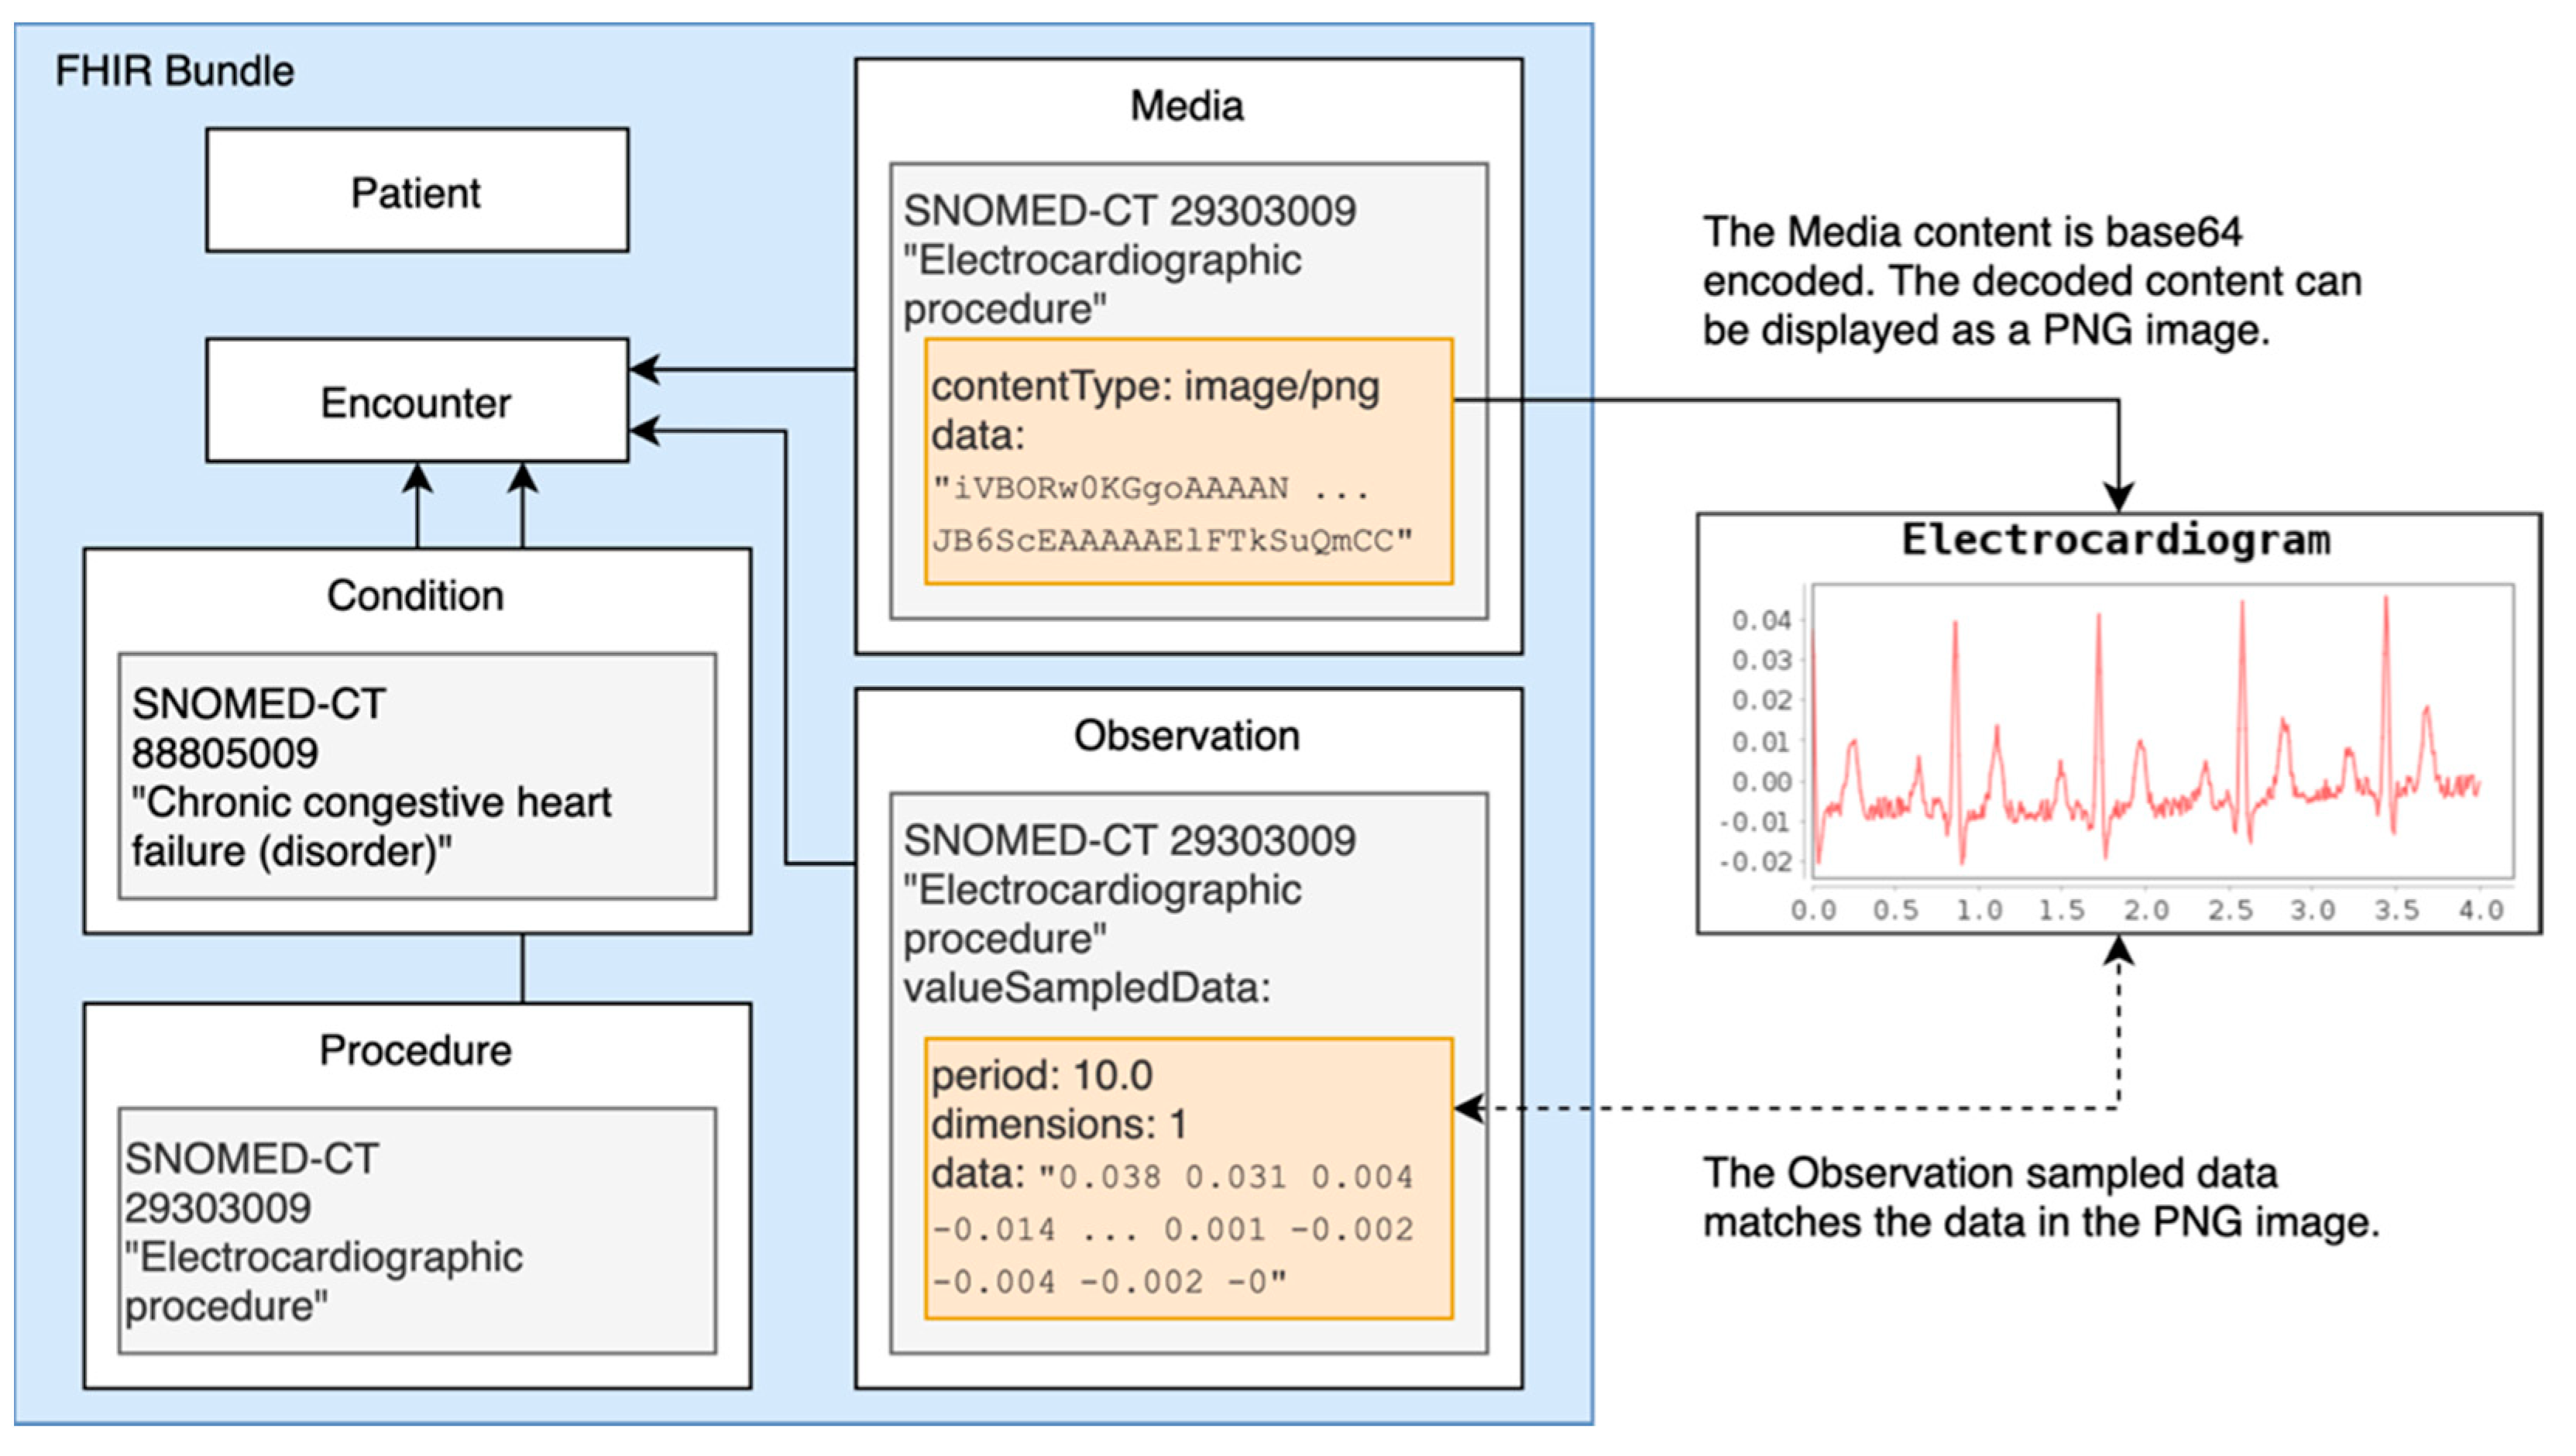
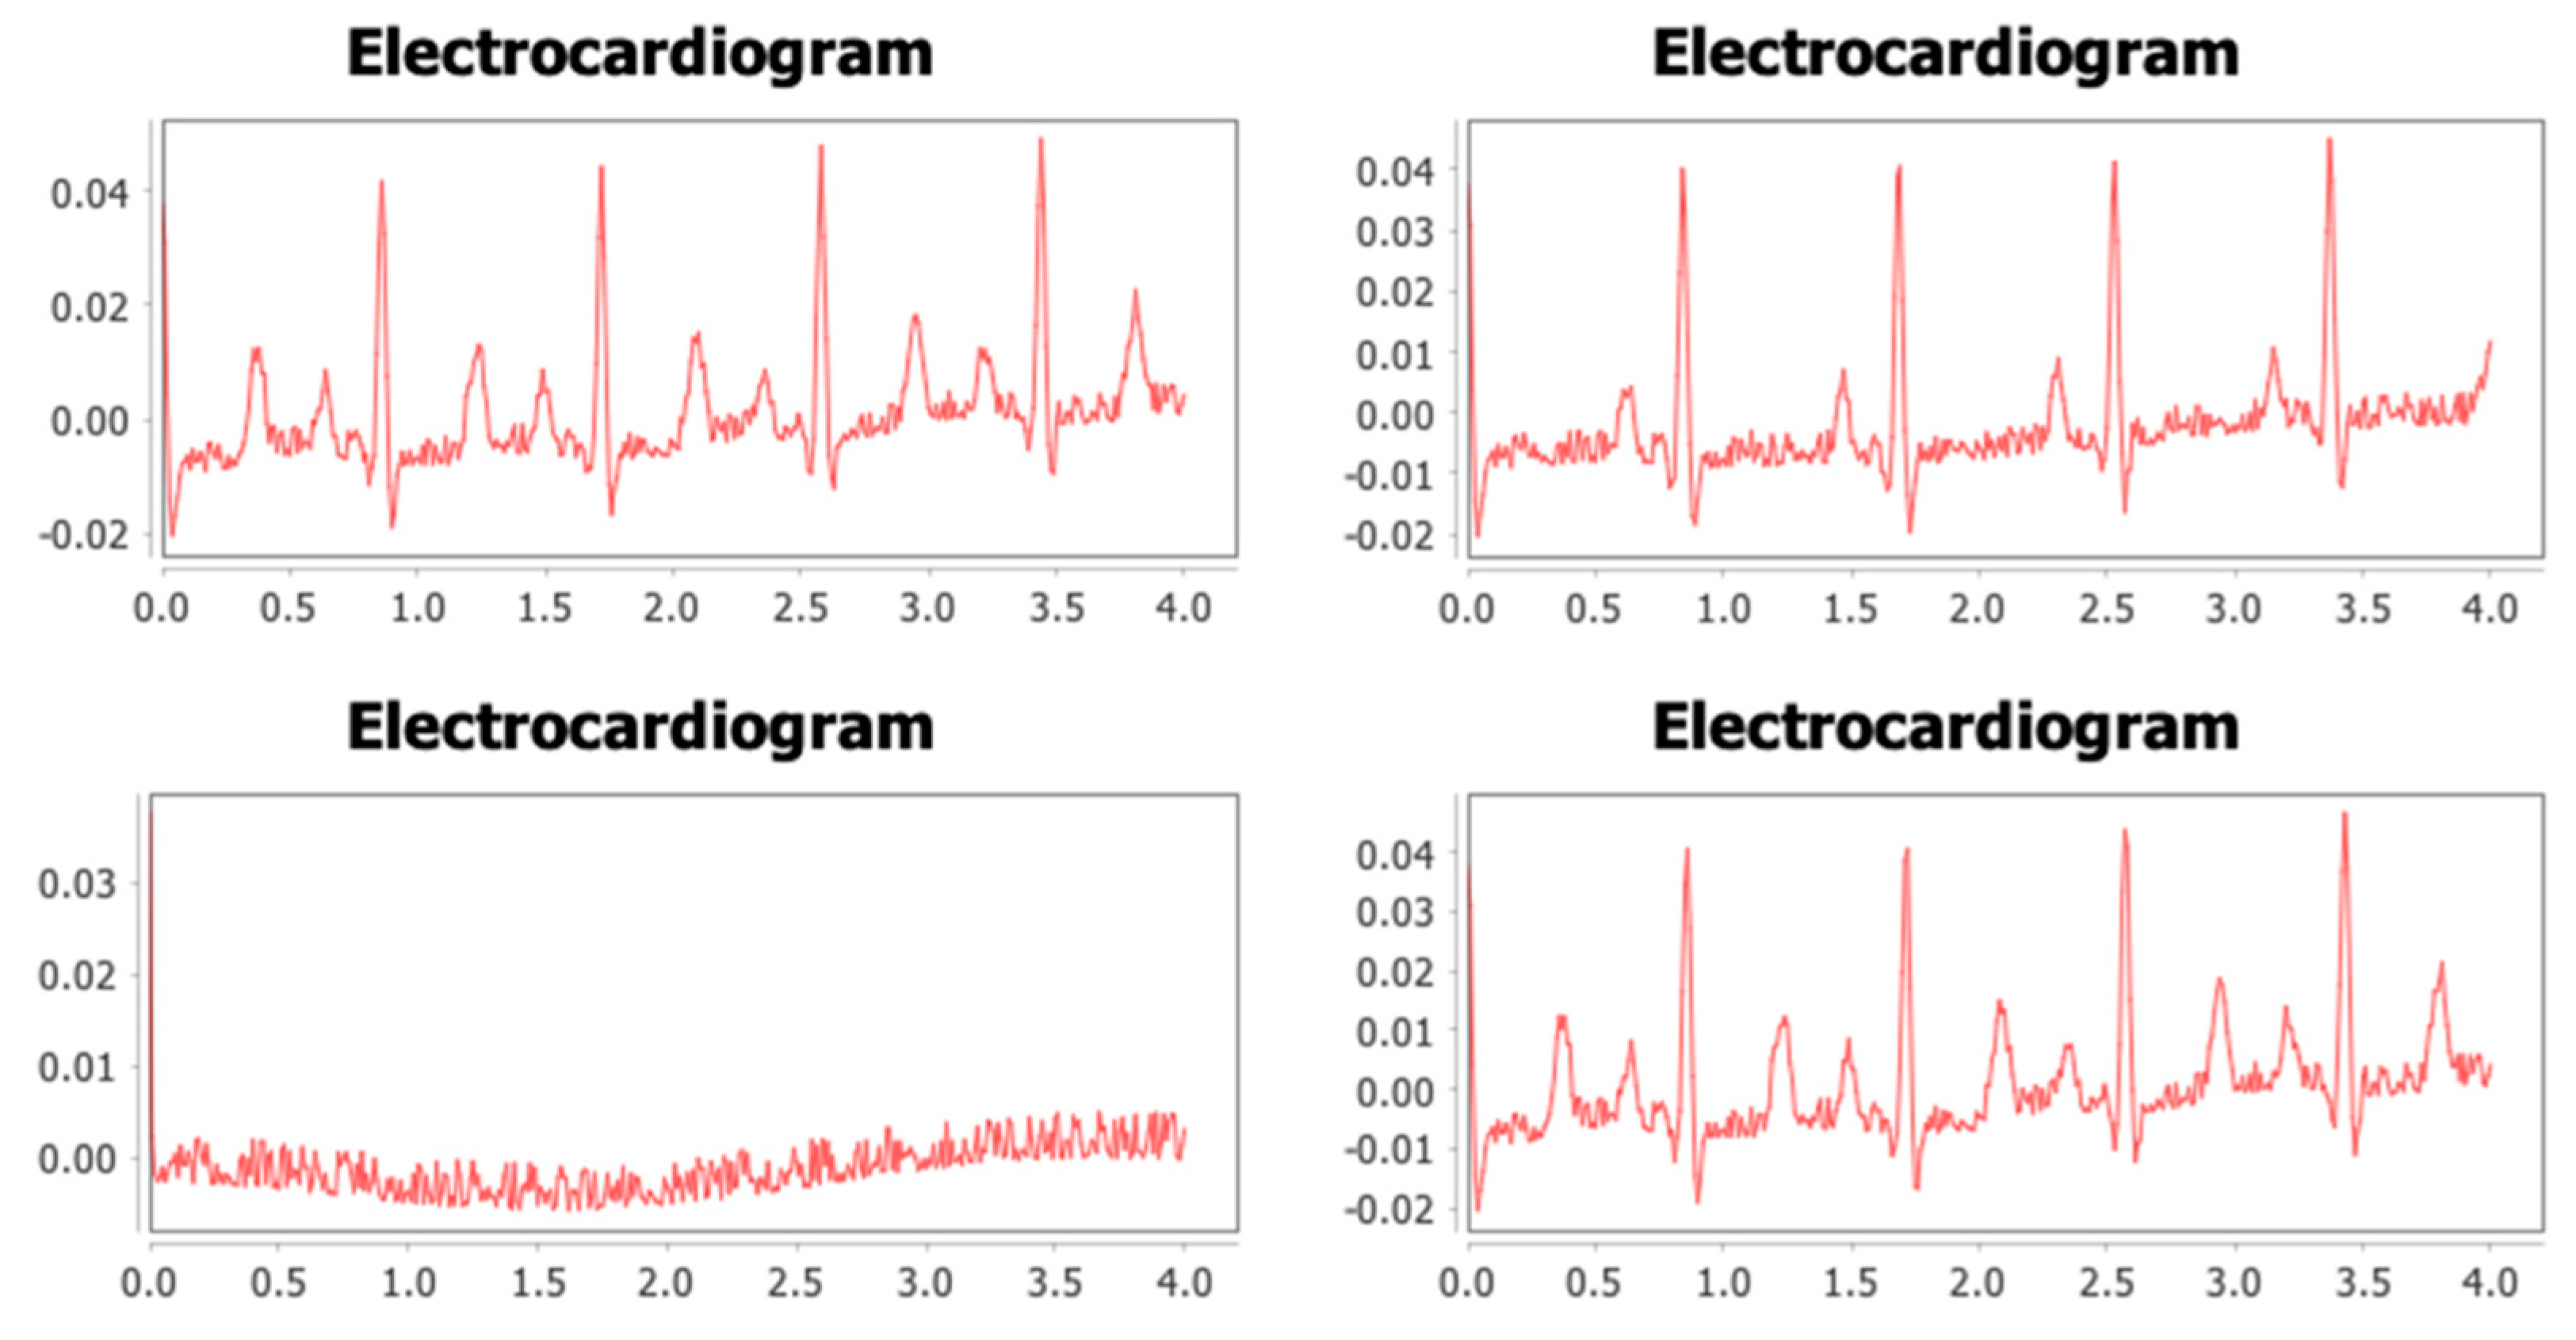
2.5. Physiology
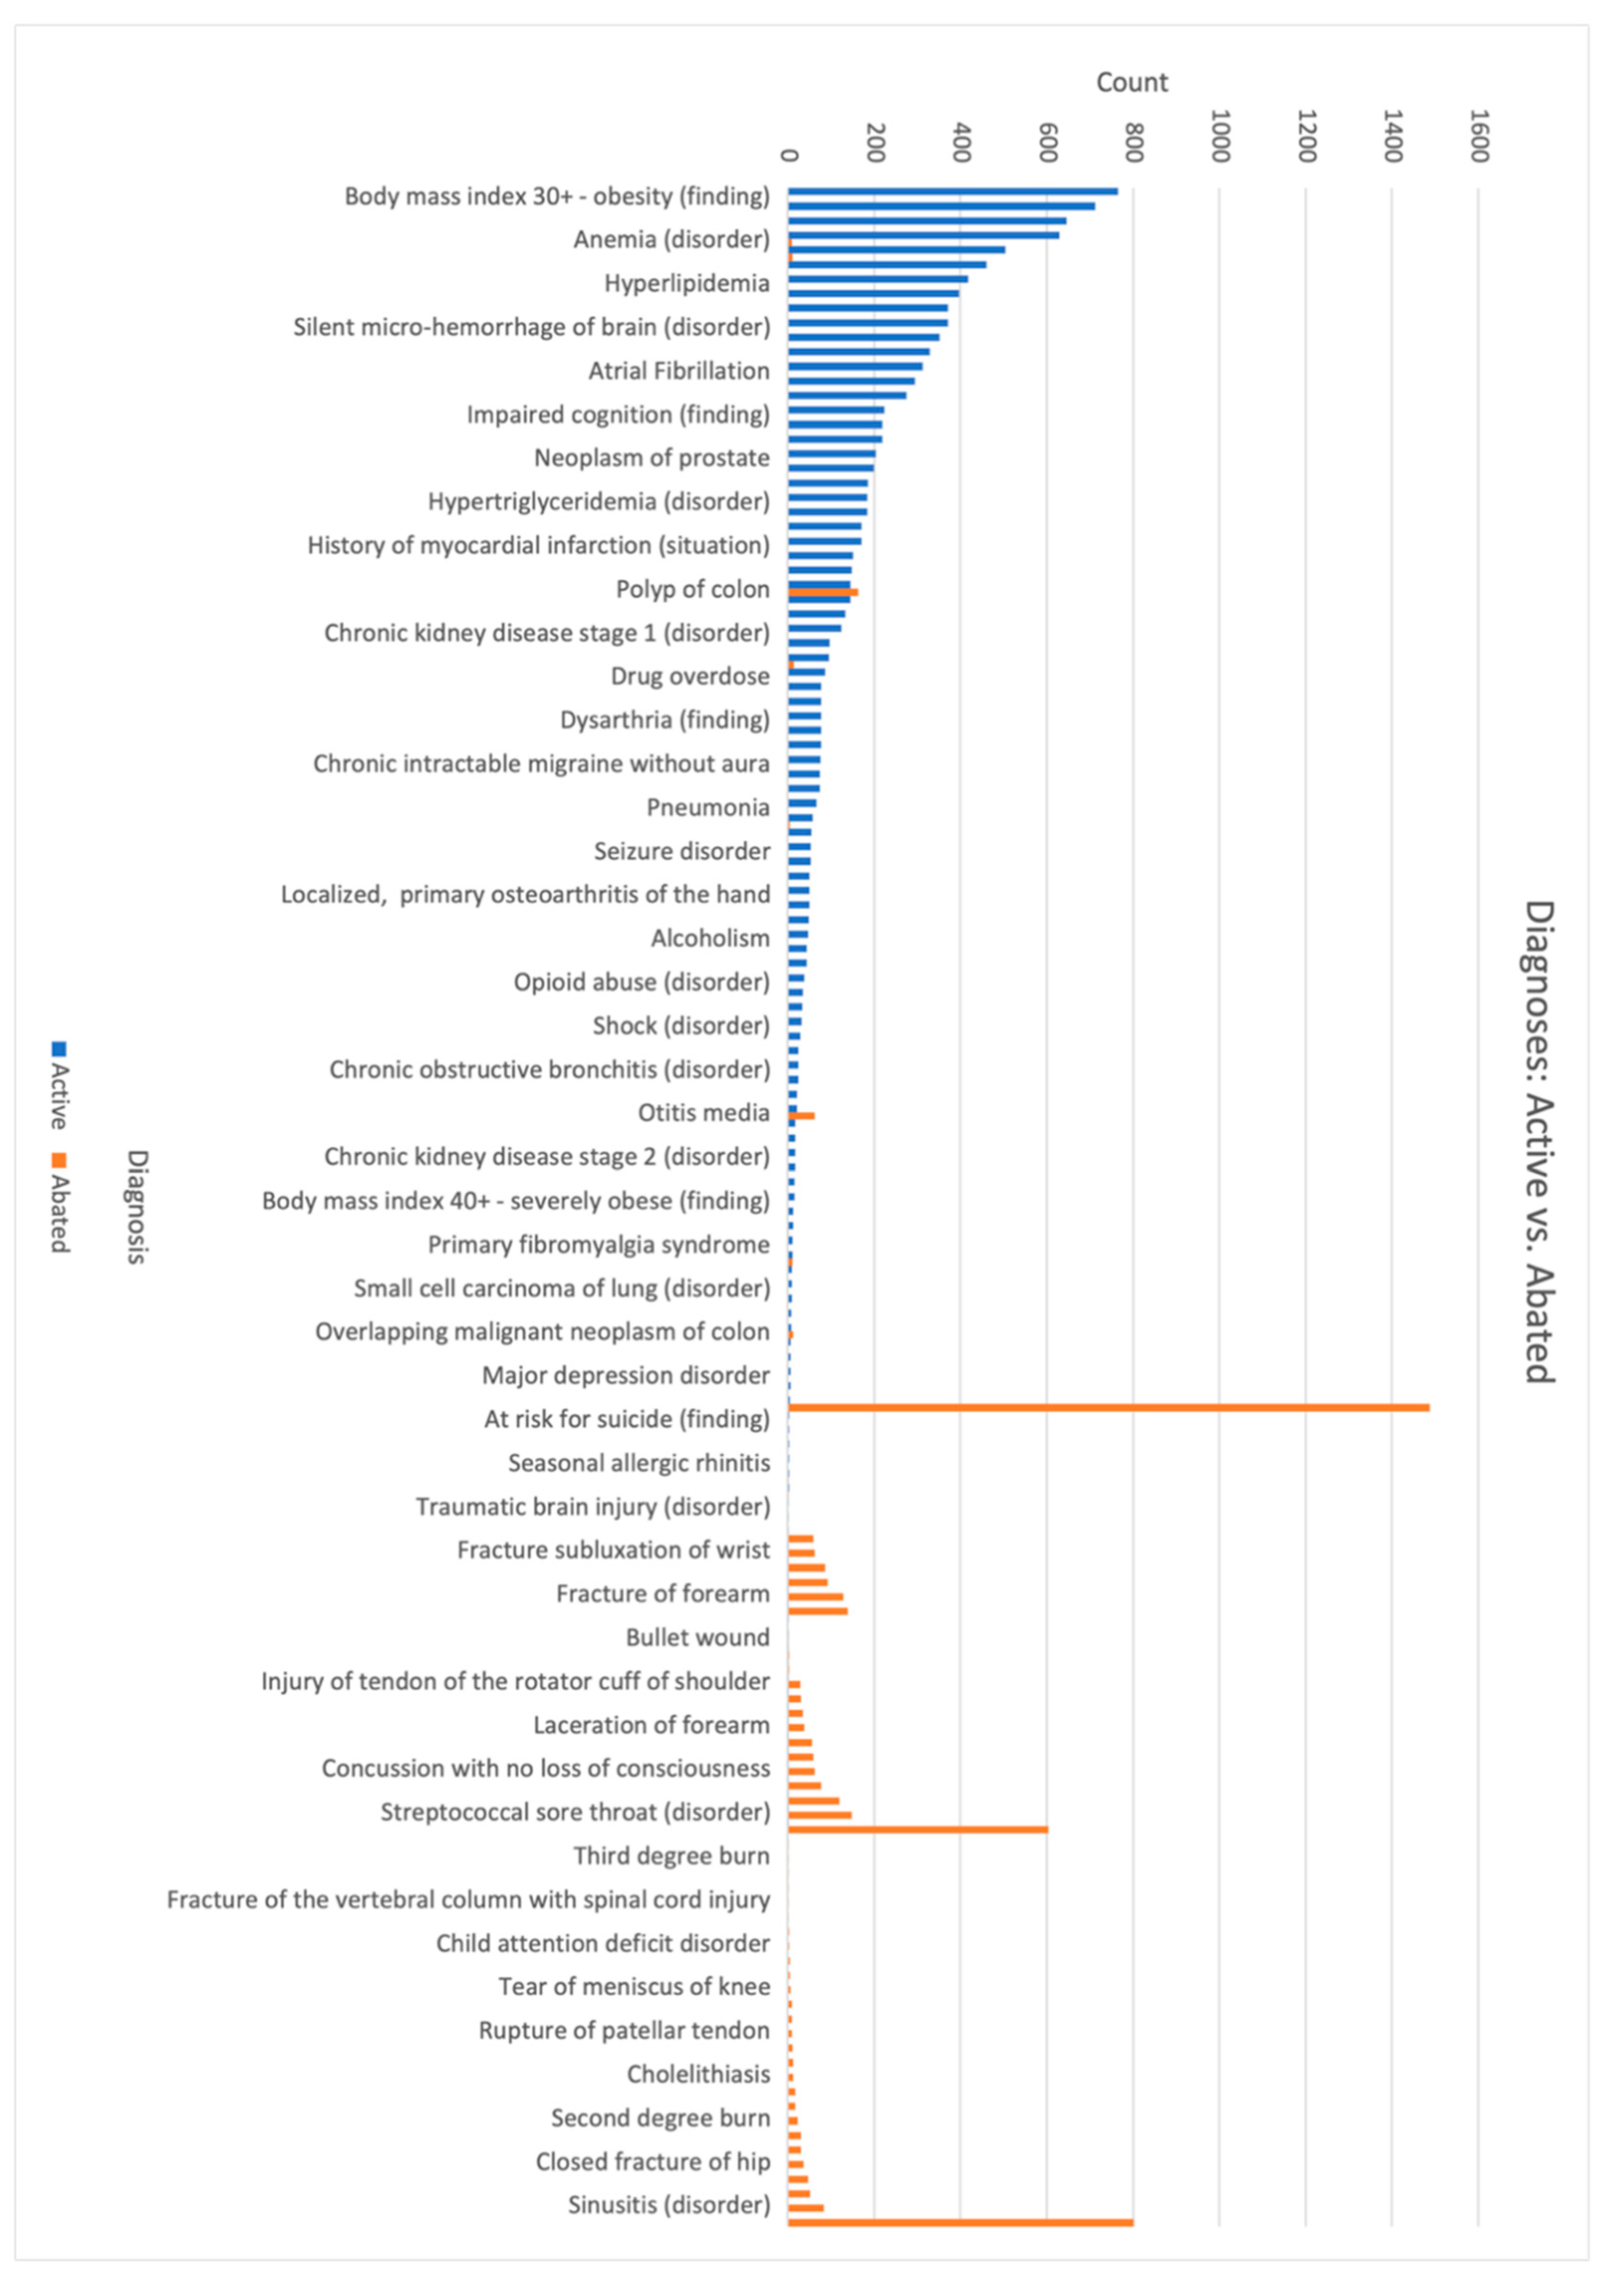
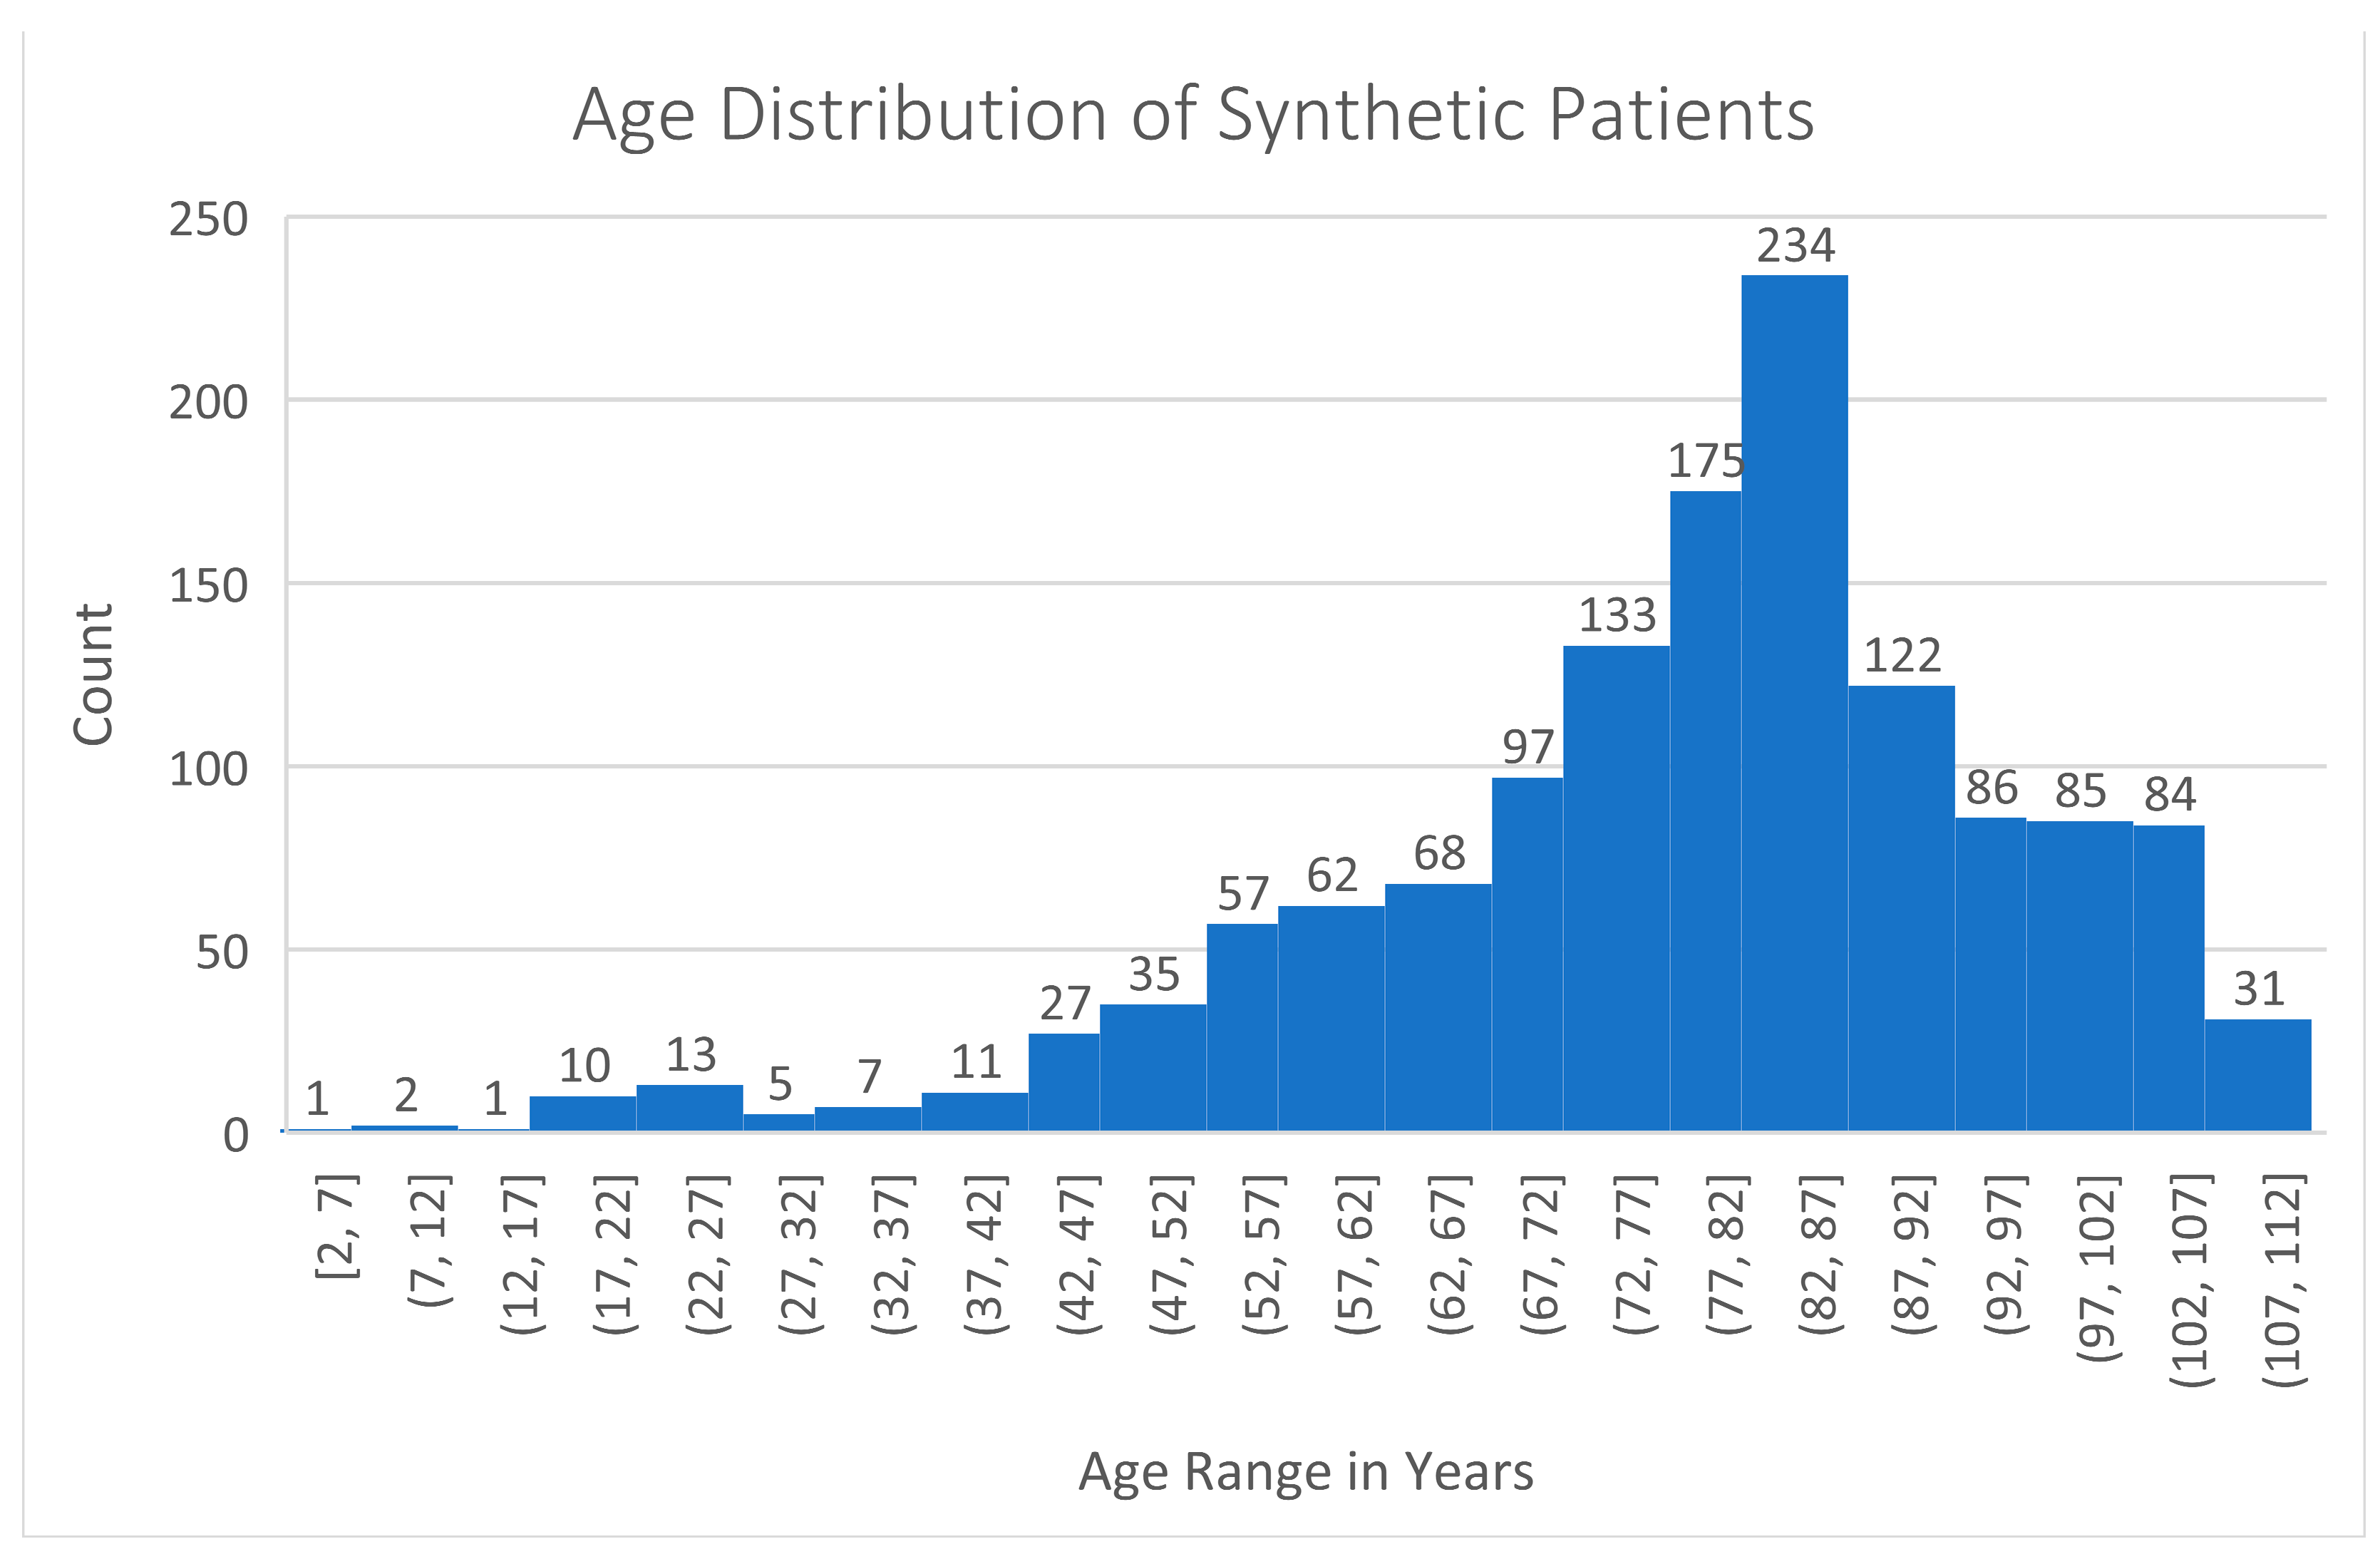
3. Results
4. Discussion
4.1. Significance of the Coherent Data Set
4.2. Validating the Results
4.3. Alternative Methods
4.4. Future Work
5. Conclusions
Supplementary Materials
Author Contributions
Funding
Data Availability Statement
Conflicts of Interest
Abbreviations
| Abbreviation | Term |
| CT | Computed Tomography |
| CVD | Cardiovascular Disease |
| ECG | Electrocardiogram |
| EHR | Electronic Health Record |
| FASTA | Text-based format for representing either nucleotide sequences or amino acid sequences |
| FHIR | Fast Health Interoperability Resources |
| FLAIR | Fluid Attenuated Inversion Recovery |
| GMF | Generic Module Framework |
| LSTM | Long Short-term Memory |
| LVEF | Left Ventricular Ejection Fraction |
| MRI | Magnetic Resonance Imaging |
| SBML | Systems Biology Markup Language |
| SNP | Single Nucleotide Polymorphism |
| TIA | Transient Ischemic Attack |
| V-fib | Ventricular Fibrillation |
Appendix A. Summary Statistics for The Coherent Data Set

| Data Type | Count |
|---|---|
| DICOM Image, DNA Data, and FHIR Bundle | 172 |
| No DICOM Image or DNA File | 289 |


References
- Rights (OCR), Office for Civil. Combined Regulation Text of All Rules. Text. HHS.gov. 7 May 2008. Available online: https://www.hhs.gov/hipaa/for-professionals/privacy/laws-regulations/combined-regulation-text/index.html (accessed on 14 March 2022).
- General Data Protection Regulation (GDPR). Recital 35-Health Data. Available online: https://gdpr-info.eu/recitals/no-35/ (accessed on 14 March 2022).
- Hussein, I.; Liu, X.; Zariffa, N.; Morris, A.D.; Denniston, A.K. Health Data Poverty: An Assailable Barrier to Equitable Digital Health Care. Lancet Digit. Health 2021, 3, e260–e265. [Google Scholar] [CrossRef]
- Jason, W.; Scanlon, R.; Dowling, C.; Hyland, M.; Ettema, R.; Posnack, S. Validation and Testing of Fast Healthcare Interoperability Resources Standards Compliance: Data Analysis. JMIR Med. Inform. 2018, 6, e10870. [Google Scholar] [CrossRef] [Green Version]
- Cao, X.; Sun, J. Health Data. In Introduction to Deep Learning for Healthcare; Springer: Cham, Switzerland, 2021; pp. 9–22. [Google Scholar] [CrossRef]
- Sweeney, L.; Abu, A.; Winn, J. Identifying Participants in the Personal Genome Project by Name. arXiv 2013, arXiv:1304.7605. Available online: https://dataprivacylab.org/projects/pgp/1021-1.pdf (accessed on 1 March 2021). [CrossRef]
- El, E.K.; Jonker, E.; Arbuckle, L.; Malin, B. A Systematic Review of Re-Identification Attacks on Health Data. PLoS ONE 2011, 6, e28071. [Google Scholar] [CrossRef] [Green Version]
- Jason, W.; Kramer, M.; Nichols, J.; Quina, A.; Hall, D.; Duffett, C.; Dube, K.; Gallagher, T.; McLachlan, S. Synthea: An Approach, Method, and Software for Generating Synthetic Patients and the Synthetic Electronic Health Care Record. J. Am. Med. Inform. Assoc. 2017, 25, 230–238. [Google Scholar] [CrossRef] [Green Version]
- Neha, P.; Wedge, R.; Veeramachaneni, K. The Synthetic Data Vault. In Proceedings of the 2016 IEEE 3rd International Conference on Data Science and Advanced Analytics, Montreal, QC, Canada, 17–19 October 2016; pp. 399–410. [Google Scholar]
- Reiner, B.A.; Almog, R.; Gorelik, Y.; Hochberg, I.; Nassar, L.; Mashiach, T.; Khamaisi, M.; Lurie, Y.; Azzam, Z.S.; Khoury, J.; et al. Analyzing Medical Research Results Based on Synthetic Data and Their Relation to Real Data Results: Systematic Comparison From Five Observational Studies. JMIR Med. Inform. 2020, 8, e16492. [Google Scholar] [CrossRef]
- Allan, T.; Wang, Z.; Rotalinti, Y.; Myles, P. Generating High-Fidelity Synthetic Patient Data for Assessing Machine Learning Healthcare Software. NPJ Digit. Med. 2020, 3, 147. [Google Scholar] [CrossRef]
- Xin, Y.; Walia, E.; Babyn, P. Generative Adversarial Network in Medical Imaging: A Review. Med. Image Anal. 2019, 58, 101552. [Google Scholar] [CrossRef] [Green Version]
- Sungeun, K.; Shen, L.; Saykin, A.J.; West, J.D. Data Synthesis and Tool Development for Exploring Imaging Genomic Patterns. In Proceedings of the 2009 IEEE Symposium on Computational Intelligence in Bioinformatics and Computational Biology, Nashville, TN, USA, 30 March–2 April 2009; pp. 298–305. [Google Scholar] [CrossRef] [Green Version]
- Edward, C.; Biswal, S.; Malin, B.; Duke, J.; Stewart, W.F.; Sun, J. Generating Multi-Label Discrete Patient Records Using Generative Adversarial Networks. arXiv 2018, arXiv:1703.06490. [Google Scholar]
- Li, J.; Zhou, Y.; Jiang, X.; Natarajan, K.; Pakhomov, S.V.; Liu, H.; Xu, H. Are Synthetic Clinical Notes Useful for Real Natural Language Processing Tasks: A Case Study on Clinical Entity Recognition. J. Am. Med. Inform. Assoc. 2021, 28, 2193–2201. [Google Scholar] [CrossRef]
- Burak, Y.; Decelle, A.; Ongaro, L.; Marnetto, D.; Tallec, C.; Montinaro, F.; Furtlehner, C.; Pagani, L.; Jay, F. Creating Artificial Human Genomes Using Generative Neural Networks. PLOS Genet. 2021, 17, e1009303. [Google Scholar] [CrossRef]
- Akram, R.; Bouaud, J.; Guézennec, G.; Gligorov, J.; Seroussi, B. Creating Synthetic Patients to Address Interoperability Issues: A Case Study with the Management of Breast Cancer Patients. Stud. Health Technol. Inform. 2020, 275, 177–181. [Google Scholar] [CrossRef]
- Simon, S.; Gehrke, M.; Möller, R. Efficient Enriching of Synthesized Relational Patient Data with Time Series Data. Procedia Comput. Sci. 2018, 141, 531–538. [Google Scholar] [CrossRef]
- HL7. FHIR. Available online: http://hl7.org/fhir/ (accessed on 5 March 2021).
- CDC. Heart Disease Facts|Cdc.Gov. Centers for Disease Control and Prevention. 2020. Available online: https://www.cdc.gov/heartdisease/facts.htm (accessed on 1 March 2021).
- National Center for Biotechnology Information. SNP FAQ Archive [Internet]. Bethesda, Rockville, MD, USA. 2005. Available online: https://www.ncbi.nlm.nih.gov/books/NBK44417/ (accessed on 1 March 2021).
- 1000 Genomes|A Deep Catalog of Human Genetic Variation. Available online: https://www.internationalgenome.org/ (accessed on 1 March 2021).
- Giacomo, T.; Scagliola, R.; Monacelli, F.; la Malfa, G.; Porto, I.; Brunelli, C.; Rosa, G.M. Alzheimer’s Disease and Cardiovascular Disease: A Particular Association. Cardiol. Res. Pract. 2020, 2020, 2617970. [Google Scholar] [CrossRef]
- Els, F.; Lee, H.-H. Physical and Numerical Phantoms for the Validation of Brain Microstructural MRI: A Cookbook. NeuroImage 2018, 182, 39–61. [Google Scholar] [CrossRef]
- Kwan, R.K.S.; Evans, A.C.; Pike, B. MRI Simulation-Based Evaluation of Image-Processing and Classification Methods. IEEE Trans. Med. Imaging 1999, 18, 1085–1097. [Google Scholar] [CrossRef]
- Marques, J.P.; Meineke, J.; Milovic, C.; Bilgic, B.; Chan, K.-S.; Hedouin, R.; Van Der Zwaag, W.; Langkammer, C.; Schweser, F. QSM Reconstruction Challenge 2.0: A Realistic in Silico Head Phantom for MRI Data Simulation and Evaluation of Susceptibility Mapping Procedures. Magn. Reson. Med. 2021, 86, 526–542. [Google Scholar] [CrossRef]
- Martin, R.; Schmansky, N.J.; Rosas, H.D.; Fischl, B. Within-Subject Template Estimation for Unbiased Longitudinal Image Analysis. NeuroImage 2012, 61, 1402–1418. [Google Scholar] [CrossRef] [Green Version]
- Teresa, W.; Hirshkowitz, A. Musculoskeletal MRI at 3.0T and 7.0T: A Comparison of Relaxation Times and Image Contrast. Eur. J. Radiol. 2015, 85, 734–739. [Google Scholar]
- Spijkerman, J.M.; Petersen, E.T.; Hendrikse, J.; Luijten, P.; Zwanenburg, J.J.M. T 2 Mapping of Cerebrospinal Fluid: 3 T versus 7 T. Magn. Reson. Mater. Phys. Biol. Med. 2018, 31, 415–424. [Google Scholar] [CrossRef] [Green Version]
- Bojorquez, J.Z.; Bricq, S.; Acquitter, C.; Brunotte, F.; Walker, P.M.; Lalande, A. What Are Normal Relaxation Times of Tissues at 3 T? Magn. Reson. Imaging 2017, 35, 69–80. [Google Scholar] [CrossRef] [PubMed]
- Kimm, S.; Kumar, R.; Delshad, S.; Macey, P.M.; Woo, M.A.; Harper, R.M. Development of T2-Relaxation Values in Regional Brain Sites during Adolescence. Engl. J. 2002, 347, 709–715. [Google Scholar] [CrossRef] [PubMed]
- Zhao, J.M.; Clingman, C.S.; Narvainen, J.; Kauppinen, R.A.; van Zijl, P. Oxygenation and Hematocrit Dependence of Blood T2 and T2* at 3T. Magn. Reson. Med. 2007, 13, 3199. [Google Scholar]
- Peters, A.M.; Brookes, M.J.; Hoogenraad, F.G.; Gowland, P.A.; Francis, S.T.; Morris, P.G.; Bowtell, R. T2* Measurements in Human Brain at 1.5, 3 and 7 T. Magn. Reson. Imaging 2007, 25, 748–753. [Google Scholar] [CrossRef]
- Langkammer, C.; Krebs, N.; Goessler, W.; Scheurer, E.; Ebner, F.; Yen, K.; Fazekas, F.; Ropele, S. Quantitative MR Imaging of Brain Iron: A Postmortem Validation Study. Radiology 2010, 257, 455–462. [Google Scholar] [CrossRef]
- Keenan, K.E.; Berman, B.P.; Rýger, S.; Russek, S.E.; Wang, W.-T.; Butman, J.A.; Pham, D.L.; Dagher, J. Comparison of Phase Estimation Methods for Quantitative Susceptibility Mapping Using a Rotating-Tube Phantom. Radiol. Res. Pract. 2021, 2021, 1898461. [Google Scholar] [CrossRef]
- Nael, K.; Dagher, J.C.; Downs, M.E.; Fine, M.S.; Brokaw, E.; Millward, D. Maximum AmbiGuity Distance for Phase Imaging in Detection of Traumatic Cerebral Microbleeds: An Improvement over Current Imaging Practice. Am. J. Neuroradiol. 2020, 41, 2027–2033. [Google Scholar] [CrossRef]
- Yao, B.; Li, T.-Q.; van Gelderen, P.; Shmueli, K.; de Zwart, J.A.; Duyn, J.H. Susceptibility Contrast in High Field MRI of Human Brain as a Function of Tissue Iron Content. NeuroImage 2009, 44, 1259–1266. [Google Scholar] [CrossRef] [Green Version]
- Langkammer, C.; Schweser, F.; Krebs, N.; Deistung, A.; Goessler, W.; Scheurer, E.; Sommer, K.; Reishofer, G.; Yen, K.; Fazekas, F.; et al. Quantitative Susceptibility Mapping (QSM) as a Means to Measure Brain Iron? A Post Mortem Validation Study. NeuroImage 2012, 62, 1593–1599. [Google Scholar] [CrossRef] [Green Version]
- Johnson, A.E.W.; Pollard, T.J.; Shen, L.; Lehman, L.H.; Feng, M.; Ghassemi, M.; Moody, B.; Szolovits, P.; Celi, L.A.; Mark, R.G. MIMIC-III, a Freely Accessible Critical Care Database. Sci. Data 2016, 3, 160035. [Google Scholar] [CrossRef] [Green Version]
- Podder, V.; Lew, V.; Ghassemzadeh, S. SOAP Notes. In StatPearls; StatPearls Publishing: Treasure Island, FL, USA, 2021. Available online: http://www.ncbi.nlm.nih.gov/books/NBK482263/ (accessed on 3 March 2021).
- McSharry, P.E.; Clifford, G.D.; Tarassenko, L.; Smith, L.A. A Dynamic Model for Generating Synthetic Electrocardiogram Signals. IEEE Trans. Biomed. Eng. 2003, 50, 289–294. [Google Scholar] [CrossRef] [PubMed] [Green Version]
- Smith, B.W.; Chase, J.G.; Nokes, R.I.; Shaw, G.M.; Wake, G. Minimal Haemodynamic System Model Including Ventricular Interaction and Valve Dynamics. Med. Eng. Phys. 2004, 26, 131–139. [Google Scholar] [CrossRef] [PubMed] [Green Version]
- CellML Model Repository—Physiome Model Repository. Available online: https://models.cellml.org/cellml (accessed on 3 March 2021).
- Hosseini, M.; Baikpour, M.; Yousefifard, M.; Fayaz, M.; Koohpayehzadeh, J.; Ghelichkhani, P.; Asady, H.; Asgari, F.; Etemad, K.; Rafei, A.; et al. Blood Pressure Percentiles by Age and Body Mass Index for Adults. EXCLI J. 2015, 14, 465–477. [Google Scholar] [CrossRef] [PubMed]


| Data Type | Count |
|---|---|
| DICOM Image | 298 |
| DNA Data | 949 |
| FHIR Bundle | 1346 |
| Data Type | DICOM Image | DNA Data | FHIR Bundle |
|---|---|---|---|
| DICOM Image | 298 | 172 | 298 |
| DNA Data | 172 | 949 | 931 |
| FHIR Bundle | 298 | 931 | 1346 |
| FHIR Resources | Count |
|---|---|
| Observation (includes genetic variants and ECG sampled data) | 712,512 |
| Claim | 379,511 |
| MedicationRequest | 225,996 |
| DiagnosticReport (includes Clinical notes and Genetic Panels) | 213,729 |
| Encounter | 153,515 |
| DocumentReference (includes clinical notes) | 153,515 |
| ExplanationOfBenefit | 153,515 |
| Procedure (includes MRI scans and EKGs) | 62,186 |
| Condition (includes relevant diagnoses) | 16,585 |
| Immunization | 12,281 |
| CareTeam | 6381 |
| CarePlan | 6381 |
| Medication | 1227 |
| MedicationAdministration | 1227 |
| ImagingStudy (includes DICOM images) | 3764 |
| Bundle | 1346 |
| Patient | 1346 |
| Provenance | 1346 |
| Device | 489 |
| AllergyIntolerance | 145 |
| Media (electrocardiogram images) | 1156 |
Publisher’s Note: MDPI stays neutral with regard to jurisdictional claims in published maps and institutional affiliations. |
© 2022 by the authors. Licensee MDPI, Basel, Switzerland. This article is an open access article distributed under the terms and conditions of the Creative Commons Attribution (CC BY) license (https://creativecommons.org/licenses/by/4.0/).
Share and Cite
Walonoski, J.; Hall, D.; Bates, K.M.; Farris, M.H.; Dagher, J.; Downs, M.E.; Sivek, R.T.; Wellner, B.; Gregorowicz, A.; Hadley, M.; et al. The “Coherent Data Set”: Combining Patient Data and Imaging in a Comprehensive, Synthetic Health Record. Electronics 2022, 11, 1199. https://doi.org/10.3390/electronics11081199
Walonoski J, Hall D, Bates KM, Farris MH, Dagher J, Downs ME, Sivek RT, Wellner B, Gregorowicz A, Hadley M, et al. The “Coherent Data Set”: Combining Patient Data and Imaging in a Comprehensive, Synthetic Health Record. Electronics. 2022; 11(8):1199. https://doi.org/10.3390/electronics11081199
Chicago/Turabian StyleWalonoski, Jason, Dylan Hall, Karen M. Bates, M. Heath Farris, Joseph Dagher, Matthew E. Downs, Ryan T. Sivek, Ben Wellner, Andrew Gregorowicz, Marc Hadley, and et al. 2022. "The “Coherent Data Set”: Combining Patient Data and Imaging in a Comprehensive, Synthetic Health Record" Electronics 11, no. 8: 1199. https://doi.org/10.3390/electronics11081199