Review

Survey of Credit Card Anomaly and Fraud Detection Using Sampling Techniques

Information System Department, College of Computer and Information Sciences, King Saud University, Riyadh 11543, Saudi Arabia
*
Author to whom correspondence should be addressed.
Electronics 2022, 11(23), 4003; https://doi.org/10.3390/electronics11234003
Submission received: 8 October 2022 / Revised: 16 November 2022 / Accepted: 25 November 2022 / Published: 2 December 2022
(This article belongs to the Section Artificial Intelligence)

Abstract

:
The rapid growth in e-commerce has resulted in an increasing number of people shopping online. These shoppers depend on credit cards as a payment method or use mobile wallets to pay for their purchases. Thus, credit cards have become the main payment method in the e-world. Given the billions of transactions that occur daily, criminals see tremendous opportunities to be gained from finding different ways of attacking and stealing credit card information. Fraudulent credit card transactions are a serious business issue, and such ‘scams’ can result in significant financial and personal losses. As a result, businesses are increasingly investing in the development of new ideas and methods for detecting and preventing fraud to secure their customers’ trust to protect their privacy. In recent years, learning algorithms have emerged as important in research areas aimed at developing optimal solutions to this issue. The core challenge currently facing researchers is that of the imbalanced credit card dataset, in which the data are highly skewed and the number of normal transactions is much higher than fraudulent transactions, which thus negatively affects the performance of credit card fraud detection. This paper reviews the sampling techniques and their importance in solving the imbalanced data problem. Past research is found to show that hybrid sampling techniques will produce excellent results that can improve the fraud detection system.

1. Introduction

With the rapid growth of technologies and the widespread use of the internet in our daily activities, people are used to buying and paying for things using their credit cards in online shopping and at physical retail outlets. The evolution of e-commerce has resulted in the use of credit cards as a method of payment by practically all companies in both small and large industries. However, the recent increase in the use of credit cards, especially through websites, has resulted in criminals finding different ways to steal credit card information from cardholders. The mechanism most vulnerable to fraud is the credit card system. Credit card fraud costs financial institutions and customers a significant amount of money each year, and fraudsters are always trying to develop new techniques and tactics. For banks and financial institutions, detecting online transaction fraud is a particularly difficult task [1]. Thus, to increase the trust of their customers and secure their businesses, banks and other organisations are constantly seeking better solutions for detecting this type of fraud.
In this context, the main challenge that researchers face is the availability of a balanced dataset; no real credit card datasets are available for testing their models [2]. Available datasets are highly imbalanced due to the very small number of fraudulent transactions compared to the high number of normal transactions, and an algorithm’s classification performance is affected by how unbalanced the dataset is. Traditionally, the goal of classification algorithms has been to improve the generated classifiers’ predicted accuracy. In the case of an unbalanced dataset, however, boosting overall accuracy might not be the optimal course of action. A classifier concentrates on the majority class since it has the highest weight in the data while maximising overall accuracy. As a result, the classifier performs efficiently on the majority class and, consequently, on the entire dataset, while its performance on the minority class is poor [3]. Sampling techniques are thus used to balance the data. These sampling techniques are divided into three categories or approaches: data-level, algorithm-level, and hybrid.
This survey reviews the sampling techniques and their different approaches; it classifies the effect of the imbalanced data on the learning algorithm performance, such as low accuracy, incorrect results and decreases in the F1evaluation, recall and precision scores; and it discusses the importance of sampling techniques in solving imbalanced data problems of credit card fraud detection.
The rest of the paper is organised as follows. Section 2 presents a review of credit card fraud detection, along with brief descriptions of anomaly detection, and Section 3 explains the imbalanced data and classifies the sampling techniques in detail. In Section 4, the effect of the imbalanced data on the classification performance is defined. Section 5 identifies the importance of the sampling techniques for imbalanced data issues, Section 6 offers a brief review of related work on the use of sampling techniques in credit card transaction data, and Section 7 gives a taxonomy of sampling approaches and their advantages and disadvantages. Section 8 discusses gaps found in the literature and compares study results. Then, Section 9 draws the conclusion of the survey, with a few directions for future work added in Section 10.

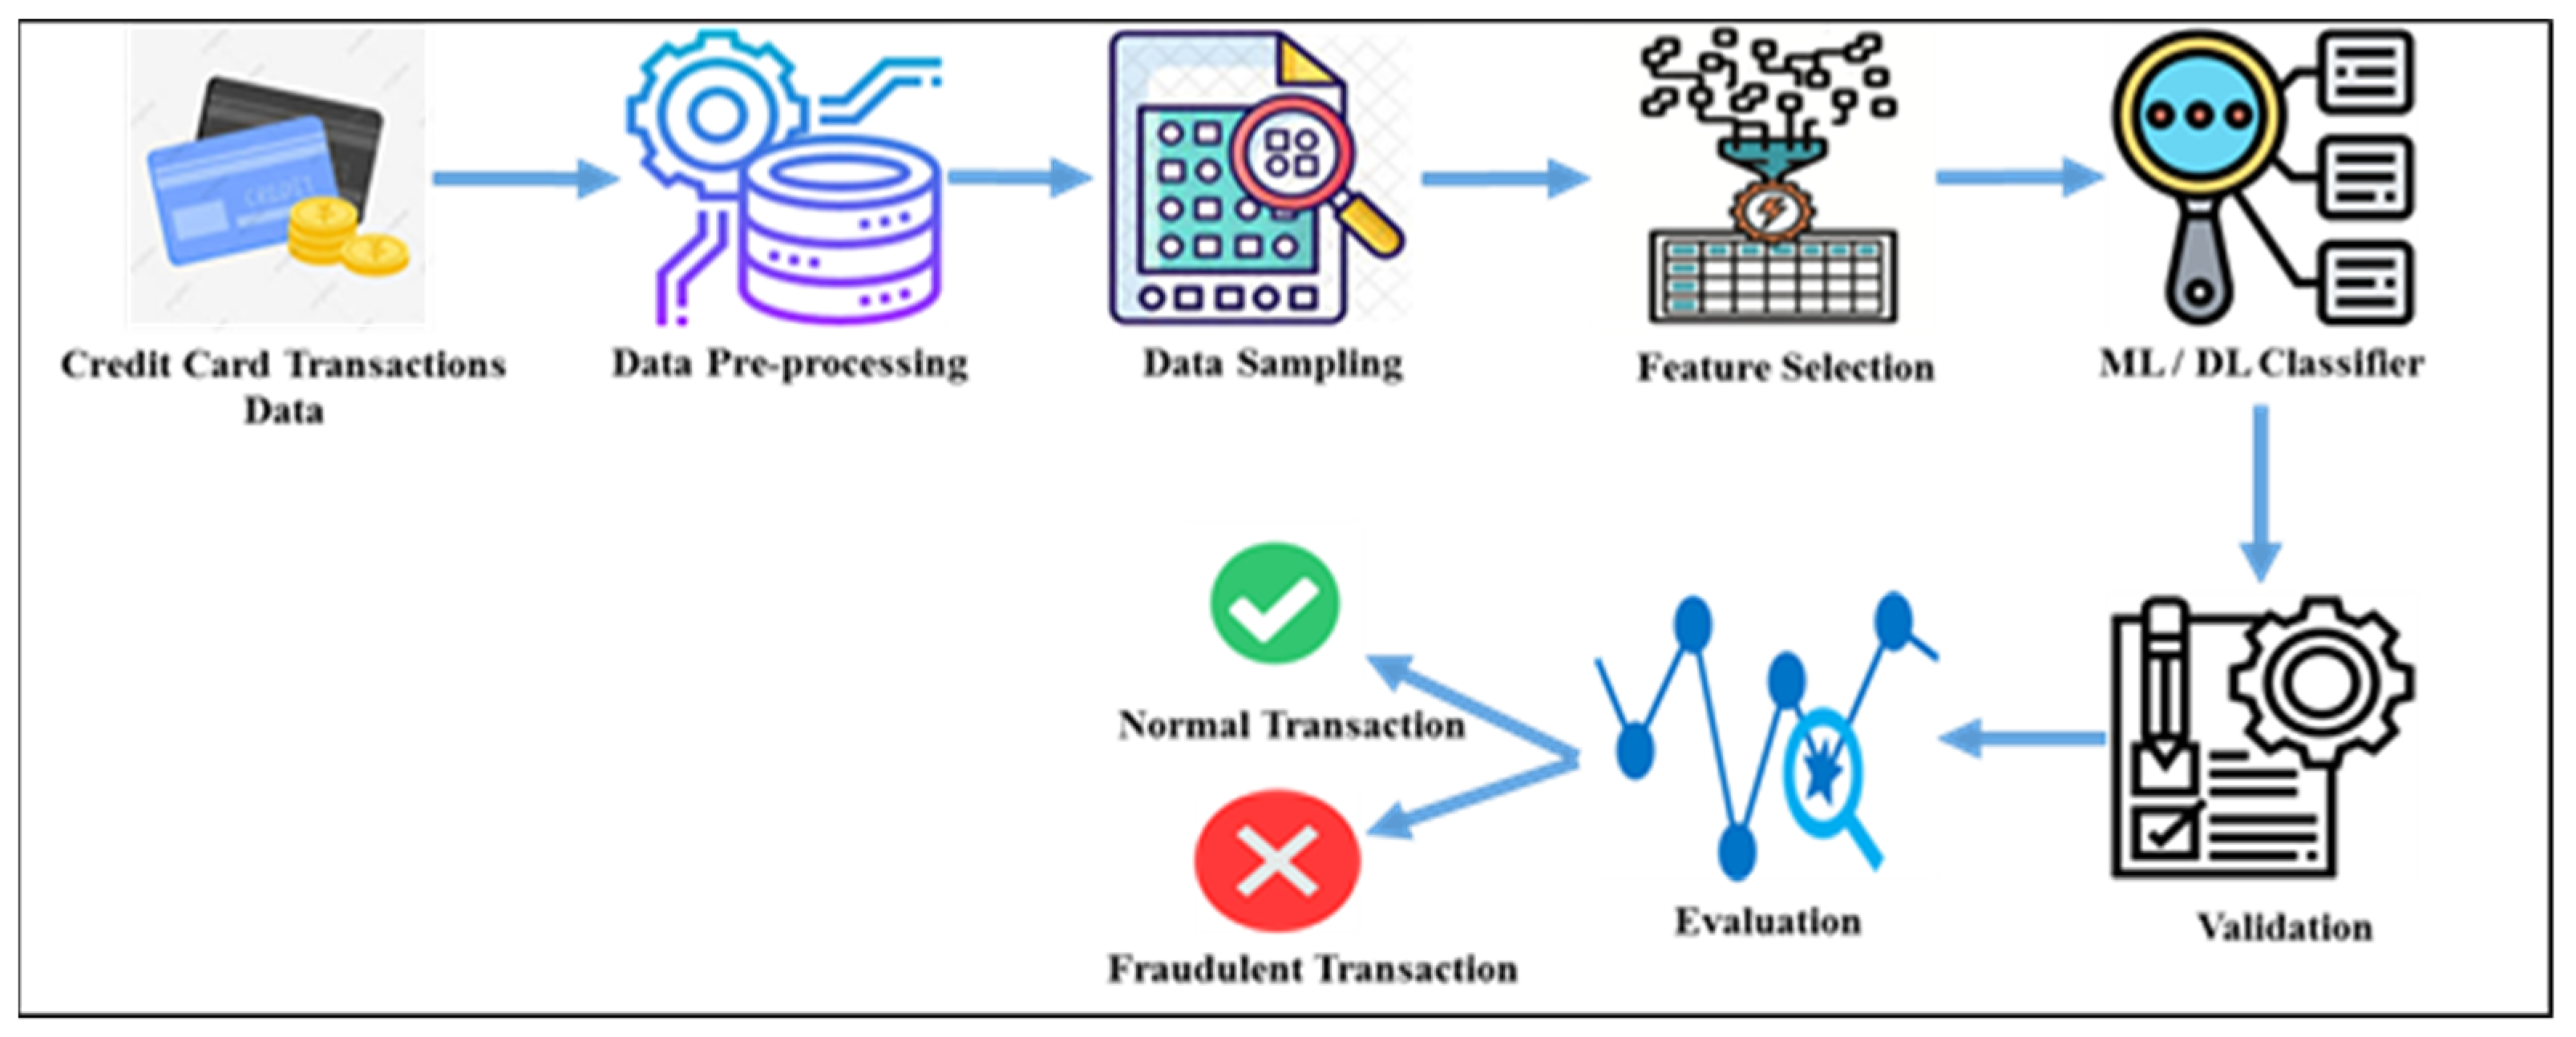
2. Credit Card Fraud Detection

Fraud is an attack activity carried out by an unauthorised person. Credit card fraud refers to the stealing of the credentials of a card holder via phone calls, Short Message/Messaging Service (SMS), or hacking through the internet to use in unauthorised transactions. It can be realised using software applications controlled by the fraudster [4].
Credit card fraud is detected in the following way. The user or customer provides the appropriate credentials to conduct a credit card transaction. The transaction should only be accepted after it has been checked for any fraudulent activity, for which purpose the transaction details are initially sent to a verification module, where they are identified as fraud or non-fraud (Figure 1). Then, any transaction classified as fraudulent is denied; otherwise, the purchase is approved [4].
Cybercriminals can use credit cards to commit credit card fraud. Fraudsters commit fraud by gaining illegal access to credit card information, resulting in financial losses for both the firm and the client [5]. As a result of the issues posed by this fraudulent activity, the need for credit card fraud detection systems has grown. Researchers are attempting to develop fraud detection systems that use machine learning, deep learning, and data mining approaches to determine whether transactions are fraudulent or real based on datasets that contain transaction information. However, credit card fraud detection is becoming more difficult since fraudulent card transactions increasingly resemble legitimate ones [5]. To address this problem, credit card companies have to employ more advanced fraud detection tools [5]. An effective fraud detection system should reliably identify fraudulent transactions and detect them in real-time transactions. Such systems can be divided into two: anomaly detection and misuse detection [6].

Anomaly Detection

The difficulty of discovering patterns in data that do not conform to expected behaviour is known as ‘anomaly detection’. Figure 2 shows an example of an anomaly. In various application fields, these nonconforming patterns are referred to as ‘anomalies’, ‘outliers’, ‘discordant observations’, ‘exceptions’, ‘aberrations’, ‘surprises’, ‘oddities’, and ‘contaminants’. Anomaly detection is used in a wide range of applications, including credit card, insurance and healthcare fraud detection, cyber-security intrusion detection, defect detection in safety-critical systems and military surveillance of enemy activities. Anomalies in data translate to substantial and often vital actionable information across a wide range of application domains, making anomaly identification critical [7].
The type of intended anomaly is a crucial feature of an anomaly detection technique. Anomalies can be categorised into one of three groups, thus:
Point anomalies A point anomaly occurs when an isolated data instance can be regarded as aberrant compared to the rest of the data. This is the most basic type of anomaly and the subject of the majority of anomaly detection research. The detection of credit card fraud may be considered as an example. The dataset represents a person’s credit card transactions. Assuming, for the purpose of simplicity, that the data are described by only one feature, the amount spent, then a point anomaly is a transaction in which the amount spent is much higher than a person’s regular spending range [7].
Contextual anomalies A contextual anomaly is defined as a data instance that is abnormal in one context but not in another. The following two sets of attributes are used to define each data instance:
  • Contextual attributes Contextual attributes are used to establish the instance’s context (or neighbourhood).
  • Behavioural attributes The behavioural features of an instance define its non-contextual qualities.
The time of purchase is a contextual attribute in the credit card domain. Assuming, for example, that an individual’s weekly shopping bill outside the Christmas season is generally around $100, then a $1000 new purchase made in July will be regarded as a contextual outlier [7].
Collective anomalies A collective anomaly occurs when a group of connected data examples is abnormal compared to the overall dataset [7].
Anomaly detection systems train the model on normal transactions using several techniques to determine novel frauds [6]. Decision trees, Bayesian approaches, neural network (NN), support vector machines (SVMs), regression models, restricted Boltzmann machines (RBMs), gradient boosted trees, Markov models and clustering algorithms, such as k-nearest neighbours (KNN) have all been used to find anomalies in consumer behaviour. Deep learning techniques, such as deep belief networks (DBNs), long short-term memory (LSTM), and recurrent neural networks (RNNs), have recently proven promising in this discipline [8].
The most popular techniques used for anomaly detection are based on machine and deep learning approaches. They can be listed as density-based, cluster analysis-based, classification-based and distance-based techniques.

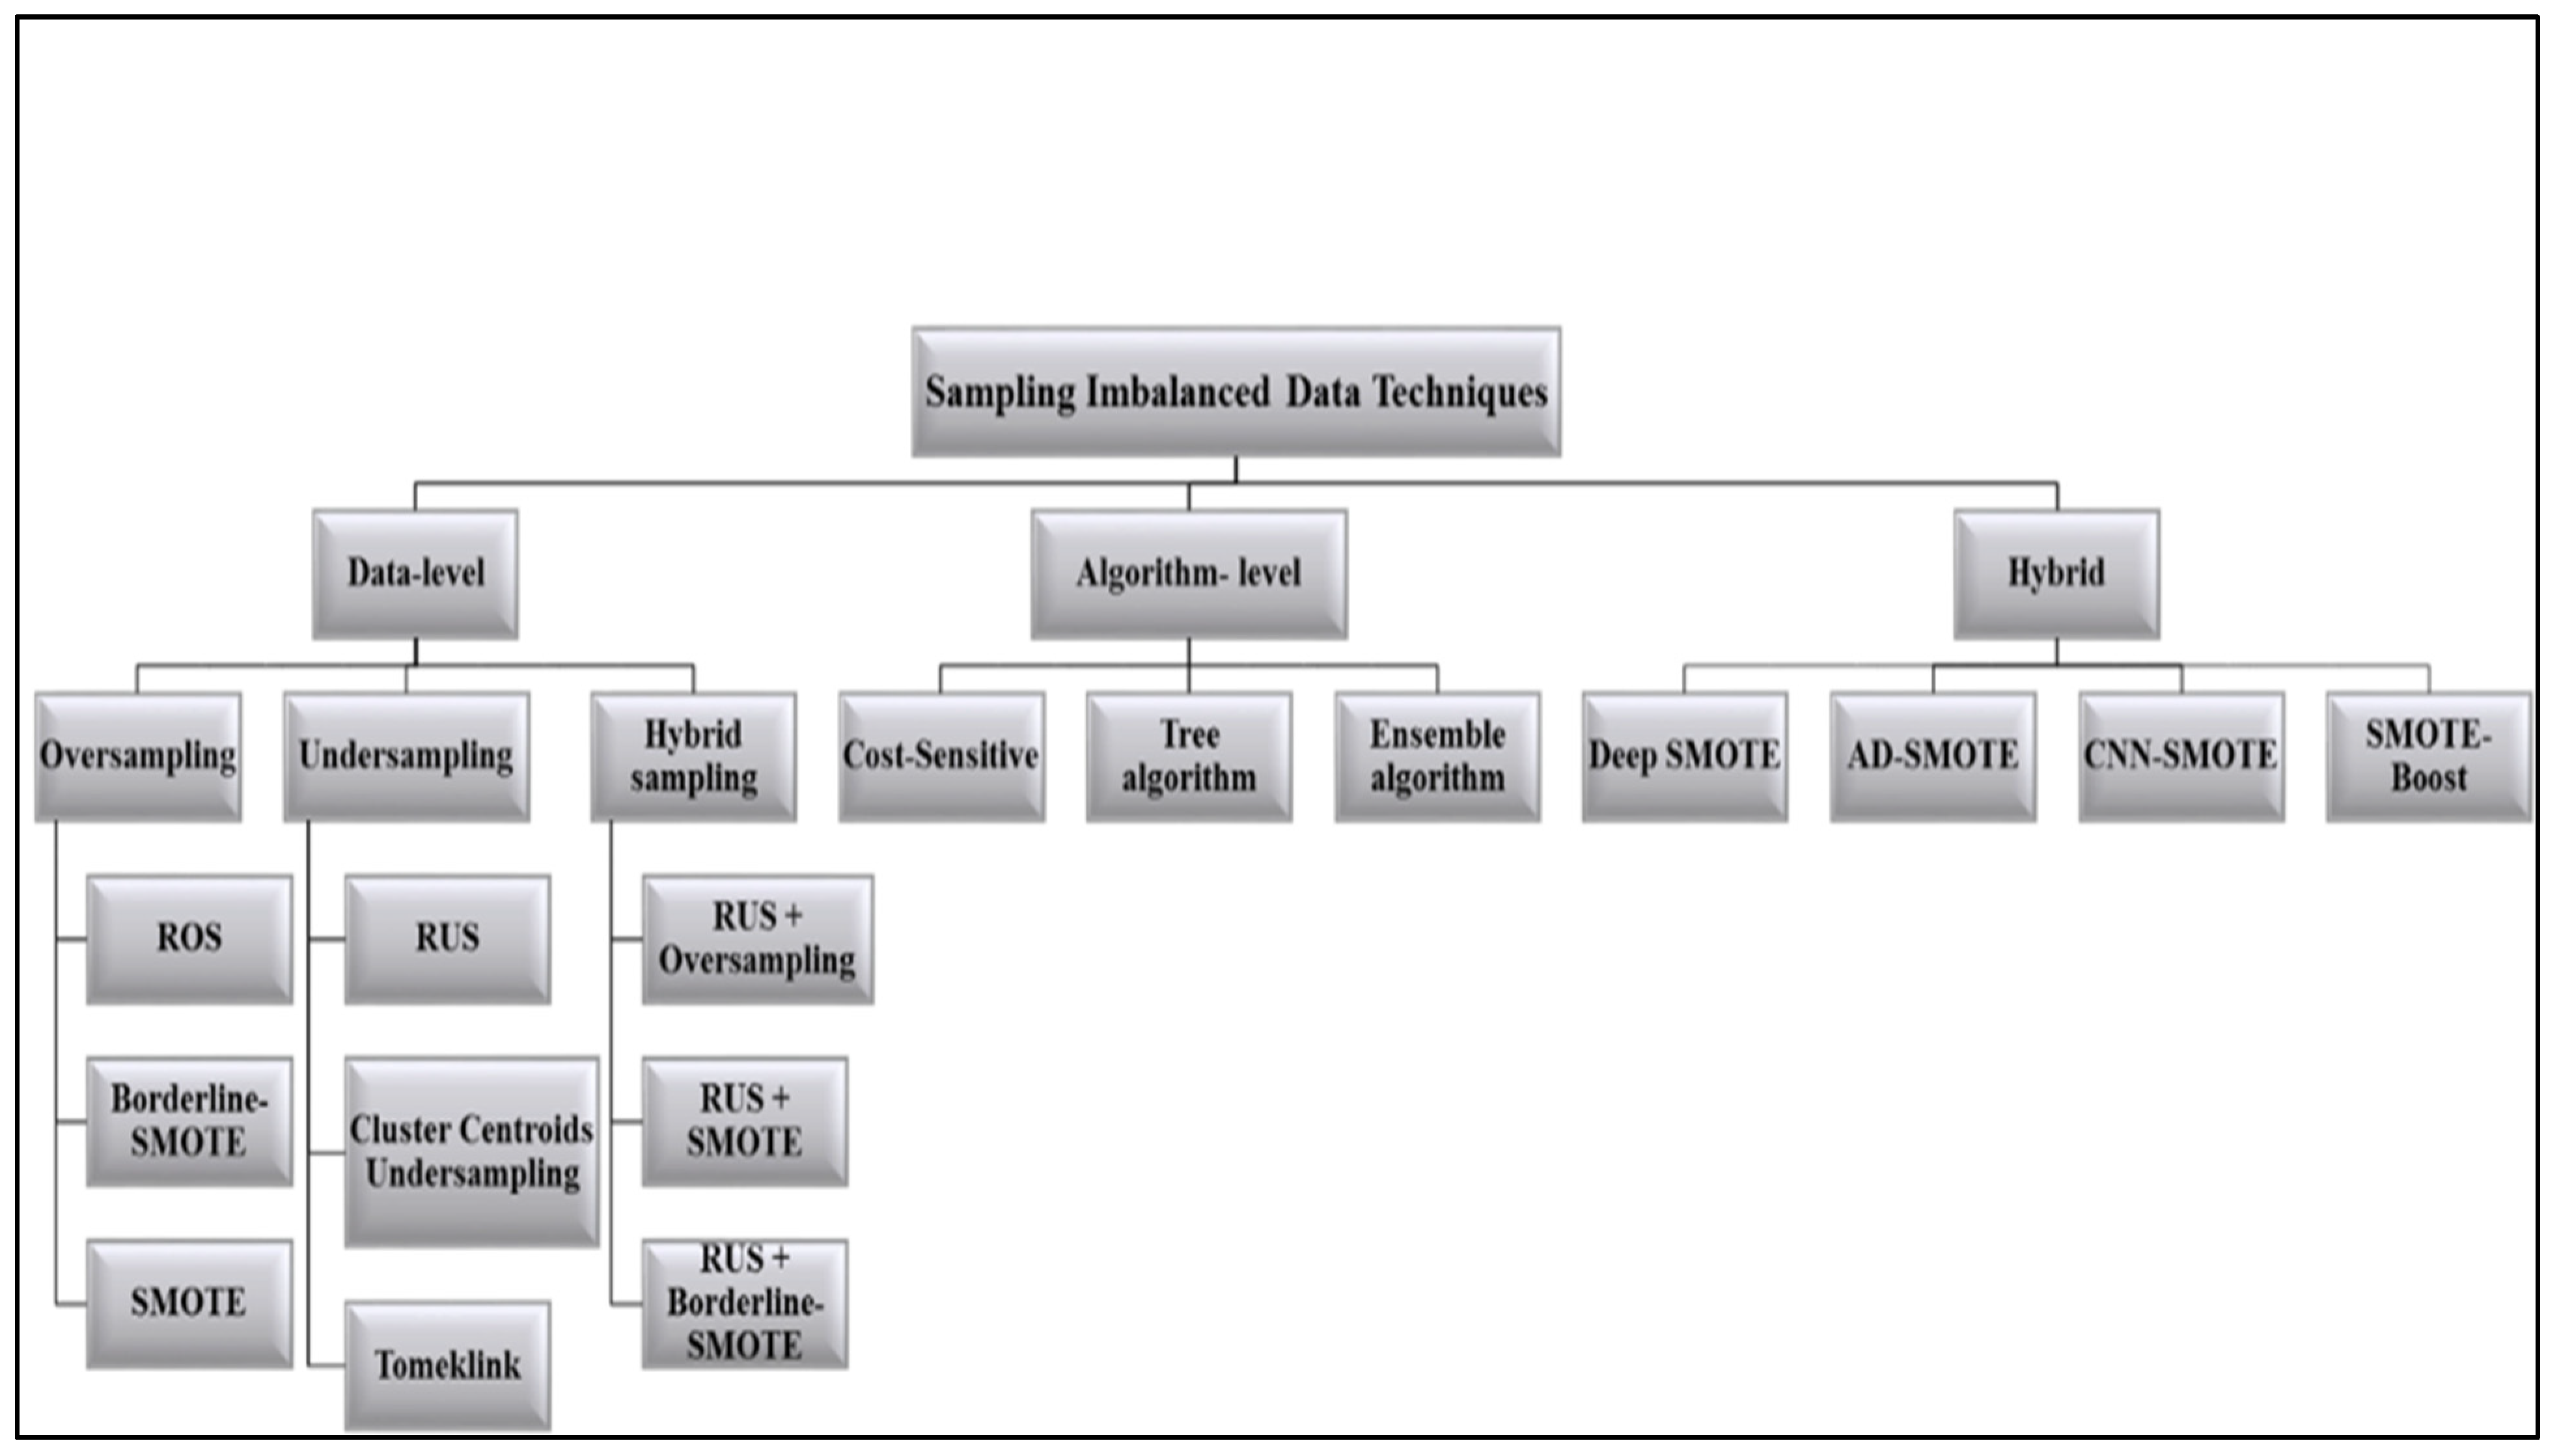
3. Imbalanced Data and Sampling Techniques

The most prevalent issue that researchers of fraud detection systems face is that their datasets are imbalanced. An imbalanced dataset has an unequal ratio of the class data contained in the dataset, as shown in Figure 3.
Imbalanced data frequently induce bias in modelling, causing the prediction to be inaccurate [9]. Thus, addressing data imbalances is an important area of research in real-time categorisation. The essential assumption of data classifiers is that the data are balanced, but in the case of imbalanced data, operations bias the classifier towards the majority of the classifications. Minority classes may even be completely ignored throughout the rule-making process if there is a sufficiently high level of imbalance [10].
Sampling techniques can be used to process imbalanced data. These techniques have three main types: the data-level, algorithm-level and hybrid approaches (Figure 4) [9].

3.1. Data-Level Approach

The data-level approach is itself divided into three: oversampling, undersampling and hybrid sampling. The most common method is oversampling. Prior to using conventional classification methods, researchers attempted to balance the datasets in the data-level approach to avoid the influence of the majority class on the findings [11].

3.1.1. Oversampling

Oversampling is the practice of enlarging the minority class to balance the dominant class. This strategy tends to replicate data that are already accessible or to develop data based on data that are already available [10]. It seeks to equalise the distribution of classes through the random repetition of minority class samples [12]. No valuable information is lost, unlike with the undersampling strategy (below), but if the dataset is already vast and unbalanced, overfitting and significant computing costs may result [12]. Many oversampling strategies have been implemented to balance the class distribution in the unbalanced dataset. The synthetic minority over-sampling technique (SMOTE) is a well-known oversampling technique that uses synthetic data points instead of creating the sample replication of the minority class. The synthetic data points are produced by plotting new data points between numerous already existing, positive minority-class occurrences. The KNN algorithm and minority class data instances are used to construct this interpolation of the synthetic data points, which are added to the original data and used to train a machine-learning model based on the number of synthetic data points required. The SMOTE method operates effectively when the dataset is small [13]. The algorithm processes are shown here as Algorithm 1 [11]:
Algorithm 1: The SMOTE algorithm
1. Identify the minority and majority classes after loading the dataset;
2. Determine the number of instances to be produced depending on the oversampling percentage;
3. Choose a random member of the minority class and determine who its closest neighbors are;
4. Decide which of the closest neighbors to the randomly chosen instance is different from that neighbor;
5. Multiply the difference by a number determined at random, ranging from 0 to 1;
6. Include this distinction with the chosen random instance;
7. Repeat the process from steps 3 to 6 until the specified proportion of instances is generated.
The Borderline-SMOTE technique is an improved version of SMOTE that involves oversampling only the borderline of the minority class. It differs from current oversampling methods, which oversample all minority examples or a random subset of the minority class. The borderline examples of the minority class are more easily misclassified than those farther away from the borderline. Thus, Borderline-SMOTE over-samples the borderline examples of the minority class, whereas SMOTE and random oversampling augment the minority class by using all or a random subset of the examples [14]. Borderline SMOTE samples are categorised as safe, dangerous or noisy. Finally, only a small number of Danger samples are oversampled. The steps of the algorithm are shown in Algorithm 2 [15]:
Algorithm 2: The Borderline-SMOTE algorithm
(1) Compute the closest m samples from the available dataset for each sample in a few classes xi. m′ denotes the number of additional categories in the most recent samples.
(2) Organize the samples xi:
If   m = m , the   samples   around   x i are all from distinct categories and are referred to be noise data. As such data will have a negative impact on the generation effect, it is recommended that these samples not be included in the generation.
If   m / 2 m < m , more than half of the m surrounding x i samples are of distinct categories. Define Danger as the border sample.
If   0 m < m / 2 , more than half of the surrounding m samples of xi are of the same categories, designated as Safe.
(3) After marking, apply the SMOTE method to enlarge the Danger samples. Select xi from the Danger dataset samples and compute k-nearest neighbor samples of the same kind xzi. New samples xn are generated at random using the formula
x n = x i + β   ( x z i x i )
where β is a random number between 0 and 1.
There are two types of Borderline-SMOTE: Borderline-SMOTE1 and Borderline-SMOTE2. Borderline-SMOTE1 randomly selects a few types of samples from the k-nearest neighbours sample during new SMOTE for Danger similar to SMOTE, while Borderline-SMOTE2 pick out in any sample in the k-nearest neighbours, regardless of sample category. The Borderline-SMOTE1 algorithm is described above [15].

3.1.2. Undersampling

Undersampling involves balancing the majority and minority classes by decreasing the size of the dominant classes. The amount of data lost during the process is largely determined by the method employed to delete information [10]. Undersampling strives to achieve this through the random rejection of samples from the majority class [12]. Due to the enormous number of majority class samples, this technique can be applied effectively for large-scale applications. The algorithm processes are shown in Algorithm 3 [11]:
Algorithm 3: Random Undersampling (RUS) algorithm
1. Load the dataset and define the minority and majority classes;
2. Calculate the number of instances to be deleted depending on the undersampling percentage.
3. Select a random instance from the majority class and delete it from the majority class;
4. Continue to step 3 until all occurrences have been eliminated according to the specified percentage.
This method has a significant flaw in that it may delete information that is pertinent to the classifiers [12]. Tomek link, random and cluster centroid undersampling [13] are all frequently used undersampling techniques.
Tomek links are defined as follows: given two instances Ei and Ej from distinct classes, d(Ei,Ej) is the distance between Ei and Ej. A (Ei,Ej) pair is regarded as a Tomek link if there is no example El, such that d(Ei,El) < d(Ei,Ej) or d(Ej,El) < d(Ei,Ej). If two cases create a Tomek connection, either one of them is noisy or both of them are borderline [16].
Tomek links can be used in two approaches, one for undersampling and the other for data cleaning. In the undersampling approach, only the instances from the majority classes are discarded, whereas in the data-cleaning approach, instances from both classes are discarded [16].
Cluster centroid undersampling is a popular and successful unsupervised learning approach that decreases the number of samples in a dataset [13]. The method processes are as follows:
Divide the dataset into clusters using the k-means clustering technique; the centroids of each cluster may determine the mean feature vector of a random set of k instances;
The Euclidian distance between the cluster centroid points and the remaining training examples will be determined;
Each training instance is now assigned to the cluster centroid with the smallest distance vector magnitude from it.
This is repeated until all training instances are allocated to a single cluster [13].
S m i n i is the number of majority class samples in the ith cluster.
S m a x i is the number of minority class samples in the ith cluster.
S N i is the number of selected majority class samples from the ith cluster and defined thus:
S N i = ( r × S m i n ) × S m a x i / S m i n i i = 0 K S m a x i / S m i n i
where r is the ratio of majority class sample S m a x and minority class sample S m i n in the dataset. If r = 1, the same number of samples will be picked from the minority and majority groups [13].
In the undersampling approach generally, the majority class samples are removed in great numbers as part of the undersampling strategy. This increases the computational efficiency of the classification model but may lead to a loss of crucial data from the majority class samples, raising the false-positive rate and increasing the cost of investigations [17].

3.1.3. Hybrid Sampling

Hybrid sampling is used to create a balanced dataset by mixing oversampling and undersampling strategies, as proposed by many recent studies [10]. The amounts of major and minor class data are reduced by using undersampling and oversampling, respectively. Some examples of research using the hybrid method involve SMOTE+Tomek links and SMOTE+ENN [18]. In the SMOTE+Tomek links approach, originally utilised in bioinformatics as a data-cleaning approach to enhance the categorisation of instances for the problem of protein annotation [16], Tomek links are applied to the oversampled training set. As a result, rather than eliminating merely the majority of class examples that form Tomek links, examples from both classes are eliminated. As can be seen in Figure 5a, there is a large imbalance between the majority classes (-) and minority classes (+); then, in Figure 5b, the dataset is oversampled using SMOTE. After that, that in Figure 5c, the circles show the Tomek links identified for removal. Finally, in Figure 5d, a balanced dataset with distinct class clusters is produced [16].
The aim of the SMOTE+ENN method is similar to that of SMOTE+Tomek links. The application of edited nearest neighbours (ENN) tends to delete more instances than Tomek links; hence, it is projected to offer more thorough data cleansing [16]. Recent research employing a mix of oversampling and undersampling strategies has highlighted a clear advantage of the hybrid over just one of these techniques [9]. In comparison to oversampling, the key advantage of hybrid sampling is that it is quick and straightforward. However, the removal of instances from the majority class may result in the loss of some of its potentially relevant data [11].

3.2. Algorithm-Level Approach

Researchers adopting the algorithm-level approach have worked on the internal algorithm structure and attempted to eliminate algorithm sensitivity to the majority class so that the outcomes of classification algorithms do not vary from the majority class [11]. These algorithms fall under the heading of a cost-sensitive algorithm. Ensemble, penalised and tree algorithms can each manage unbalanced datasets on their own [12]. Cost sensitivity offers the ability to reduce the cost of misclassification by pitting the classifier against the minority class against the drawback of the frequently unknown misclassification costs. Cost-sensitive learning technology has the benefit of not producing or adding new data, thus preventing the entry of outside noise into the classification model [13]. Cost-sensitive learning models that are commonly utilised include cost-sensitive SVMs, LRs and DTs [17]. The drawback of cost-sensitive learning technology is that the cost matrix cannot be precisely determined and must instead be assessed by business professionals [17]. Tree algorithms working together deliver good-performing classification results and great resilience to noise [12]. In addition to good noise resistance, the benefits of tree algorithms high-performing classification results, while time-consuming and overfitting are cited as drawbacks [12].

3.3. Hybrid Approach

In order to tackle the issue of unbalanced data in credit card transactions, recent studies have improved the detection system by combining the data- and algorithm-level approaches. In one study [19], SMOTE was used in a hybrid form with a convolution neural network (CNN) approach to improve results as shown in Figure 6.
The oversampling convolution neural network model (OSCNN) model begins by oversampling the minority class by 0.25, so that the minority class-to-majority class ratio becomes 75:25. This ratio was selected to compensate for SMOTE’s overfitting [19]. The second component of the OSCNN model employs the CNN with hybrid parameters (number of epochs, batch size, verbose, optimiser RMSProp and loss function) and layers [19]. Compared with MLP or MLP with SMOTE, the accuracy of the hybrid system (OSCNN) has been raised from 88% to 98%, which is very high [19].
Another study [20] employed SMOTE and adaptive synthetic (ADASYN) as sampling techniques, together with three classifier algorithms—bagging, boosting and KNN—to balance the dataset. The goal behind ADASYN is to generate minority data samples adaptively depending on their distributions. Further synthetic data is created for minority class samples, which are more difficult to learn, than for minority class samples, which are simpler to learn [20]. The ADASYN technique not only reduces the learning bias imposed by the initial unbalanced data distribution but may also adaptively change the decision boundary to focus on the samples that are hardest to learn [20]. In contrast to Borderline-SMOTE, ADASYN gives the most attention to cases with the greatest class overlap.
Concerning cases in which low-density instances may be outliers, the ADASYN technique may place too much emphasis on certain portions of the feature space, resulting in poor model performance [20]. KNN was combined with SMOTE and ADASYN as this helped to reduce the error rate; the integration produced a very high level of accuracy (98%). However, this approach should not be used for real-time applications as the process may result in some genuine transactions being identified as fraudulent [20]. The random forest (RF) method was also combined with SMOTE and ADASYN. This gave 99% accuracy, with ADASYN yielding slightly better accuracy than SMOTE. Another approach involved combining extreme gradient (XG)-Boost with SMOTE and ADASYN, resulting in 99% accuracy and proving to be the best approach [20].
In another study [21], SMOTE was applied in a deep learning model where the inputs and outputs of the conventional SMOTE were trained using a deep neural network (DNN) regression model. Two data points were randomly selected as inputs for the suggested deep regression model, which were concatenated to create a double-size vector. The outputs of the model—named ‘Deep SMOTE’—were original-dimension equivalent randomly interpolated data points between two randomly selected vectors [21]. Deep SMOTE is written as follows:
Given a collection of minority samples (x_1,x_2,……,x_w) where x_(i) ∈ R_n,m training data points are generated as (x_1^′,y_1 ),(x_2^′,y_2 ),….,(x_m^′,y_m) where x_i^′ ∈ R^2n, y_(i) ∈ R^n by combining x_s and x_t, where s and t are two randomly chosen numbers, 1<s<w and 1<t<w and y_i is an inserted data point along the line segment joining x_s to x_t [21].
The authors indicated that Deep SMOTE’s performance was superior to that of SMOTE in terms of all evaluation metrics. They also proposed Deep Adversarial (DA)-SMOTE, which was based on training a neural network regression model in adversarial mode, drawing inspiration from three separate concepts: SMOTE, generative adversarial nets (GANs) and Deep SMOTE. The main difference between DA-SMOTE and Deep SMOTE was that DA-SMOTE did not require interpolation to train the regression model [21]. The DA-SMOTE training method is extremely similar to the GAN training algorithm, as seen in in Algorithm 4:
Algorithm 4: Minibatch stochastic gradient descent training of Deep Adversarial SMOTE
(1) for number of training iterations do
(2)      for k steps do
(3)          Sample minibatch of m data   pairs { z ( 1 ) , . , z ( m ) } form minority prior and concatenate each selected pairs p g ( z ) .
(4)              Sample minibatch of m sample   { x ( 1 ) , . , x ( m ) } from data generating distribution p d a t a ( x ) .
(5)          Update the discriminator be ascending its stochastic gradient.
                 Δ θ d 1 m i = 0 m [ log D ( x ( i ) ) ] + [ log ( 1 D ( G ( z ( i ) ) ) ) ]
(6)    end for
(7)    Sample minibatch of m minority data pairs { z ( 1 ) , . , z ( m ) } from minority prior and concatenate each selected pair p g ( z ) .
(8)     Δ θ g 1 m i = 0 m [ log ( 1 D ( G ( z ( i ) ) ) ) ]
(9)  end for
However, this model outclassed Deep SMOTE and SMOTE in terms of F1 score, the area under the curve (AUC) and receiver operating characteristic (ROC) curve in five datasets. The authors considered DA-SMOTE to have advantages over Deep SMOTE, which is trained in an unsupervised mode [21].
Another researcher [22] proposed a cost-sensitive weighted RF model that combines cost sensitivity with RF. The author proposed this approach because, in RF, the dataset is sampled into a number of parts before learning, which leaves the probability of obtaining a satisfactory outcome in doubt because each tree contains instances of data imbalance. Therefore, a cost function is constructed in the training phase of each tree, in bagging, emphasising the assignment of greater weight to the minority instances during training to increase the prediction ability of each tree, as well as the overall performance of the ensemble, as shown in Figure 7. Here, trees are rated based on how well they can anticipate occurrences in the minority class [22].
The proposed model achieved excellent results in terms of F-measure, G-mean and AUC as compared to standard RF and RF-based imbalanced data cleaning and classification (RF-IDCC). However, this model has not been validated for large datasets [22].

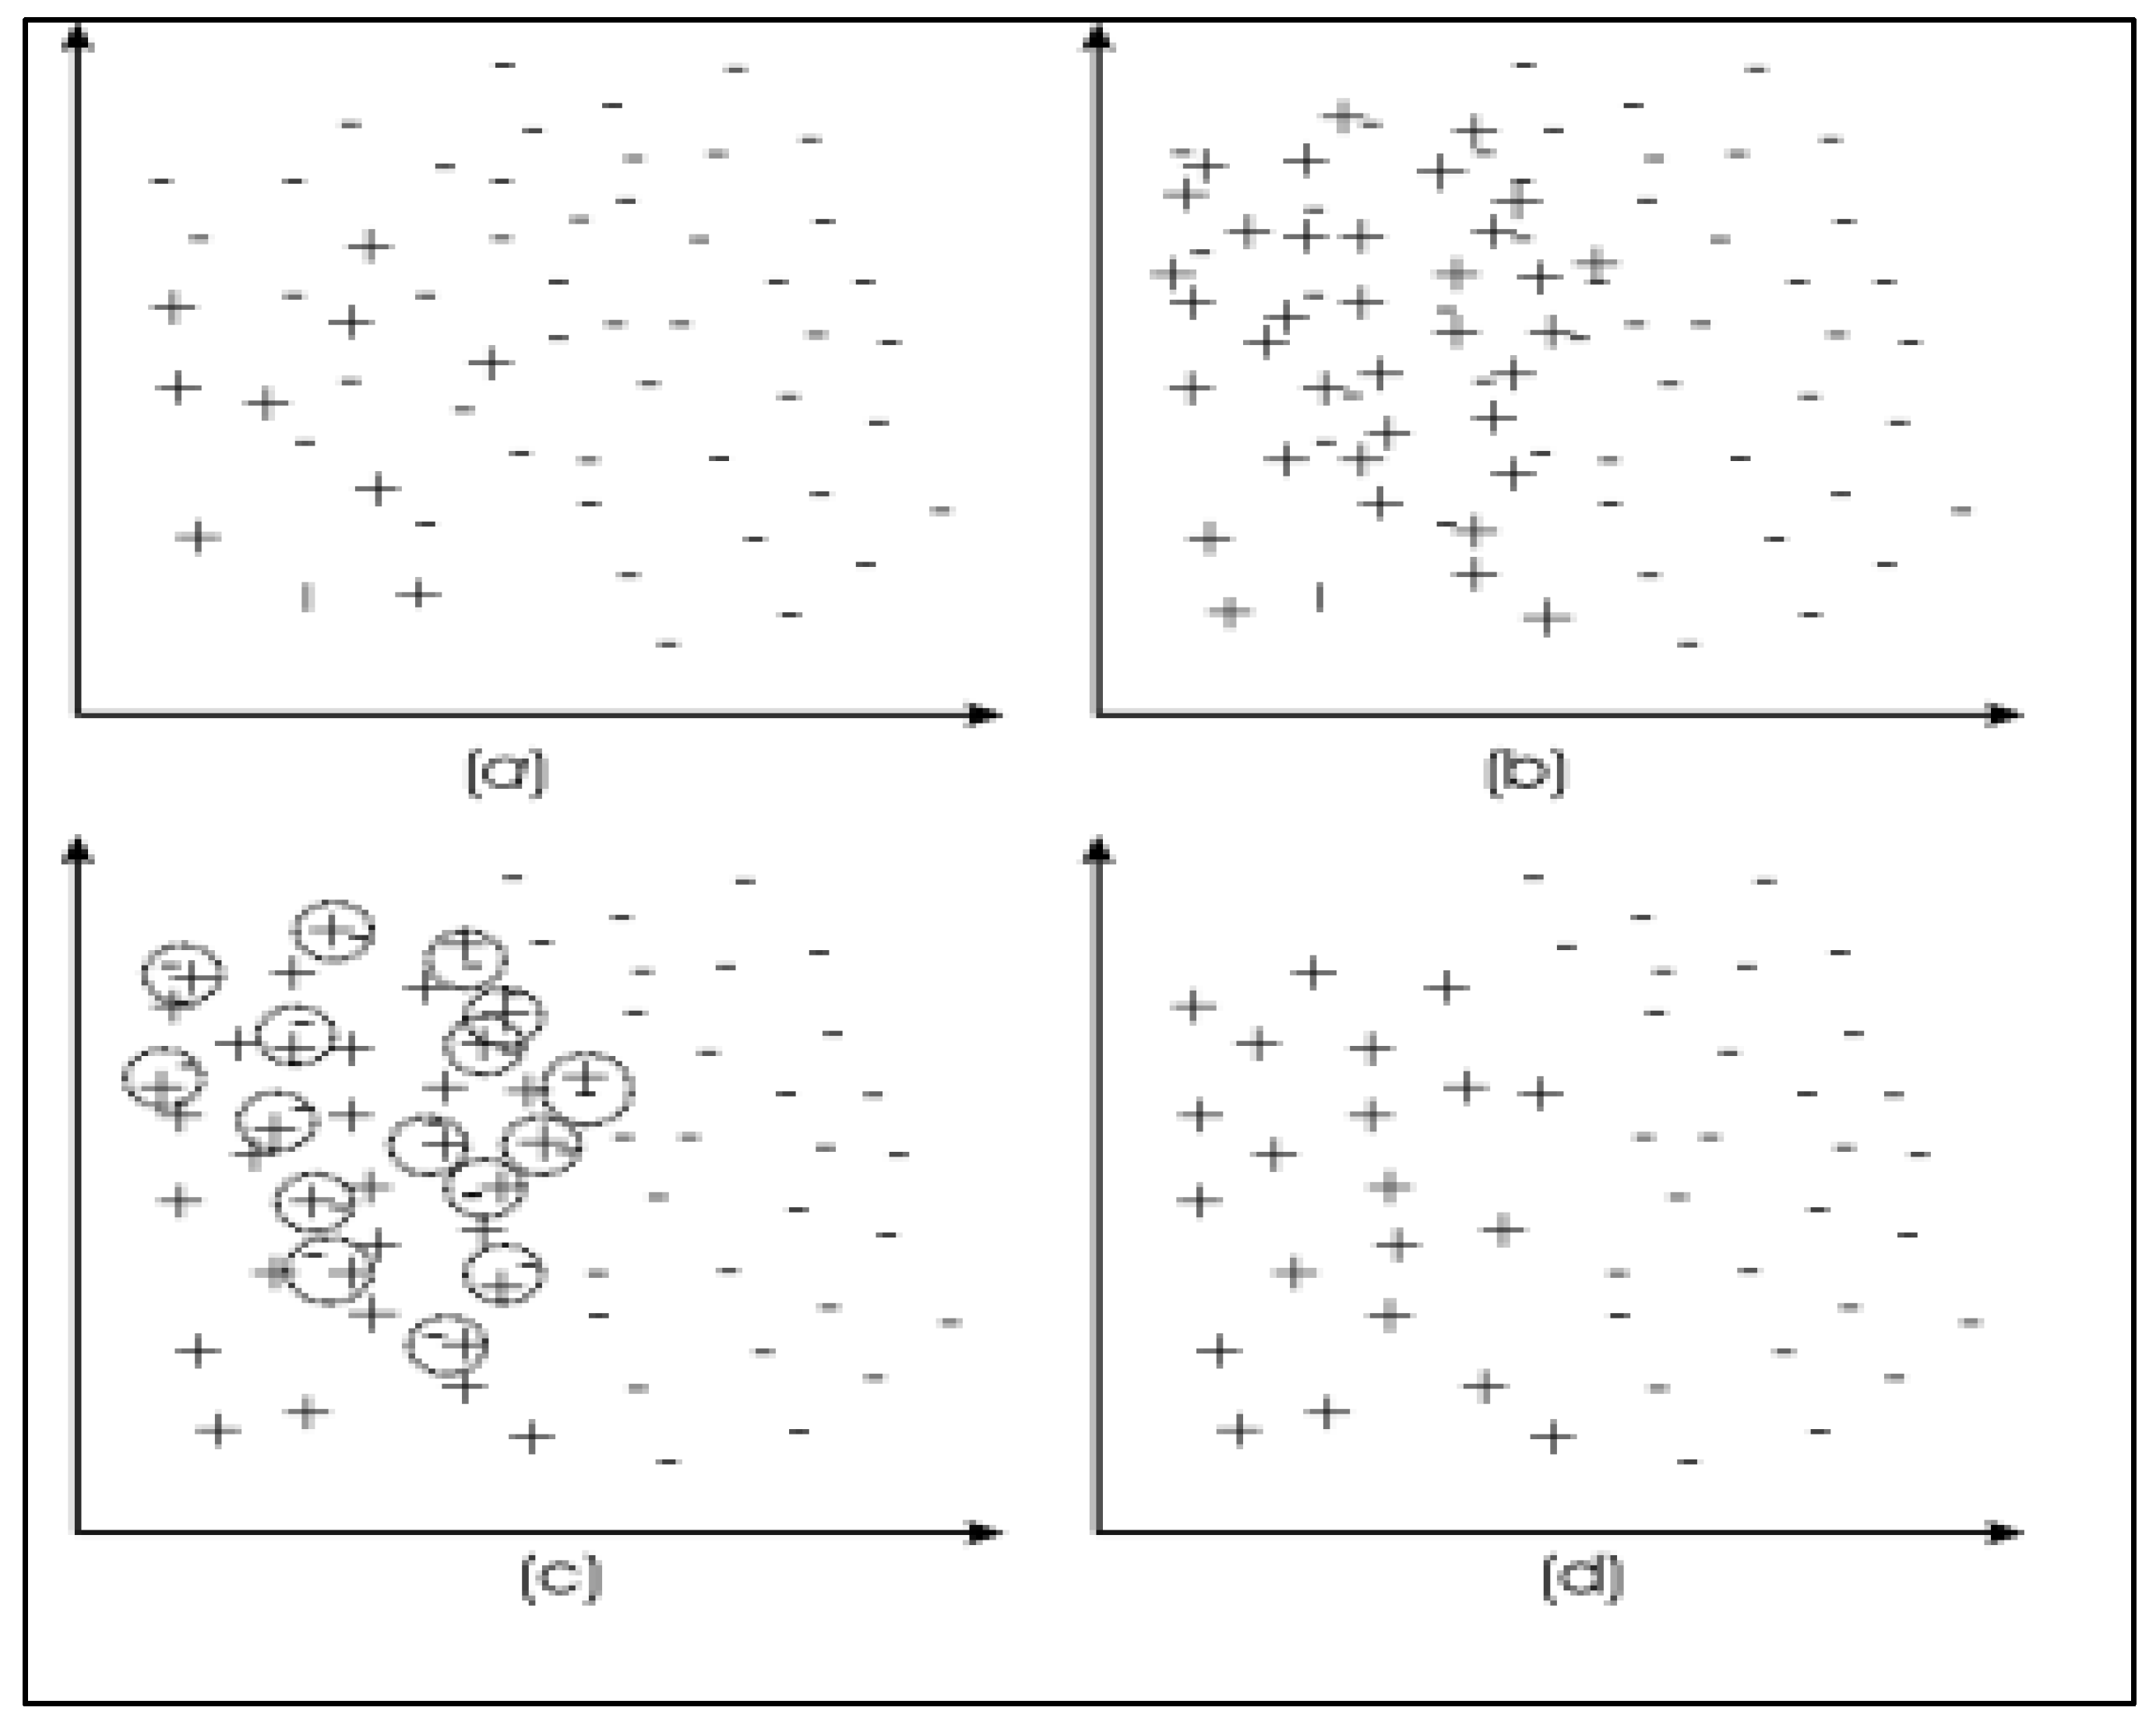
4. Effect of Imbalanced Data on the Classification Performance

Imbalanced data classification has recently emerged as a popular subject in data and machine learning. Its employment is fairly widespread, including for credit card fraud detection. Traditional classification methods have a poor classification impact on minority classes due to the large variation in the number of categories and imbalanced distribution, and a suitable identification of minority classes typically delivers more value [23]. In order to measure the performance of classifiers and evaluate whether classification algorithms have achieved significant results, the evaluation metrics should use accuracy, F1, recall and precision scores, along with the G-mean, AUC and ROC curves.
When evaluating the effects of class distribution on learning, error rate and accuracy are particularly suspect performance measures since they are heavily biased in favour of the majority class [16]. For example, in a domain where the majority class proportion equates to 99% of the cases, it is simple to develop a classifier with an accuracy of 99% (or an error rate of 1%) by simply forecasting every new example as belonging to the majority class [16]. However, highly imbalanced issues typically have highly non-uniform error costs that favour the minority class, which is frequently the dominant interest class.
Another factor to consider while researching the effect of class distribution on learning systems is that it can vary [16]. From the previous studies, we learn that the imbalanced data will have a greater effect on learning classifier performance, which leads to the higher production of incorrect results due to the highly skewed dataset.

5. The Importance of Sampling Techniques

Currently, people around the world make great use of credit cards in their daily lives, especially when dealing with online stores. However, criminals see that the internet is the easiest way to steal credit card information, and they are finding different ways to steal money. This is leading to the loss of billions of dollars annually and affects organisations’ business and customer relationships. Institutions and banks are trying to identify solutions by building efficient credit card fraud detection systems that provide high-quality results for predicting and detecting fraud in credit card transactions [1]. However, these systems are built using a dataset as the main part to train and test the models. Unfortunately, no real datasets are available publicly, and most banks are not permitted to provide their datasets for research (to preserve customer privacy) [24]. Therefore, researchers often use datasets that are publicly available on the internet, such as at Kaggle.com.
These datasets are highly imbalanced, an issue that affects the results of detection systems [23]. Solving this problem requires the use of sampling techniques to balance the data. As described (above), oversampling, undersampling and hybrid sampling can be used to adjust the data sample and improve the accuracy of the model employed. However, these techniques have certain drawbacks that influence performance, such as overfitting, noise, overlapping, discarding useful information, lack of flexibility and over-generalisation [9,10].
When applying machine learning algorithms to real applications, handling class imbalance problems has become a typical difficulty. The primary research on this issue has focused mostly on classification methods and evaluation criteria [12]. In order to measure the performance of the classification method, the common measures applied are accuracy, precision, recall, F1-measure, G-mean, AUC and ROC. The distribution ratio of classes is crucial for model accuracy and precision in classification issues.
The purpose of creating a detection system is to find fraudulent transactions, which is of major interest [13]. In other words, designers want the model to accurately predict fraudulent transactions. Where a valid transaction is predicted to be fraudulent, the card issuing company can query the detection system—but the transition may not be queried, in which case the goal of creating the model will not be achieved (i.e. if a classification model predicts a fraudulent transaction as a valid transaction) [13]. Thus, the distribution of data should be more evenly distributed to develop an intelligent classification model that can identify fraudulent transactions with high accuracy. Therefore, a balanced class distribution should be present in the dataset used to develop and test the classification model [13].

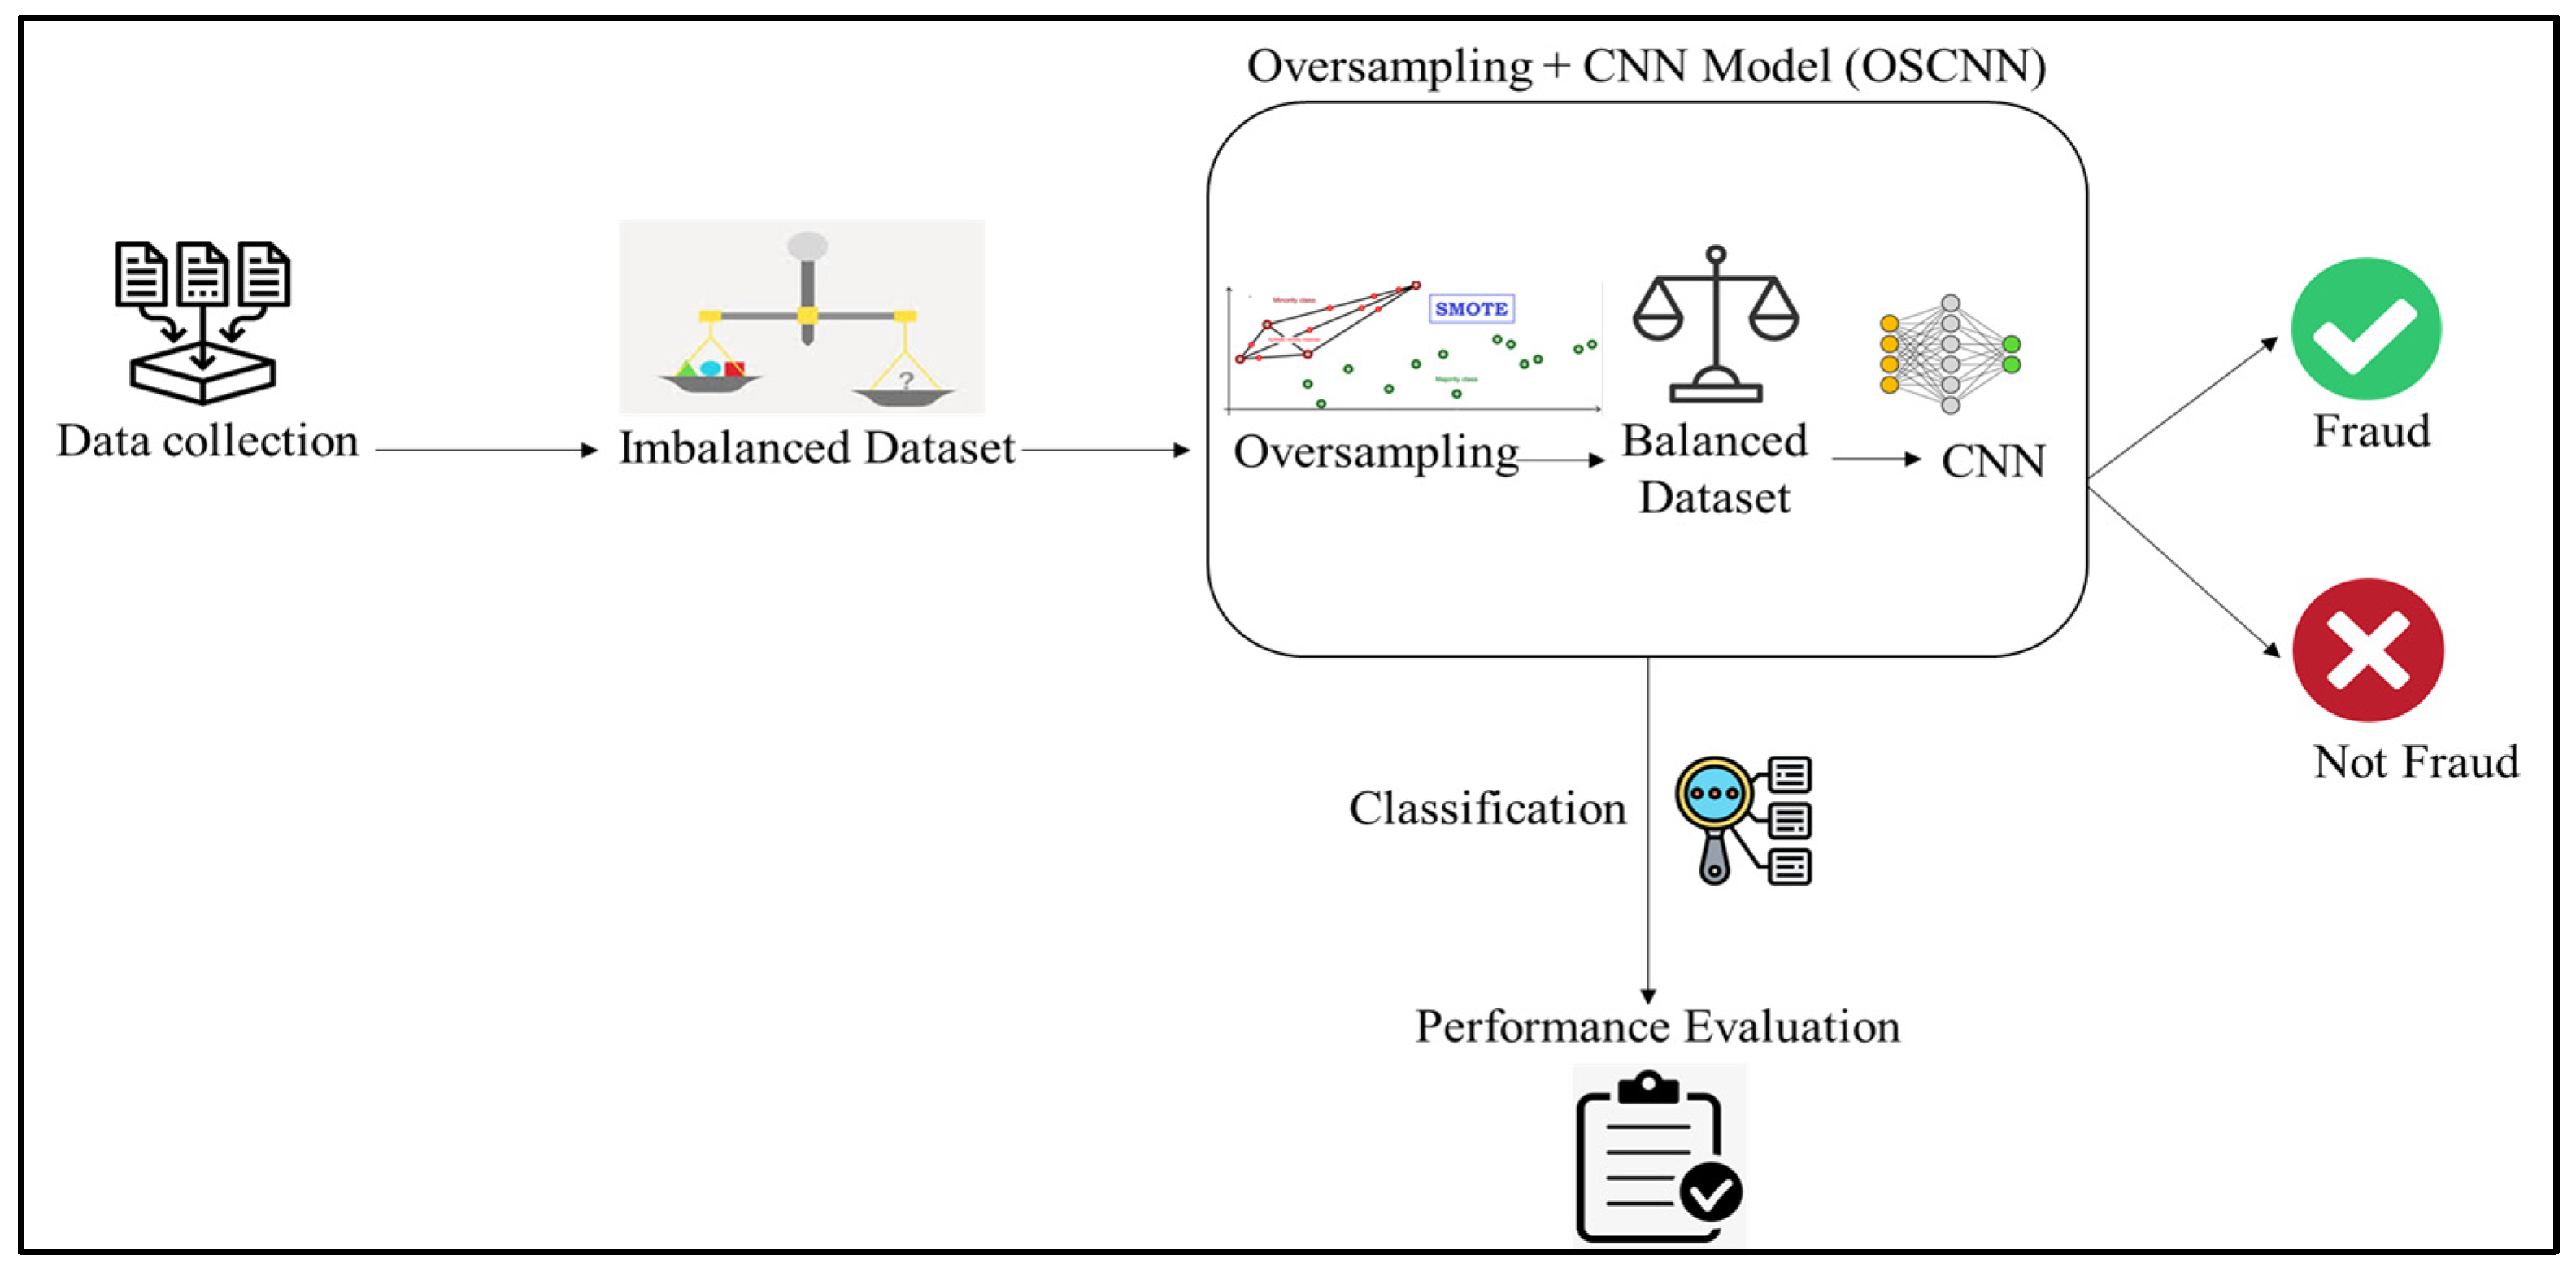
6. Sampling Techniques for Credit Card Transaction Data

One of the biggest challenges facing credit card fraud detection is that of imbalanced data, partly because the genuine transaction number is much higher than the fraudulent transaction, which is 1% of the total transaction [24]. A recent study [24] highlighted that machine learning models typically work with the statement of an equal class balance and an equal cost of misclassification. Thus, sufficient measures have to be taken to address this problem of class imbalance.
One study [24] trained four predictive models—using artificial neural networks (ANNs), a stacked ensemble, gradient boosting machine (GBM), and RF—on different sampling methods, namely, random undersampling, SMOTE, density-based-SMOTE (DB-SMOTE), and SMOTE+ENN, which were used for all models. The outcomes showed promising results with SMOTE-based sampling techniques, with the best recall score obtained using the SMOTE sampling strategy by the RF classifier. Thus, the authors classified the SMOTE method as preferable [24]. Another study [25] used SMOTE because it is a widely used oversampling method that has been shown to be effective when applied to imbalanced datasets. The authors demonstrated the importance of balancing the dataset in achieving significant results in the credit card fraud detection model [25]. Other researchers [26] have explored different undersampling techniques—undersampling, SMOTE, and SMOTE-Tomek—for imbalanced data. The classification models used in this recent study (KNN, LR, RF, and SVM) were trained on balanced data to detect fraudulent credit card transactions. The performance of the classifiers on the balanced data showed that RF with SMOTE and SMOTE-Tomek were best, with an accuracy of 99% [26].
Another study [27] proposed a new behaviour-cluster-based imbalanced classification method. The authors divided user behaviour into groups by clustering and ensured the reliability of user information through hierarchical sampling. They defined behaviour noise and removed it. Compared to the existing popular imbalanced classification methods on multiple datasets, their method showed that eliminating behaviour noise in fraud detection was better at solving the issue of class imbalance in fraud detection. The authors recommended future work on the hybrid ensemble method and noise reduction to improve detection performance.
A novel fraud detection method has also been devised in which customers were grouped based on their transactions and behavioural patterns were extracted to create a profile for each cardholder [28]. The researchers found the Matthews correlation coefficient (MCC) to be the best parameter for dealing with imbalanced datasets. They tried balancing the dataset with SMOTE and discovered that the classifiers performed better than before [28]. Another option for dealing with imbalanced datasets according to this study is to use one-class classifiers, such as a one-class SVM. A previous study [29] used random undersampling techniques to balance the dataset with the classifiers LR, NB, and KNN to improve the performance of the model. Random undersampling produces excellent results for the model; however, the authors argued that the main disadvantage of random undersampling is that some information may be lost, and new resampling methods for achieving optimal results could be devised in the future to aid credit card fraud detection [29].
In another study [30], the data were pre-processed and oversampling and undersampling were used to prepare the data for a machine-learning approach to determine credit card user types. A balanced dataset was created after oversampling and undersampling the dataset, and user detection accuracy was determined using a suitable classification algorithm (KNN) [30]. The data samples were significantly balanced, and the machine learning technique used on these samples showed good accuracy [30].
Another study [31] conducted an in-depth performance analysis of oversampling approaches to address the problem of high-class imbalance. The addition of the oversampling technique was used to balance the data in each class, resulting in unbiased modelling evaluation findings. Random oversampling, ADASYN, SMOTE, and Borderline-SMOTE approaches were compared in terms of performance. Machine learning methods, such as RF, LR, and KNN, were integrated with all oversampling approaches [31]. The results revealed that RF with Borderline-SMOTE provided the best value, with a precision of 99.97% [31]. Finally, a noisy domain study [11] contrasted oversampling and undersampling approaches to class imbalance learning, with SMOTE and random undersampling approaches used for comparison. In a noisy environment, the oversampling strategy (SMOTE) performed more robustly than the random undersampling approach [11].
Thus, various techniques have been used to balance credit card transaction data, including undersampling, SMOTE, DBSMOTE, Borderline-SMOTE, and SMOTEENN. Table 1 presents a comparison of selected studies on sampling techniques. These techniques have been used to balance highly skewed credit card transaction data, but they may result in overlapping and a loss of relevant information.

7. Taxinomy

In the reviewed papers, we also classified the type of sampling approaches. This is presented in Table 2, along with some advantages and disadvantages when applied to credit card transaction data sets.

8. Discussion

This review of relevant research has shown that the SMOTE technique gives the best performance for classification when applied to imbalanced data in terms of accuracy [11,24,25,28]. The oversampling technique has some limitations involving overfitting that may cause higher accuracy of the detection model due to the duplication of instances and overlapping [25,30]. Some oversampling approaches can solve the overfitting and overlapping issue and produce excellent results, such as Borderline-SMOTE [31] and SMOTEE, DB-SMOTE [24] and SMOTE-Tomek [26]. These techniques can are very effective with different classifier algorithms. These studies indicate limitations when using undersampling because it eliminates data and thus may remove important data, which can negatively affect the overall classification performance [11,24,26,30].
In fraud detection systems, the aim is to detect fraudulent credit card transactions without false alarms. In other words, the best detection performance is measured by low error and false positive rates. Thus, precision and F1 score are considered together with accuracy. The sampling technique has to balance the data and improve the performance of the detection system. One research paper [30] observed that combining oversampling and undersampling improves the result of the model. This implies a hybrid approach that can combine two sampling techniques in order to balance the credit card transaction dataset so as to improve detection model performance and reduce the error rate. This paper has found that there is no optimal solution for imbalanced data that can produce a best result for fraud detection without error.

9. Conclusions

Imbalanced data is a hot topic to which researchers are trying to find an optimal solution due to its impact on learning classifier performance. This study has reviewed sampling technique approaches that can handle imbalanced data in the credit card transaction dataset. It has defined the effect of the imbalanced data on the learning classifiers and the importance of the sampling approaches. Imbalanced data can negatively affect the performance of the detection model by reducing accuracy, thus producing inaccurate fraud detection results. However, effective sampling techniques can be used in the pre-processing stage to balance the data, which can then be trained in the classifier model to detect fraudulent transactions. Measurement metrics are then employed to assess the performance of the system and ensure that the results are correct.
The main findings of this review are there are limitations to undersampling and oversampling when applied alone that lead to a decreased performance of the detection system. When applying undersampling, these include the removal of important information and confusion between information data and noise, while oversampling can lead to overfitting and overlapping. Thus, the optimal solution is to apply a hybrid of the best sampling techniques in order to balance the dataset and improve the performance of the detection system.

10. Future Directions

Future investigations should examine the best hybrid sampling techniques by identifying their best features in resolving the imbalanced data issue as it pertains to identifying fraud in credit card transactions. This may help to increase the performance of fraud detection systems. The hybrid approach uses the different advantages of different sampling techniques to balance the imbalanced data and improve the performance of fraud detection systems and then compare the results gained with those of existing approaches. This review of recent work suggests that the SMOTE technique should be included in the hybrid methods tested in future work in the area.

Author Contributions

M.A. analysis and review the study. M.Y. supervised this study. All authors have read and agreed to the published version of the manuscript.

Funding

This research paper was supported by a grant from the “Research Centre of the Female Scientific and Medical Colleges”, Deanship of Scientific Research (GSR), King Saud University.

Data Availability Statement

Not applicable.

Acknowledgments

This research paper was supported by a grant from the “Research Centre of the Female Scientific and Medical Colleges”, Deanship of Scientific Research (GSR), King Saud University.

Conflicts of Interest

The authors declare no conflict of interest.

References

  1. John, J.; Naaz, S. Credit Card Fraud Detection using Local Outlier Factor and Isolation. (IJCSE) Int. J. Comput. Sci. Eng. 2019, 7, 1060–1064. [Google Scholar] [CrossRef]
  2. Nguyen, T.; Tahir, H.; Abdelrazek, M.; Babar, A. Deep Learning Methods for Credit Card Fraud Detection. arXiv 2020, arXiv:2012.03754. [Google Scholar]
  3. Thabtaha, F.; Hammoudb, S.; Kamalovc, F.; Gonsalves, A.H. Data Imbalance in Classification: Experimental Evaluation. Inf. Sci. 2020, 513, 429–441. [Google Scholar] [CrossRef]
  4. Asha, R.B.; Suresh Kumar, K.R. Credit Card Fraud Detection Using Artificial Neural Network. Glob. Transit. Proc. 2021, 2, 35–41. [Google Scholar]
  5. Najadat, H.; Altiti, O.; Abu Aqouleh, A.; Younes, M. Credit Card Fraud Detection Based on Machine. In Proceedings of the 2020 11th International Conference on Information and Communication Systems (ICICS), Irbid, Jordan, 7–9 April 2020. [Google Scholar]
  6. Pumsirirat, A.; Yan, L. Credit Card Fraud Detection using Deep Learning. (IJACSA) Int. J. Adv. Comput. Sci. Appl. 2018, 9, 18–25. [Google Scholar]
  7. Chandola, V.; Banerjee, A.; Kumar, V. Anomaly Detection: A Survey. ACM Comput. Surv. (CSUR) 2009, 41, 1–58. [Google Scholar] [CrossRef]
  8. Roy, A.; Sun, J.; Mahoney, R.; Alonzi, L.; Adams, S.; Beling, P. Deep Learning Detecting Fraud in Credit Card Transactions. In Proceedings of the Systems and Information Engineering Design Symposium (SIEDS), Charlottesville, VA, USA, 27 April 2018. [Google Scholar]
  9. Wen, S.W.; Yusuf, R.M. Predicting Credit Card Fraud on an Imbalanced Data. Int. J. Data Sci. Adv. Anal. 2019, 1, 12–17. [Google Scholar]
  10. Somasundaram, A.; Reddy, U.S. Data Imbalance: Effects and Solutions for Classification of Large and Highly Imbalanced Data. In Proceedings of the International Conference on Research in Engineering, Computers and Technology (ICRECT), January 2016; pp. 28–34. [Google Scholar]
  11. Kaur, P.; Gosain, A. Comparing the Behavior of Oversampling and Undersampling Approach of Class Imbalance Learning by Combining Class Imbalance Problem with Noise. In ICT Based Innovations; Springer: Singapore, 2018. [Google Scholar]
  12. Mînăstireanu, E.-A.; Meşniţ, G. Methods of Handling Unbalanced Datasets in Credit Card Fraud Detection. Brain. Broad Res. Artif. Intell. Neurosci. 2020, 11, 131–143. [Google Scholar] [CrossRef] [PubMed]
  13. Singh, A.; Ranjan, R.K.; Tiwari, A. Credit Card Fraud Detection under Extreme Imbalanced Data: A Comparative Study of Data-level Algorithms. J. Exp. Theor. Artif. Intell. 2022, 34, 571–598. [Google Scholar] [CrossRef]
  14. Han, H.; Wang, W.-Y.; Mao, B.-H. Borderline-SMOTE: A New Over-Sampling Method in Imbalanced Data Sets Learning. In International Conference on Intelligent Computing; Springer: Berlin/Heidelberg, Germany, 2005. [Google Scholar]
  15. Sun, Y.; Que, H.; Cai, Q.; Zhao, J.; Li, J.; Kong, Z.; Wang, S. Borderline SMOTE Algorithm and Feature Selection-Based Network Anomalies Detection Strategy. Energies 2022, 15, 4751. [Google Scholar] [CrossRef]
  16. Batista, G.; Prati, R.; Monard, M. A Study of the Behavior of Several Methods for Balancing Machine Learning Training Data. ACM SIGKDD Explor. Newsl. 2004, 6, 20–29. [Google Scholar] [CrossRef]
  17. Xie, Y.; Li, A.; Gao, L.; Liu, Z. A Heterogeneous Ensemble Learning Model Based on Data Distribution for Credit Card Fraud Detection. Wirel. Commun. Mob. Comput. 2021, 2021, 2531210. [Google Scholar] [CrossRef]
  18. Choirunnisa, S.; Lianto, J. Hybrid Method of Undersampling and Oversampling for Handling Imbalanced Data. In Proceedings of the 2018 International Seminar on Research of Information Technology and Intelligent Systems (ISRITI), Yogyakarta, Indonesia, 21–22 November 2018; pp. 276–280. [Google Scholar]
  19. Abd el Naby, A.; Hemdan, E.E.-D.; El-Sayed, A. Deep Learning Approach for Credit Card Fraud Detection. In Proceedings of the 2nd IEEE International Conference on Electronic Engineering ICEEM2021, Menouf, Egypt, 3–4 July 2021. [Google Scholar]
  20. Zou, H. Analysis of Best Sampling Strategy in Credit Card Fraud Detection Using Machine Learning. In Proceedings of the 2021 6th International Conference on Intelligent Information Technology (ICIIT ‘21), Ho Chi Minh, Vietnam, 25–28 February 2021. [Google Scholar]
  21. Mansourifar, H.; Shi, W. Deep Synthetic Minority Over-Sampling Technique. arXiv 2020, arXiv:2003.09788. [Google Scholar]
  22. Devi, D.; Biswas, S.; Purkayastha, B. A Cost-sensitive weighted Random Forest Technique for Credit Card Fraud Detection. In Proceedings of the 10th International Conference on Computing, Communication and Networking Technologies (ICCCNT), Kanpur, India, 6–8 July 2019. [Google Scholar]
  23. Wang, Y. An Ensemble Learning Imbalanced Data Classification Method Based on Sample Combination Optimization. J. Phys. Conf. Ser. 2019, 1284, 012035. [Google Scholar] [CrossRef]
  24. Muaz, A.; Jayabalan, M.; Thiruchelvam, V. Acomparison of Data Sampling Techniques for Credit Card Fraud Detection. Int. J. Adv. Comput. Sci. Appl. (IJACSA) 2020, 11, 477–485. [Google Scholar]
  25. Varmedja, D.; Karanovic, M.; Sladojev, S.; Arsenovic, M.; Anderla, A. Credit Card Fraud Detection—Machine Learning Methods. In Proceedings of the 18th International Symposium Infotech-Jahorina, Jahorina, Bosnia and Herzegovina, 20–22 March 2019. [Google Scholar]
  26. Mahesh, K.P.; Afrouz, S.A.; Areeckal, A.S. Detection of fraudulent credit card transactions: A comparative analysis of data sampling and classification techniques. J. Phys. Conf. Ser. 2022, 2161, 012072. [Google Scholar] [CrossRef]
  27. Li, Q.; Xie, Y. A Behavior-Cluster Based Imbalanced Classification Method for Credit Card Fraud Detection. In Proceedings of the 2nd International Conference on Data Science and Information Technology, Seoul, Republic of Korea, 19–21 July 2019. [Google Scholar]
  28. Dornadulaa, V.N.; Geetha, S. Credit Card Fraud Detection Using Machine Learning Algorithms. In Proceedings of the International Conference on Recent Trends in Advanced Computing (ICRTAC), Chennai, India, 11–12 November 2019; Volume 165, pp. 631–641. [Google Scholar]
  29. Itoo, F.; Meenakshi; Singh, S. Comparison and Analysis of Logistic Regression, Naive Bayes and KNN Machine Learning Algorithms for Credit Card Fraud Detection. Int. J. Inf. Technol. 2021, 13, 1503–1511. [Google Scholar] [CrossRef]
  30. Ahammad, J.; Hossain, N.; Alam, M.S. Credit Card Fraud Detection Using Data Pre-Processing on Imbalanced Data-Both Oversampling and Undersampling. In Proceedings of the International Conference on Computing Advancements, Dhaka, Bangladesh, 10–12 January 2020. [Google Scholar]
  31. Wibowo, P.; Fatichah, C. An In-Depth Performance Analysis of the Oversampling Techniques for High-Class Imbalanced Dataset. Sci. J. Inf. Syst. Technol. 2021, 7, 63–71. [Google Scholar] [CrossRef]
Figure 1. Credit card fraud detection process.
Electronics 11 04003 g001
Figure 2. An example of anomaly in a dataset.
Electronics 11 04003 g002
Figure 3. Imbalanced dataset.
Electronics 11 04003 g003
Figure 4. Sampling imbalance data techniques.
Electronics 11 04003 g004
Figure 5. Balance the Dataset ((a). Normal dataset; (b). Dataset oversampled; (c). Identified Tomek links; (d). Removed borderline and noise example) [16].
Electronics 11 04003 g005
Figure 6. Over Sampling Convolution Neural Network Model (OSCNN).
Electronics 11 04003 g006
Figure 7. The suggested cost-sensitive weighted Random forest technique’s framework.
Electronics 11 04003 g007
Table 1. Comparison of sampling techniques for fraud detection in credit card transaction datasets.
Ref.YearDatasetSampling TechniquesClassifierAccuracy
[11]2018Synthetic datasetRandom undersampling, SMOTEC4.5NM *
[24]2020KaggleRandom undersampling, SMOTE, DBSMOTE, SMOTEENNANN, GMB, RF, Stacked ensembleNM *
[25]2019KaggleSMOTELR, RF, NB, MLP97.46%, 99.96%,
99.23%, 99.93%
[26]2022KaggleUndersampling, SMOTE, SMOTE-TomekKNN, LR, RF, SVMNM *
[27]2019Financial institution and 18 UCI datasetsbehaviour-cluster based imbalanced classification methodNM *
[28]2019KaggleSMOTE, MCCLOF, Isolation Forest, LR, Decision Tree, RF45.8%,
58.8%,
97.18%, 97.08%, 99.98%
[29]2021KaggleRandom undersamplingLR, KNN, NB95.9%, 75.1%, 91.5%
[30]2020NM *Undersampling, SMOTEKNN81.12%
[31]2021KaggleRandom oversampling, ADASYN, SMOTE, Borderline-SMOTERF, LR, KNN99.97%
* NM—Not mentioned.
Table 2. Taxonomy of advantages and disadvantages of sampling approaches among the reviewed papers.
Approaches Ref.AdvantagesDisadvantages
Data-level approach[11]
  • The SMOTE performs better than RUS in a noisy enviorment.
  • SMOTE preformance increases when the classes are balanced.
  • RUS performance decrese when the classess are changed from unbalanced to balanced.
  • RUS removes more informational data and has agreater impact on noise point hold in the majority classes.
sData-level approach, Hybird approach[24]
  • SMOTE is the best strategy as it gvies excellent precision scores with distributed RF classifier.
  • SMOTE, SMOTEE, DBSMOTE produce good performnce with classifiers.
  • RUS gives low precision with ANN classifier.
Data-level approach[25]
  • SMOTE improves the fraud detection rate.
  • SMOTE may cause overfitting.
Data-level approach[26]
  • The best sampled data result is obtianed by SMOTE-Tomek, with high F1 score.
  • Undersampling reduces the number of samples that are too small for training clssifier algorithms effectively.
  • SVM and LR show the worst performance with SMOTE and SMOTE-Tomek are
Data-level approach[27]
  • Elimination behavoiur noise in fraud detection.
  • Solve the imbalnced data problem.
  • Gives a low result in F1 score and low precision.
Data-level approach, Algorithm-level approach[28]
  • SMOTE and MCC are show better result together with the classifers.
  • Oversampling dose not produced any goood results.
Data-level approach[29]
  • RUS with LR produces excellent results in fraud detection.
  • RUS may cause some loss of important information.
Data-level approach[30]
  • Combining oversampling and undersampling techniques improves the performance of the classsifcation.
  • Applying only undersampling produces lower accuracy.
  • Applying only oversampling produces lower accurancy.
Data-level approach[31]
  • Borderline-SMOTE produces the best results since it mirrors the minority data’s margins.
  • ROS has little variance in duplicate data as data duplication is based on the original data.
Publisher’s Note: MDPI stays neutral with regard to jurisdictional claims in published maps and institutional affiliations.

