

Design Optimization of an Efficient Bicolor LED Driving System

Department of Electrical and Electronic Engineering, Bangladesh University of Engineering and Technology, Dhaka 1205, Bangladesh
*
Author to whom correspondence should be addressed.
Electronics 2022, 11(23), 3984; https://doi.org/10.3390/electronics11233984
Submission received: 1 November 2022
/
Revised: 27 November 2022
/
Accepted: 27 November 2022
/
Published: 1 December 2022
(This article belongs to the Topic Power Converters)
Abstract
:There are some challenges involved in the design of a multicolor LED driver, such as the precise control of color consistency, i.e., maintaining the correlated color temperature (CCT) and luminous intensity. CCT deviation causes a color shift of composite light. This paper approaches the method of nonlinear optimization of the LED currents of two LED sources to achieve the desired CCT. A bicolor blended-shade white LED system is formed by using a warm color LED source of 1000 K CCT and a cool color LED source of 6500 K CCT. By using a nonlinear optimization methodology, the reduced deviation of the blended CCT and optimum LED currents are obtained. The optimized currents in the two LED strings are maintained by the control circuit of the single-ended primary inductor converter (SEPIC). The obtained reduced deviation of the CCT is 43 K, and the precision is 99.15%. Again, harmonics in the input current hamper power quality, i.e., reduce the power factor and increase power loss. This paper proposes the harmonic reduction technique to achieve the lowest value of total harmonic distortion (THD) through the nonlinear parametric optimization of the SEPIC. Measured THD = 4.37%; PF = 0.96; and efficiency = 92.8%. The system stability was determined and found to be satisfactory.
1. Introduction
Multicolor LED lights can provide a large range of colors and quality lighting with a high color rendering index (CRI), and they can be applied in many areas [1]. As red, green, and blue LEDs have different thermal and luminous characteristics, variation in one color can have a significant effect on the targeted color point (CCT). Color control in LED systems is a multidisciplinary subject involving electric power, circuit topology, thermal management, and optical performance [2,3]. There is a lack of measurement results that describe the luminous and power parameters of multicolor LED systems. This paper presents an LED driving system which describes essential luminous and power measurements.
The color recognition of the LED light is a crucial research area in multicolor LED systems [4,5]. For the smooth intensity control of an LED light, optical regulation can be conducted either by changing the amplitude level or the duty cycle, or by changing both of the currents flowing through the LEDs [6,7]. White and other different colors can be generated using LED lights. Currently, LED-based white light is generated from a blue or a near-ultraviolet emitting chip coated with yellow phosphor, or by mixing red, green, and blue light [8]. Light from monochromatic red-green-blue (RGB) LEDs [9,10,11,12] or red-green-blue-amber (RGBA) LEDs were blended to obtain different shades of white. However, these types of LED systems require three or more pulse-width modulated (PWM) output channels. The RGB [10,13] or RGBA [14] LED driver uses independent converters for its power supply. These are redundant. The proposed bicolor LED driver uses a single power converter to drive both LED strings.
There are some challenges in obtaining a high-quality multicolor LED light source, such as junction temperature variations caused by the self-heating of the LEDs and disturbances in ambient temperatures [10,15]. These factors affect the LED current and hamper color consistency, i.e., CCT. The researchers proposed different feedback control structures based on LED junction temperature [13,15] to stabilize the luminous intensity and color consistency. However, the use of sensors not only increases the complexity but also increase the expense of the system. The proposed LED driver does not require sensors.
Therefore, in the design of LED drivers for diversified applications, constituents such as color consistency (CCT) and color intensity are needed along with other key requirements such as low THD, high PF, and high efficiency. Several attempts have been made to achieve low harmonics in the input current [16,17,18,19]. The resulting aim would be to achieve an LED driver that can maintain a constant CCT with constant intensity along with low THD and high luminous efficiency. High efficiency enables a low consumption of electrical energy. However, in most cases, the efficiency of LED drivers is low [20,21,22,23,24], and they cause harmonics in the input current and a low power factor [25,26,27]. The proposed LED driver has overcome these THD and power factor issues. This paper has achieved a low THD value by using a non-linear optimization methodology on SEPIC parameters. There was a bit of a discrepancy between the measured results and the calculated results for the THD. A high power factor was achieved by using a proper control circuit.
The precise color control of the multicolor LED system is still a challenging task for the chromaticity (CCT) shift due to the junction temperature variation and aging [28,29,30,31,32,33]. Efforts are ongoing to maintain CCT control. Papers [34,35,36,37,38] used the linear method for the CCT control of bicolor LEDs, and they considered the CCT constant, which is inaccurate. The CCT assumption fails to account for the temperature-dependent color temperature of LEDs and the nonlinearity of LEDs. It employs duty cycle control to mix color. The proposed LED driver is based on the use of nonlinear optimization to find the least CCT deviation. CCT and dimming control are performed in [39] using a microcontroller, where CCT deviation varies from 145 K to 510 K for a CCT range 2700 K to 6500 K. This large CCT deviation will cause color shifts. Using a microcontroller enhances complexity and cost. An open-loop system is used in [40] for CCT control, and the deviation of CCT is relatively higher. In [39,41,42], the authors focus on color control based on PWM switched systems. Refs. [39,41] uses one AC–DC converter and two LED drivers. The closed-loop control system is highly dependent on color sensors. MCU is used to generate PWM. All these increase complexity and cost. Paper [42] worked on CRI optimization with CCT, but there was no option to mitigate junction temperature and aging. They worked only on the color control of LEDs. The papers did not mention anything about the power source, power quality, and power related issues, etc. On the other hand, our proposed LED driver gives the full driver circuit design while considering color and power issues. The proposed driver has mitigated the current rising with the junction temperature and the aging effect by using a proper color feedback circuit. The driver shows a CCT deviation range of 43 K to 234 K, which cannot be seen by the naked eye. A microcontroller is not required in the proposed driver, and this reduces cost and complexity.
In previous studies [40,41] of bicolor LEDs, researchers have worked with only bicolor LEDs, whereas we have not only worked with bicolor LEDs but we have also designed a bicolor composite LED driver. In [43], the authors propose a general-purpose LED driver, and in [44], the authors describe a bicolor LED driver. In both cases, the power parameters are good. In [45], the authors worked with a bicolor LED driver based on luminous flux as a function of the LED voltages, but luminous flux is a function of LED current, which is more accurate. They did not mention the power quality parameters. In the proposed paper, we designed a bicolor LED driver for which the CCT was maintained at two color temperatures, namely, 1000 K and 6500 K, with a blended-shade white composite LED light through controlling the LED string current. At the same time, we achieved the least THD and a high power factor by optimizing the SEPIC parameters and using a proper control circuit, respectively.
In the proposed LED driver, the bicolor LED string’s current is regulated by a single power converter. The combined CCT of the composite LED light is determined. CCT deviation is minimized through the constrained nonlinear optimization of the LED currents of the two LED strings. A nonlinear constrained parametric optimization methodology is also applied to refine the parameters of the SEPIC to obtain the lowest THD value. The proposed driver also boosts the efficiency and power factor. The SEPIC is operated in DCM and hence a control circuit improves the power factor. Thus, the LED driver maintains the desired CCT with minimal THD. Nowadays, people prefer a diversity of light color, e.g., shopping centers, garden lights, and spotlights where colors change with different control techniques. The nonlinear optimization model can be simplified to achieve practical solutions which are then transformed into real life applications. The result is more accurate than those obtained with linear approaches. The idea can be applied to LED systems with multiple color temperatures and is not limited to white LEDs.
The remainder of the paper is organized as follows: the basic configuration and driver topology are described in Section 2, the nonlinear optimization approach is laid out in Section 3, the nonlinear optimization of the reduction in CCT deviation is shown in Section 4, the analysis of the color-control scheme is described in Section 5, the proposed parametric optimization methodology for harmonic reduction is detailed in Section 6, the stability studies are listed in Section 7, the results are discussed in Section 8, and a conclusion is provided in Section 9.
2. Basic Configuration and Driver Topology
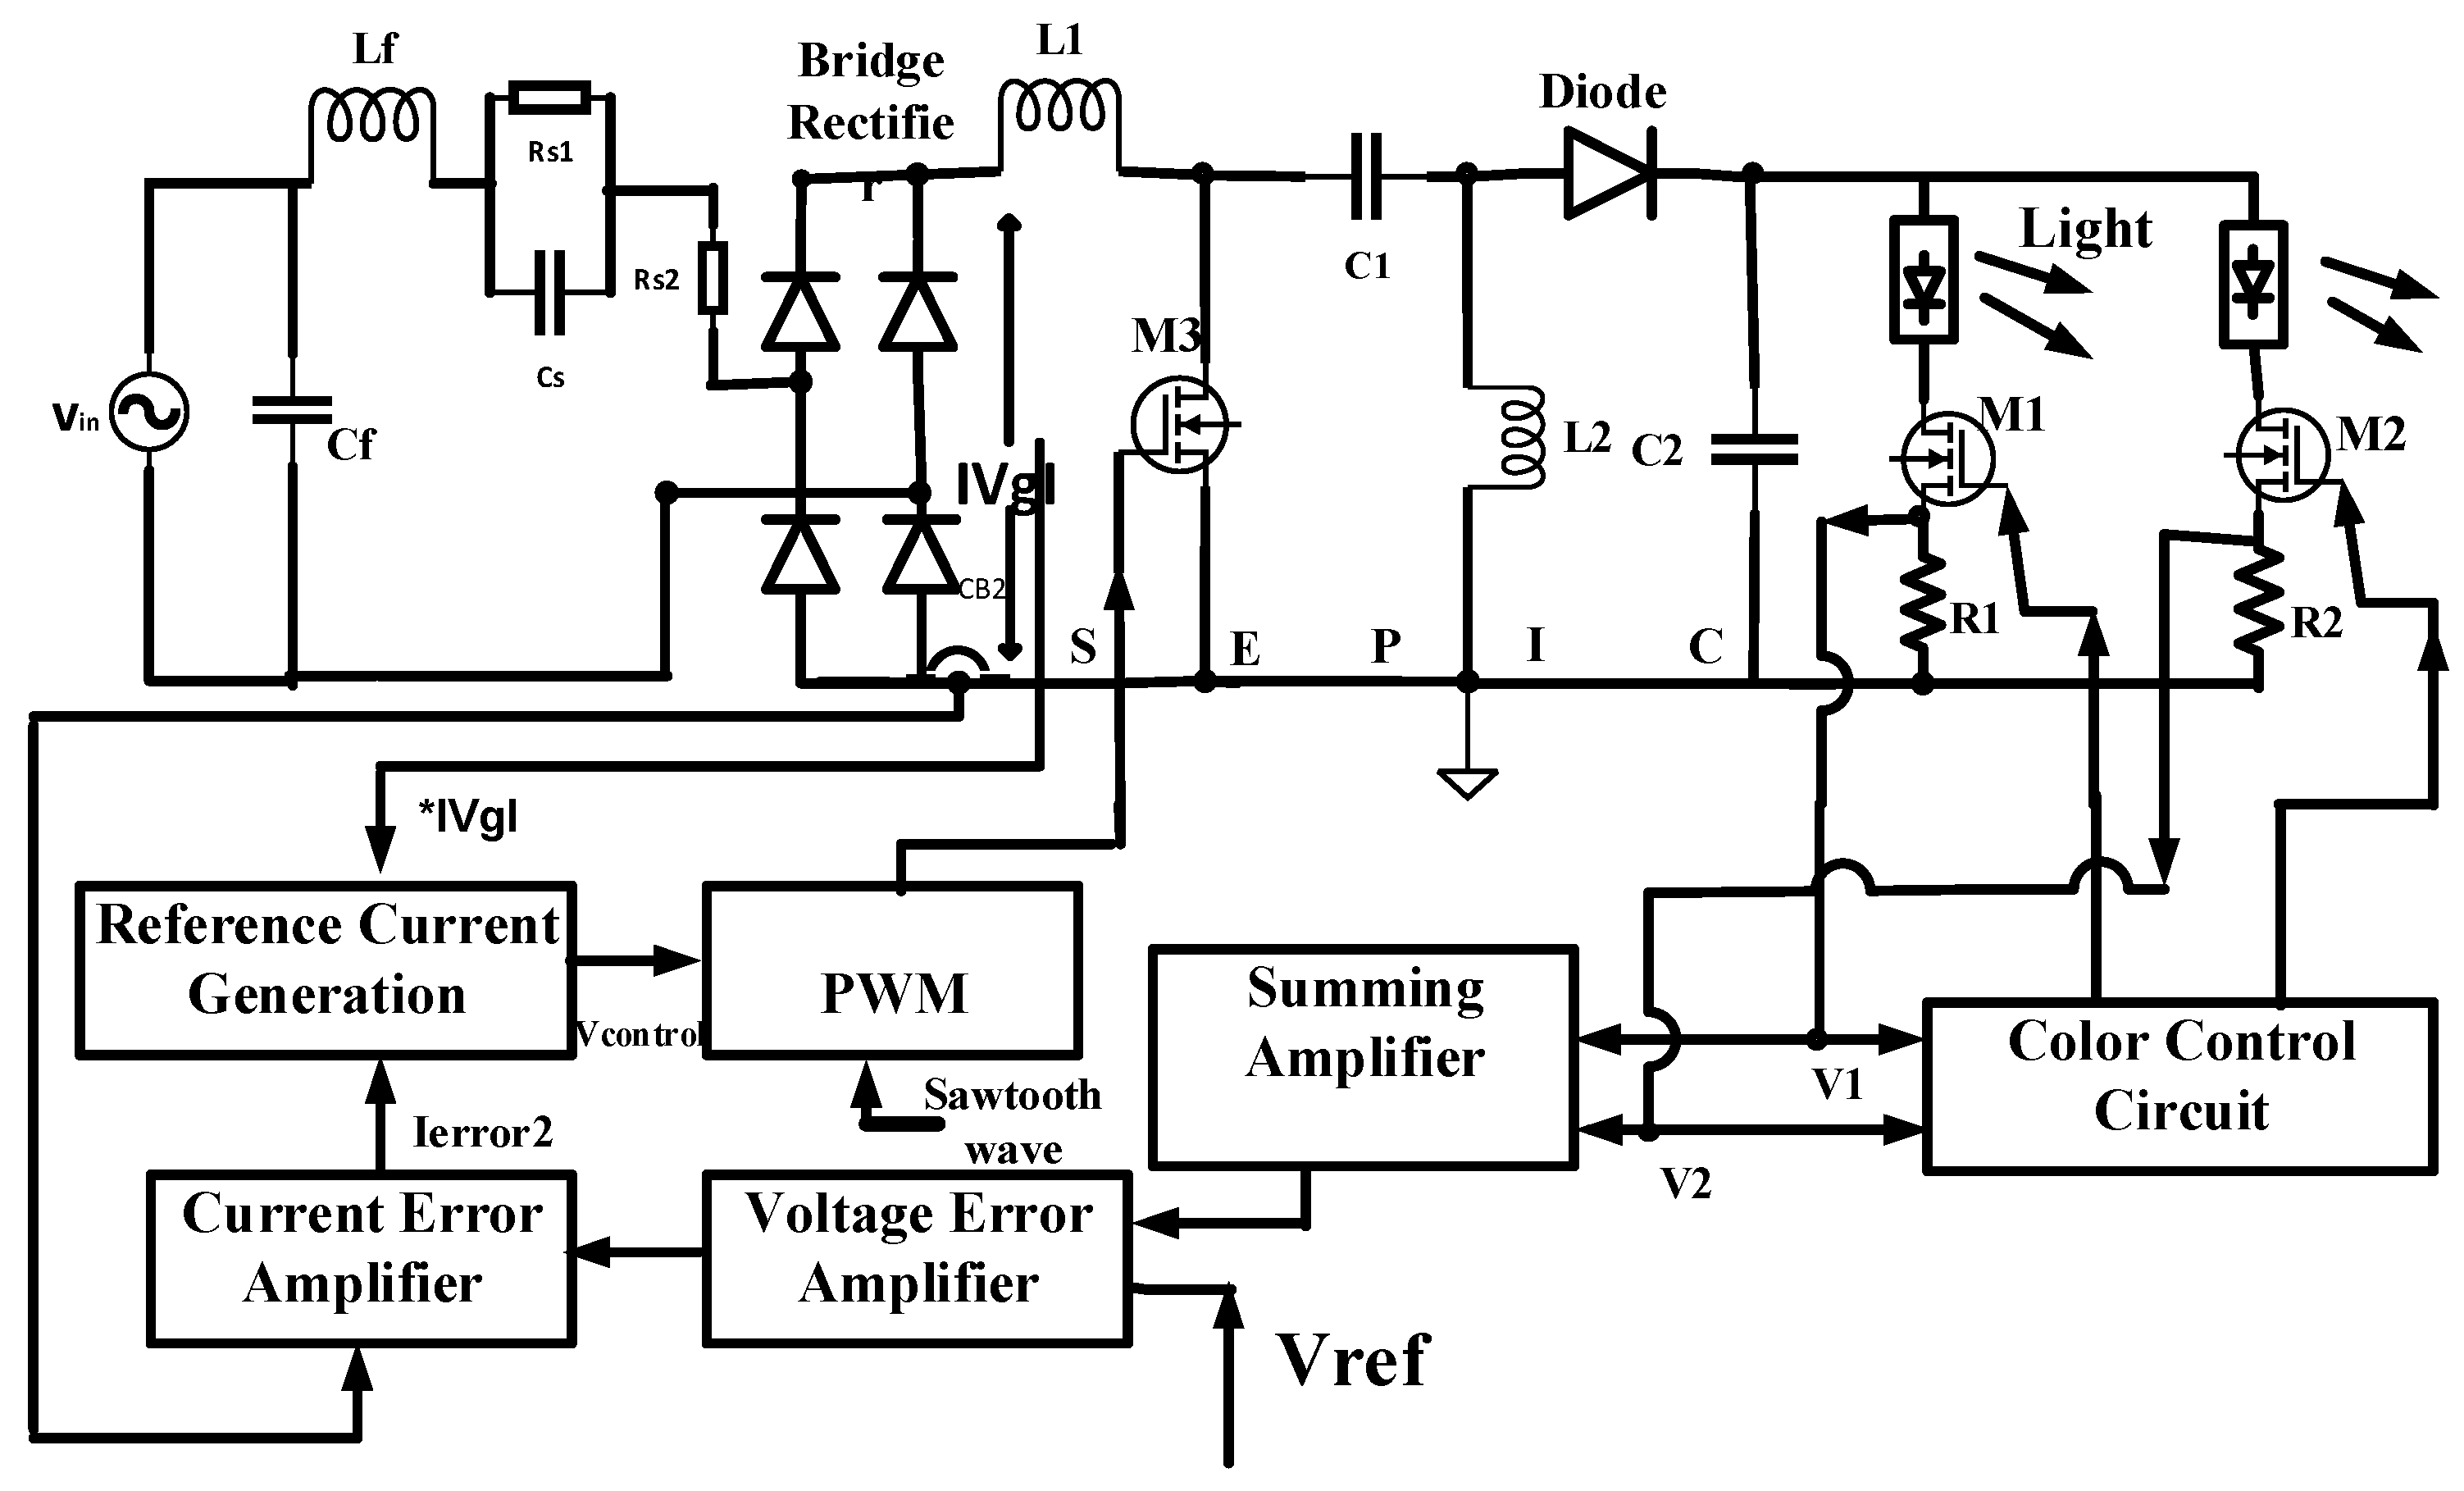
The bicolor LED driver circuit consists of two parts. The first is the power stage, and the second is the color management stage. The power stage comprises a bridge rectifier and a SEPIC to regulate the LED outputs. The SEPIC is chosen for PFC due to its superior characteristics: positive DC output, high–low output level, low switching stress, and low output ripple current. The total LED current regulation is carried out using the control circuit of the SEPIC. The block diagram in Figure 1 shows the power stage. The color controller controls the LED current in each of the LED strings.
The CCT and THD are controlled in the bicolor LED driver circuit simultaneously. The composite CCT is obtained by blending the colors of the LEDs of two parallel branches. By maintaining optimized LED currents in both branches, the minimization of CCT deviation can be obtained. In the color control scheme, the required current in each LED string flows individually through each color control feedback loop to achieve the target CCT with color stability. Reduced THD can be obtained by using optimized SEPIC parameters with the LED driver. The circuit parameters are achieved by performing constrained nonlinear optimization within the workable boundary.
The SEPIC provides a constant current, which is equal to the sum of the desired currents in the two LED strings, i.e., the SEPIC output current is divided into two LED strings according to the equivalent resistor of each branch. For the proposed converter topology, bicolor LED strings with string voltages (V1 and V2) act as the load. The sensed voltages of the two LED strings are summed and then passed through a voltage error amplifier. This generates an error signal, which is the reference current of the current error amplifier. The inductor current (IL) is sensed and compared with the reference. It performs a proportional and integral function. The output of the current error amplifier is multiplied by the input sinusoidal voltage template, and the resulting signal forms the reference to generate the PWM signal. This helps to improve the power factor and reduce the harmonics in the input current. The PWM signal is generated by comparing a sawtooth carrier signal of 20 kHz with the output of a multiplier. The LED currents are as follows:
From ref. [43], the average SEPIC output current is:
I0 has been divided into R01 and R02 (R01 and R02 are the equivalent resistances of string1 and string2).
The average LED currents are now:
are the duty cycles of MOSFETs M1 and M2.
Finally, the PWM signal is fed into the gate of SEPIC MOSFET M3, and thus the LED current is maintained. An RC circuit is incorporated before the bridge rectifier to suppress the inrush current and voltage spike. The RC circuit is also shown in Figure 1. The details of the color control scheme are provided later.
3. Nonlinear Optimization Approach
Problem-based nonlinear constrained optimization methods are effective for fixing the parameters of analogue circuits. This optimization method is applied to find the optimum value of the LED current to achieve the desired CCT, and to find the lowest THD value with the optimum parameters for SEPIC L1, L2, and C1 and the optimum filter parameters for Lf and Cf. Minimized CCT deviation and minimal THD are both desirable for maintaining color consistency and power quality in a multicolor LED driver, respectively. Figure 2 shows a functional block diagram of the CCT optimization process.
Non-linear optimization can be conceptually divided into the following distinct parts: (i) define the objective function or cost function, (ii) create constraints, and (iii) solve the problem iteratively within these constraints. The objective function is a mathematical model quantitatively describing the desired behavior of the circuit. We chose to define the circuit performance metric in order to minimize the cost function. The solution of the cost function achieves the lowest value among all the combinations of possible variables.
Constraints of optimization constitute a hard boundary placed on the value of a variable, which prevents transition to unrealistic values. In nonlinear constrained optimization, the error function is calculated and then the parameters are adjusted to minimize the error function, causing the actual circuit behavior to approach the target function as closely as possible within the boundary limit.
4. Nonlinear Optimization for Reduction of CCT Deviation
Color temperature is a characteristic of visible light. Changing the color consistency causes adverse effects on human perception and comfort. Therefore, it is important to choose the right color temperature based on the desired mood. The International Commission for Illumination (CIE) has regulated and evolved multiple color spaces for the computation, assessment, and demonstration of visualizable colors [8]. In this paper, the system is configured based on two different color temperatures. The combined CCT of the composite LED light is determined. The CCT deviation is minimized through the nonlinear optimization of the LED currents of the two LED strings.
Creation of Optimization Problem
For the two LED modules with color temperatures of 1000 K and 6500 K, the chromaticity coordinates of the emitted light according to CIE 1931 are, respectively, (x1, y1) and (x2, y2) with luminous fluxes φ1 and φ2. Referring to Figure 1, the currents that flow through the mentioned LED strings are ILED1 and ILED2, and their corresponding voltages are VLED1 and VLED2, respectively. In order to find the desired CCT within the infinite number of possible solutions, an objective function is introduced to the system of equations. Equations (4) and (5) illustrate the mathematical model of the CCT. The CCT deviation is:
According to McCamy’s approx. algorithm [1], the estimated CCT of synthesized light is:
where .
The chromaticity coordinate of the light synthesized by the two LED channels is based on [1]. Each color LED features a different spectral distribution and luminous output. If P is the consumed electrical power of each LED string and εi is the luminous efficacy of the LED light source, then , where I = 1,2 for the bicolor LED string. By calculating the values of x, y, and φi, n is estimated as follows:
The target CCT is obtained from the (x, y) coordinate of the blackbody curve. This CCTest model is used in order to obtain the least CCT deviation.
Formation of Constraint with boundary—LEDs are current-driven devices with low equivalent dynamic resistance. The LED model is shown in Equation (7). Figure 3 represents the graph of LED load model. The constraint equation represents the I-V relationships of the LEDs.
The LED current is:
Rearranging
The reverse saturation current Io can be practically considered as 10 μA. The ideality factor n = 2 denotes the direct semiconductor (GaAs and InP). The room temperature thermal voltage VT is considered to be 0.025 V.
The reduction in CCT deviation reduces color shift. Theoretically, various combinations are possible for CCT minimization. However, CCT deviations, i.e., color shifts, will only be minimized if the LED currents are within the specified ranges and the other parameters are meaningful. We measured the I-V characteristics of LEDs of 1000 K (LED1) and 6500 K (LED2), which were confined, according to their observed I-V characteristics. We considered the current limit of ILED1 to be from 220 mA to 320 mA when the LED1 voltage varies between 23 volts and 25 volts, and the current ILED2 rises from 510 mA to 610 mA when the LED2 voltage varied from 23 volts to 25 volts. For the change in the AC input voltage, the SEPIC output changed within the limit for feedback control.
Luminous efficacy differs with color variation. The efficacy of the LED was measured at 10 lm/watt and 33.7 lm/watt for LED1 and LED2, respectively. The minimized CCT deviation was obtained by solving the nonlinear optimization problem in MATLAB. We obtained ∆CCT = 87.7 K for two optimized LED currents, ILED1 = 290 mA and ILED2 = 610 mA. In the bicolor LED driver, the color control circuit should be designed in such a way that the 290 mA and 610 mA currents will flow through the LED1 and LED2 strings, respectively, to ensure minimal CCT deviation.
Some other constraints are the luminous intensity, efficacy, temperature, and electrical power of LEDs. All these depend upon LED currents. Since LED sources have a narrow spectral range in comparison with the visible spectrum, composite LED systems are highly sensitive to variations in temperature and peak wavelengths. As the junction temperature is not controllable, we can compensate for its effect with a color feedback circuit. Again, variations in circumambient luminosity and LED lifetime will lead to even more significant deviations in the real flux and CCT.
5. Proposed Color Control Scheme
Luminous output changes with temperature, and it changes over time in a way that cannot be accurately prognosticated. These factors influence the CCT, light intensity, and color point. This problem can be solved by applying a proper current control scheme.
The CCT and luminance set points are provided to the system in a convenient form using two series resistors, R1 and R2,, connected with both LED strings, respectively. The bicolor LED driver with a color controller is shown in Figure 4. The LED string current is sensed from series resistors R1 and R2. The current error amplifier maintains the LED current according to the reference value. This reference value is tuned to achieve the value of the current obtained from the MATLAB optimization program. It maintains the CCT of the corresponding color point. The control voltage is the output of the current error amplifier. The PWM signal is generated by comparing the control voltage with the sawtooth wave of the same clock frequency (20 kHz). The PWM signal generated from each color control loop is fed into the gate of the MOSFET of both LED strings and maintains the desired LED current individually. Thus, the corresponding color point and CCT of the respective LED currents remain stable. The switching state transition times of M1 and M2 are very short (a few ns), so it is undetectable to humans. The dimming capability can be achieved by changing the reference voltage. For the color controller, if one LED current is controlled instead of two, under the premise of controlling the sum of the two LED currents, one LED current will be discontinuous, and the other will be continuous. For currents of a different nature, smooth color control becomes difficult. This is why two-color control loops are used.
6. Proposed Parametric Optimization Method for Harmonic Reduction
The parameters that influence harmonics in the input current are the value of the input inductor L1, input capacitor C1, and output inductor L2, and the filter components Lf and Cf. The nonlinear optimization method is applied in order to minimize the THD, where the parameters of the SEPIC and input filter parameters are optimized.
6.1. Expression for the Optimization Problem
We have applied the problem-based nonlinear constrained optimization methodology by using MATLAB. For this purpose, the SEPIC parameter optimization problem is formulated first. THD is defined in the optimization problem. Next, the necessary constraints are set and then the nonlinear optimization algorithm is executed iteratively to minimize the cost function by varying the parameters within the range set by the constraints.
To minimize the THD, the objective functions is obtained from Equations (9) and (10) of reference [43].
6.2. Formation of Constraint with Boundary
To achieve minimal THD, the SEPIC parameters L1, L2, and C1 and the filter parameters Lf and Cf are optimized using nonlinear optimization in MATLAB, and the constraint boundary limit is defined in the practical domain. Here, we first consider the limit of L1. The value of L1 is defined in Equation (9):
Here, L1 depends upon ΔIL1. L1 must be high enough for ΔIL1 to be significantly minimized. In the practical circuit, L1 has some limitations, such as size, cost, and the availability of component values. It should also be cost effective. Considering the above, L1 is varied from 1 mH to 10 mH. L2 is defined as the equivalent resistance of Leq and L1. Leq is dependent on the dynamic resistance, voltage conversion ratio, and switching frequency. Considering the transfer of energy in the SEPIC, it is feasible to restrict L2 to a moderate range, i.e., to the micro-henry range.
It is confined in the range of 1 µH to 100 µH. Now, the constraint parameter C1 depends upon the resonance frequency fr,,which should be within the line frequency and switching frequency. The resonance frequency is considered to be 3 kHz. C1 is the input energy transfer capacitor. Therefore, it should be a small value for the smooth transfer of energy from the input to the output, and for maintaining proper circuit operation according to the constraint of Equation (10).
For convenience, the range for C1 is from 0.001 µF to 0.01 µF. For the input filter, high impedance is used to restrict the unwanted frequency in the input terminal. It should also be noted that to restrict the high starting current and voltage spike, an RC soft-start is incorporated in the circuit after the LC filter in the input. The effect of these RC components is also considered while calculating Lf and Cf. Thus, undesired signals, especially high frequency signals, will be blocked from the power grid.
Here, Lfeq is the equivalent inductance of the filter components. By evaluating a realistic situation, Cf is restricted in the range of 0.1 µF to 1.0 µF and Lf is restricted in the range of 1 mH to 10 mH, according to the constraints (12). The minimized THD is obtained from the solution of the nonlinear optimization by using MATLAB. THD = 2.1% is obtained for the SEPIC parameters L1 = 10.0 mH, L2 = 40.0 μH, C1 = 0.01 μF, Lf = 10.0 mH, and Cf = 1 μF. The measured values are provided in Section 8.
7. Stability Studies
A state space-averaged model for the SEPIC-based LED driver during different modes of operation has been developed [43]. Following this methodology, the factors of the bicolor LED system are considered, and the overall open-loop transfer function of the System is obtained as follows:
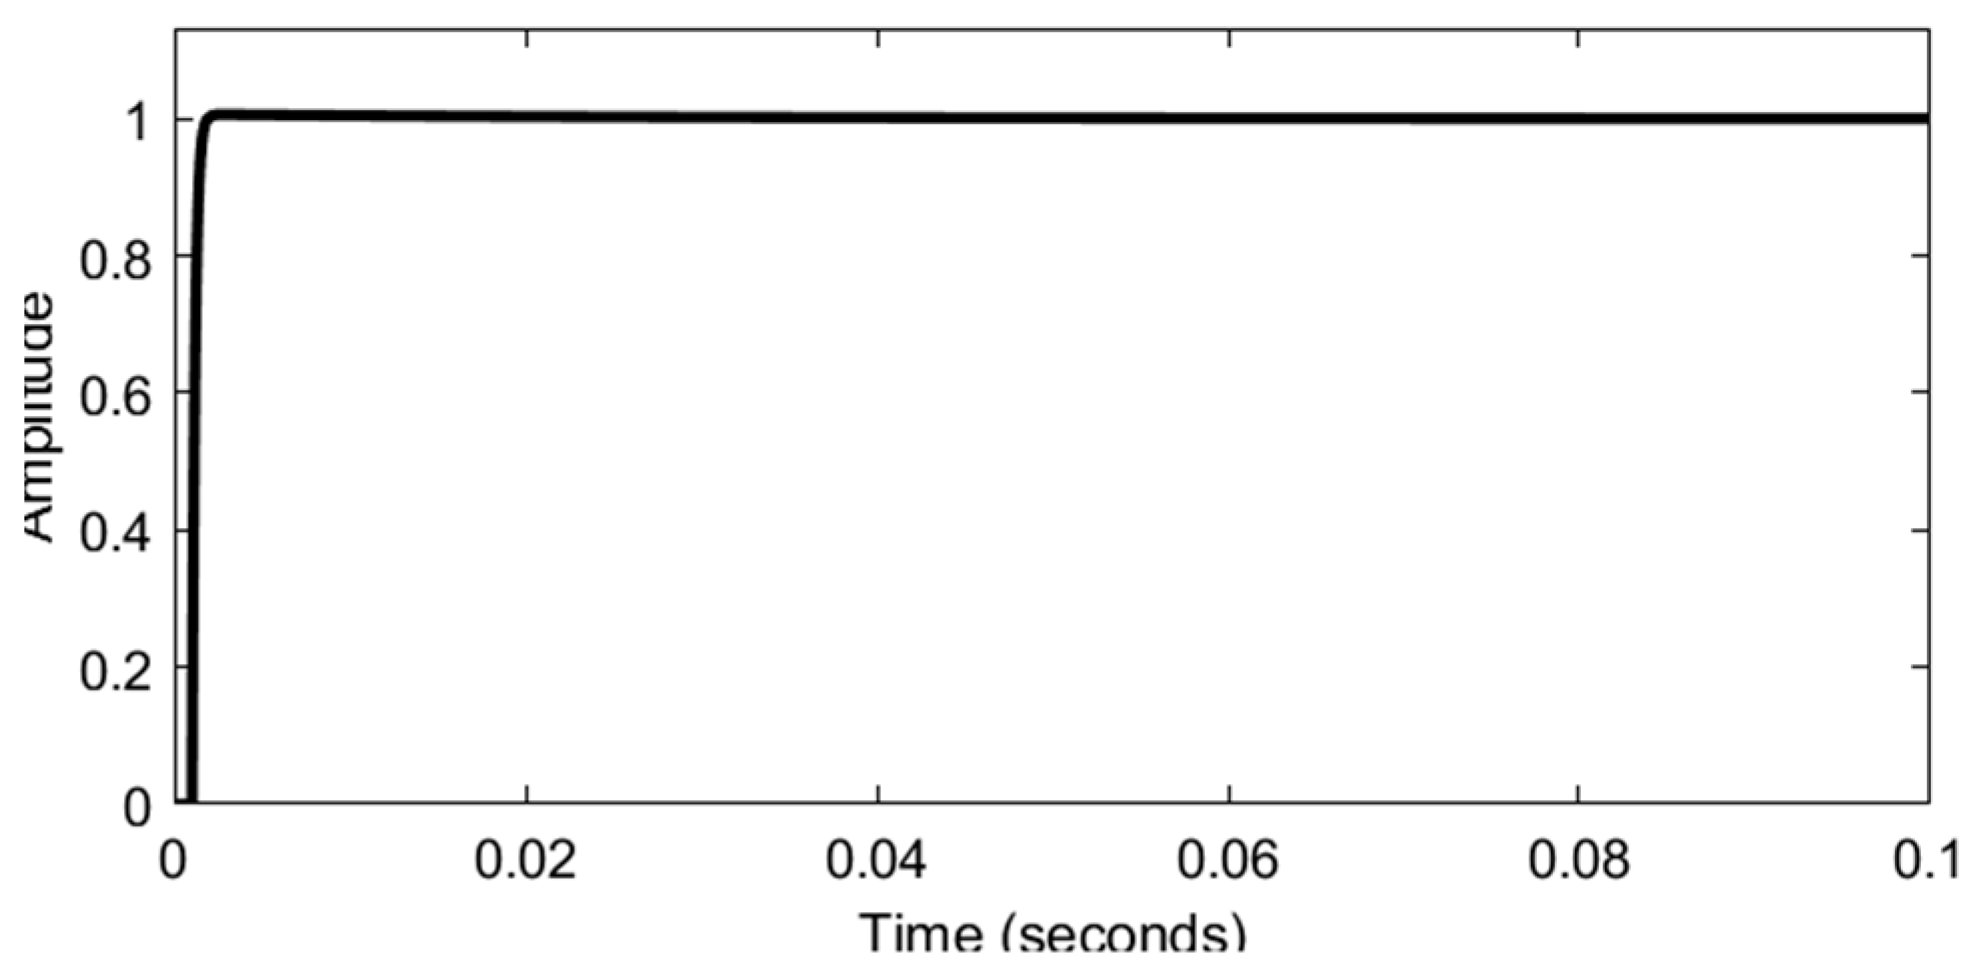
From the step response shown in Figure 5, it is found that for the compensated model, the system reaches the steady state within only 1 ms.
8. Results
We have designed a nonlinear optimization scheme in MATLAB for bicolor LED combinations. For both cases, CCT and THD, to achieve the lowest value, nonlinear optimization was performed by refining the boundary limits to obtain optimum performance. In the bicolor system, both the LED strings were of 24 volts, and LED1 (2 × 12 V) and LED2 (3 × 8 V) were mounted on the heatsink. The experimental setup consisted of the SEPIC circuit and a control circuit. The control circuit consisted of a summing amplifier, voltage error amplifier, current error amplifier, and multiplier, and PWM generators were constructed using the OPAMP, diode, capacitor, and resistors. We determined the different luminous and electrical characteristics of 1000 K and 6500 K LEDs.
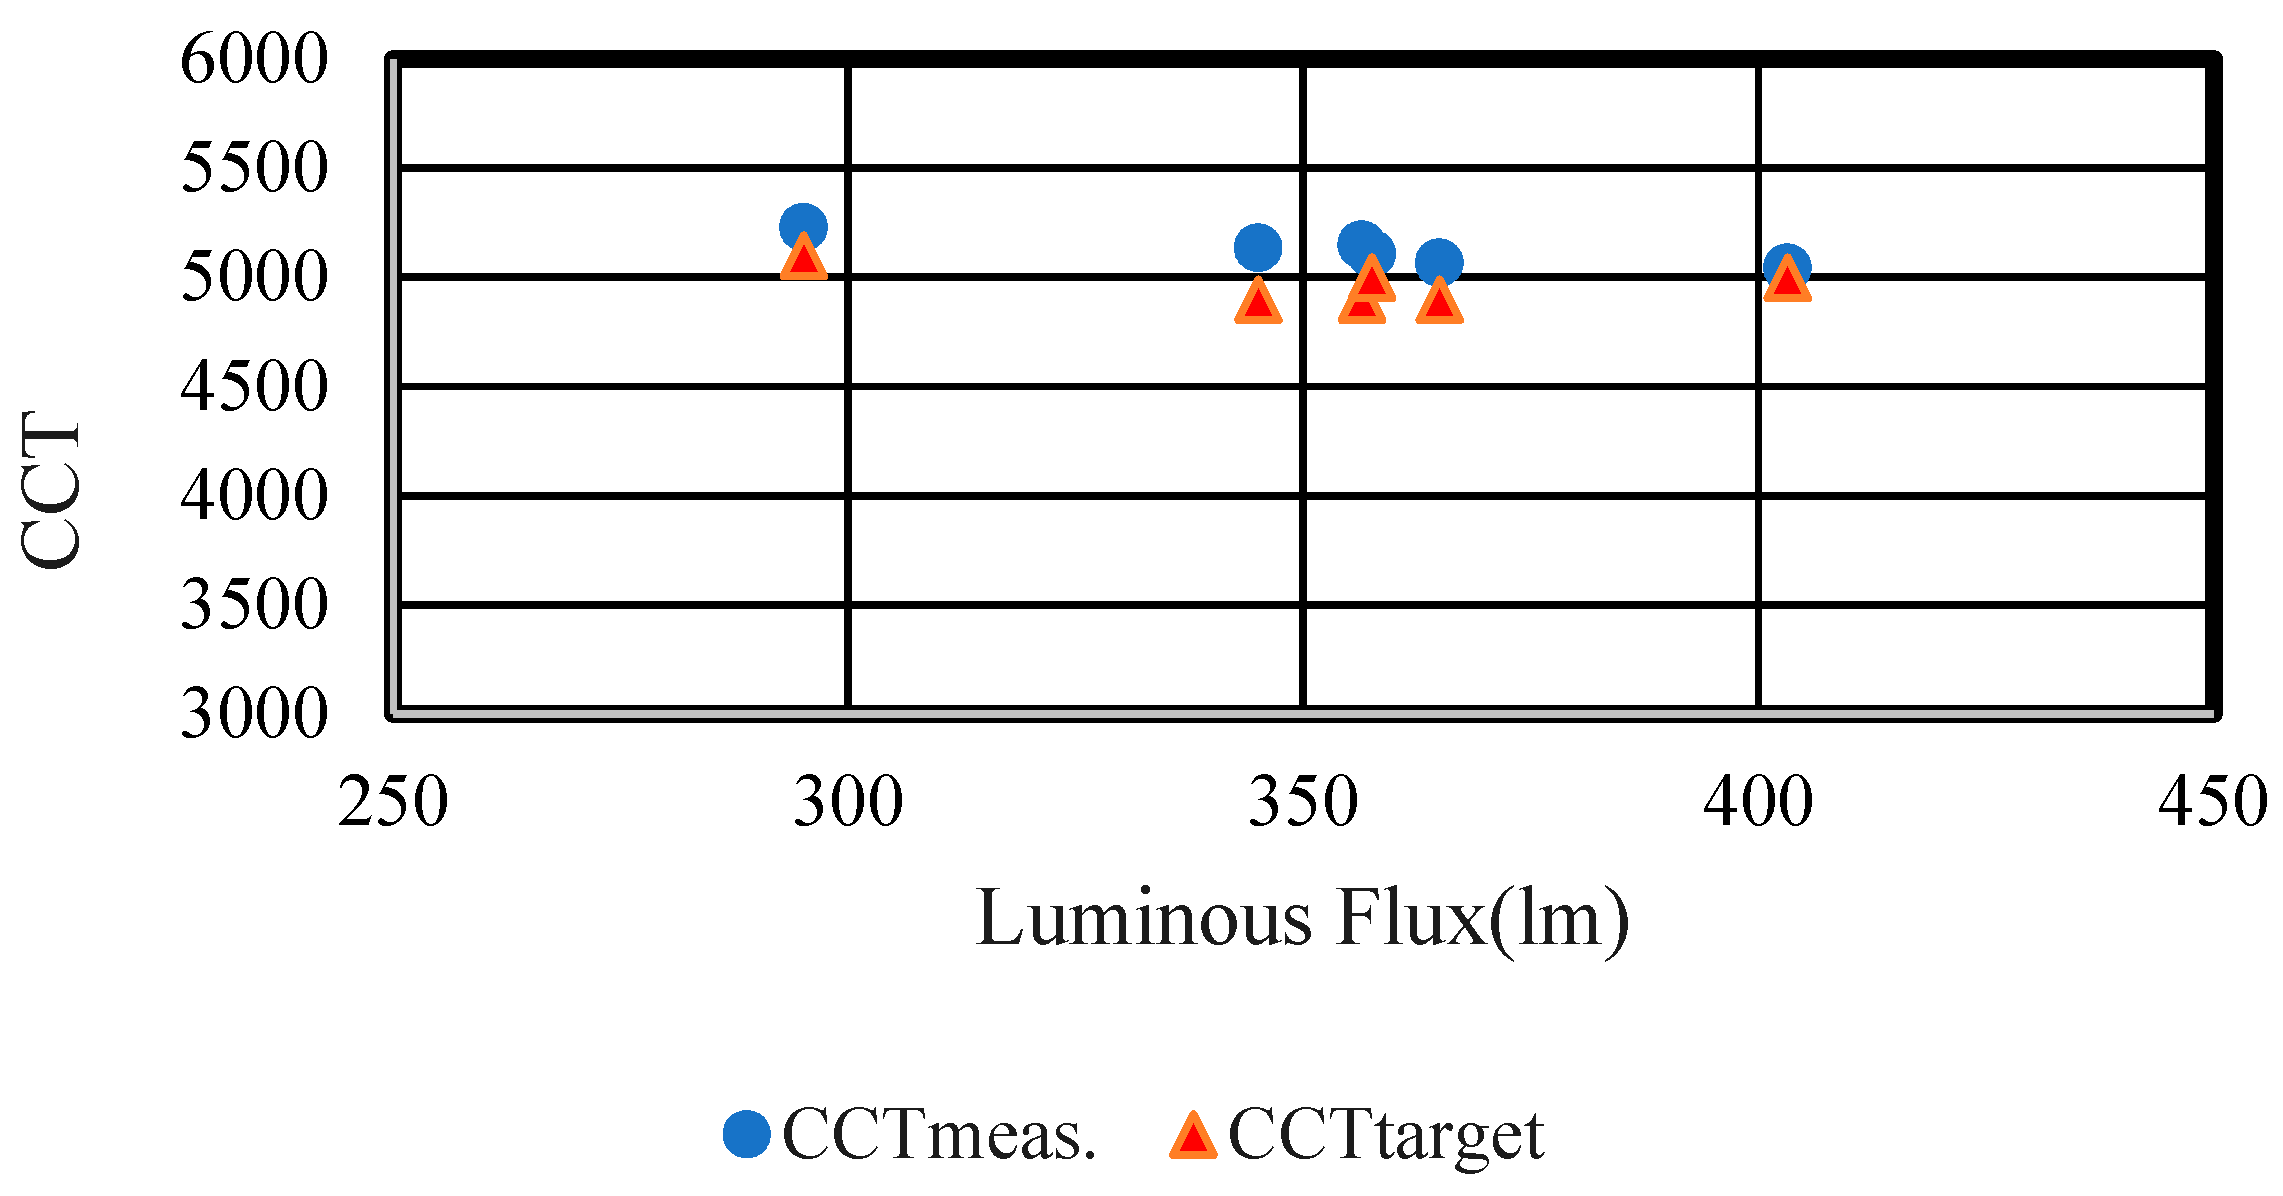
By applying the proposed closed-loop control scheme, we regulated the specified currents, 290 mA and 610 mA, found in the nonlinear optimization algorithm to flow through the two LED strings at an input voltage of 220 V. The CCT, CRI, and luminous flux of the composite LED light were measured with an LED current from the Lab-sphere Photometric Measurement System PM-105-16 at different input voltages. Figure 6 shows the CCT and flux vs. the LED current curve for both LEDs. The CCT was almost constant, but the flux increased with the increase in LED current. The measured composite CCT was 5043 K, which was very close to the desired CCT of 5000 K. The CCT deviation was 43 K at an operating voltage of 220 V, which is within the non-perceivable (+/−283 K) color limit [26]. The measured and target CCT values with the flux of the bicolor LED light are shown in Figure 7. The experimental results show that, despite variations in light intensity, the bicolor LED lamp with a closed-loop control remained stable with the strict control of the CCT.
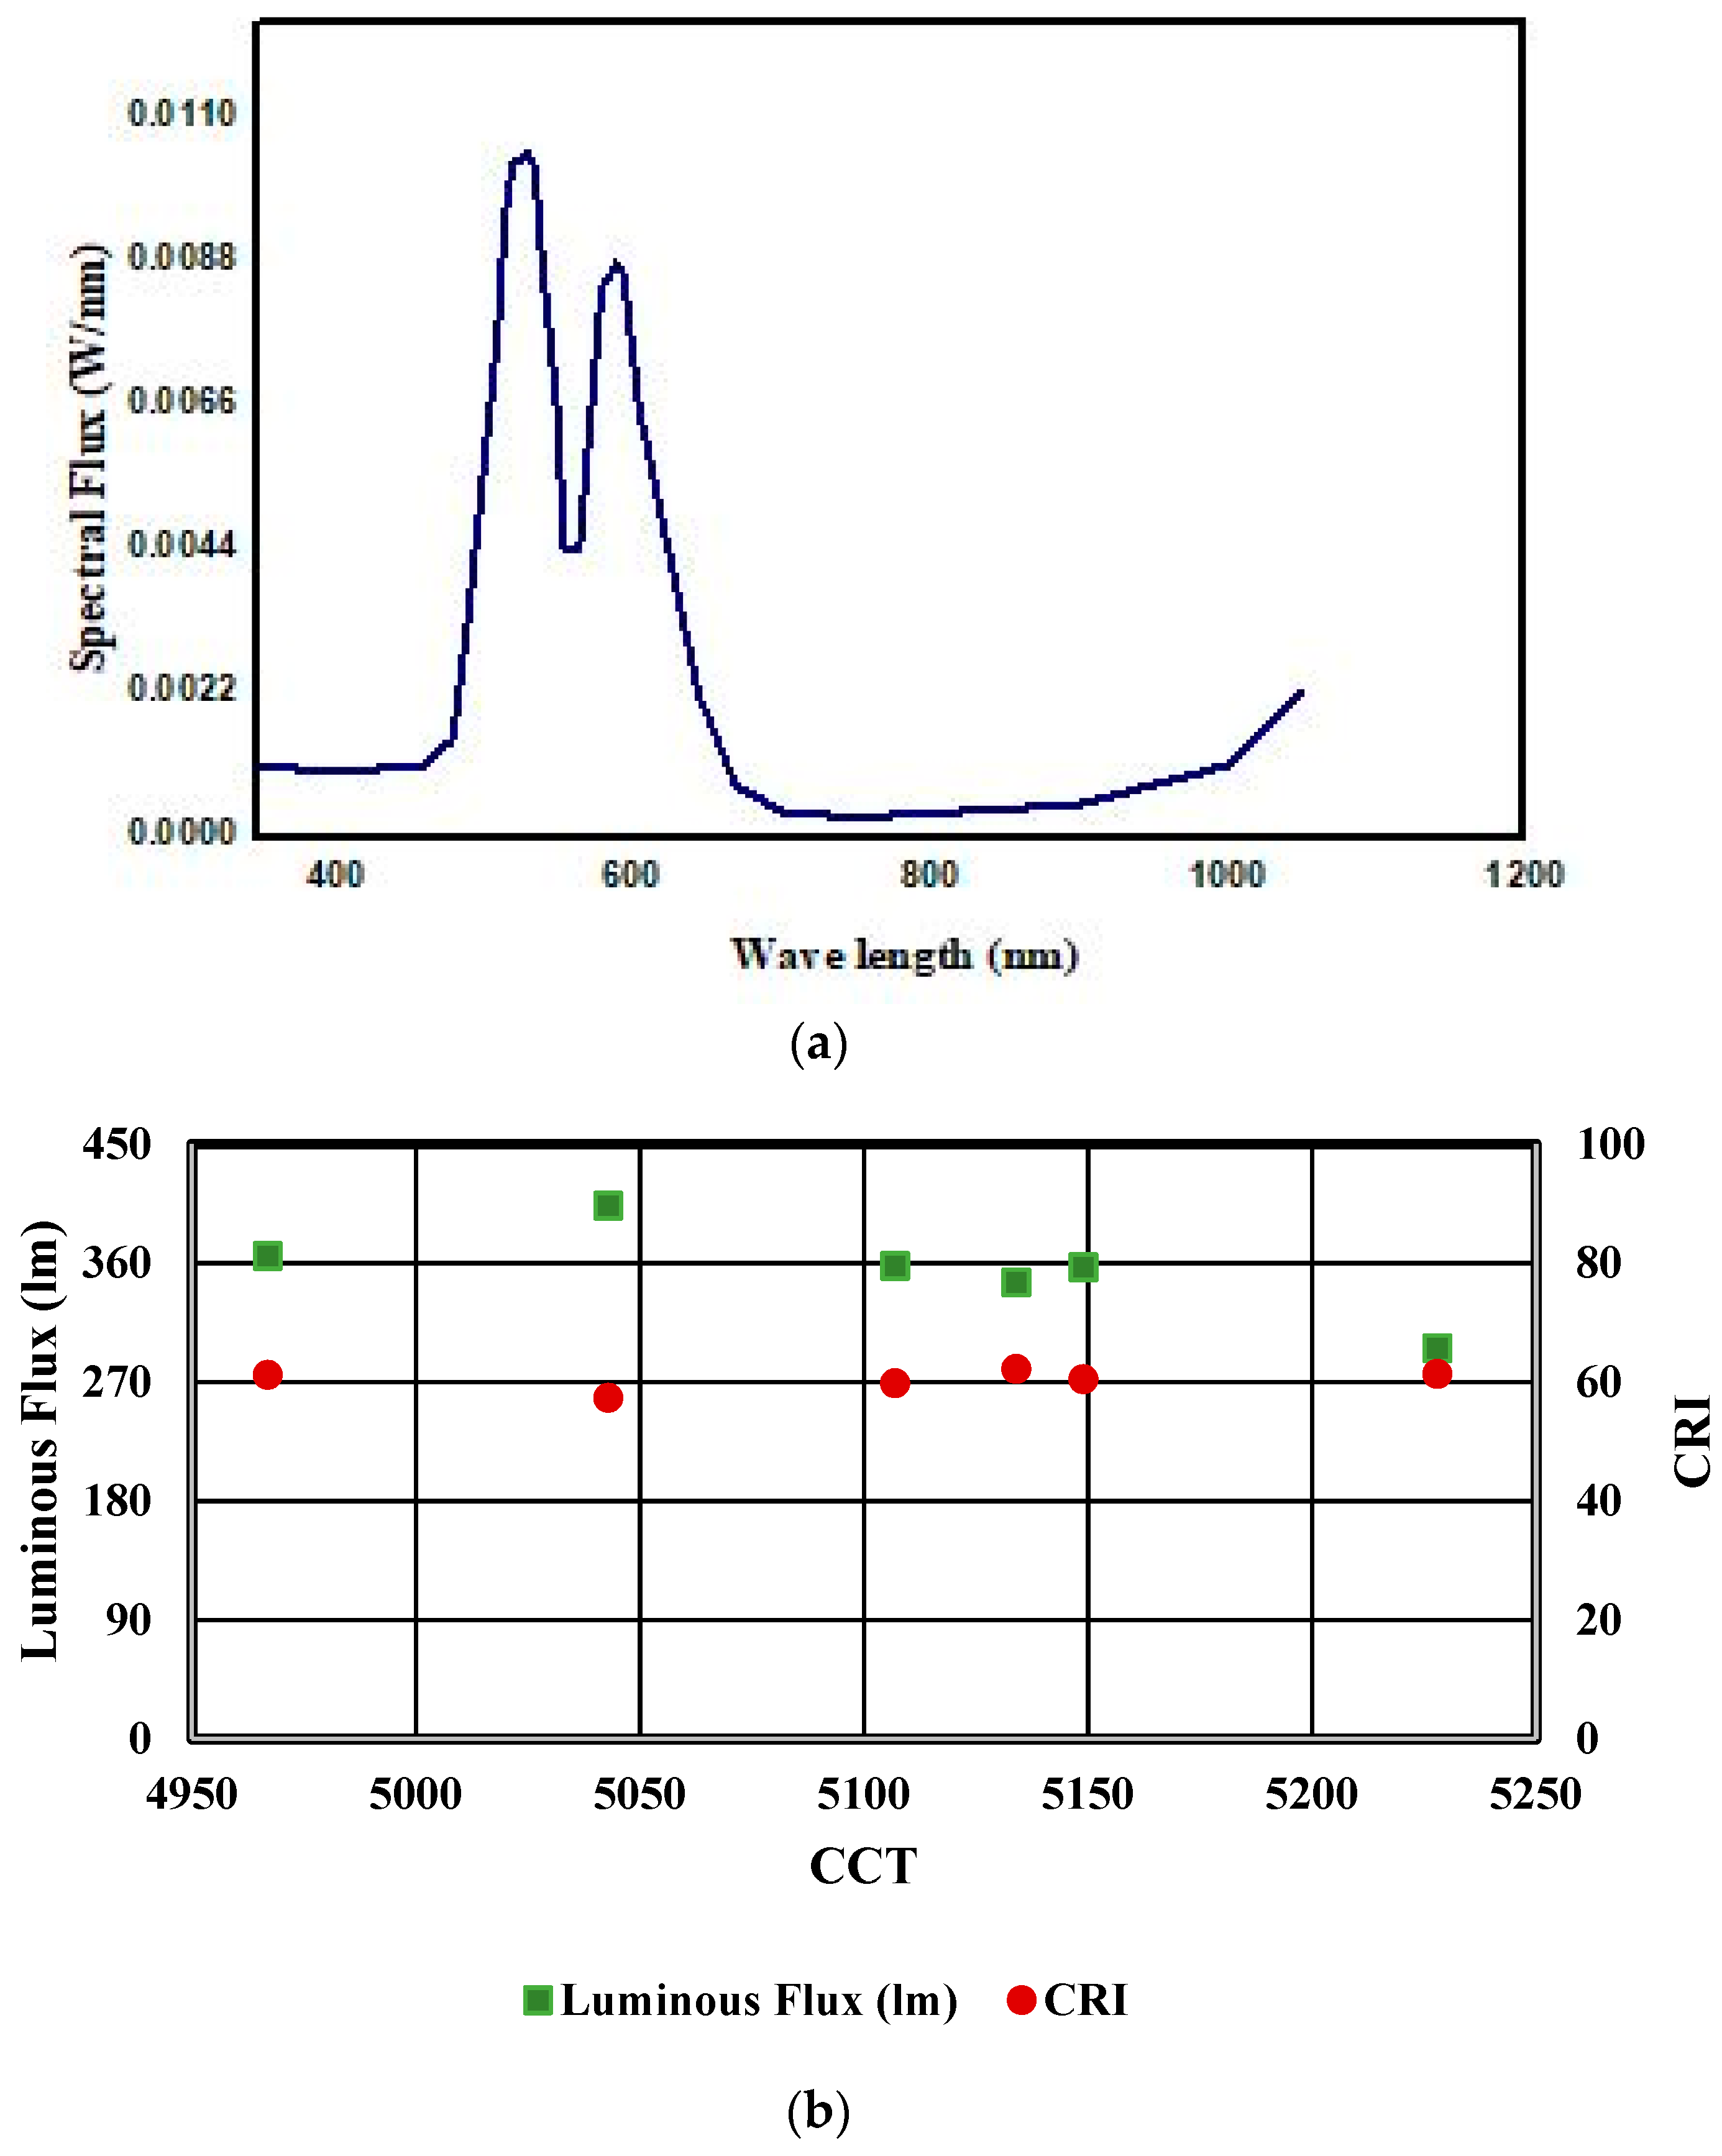
Table 1 compares the target CCT with the corresponding measured CCT for the blended LED system. The minimum and maximum percentage errors are 0.86% and 5.08%, respectively. This shows that the measured CCT values from the color sphere conform closely with the corresponding target values. Figure 8a shows the spectral distribution of the composite color LED light with the wavelength. This allows us to determine the nature of the composite light at different wavelengths. The spectral flux vs. the wavelength of the composite LED light (LED2, wavelength of 500–565 nm with a CCT of 6500 K; LED1, wavelength of 625–740 nm with a CCT of 1000 K) is shown in the curve. In the wavelengths of the spectrum, only certain wavelengths (the spikes) are strongly present. From the SPD curve, it can be seen that the peaks of the green (LED2) region are greater than those of the red (LED1) region. These spikes indicate the dominance of the rendering of color for objects illuminated by the light source. The measured CCT of 5043 K leads to a CRI value of 57.32% in this region. It produces a light similar to daylight (5000 K). Its ability to render color across the spectrum is not bad, but it is certainly much worse than daylight. We found from the measured data that the CCT varies from around 4967 K to 5228 K with the variation in the LED current.
Figure 8b shows that the luminous flux changes (increases and decreases) very little with the increase in CCT. The luminous flux is proportional to the LED current. However, when the LED voltage and efficacy change, the flux no longer remains proportional. The CRI is independent of the CCT.
The duty cycle of the SEPIC is defined as:
where .
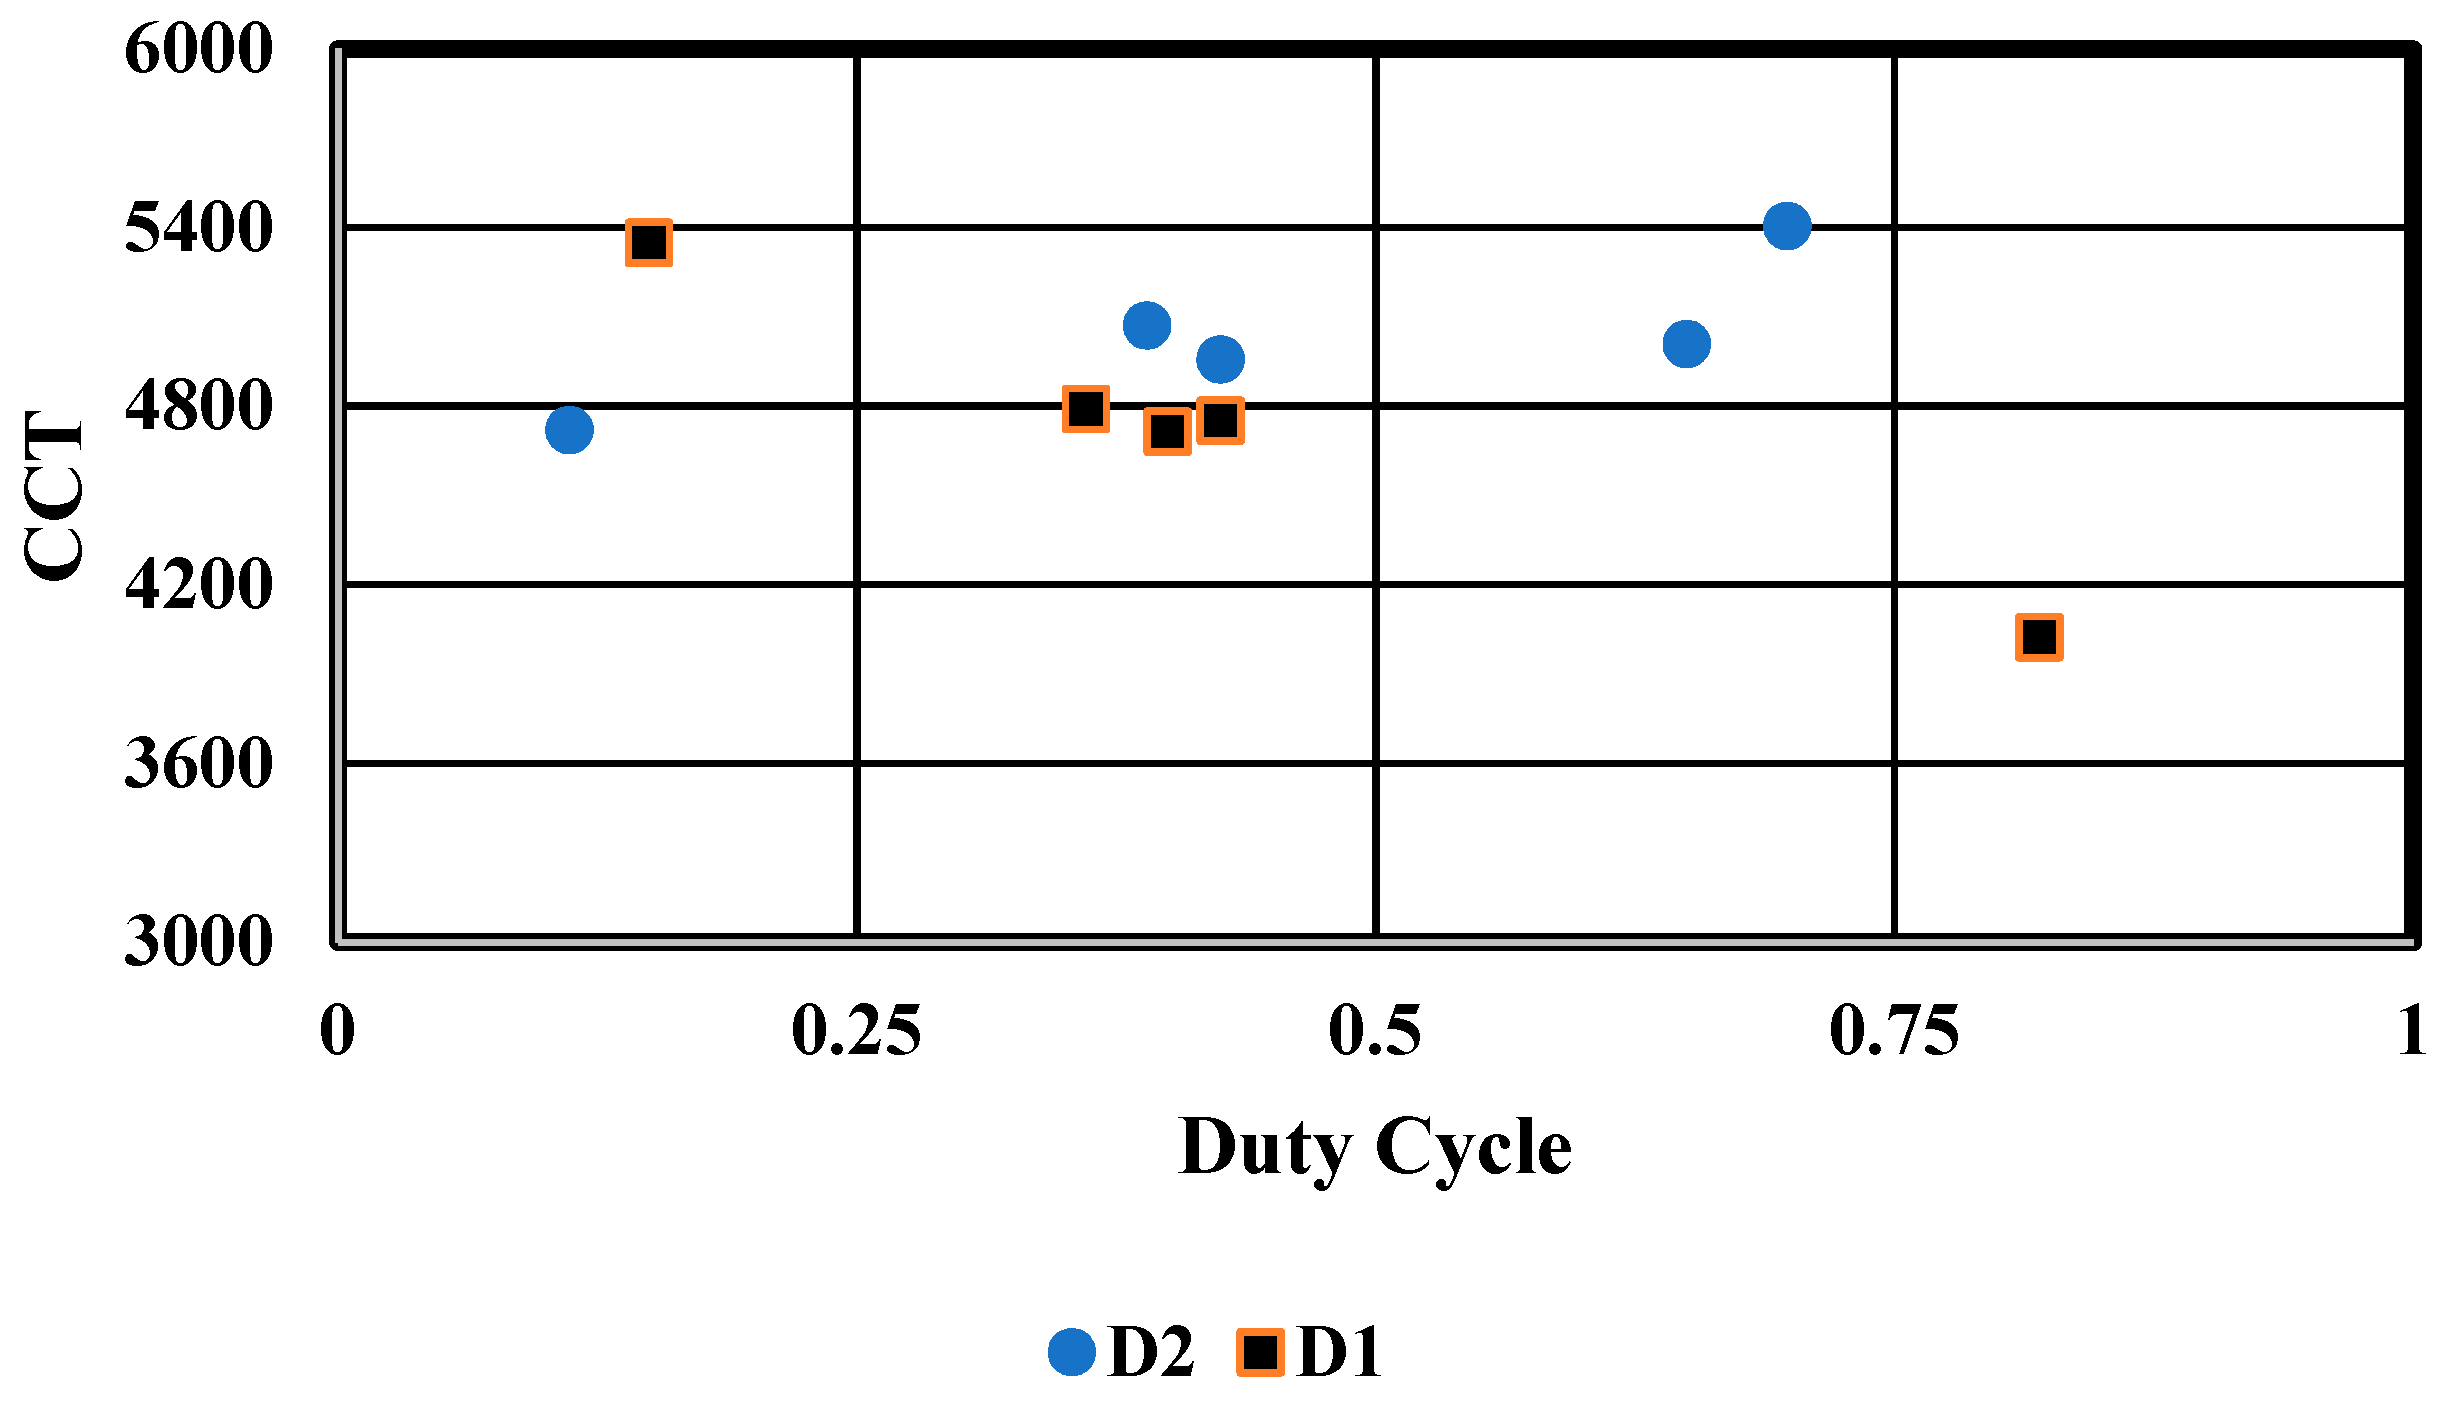
It is found that an increase or decrease in the duty cycle will result in an increase or decrease in the flux value. Thus, the overall CCT value increases or decreases. For instance, a larger D1 value will cause a decrease in the CCT value, i.e., it will become more reddish white. Similarly, a larger D2 value will increase the CCT value, i.e., it will become more bluish white. Because the duty ratio changes, the LED current changes from the optimized values, and the CCT also changes. The composite CCT vs. duty ratios (D1, D2) are graphically illustrated in Figure 9. We find that the CCT deviation shown in Table 1 is within the allowable CCT tolerance. Therefore, it is experimentally verified that the CCT values continue to track closely with the target values, regardless of the variations in the luminous flux. This prevents a color shift in the composite color LED driver. Table 2 represents the optimized parameters of prototype of LED driver.
The measured power loss shown is 7.2%, the efficiency is 92.8%, and the THD is 4.37% at 220 V. The measured power losses are distributed component-wise, as shown in Figure 10. Here, R-sense stands for the sense resistor, V-divider denotes the resistance for the template of the input voltage, and R-diode and S-diode denote the rectifier and SEPIC diode, respectively.
The power consumed in the DC bias circuit is PDCbias = 0.30 watt. It can be seen that the largest power loss occurs in the MOSFETs, accounting for approximately 2.37% of the total power consumption. The proposed LED driver shows low THD (4.37%) and high PF (0.96) at 220 V due to the optimization of the SEPIC parameters and the well-designed feedback control circuit. A crest factor of 1.4 is obtained.
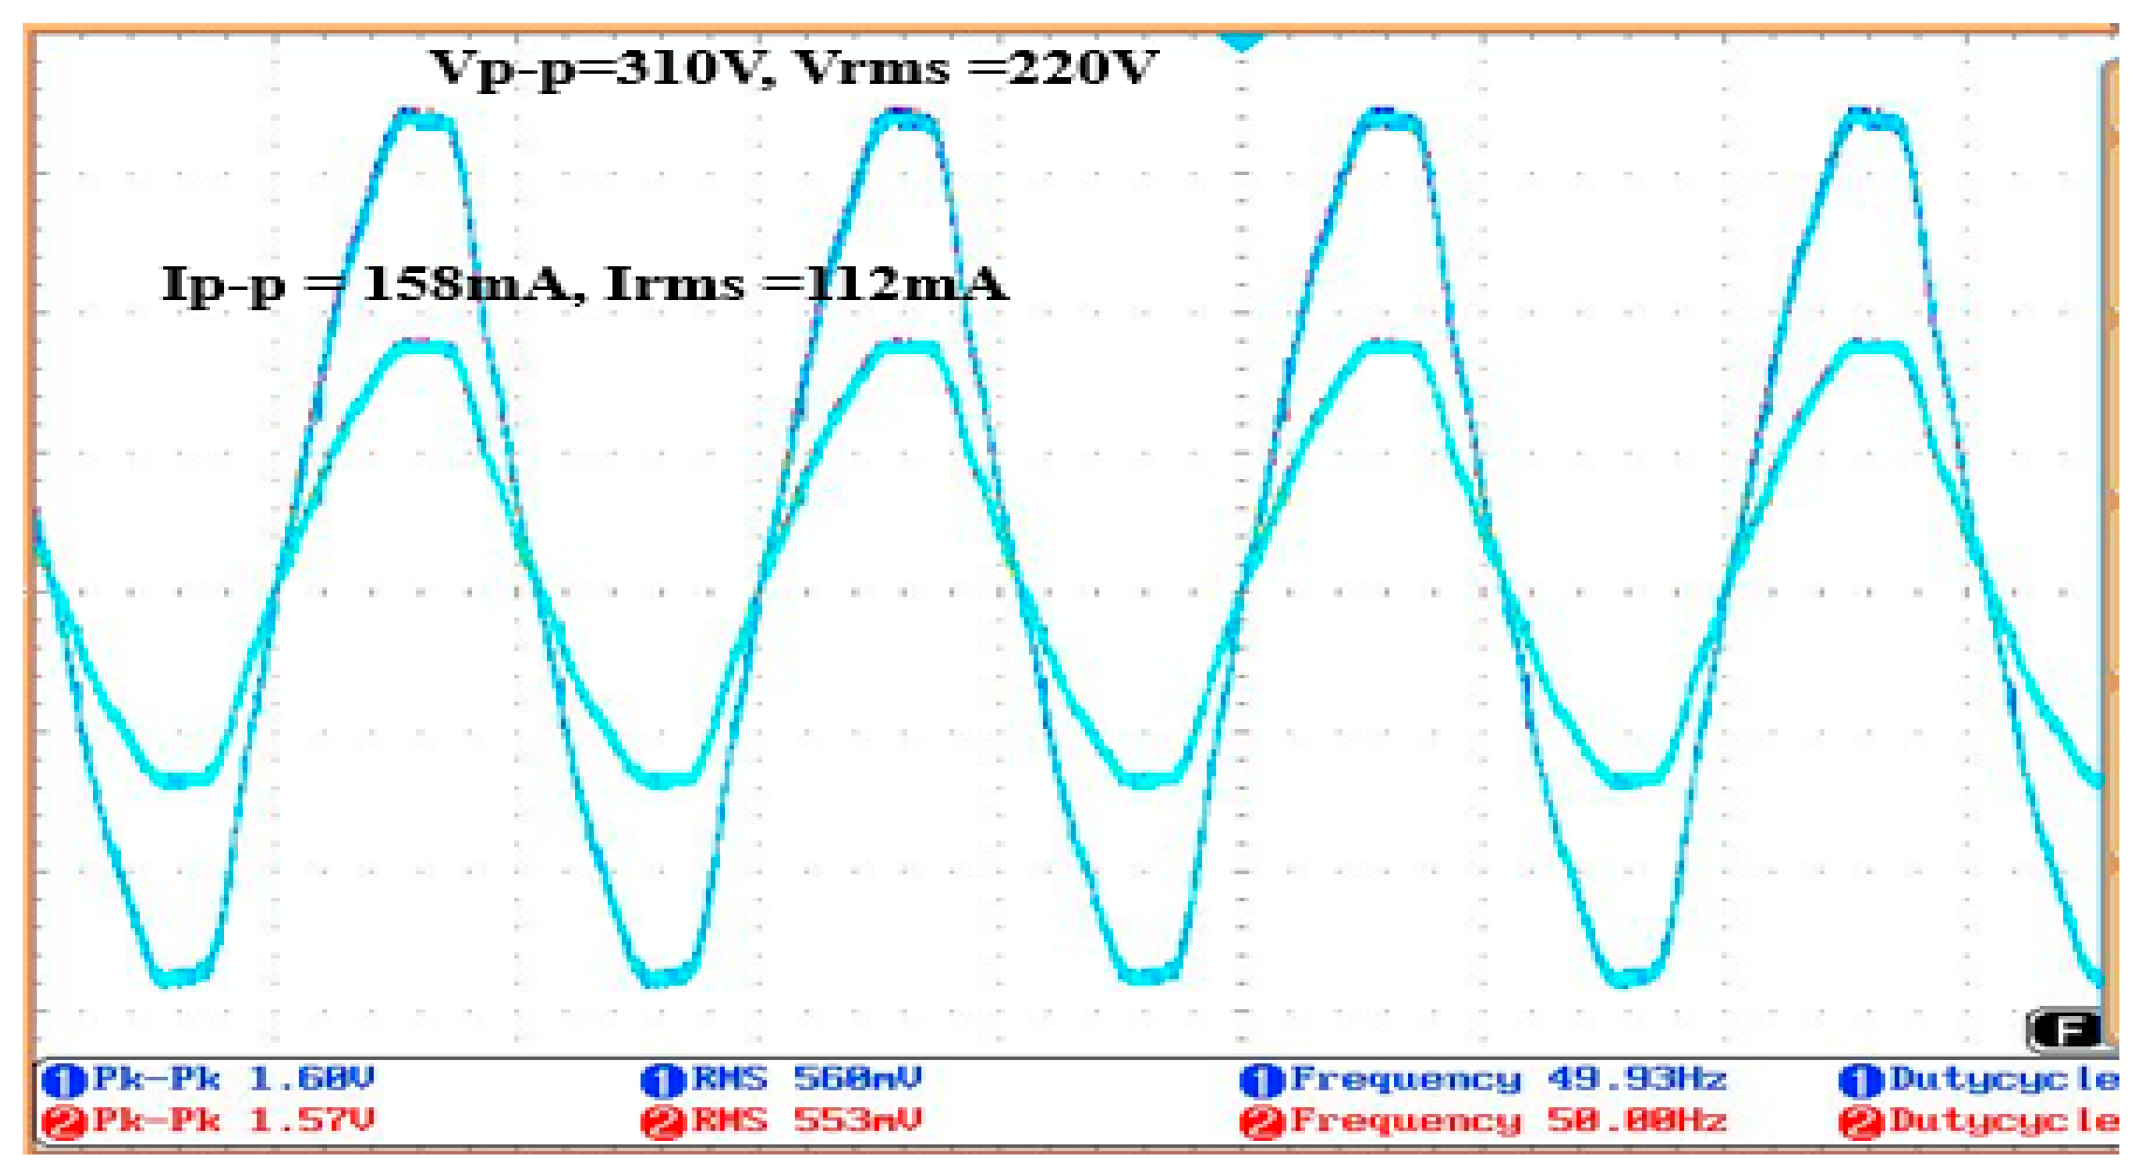
The average measured LED voltage and LED current of the two branches are 24 V, 290 mA and 24.4 V, 610 mA, respectively. Figure 11 shows the waveforms of the input voltage (vs) and the input current (is) in the steady state condition. From the results, we find that the input current follows the input voltage, and therefore the P.F is high.
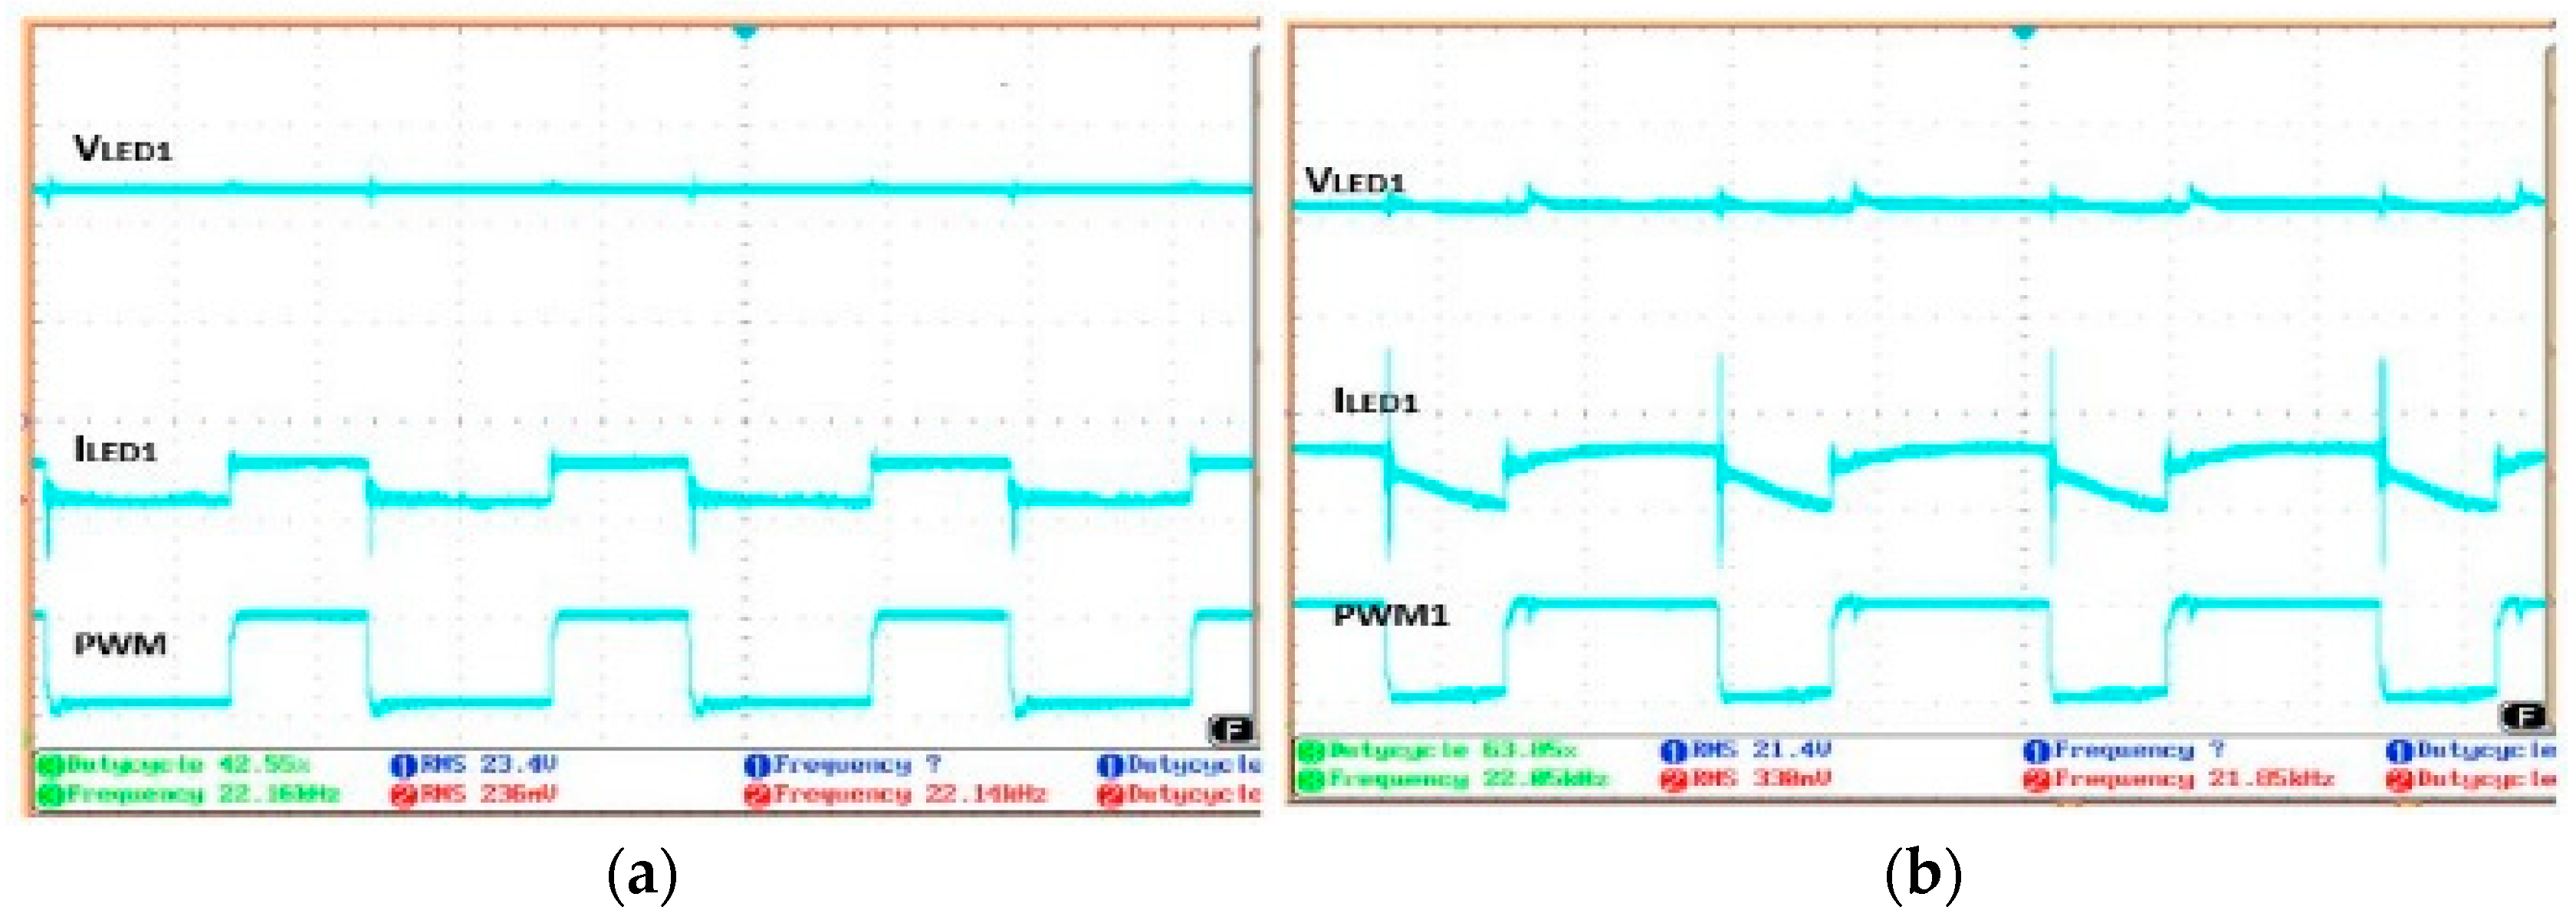
The currents of both LED strings were measured by varying the respective duty cycles (D1 and D2) of MOSFETs M1 and M2. Figure 12a,b shows the PWM and corresponding LED voltage and LED current at Vs = 220 V in a steady-state condition at a duty cycle D1 of 42.55% and 63% for LED1. The same curves are shown in Figure 13a,b for LED2 by varying the duty cycle D2 to 11.61% and 36.65%. For Figure 12a,b and Figure 13a,b, we find that with dimming, the LED voltages and LED currents vary. The pulse width of the LED current changes with the change in duty cycle. However, the obtained LED voltages are smooth and constant due to the use of a capacitor of 1000 μF (ref. Figure 1) parallel to both LED strings. The effect of dimming on the luminosity data are shown in Table 3.
Table 3 shows the LED current, voltage, and luminosity data variations with dimming. Here, we see that, in spite of the variation in the duty cycle, the CCT deviates only from 0.90% to 5.62%, i.e., from 45 K to 281 K, a change which cannot be recognized by the human eye.
Table 4 shows the measured power parameters of the designed bicolor LED driver. By the nonlinear optimization of the parameters of the SEPIC, a minimized THD was obtained. For efficiency enhancement, we have chosen circuit components with loss-related parameters of minimum values. Figure 14a shows the efficiency, THD, and P.F. variation of the LED driver with the variation in the duty cycle. From the curve, it can be seen that the efficiency and the THD decrease and that the power factor increases with the increase in the duty cycle. Figure 14b shows the efficiency, THD, and P.F. variation of the LED driver with the variation in input voltage.
The curve shows that efficiency and THD increase and that the power factor decreases with the increase in input voltage. The performance in Figure 14a,b justifies the electrical characteristics of an LED driver. Table 5 shows comparisons between the luminous flux and CCT of the proposed system and those of the bicolor LED systems presented in [39] and [41]. The proposed LED driver shows luminous bicolor LED system features that are comparable with those obtained using the more accurate nonlinear approach, but exhibits better features than those obtained using the linear approach [39]. Ref. [41] presents an LED driver which shows a CCT less than 50 K, but nothing is said about the luminous flux. Neither of these papers mention anything about the power quality parameters.
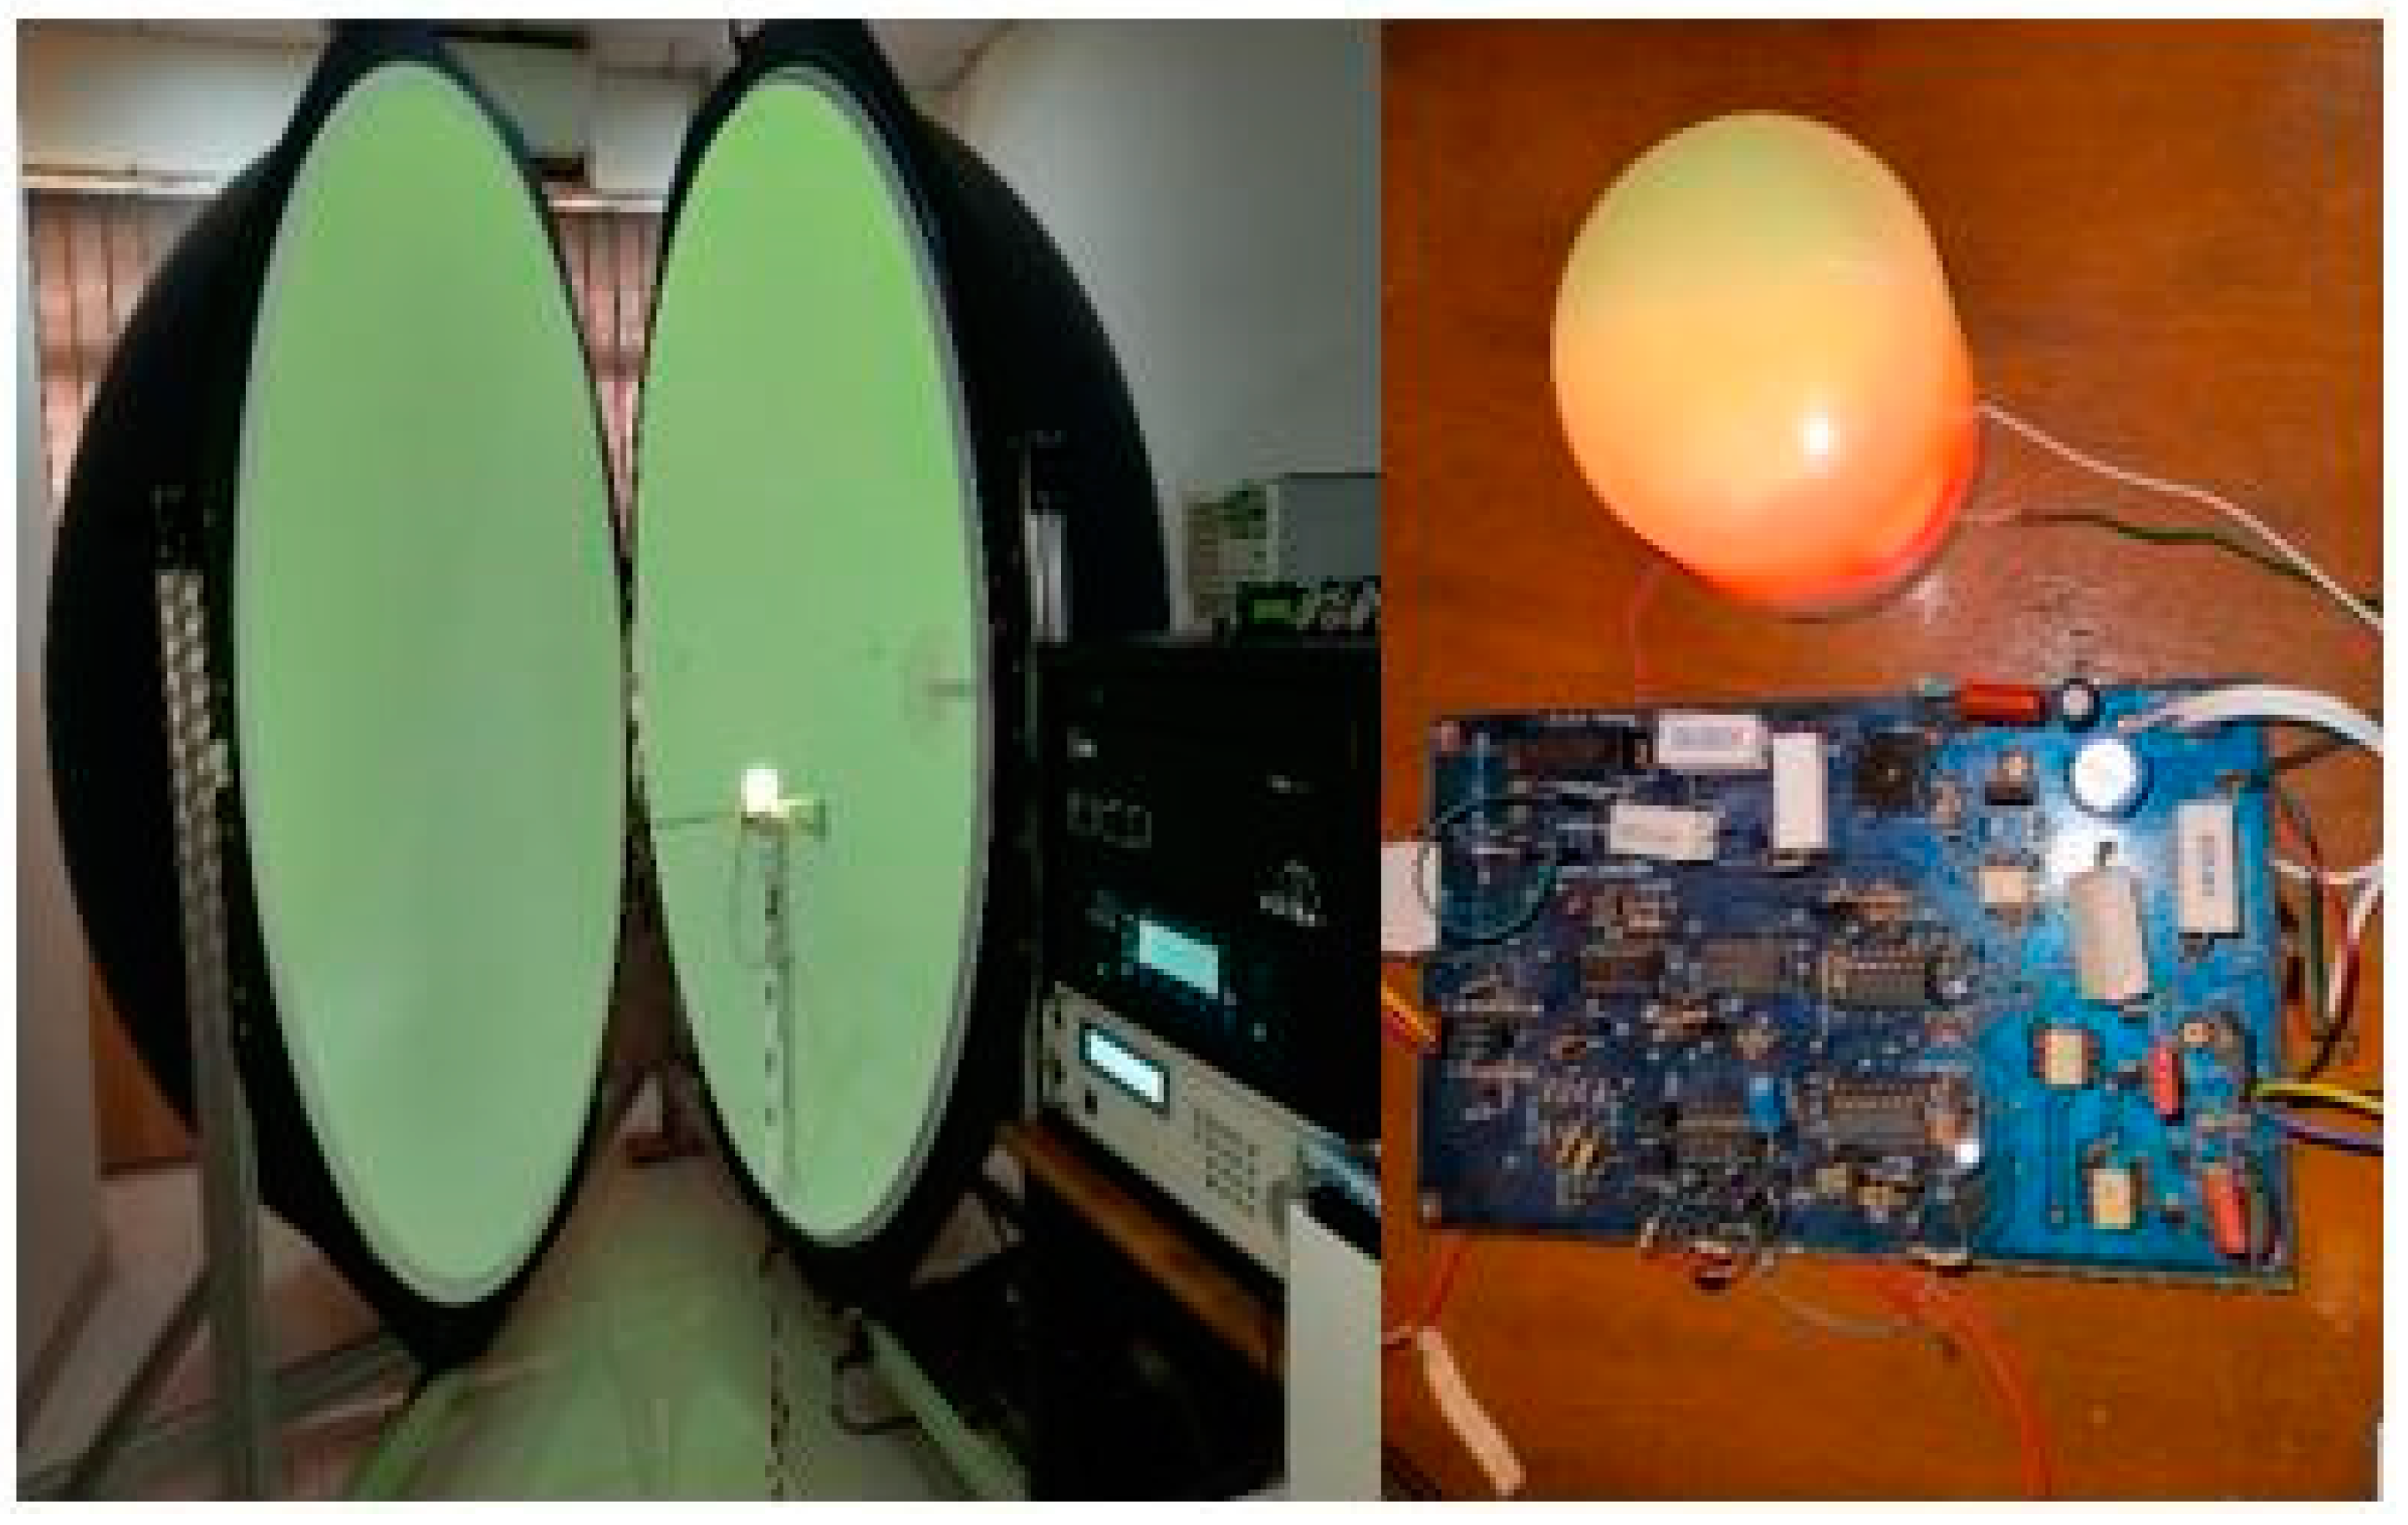
Table 6 shows the comparison of the power parameters with those of [44,45]. Our designed LED driver shows better performance in THD and efficiency than [41], but on the other hand it shows comparable performance in P.F. The author of [45] has worked with bicolor LED drivers that show CCT variations of 0.73% to 2.58%, but they do not mention power quality parameters. In the proposed bicolor LED driver, the CCT varies from 0.86% to 5.08%. The result is comparable. Ref. [45] uses a single-inductor dual-output converter with a 12 V DC input, whereas the proposed LED driver is SEPIC based and has a 220 V AC input. Figure 15 shows the prototype of the bicolor LED driver with the experimental setup.
9. Conclusions
In this paper, a bicolor composite LED driver is designed based on nonlinear optimization for maintaining color consistency and regulating THD. Though the empirical model of the CCT depends upon junction temperature, ambient temperature, ambient luminance and aging for a proper color feedback circuit, the CCT deviation remains within the limit. The experimental results are: CCT deviation = 43 K, error = 0.86%, and CRI = 57.32%. Thus, the proposed approach is accurate and tightly controls CCT. By determining the proper THD model, choosing the constraints accounting for the appropriate functionality and availability of components, and applying nonlinear optimization, the simulated THD was 2.1% and the experimentally obtained THD was 4.37%. The Power factor was increased by using a proper feedback circuit (reference current generation block). The nonlinear optimization method was also appropriate for achieving lower THD. The other obtained power quality parameters were: CF = 1.41%, P.F. = 0.96, and efficiency = 92.8%. These are satisfactory. The cost of our proposed AC–DC bicolor LED driver is BDT 750 (USD 7.14), whereas a traditional 22-watt AC–DC driver costs BDT 440 (USD 4.2). The traditional driver’s efficiency is 86%, whereas we have designed 22-watt driver with 92% efficiency. The simplicity of the generation of precise and consistent light output from the proposed bicolor LED system makes it an attractive solution.
Author Contributions
Conceptualization, A.B.M.H.-u.R.; data curation, F.F.; formal analysis, F.F.; investigation, F.F.; methodology, F.F.; resources, A.B.M.H.-u.R.; supervision, A.B.M.H.-u.R. All authors have read and agreed to the published version of the manuscript.
Funding
This research received no funding.
Conflicts of Interest
The authors declare no conflict of interest.
Abbreviations
| CCT | Corelate color temperature |
| CRI | Color rendering index |
| THD | Total harmonic distortion |
| P.F. | Power factor |
| Output current | |
| D | Duty cycle |
| Rectified input voltage | |
| εi | Luminous efficacy |
| φ1, φ2 | Luminous flux of LED 1 and 2 |
| , | Equivalent resistance of strings 1 and 2 |
| SEPIC | Single-ended primary inductor converter |
| Duty cycle of MOS of 1st and 2nd LED strings | |
| CCT of target point | |
| Estimated CCT | |
| Deviation between target and estimated CCT | |
| R1, R2 | Sense resistor of LED strings 1 and 2 |
| PWM | Pulse width modulation |
| ΔIL1 | Inductor current increment |
| , | Series resistors 1 and 2 of RC circuit |
References
- Zhan, X.; Wang, W.; Chung, H. A novel Color Control Method for Multi-colour LED Systems to Achieve High Colour Rendering Indexes. IEEE Trans. Power Electron. 2018, 33, 8246–8258. [Google Scholar] [CrossRef]
- Chen, H.T.; Tan, S.C.; Hui, S.Y.R. Colour variation reduction of GaN-based white light-emitting diodes via peak-wavelength stabilization. IEEE Trans. Power Electron. 2014, 29, 3709–3719. [Google Scholar] [CrossRef] [Green Version]
- Hui, S.Y.R.; Qin, Y.X. A general photo-electro-thermal theory for light-emitting-diode (LED) systems. IEEE Trans. Power Electron. 2009, 24, 1967–1976. [Google Scholar] [CrossRef]
- Paschotta, R. Encyclopedia of Laser Physics and Technology; Wiley: New York, NY, USA, 2008. [Google Scholar]
- Mills, P.R.; Tomkins, S.C.; Schlangen, L.J.M. The effect of high correlated color temperature office lighting on employee wellbeing and work performance. J. Circadian Rhythm. 2007, 5, 1–9. [Google Scholar] [CrossRef] [Green Version]
- Yau, T.Y.; Hwu, K.I.; Liu, K.J. AC–DC Flyback Dimmable LED Driver with Low-Frequency Current Ripple Reduced and Power Dissipation in BJT Linearly Proportional to LED Current. J. Energies 2020, 13, 4270. [Google Scholar] [CrossRef]
- Nassary, M.; Orabi, M.; Ahmed, E.M.; Hasaneen, E.-S.; Gaafar, M. Modified Harmonic Injection Technique for Electrolytic Capacitor-Less LED Driver. In Proceedings of the Nineteenth International Middle East Power Systems Conference (MEPCON), Cairo, Egypt, 19–21 December 2017; pp. 1459–1464. [Google Scholar]
- Ferdous, S.M.; Oninda, M.A.M.; Sarowar, G.; Islam, K.K.; Hoque, M.A. Non-Isolated Single Stage PFC based LED Driver with THD Minimization using Cúk Converter. In Proceedings of the 9th International Conference on Electrical and Computer Engineering, Dhaka, Bangladesh, 16 February 2017; pp. 471–474. [Google Scholar]
- Yoomak, S.; Ngaopitakkul, A. The Study of Harmonic Reduction in Light Emitting Diode (LED) Roadway Lighting System. In Proceedings of the 17th International Scientific Conference on Electrical Power Engineering (EPE), Prague, Czech Republic, 16–18 May 2016; pp. 1–5. [Google Scholar]
- Miao, C.H. Colour Temperature Adjustable Lamp. U.S. Patent US8159125B2, 17 April 2012. [Google Scholar]
- Jonsson, K. Light with Changeable Color Temperature. U.S. Patent US20120146505A1, 20 November 2012. [Google Scholar]
- Schubert, E.F. Light-Emitting Diodes, 2nd ed.; Cambridge University Press: Cambridge, UK, 2016; pp. 332–346. [Google Scholar]
- Muthu, S.; Schuurmans, F.J.; Pashley, M.D. Red, green, and blue LEDs for white light illumination. IEEE Trans. J. Sel. Top. Quantum Electron. 2002, 8, 333–338. [Google Scholar] [CrossRef] [Green Version]
- Wang, F.C.; Tang, C.-W.; Huang, B.J. Multivariable robust control for a red-green-blue LED lighting system. IEEE Trans. Power Electron. 2012, 25, 417–428. [Google Scholar] [CrossRef]
- Tang, C.W.; Huang, B.J.; Ying, S.-P. Illumination and color control in red -green-blue light-emitting diode. IEEE Trans. Power Electron. 2014, 29, 4921–4937. [Google Scholar] [CrossRef]
- Zhao, H.; Lee, S.W.R. Determination of Driving Current of RGB LEDs for White Light Illumination. In Proceedings of the 13th International Conference on Electronic Packaging Technology & High Density Packaging, Guilin, China, 13–16 August 2012; pp. 1540–1545. [Google Scholar]
- Qu, X.H.; Wong, S.C.; Tse, C.K. Temperature measurement technique for stabilizing the light output of RGB LED lamps. IEEE Trans. IEEE Trans. Instrum. Meas. 2010, 59, 661–670. [Google Scholar]
- Gilman, J.M.; Miller, M.E.; Grimaila, M.R. A simplified control system for a daylight-matched LED lamp. Light. Res. Technol. 2013, 45, 614–629. [Google Scholar] [CrossRef]
- Available online: https://docplayer.net/203504867-White-paper-color-management-of-a-red-green-and-blue-led-combinational-light-source-abstract-using-rgb-leds.html (accessed on 30 October 2022).
- Górecki, K.; Ptak, P. Modeling power supplies of LED lamps. Int. J. Circuit Theory Appl. 2018, 46, 629–663. [Google Scholar] [CrossRef]
- Rata, G.; Rata, M. The study of harmonics from dimmable LED lamps, using CompactRIO. In Proceedings of the 2016 International Conference on Development and Application Systems (DAS), Suceava, Romania, 19–21 May 2016; pp. 180–183. [Google Scholar]
- Pollock, A.; Pollock, H.; Pollock, C. High Efficiency LED Power Supply. IEEE J. Emerg. Sel. Top. Power Electron. 2015, 3, 617–623. [Google Scholar] [CrossRef]
- Uddin, S.; Shareef, H.; Mohamed, A.; Hannan, M.A. Harmonics and thermal characteristics of low wattage LED lamps. Przegląd Elektrotechniczny 2012, 88, 266–271. [Google Scholar]
- Lho, Y.H.; Lee, S.Y. A Study on methodology to improve the power factor of high-power LED module. In Proceedings of the 2014, 14th International Conference on Control, Automation and Systems (ICCAS 2014), Seoul, Republic of Korea, 22 October 2014; pp. 1404–1406. [Google Scholar]
- Górecki, K. The influence of power supply voltage on exploitive parameters of the selected lamps. Inf. MIDEM-J. Microelectron. Electron. Compon. Mater. 2013, 43, 193–198. [Google Scholar]
- Uddin, S.; Shareef, H.; Mohamed, A.; Hannan, M. An analysis of harmonics from dimmable LED lamps. In Proceedings of the 2012 IEEE International Power Engineering and Optimization Conference, Melaka, Malaysia, 6–7 June 2012; pp. 182–186. [Google Scholar]
- Ionescu, C.; Dima, M.; Bonfert, D. Flicker distortion power factor analysis in lighting LED’s. In Proceedings of the 2017 IEEE 23rd International Symposium for Design and Technology in Electronic Packaging (SIITME), Constanta, Romania, 26–29 October 2017; pp. 280–285. [Google Scholar]
- Li, Y.C. A novel control scheme of quasi-resonant valley-switching for high-power-factor AC-to-DC LED drivers. IEEE Trans. Ind. Electron. 2015, 62, 4787–4794. [Google Scholar] [CrossRef]
- Liu, P.J.; Hsu, Y.-C. Boost converter with adaptive reference tracking control for dimmable white LED drivers. Microelectron 2015, 46, 513–518. [Google Scholar] [CrossRef]
- Liu, P.J.; Peng, K.L. Adaptive Driving Bus Voltage and Energy Recycling Control Schemes for Low- Power AC–DC RGB-LED Drivers. IEEE Trans. Power Electron. 2017, 64, 7741–7748. [Google Scholar] [CrossRef]
- Zhang, Y.; Chen, H.; Dongsheng, M. A VO-Hopping Reconfigurable RGB LED Driver with Automatic Detection and Predictive Peak current Control. IEEE J. Solid-State Circuits 2015, 50, 1287–1298. [Google Scholar] [CrossRef]
- Zhan, X.; Chung, H.; Zhang, R. Investigation into the Use of Single Inductor for Driving Multiple Series-Connected LED Channels. IEEE Trans. Power Electron. 2017, 32, 3034–3050. [Google Scholar] [CrossRef]
- Ng, S.K.; Loo, K.H.; Lai, Y.M.; Tse, C.K. Color Control System for RGB LED with Application to Light Sources Suffering from Prolonged Aging. IEEE Trans. Ind. Electron. 2014, 61, 1784–1798. [Google Scholar] [CrossRef]
- Lee, A.; Sin, J.; Chan, P. Scalability of quasi-hysteretic FSM based digitally controlled single-inductor dual-string buck LED driver to multiple strings. IEEE Trans. Power. Electron. 2014, 29, 501–513. [Google Scholar] [CrossRef] [Green Version]
- Kim, H.C.; Yoon, C.S.; Ju, H.; Jeong, D.-K.; Kim, J. An AC-powered, flicker-free, multi-channel LED driver with current-balancing SIMO buck topology for large area lighting applications. In Proceedings of the 2014 IEEE Applied Power Electronics Conference and Exposition-APEC 2014, Fort Worth, TX, USA, 16–20 March 2014; pp. 3337–3341. [Google Scholar]
- Zhang, W.; Sutardja, P. Correlated Color Temperature Control Methods and Devices. U.S. Patent US20130020956 A1, 24 January 2013. [Google Scholar]
- Wang, H.-C.; Chen, Y.T.; Lin, J.T.; Chiang, C.P.; Cheng, F.H. Enhanced visualization of oral cavity for early inflamed tissue detection. Optics Express 2010, 18, 11800–11809. [Google Scholar] [CrossRef] [PubMed]
- Chen, Y.S.; Lin, C.Y.; Yeh, C.M.; Kuo, C.T.; Hsu, C.W.; Wang, H.C. Anti-glare LED lamps with adjustable illumination light field. Optics Express 2014, 22, 5. [Google Scholar] [CrossRef] [PubMed]
- Chen, H.T.; Tan, S.C. Nonlinear Dimming and Correlated Color Temperature Control of Bi-Color White LED Systems. IEEE Trans. Power Electron. 2014, 30, 6934–6947. [Google Scholar] [CrossRef] [Green Version]
- Malik, R.; Ray, K.; Mazumdar, S. Wide range, Open-loop, CCT and Illuminance Control of an LED Lamp using Two-component Colour Blending. IEEE Trans. Power Electron. 2017, 33, 9803–9818. [Google Scholar] [CrossRef]
- Lee, A.T.L.; Chen, H.; Tan, S.C.; Hui, S.Y. Precise Dimming and Colour Control of LED Systems Based on Color Mixing. IEEE Trans. Power Electron. 2016, 31, 65–80. [Google Scholar] [CrossRef] [Green Version]
- Lohaus, L.; Leicht, E.; Dietrich, S.; Wunderlich, R.; Heinen, S. Advanced Color Control for Multicolor LED Illumination Systems with Parametric Optimization. In Proceedings of the IECON 2013-39th Annual Conference of the IEEE Industrial Electronics Society, Vienna, Austria, 10–13 November 2013; pp. 3305–3310. [Google Scholar]
- Ferdous, F.; Rashid, A.B.M.H. Design of a High-Performance AC-DC LED Driver Based on SEPIC Topology. Int. J. Power Electron. Drive Syst. (IJPEDS) 2021, 12, 870–885. [Google Scholar] [CrossRef]
- Pal, S.; Singh, B.; Chandra, A. A Novel Ambiance Changing Energy Saving LED Lighting System with PFM Operated Zeta Converter. In Proceedings of the 2015 IEEE Industry Applications Society Annual Meeting, Addison, TX, USA, 18–22 October 2015; pp. 1–8. [Google Scholar]
- Germaine, C.P.; Lee, A.T.; Tan, S.C.; Hui, S.R. Precise Luminous Flux and Color Temperature Control of Dimmable Bi- Colour White Light-Emitting Diode Systems. In Proceedings of the 2022 IEEE Applied Power Electronics Conference and Exposition (APEC), Houston, TX, USA, 20–24 March 2022. [Google Scholar]
Figure 1.
Power stage (basic SEPIC) and color control system.

Figure 2.
Functional block diagram of the CCT optimization.

Figure 3.
LED load model.

Figure 4.
Bicolor LED driver with a feedback loop to regulate each LED string current to maintain CCT.
Figure 4.
Bicolor LED driver with a feedback loop to regulate each LED string current to maintain CCT.

Figure 5.
Steady state is achieved at 1 ms (step response) of the compensated SEPIC.

Figure 6.
Measured CCT and luminous flux vs. LED current for CCT 1000 K and 6500 K LEDs.

Figure 7.
Variation in CCT with the change in luminosity of the composite LED light.

Figure 8.
(a) Spectral distribution of composite R-G color measured using the Lab-sphere Photo metric Measurement System. (b) Luminous flux and CRI vs. CCT variation.
Figure 8.
(a) Spectral distribution of composite R-G color measured using the Lab-sphere Photo metric Measurement System. (b) Luminous flux and CRI vs. CCT variation.

Figure 9.
Composite CCT variation with change in duty cycle.

Figure 10.
Power loss components in LED driver.

Figure 11.
The measured input voltage: 220 V rms (50 V/division); the input current: rms (7 mA/division). THD = 4.37% and P.F = 0.96.
Figure 11.
The measured input voltage: 220 V rms (50 V/division); the input current: rms (7 mA/division). THD = 4.37% and P.F = 0.96.

Figure 12.
LED voltage and current at duty cycles of (a) 42.55% and (b) 63% with corresponding gate pulse for string 1.
Figure 12.
LED voltage and current at duty cycles of (a) 42.55% and (b) 63% with corresponding gate pulse for string 1.

Figure 13.
LED voltage and current with duty cycles (D2) of (a) 11.61% and (b) 36.65% in LED string 2.
Figure 13.
LED voltage and current with duty cycles (D2) of (a) 11.61% and (b) 36.65% in LED string 2.

Figure 14.
(a) THD, P.F., and efficiency vs. duty cycle graph; (b) THD, P.F., and efficiency vs. input voltage graph.
Figure 14.
(a) THD, P.F., and efficiency vs. duty cycle graph; (b) THD, P.F., and efficiency vs. input voltage graph.

Figure 15.
Prototype of the bicolor LED driver with Lab-sphere Photometric Measurement System PM-105-16.
Figure 15.
Prototype of the bicolor LED driver with Lab-sphere Photometric Measurement System PM-105-16.


Table 1.
CCT measurements.
| LED Current (mA) | CCT Target | CCT Meas. | CCT Dev. | % Error | CRI | |
|---|---|---|---|---|---|---|
| ILED1 | ILED2 | |||||
| 220 | 512 | 5100 | 5228 | 128 | 2.50 | 61.34 |
| 250 | 520 | 4900 | 5134 | 234 | 4.78 | 62.17 |
| 270 | 543 | 4900 | 5149 | 149 | 5.08 | 60.46 |
| 278 | 563 | 4900 | 4967 | 67 | 1.36 | 61.14 |
| 282 | 610 | 5000 | 5107 | 107 | 2.14 | 59.73 |
| 290 | 610 | 5000 | 5043 | 43 | 0.86 | 57.32 |
Table 2.
Optimized parameters used in prototype.
| Parameters | Values |
|---|---|
| Input inductor, L1 | 10 mH |
| Output inductor, L2 | 100 μH |
| Input capacitor, C1 | 0.01 μF/600 V |
| Input Filter Inductor, Lf | 10 mH |
| Input Filter Capacitor, Cf | 0.94 μF |
| Duty Cycle, Dmax | 0.21 |
| Power Diode | 1000 V/10 A |
| Power MOS, M3 | 12 N60 (600 V/12 A) |
| Operating Voltage | 220 V |
| MOS Switch, M1, M2 | K2098 |
Table 3.
Current, voltage, and luminosity data variation with dimming.
| No. of String | Duty Cycle (%) | LED Current (mA) | LED Voltage (V) | CCT | % CCT Deviation | Luminous Flux | CRI |
|---|---|---|---|---|---|---|---|
| 1 | 42.55 | 236 | 23.4 | 4955 | 0.90 | 381.69 | 58.21 |
| 63 | 330 | 24.4 | 5104 | 2.08 | 401.69 | 49.81 | |
| 2 | 11.61 | 264 | 24.6 | 4719 | 5.62 | 379.63 | 62.64 |
| 36.65 | 460 | 24.6 | 4790 | 4.20 | 300.07 | 63.21 |
Table 4.
The measured power parameters of the proposed bicolor LED drivers.
| Vs (Volt) | Is (mA) | P.F. | THD | VLED1 (Volt) | ILED1 (mA) | VLED2 (Volts) | ILED2 (mA) | Efficiency % |
|---|---|---|---|---|---|---|---|---|
| 90 | 206 | 0.988 | 1.27 | 23.1 | 220 | 23.8 | 512 | 91.6 |
| 110 | 190 | 0.981 | 2.40 | 23.8 | 250 | 24.0 | 520 | 90.7 |
| 150 | 150 | 0.980 | 5.40 | 24.0 | 270 | 24.5 | 543 | 88.5 |
| 180 | 125 | 0.977 | 4.36 | 24.0 | 278 | 24.5 | 563 | 91.8 |
| 200 | 115 | 0.960 | 4.15 | 24.6 | 282 | 24.8 | 580 | 95.3 |
| 220 | 110 | 0.960 | 4.37 | 24.0 | 290 | 24.4 | 610 | 92.8 |
| Bicolor White LED Light | Luminous Flux (lm) | CCT Measured | CCT Desired | CCT Deviation |
|---|---|---|---|---|
| CCTC = 5000 K | 100 | 2754 | 3300 | 546 |
| CCTw = 2700 K | 289 | 3814 | 4000 | 186 |
| (Linear approach) [39] | 455 | 2798 | 3300 | 502 |
| CCTC = 6500 K | 274.57 | 4713 | 4900 | 187 |
| CCTw = 1000 K | 354.86 | 5070 | 5000 | 70 |
| (Proposed) | 401.69 | 5404 | 5300 | 104 |
| CCTC = 5000 K | ||||
| CCTw = 2700 K | 95 | 3250 | 3300 | 50 |
| (Non-linear approach) | 296 | 5515 | 5400 | 115 |
| [39] | 562 | 3392 | 3300 | 92 |
| CCTC = 7500 K | - | 3050 | 3000 | 50 |
| CCTw = 2700 K | - | 3410 | 3400 | 10 |
| [41] | - | 3505 | 3500 | 05 |
Publisher’s Note: MDPI stays neutral with regard to jurisdictional claims in published maps and institutional affiliations. |
© 2022 by the authors. Licensee MDPI, Basel, Switzerland. This article is an open access article distributed under the terms and conditions of the Creative Commons Attribution (CC BY) license (https://creativecommons.org/licenses/by/4.0/).
Share and Cite
MDPI and ACS Style
Ferdous, F.; Harun-ur Rashid, A.B.M. Design Optimization of an Efficient Bicolor LED Driving System. Electronics 2022, 11, 3984. https://doi.org/10.3390/electronics11233984
AMA Style
Ferdous F, Harun-ur Rashid ABM. Design Optimization of an Efficient Bicolor LED Driving System. Electronics. 2022; 11(23):3984. https://doi.org/10.3390/electronics11233984
Chicago/Turabian StyleFerdous, Fouzia, and A.B.M. Harun-ur Rashid. 2022. "Design Optimization of an Efficient Bicolor LED Driving System" Electronics 11, no. 23: 3984. https://doi.org/10.3390/electronics11233984
Note that from the first issue of 2016, this journal uses article numbers instead of page numbers. See further details here.