Article

Human Perception Intelligent Analysis Based on EEG Signals

1
School of Information and Communication Engineering, Communication University of China, Beijing 100024, China
2
Department of Mathematical Sciences, Tsinghua University, Beijing 100084, China
3
Department of Electronic Engineering, Tsinghua University, Beijing 100084, China
*
Author to whom correspondence should be addressed.
Electronics 2022, 11(22), 3774; https://doi.org/10.3390/electronics11223774
Submission received: 7 October 2022 / Revised: 9 November 2022 / Accepted: 15 November 2022 / Published: 17 November 2022
(This article belongs to the Special Issue Applications of Computational Intelligence)

Abstract

:
The research on brain cognition provides theoretical support for intelligence and cognition in computational intelligence, and it is further applied in various fields of scientific and technological innovation, production and life. Use of the 5G network and intelligent terminals has also brought diversified experiences to users. This paper studies human perception and cognition in the quality of experience (QoE) through audio noise. It proposes a novel method to study the relationship between human perception and audio noise intensity using electroencephalogram (EEG) signals. This kind of physiological signal can be used to analyze the user’s cognitive process through transformation and feature calculation, so as to overcome the deficiency of traditional subjective evaluation. Experimental and analytical results show that the EEG signals in frequency domain can be used for feature learning and calculation to measure changes in user-perceived audio noise intensity. In the experiment, the user’s noise tolerance limit for different audio scenarios varies greatly. The noise power spectral density of soothing audio is 0.001–0.005, and the noise spectral density of urgent audio is 0.03. The intensity of information flow in the corresponding brain regions increases by more than 10%. The proposed method explores the possibility of using EEG signals and computational intelligence to measure audio perception quality. In addition, the analysis of the intensity of information flow in different brain regions invoked by different tasks can also be used to study the theoretical basis of computational intelligence.

1. Introduction

With the continuous development of computer technology, how to deal with and analyze the potentially insightful information in big data has become an extremely urgent problem that must be overcome. The emergence of computational intelligence and artificial intelligence technology has become an effective way to solve the above problems in various scientific fields. Many outstanding works have further promoted the application of computational intelligence. In the field of image analysis, machine learning (ML) and deep neural networks are used for feature extraction and image segmentation [1,2].
In the field of multimedia communication, with the development of multimedia and communication technology, new services and applications emerge in an endless stream. There are more and more ways for people to obtain information through various terminals, and the audio–visual forms are becoming increasingly abundant; traditional audio, video and emerging virtual reality, augmented reality and other forms are becoming more and more convenient. Ubiquitous multimedia and converged media services are changing people’s lives, which also leads to great changes in business content and data volume. Whether a product can provide users with satisfactory services has become a decisive factor for success in the rapidly changing market environment, which is crucial for communication service providers and business service providers. Under the new market demand, the communication changes from data communication to multimedia communication. User satisfaction is also affected by a variety of factors, and the mechanism of action is much more complex [3,4]. At this time, ML is often used for resource allocation, quality management and quality prediction [5].
Traditionally, the most recognized method is a technology parameter-centric quality metric named quality of service (QoS) [6], which mainly considers objective technical parameters such as jitter, packet loss, delay, etc. It has been widely used in technology and industry. Additional research has found that the key performance QoS of traditional networks measures the objective quality [6]. The QoS does not consider the actual experience of users. Therefore, a good QoS may not satisfy users, which leads to the bottleneck of improving user satisfaction [7].
International standardization organizations ITU-T [8] defined QoE as “the overall acceptability of an application or service, as perceived subjectively by the end-user” [9]. According to such a definition, the factors influencing QoE are more diverse, including not only audio quality, video quality and network quality, but also service content, multimedia devices and users’ personal feelings [3]. For service providers and network operators, the shift from the traditional quality evaluation method focusing on QoS service performance to the QoE evaluation aiming at users’ perception and demand seems to better reflect the original intention of providing users with better-quality services. Therefore, QoE research has become an interdisciplinary field involving a lot of knowledge, such as social psychology, cognitive science, intelligent computing and engineering science [10].
At present, the evaluation methods of QoE are mainly divided into two categories: objective parameter-based evaluation and intelligent cognitive-based subjective evaluation [4,7,11], as shown in Figure 1. The objective parameter-based evaluation method first measures or calculates the objective parameters, or establishes a mathematical estimation model from objective parameters to subjective experience, which is based on the statistical knowledge derived from a large number of data, then the estimation model is further used to transform the objective parameters into the estimated value of experience quality [11]. Both the advantages and disadvantages of this kind of method are very prominent. One advantage is that if a suitable mathematical model has been embedded in the QoE evaluation system, the evaluation of QoE will be efficient. Therefore, it is still the best choice for the actual multimedia business scenario [12]. The disadvantage is that it is impossible to truly experience the multi-level satisfaction of users without their participation. Intelligent cognitive-based subjective evaluation refers to evaluation that requires users’ participation. Either the specific indicators or the information of experience quality needs to be obtained directly from users. It can be reported by users straight away or be measured by users’ relevant physiological variables. These physiological data need to further adopt feature extraction and learning to calculate and analyze the real feelings of the user [7,10,13]. Based on the correlation between perceptual processes and neurophysiology, using advanced calculation and analysis of user neurophysiological indicators to quantify users’ subjective experience is an important way to overcome the bias caused by users’ upper cognitive behavior in the process of subjective feedback [14]. In addition, due to the amount of data and analytical requirements, computational intelligence techniques also provide more feasible methods for subjective QoE prediction and quality analysis [15,16].
In multimedia communication, the sound is the sensory channel with the highest priority, which is the basis of audiovisual perception. Nonetheless, to our knowledge, the influence of auditory perception on QoE is much less studied than that of visual perception on QoE. This paper proposed a new method to explore the possibility of measuring the user’s auditory subjective feelings by collecting the physiological sensory signals from the user’s central nervous system. The main contributions of our work are summarized as follows. First, a complete experiment was designed to collect perceptual data of users under different audio quality conditions, including EEG data, subjective judgment data and perceptual semantic data. Second, a new method of studying the relationship between human perception ability and audio noise intensity using EEG signals was proposed, and the perceptual tolerance of audio noise in different semantic scenarios was obtained. In addition, the relationship between audio signal to noise ratio (SNR), audio scenarios, user emotions, and noise perceptual tolerance was explored. Finally, the location of the brain area for audio processing was explored, and the connectivity of related brain regions was quantitatively analyzed.
The rest of this paper is organized as follows. Section 2 reviews related work for QoE evaluation. Section 3 briefly describes the experiment design and data recording. In Section 4, we describe the signal processing and analysis methods in detail, and Section 5 expands on the experimental results and discussion. In Section 6, we conclude the current work and give the direction for future work.

2. Related Work

Since the concept of QoE was proposed, there has been a lot of excellent work published continuously on QoE prediction and evaluation. In the paper [17], the authors used subjective mean opinion score (MOS) data and evolutionary algorithms to optimize QoE on a global scale. In the paper [18], deep learning (DL) was used to extract generalized features and representation learning from text data, video and audio data and classification parameters, and finally achieved QoE prediction through the classifier. The data in the above works came from communication networks and multimedia devices. Psychological and physiological data were retrieved directly from the user. The psychology aspect mainly involves the user questionnaire, the ratings, and so on. The physiology aspect mainly involves the collection and processing of users’ physiological signals. Currently, physiological measures used to assess the quality of multimedia experience fall into three categories: central nervous system measurement, peripheral autonomic nervous system measurement, and eye measurements [19]. Human primary perception and thinking activities belong to the central nervous system function. The neural connections between attention, decision making, and memory in animals and humans have been described in a wide range of experimental studies [20]. Because the physiological indicators measured by the central nervous system can directly reflect human perception and other thinking activities, this method is more conducive to the calculation and analysis of users’ perception and cognitive process of multimedia stimulation [14]. The most common devices available are electroencephalography (EEG) [19], near-infrared spectroscopy (NIRS) [21], functional magnetic resonance imaging (fMRI) [22] and magnetoencephalography (MEG) [23]. The activity of the peripheral autonomic nervous system is not controlled by the upper cognition of the brain. The peripheral autonomic nervous system regulates physiological functions such as respiration, heart rate and skin conductance, so electrocardiography (ECG) [24] and electrodermal activity (EDA) [25] can be used to measure the fatigue degree and emotional changes of users. There is also an eye measurements method that evaluates QoE by measuring eye gaze tracking, blinking, or pupillometry [26].
EEG is one of the basic theoretical research methods for brain science. Human mental and physical activities are dependent on bioelectricity. The brain produces and transmits different but regular electrical signals all the time. Therefore, the physiological signals of brain activity can overcome the influence of user fatigue, preference, educational background and external environment when analyzing the user’s real feelings [27]. When neurons in the brain fire, they penetrate the brain’s dura and skull, creating a weak wave of electrical potential on the brain’s skin. This allows non-invasive EEG measurements to infer the firing of intracranial neurons, which can be observed and collected by attaching special electrodes to the surface of the scalp [27]. The location of these electrodes is usually specified in the 10–20 standard system, and the appropriate reference electrode is selected. A standard system facilitates the spatial localization and signal tracking of electrodes in EEG signal analysis.
Induced event-related potentials (ERPs) [28], time-frequency domain analysis [29] and spatial brain connectivity [30] are important methods for EEG experiments and signal processing. ERPs is a special brain potential evoked by sensory stimulation and cognitive process in the brain. The relative strength of the component is significantly improved during the superposition averaging process. After the occurrence of sensory stimulation events, the waveforms of specific channel signals show distinct multiple fluctuations in sequence, and these peaks and troughs represent different patterns of ERPs. The middle-latency response generally refers to the potential induced by 50–200 ms, mainly including N100, P100, N200 and P200. In the paper [31], the authors pointed out that N100 was widely present in a variety of cognitive processing functions, including auditory, visual, behavioral and cognitive tasks, and it can reflect early simple sensory processing and can be used as a biomarker of neuroplasticity. P300 is the neural activity triggered by task-related target stimulus, which is an important aspect of ERPs research. It is a widely existing component that can be recorded and observed in the scalp, with a large amplitude and a wide span [32]. The P3a subcomponent reflects the top-down frontal attentional mechanism during task processing. Another subcomponent, P3b, reflects top-down temporoparietal activity related to memory mechanisms [33]. N400 can be used as a neurophysiological index for semantic priming, with the absolute value of N400 amplitude being smaller when a word is a good match with the previous word/context, and larger when the two do not match [34]. The time-frequency decomposition of non-stationary time signals, such as continuous wavelet transform (CWT) [35], discrete wavelet transform (DWT) [29] and empirical mode decomposition (EMD) [36], are effective EEG signal analysis methods, which can accurately capture and locate transient features in the time domain and the frequency domain to better understand the dynamic characteristics of the human brain. Assessing information exchange between brain regions is also a common method for analyzing EEG signals. This method can be combined with graph theory to analyze and quantify the structure, function and causality of the brain. The directed transfer function of the autoregressive model framework was proposed and used to determine the direction and frequency content of brain activity, and the validity of the DTF algorithm was verified by real neurobiological data [37,38]. In the paper [39], the authors validated a connection-based EEG feature detection method using ML based on tone-mapped high dynamic range videos and confirmed that DTF outperformed undirected functions.
It is clear from a large amount of research that visual stimuli have been studied far more than auditory stimuli. In the paper [40], the authors pointed out that there were not as many physiological studies on hearing as vision, so early auditory perception activation could be explored by means of physiological measurement and computational intelligence. In our previous article, we carried out some preliminary research, including recruiting volunteers, collecting EEG signal samples, selecting appropriate threshold of DTF to construct edge sets and using weighted degree for clustering [41]. The work of this paper was based on the previous work, so part of the previous experimental results are presented in Section 5.3.

3. Design of Experiments
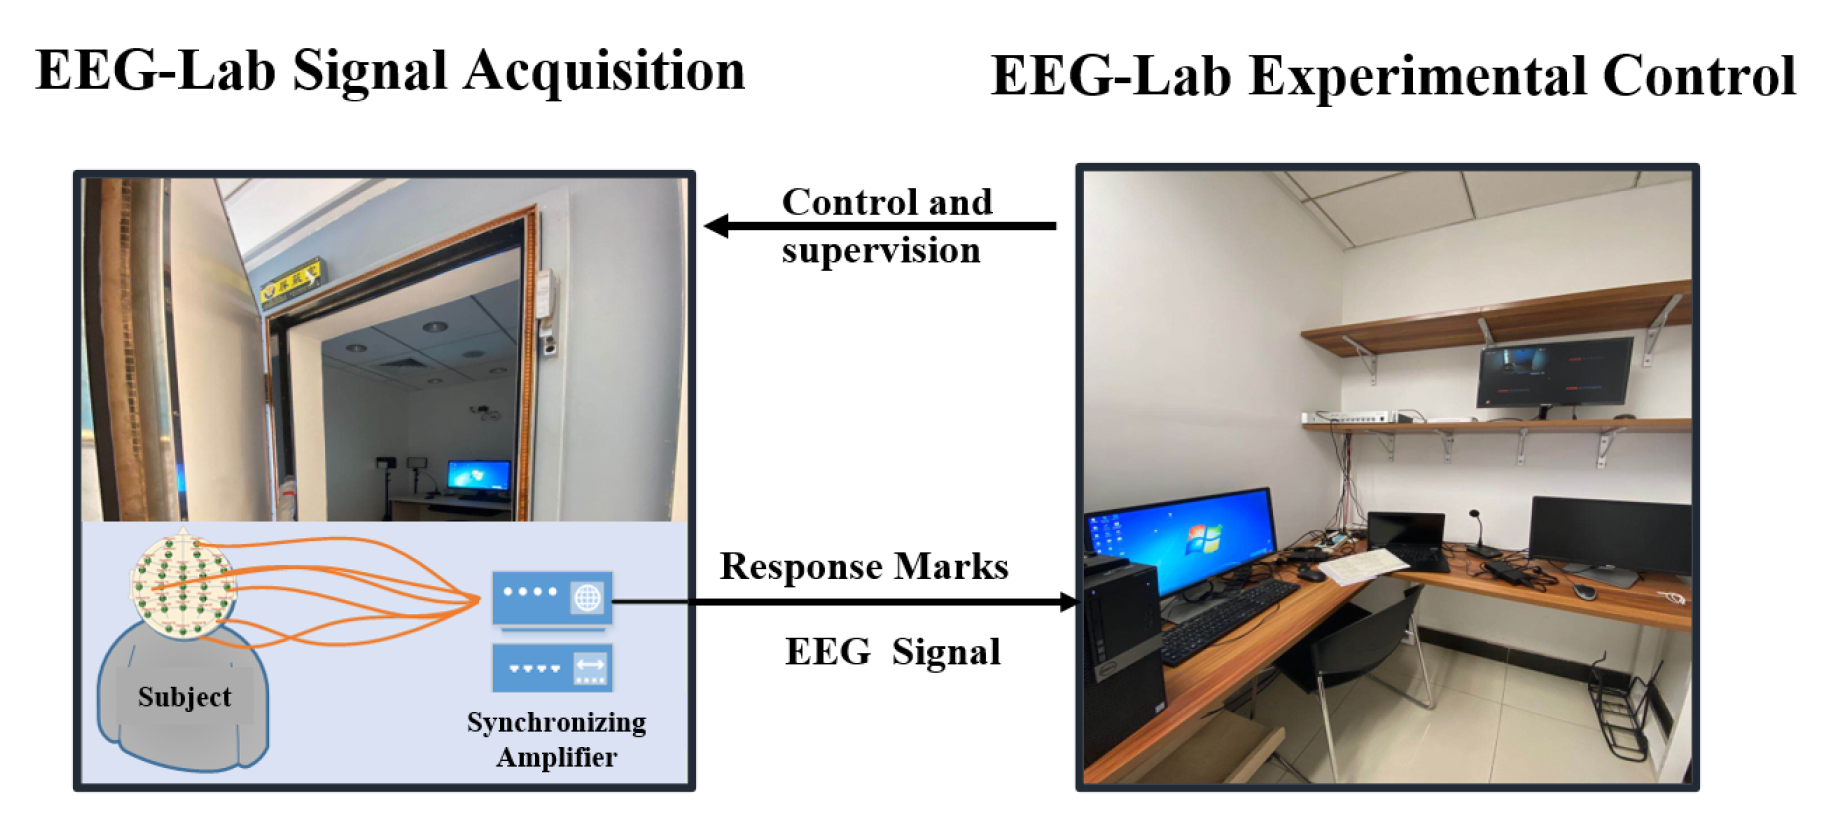
3.1. Procedure

The experiments were performed in the Wireless Multimedia Communication Lab (WMC) at Tsinghua University. The subjects were required to complete all the experimental contents in the professional EEG shielding room, as shown in Figure 2. The process of signal acquisition required the subject to complete all experiments in a professional EEG shielding chamber. This shielding room can strictly control external noise, indoor temperature, light, and electromagnetic interference. Mobile phones and other devices were banned during the experimental phase. Before the experiment, every participant was asked to read and sign an informed consent form. The researchers explained the experimental procedure and operation to the subjects in detail. The subjects did not know the specific principles and methods of the experiment. During the experiment, the subjects had to complete their tasks alone in the shielding room. Researchers could watch the indoor situation through a monitor in the control room and the brain waves of the subjects through a computer screen in real time. In special cases, researchers could communicate with the subject through the internal microphone and sound system as necessary.
We recruited 12 students and young teachers as volunteers, consisting of 6 females and 6 males, aged between 18 and 28. None of them had major illnesses. They all had normal hearing and had never had any neurological problems. Participants were tested in a soundproof, standardized EEG lab and asked to minimize blinking, make body movement, and swallow during the experiment. Two of the subjects’ data were discarded due to the too many behavioral interference signals. We finally admitted EEG data from a total of 10 subjects [41].

3.2. Stimuli and Experimental Procedure

In the experiment, four kinds of specially processed audio materials with very different semantic content were played through the headset, and each audio clip was played for 15 s. The four semantic contents were classical piano music, ocean waves, fire alarms and mosquitoes, all with periodic rhythms. Six levels of white Gaussian noise were added to each audio clip. The six Gaussian noise levels were defined according to the power spectral density of noise, which was 0, 0.001, 0.005, 0.01, 0.03 and 0.1. Depending on the level, the noise was added to the audio from 2s to 6s and lasted for 5 s. The noise of level 1 started from the second second; the noise of level 2 started from the third second, and so on. In the end, 24 different audio clips were obtained.
In each section of the experiment, the audio clips (24 in total) were randomly played twice. So, in the whole experiment, all the audio clips (24 in total) were played six times. After each audio clip was played, the subjects were asked whether they could tolerate the noise in the audio. A response of Y meant yes, and N meant no. At the end of each section, subjects rested for 3 min. At the end of the experiment, the subjects were asked to complete a subjective audio semantic questionnaire. We used the semantic difference method to make the subjects perform multiple perceptual evaluations on four different kinds of audio. The subjects were asked to evaluate three contrasting pairs of attributes. They were pleasant–unpleasant pair, relaxed–tense pair, and calm–upset pair. Matlab was used for audio material synthesis and signal processing, and Presentation, a program used for stimulation presentation and experimental control in physiological experiments, was used for stimulus materials. The whole experimental procedure is shown in Figure 3.

4. Signal Processing

4.1. Directed Transfer Function

In brain network research, directional functional brain connections can also be called causal brain connections. The information between the connected nodes is statistically causal. Methods for constructing causal connections mainly include directional transfer function (DTF) and partial directed coherence (PDC), and network connection thresholds need to be further selected for quantification. In this paper, we used the DTF method to construct the brain network and carried out degree feature extraction.
DTF is an autoregressive (AR) model [37], which can be described as
d = 0 D A d x t d = e t
where D is the model order determined by Akaike information criterion, A d is the delay matrix in AR model, and when d = 0 , it is an identity matrix. x t = ( x 1 , t , x 2 , t , , x k , t ) is the the EEG data based on time series and e t = ( e 1 , t , , e k , t ) is the vector of uncorrelated zero-means Gaussian white noise processes. If x k , t is a stationary stochastic process, A d can be obtained according to the Yule–Walker equation. Then, the Z transformation gives the following result.
X ( f ) = H ( f ) E ( f )
where H ( f ) is the transfer function, X ( f ) and E ( f ) represent the transformed EEG data and noise data at frequency f. The DTF value (denoted by D T F i , j ( f ) ) is obtained by performing column square sum normalization by H and indicates the information flow intensity between the i-th and j-th electrode.
There is a large amount of redundancy in the DTF coefficients. In the simulated signal test, only dimensions of 3, 4, 5 or 7 are used frequently [37,42], while in actual multichannel EEG signal processing, the dimensions are generally much greater than those in the simulated test. Therefore, we first simulated and tested the same dimensional vector time series system of the DTF algorithm so as to determine an appropriate threshold to construct the brain-connected network. We controlled the spectral radius ρ ( A d ) to solve the problem of randomly generating a large number of A d matrices while maintaining system stability in high-dimensional vector time series system simulation [37,41]. The formula is as follows.
r ( A d ) ρ ( A d ) R ( A d )
where r ( A d ) and R ( A d ) are the minimum and maximum row summation of A d , respectively. In the process of simulation, we let each row summation of A d be a random variable obeying uniform distribution with extreme values of 0.30 and 0.95 ; thus, we had for all i.
j = 1 31 A d ( i , j ) U ( 0.30 , 0.95 )
Specifically, we gave the row summation and then randomly divided it into 5–16 parts as the elements of the corresponding line, indicating that A d was non-negative and R ( A d ) < 1 .
In our previous work [41], we found a strong correlation between the information flow accuracy of the DTF algorithm and the A d of the actual AR model through large-scale testing of random analog signals. Previous experimental results have shown that when 10% was chosen as the threshold for constructing the brain connectivity network, the accuracy of effective connectivity could be guaranteed at most densities of A d .

4.2. Network Structure and Comprehensive Weighted Degree

In order to characterize the intensity of information flow in the cerebral cortex, we constructed a brain connectivity graph by D T F ( f ) denoted by G f q = ( V , A , W ) , where V = { 1 , 2 , , 31 } is the vertex of the network, corresponding to 31 electrodes. A = { ( i , j ) | i , j 1 , , 31 a n d i j } is the directed edge set of the graph and W : A [ 0 , 1 ] represents the weight of each directed edge. Figure 4 shows different brain connection networks constructed by a subject when listening to piano music of different quality levels. Different colors represent different connection strengths. As can be seen from the figure, the strength of noise in audio affected brain connectivity.
To further quantify the information strength feature, for each vertex v V ( G ) , we calculated the following parameters.
d e g ( v ) = w O N ( v ) \ I N ( v ) W ( v , w ) + w I N ( v ) \ O N ( v ) W ( w , v ) + w O N ( v ) I N ( v ) m a x W ( v , w ) , W ( w , v )
where I N ( v ) and O N ( v ) are the input and output neighbor of vertex v, respectively, and d e g ( v ) is the comprehensive weighted degree of v, we also let d e g G f q ( V ) denote the comprehensive weighted degree sequence of graph G f q , and λ q denote that of full-frequency band [41].
λ q = f d e g G f q ( V ) f m a x f m i n + 1
Figure 5 shows the brain topography of comprehensive weighted degree of a user in four different audio scenarios under two extreme conditions (the audio with no noise and the audio with noise intensity of 0.1). It can be seen that the user’s EEG response varies greatly under different conditions.

4.3. Clustering

For each given audio semantic scenario, we performed the clustering algorithm separately on λ 0 , λ 5 . Clustering optimization was carried out according to the error sum of squares criterion function.
J = i = 1 K j = 1 N w j i λ q C i
where w is the membership coefficient, which is either zero or one. λ q is the feature data of K-means clustering. This comprehensive weighted degree was 31 dimensions. The clustering category was defined as the acceptable level space and the unacceptable level space, and the user’s tolerance level in different audio semantics was determined by the clustering sample subordination, which was defined as the proportion of EEG signal samples classified into the unacceptable level category at different noise levels.

5. Result and Discussion

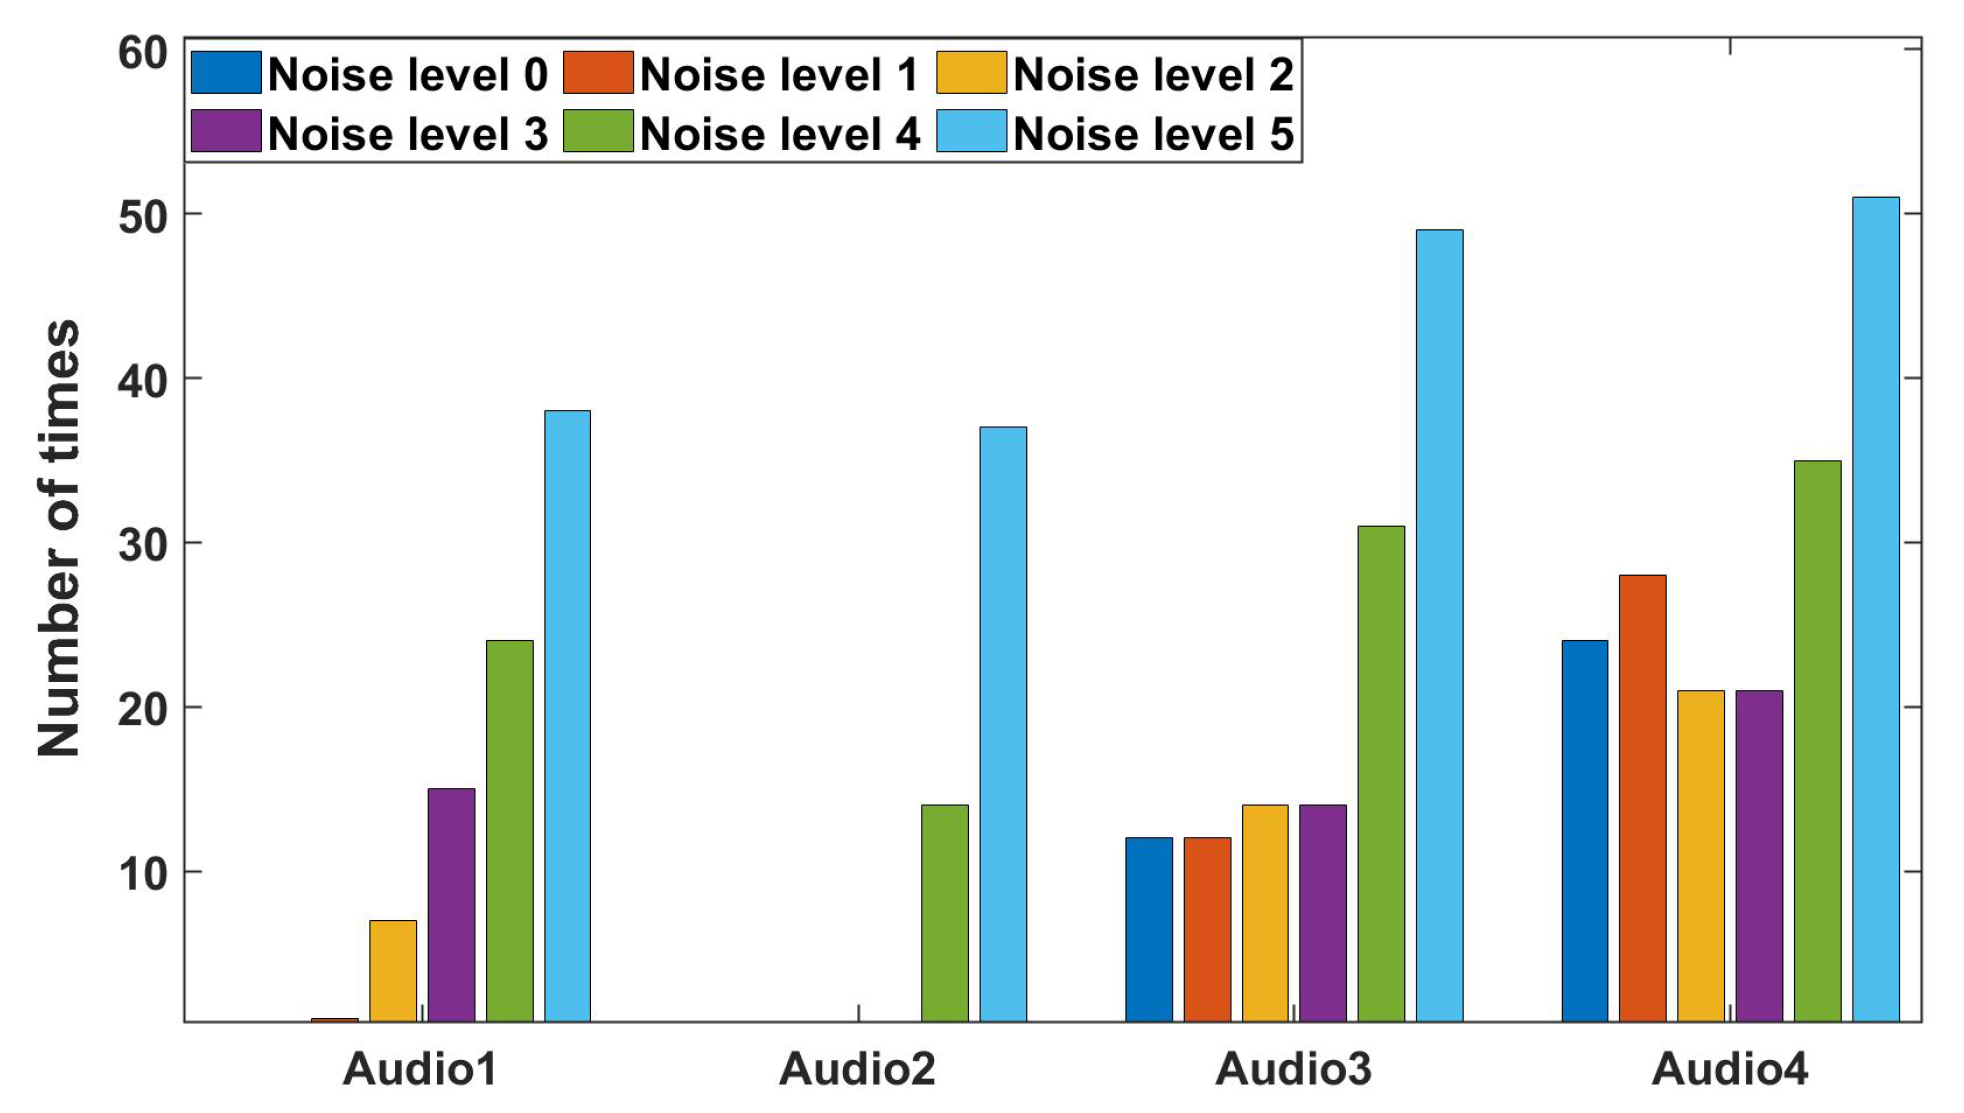
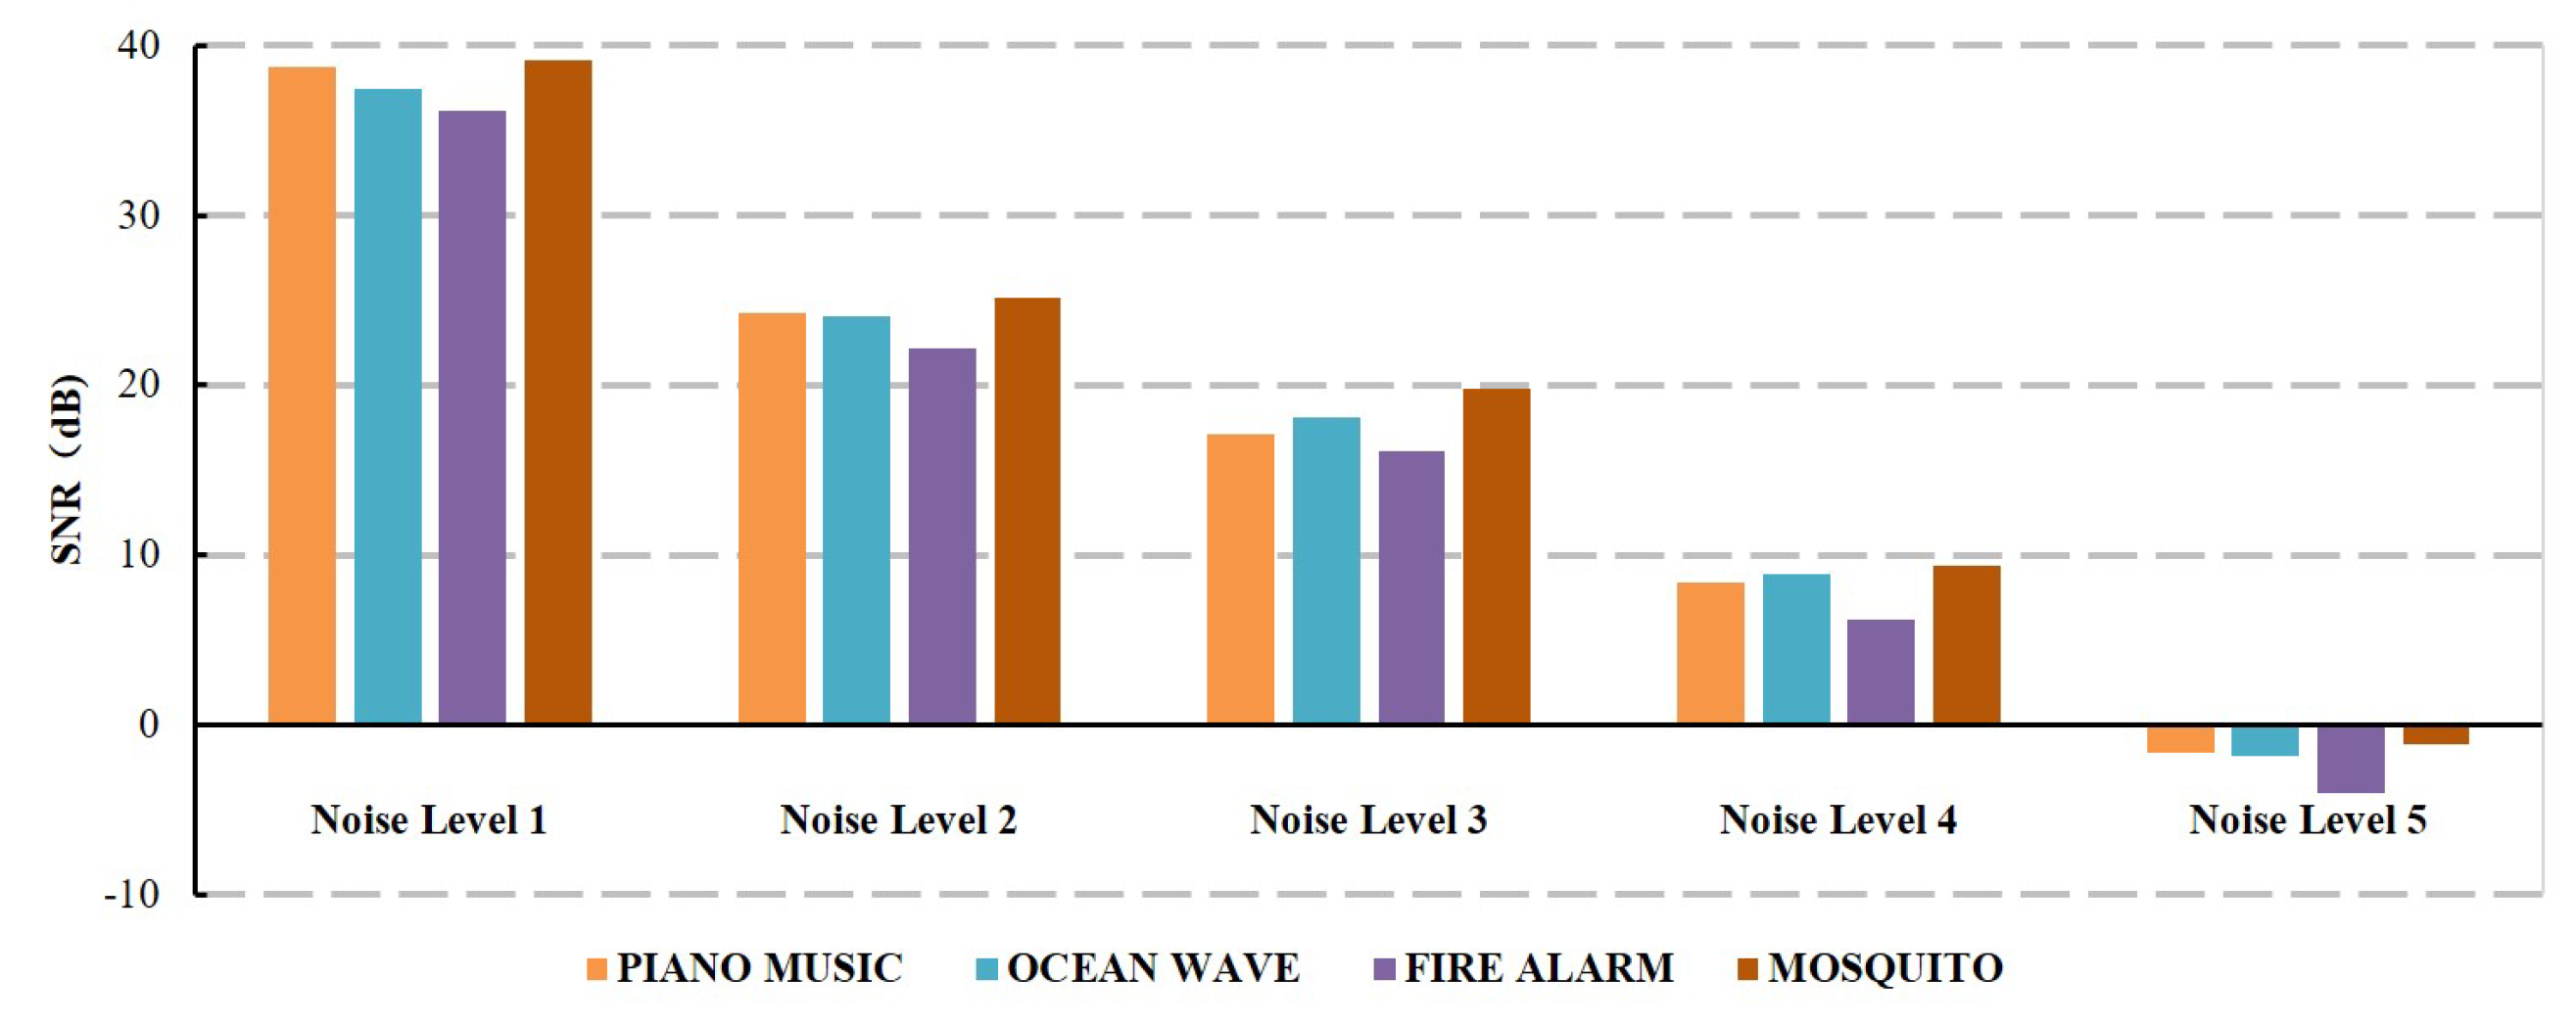
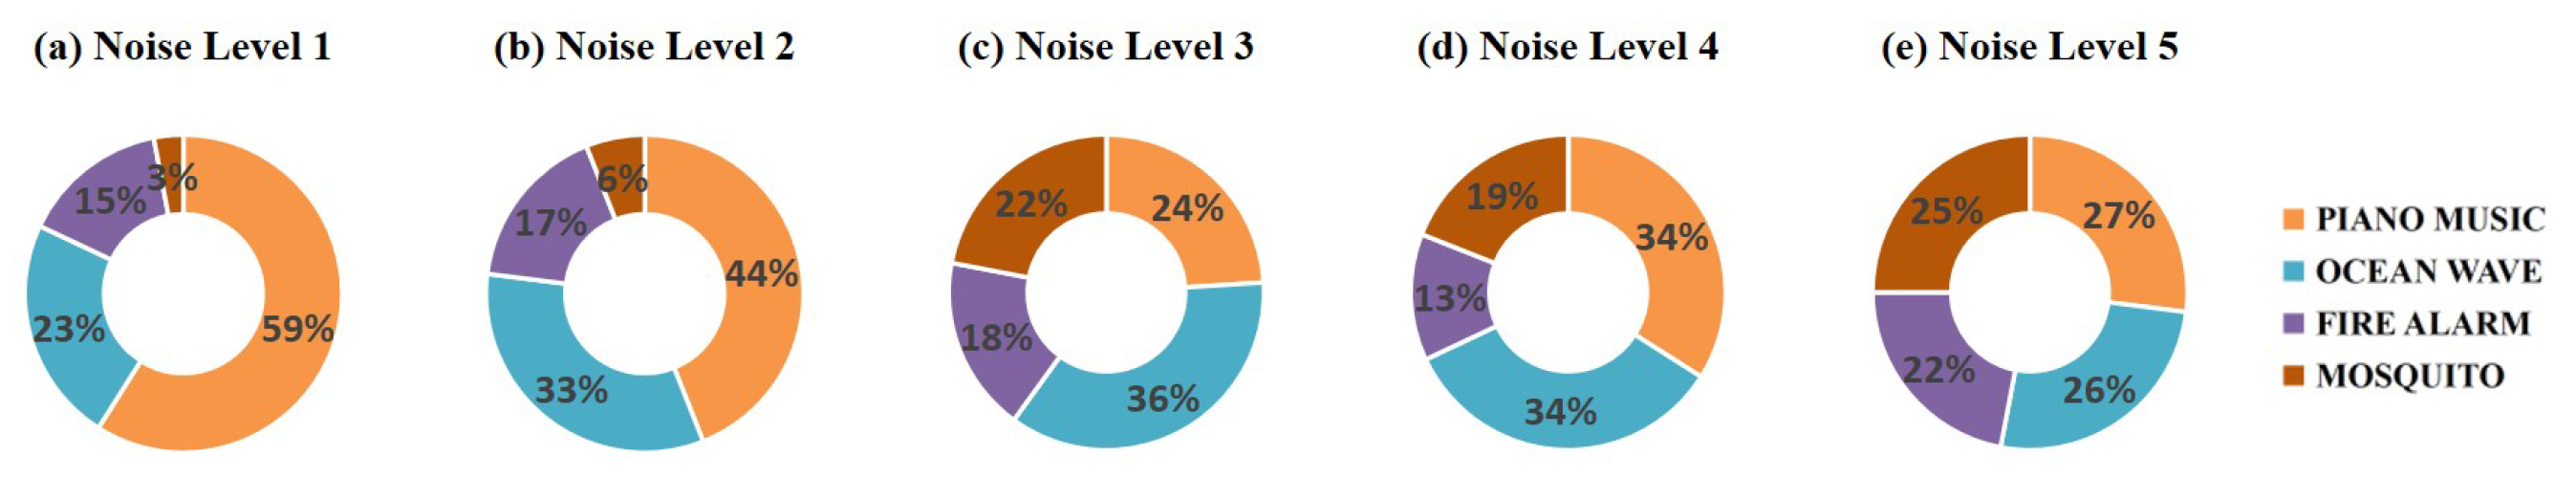
5.1. Results of Subjective Data Analysis on Noise Level

Figure 6 shows the statistical subjective evaluation results of the number of times the user experiences noise that affects audio quality. It can be seen from the results that the pure subjective evaluation of users was not completely consistent with the objective facts. In many cases, the subjective evaluation results were intuitive but not reliable. For example, in the case of the sound of ocean waves, when the noise level was low, there was no negative evaluation. Users did not make a lot of negative quality evaluations, even when the noise level reached level 4, which was unexpected. In addition, although subjects were required to evaluate only the impact of noise on audio quality, in the last two audio scenarios of the experiment, when the noise level was zero, a lot of negative evaluations on audio quality had been received. In fact, the objective audio quality was very good at that point and did not include noise. This is the disadvantage of subjective evaluation, which is the uncontrollable subjective arbitrariness of users.

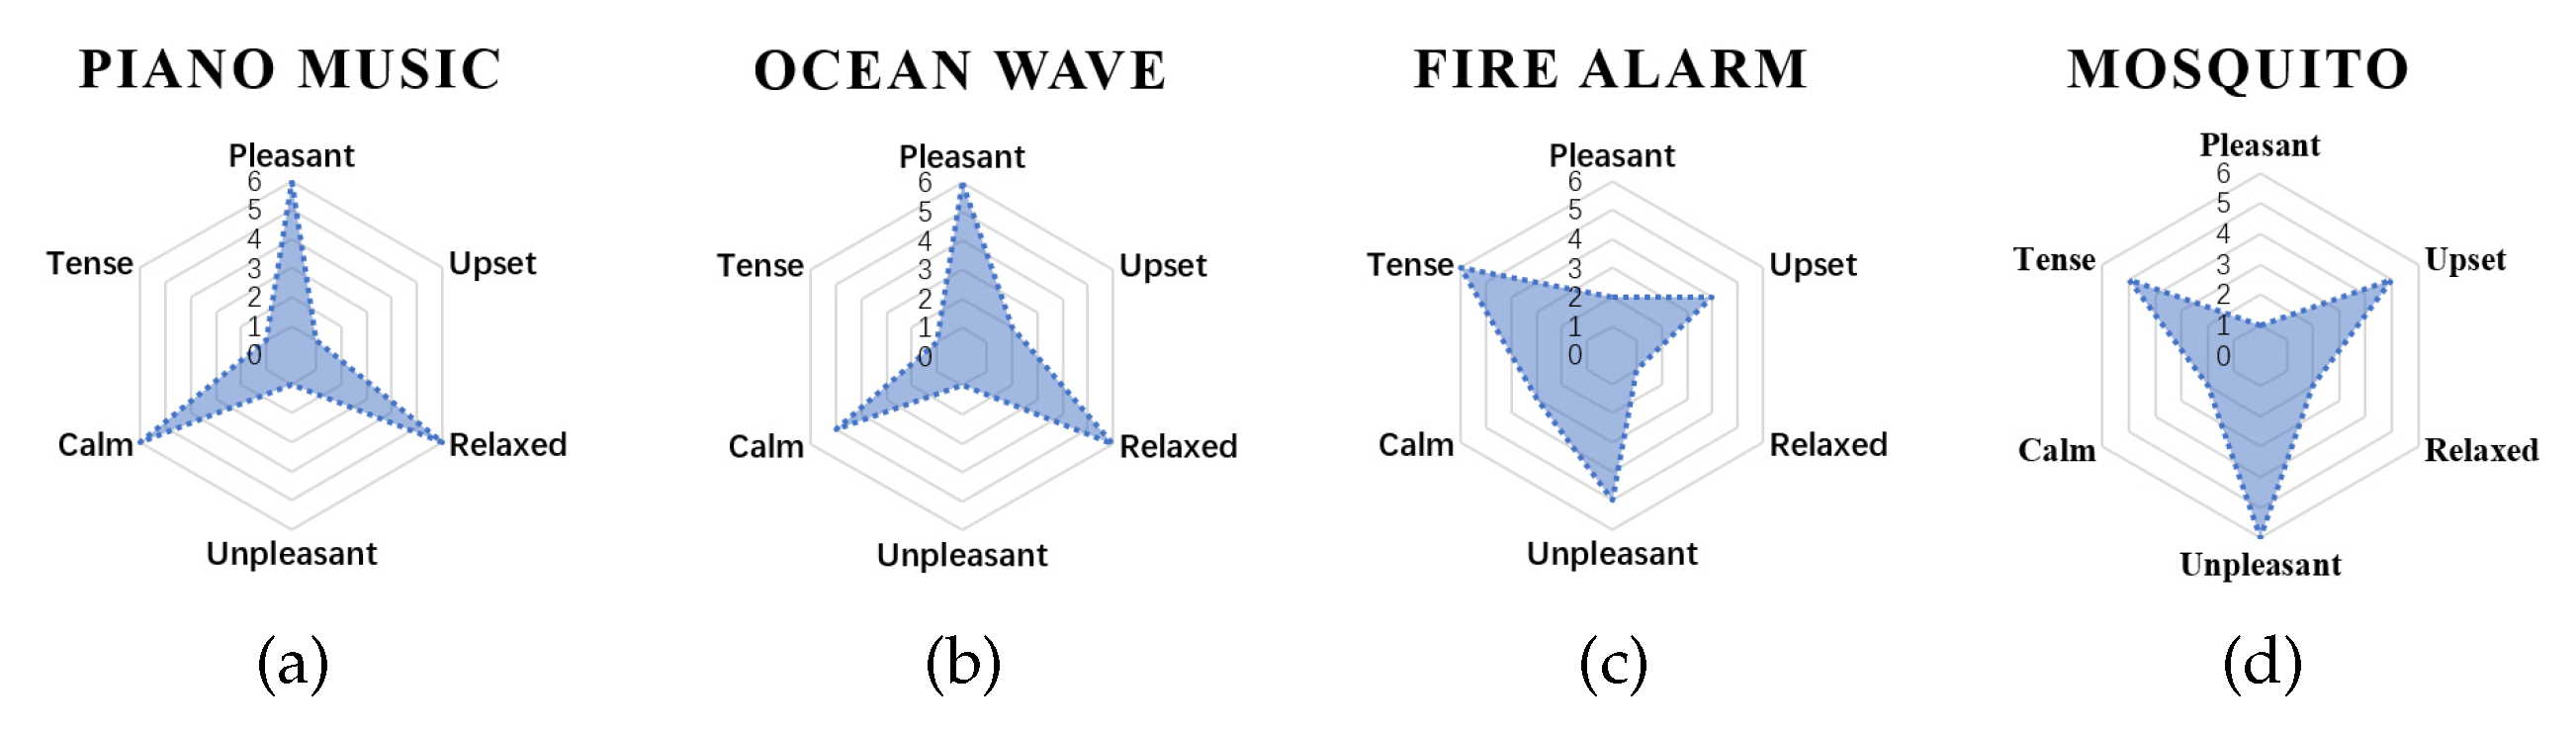
5.2. Results of Semantic Questionnaire Analysis

The attributes and semantic questionnaire analysis results are shown in Figure 7. It can be clearly seen from the figure that the perceptive semantic radar map of the four audio scenarios expressed two completely different audio emotions. This data and result can also be seen in our previous work [41]. The details were discussed in Section 5.3, together with the physiological data results.

5.3. Perceptual Tolerance

An important goal of our analysis of EEG signals is to find the level of noise perceptual tolerance, when the noise level is higher than the perceptual tolerance, almost all subjects would show an intolerable trend. According to general experience, the perceptual tolerance of humans to audio noise should be determined by the value of the SNR. Figure 8 shows the SNR results of all audio stimulus materials with noise in our experiment. As can be seen from the Figure 8, the value of SNR decreases significantly with the increase in noise level. In addition, due to the different semantics of the audio scene, the value of SNR with the same noise level fluctuates in a small range. However, the physiological signal analysis results given in Figure 9 show that humans have different perceptual tolerance for the same noise level. In this work, the brain map of the comprehensive weighting degree was very different from that of high-intensity audio when users listened to raw audio and low-intensity-noise audio. Therefore, the comprehensive weighting degree of the full frequency can be used as EEG features for the clustering algorithm. Figure 9 shows the clustering visualization results as block diagrams of all subjects.
It can be clearly seen from Figure 9 that the user’s noise tolerance level for a particular audio scenario was determined. Specifically, the user’s limits of audio 1, 2, 3 and 4 were noise levels 1, 2, 4 and 4, respectively. We suspected the above results were related to the audio scenario and the difference between the original audio signal and the noise. So, we focused on the analysis of the semantic environment of the audio and the absolute integral value of the deviation between the four semantic audios with different levels of white noise.
Combined with the results of the perception semantic questionnaire results in Figure 7, it can be seen that based on the choices of all subjects, the smooth piano music and ocean waves make people feel pleasant, relaxed and calm. Under this situation, even the low-intensity white Gaussian noise on such audio will have a great influence on the subject’s quality of experience; the user will be very sensitive to the noise, and their brainwave signal will significantly change. A different situation appears in audio 3 and 4. The fire alarm makes subjects feel tense and unpleasant, and mosquito audio makes subjects more upset. In this semantic audio environment, the subject’s sensitivity to noise is reduced, and the perceptual tolerance of noise intensity is increased. Different audio scenes bring different perceptual emotions to people, which perfectly explains that humans’ perceptual tolerance does not exactly correspond to the objective SNR of the audio. Figure 10 gives more details about the signal absolute difference integral proportion difference between audio with five levels of noise and raw audio under four different audio scenarios. This is a strong explanation for the results that the perceptual tolerance of audio 3 and 4 are higher than that of audio 1 and 2. The clustering results can also be seen in our previous work [41].
In conclusion, the perceptual tolerance of human perception of noise was related to the audio semantic environment perceived by users, and it was inversely proportional to the signal absolute difference integral proportion difference between audio with noise and raw audio under different audio scenarios. Moreover, both EEG signals analysis and subjective evaluations indicated that users were more sensitive to noise-induced quality changes in the calming and soothing audio scenario.

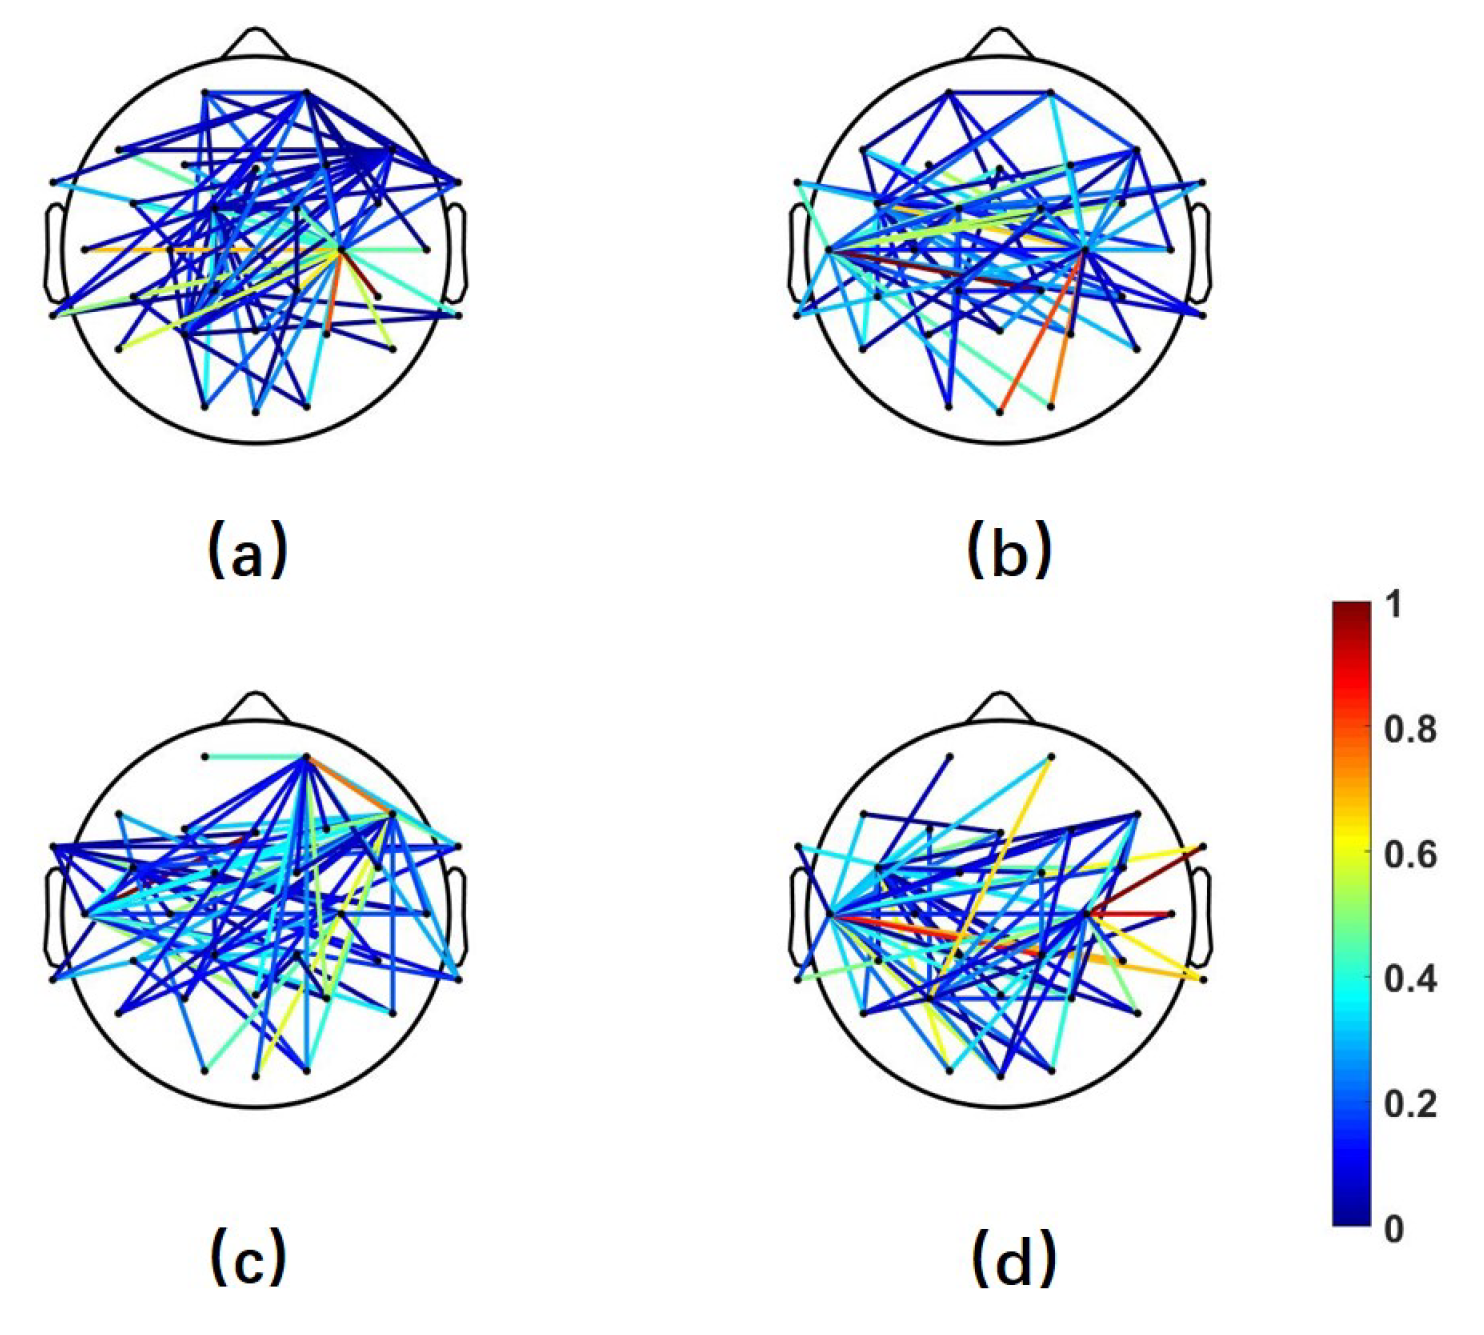
5.4. Connectivity Analysis of Related Brain Regions

To better illustrate the experimental result, we presented the comprehensive weighted degree of key channel signal of ten users with qualified experimental data. We defined the key channel as degree >1 in the audio condition (high-quality audio or audio with noise), and compared with level 0, the amplitude of level 5 increased by more than 10%. The specific values are shown in the table below.
The brain is divided into frontal, parietal, temporal, and occipital regions. The naming of the channel electrodes on the EEG cap is refined according to the location of the four brain regions. The channel F represents the frontal region, P represents the c region, T represents the temporal region, O represents the occipital region, C represents the central region, FC represents the frontal central region, CP represents the central parietal region, FP represents the frontal pole region, the singular represents the left brain, the even represents the right brain, and Z represents the middle region.
As can be seen from Table 1, when users heard the audio, the degree of nodes of CP related channels degree was higher than that of other nodes (8/10 users), and the degree of nodes of FC related channels degree was higher than that of other nodes (8/10 users), too, indicating that certain brain regions were activated after users heard the audio stimulation. We found that no matter the audio scenario, the value of node degree would increase significantly when there was noise, indicating that the activation degree of the electrical nerve signal in the brain area increased. For example, under four audio scenarios, the channel degree of the original audio and the audio with noise level 5 increased by 39.59%, 35.08%, 16.07%, and 41.66%, respectively. For another example, the CP2 channel degree of user 1 increased by 28.2%,65.92%, and 32.3% under the audio scenarios 1, 2 and 4. In audio scenario 3, the degree of channel CP5 increased by 13.99% in the same brain area. Similarly, the increase in FC-related channels was also obvious. Under audio scenarios 1, 2 and 3, the degree of FC2 of user 4 increased by 105.88%, 37.97%, and 28.78%, respectively. The degree of FC6 in the same area increased by 10.16% under audio scenario 2 and 18.75% under audio scenario 4. These statements suggested that noise had a greater effect on the brain regions where the channels mentioned above were located. In particular, the central parietal region where CP channels were located and the frontal central region where FC channels were located were cognitive-integration-related brain regions and preference-decision-related brain regions. These were consistent with previous research on brain perception [43]. All of these were consistent conclusions, regardless of the individual or the audio scenario. However, activation of the brain regions did not rule out individual differences. For example, when user 7 was under audio scenario 1 and scenario 4, the degree value and the increase in F3 and Fz channels in the frontal regions were both great.

6. Conclusions

This paper discussed the evaluation methods of human subjective perception from two aspects. They were the analysis of the physiological signals from the central nervous system and the users’ subjective behavioral data. The EEG was used to record real brain wave data, and brain connectivity maps were constructed to obtain the perceptual tolerance degree of audio noise in different scenarios. The relationship between audio signal-to-noise ratio, audio scenarios, user emotions and noise perception tolerance was analyzed comprehensively. Meanwhile, a change in brain activity intensity was also demonstrated.

Author Contributions

Conceptualization, B.G.; Methodology, B.G. and K.L.; Software, K.L.; Supervision, Y.D.; Writing—original draft, B.G. All authors have read and agreed to the published version of the manuscript.

Funding

This work was supported by the Fundamental Research Funds for the Central Universities(CUC220C007, CUC22GZ007).

Institutional Review Board Statement

The data collection part of the study was conducted at Tsinghua University, and this study was approved by the Medical Ethics Committee of Tsinghua University (1100000118937).

Informed Consent Statement

Informed consent was obtained from all subjects involved in the study.

Data Availability Statement

Not applicable.

Acknowledgments

This work was also supported by Communication University of China and Tsinghua University-China Mobile Communications Group Co., Ltd. Joint Institute. We wish to thank Tsinghua WMC EEG Lab for providing experimental conditions. A small part of this work was presented at the conference IWCMC, and we have officially obtained IEEE permission to reuse the materials.

Conflicts of Interest

The authors declare no conflict of interest.

Abbreviations

QoEQuality of Experience.
EEGElectroencephalogram.
QoSQuality of Service.
MOSMean Opinion Score.
MLMachine learning.
DLDeep learning.
DTFDirectional Transfer Function.
ERPsEvent-Related Potentials.
NIRSNear-Infrared Spectroscopy.
fMRIFunctional Magnetic Resonance Imaging.
MEGMagnetoencephalography.
ECGElectrocardiography.
EDAElectrodermal Activity.
CWTContinuous Wavelet Transform.
DWTDiscrete Wavelet Transform.
EMDEmpirical Mode Decomposition.
ARAutoregressive.
PDCPartial Directed Coherence.
SNRSignal to Noise Ratio.

References

  1. Wu, Y.; Li, J.; Yuan, Y.; Qin, A.K.; Gong, M.G. Commonality Autoencoder: Learning Common Features for Change Detection From Heterogeneous Images. IEEE Trans. Neural Netw. Learn. Syst. 2021, 33, 4257–4270. [Google Scholar] [CrossRef] [PubMed]
  2. Wu, Y.; Mu, G.; Qin, C.; Miao, Q.; Zhang, X. Semi-Supervised Hyperspectral Image Classification via Spatial-Regulated Self-Training. Remote Sens. 2020, 12, 159. [Google Scholar] [CrossRef] [Green Version]
  3. Moldovan, A.; Ghergulescu, I.; Weibelzahl, S.; Muntean, C.H. User-centered EEG-based multimedia quality assessment. In Proceedings of the 2013 IEEE International Symposium on Broadband Multimedia Systems and Broadcasting (BMSB), London, UK, 5–7 June 2013; pp. 1–8. [Google Scholar]
  4. Wu, Y.; Zhang, L.; Lv, T.; Guo, R.; Xing, L.; Wang, Y. An Intelligent Perception Model and Parameters Adjust Method for Quality of Experience. Electronics 2022, 11, 1732. [Google Scholar] [CrossRef]
  5. Ahmad, A.; Mansoor, A.B.; Barakabitze, A.A.; Hines, A.; Atzori, L.; Walshe, R. Supervised-learning-Based QoE Prediction of Video Streaming in Future Networks: A Tutorial with Comparative Study. IEEE Commun. Mag. Artic. News Events Interest Commun. Eng. 2021, 59, 88–94. [Google Scholar] [CrossRef]
  6. Zhang, Q.; Zhu, W.; Zhang, Y.Q. End-to-End QoS for Video Delivery Over Wireless Internet. Proc. IEEE 2005, 93, 123–134. [Google Scholar] [CrossRef]
  7. Skorin-Kapov, L.; Varela, M.; Hobfeld, T.; Chen, K.T. A Survey of Emerging Concepts and Challenges for QoE Management of Multimedia Services. Acm Trans. Multimed. Comput. Commun. Appl. 2018, 14, 1–29. [Google Scholar] [CrossRef]
  8. ITU-T. 1865. Available online: https://www.itu.int/en/ITU-T/Pages/default.aspx (accessed on 7 September 2022).
  9. New Appendix I-Definition of Quality of Experience (QoE). ITU-T Rec. P.10/G.100 Appendix 1. 2007. Available online: https://cir.nii.ac.jp/crid/1570291225912681600 (accessed on 14 July 2008).
  10. Song, J.; Yang, F.; Zhou, Y.; Wan, S.; Wu, H.R. QoE Evaluation of Multimedia Services Based on Audiovisual Quality and User Interest. IEEE Trans. Multimed. 2016, 18, 444–457. [Google Scholar] [CrossRef]
  11. Yang, M.; Wang, S.; Calheiros, R.N.; Yang, F. Survey on QoE Assessment Approach for Network Service. IEEE Access 2018, 6, 48374–48390. [Google Scholar] [CrossRef]
  12. Mok, R.K.P.; Luo, X.; Chan, E.W.W.; Chang, R.K.C. QDASH: A QoE-aware DASH system. In Proceedings of the Proceedings of the Third Annual ACM SIGMM Conference on Multimedia Systems, Chapel Hill, NC, USA, 22–24 February 2012. [Google Scholar]
  13. Wang, Y.; Agarwal, M.; Lan, T.; Aggarwal, V. Learning-Based Online QoE Optimization in Multi-Agent Video Streaming. Algorithms 2022, 15, 227. [Google Scholar] [CrossRef]
  14. Cassani, R.; Moinnereau, M.A.; Falk, T.H. A Neurophysiological Sensor-Equipped Head-Mounted Display for Instrumental QoE Assessment of Immersive Multimedia. In Proceedings of the 2018 Tenth International Conference on Quality of Multimedia Experience (QoMEX), Cagliari, Italy, 29 May–1 June 2018; pp. 1–6. [Google Scholar]
  15. Machado, V.A.; Silva, C.N.; Oliveira, R.S.; Melo, A.M.; Hirata, C.M. A new proposal to provide estimation of QoS and QoE over WiMAX networks: An approach based on computational intelligence and discrete-event simulation. In Proceedings of the 2011 IEEE Latin-American Conference on Communications (LATINCOM), Belem, Brazil, 24–26 October 2011. [Google Scholar]
  16. Huang, R.; Xin, W.; Lv, C.; Li, X.; Zhang, S. Prediction Model for User’s QoE in Imbalanced Dataset. In Proceedings of the 2015 First International Conference on Computational Intelligence Theory, Systems and Applications (CCITSA), Ilan, Taiwan, 10–12 December 2015. [Google Scholar]
  17. Deressa, M.; Sheng, M.; Wimmers, M.; Liu, J.; Mekonnen, M. Maximizing Quality of Experience in Device-to-Device Communication Using an Evolutionary Algorithm Based on Users’ Behavior. IEEE Access 2017, 5, 3878–3888. [Google Scholar] [CrossRef]
  18. Zhang, H.; Hu, H.; Gao, G.; Wen, Y.; Guan, K. DeepQoE: A unified Framework for Learning to Predict Video QoE. In Proceedings of the IEEE International Conference on Multimedia & Expo, San Diego, CA, USA, 23–27 July 2018; pp. 1–6. [Google Scholar]
  19. Kwon, M.; Cho, H.; Won, K.; Ahn, M.; Jun, S.C. Use of Both Eyes-Open and Eyes-Closed Resting States May Yield a More Robust Predictor of Motor Imagery BCI Performance. Electronics 2020, 9, 690. [Google Scholar] [CrossRef]
  20. Spence, S. The Cognitive Neurosciences. J. Cogn. Neuroence 1995, 7, 514. [Google Scholar] [CrossRef]
  21. Laghari, K.R.; Gupta, R.; Arndt, S.; Antons, J.; Schleicher, R.; Möller, S.; Falk, T.H. Neurophysiological experimental facility for Quality of Experience (QoE) assessment. In Proceedings of the 2013 IFIP/IEEE International Symposium on Integrated Network Management (IM 2013), Ghent, Belgium, 27–31 May 2013; pp. 1300–1305. [Google Scholar]
  22. Kim, D.; Yong, J.J.; Kim, E.; Yong, M.R.; Park, H.W. Human brain response to visual fatigue caused by stereoscopic depth perception. In Proceedings of the 2011 17th International Conference on Digital Signal Processing (DSP), Corfu, Greece, 6–8 July 2011; pp. 1–5. [Google Scholar]
  23. Miettinen, I.; Tiitinen, H.; Alku, P.; May, P.J. Sensitivity of the human auditory cortex to acoustic degradation of speech and non-speech sounds. BMC Neurosci. 2010, 11, 24. [Google Scholar] [CrossRef] [Green Version]
  24. Kroupi, E.; Hanhart, P.; Lee, J.S.; Rerabek, M.; Ebrahimi, T. Predicting subjective sensation of reality during multimedia consumption based on EEG and peripheral physiological signals. In Proceedings of the IEEE International Conference on Multimedia & Expo, Chengdu, China, 14–18 July 2014; pp. 1–6. [Google Scholar]
  25. Keighrey, C.; Flynn, R.; Murray, S.; Murray, N. A Physiology-based QoE Comparison of Interactive Augmented Reality, Virtual Reality and Tablet-based Applications. IEEE Trans. Multimed. 2021, 23, 333–341. [Google Scholar] [CrossRef]
  26. Liu, H.; Heynderickx, I. Visual Attention in Objective Image Quality Assessment: Based on Eye-Tracking Data. IEEE Trans. Circuits Syst. Video Technol. 2011, 21, 971–982. [Google Scholar]
  27. Moon, S.E.; Lee, J.S. Implicit Analysis of Perceptual Multimedia Experience Based on Physiological Response: A Review. IEEE Trans. Multimed. 2017, 19, 340–353. [Google Scholar] [CrossRef] [Green Version]
  28. Liu, X.; Tao, X.; Xu, M.; Zhan, Y.; Lu, J. An EEG-Based Study on Perception of Video Distortion Under Various Content Motion Conditions. IEEE Trans. Multimed. 2020, 22, 949–960. [Google Scholar] [CrossRef]
  29. Adeli, H.; Zhou, Z.; Dadmehr, N. Analysis of EEG records in an epileptic patient using wavelet transform. J. Neurosci. Methods 2003, 123, 69–87. [Google Scholar] [CrossRef]
  30. Friston, K.J. Functional and effective connectivity: A review. Brain Connect 2011, 1, 13–36. [Google Scholar] [CrossRef]
  31. Joseph, G.H.; Michelle, B.E.; Eugene, D.; Seidman, L.J.; Sarah, G.; April, K.; Woodberry, K.A.; Ashley, R.; Sahil, T.; Kyle, O. N100 Repetition Suppression Indexes Neuroplastic Defects in Clinical High Risk and Psychotic Youth. Neural Plast. 2016, 2016, 4209831. [Google Scholar]
  32. Bachiller, A.; Lubeiro, A.; Díez, Á.; Suazo, V.; Domínguez, C.; Blanco, J.A.; Ayuso, M.; Hornero, R.; Poza, J.; Molina, V. Decreased entropy modulation of EEG response to novelty and relevance in schizophrenia during a P300 task. Eur. Arch. Psychiatry Clin. Neurosci. 2015, 265, 525–535. [Google Scholar] [CrossRef] [PubMed]
  33. Polich, J. Updating P300: An integrative theory of P3a and P3b. Clin. Neurophysiol. 2007, 118, 2128–2148. [Google Scholar] [PubMed]
  34. Boyd, J.E.; Patriciu, I.; McKinnon, M.C.; Kiang, M. Test-retest reliability of N400 event-related brain potential measures in a word-pair semantic priming paradigm in patients with schizophrenia. Schizophr. Res. 2014, 158, 195. [Google Scholar] [CrossRef] [Green Version]
  35. Cohen, M.X. A better way to define and describe Morlet wavelets for time-frequency analysis. NeuroImage 2019, 199, 81–86. [Google Scholar] [CrossRef] [PubMed]
  36. Sweeney-Reed, C.M.; Nasuto, S.J. A novel approach to the detection of synchronisation in EEG based on empirical mode decomposition. J. Comput. Neurosci. 2007, 23, 79–111. [Google Scholar] [CrossRef]
  37. Kaminski, M.J.; Blinowska, K.J. A new method of the description of the information flow in the brain structures. Biol. Cybern. 1991, 65, 203–210. [Google Scholar] [CrossRef]
  38. Van Wijk, B.C.; Stam, C.J.; Daffertshofer, A. Comparing brain networks of different size and connectivity density using graph theory. PLoS ONE 2010, 5, e13701. [Google Scholar] [CrossRef]
  39. Moon, S.E.; Lee, J.S. EEG Connectivity Analysis in Perception of Tone-mapped High Dynamic Range Videos. In Proceedings of the 23rd ACM International Conference on Multimedia, Brisbane, Australia, 26–30 October 2015; pp. 987–990. [Google Scholar]
  40. Tian, X.; Ding, N.; Teng, X.; Bai, F.; Poeppel, D. Imagined speech influences perceived loudness of sound. Nat. Hum. Behav. 2018, 2, 225–234. [Google Scholar] [CrossRef]
  41. Geng, B.; Liu, K.; Duan, Y.; Song, Q.; Shi, J. A Novel EEG Based Directed Transfer Function for Investigating Human Perception to Audio Noise. In Proceedings of the 2020 International Wireless Communications and Mobile Computing (IWCMC), Limassol, Cyprus, 15–19 June 2020; pp. 923–928. [Google Scholar]
  42. Baccal, L.A.; Sameshima, K. Partial directed coherence: A new concept in neural structure determination. Biol. Cybern. 2001, 84, 463–474. [Google Scholar] [CrossRef]
  43. Wang, R.W.; Chang, Y.C.; Chuang, S.W. EEG spectral dynamics of video commercials: Impact of the narrative on the branding product preference. Sci. Rep. 2016, 6, 36487. [Google Scholar] [CrossRef]
Figure 1. The evaluation methods of QoE.
Electronics 11 03774 g001
Figure 2. EEG experiment environment.
Electronics 11 03774 g002
Figure 3. The experimental procedure consisted of three sections and two rests. In each session, 48 stimuli clips were played randomly.
Electronics 11 03774 g003
Figure 4. The brain connection networks of a subject when listening to piano music with 0 (a), 1 (b), 4 (c) and 5 (d) noise level.
Electronics 11 03774 g004
Figure 5. The brain topography of comprehensive weighted degree in four different audio scenarios under two extreme conditions.
Electronics 11 03774 g005
Figure 6. Number of times the user experiences noise that affects audio quality.
Electronics 11 03774 g006
Figure 7. The subjective audio semantic questionnaire: the result of multiple perceptual evaluations on four different kinds of audio. (a) Piano music (b) Ocean wave (c) Fire alarm (d) Mosquito.
Electronics 11 03774 g007
Figure 8. The SNR of audio stimulus materials.
Electronics 11 03774 g008
Figure 9. Clustering visualization results with comprehensive weighted degree based on DTF: A lighter block indicates a lower degree of subordination, and a deeper block indicates a higher degree of subordination. Red dashed lines represent the determination of clustering result.
Electronics 11 03774 g009
Figure 10. The signal absolute difference integral proportion difference between audio with five levels of noise and raw audio under four different audio scenarios.
Electronics 11 03774 g010
Table 1. The values and ranges of degree.
UserAudio SceneChannelThe Values and Ranges of Degree
1123:CP21.95, 2.50, 28.2%
223:CP21.79, 2.97, 65.92%
311:CP52.43, 2.77, 13.99%
46:FC50.95, 1.18, 24.21%
23:Cp21.95, 2.58, 32, 3%
2123:CP22.02, 2.50, 23.76%
223:CP21.79, 2.97, 65.92%
311:CP52.42, 2.86, 18.18%
46:CP50.89, 1.18, 32.58%
23:CP21.96, 2.58, 31.63%
3128:FC61.07, 1.33, 24.29%
223:CP21.74, 1.79, 2.87%
24:Cz1.82, 2.11, 15.93%
19:P42.13, 2.60, 22.06%
328:FC60.83, 1.26, 51.8%
423:CP21.39, 1.53, 10.07%
19:P42.31, 2.56, 10.82%
4129:FC20.85, 1.75, 105.88%
228:FC63.05, 3.36, 10.16%
29:FC20.79, 1.09, 37.97%
324:Cz2.77, 3.16, 14.07%
29:FC20.66, 0.85, 28.78%
428:FC63.04, 3.61, 18.75%
516:FC51.66, 2.60, 56.62%
23:CP21.97, 2.75, 39.59%
212:CP10.36, 1.18, 227.77%
23:CP21.71, 2.31, 35.08%
36:FC51.64, 2.27, 38.41%
23:CP21.68, 1.95, 16.07%
31:F81.34, 1.65, 23.13%
423:CP21.68, 2.38, 41.66%
31:F81.16, 1.59, 37.06%
616:FC51.75, 2.24, 28.00%
26:FC51.45, 2.28, 57.24%
7:FC10.84, 1.30, 54.76%
8:C31.56, 2.05, 31.41%
37:FC10.64, 0.84, 31.25%
46:FC51.64, 2.58, 57.31%
712:Fz1.04, 1.23, 18.26%
14:P30.93, 1.06, 13.97%
212:CP11.52, 1.73, 13.81%
14:P31.15, 1.63, 41.73%
312:CP11.04, 1.51, 45.19%
22:CP61.11, 1.38, 24.32%
28:FC60.73, 1.05, 43.83%
42:Fz1.13, 1.48, 30.97%
14:P31.06, 1.39, 31.13%
8113:PZ0.98, 1.22, 24.48%
23:CP20.52, 1.26, 142.3%
212:CP11.42, 1.77, 24.64%
323:CP20.55, 1.25, 127.27%
429:FC20.57, 0.69, 21.05%
9112:CP10.54, 1.04, 92.59%
23:CP22.2, 2.42, 10.00%
211:CP51.78, 2.29, 28.65%
312:CP10.72, 1.03, 43.05%
423:CP22.36, 2.66, 12.71%
1016:FC51.64, 1.77, 7.92%
229:FC20.61, 0.68, 11.47%
311:CP51.78, 1.86, 4.49%
46:FC51.26, 1.82, 44.44%
Publisher’s Note: MDPI stays neutral with regard to jurisdictional claims in published maps and institutional affiliations.

