1. Introduction
The motivation of the article is related to previous experiences in the robotization of processes such as machining, gluing, welding, and painting, where it is very important to ensure a defined speed. The currently encountered robots are characterized by the implementation of a path with a very high repeatability in the absence of ensuring a defined speed of movement. This also results from the provisions of the PN-ISO 9283 standard. The occurrence of significant reconfiguration of the robot arm causes large errors in the implementation of the defined speed. Robotic station integrators in the event of speed disturbances increase the defined speed value based on experience. The process of selecting these parameters is time-consuming and requires experience and dedicated tools.
In order to improve the control of a defined robotic process, it is necessary to control the defined path and observe the given speed profile. Then, we can control and correct the speed parameters. All parameters for evaluating the robot path for ABB robots are available in RobotStudio. Other parameters, such as speed, acceleration, contact forces, energy consumption, etc., can be recorded using additional software. The Signal Analyzer option embedded in RobotStudio enables the registration of the robot’s kinematic parameters, displacements, velocities and accelerations, both joint parameters and parameters of the TCP (in accordance with the ISO 10218-1: 2011 tool center point—a point defined for a given application, taking into account the coordinate system of the mechanical interface), point motion in various reference systems, and recording of energy consumption, while all the abovementioned data can be saved over a wide time horizon at the station and with a remote method using network communication.
Other external programs for monitoring the operation of robotic stations are Test Signal Viewer, which is designed to measure mainly signals related to the operation of the force control add-on; it gives the option of measuring the force vector in different directions of a defined reference system.
The latest of these is the external Tune Master program, which, in addition to a friendly interface, allows for recording the parameters listed in the previous programs, and additionally allows for recording the parameters of regulators and damping, both for the robot’s drive units and for added external systems.
The tools listed above are implemented depending on the problem. The study considered the use of the Tune Master add-on for the selection of the process of robotic machining of the ADT gear body, and the Test Signal Viewer program for monitoring the forces in the process of machining the V2500 engine diffuser.
The Signal Analyzer software was used to control the accelerations affecting the Keyence laser scanner in the processes of controlling the execution of rays and deburring the sharp edges of the aircraft gearbox housing, and in measuring the path correction points during robotic processing of cast iron castings.
The approach proposed in the article enables improving the quality of the robotic processes carried out. It presents the available IT tools for monitoring the parameters of robotic stations and how to use them. On the examples of the implementation of robotic stations in the industry, it shows the advantages of the proposed solutions and their limitation.
2. State of Knowledge
Almost every leading manufacturer of robots on the market offers tools that allow for recording the working parameters of robots. For example, Kuka offers the KUKA.ProcessScreen software for the visualization, monitoring, and continuous documentation of various types of robotic production processes in real time. It enables data management and documentation, and includes simple tools for analysis. Another tool offered by KUKA AG is the KUKA Connect analytical platform. It allows access to data using a web browser (Google Chrome, Safari, Microsoft Edge) or a mobile application. In this way, databases on the operation of robotic systems can be built and accessed in real time. KUKA iiQoT is the software based on the cloud, in which, thanks to the use of IIoT (Industrial Internet of Things), it is possible to view all interesting information in real time, for both one and many robots.
Another robot manufacturer, Fanuc, offers universal MT-LINK software for monitoring the parameters of not only industrial robots, but also CNC machine tools and other mechanical units.
There are a number of programs that enable the collection and analysis of data from machines and devices in the industry, including robots. These are, for example, SCADA Asix, DASYLab, or the aforementioned MT-LINKs. It is worth paying attention to solutions dedicated only to robots, such as the IXON application, supporting such robot brands as ABB, Aubo, Automata (Eva robot), Comau, Doosan, Epson, FANUC, Hanwha, Kawasaki, KUKA, Mitsubishi, Nachi, Omron, OTC Daihen, Panasonic, Sawyer, Stäubli, Universal Robots (UR+), Yaskawa, and KEBA.
This paper describes the possibilities and the way of using the ABB software for recording parameters of robotic processes.
The most readily available and frequently used data acquisition software is an add-on that is an integral part of RobotStudio called Signal Analyzer.
Its use is very wide, e.g., in article [
1] a method of optimizing the energy consumption of robotic stations is presented. The problem is formulated as reducing energy consumption by finding the optimal execution time and sequence of the robot’s movements. The result shows a 12% reduction in energy consumption without increasing the cycle time of the stations. A similar problem was discussed in [
2], where the change of the acceleration ramp values and the speed of movement of the TCP point were used while maintaining a constant time. An alternative method of minimizing energy consumption can be found in [
3], which proposes an algorithm that creates a smooth, collision-free path, taking into account energy consumption. The method of planning the probabilistic road map (PRM) path and the optimization algorithm based on the Dijkstra algorithm were used for this.
Another example is the planning of paths and modeling of robots used in foundries [
4] or the optimization of their movement in industrial processes [
5]. Other industrial applications include monitoring of laser cutting stations [
6].
New information technologies such as virtual reality are used for training [
7]; the possibility of virtual generation of complex traffic paths [
8] requires knowledge of minimal digital recording of the movement of robotic stations. Obtaining such data is possible thanks to the aforementioned Signal Analyzer program, and this type of application is included in [
9].
Together with the development of the addition of force control in ABB robots, the Test Signal Viewer software was launched on the market, dedicated as a solution for monitoring, controlling, and recording the signals of controllers with the IRC5 system [
10,
11]. The software was mainly designed to record the force values from sensors manufactured by ATI Industrial Automation. Therefore, the main applications of this software are related to processes where forces must be controlled. The main applications are force monitoring in the processes of machining [
12] or polishing [
13,
14,
15]. Robotic joining technologies in which forces play an important role also make extensive use of the capabilities of the Test Signal Viewer software. This applies, for example, to resistance welding (RSW) [
16], or the recently very popular friction welding (FSW) [
17,
18]. It is also worth mentioning that the speed of data recorded by the software allows for vibration and noise analysis [
19].
Other examples include assembly operations [
20] or manufacturing technologies using robotic plastic processing, i.e., roboforming [
21]. The use of additional force control enables the robot to be programmed by guiding the effector by hand [
12].
A very original solution for the implementation of a device for energy recovery and storage on a working robot can be found in [
22], in which the discussed software was used for analyses.
A newer tool for signal analysis is the Tune Master software consisting of four modules. The first one, called Robot, is designed for the analysis and selection of the dynamic coefficient responsible for damping the oscillations, which significantly improves the implementation of the planned path. The second one, called Additional Axis, has the functionality to display and modify configuration parameters for each mechanical unit in the system. For external mechanical units, it is possible to estimate the friction coefficient to identify parameters in the statistical model using the least squares method. We have the possibility to analyze quantities such as the total moment of inertia, total Coulomb friction, total viscous stick for the motor, gear and arm, and the angle between the center of rotation and the center of gravity. In addition, we have the ability to define the parameters of the PID controller, and define the values of deceleration and acceleration ramps.
The last two modules are Servo Gun and Log Signals, which are used to work with signals generated by mechanical units. Thanks to their application, it is possible to analyze and control the condition of a given machine. They allow for creating reports on the process and showing the influence of external factors on the process.
In the following subsections, the paper presents solutions using Log Signals to monitor and record quantities such as velocity and linear and angular acceleration of robot elements, values of forces, and moments, both driving and resulting from contact, e.g., a tool workpiece. Unfortunately, only one article [
23] concerning the accuracy and noise immunity of the IMU sensor installed on a robot was found in the literature on the Tune Master Log Signals software application available to the authors.
Summing up, each of the robot manufacturers offers tools for analyzing and recording signals related to the robot’s operation. In the case of their insufficient functionality, universal commercial tools can be used. In our work so far, during the implementation of robotic stations equipped with ABB robots, three dedicated tools have been used, and they are presented in the following subsections.
3. Application of Diagnostic Software in Industrial Examples
During many years of work with applications implemented with the use of ABB robots with the IRC5 controller, in practice many tasks would be very time-consuming or impossible to implement. Processes related to force control, minimization of energy consumption, and machining require at a certain stage of implementation information about the process parameters and the possibility of their monitoring and registration. This allows for understanding the phenomena, drawing conclusions and correctly implementing the defined task. Below are presented examples of using RobotStudio Signal Analyzer, Test Signal Viewer, and Tune Masters for the implementation of robotic industrial solutions.
3.1. RobotStudio Signal Analyzer
The production of parts or components of aircraft engines from the point of view of the plant’s order portfolio is characterized by stability over a wide time horizon. Long-term orders for a strictly defined number of parts, on the one hand, allow for long-term production planning and provide a certain financial stability; on the other hand, they do not allow for product development or increasing the number of manufactured components in order to increase profits. The only possibility of increasing the profits from production is to carry out the production process with the least amount of human work and the lowest energy consumption. It is an impulse for optimization efforts that directly translates into the economic result of the enterprise. One of the elements of cost reduction is the optimization of electricity consumption, which we implement for robotic stations using the RobotStudio software add-on called Signal Analyzer.
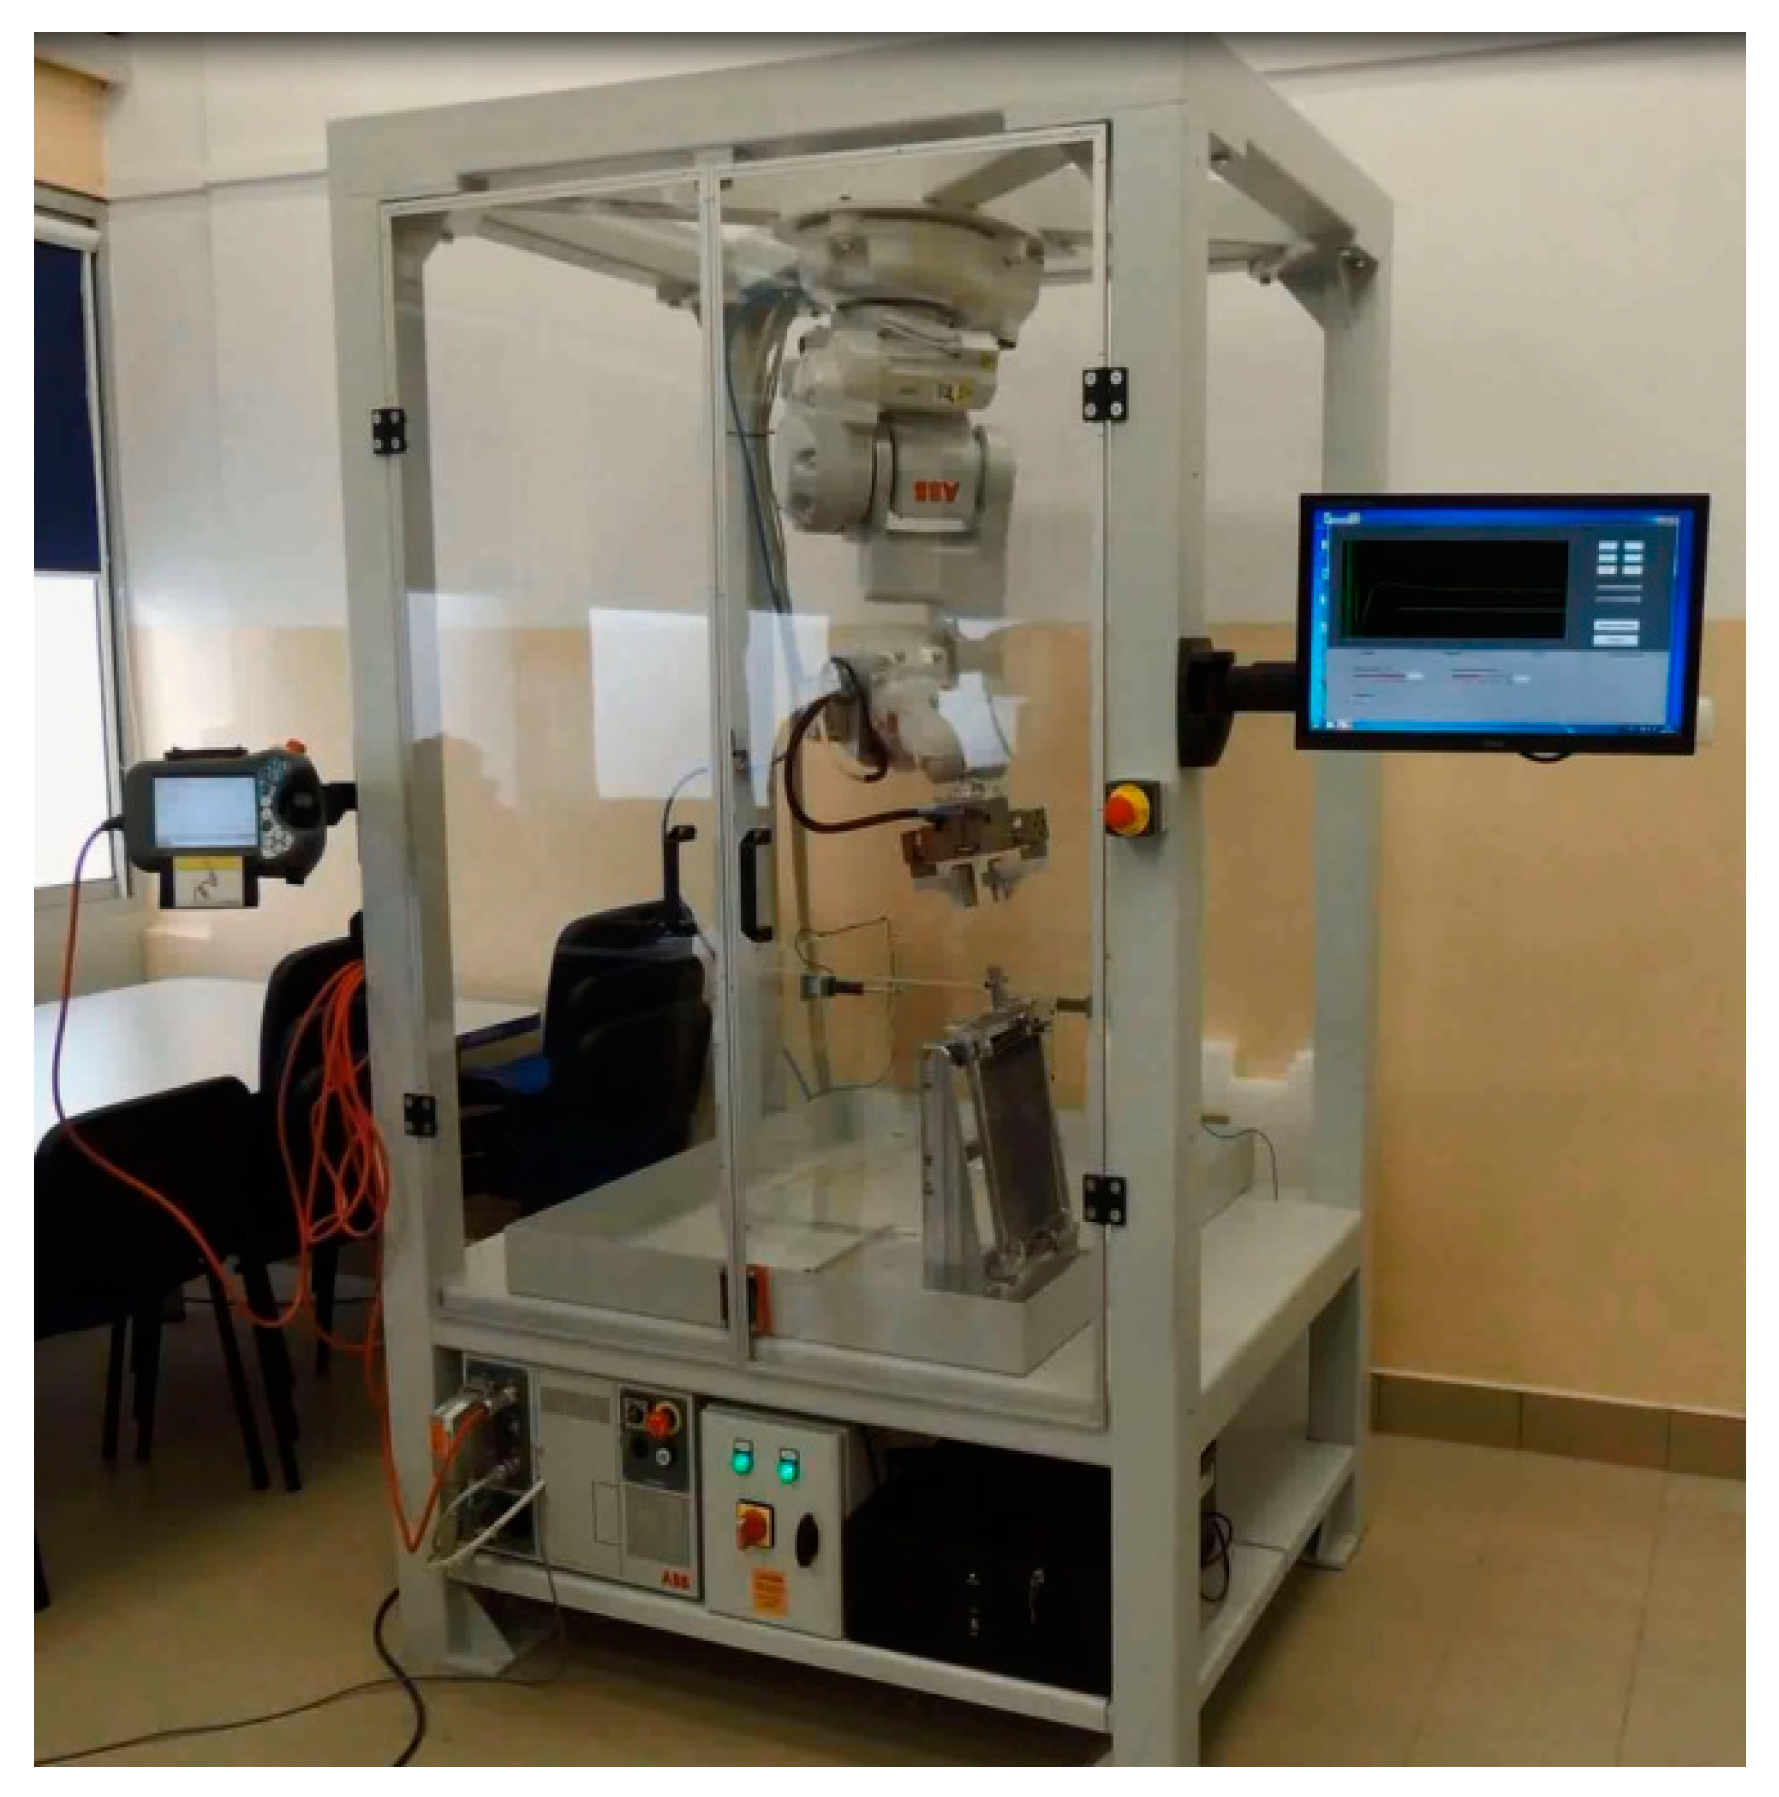
The process of minimizing energy consumption is presented with the example of a real robotic station used to control the quality of outlet guide vane (OGV) castings. As part of the work to minimize energy consumption, the process parameters were recorded and the changes in the speed of the TCP point and acceleration changes were searched for, so as to minimize energy consumption while maintaining a constant process time. The robotic station this paper concerns is the equipment of the Research and Development Laboratory for Aerospace Materials (
Figure 1).
The selection of process parameters allowing for the reduction of total energy consumption by the robotic system was based on the dependence on electricity. The value of the torque produced by the robot’s drives is related to the description of the dynamics of the object and depends on acceleration and speed as well as resistance to motion. Summing up, changes in speed and acceleration of movement of the robot’s TCP point affect the drive torque in the robot’s joints and thus the drive currents, which translates into energy demand [
2].
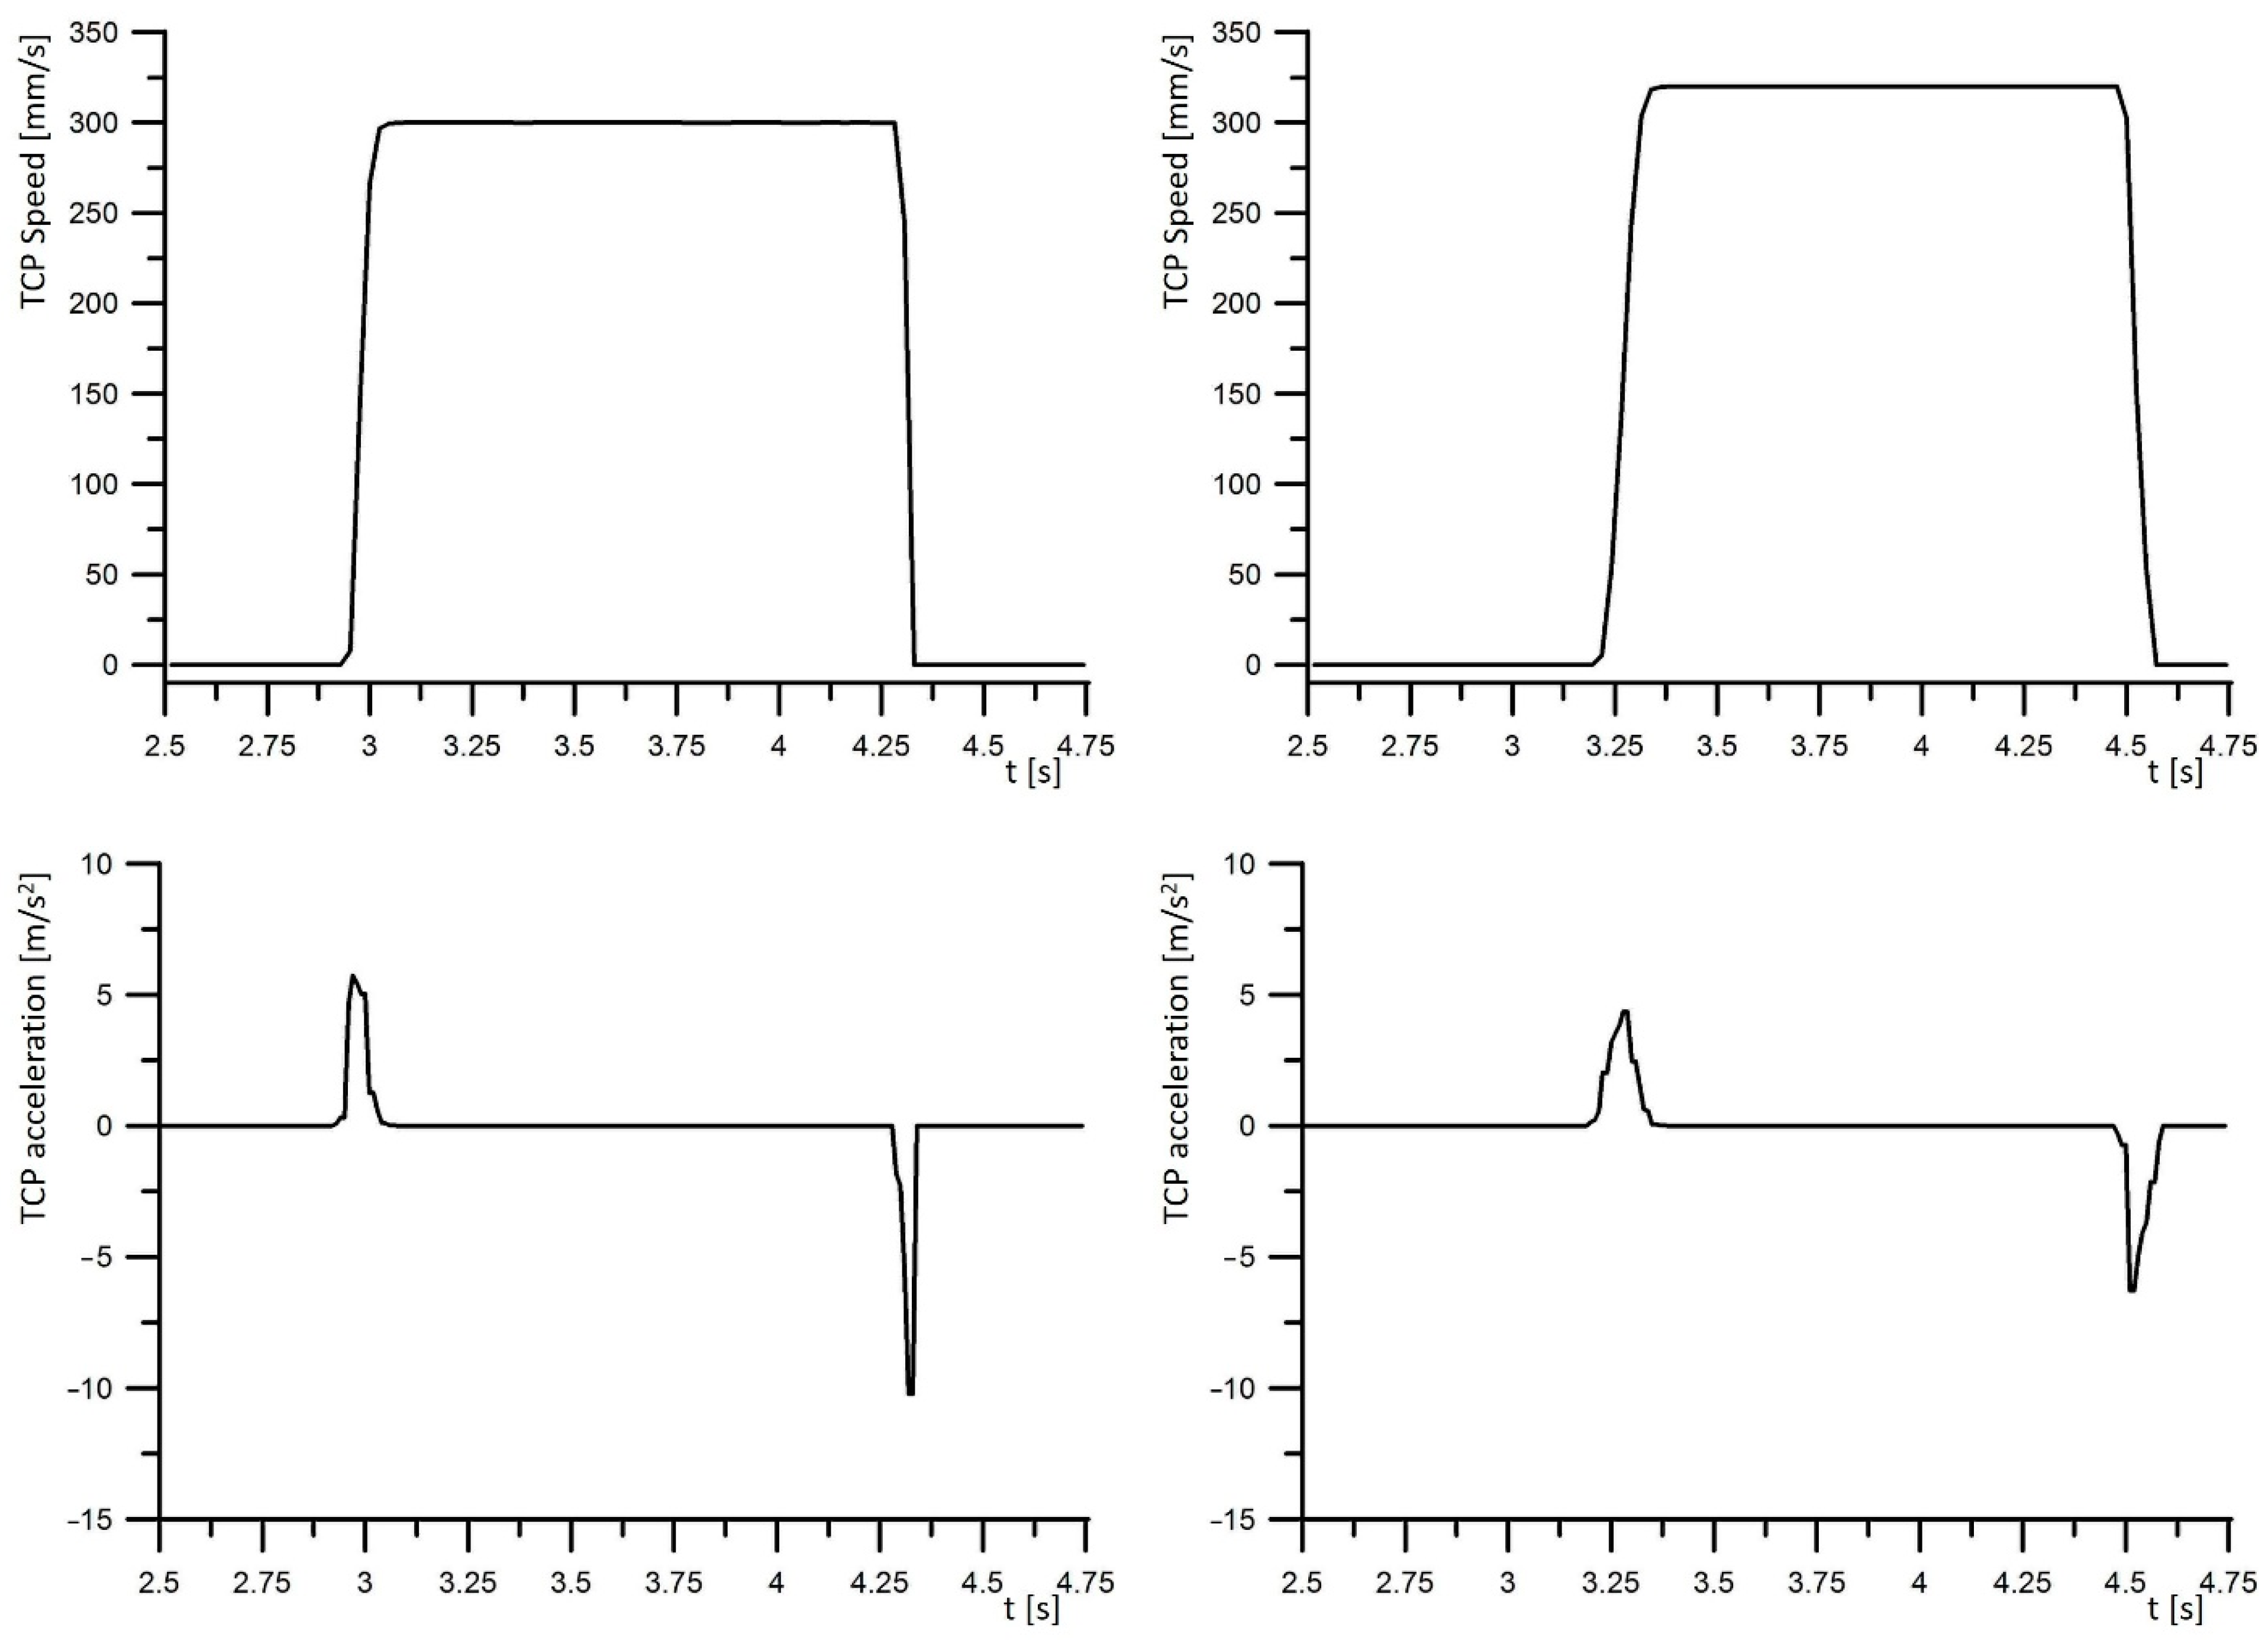
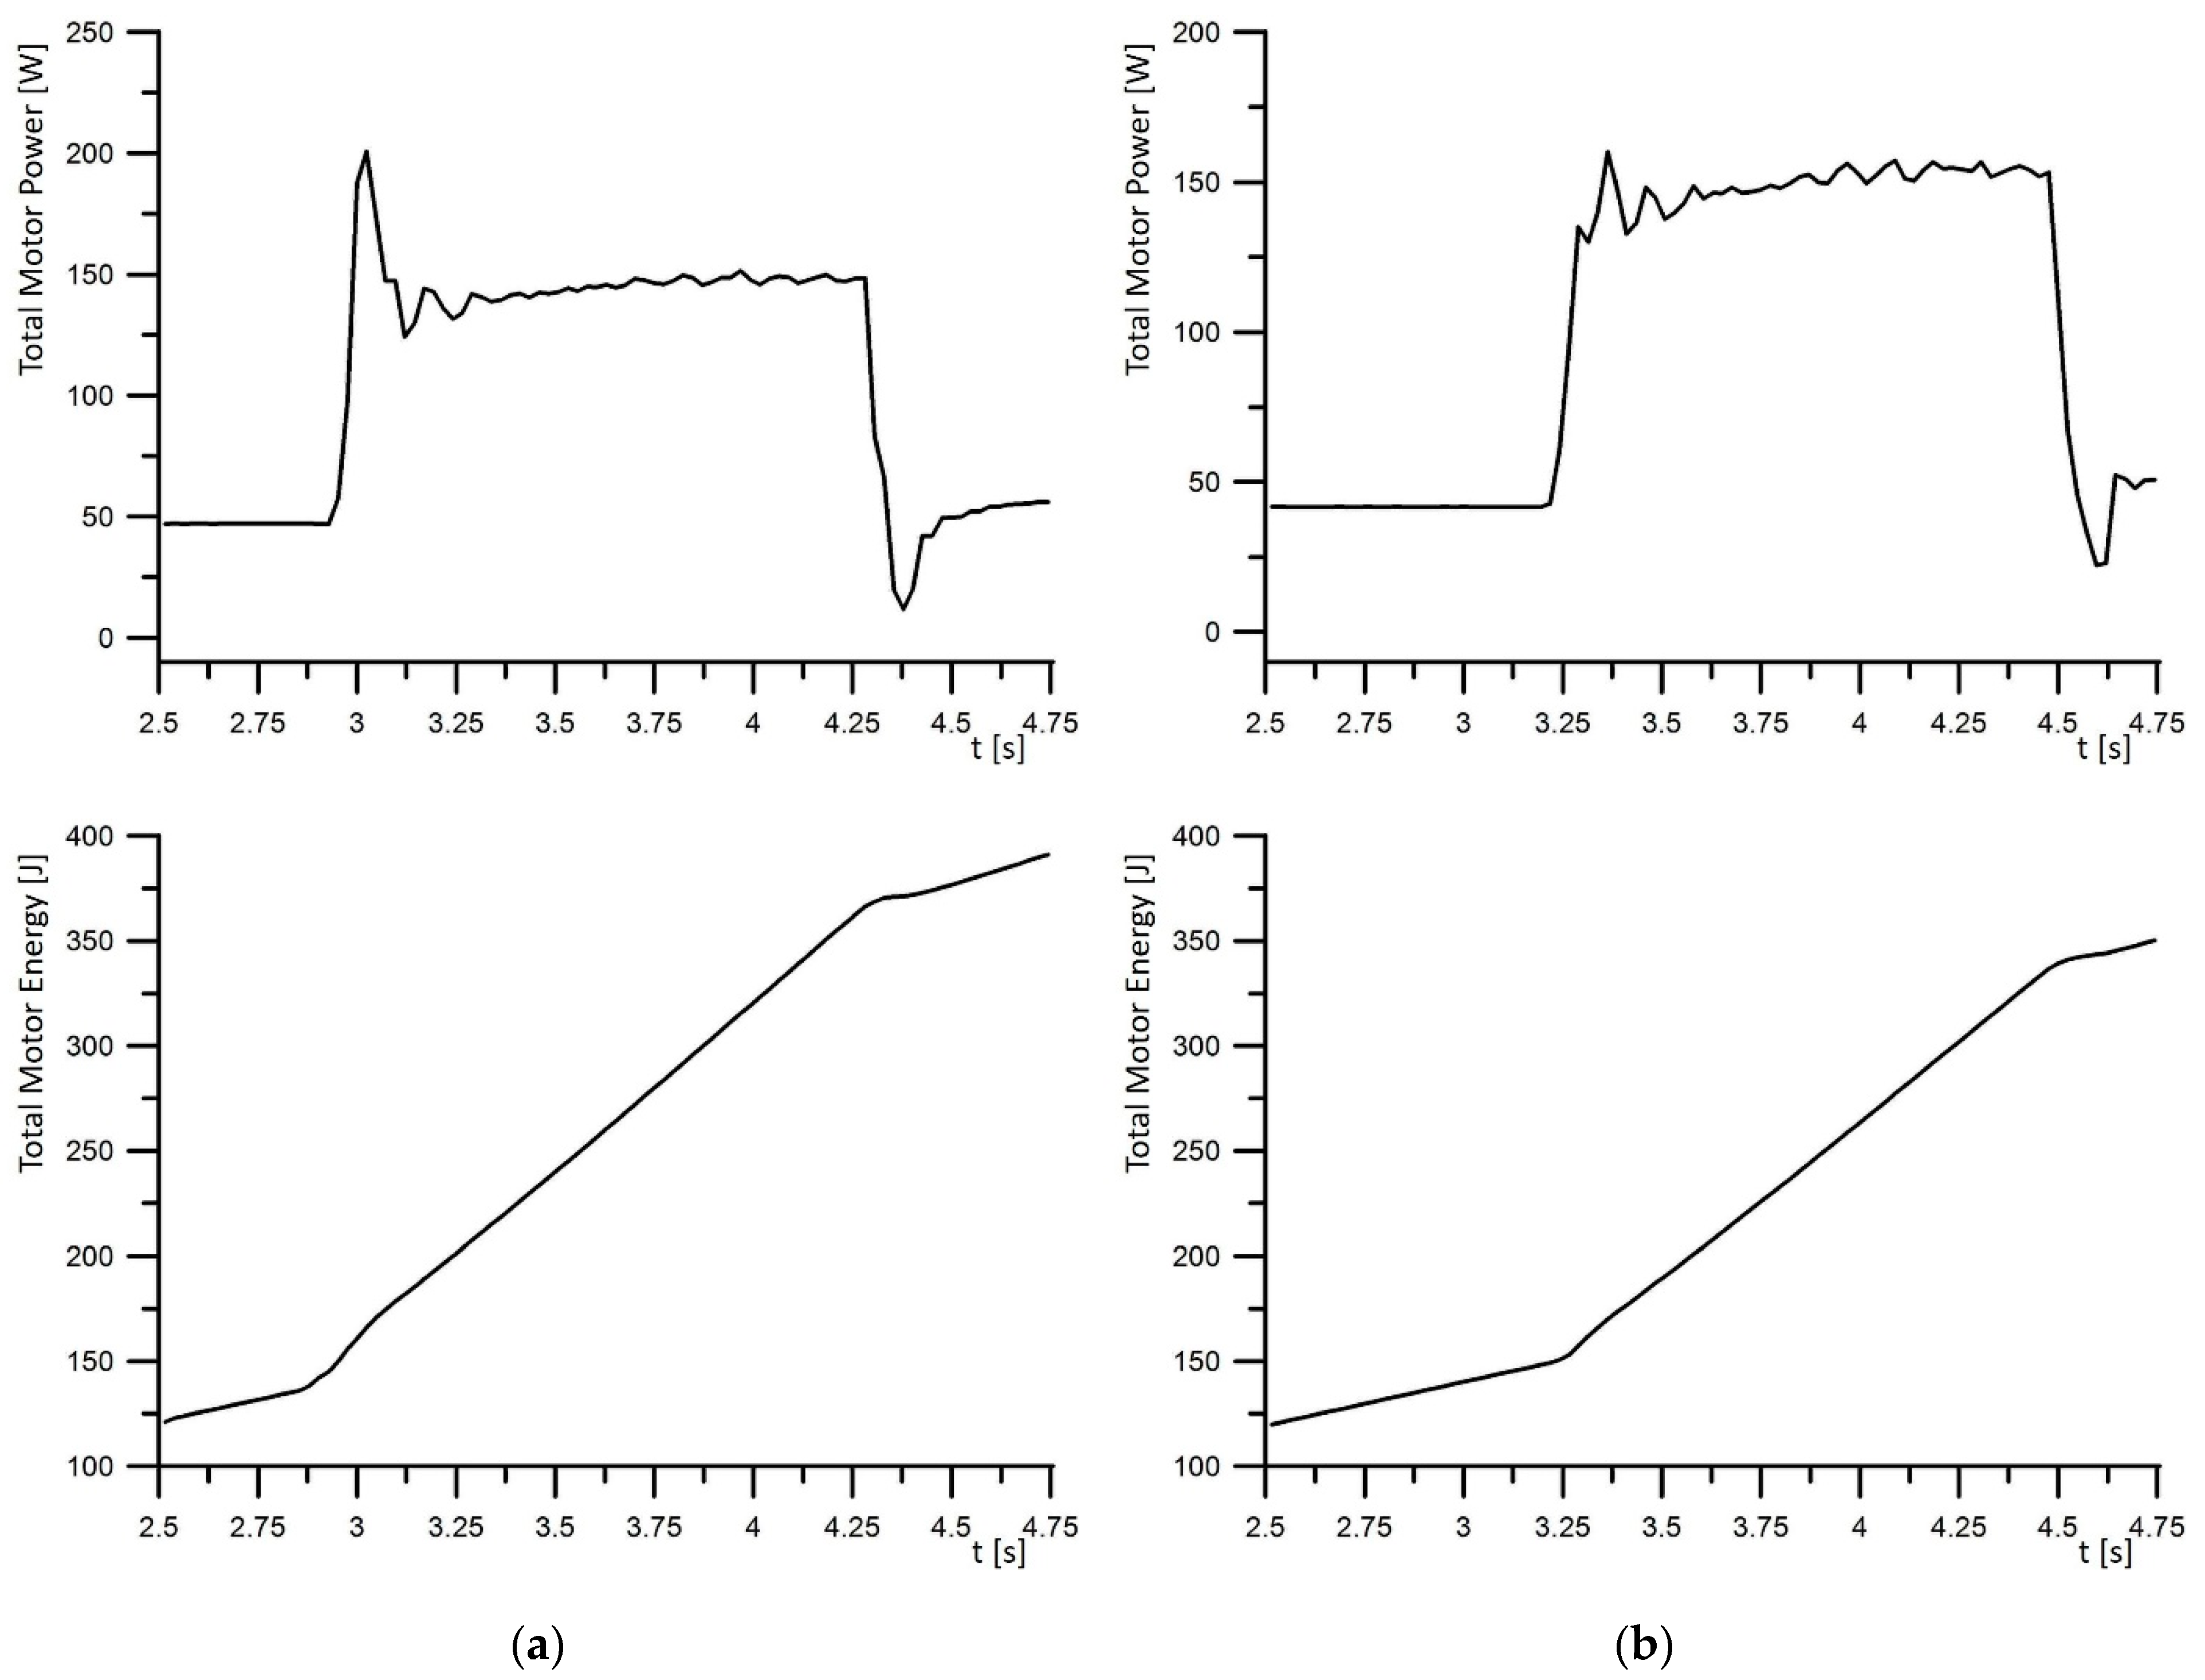
Because the entire program for controlling the thickness of the OGV airfoils of the robotic station includes over 3000 movement instructions, and the execution time is approx. 15 min, the method of selecting accelerations and speeds is illustrated by a simplified real example. Let us assume that the robot’s TCP is moved from P1 to P2 (these are the TCP robot trajectory points).
Figure 2a shows the point motion parameters such as speed and acceleration, power consumed by the system, and total energy. By changing the motion parameters of the point, namely increasing the speed and decreasing the acceleration value, we can reduce the energy consumption of the system (
Figure 2b).
It should be noted that the time needed to travel from P1 to P2 is constant because we assume that the working cycle time of the robotic station is not extended, which is very important in our considerations.
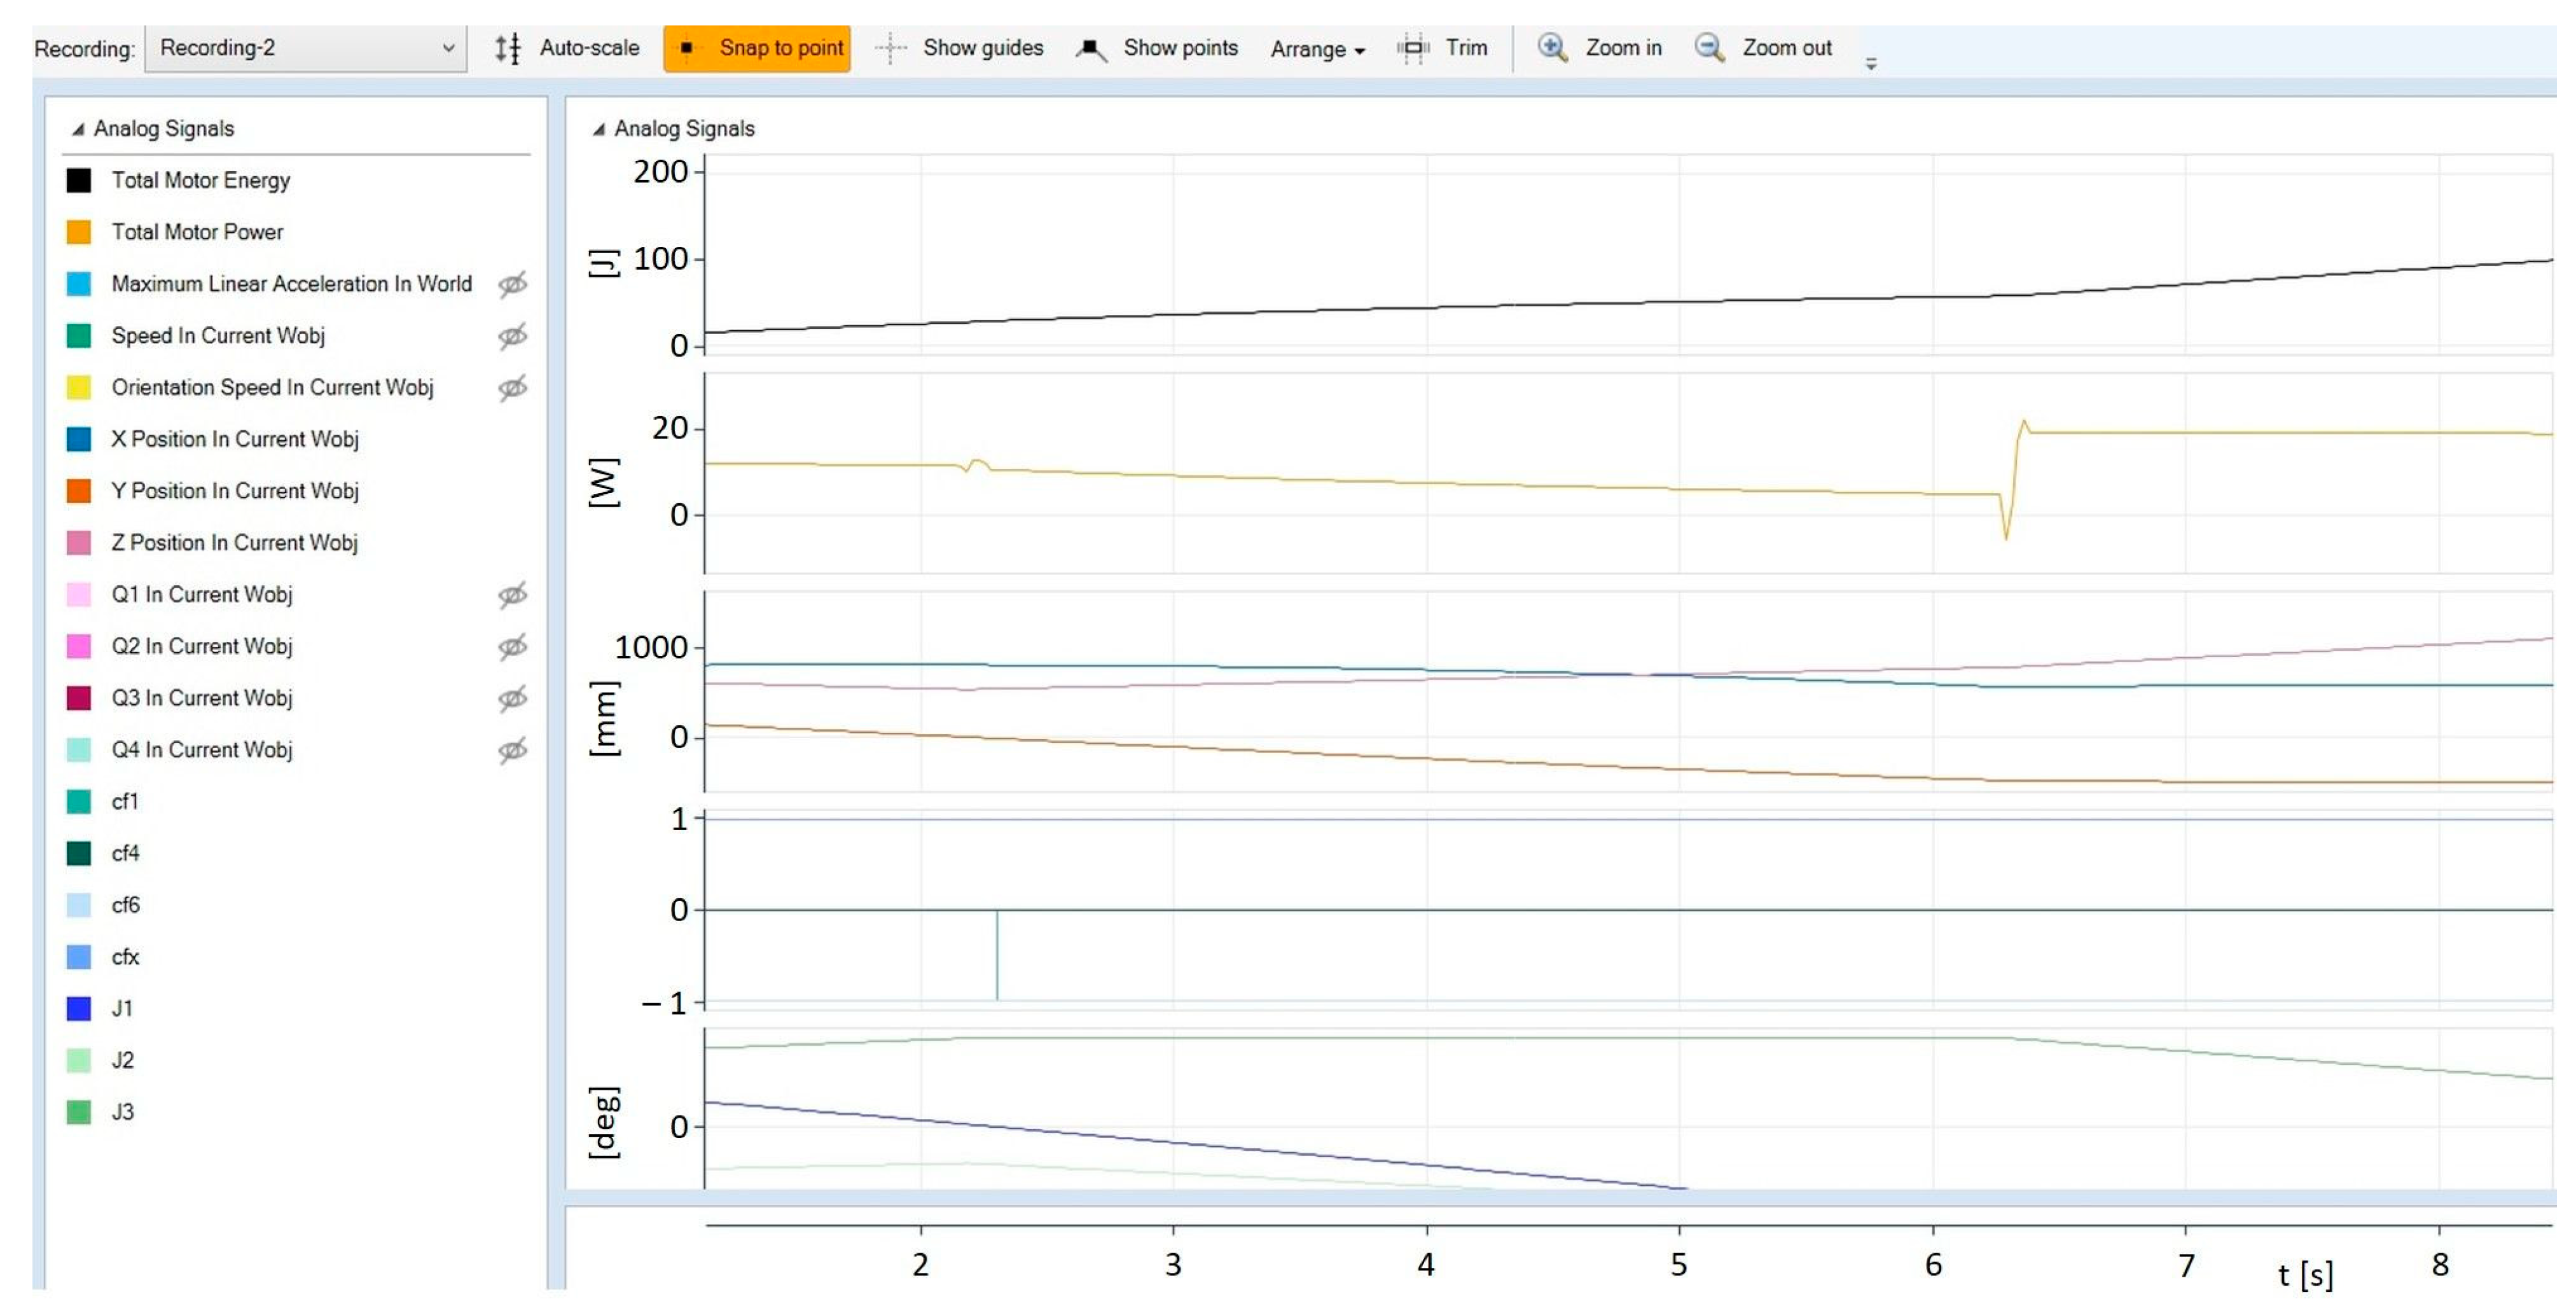
The change of the robot’s TCP point motion parameters, its monitoring and registration were carried out using RobotStudio software and the Signal Analyzer add-on. It is a tool that allows for recording a series of defined values at a speed of 40 times per second. The values of recorded parameters can be observed online in the scaled graphs or saved as text files or *.xls files. An example of the application window is presented in
Figure 3.
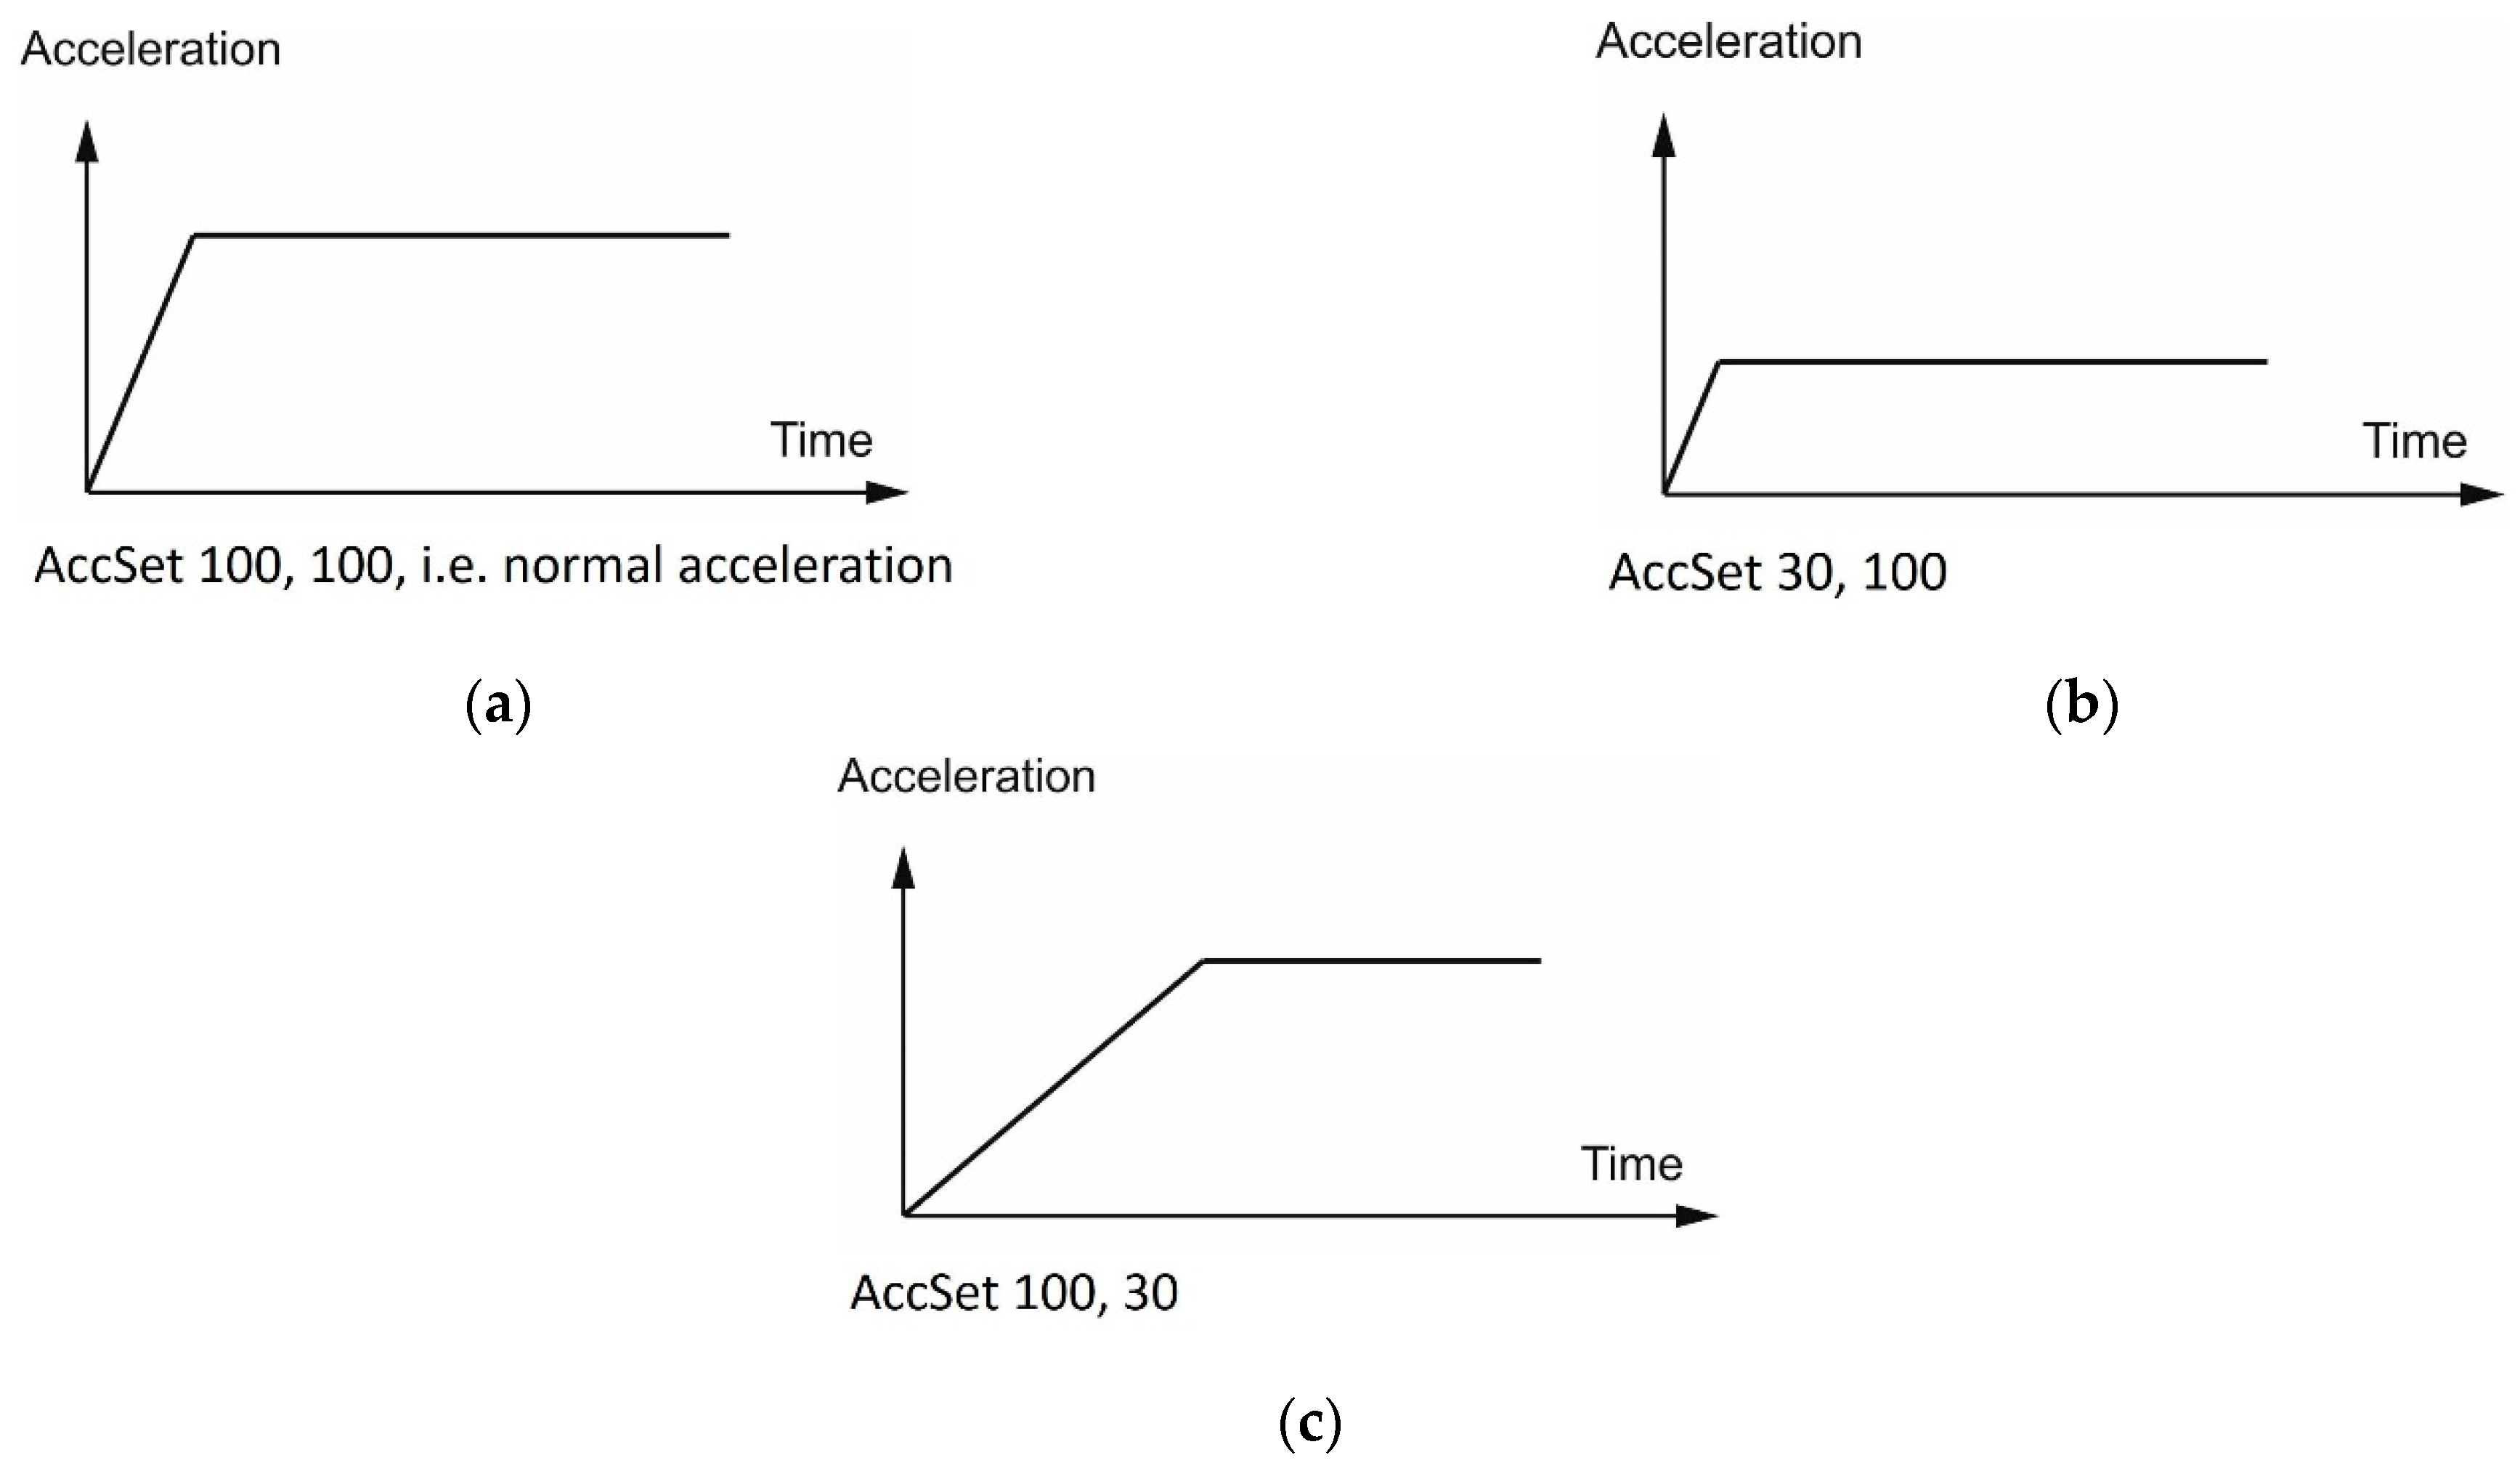
Defining accelerations and decelerations in the RAPID language is possible by defining the percentage value of acceleration and the percentage value of the increase of acceleration. The method of changing the accelerations set by the AccSet function is presented in
Figure 4.
Figure 4a shows nominal acceleration values, at a maximum for a given station structure. Percentage change of their values is possible, e.g., by using the AccSet function with parameters. The first parameter corresponds to the limitation of the nominal acceleration value as a percentage. In
Figure 4b, for example, the acceleration value is reduced to 30% of the maximum acceleration value. The second parameter corresponds to the value of the speed of acceleration increase. In the example in
Figure 4c, the acceleration gain is limited to 30% of the standard value.
In the work on reducing energy consumption in programmed movement paths, the speed was increased by software, and the acceleration was limited to a constant time.
In the solution proposed in article [
2], the choice of parameters was made empirically. The invariable limitation adopted was the path execution time. Acceleration was minimized, and speed was increased until the process was no longer feasible. The most common limitation here was the minimum acceleration value of the robot.
Figure 2 shows a simple example of how it influenced the energy consumption. The same was done for all traffic stages in the real station. The conducted work allowed for reducing the value of consumed energy by 15% while maintaining the process time below 15 min. The proposed method of signal analysis and parameter changes allowed for a 15% reduction in energy consumption by a real robotic station while maintaining the same process execution time. It is worth paying attention to the economic aspect of the cited work, which over a wide time horizon brings significant financial benefits.
3.2. Test Signal Viewer
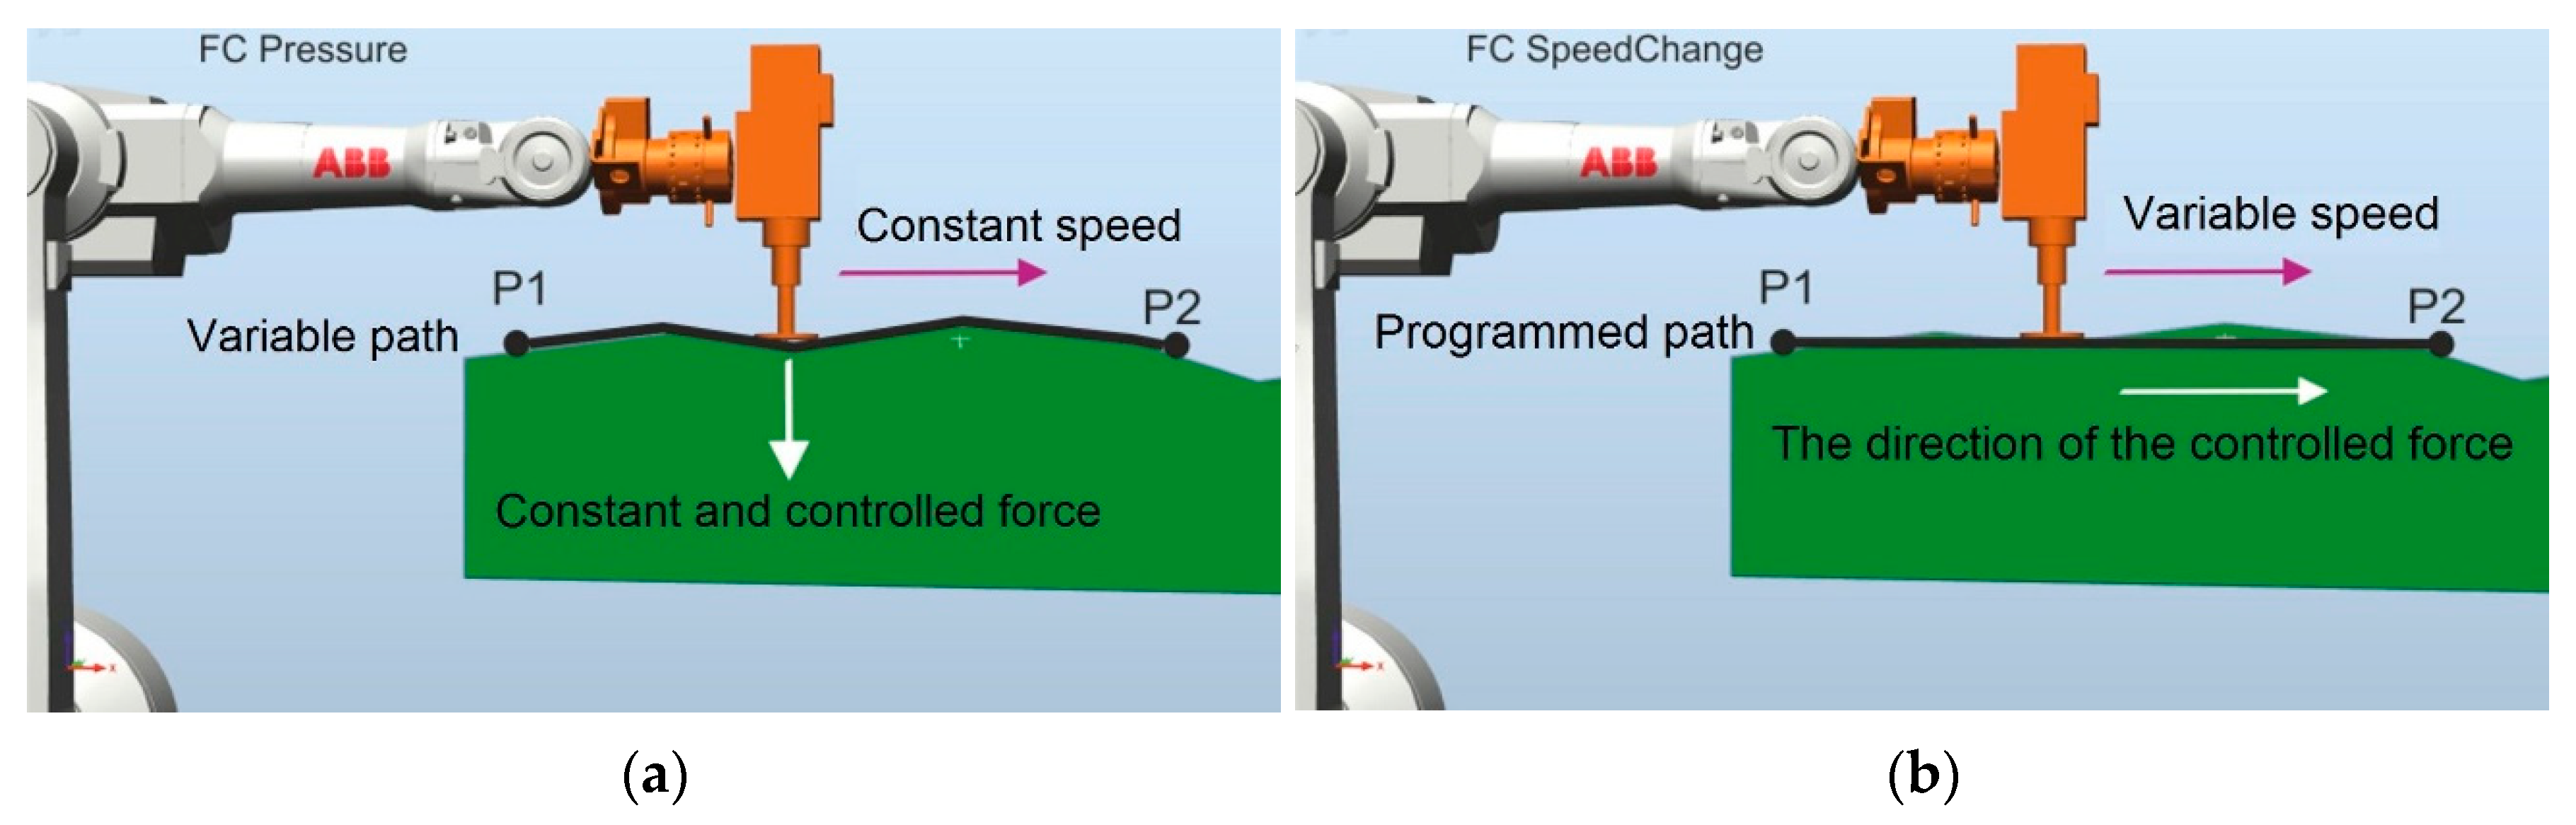
The Test Signal Viewer tool allows for selecting the parameters of force control systems. The use of the Force Control (FC) package allows controlling the force exerted by the tool on the workpiece. The use of such a solution enables the robot to interact with the environment by controlling the process using the strategy of FC Pressure or FC SpeedChange. The FC Pressure option enables polishing or grinding of elements with variable geometry (e.g., castings) while maintaining a constant pressure of the tool on the surface of the workpiece at a constant defined process speed. The idea of this solution is presented in
Figure 5a. The use of this function allows the material to be processed at a constant speed and control of the force perpendicular to the processed surface. The tool travel path follows the curvature of the surface.
The FC SpeedChange function (
Figure 5b) allows the casting to be machined or the machining allowances to be removed at a speed depending on the existing drag forces. The speed of movement of the robot’s TCP point is reduced by the control system when the forces occurring during machining exceed the assumed values. This avoids damage to the workpiece or tool from excessive stress and heat.
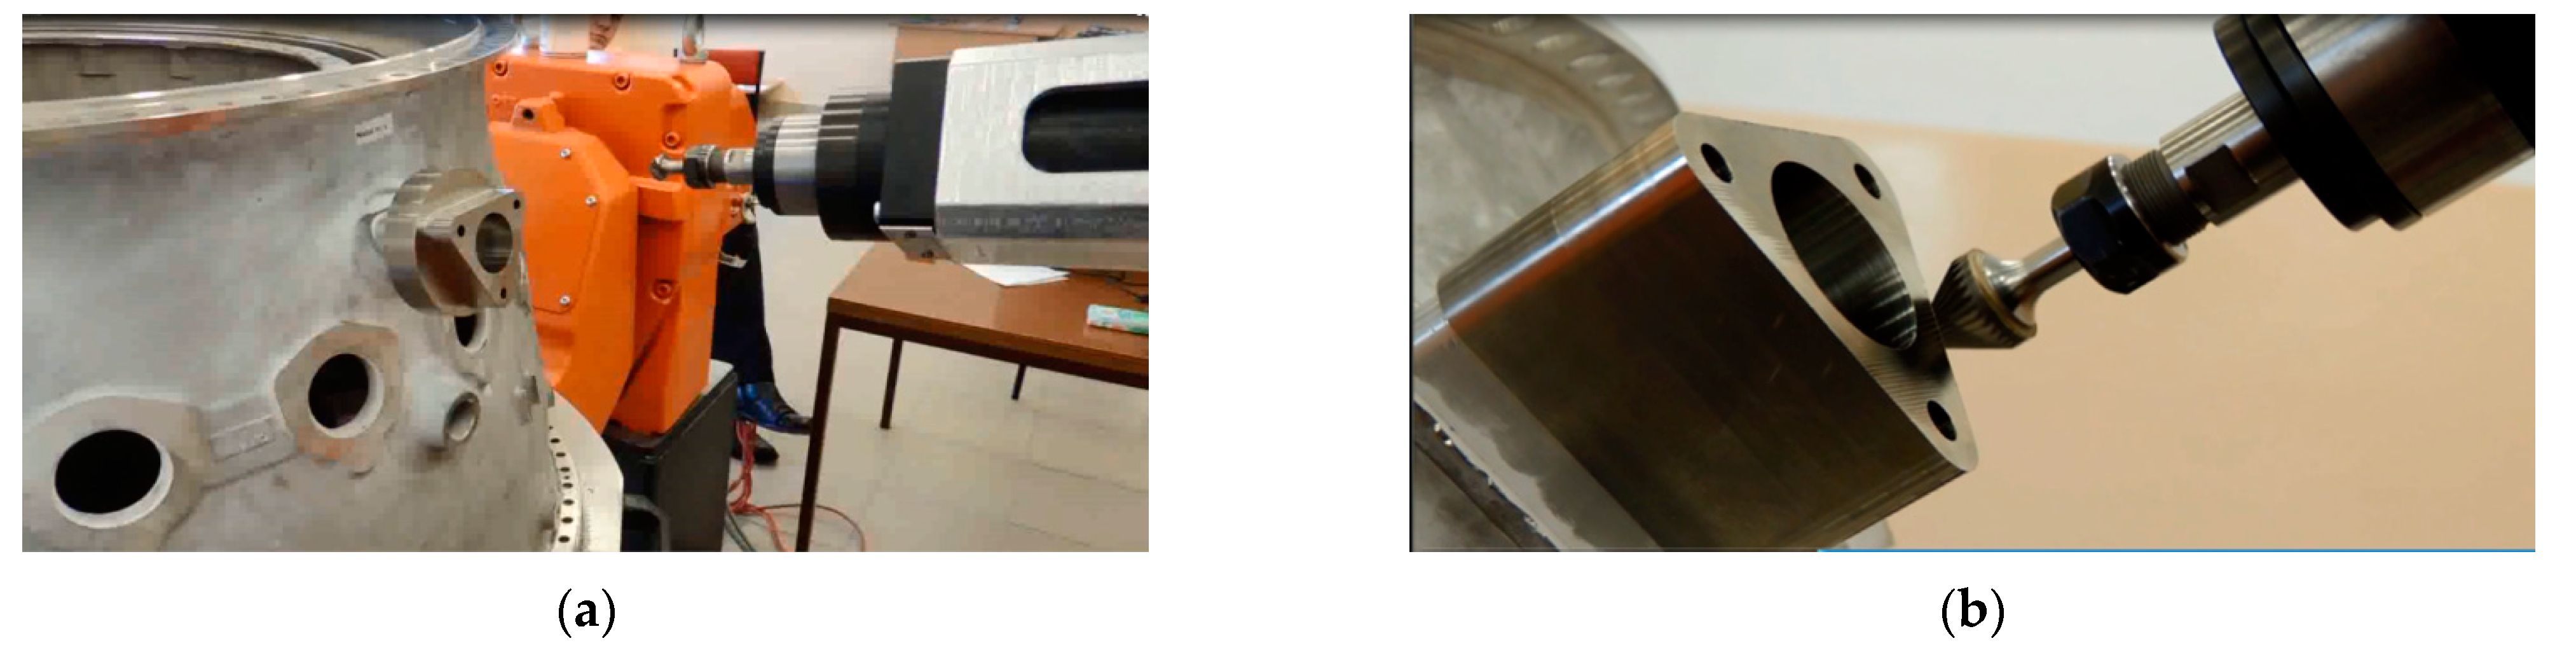
The use of the FCPressure add-on requires the determination of a number of parameters, such as Threshold %, Force Change Rate N/s, Damping-D %, the maximum waiting time for contact (Timeout s), the percentage of the set force with which the robot starts the process (Zero Contact Force %), and the level of filtration for the low-pass filter (Noise level Hz). Regarding parameters, the rate of speed change and the percentage of the set force with which the robot starts the process are correlated with the shape of the trajectory and are selected on the basis of research practice to date. The parameters of the coefficient of force growth and the damping were selected on the basis of the experiment, so that the beginning of the process was characterized by the lack of a cavity in the performed deburring and the resulting treated surface was smooth. The selection of these parameters is related to the type of material being processed as well as the type of tool used and the cutting parameters. Adopting the parameters of the force control system allows for starting testing work aimed at determining the process parameters such as the speed of the TCP point and the value of the contact force between the tool (cutter) and the workpiece. The software tool that allows for monitoring and analyzing the values of sensor forces in different reference systems at different speeds is the Test Signal Viewer software. This software was tested on the machining of parts having a randomly changing shape (the solidification process of the detail introduces a random change of geometry to some extent). This treatment is related to the processing and determination of suboptimal values of the damping factor and the force increase factor. In the research work, the forces and speed of movement of the TCP point were searched for, ensuring the execution of edge deburring within the limits defined by the technological requirements imposed by the PWA 360 standard by Pratt and Whitney. For the tests, a V2500 engine compressor casting made of Inconell 718 was used as a demonstrator. One of the casting elements was selected, namely the so-called triangle-shaped nabe with rounded tips, and the tool used was a multi-flute conical cutter. Photos of the research work are presented in
Figure 6.
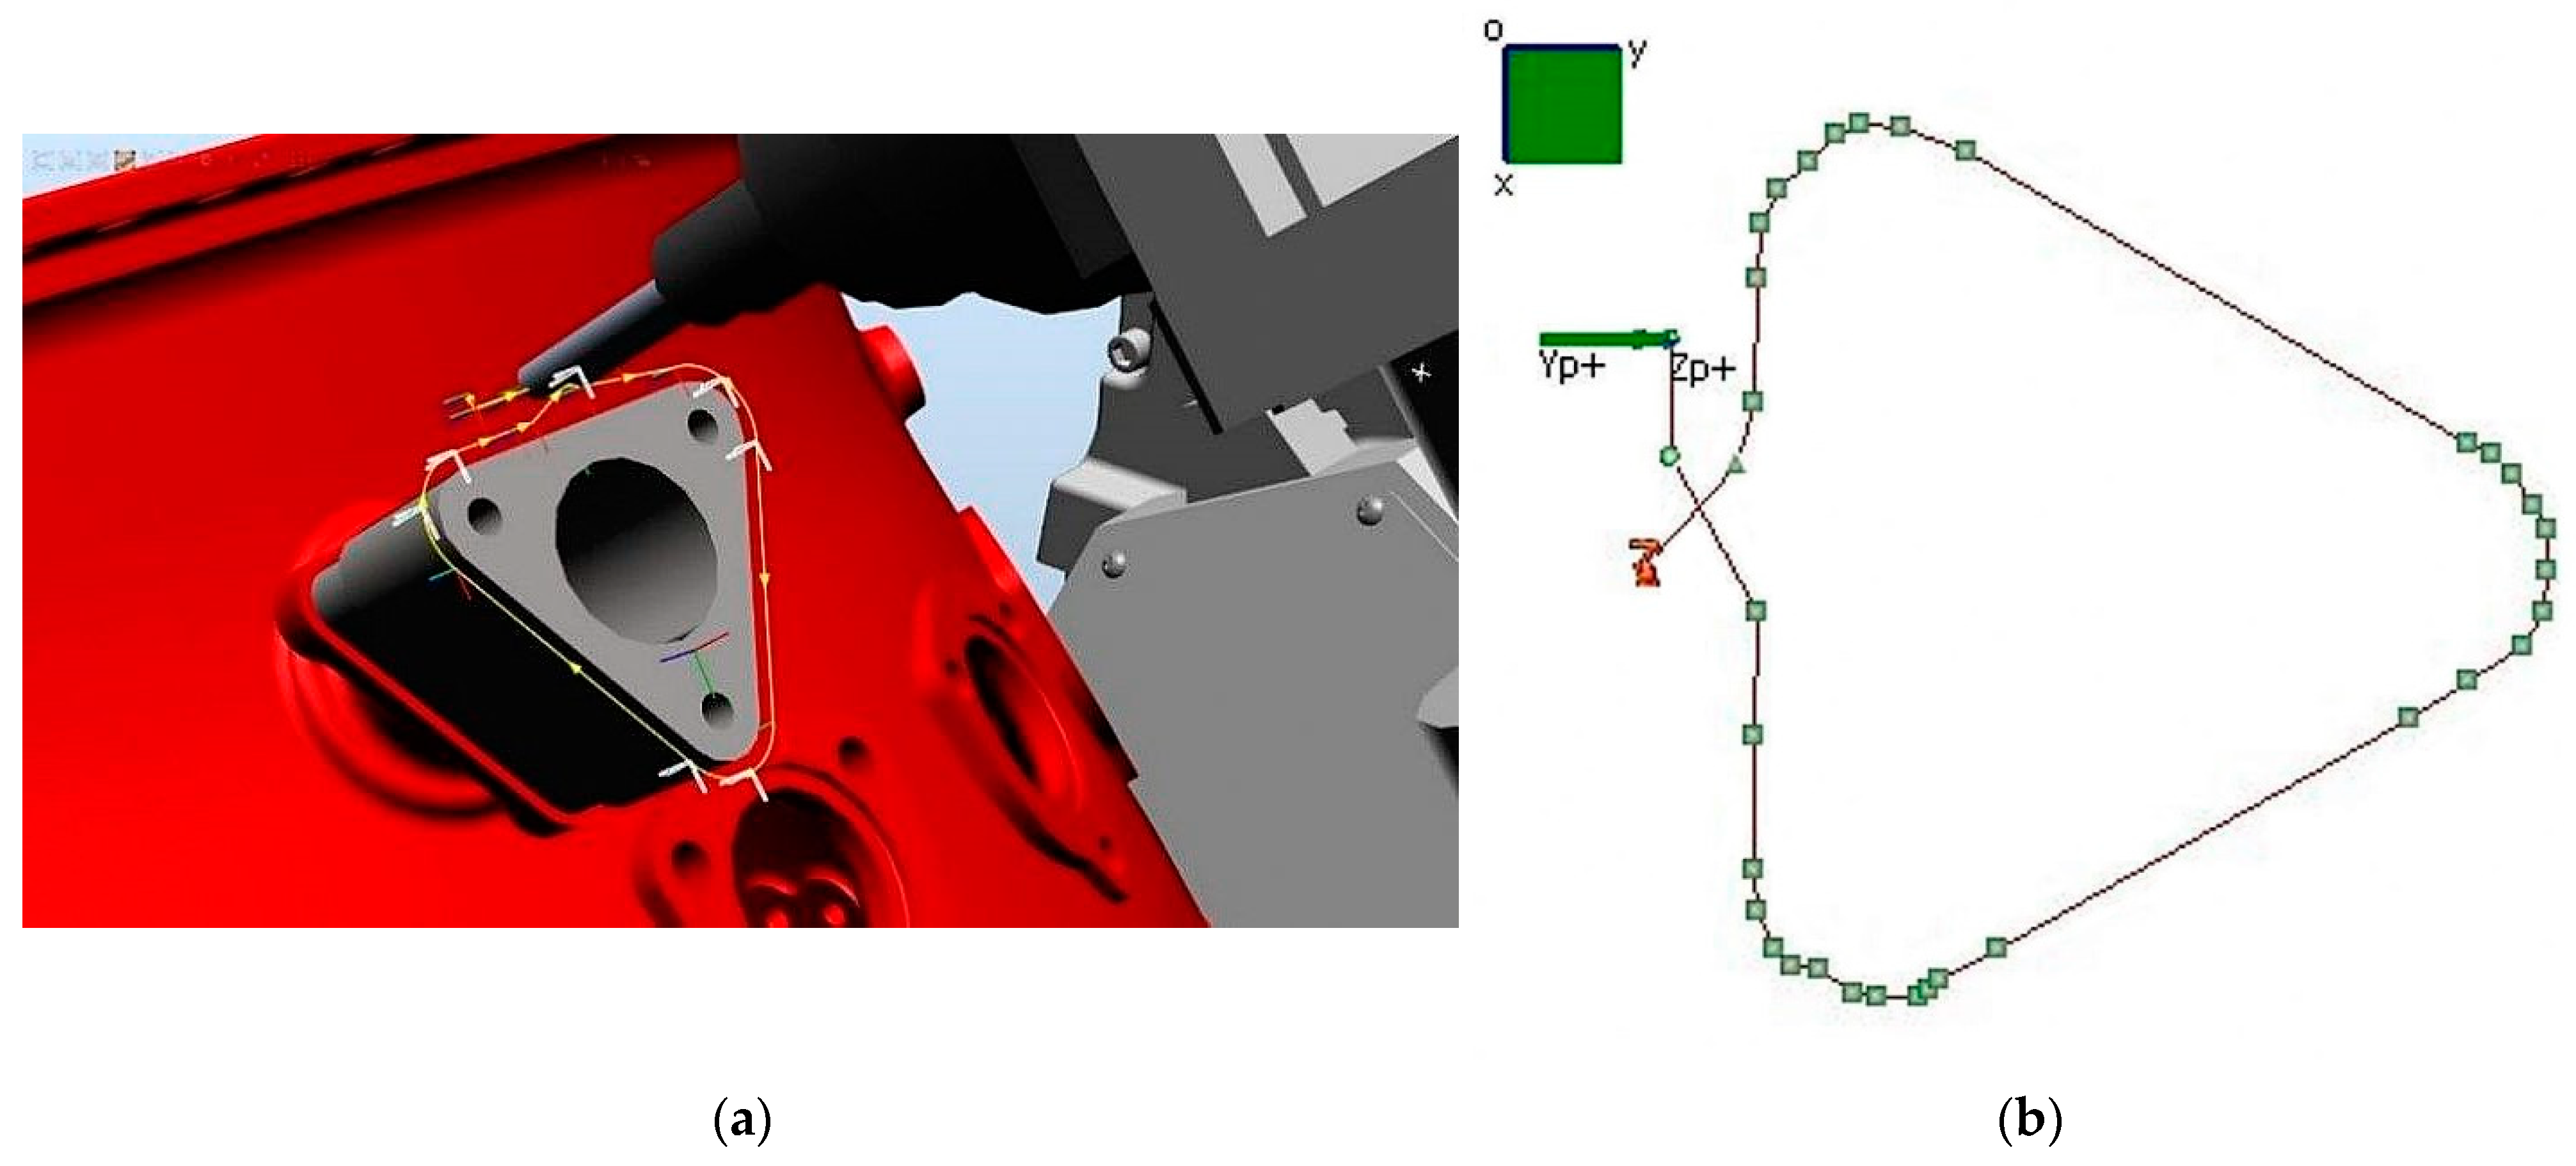
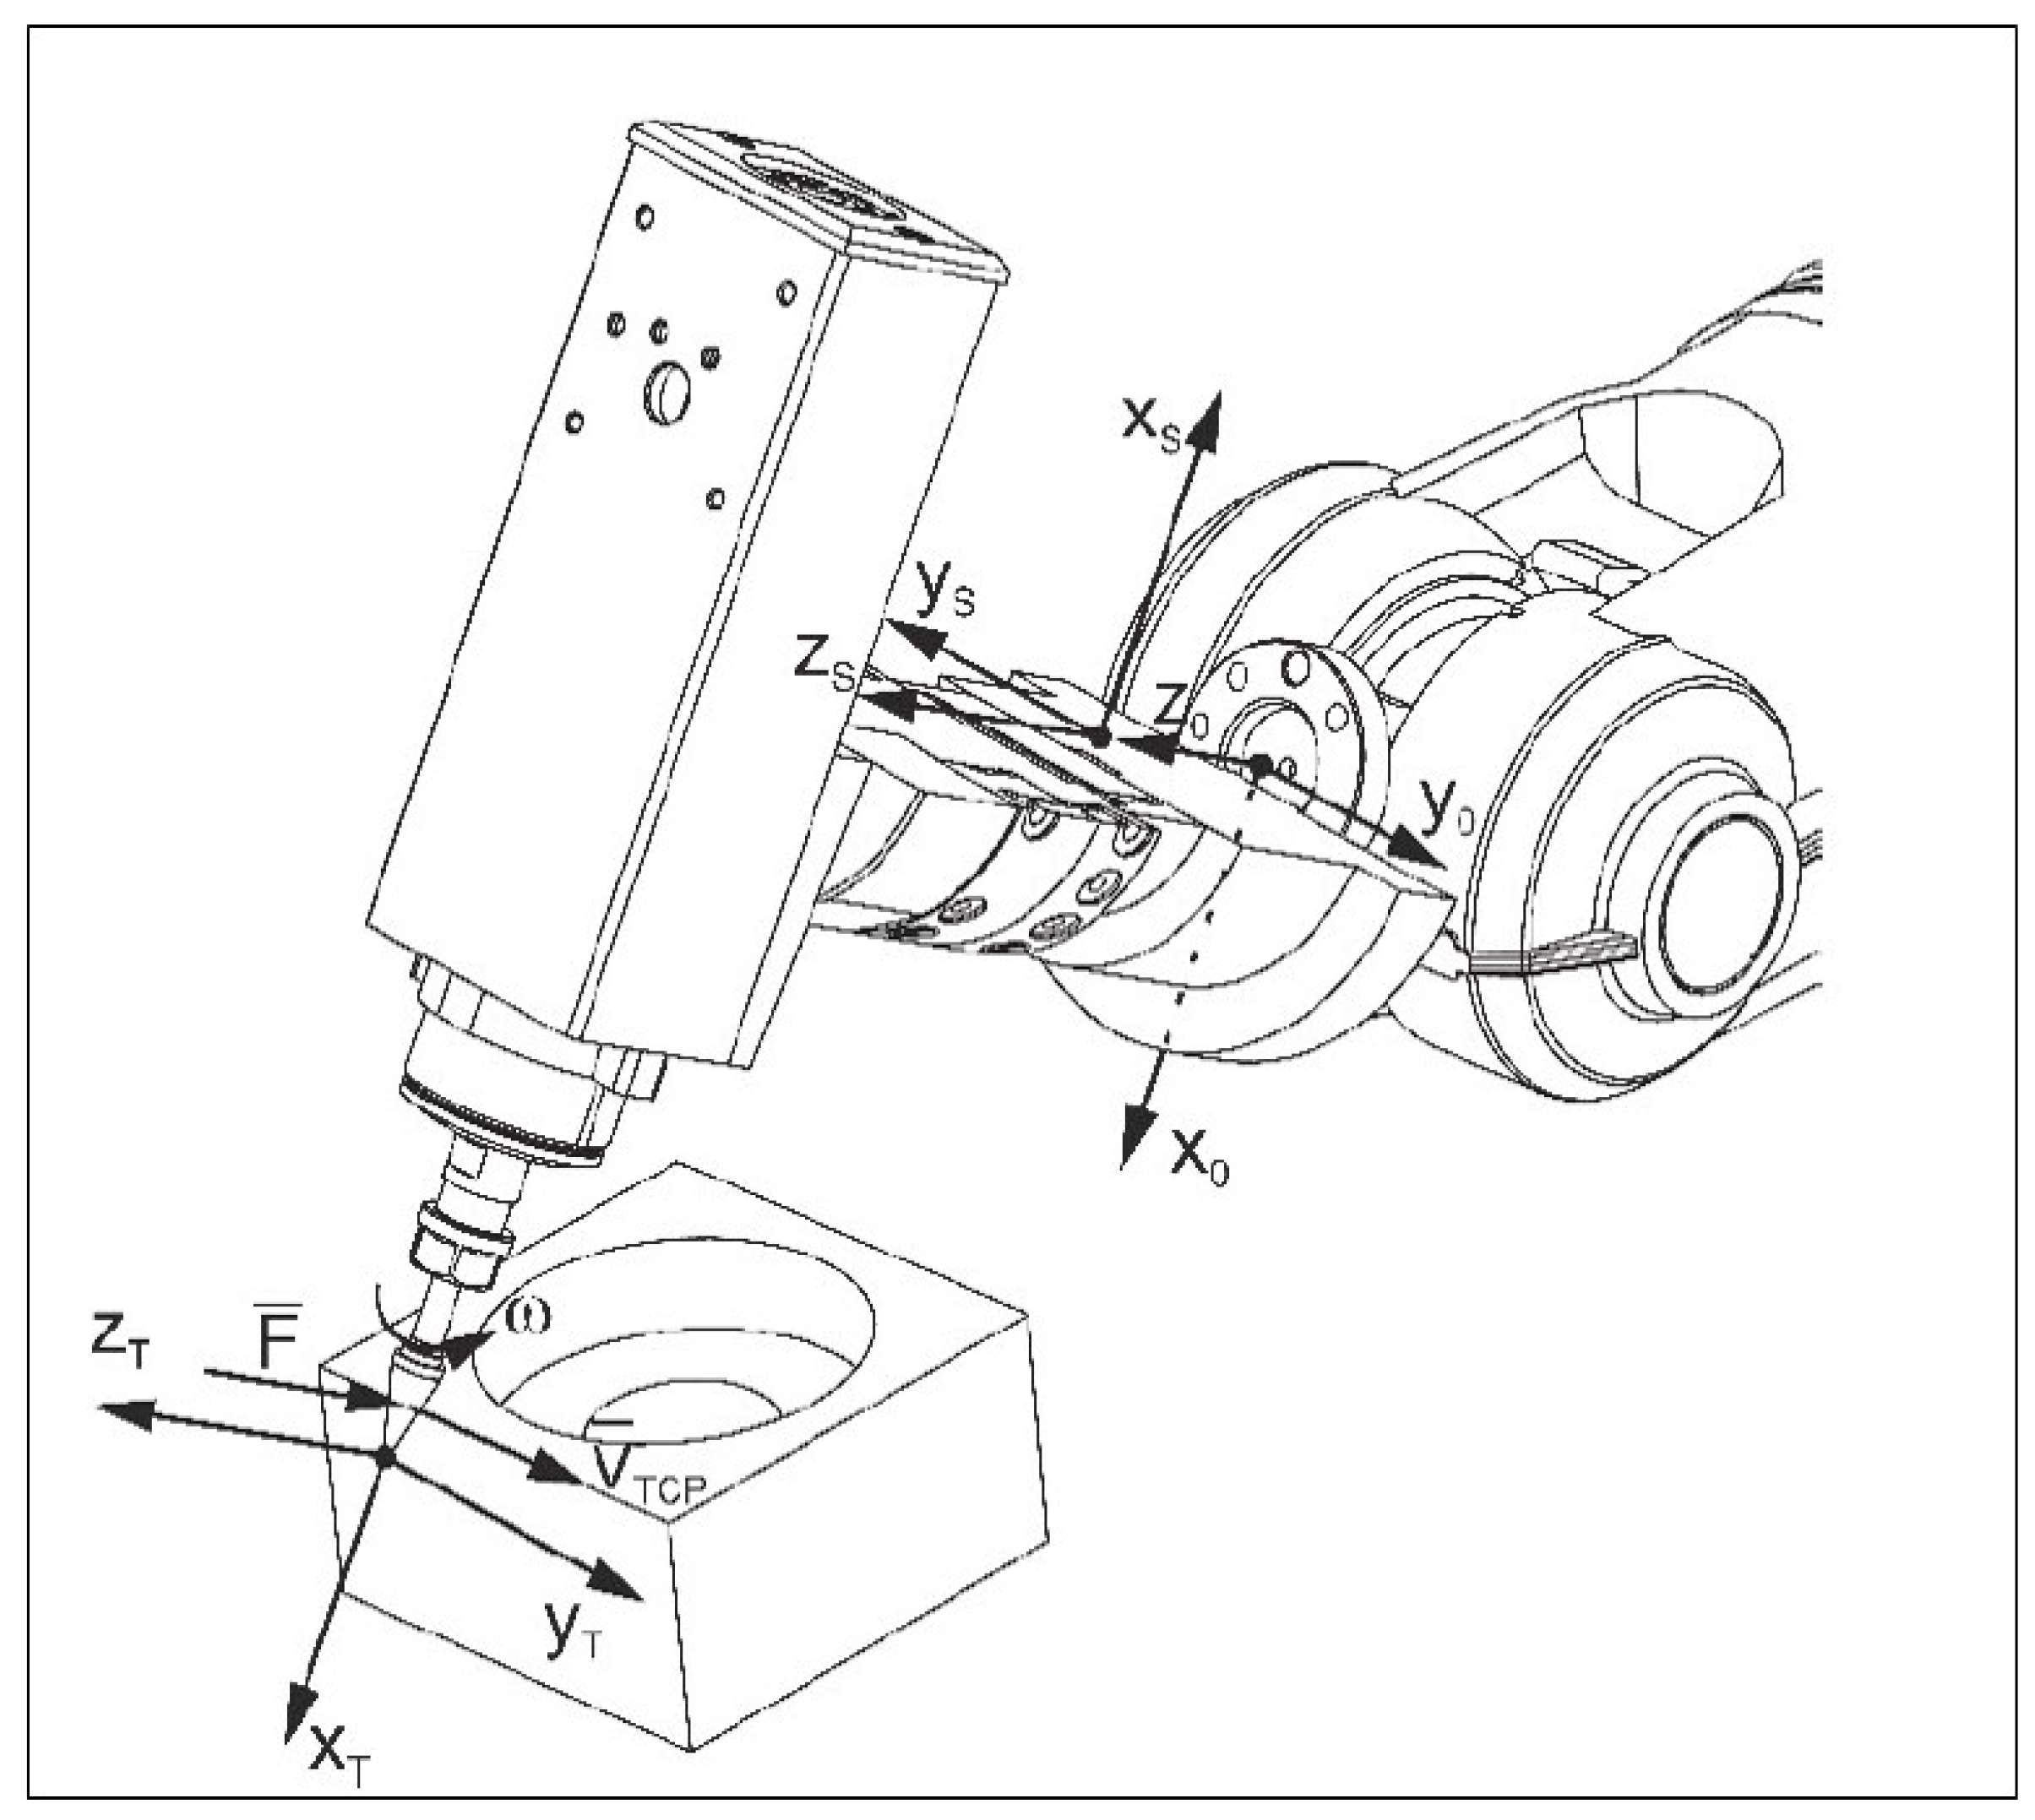
Figure 7a shows the path followed by the robot’s TCP point and the system of the adopted reference system in the force control process (
Figure 7b).
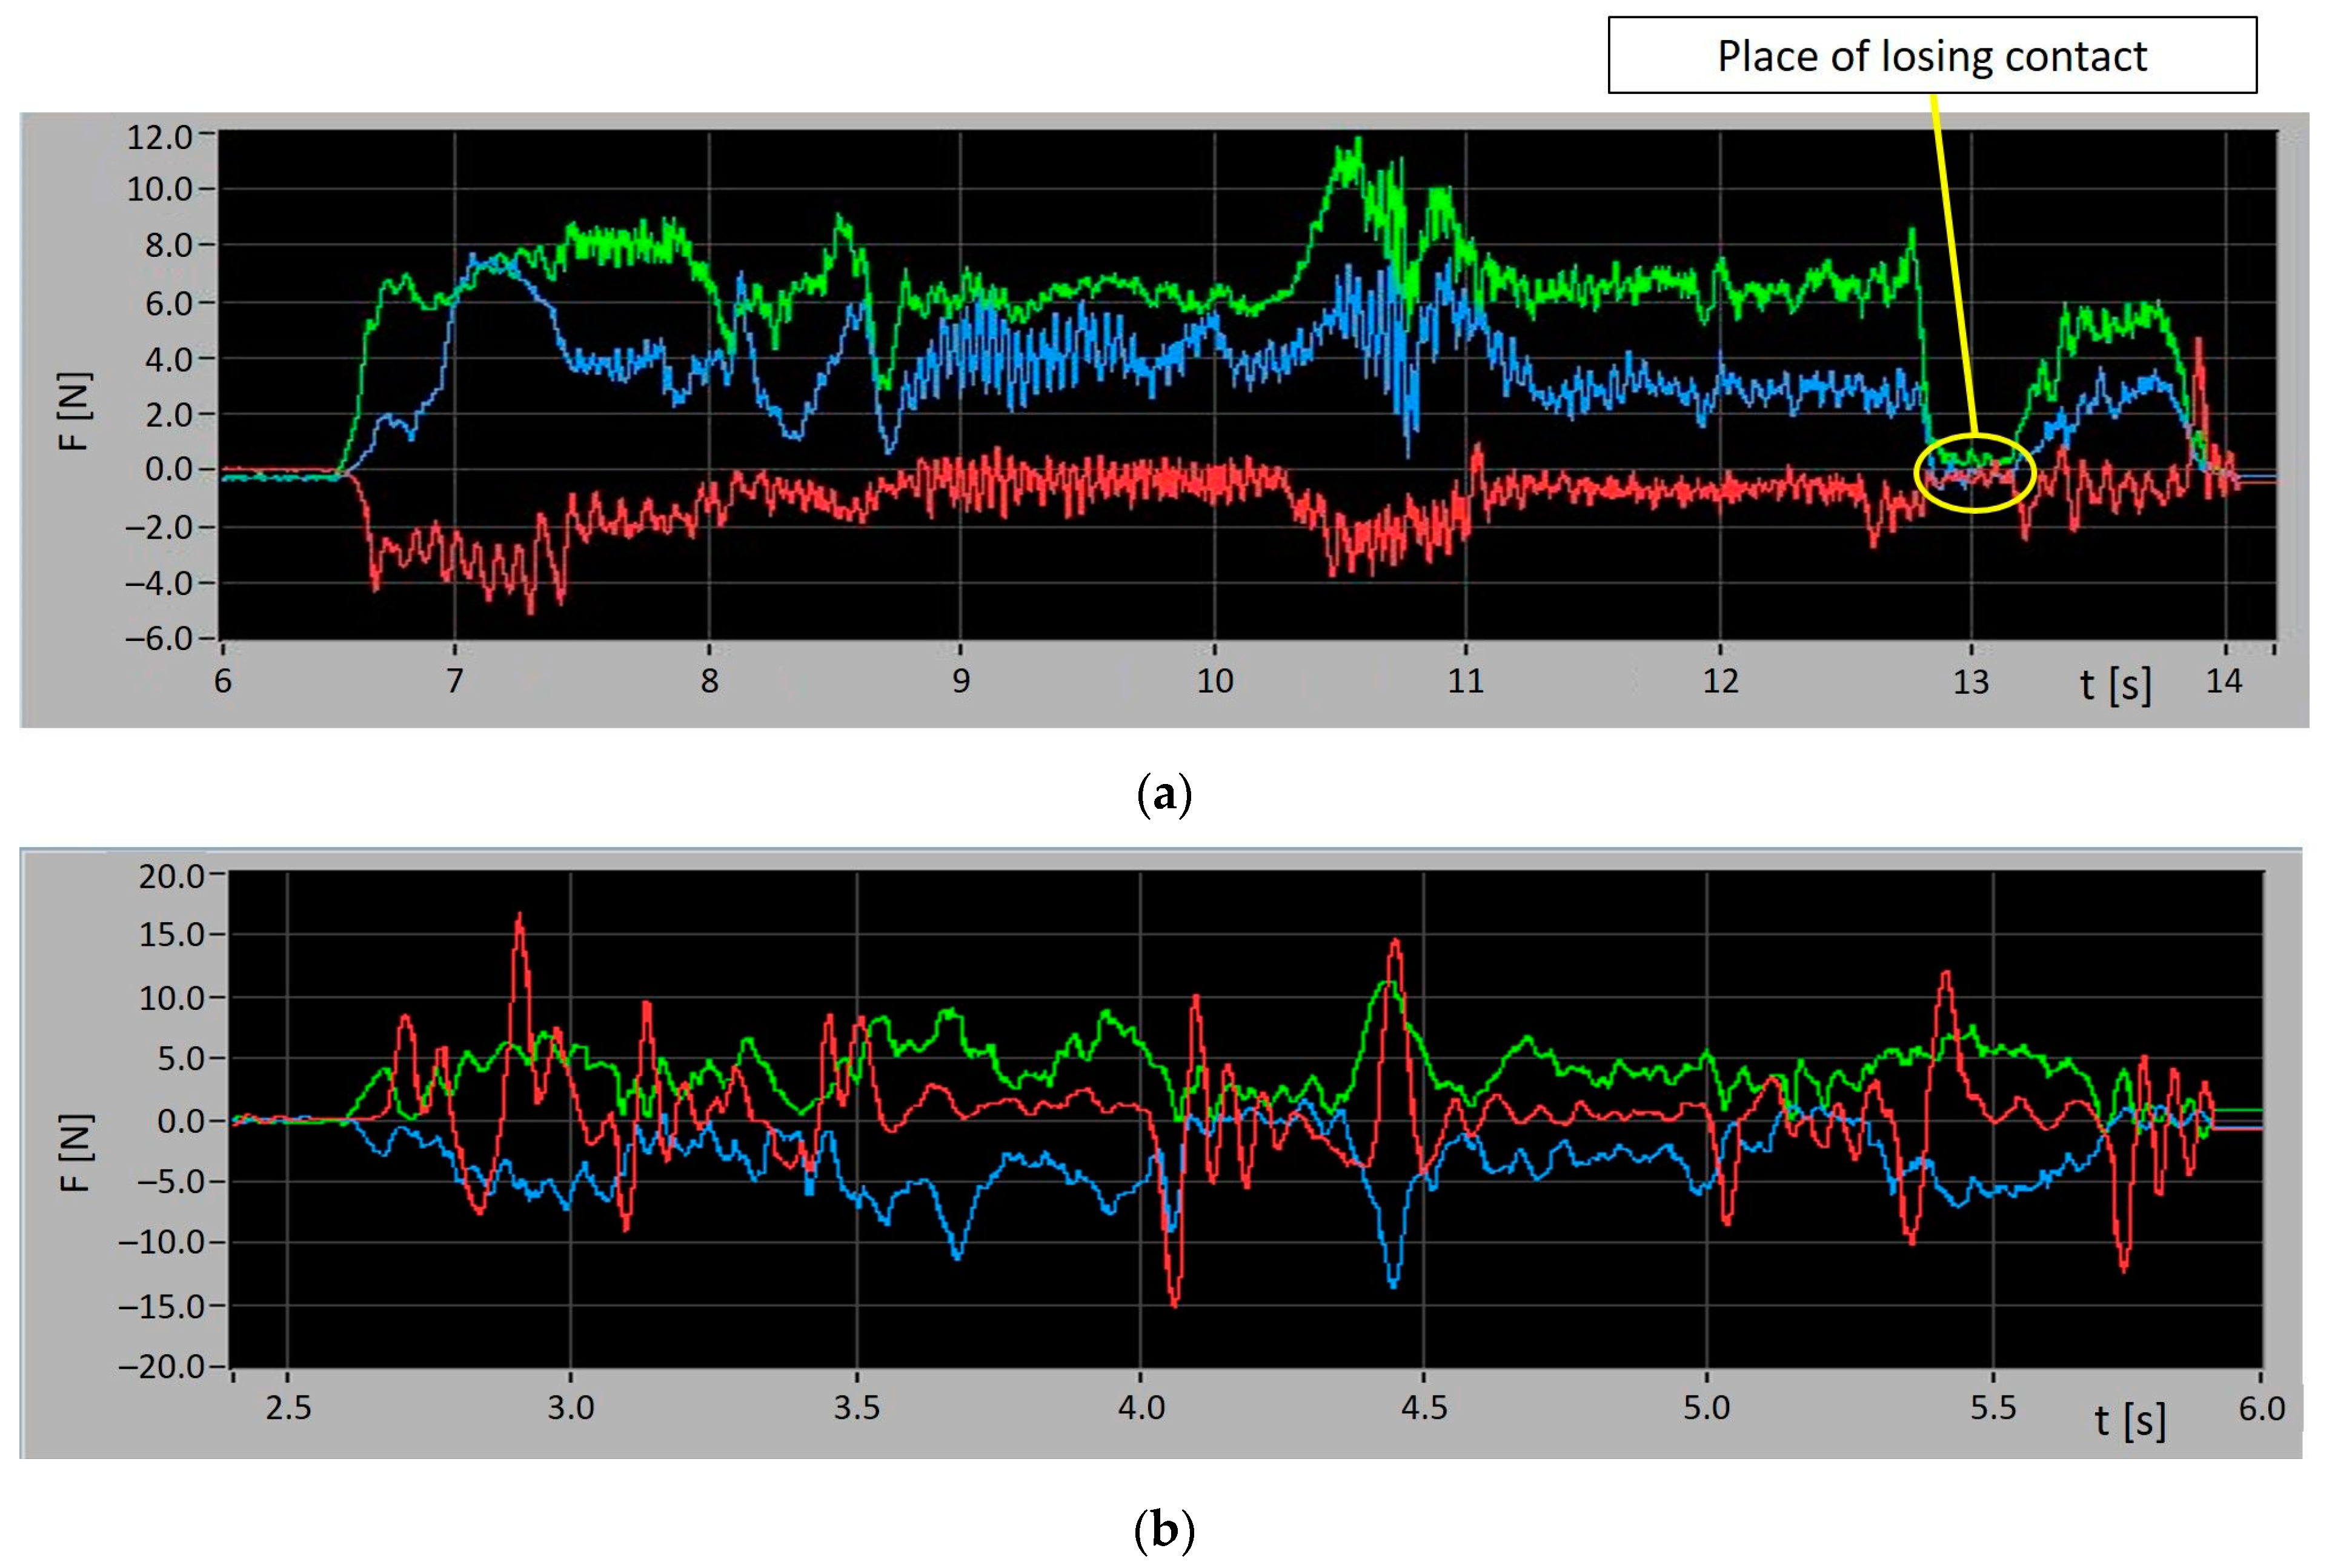
The problem of loss of force control was encountered during the research work (
Figure 8a). The manufacturer states that the tool works from the value of the controlled force at the level of 1 N in the Z axis.
For the workpiece, when executing the trajectory along the path (force control in the Z axis of the tool) at the last third turn (
Figure 8a), the force control stops working properly. The disturbance of the force control package occurred at the set force of 2 N, and the gradual increase of the feed force minimizes this effect [
24].
Figure 8a shows the effect of the decrease in the value of the forces between the tool and the workpiece while moving along a triangular path and
Figure 8b shows what the correct trajectory should look like.
It was noticed that the correctness of the performed machining depends on the shape of the surface, and above all, the speed of the TCP point and the contact force. For the defined motion path and the set speed, it was necessary to define the minimum parameters of using the FC Pressure software feature. As a result of the research work, internal documentation was created, specifying for which tools and materials what minimum debris values can be obtained with the use of a robot with the force control software. The entire document was developed as a result of testing and monitoring parameters using the Test Signal Viewer software.
The paper [
14] includes optimization of parameters in terms of the width of the deburring performed and the quality of the surface. As an indicator of quality, the sum of squares of lapses relative to the nominal value was proposed, which informs how much error was made in the execution of the deburring. To assess the rate of the shape change (surface quality), an indicator was introduced in the form of the maximum value of the derivative of the function describing the shape change.
For this purpose, the deviation from the nominal value was discretized with a set of points. The obtained points were approximated by a third-degree spline function using Matlab/Simulink software. The generated function was then used to determine the proposed quality indicators. The sum of squares of the lapses and the maximum absolute value of the derivative of the error function were used as quality indicators. Juxtaposition of the obtained indicator values allowed for the selection of suboptimal parameters. The resulting parameters in the form of the value of the tool–workpiece contact force and the speed of the TCP at a given nominal value of tool rotation were adopted as the best solution from the available set of solutions. A detailed description of the conducted research is included in [
14].
The second problem defined above concerns the selection of the damping and the speed of the force increase. It is related to the quality of the machined surface. As a result of the research work, the indicated parameters were determined for the analyzed diffuser machining process. The experiment consisted in driving along one of the rectangular edges of the sample with a given contact force and recording the force value with variable parameters of the force control system. The course of the experiment is shown in the diagram in
Figure 9.
In the first step, the influence of the damping coefficient D on the stabilization of the set force for different values of forces was investigated [
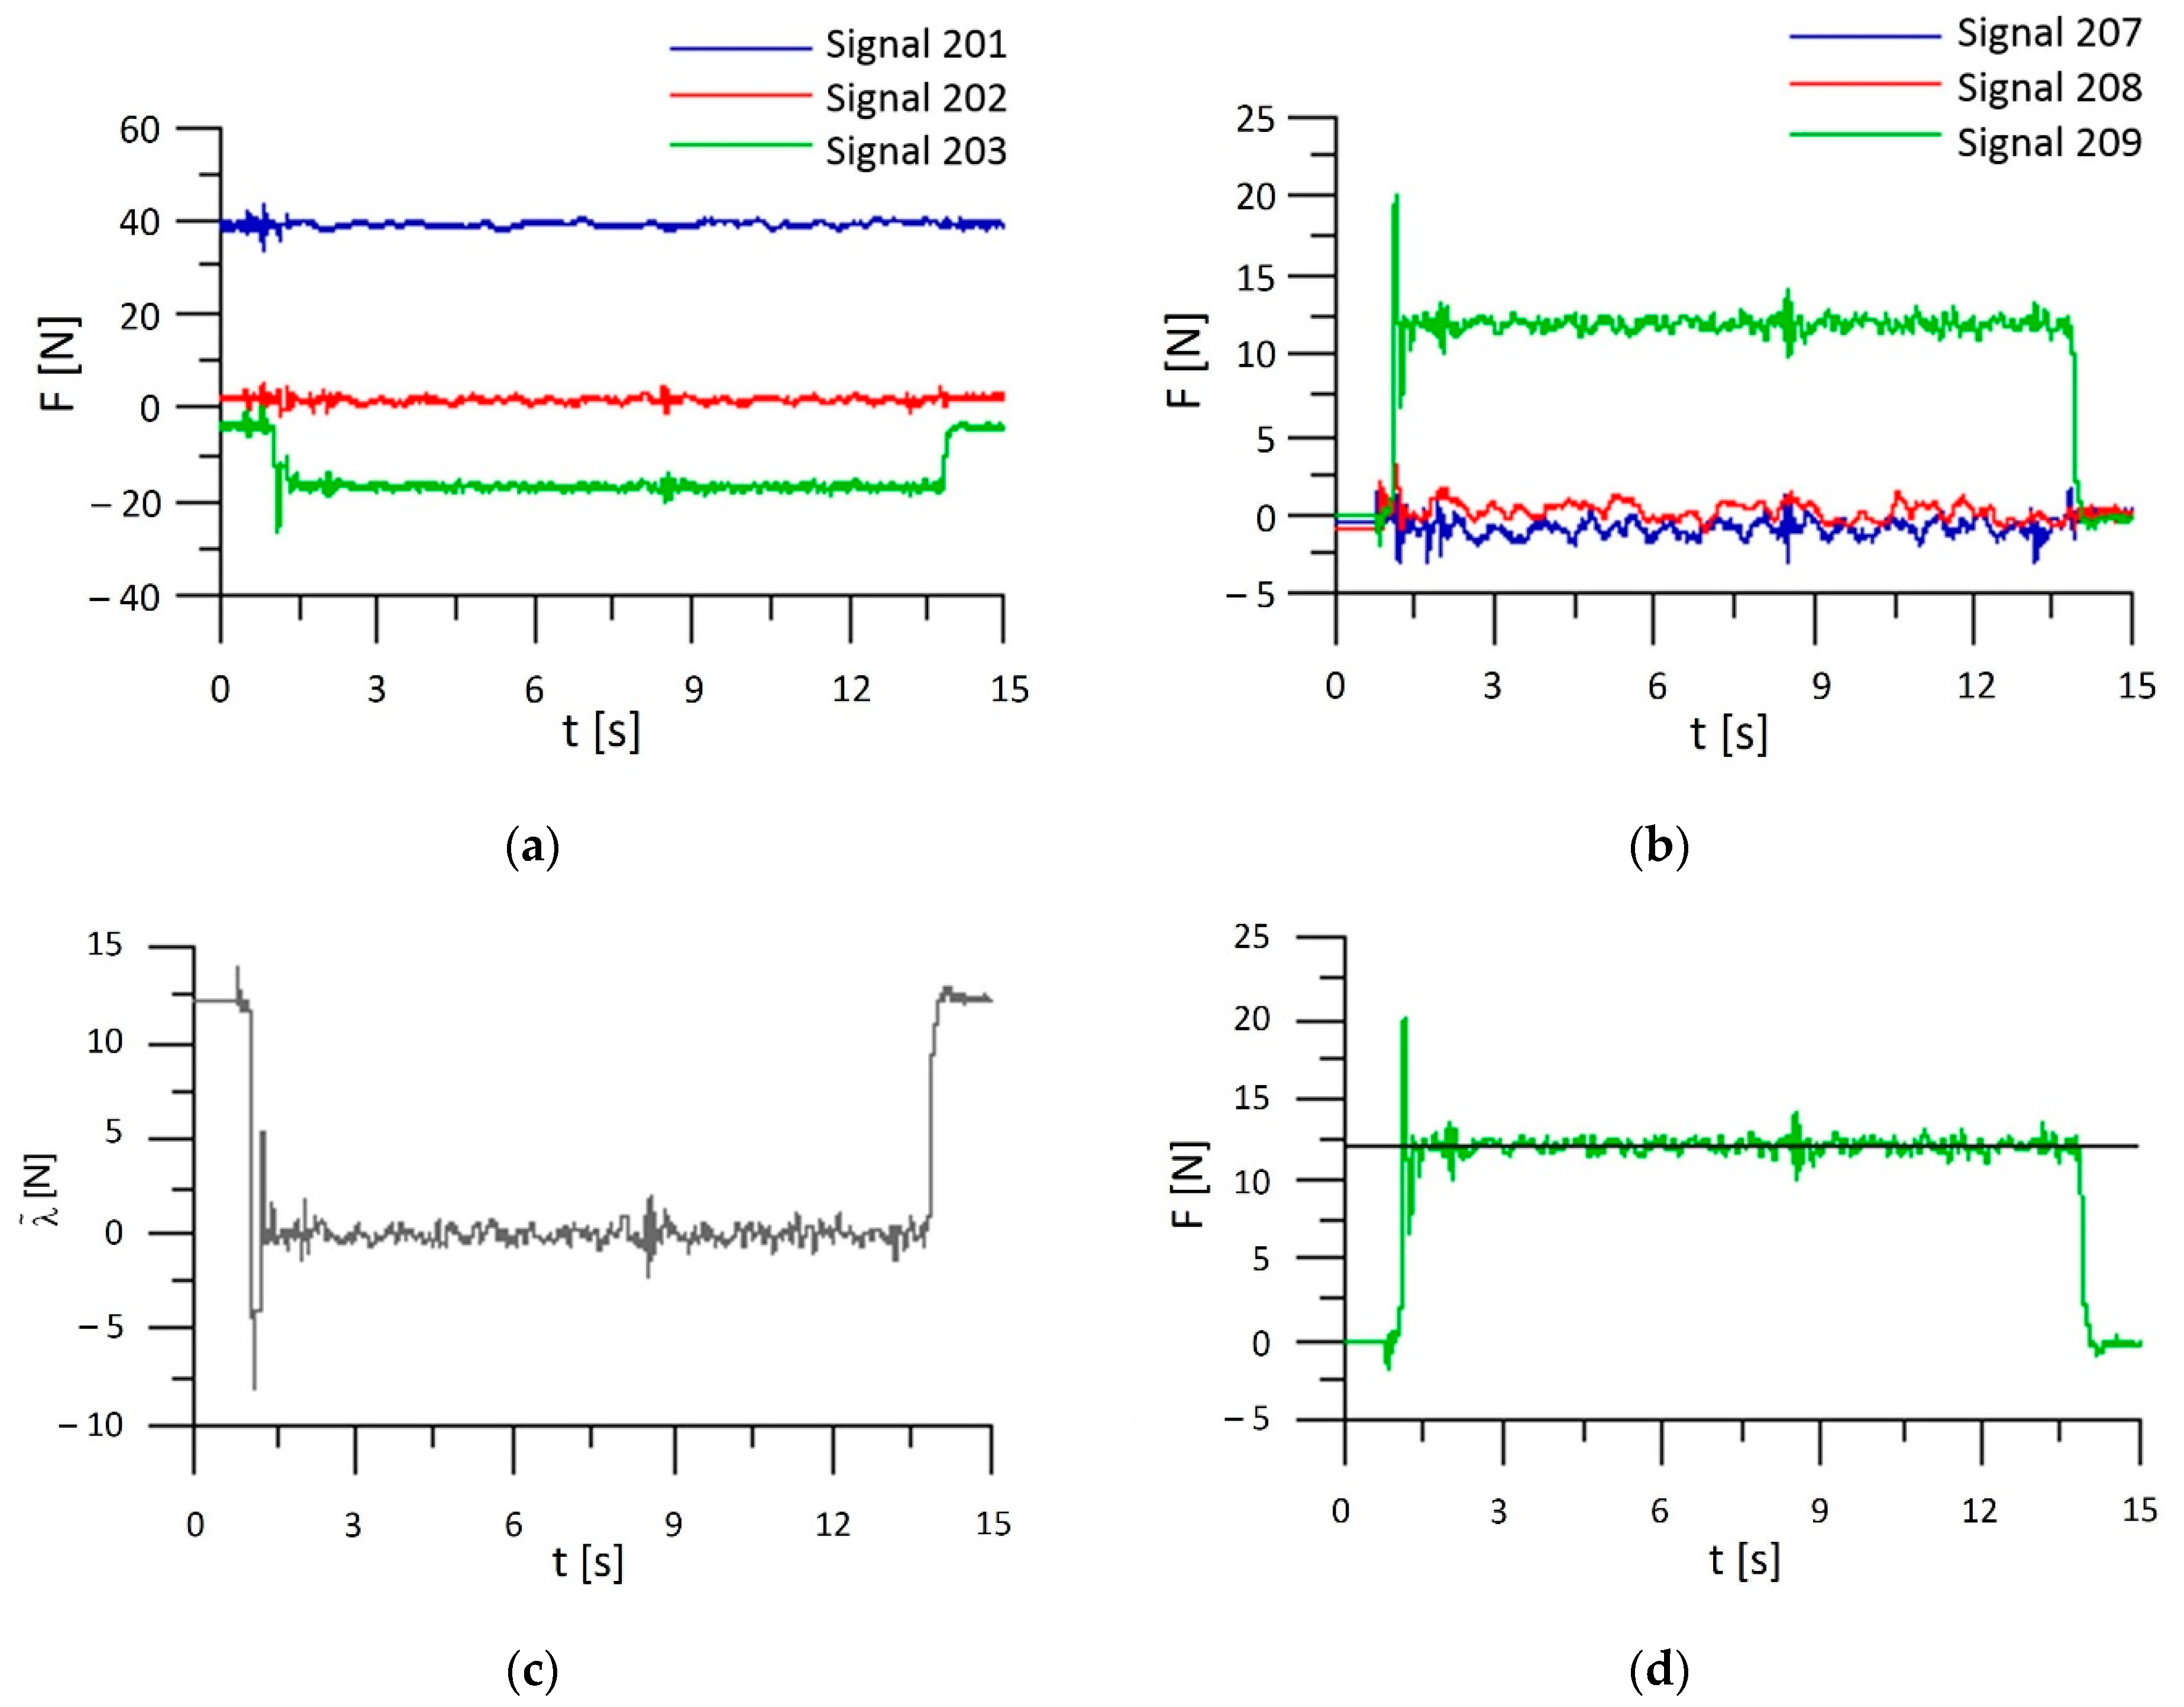
25]. In the ABB documentation, the damping coefficient D is a definition of how large a contact force is required for the robot to move at a certain speed. The signals from the force sensor were recorded using the ABB Signal Test Viewer software, additionally exporting the recorded measurements to Matlab software in order to determine RMS errors. An example of a measurement chart is shown in
Figure 10.
Figure 10 shows that the signal 209 (related to the direction of the Z axis) along the entire trajectory oscillated around a force command value of 12 N. This value is close to the reference value in this example test. It should be noted that in the initial phase of the robot’s contact with the environment, there was a noticeable overshoot of signal 209 to a value close to 17.5 N. The force error diagram shows that throughout the entire measurement, when the manipulator tool was in contact with the workpiece, the force error diagram had quite large oscillations (error values of 2 N and the RMSE value of 1.873567). The second part of the experiment consisted in making and analyzing the measurements with regard to the value of the speed of force changes. A number of tests were performed. An example of a test is presented in
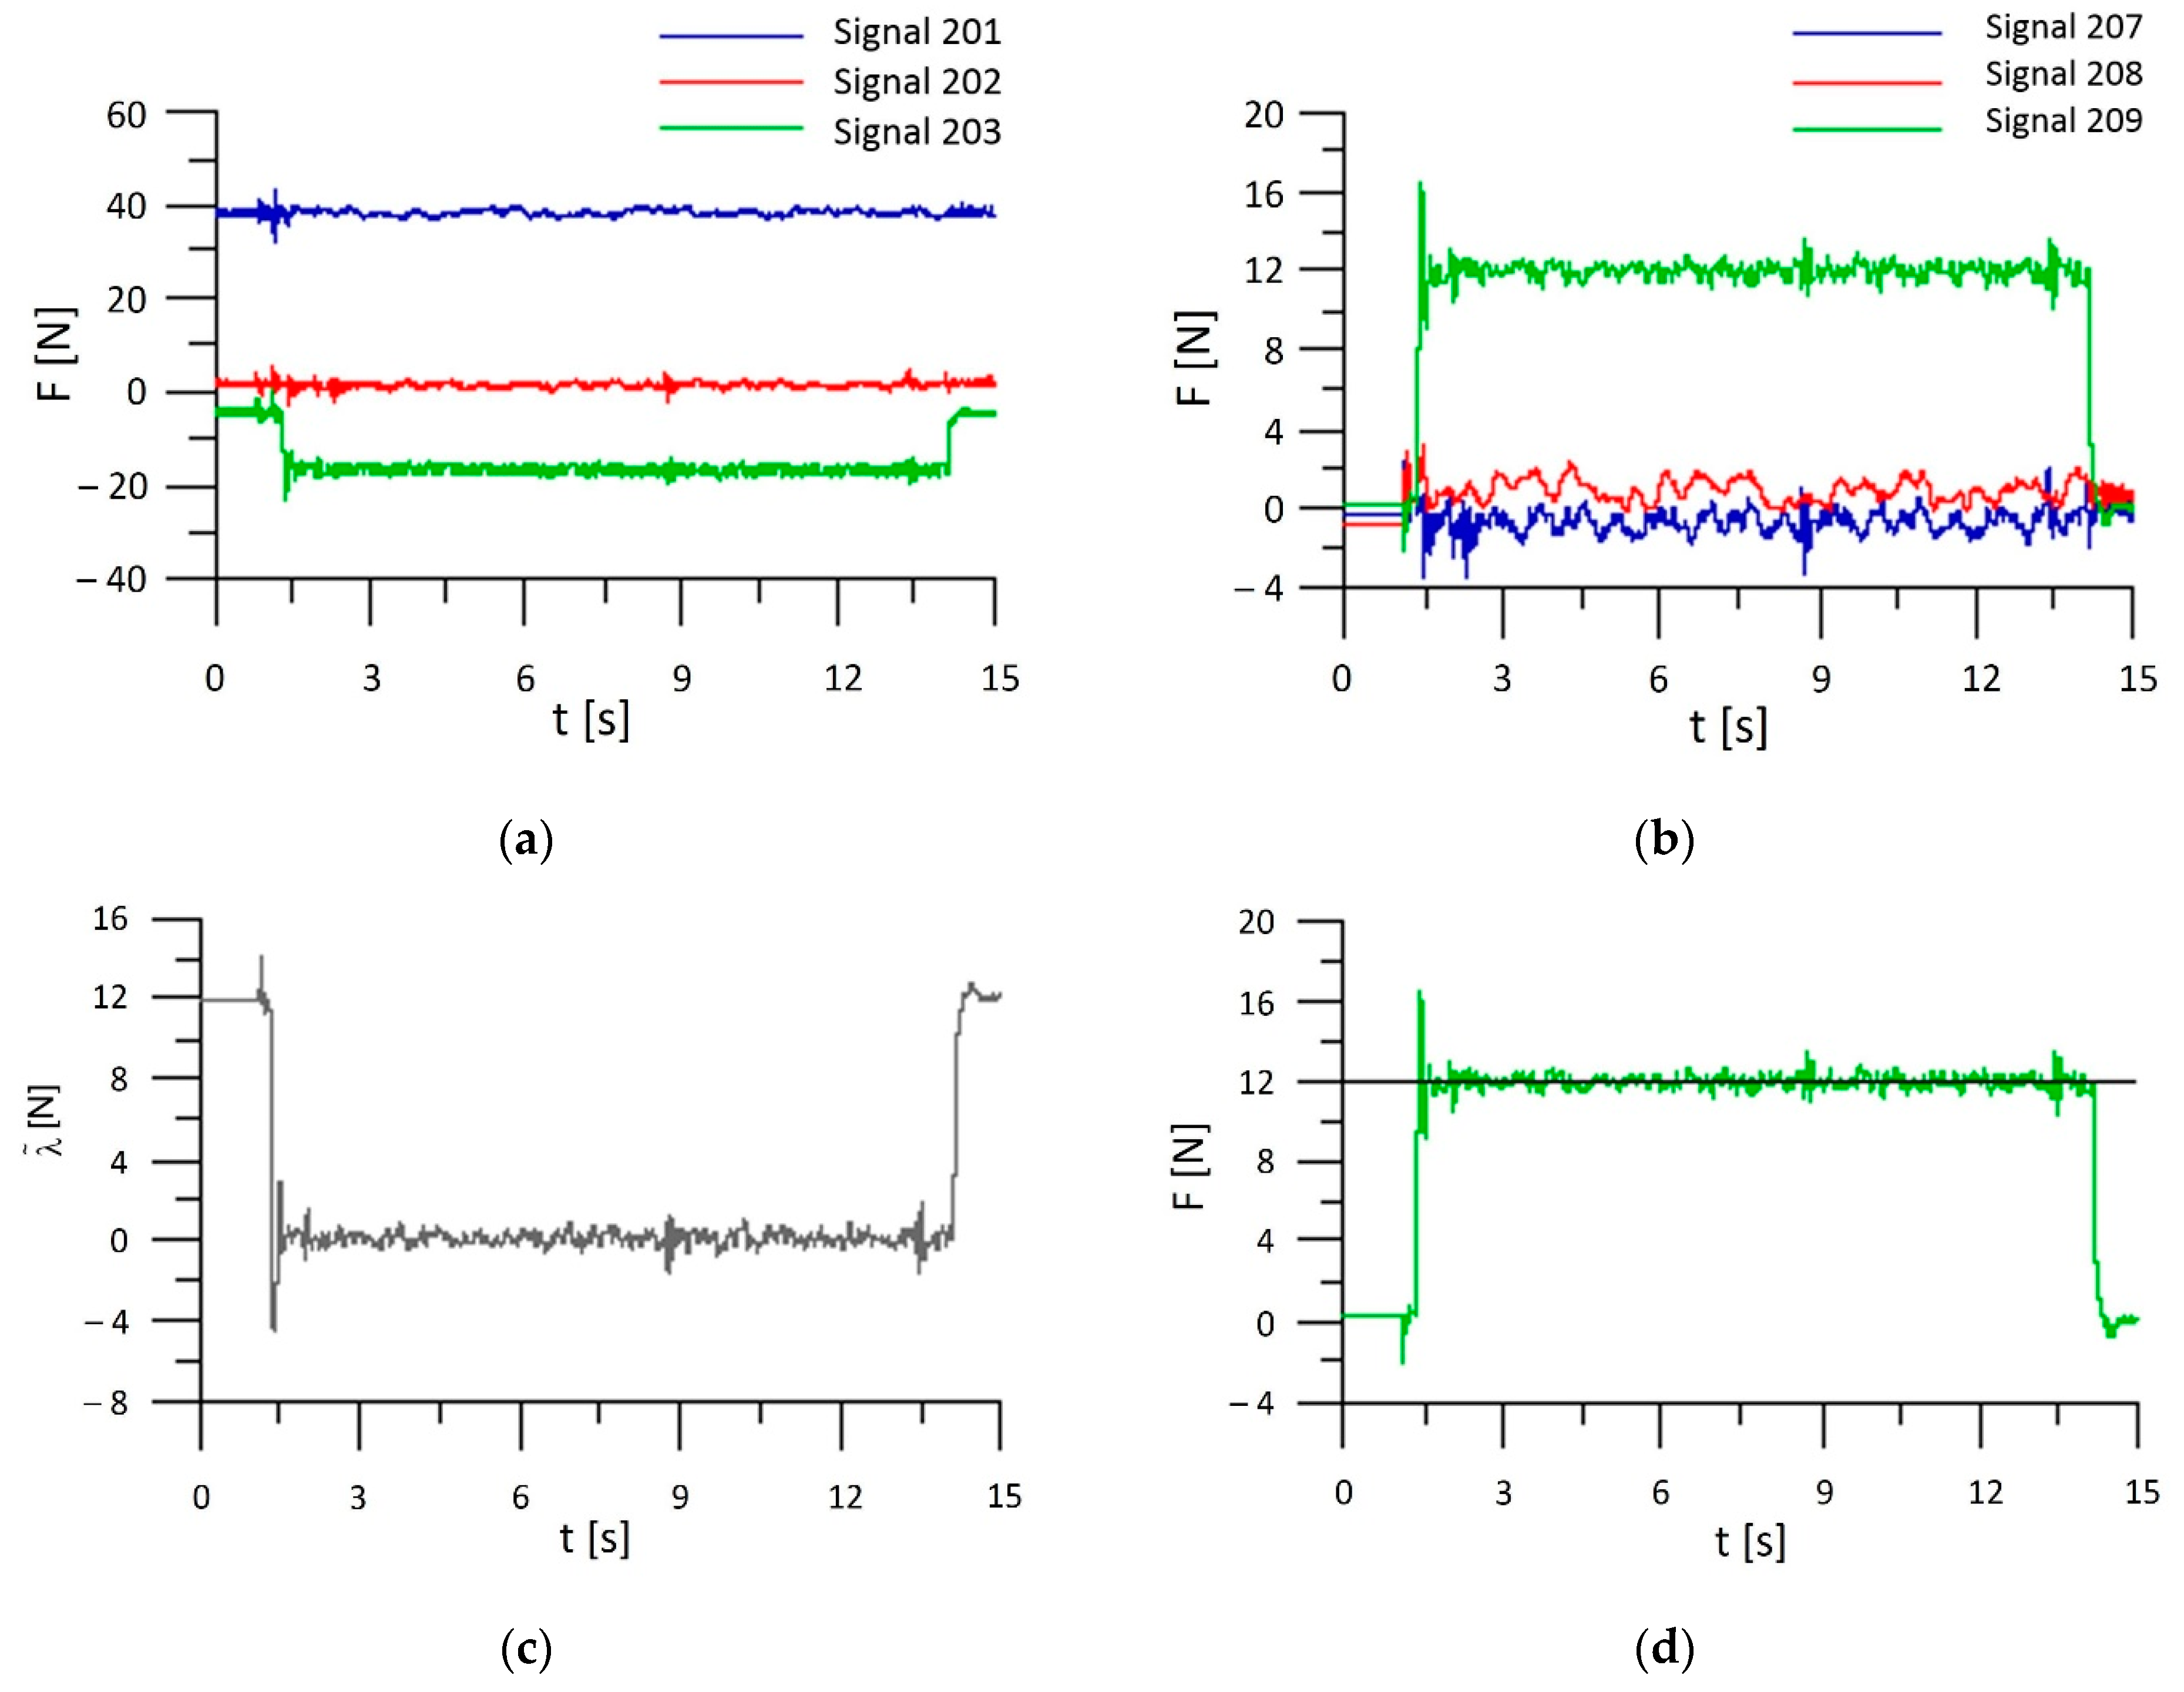
Figure 11.
Figure 11 shows the lack of overshoot in the course of the real force (signal 209). However, this comes at the cost of a higher RMSE mean square error and standard fluctuation. The authors conducted research for selected values of the D coefficient of 150%, 100%, 75%, and 50%. Research was conducted for these coefficients. The results for the coefficient D = 100% are shown in
Figure 10 and
Figure 11. The selected value of D = 100% was selected experimentally, taking into account the force stabilization and the speed of force change. The appropriate selection of the parameter is an important element in programming, if the manipulator is to perform cutting operations with high accuracy and in a stable manner (this corresponds to the quality of the machined surface) [
25,
26,
27]. To sum up, the use of the Test Signal Viewer software allows for better use of the Force Control software feature and extends the possibilities of its implementation.
The method of determining the best parameters of damping and rate of force buildup was carried out on the basis of an experimental study, which consisted of making a pass along one edge of a rectangular sample. The value of the tool–sample contact force was assumed, and at different values of damping and rate of force buildup, the correctness of realization of the assumed force was measured.
Thus, the effect of the damping factor D and the force increase factor FC on stabilizing the set clamping force of F = 12 N was tested. Signals from the force sensor were recorded using the ABB Signal Test Viewer application, dedicated to retrieving signal values from ABB’s robot controller.
Figure 10 and
Figure 11 show selected results of the experiment implementation.
Figure 10c and
Figure 11c show the course of the force value deviation.
Two indicators of the quality of force control implementation were used for the analysis: the root-mean-square error (RMSE) and the standard deviation according to the relationships:
where:
—root-mean-square error;
—standard deviation; n—number of samples; k—sample no.;
—contact force error in the k-th measurement;
—arithmetic mean of force value.
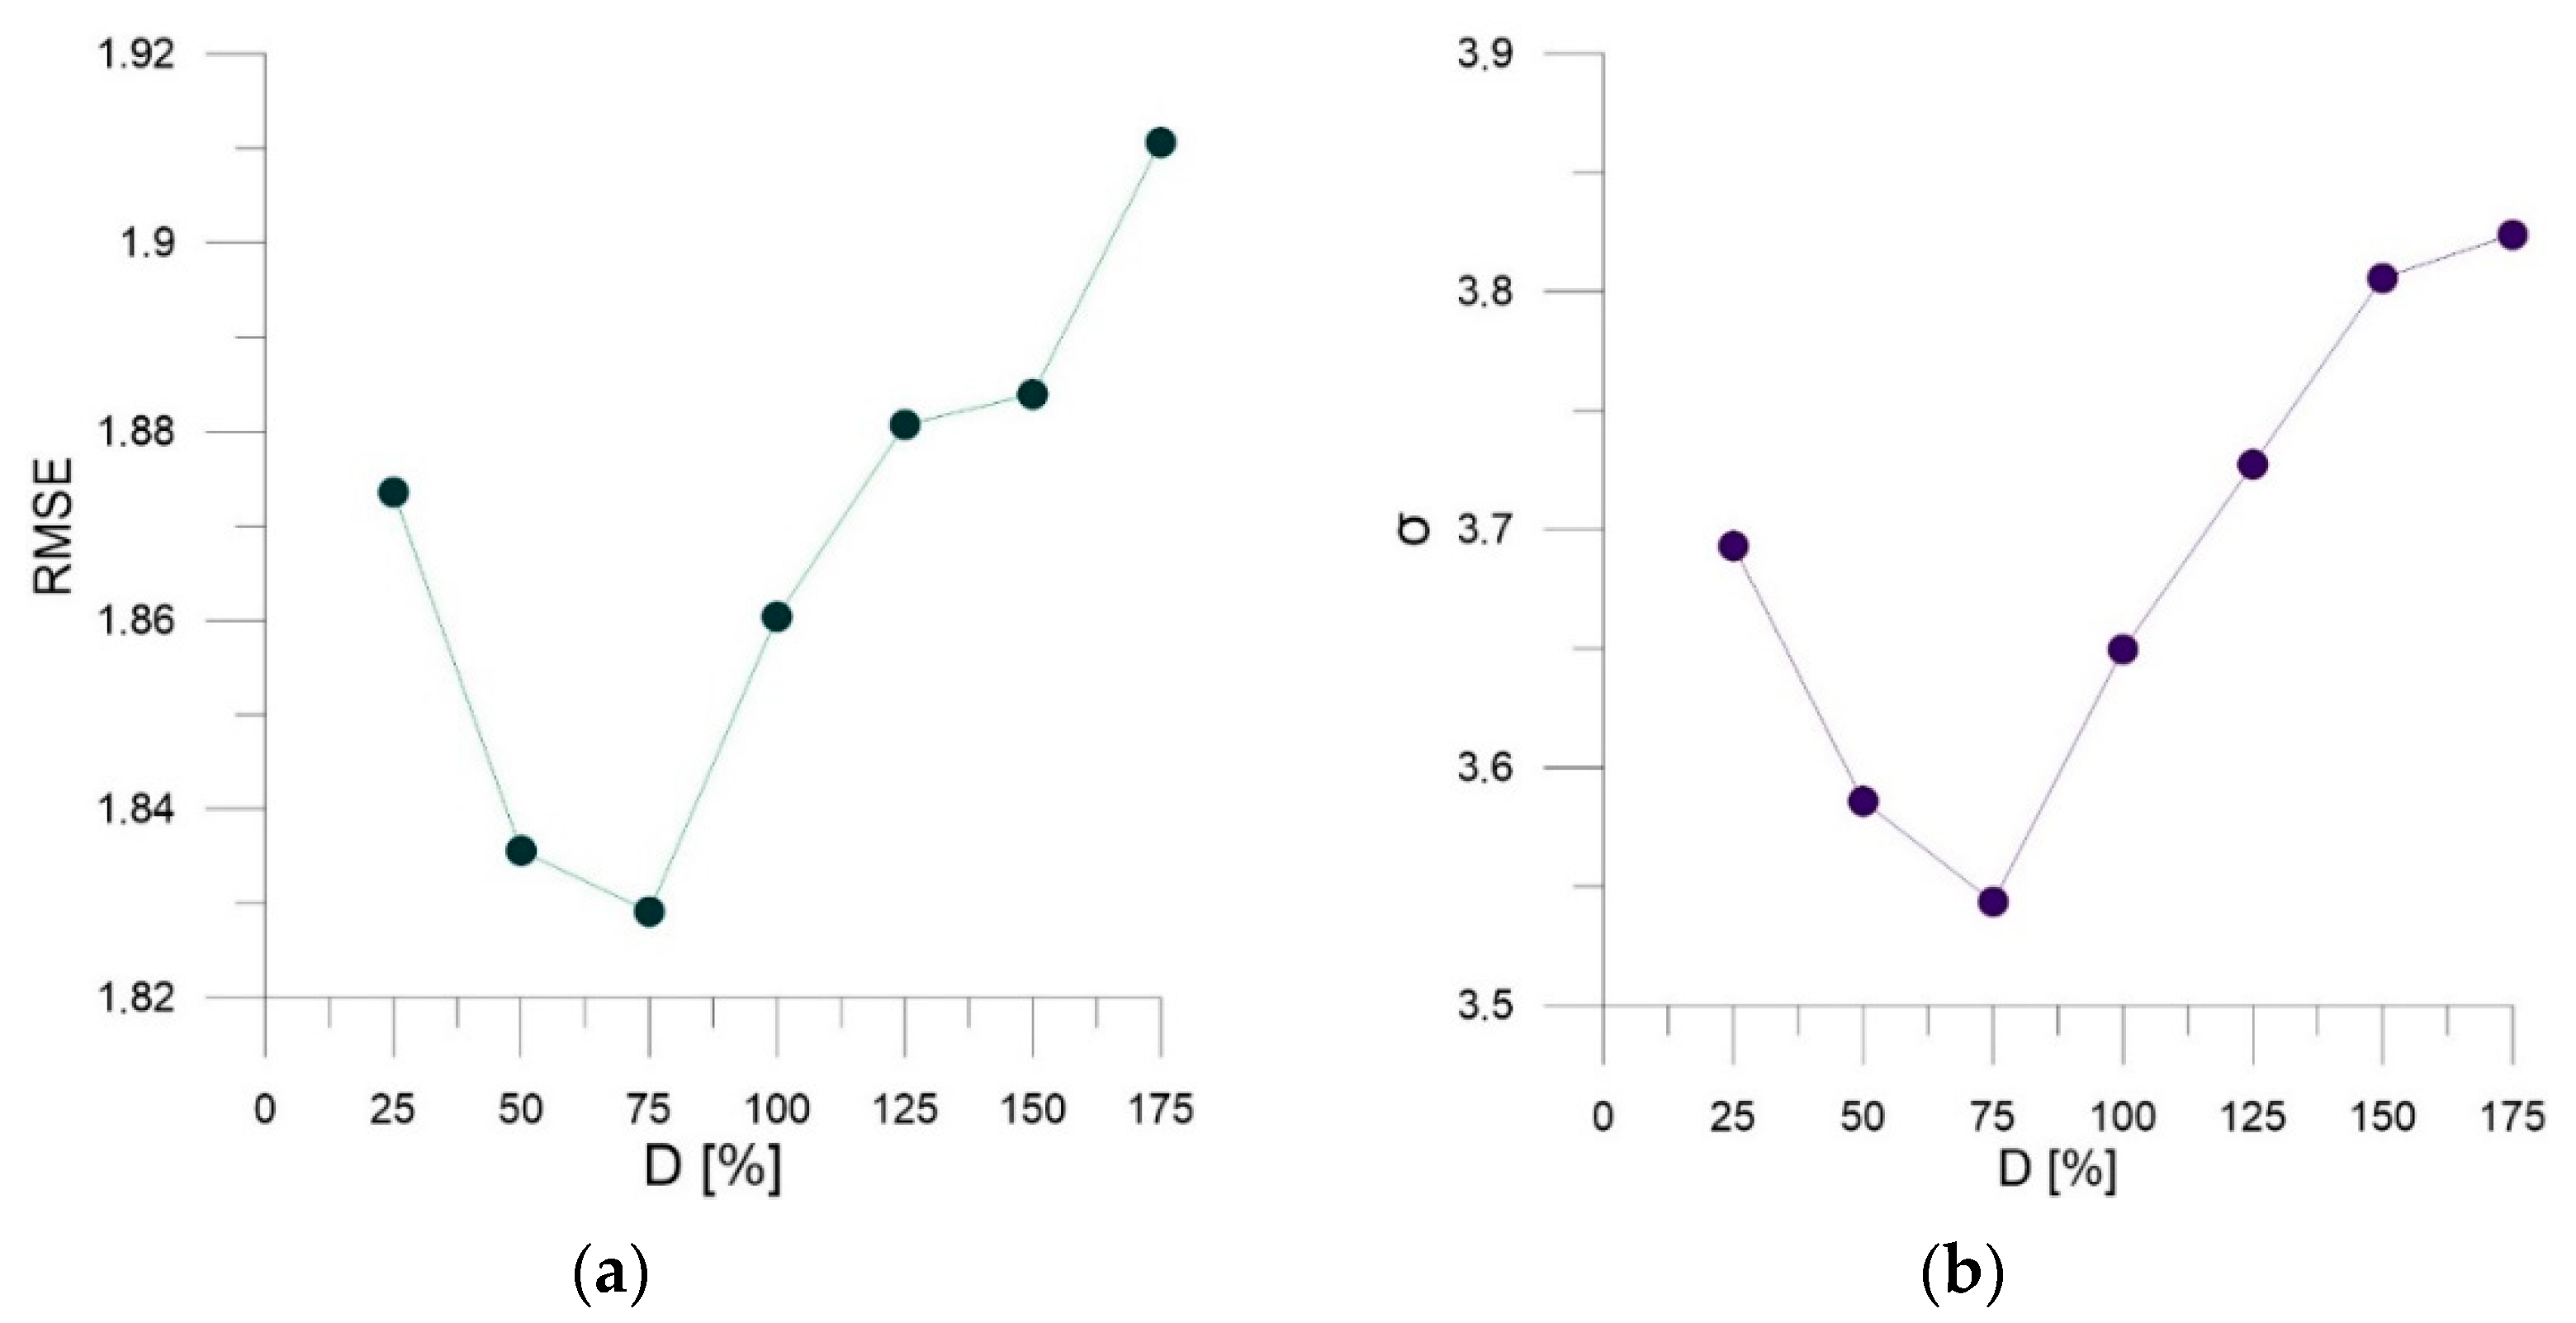
In the first part of the experiment, seven tests were performed by varying the damping parameter in the range of 25 ÷ 175%, with a constant force increase factor FC = 50 N/s.
The results of the analysis are presented in the form of a plot in
Figure 12 and
Figure 13.
Figure 12a presents a plot of the root-mean-square error as a function of the value of the damping parameter, while
Figure 12b shows a plot of the standard deviation as a function of the value of the damping parameter.
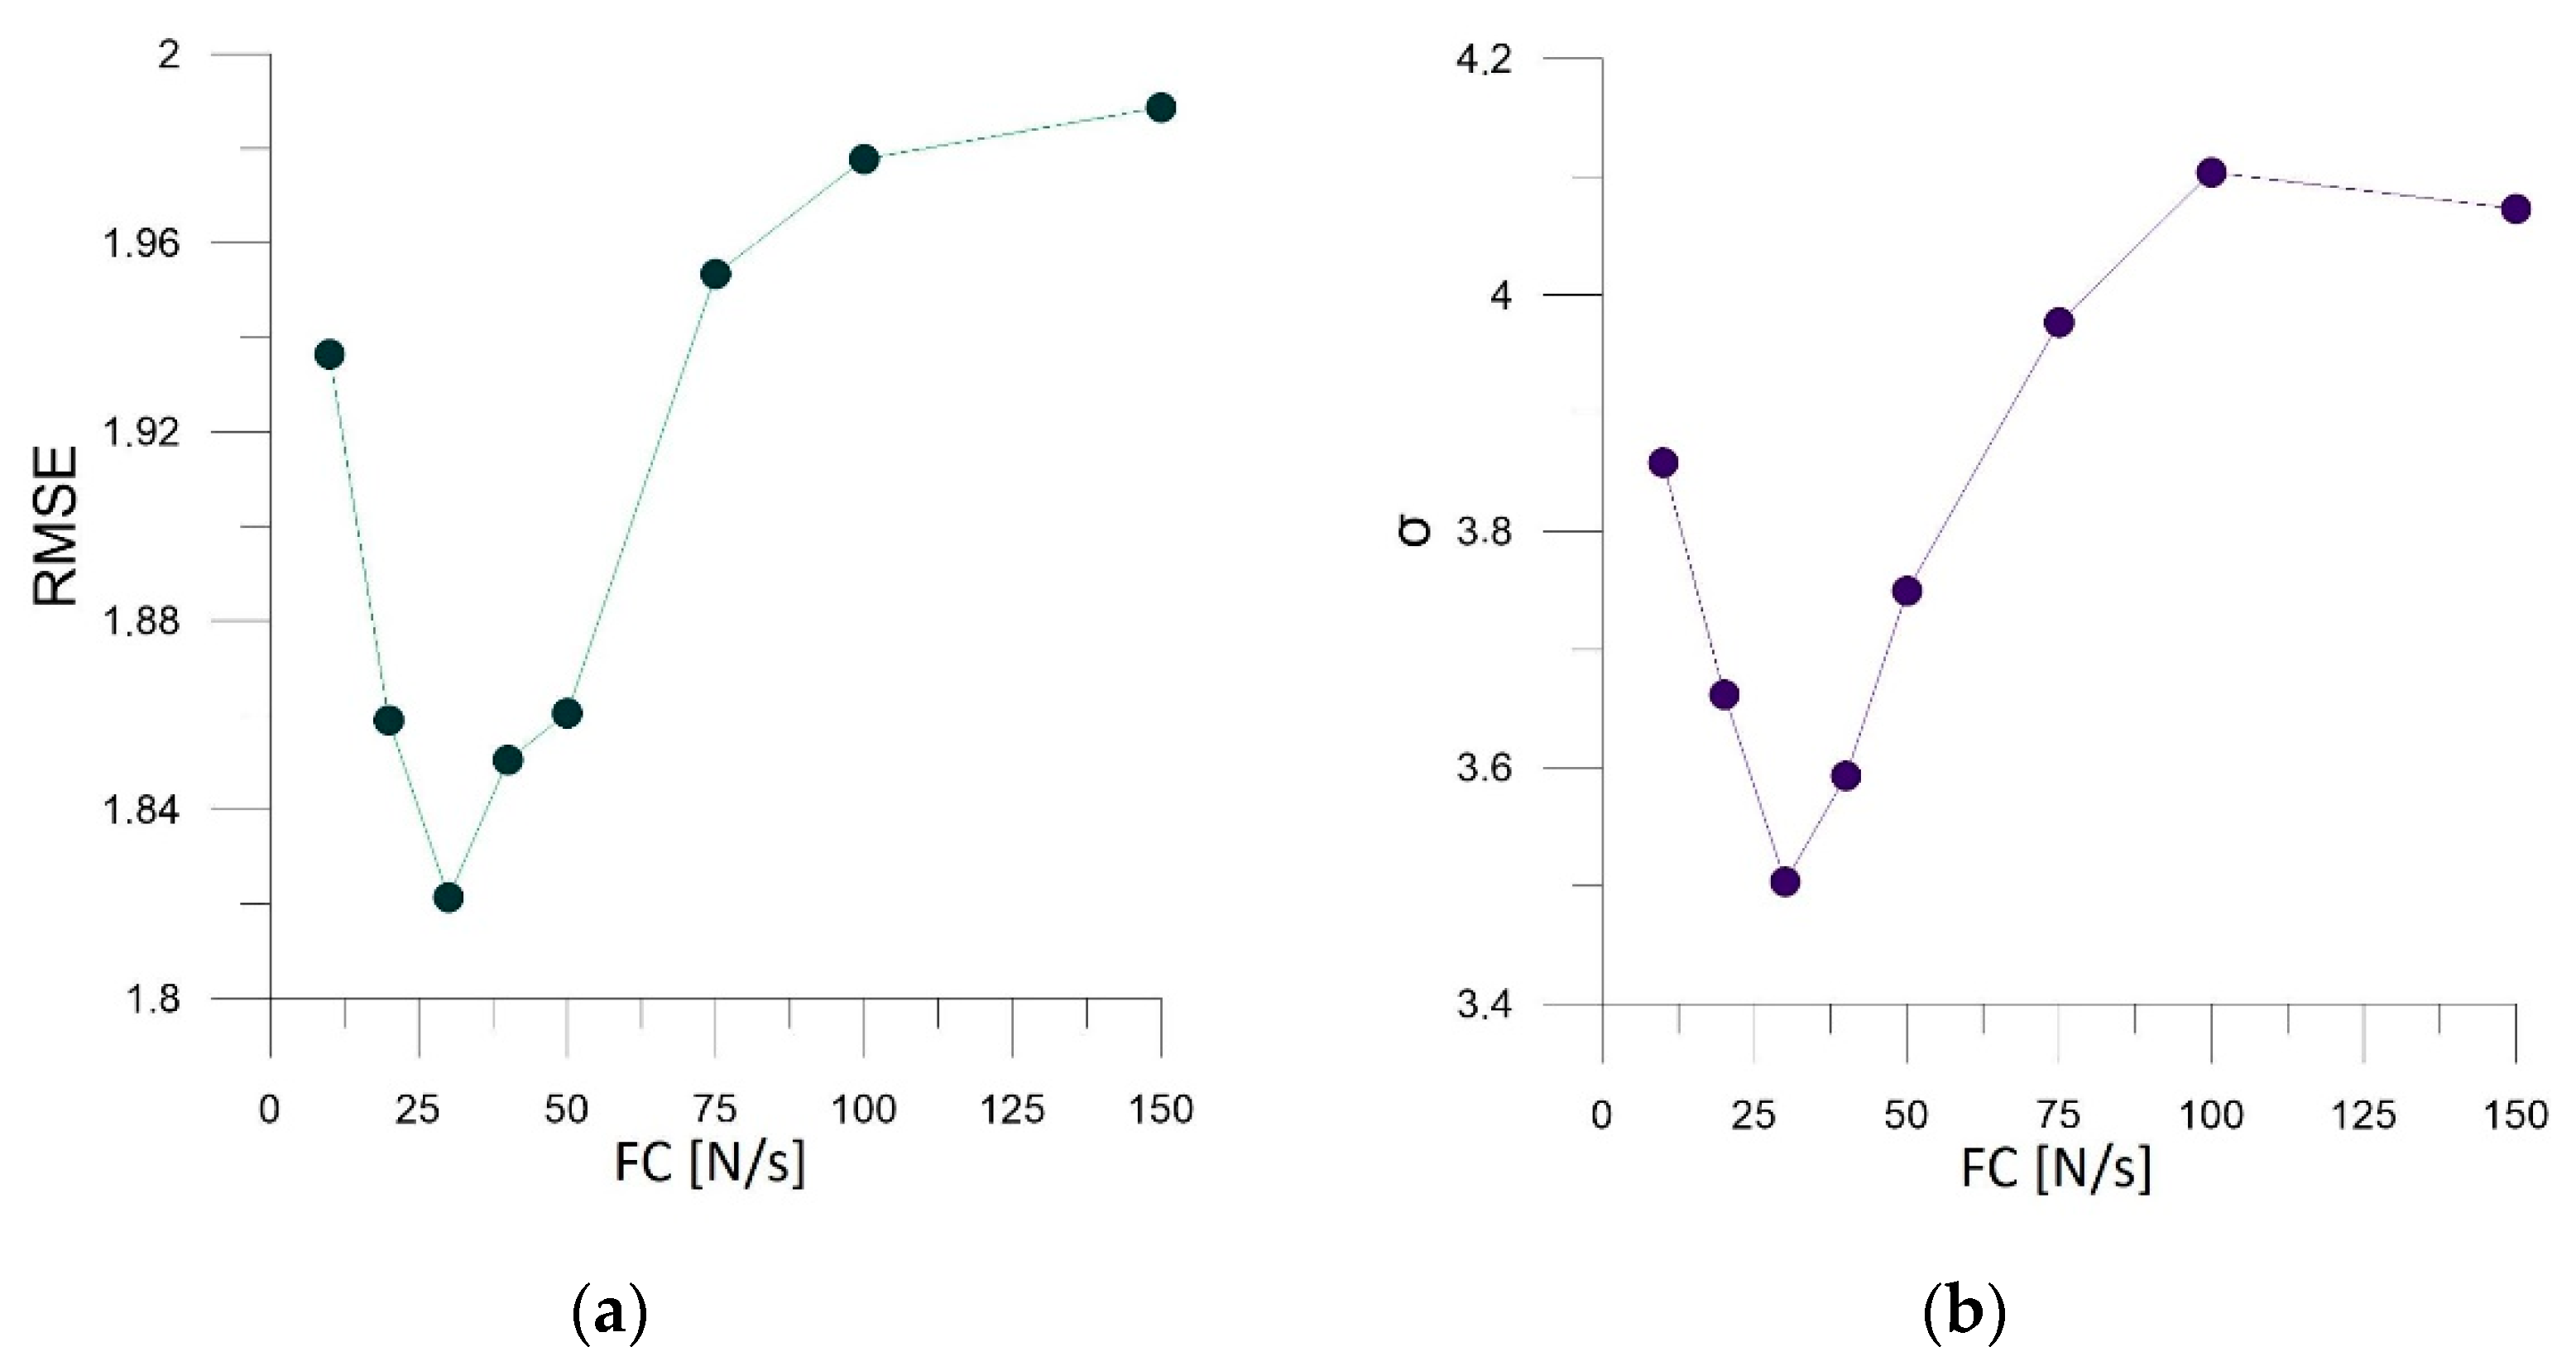
In the second part of the experiment, tests were carried out for eight values of the force increase factor FC in the range of 10 ÷ 150 N/s, with a constant damping factor of D = 100%.
Figure 13a shows a plot of the root-mean-square error as a function of the value of the force increase parameter, and
Figure 13b shows a plot of the standard deviation as a function of the value of the force increase parameter.
The smallest values of the root-mean-square error and standard deviation ratios were observed for a damping ratio of D = 75% and a force increase ratio of FC = 30 N/s.
3.3. Tune Master
Robotization of technological processes related to machining has been carried out in the industry for many years. Robots are used primarily for the operation of CNC machines and the processing of so-called soft materials such as plastics, wood, and aluminum alloys. With the increase in the repeatability and accuracy of robots, the spectrum of their applications is growing. Robots can find application in the automation of manual processes such as deburring, and removal of mold lines on cast elements [
28,
29,
30,
31,
32]. Due to the low rigidity compared to your CNC, robots will not replace them in the so-called heavy and highly accurate machining. Robots are more and more commonly used where high accuracy is not so important, e.g., in deburring cast iron castings.
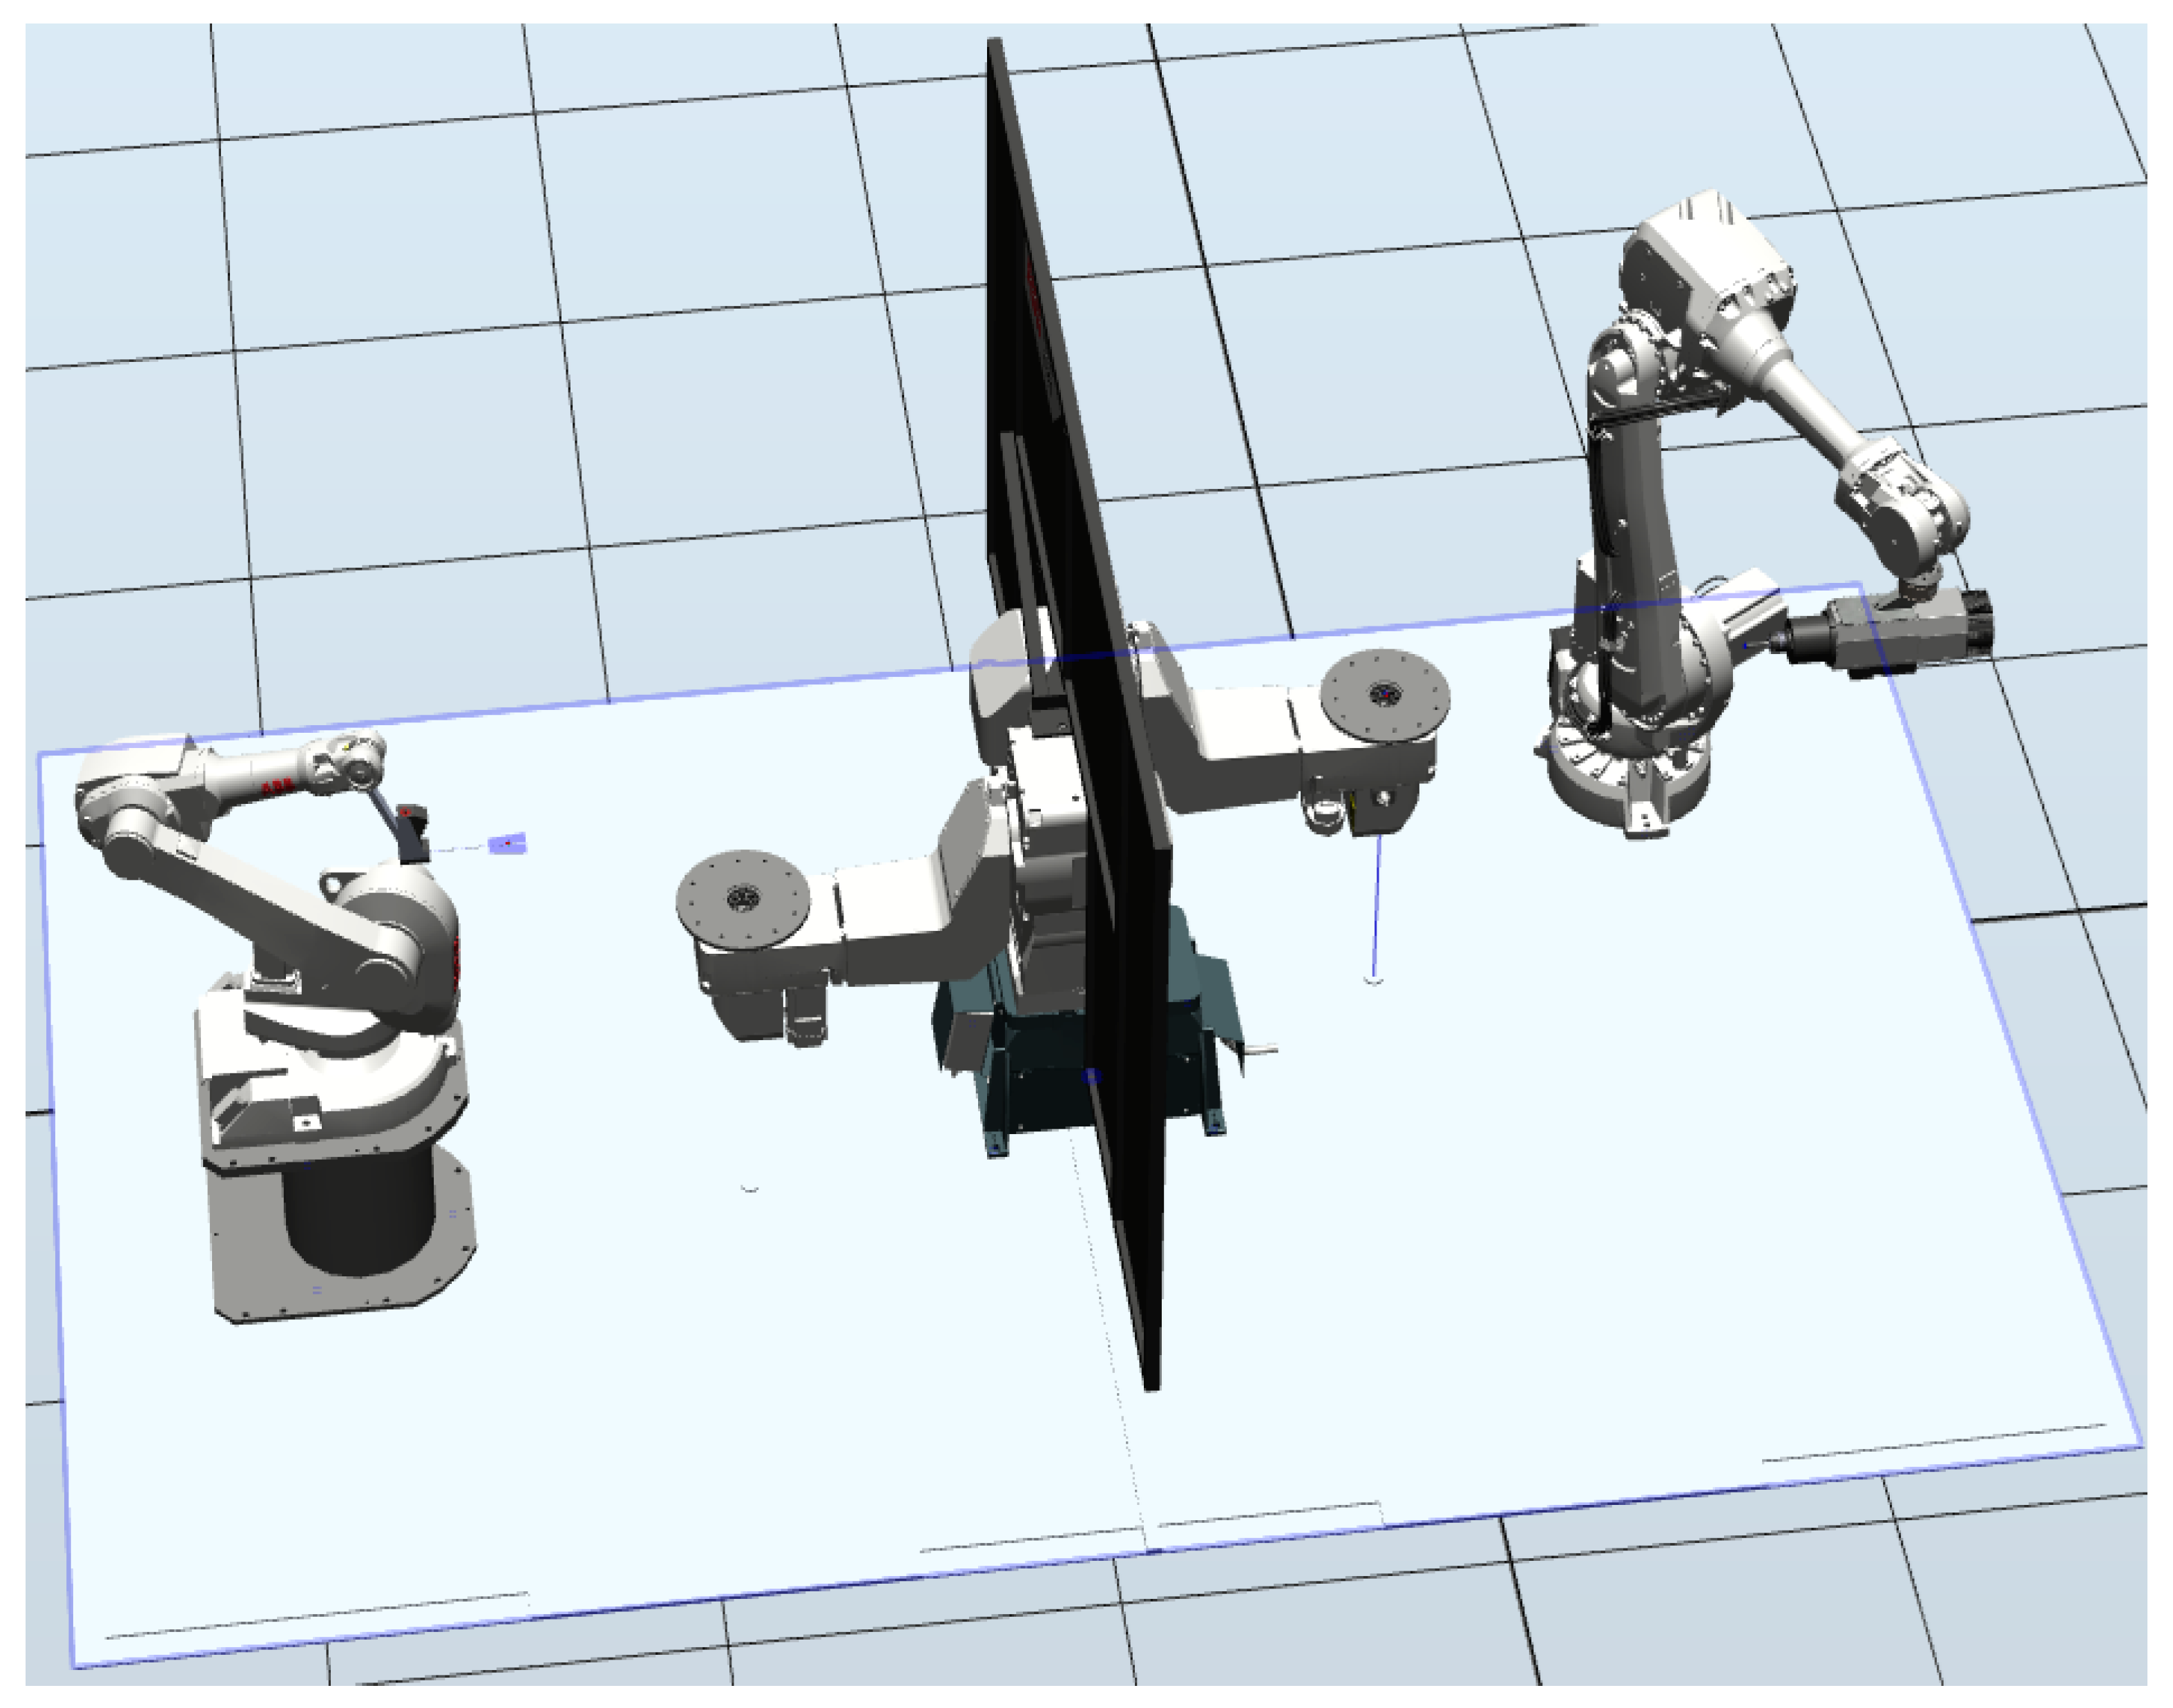
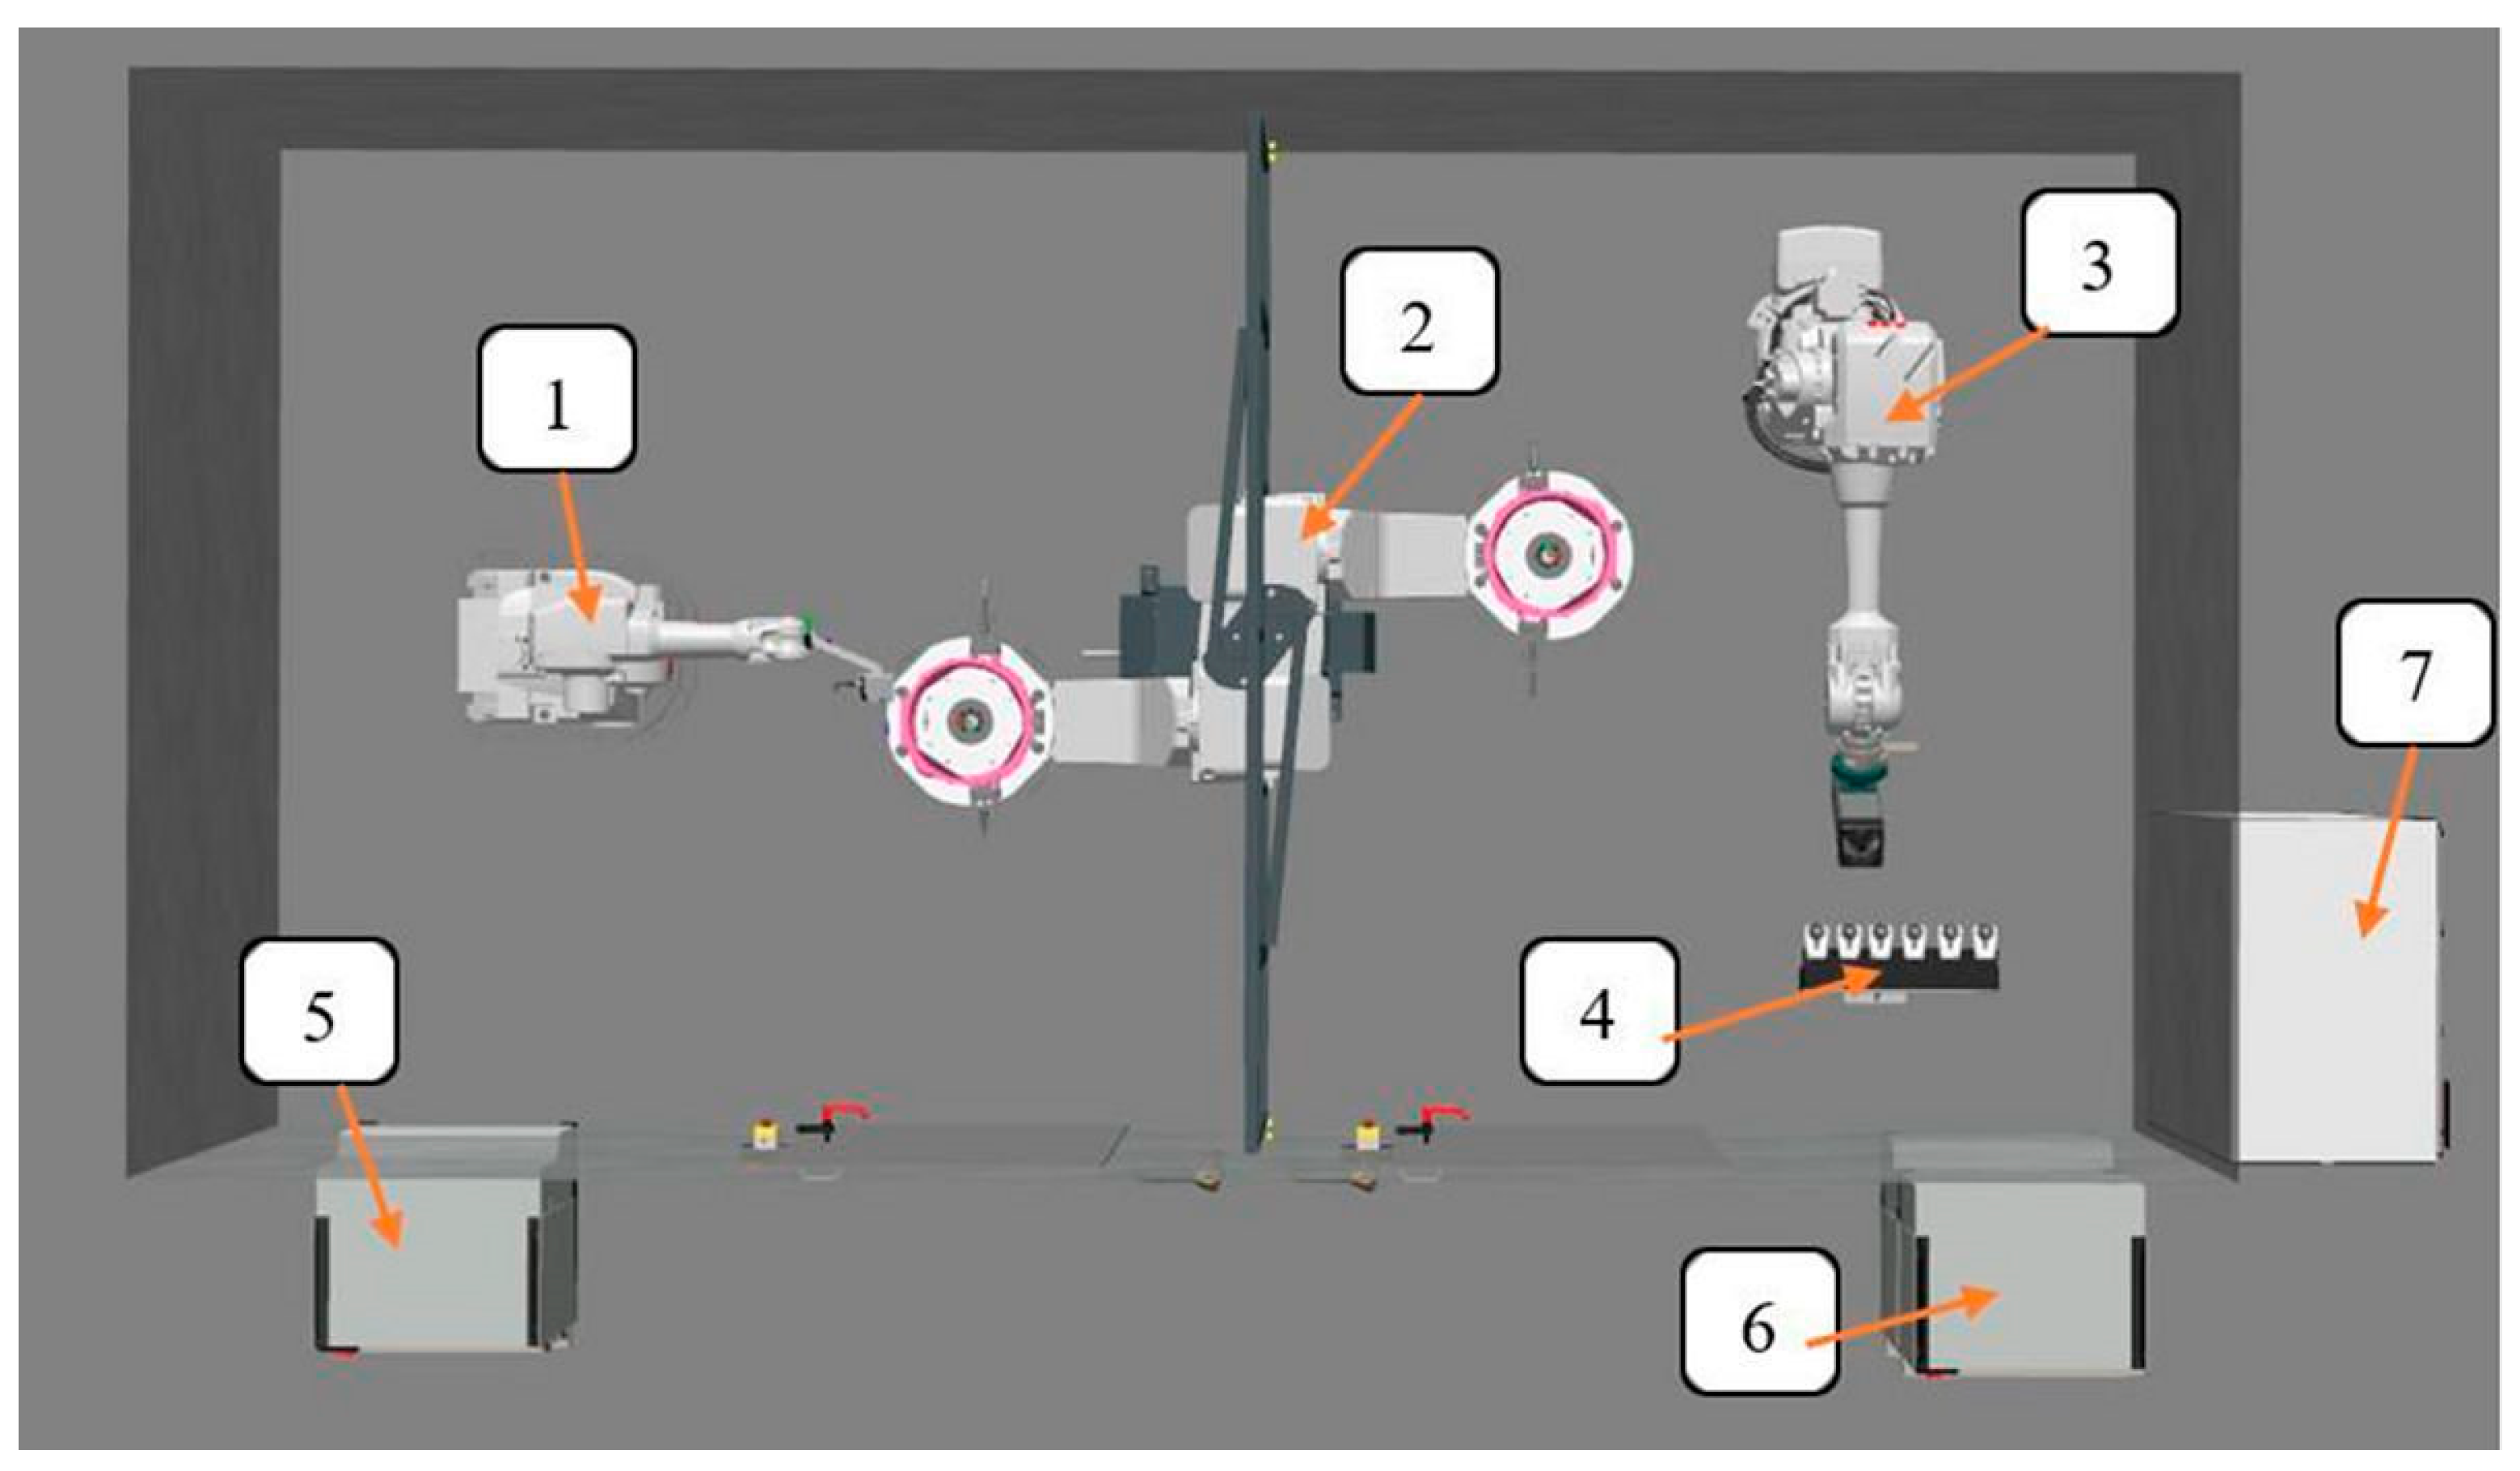
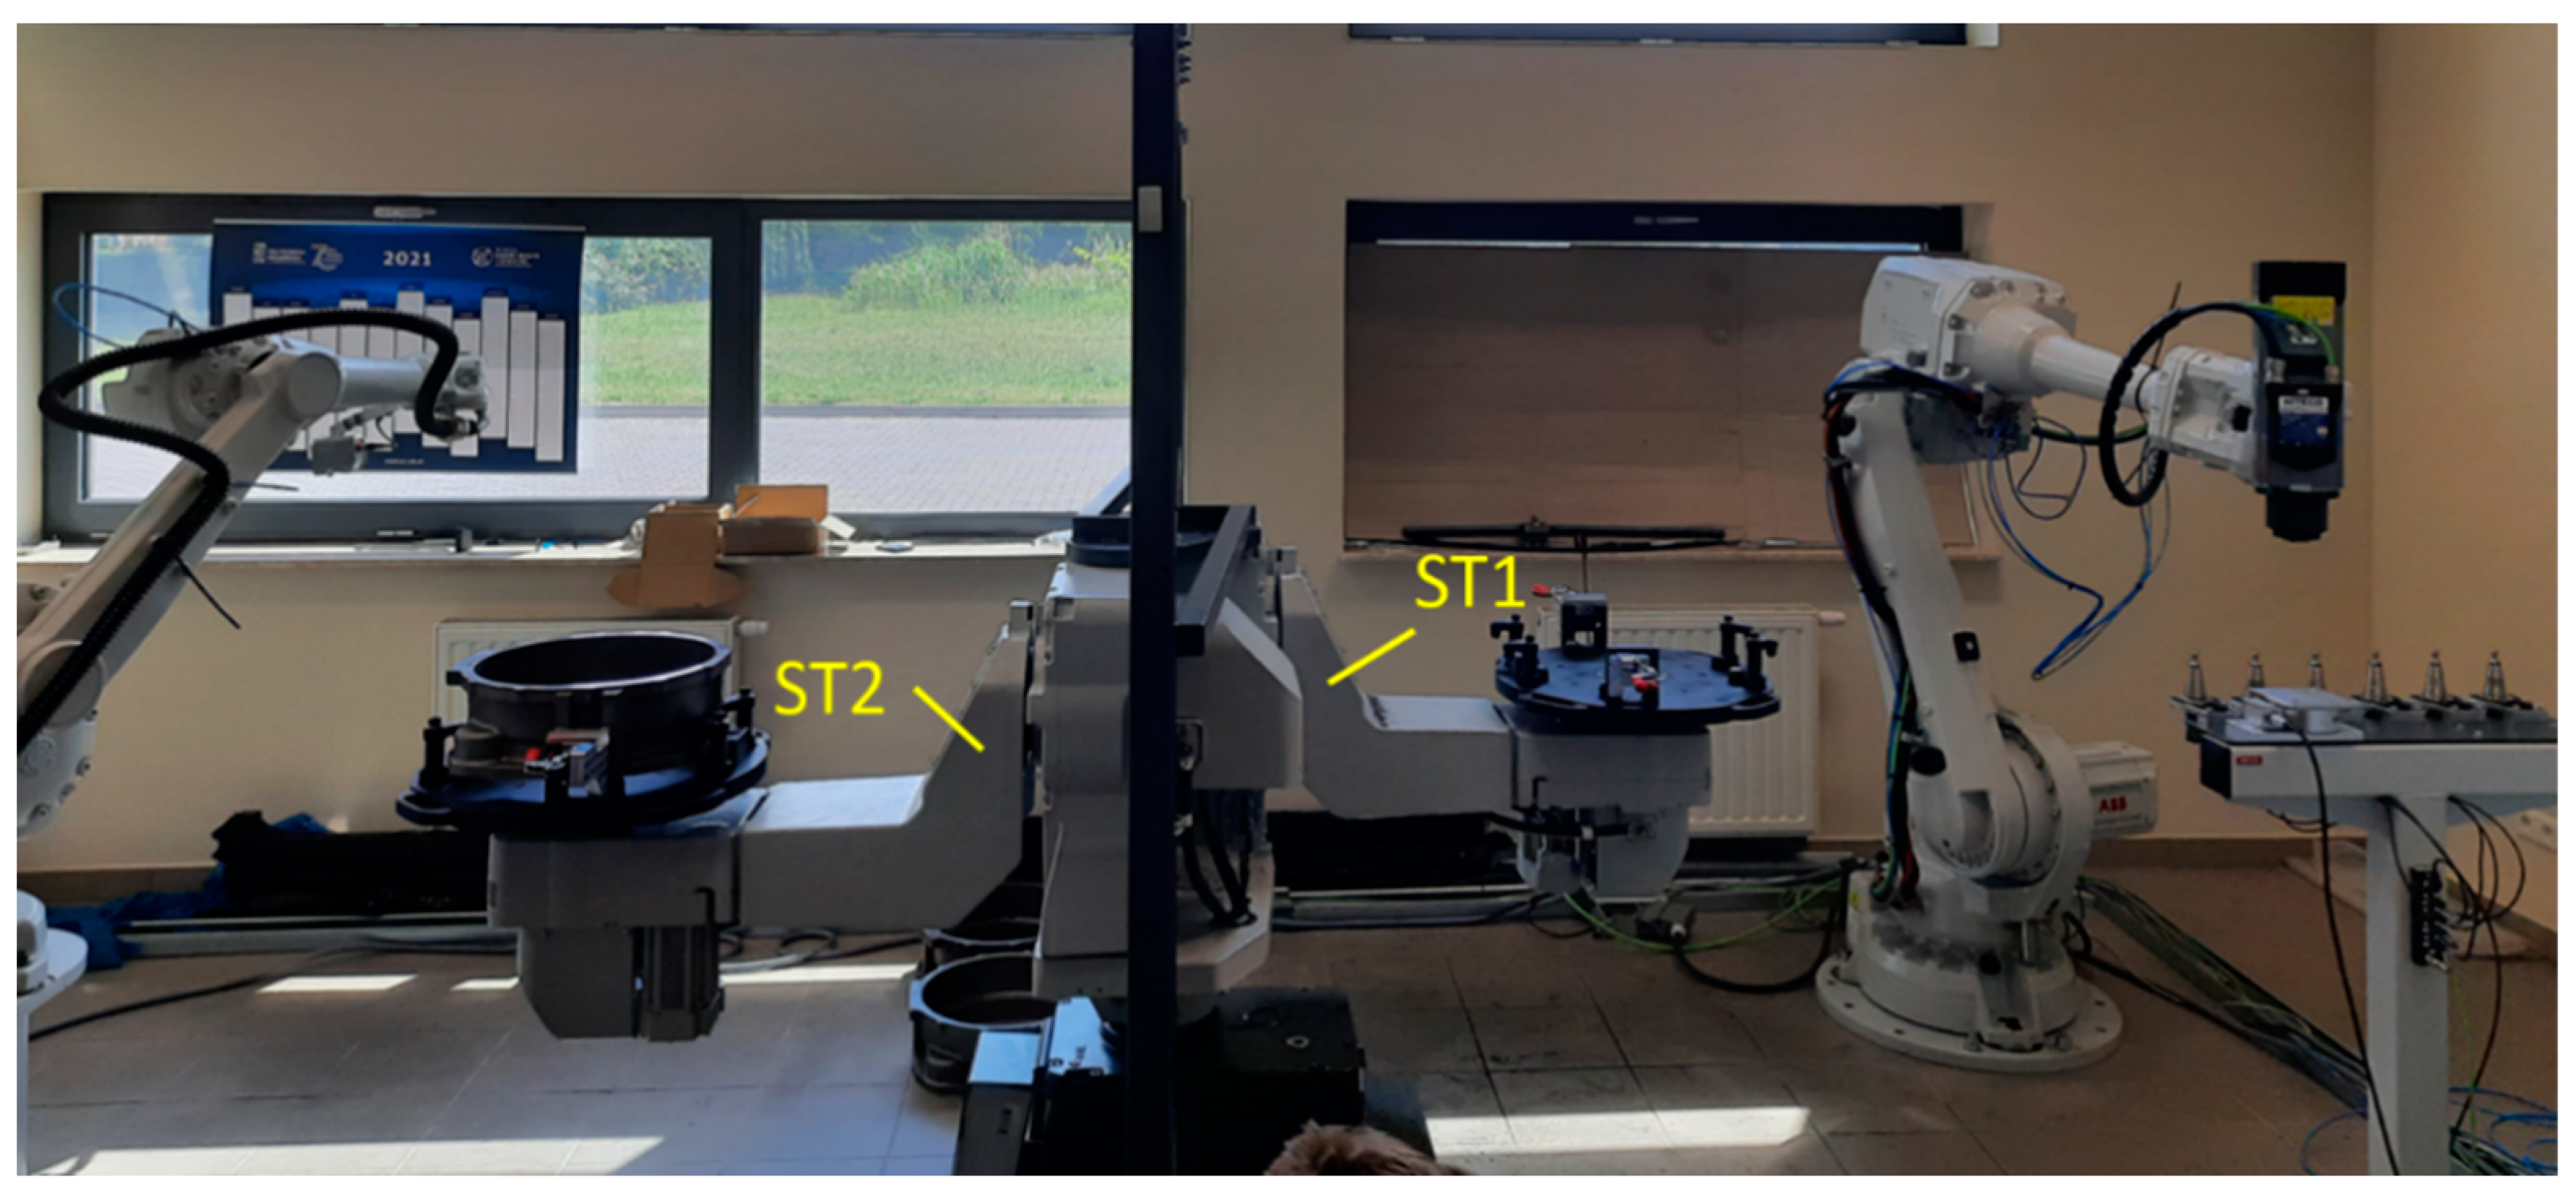
As part of the work carried out, a robotic station was developed to machine castings of gearbox housings made as gray cast iron castings made in disposable sand molds. A view of the station model is shown in
Figure 14. The station components are described in
Figure 15. The idea of the station’s operation is based on the use of the IRB1600 robot with a 2D laser scanner, which allows the measurement of fluctuations from the reference model. Then, the position offset of the cutting tool is calculated. The measured workpiece is transported with a five-axis IRBP B250 positioner to the machining zone, the so-called dirty zone. There, the IRB 4600 robot equipped with an electrospindle and tool storage performs the machining of workpieces.
The machined workpiece is a part from the automotive industry in which the time of execution of machining processes is crucial. Therefore, it is important to perform machining as efficiently as possible. In the presented station, the FC SpeedChange software feature was used, which allows, by measuring the force in the cutting direction, for increasing or decreasing the speed of the tool movement. In order to monitor the forces in test work, so as to determine the tool speed change thresholds, parameters such as tool movement speeds and forces in the process must be known. Tune Master software was used to monitor these parameters. An exemplary view of working with the software during tests is presented in
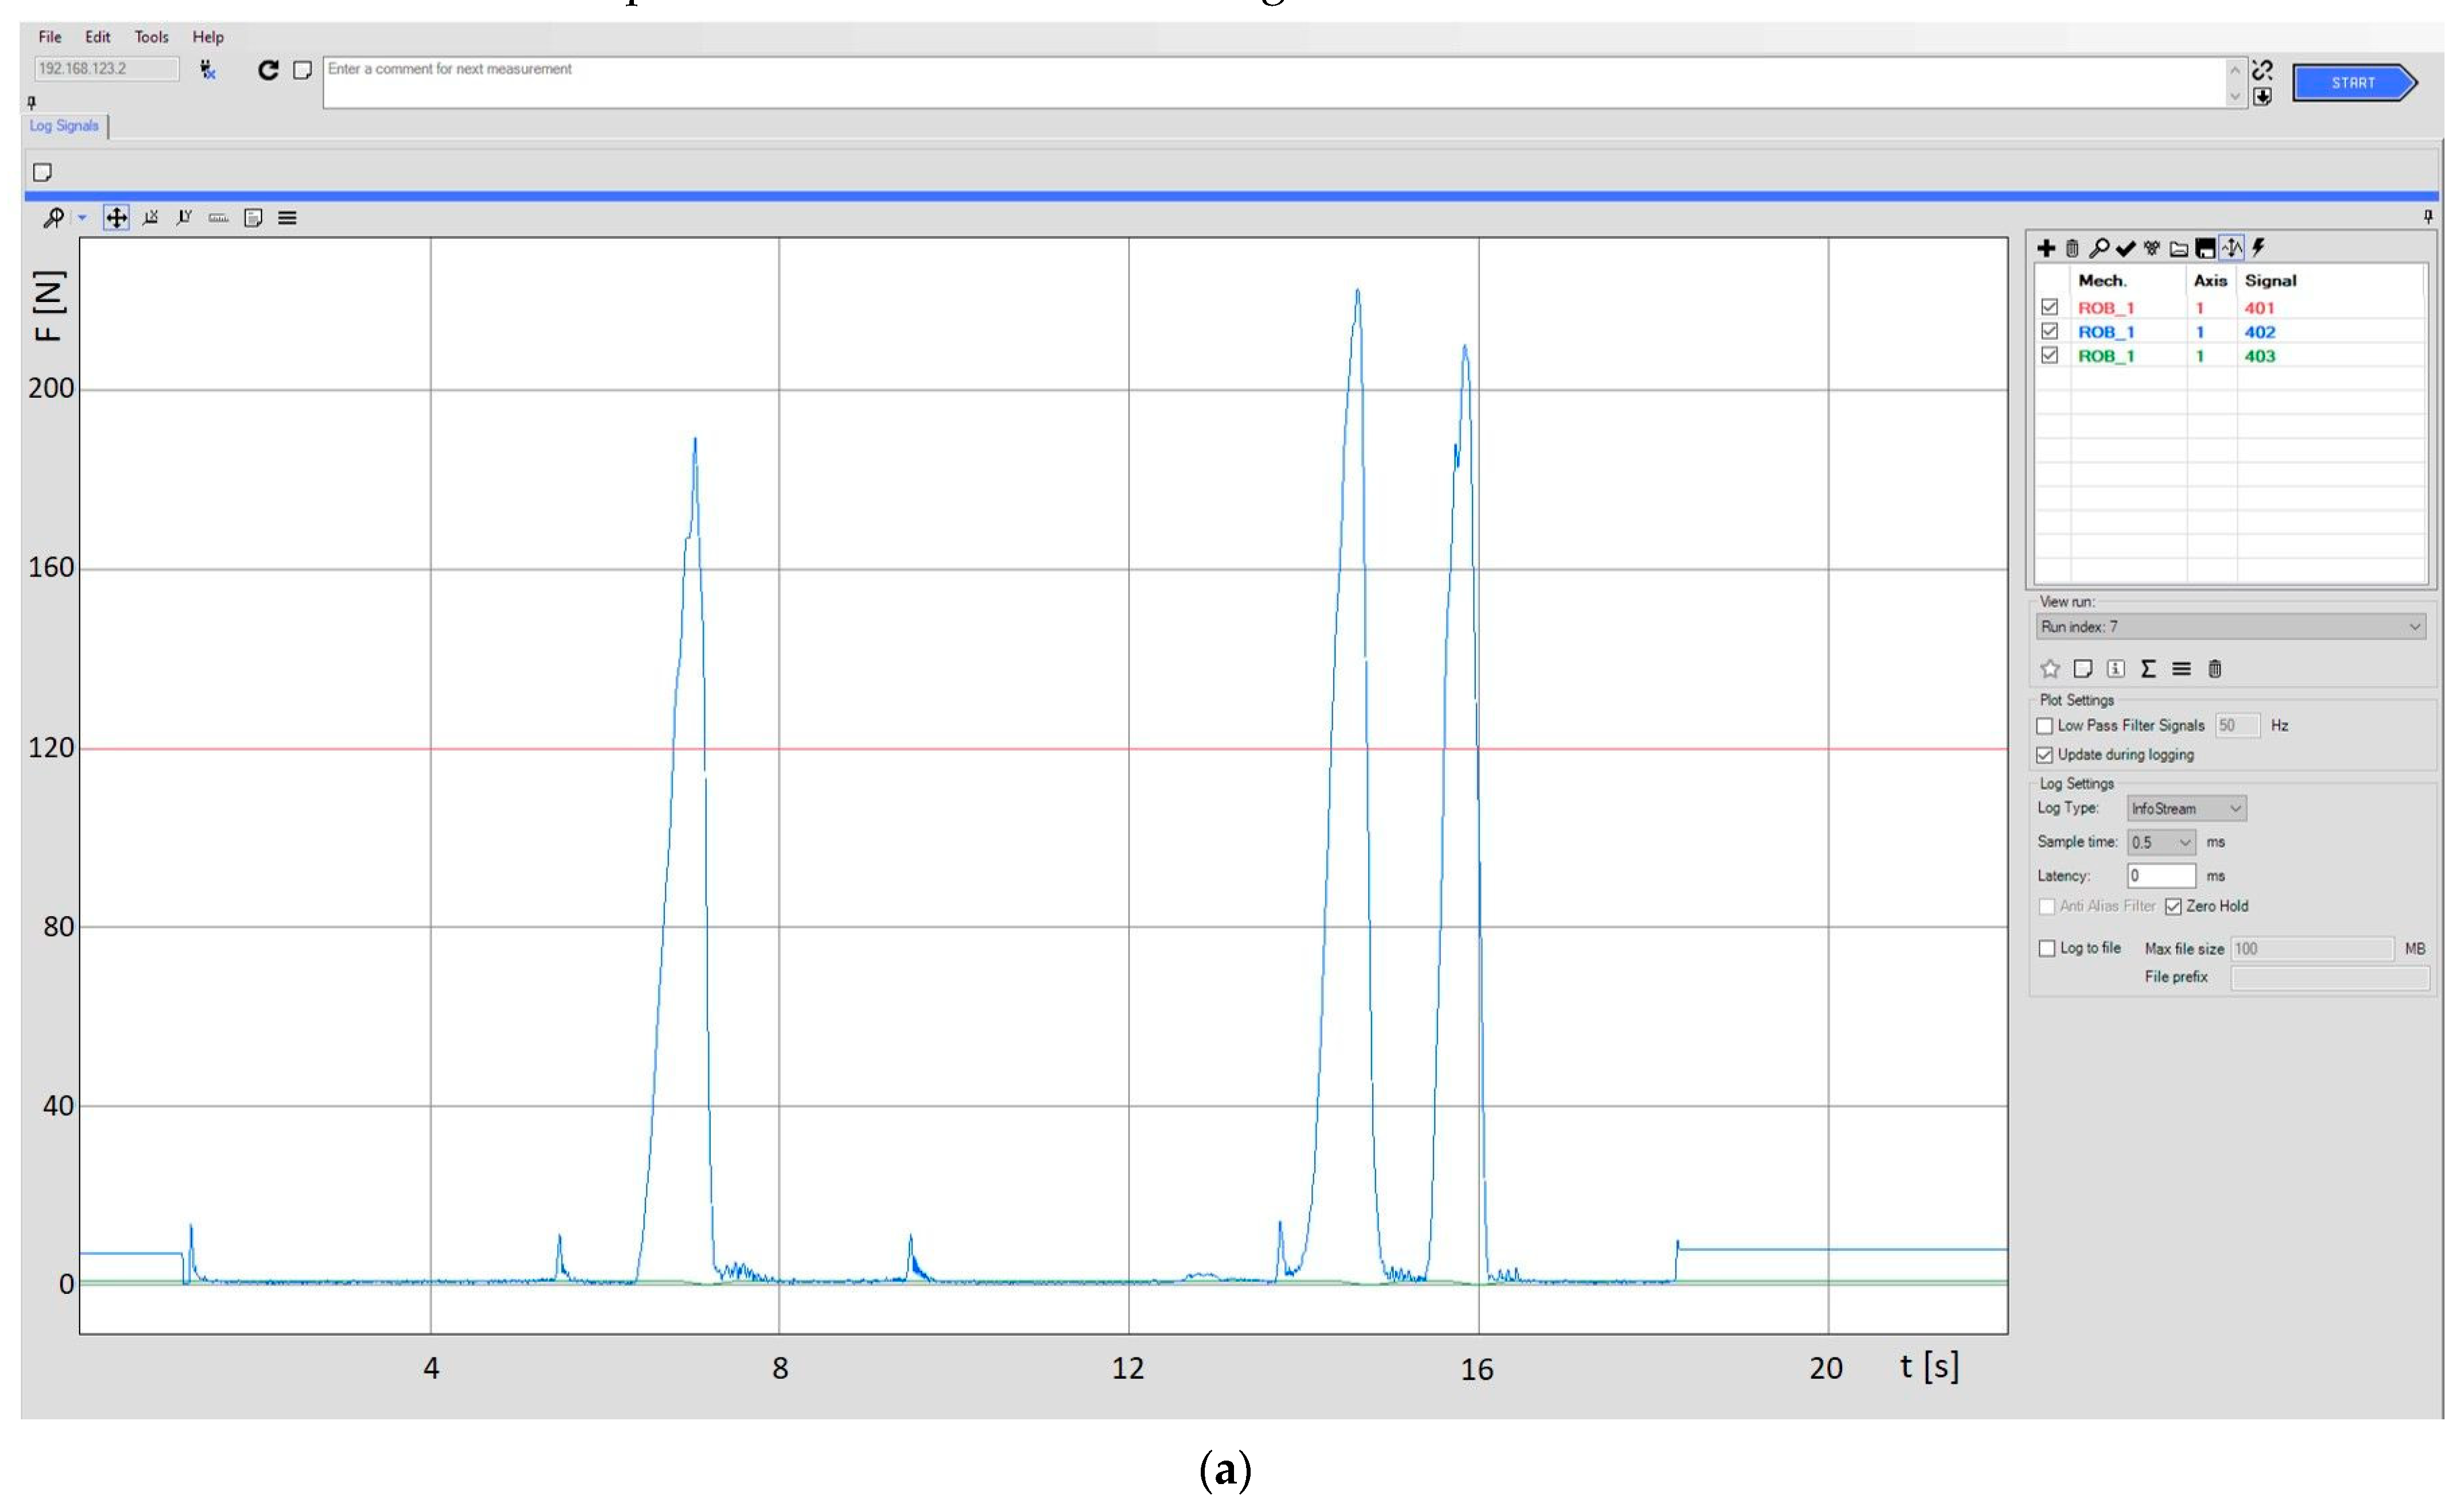
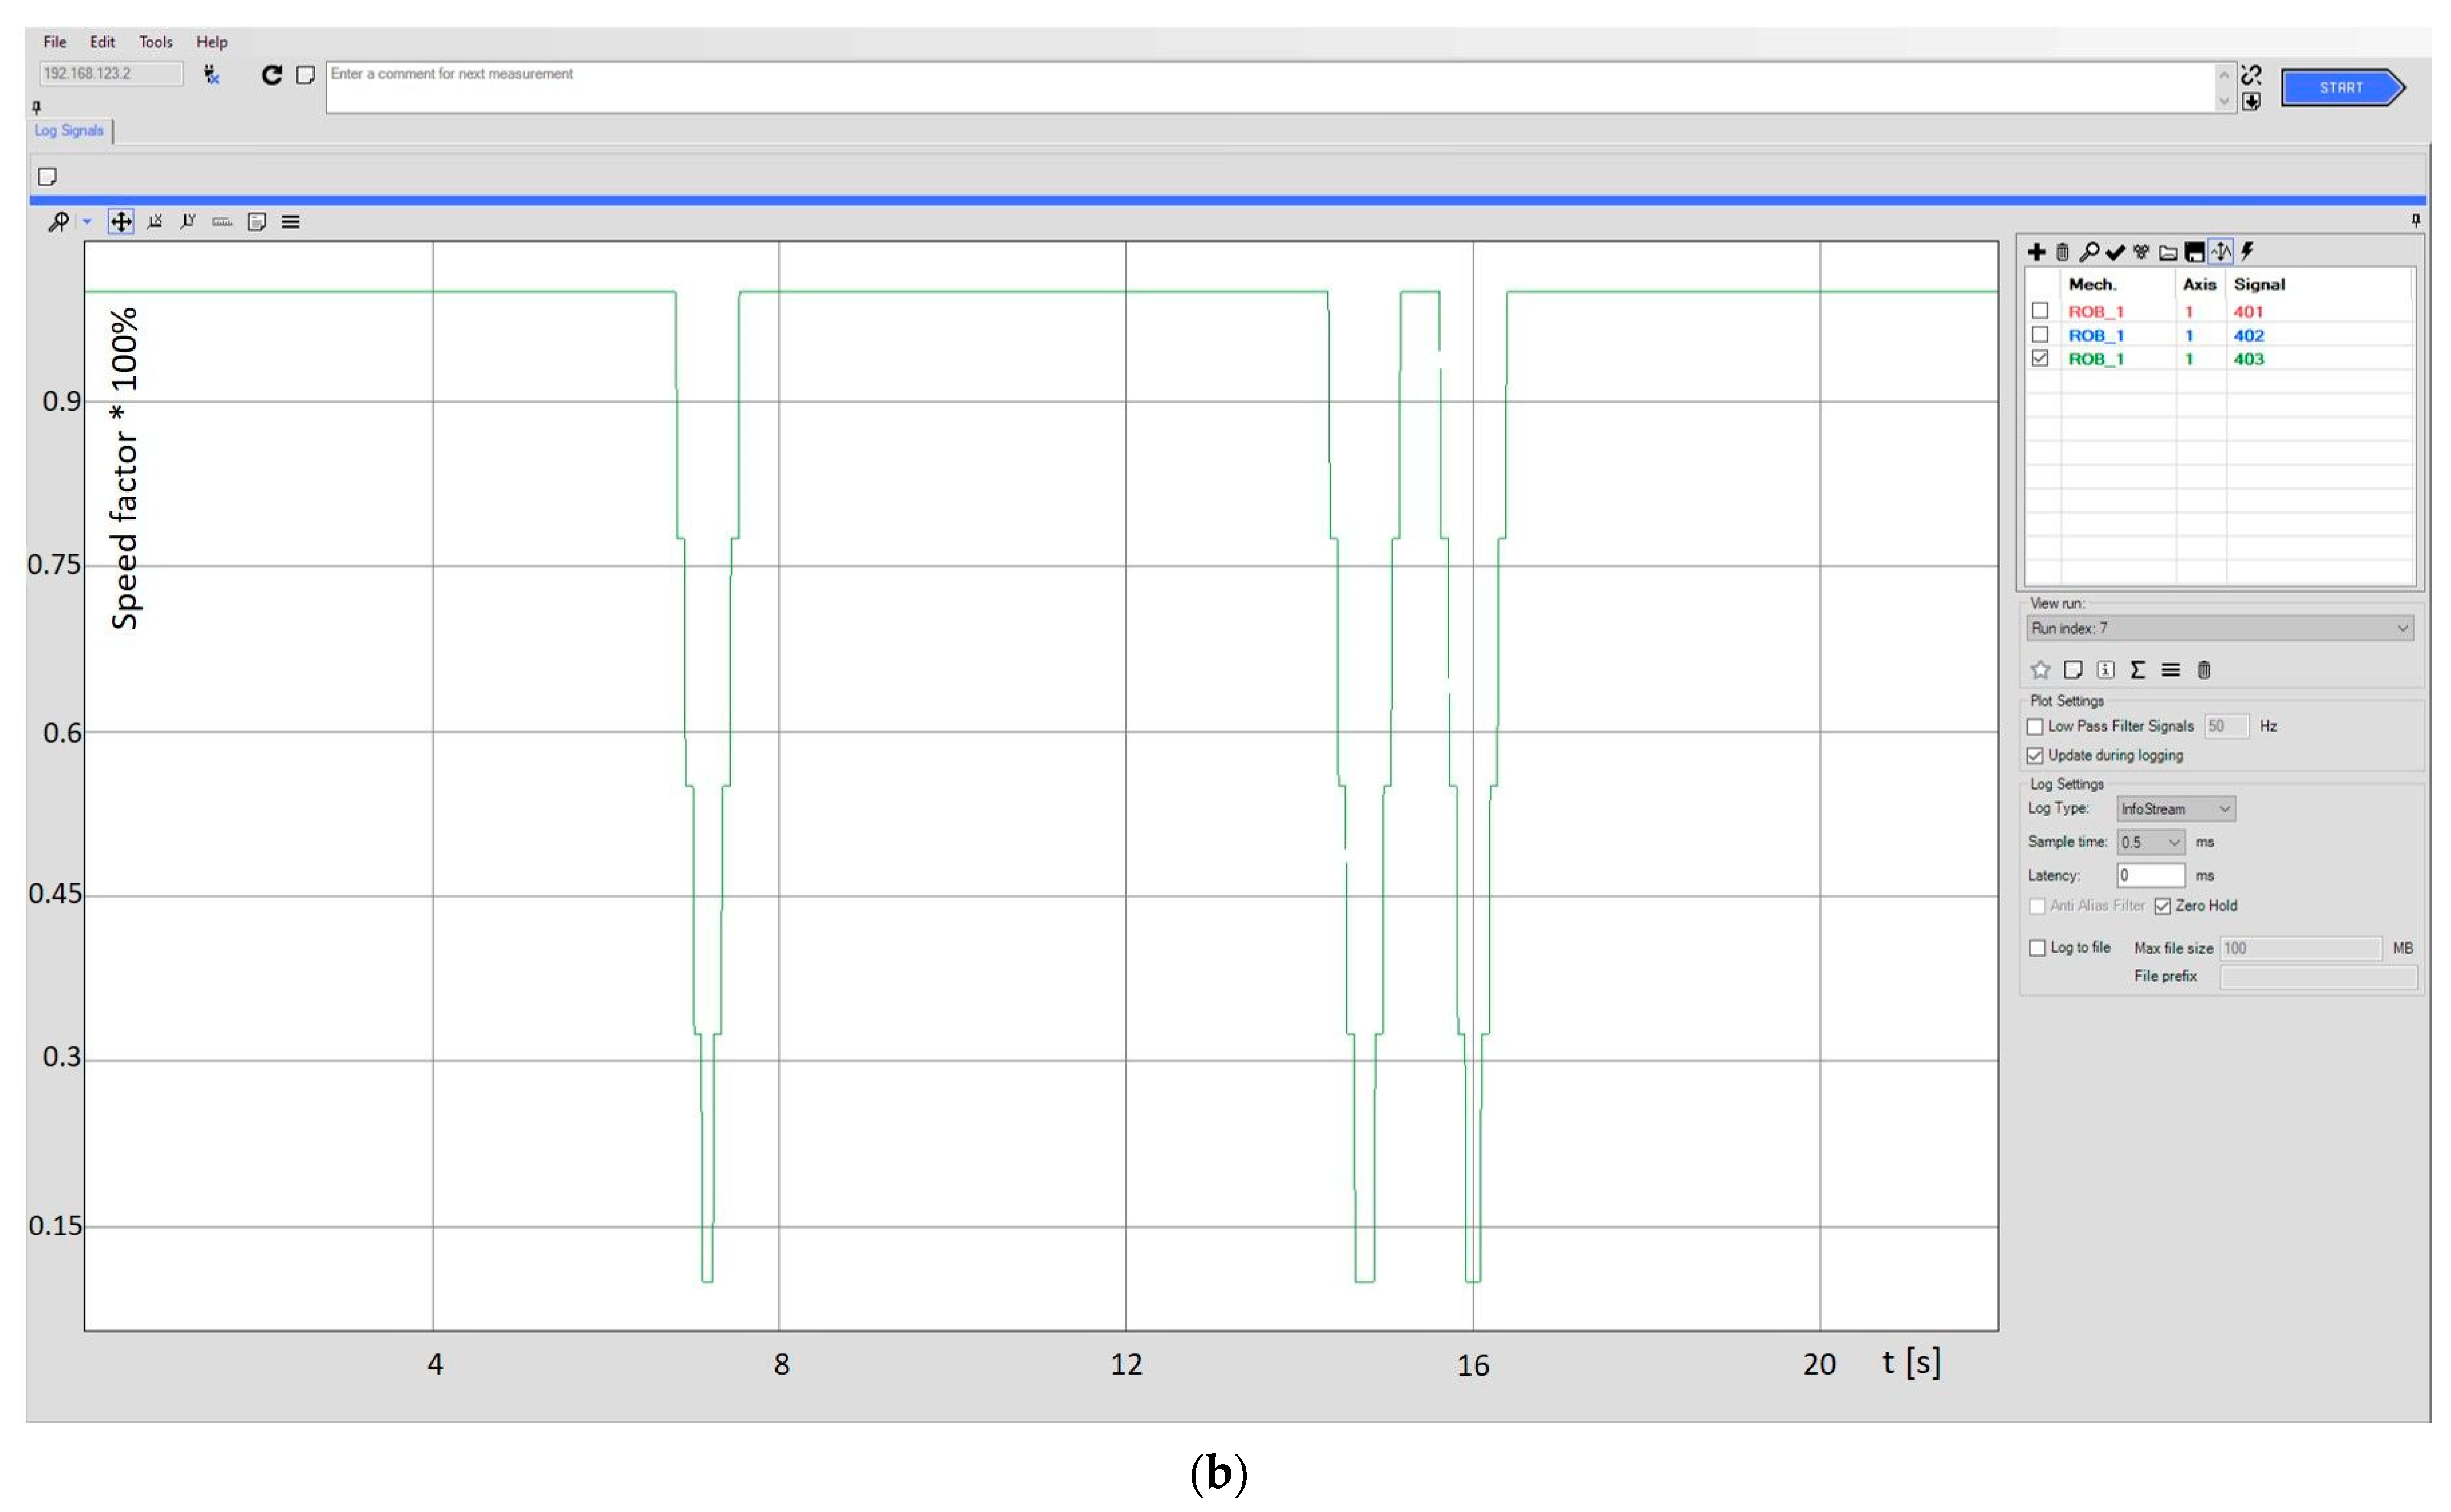
Figure 16.
The tuned parameter for this solution was the value of the force at which the robot’s TCP feed rate is reduced (
Figure 16a, signal 401, red color). This is a very important limiting parameter. With cutting forces (
Figure 16a, signal 402, blue color) below the accepted value, the TCP moved with the feed rate specified by the programmer, e.g., 100 mm/s. When the limit value was exceeded, the feed rate was reduced (value 1 corresponds to the speed set by the programmer, picture 16b, signal 403, green color). The limiting force parameter was tuned using Tune Master software. The selection of this parameter was carried out experimentally. The authors set the maximum feed rate specified by the cutting tool manufacturer. Contact forces were then recorded. If the contact force that occurred was safe for the tool then it was taken as a limit and set as a parameter in the software. If this parameter was selected, the cycle time was optimized. Efforts were made to achieve the highest possible TCP feed rate, i.e., the shortest possible machining time for the part. The most important criterion was not to allow damage to the tool. It was checked that the forces during cutting did not exceed the maximum forces allowed by the tool manufacturer. The software and optimization resulted in a machining cycle time of 750 s. On the basis of references from similar projects, it can be assumed that the cycle time without optimization would be 30% longer.
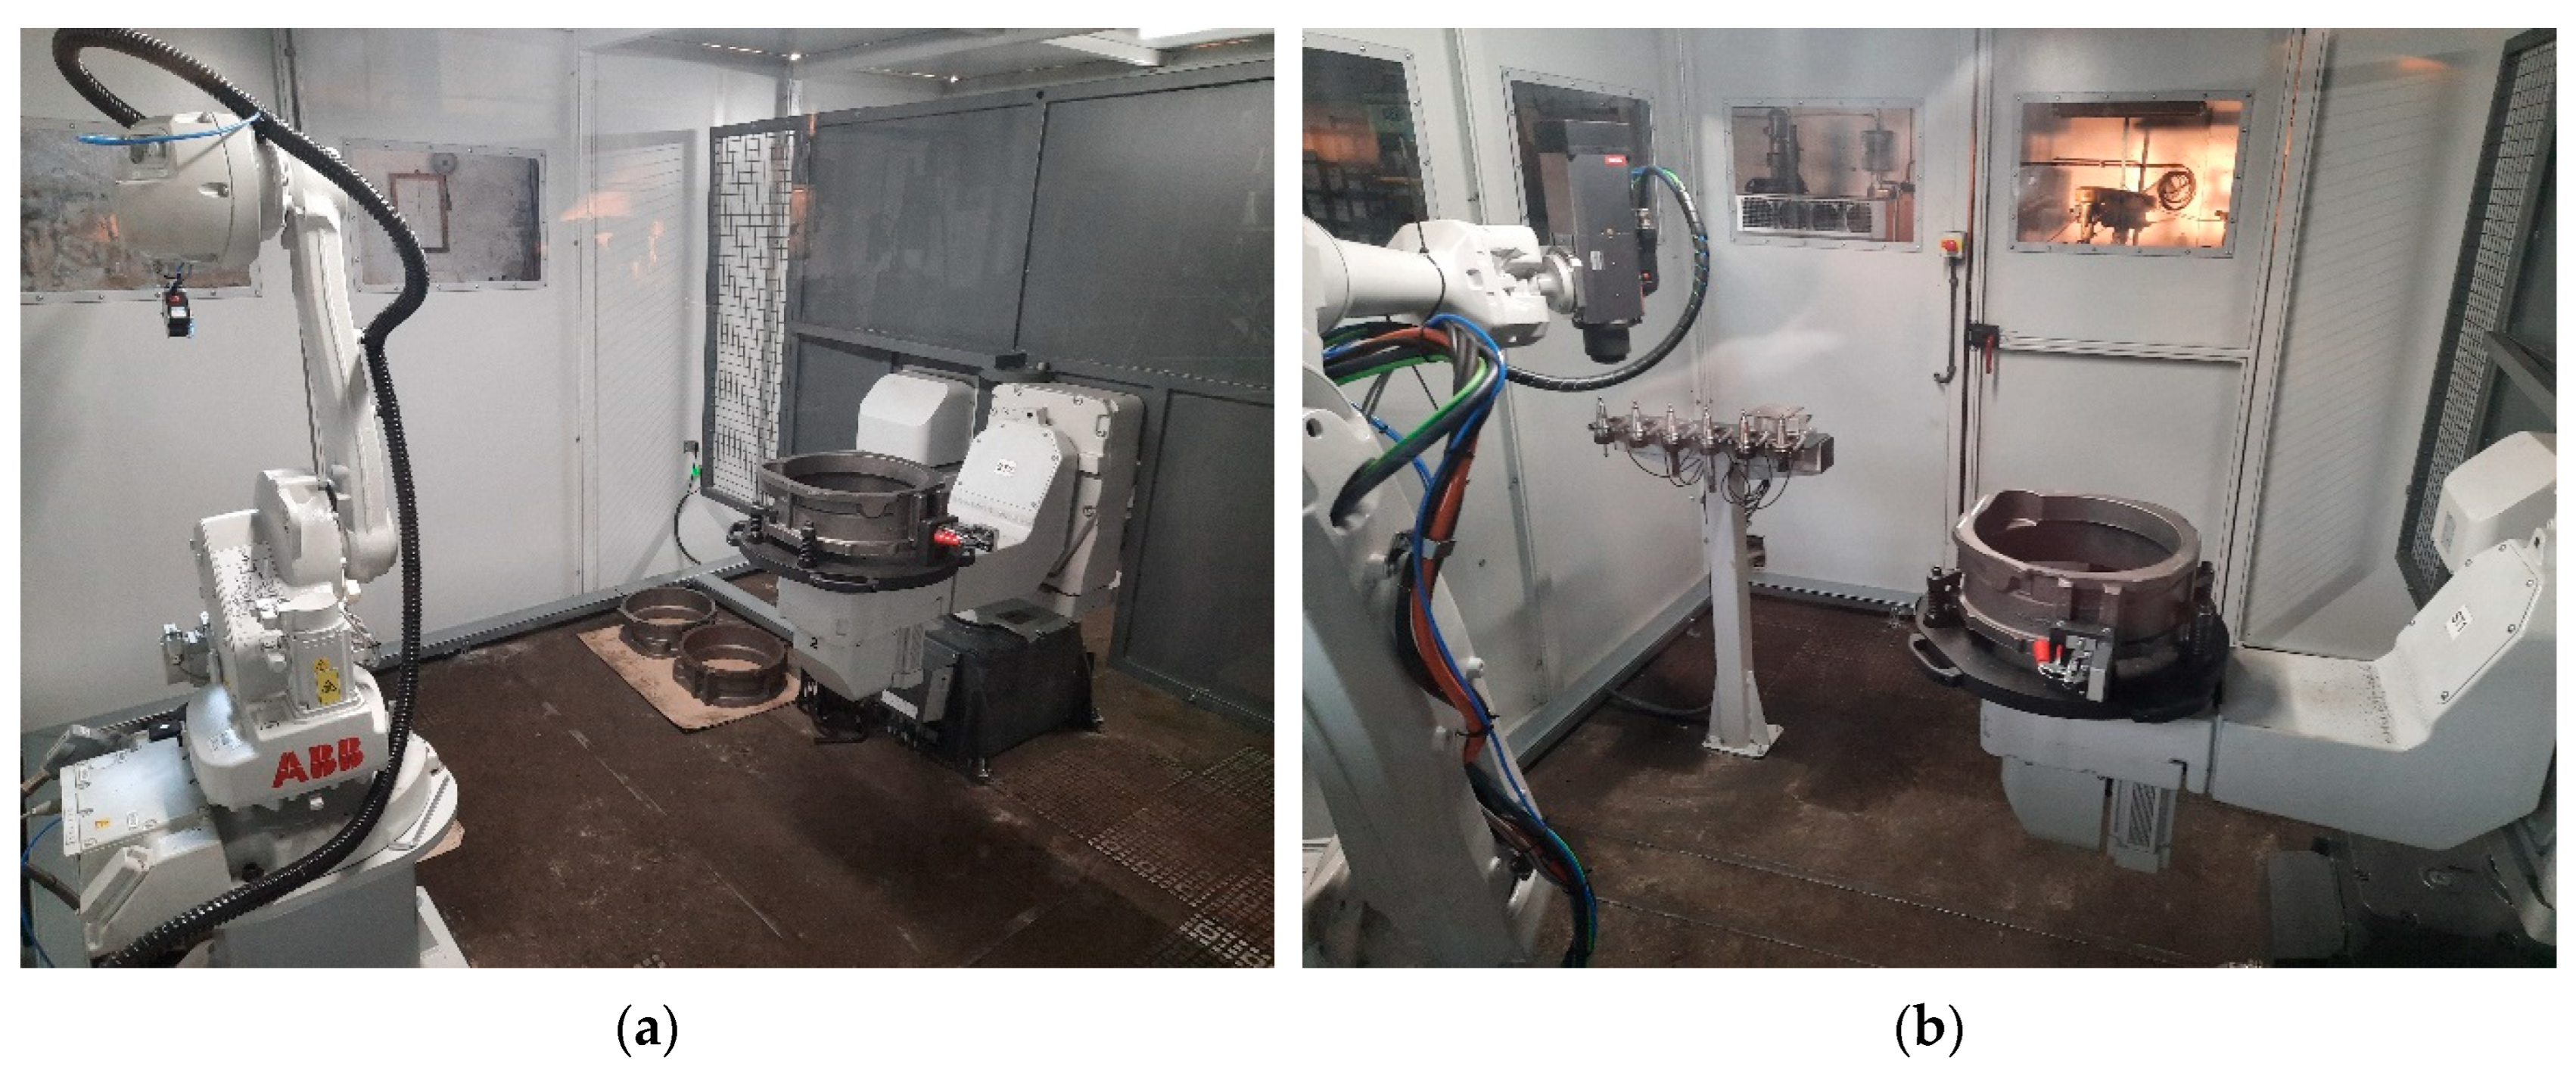
The use of the Tune Master software enabled the optimization and correct programming of the casting machining station, which was implemented in a Kutno foundry powered by Luma Automation. Photos of the work in the laboratory and the implementation in the production plant are presented in
Figure 17 and
Figure 18.
4. Conclusions
The paper presented examples of the use of three programs to monitor the operation of ABB robotic stations with the IRC5 controller. Their possibilities, functionalities and industrial examples of use were shown. The presented programs, thanks to the possibility of monitoring, recording, and data processing, can extend the possibilities of implementing robotic stations to more demanding technological processes. The use of the aforementioned IT tools in many cases allows for a significant reduction in the programming time of robots, and in some cases for the optimization of energy consumption, which brings financial gains over a wide time horizon.
In our practice, we have so far used the abovementioned software to carry out such tasks as the development of a robotic process of deburring the edges of parts with variable shape used in aircraft engines with the use of the automatic tool trajectory adaptation system. The work was carried out for the diffuser of the V2500 engine used in Airbus A320 and McDonnell Douglas MD-90 airplanes. Another example is the already mentioned station for measuring the thickness of the segments of the OGVs of the GP7000 engine produced by a wide consortium, including by Pratt and Whitney, used in the Airbus A380 aircraft. In addition, monitoring software was widely used in work on the automation of machining thin-walled aircraft gearbox housings made of light alloys. The research work carried out concerned the deburring of the machined sections of the aluminum ADT housing of the PW1500G engine used in the Airbus A220 aircraft. The aforementioned software was widely used in the selection of parameters for the robotic blade grinding process of the PT6 motor manufactured by Pratt and Whitney. The company also benefited from the work related to polishing the teeth of the FDGS gear wheels. The monitoring of brush wear in the process of deburring the blade locks of the CFM International LEAP engine used in the Airbus A320 and Boeing 737 aircrafts commissioned by Safran Aircraft Engines is another example of the use of monitoring programs. An example of implementation in the automotive industry is the already mentioned work on the development and commissioning of a technology for the production of highly accurate iron castings for the automotive sector, consisting of the machining of cast housings. Research work was commissioned by Luma Automation S.A.
In conclusion, the described possibilities of programs for monitoring robotic processes by ABB can become very valuable information, giving rise to new ideas and solutions, and showing new possibilities of implementing complex processes.


 ,
, 


