Article

A Machine Learning Method for Prediction of Stock Market Using Real-Time Twitter Data

1
Department of Information Technology, College of Computer, Qassim University, Buraydah 52571, Saudi Arabia
2
Department of Computer Science, University of Engineering and Technology, Taxila 39161, Pakistan
3
Department of Computer and Electrical Engineering, University of Michigan, Dearborn, MI 48128, USA
*
Author to whom correspondence should be addressed.
Electronics 2022, 11(20), 3414; https://doi.org/10.3390/electronics11203414
Submission received: 19 September 2022 / Revised: 3 October 2022 / Accepted: 4 October 2022 / Published: 21 October 2022
(This article belongs to the Section Computer Science & Engineering)

Abstract

:
Finances represent one of the key requirements to perform any useful activity for humanity. Financial markets, e.g., stock markets, forex, and mercantile exchanges, etc., provide the opportunity to anyone to invest and generate finances. However, to reap maximum benefits from these financial markets, effective decision making is required to identify the trade directions, e.g., going long/short by analyzing all the influential factors, e.g., price action, economic policies, and supply/demand estimation, in a timely manner. In this regard, analysis of the financial news and Twitter posts plays a significant role to predict the future behavior of financial markets, public sentiment estimation, and systematic/idiosyncratic risk estimation. In this paper, our proposed work aims to analyze the Twitter posts and Google Finance data to predict the future behavior of the stock markets (one of the key financial markets) in a particular time frame, i.e., hourly, daily, weekly, etc., through a novel StockSentiWordNet (SSWN) model. The proposed SSWN model extends the standard opinion lexicon named SentiWordNet (SWN) through the terms specifically related to the stock markets to train extreme learning machine (ELM) and recurrent neural network (RNN) for stock price prediction. The experiments are performed on two datasets, i.e., Sentiment140 and Twitter datasets, and achieved the accuracy value of 86.06%. Findings show that our work outperforms the state-of-the-art approaches with respect to overall accuracy. In future, we plan to enhance the capability of our method by adding other popular social media, e.g., Facebook and Google News etc.

1. Introduction

Stock price fluctuation signifies the existing market trends and company evolution that might be measured to sell or buy stocks. A stock market estimate has been considered as one of the highly challenging and essential tasks due to its nonlinear or dynamic behavior [1]. Stock prices turn up and down every minute or even every second because of variations in demand and supply. If a group of individuals wants to purchase a specific stock, its price will rise. Whereas, when most people owning a specific stock want to sell it, its market price will decrease. This association among supply and demand is tied into the news, blogs, and sentiment analysis (SA), etc. Stock market prediction using SA deals with automatic [2] performance of the stock market. In this regard, Twitter is the most popular platform that can be used to predict public opinion, so it can be useful for forecasting the stock market price [3].
Nowadays, there has been a debate on the effectiveness of the sentiments conveyed via social media in forecasting the change in the stock market. Various researchers have revealed that sentiments might influence the stock market movement and act as potential predictors for trade-off outcomes [4,5]. Furthermore, different methods of sentiment mining can be employed differently in numerous stock circumstances [6]. In other words, there are a lot of responsibilities involved in evaluating opinions about the traits and features of stocks. [7,8]. However, the existing techniques do not suggest an absolute reliance on the number of tweets per unit of time. The amount of data gathered and analyzed during the existing studies remain inadequate, thus causing predictions with low accuracy [9,10].
Even though extensive techniques have been presented by the research community for stock market prediction, these approaches have some potential limitations. The existing methods are not robust to tackle the versatile nature of stocks. Furthermore, the massive size of data requires such methods which can learn a more reliable set of features to better demonstrate the varying behaviors of stocks over the time. Hence, there is a need for performance enhancement both for the stock trends prediction accuracy and time complexity.
To deal with the issues of current approaches, we propose the technique namely the SSWN with ELM classifier for stock market prediction. The presented method comprises three main steps which are data gathering, sentiments computation along with model training, and finally the stock market prediction module. More descriptively these are the contributions of this paper:
  • An efficient framework namely SSWN is proposed with ELM and RNN classifiers for stock market behavior prediction.
  • Utilization of SA for stock market prediction and modification of SWN by introducing new terms related to stock market.
  • Assignment of sentiment scores to newly introduced stock market-related terms by applying the information gain method, resulting in the development of a new sentiment lexicon SSWN.
  • To perform comparative analysis with other methods to show the effectiveness of proposed method.
The remainder of this paper is structured as follows: Section 2 shows the related work. The proposed method is presented in Section 3. Experiments and results are described in Section 4, while Section 5 concludes our work.

2. Related Work

Numerous studies [11,12,13,14,15,16,17,18,19,20,21] have been exhibited on employing electronic knowledge to forecast stock trends. For instance, Zhang et al. [22] proposed an LSTM based method to estimate the stock market trend. In the first step, the input is partitioned into three parts: open opinion space, stock transaction, and market transaction data. The one-layer LSTM was employed to prepare long memory in public opinion space, whereas two layers of LSTM were applied to train short memory in stock series and market. After this, data were combined by using the merged layer, and a linear layer was utilized to enhance the model results. The method predicts the market behavior and evaluates the relationship between the emotions of investors and transaction data. However, the method needs further improvements in the emotion abstraction technique. Xu et al. [23] presented a method for the forecast of the stock market by introducing the SA. Initially, the dataset is gathered by using a heuristic mean-end process, and then sentiments are identified from the acquired data. SA was combined with event study and the result was used as the input of principal component analysis (PCA), which was used for further analysis. The method predicts the market behavior using SA with an accuracy of 84.89%. However, the method faces stability-related issues and there exists an inequality between the forecast and real values.
Wu et al. [24] proposed a deep learning (DL) method for the prediction of the stock dimensional valence-arousal sentiments in the stock market. The method used the title, keywords, and overview of stock market-related messages for estimation of all vectors using the hieratical attention approach. The method achieved success, producing better results. However, it cannot identify the words with multiple meanings, and it also needs some stability improvements. Similar to the aforementioned technique, a DL-based method was employed in [22] for extrapolation of Stock market using sentiment analysis. The model is based on RNN and LSTM techniques which is then utilized to define the sentiments into positive and negative class. The increase or decrease in stock prices is predicted from sentiment analysis. Ren et al. [15] presented a framework for prediction by examining the sentiments of investors. Initially, the financial reviewed content was gathered from two sites namely Sina Finance and Eastmoney. Then, the SVM was trained over the financial data to predict an essential index in China, namely SSE 50 Index, by applying a five-fold cross-validation technique. The method confirmed that merging the sentiment keypoints with stock market data can obtain robust results in comparison to utilizing only stock market data in estimating movement direction. However, this technique is not robust to analyze large data in real-time. Bouktif et al. [14] introduced an approach to predict the stock market’s future directions. Initially, stock data are gathered from online resources together with public tweets. In the second step, the NLP approach was applied to compute the informative key-points from the tweets. Then, several ML-based methods, namely naive Bayes, logistic regression, SVM, ANN, random forest, and XGBoost, were trained to classify the data. The technique needs further improvement for complex textual features.
Kelotra et al. [13] offered a DL based technique namely the Rider-monarch butterfly optimization (MBO)-based on the ConvLSTM framework for stock market prediction. In the first step, the input data were collected from the livestock market which was passed to the key-points computation process to calculate the technical indicators-based representative set of features. In the next step, the clustering technique, namely sparse-fuzzy C-means (FCM), was employed over the extracted key-points to group them. After this, the highly important key-points were passed to the presented RiderMBO-based Deep-ConvLSTM network to perform prediction. Another sentiment analysis-based stock market prediction approach was presented in [12], which makes use of computed textual deep features. After gathering the stock market data, CNN and RNN were employed to compute the deep features. After this, PCA and LDA algorithms were applied to extract the significant set of features. Finally, the SVM classifier was trained over the calculated features for stock market movements prediction. The model performs well for stock market prediction, but it may not exhibit better performance over real-world scenarios. Similarly, in [11], a DL-based framework employing sentiment analysis for stock market prediction was presented. The LSTM model was utilized to forecast the future closing values of a stock market. Supporting the English-only tweets, this method is robust to calculate the stock market movements.
The user responses from historic articles can be employed to predict consumer behaviors with time. One such method was presented in [25] using a dual CNN approach with user behaviors to embed both the semantic and structural information from text articles. Another approach employing Pillar 3 disclosed information was presented in [26] that focused on the investigation of deposit users’ interests and behavior using information from websites that were rooted deeply in commercial bank disclosures. The Pillar 3 regulatory framework’s objective was to strengthen price stability by ensuring accountability and improving financial institutions’ public disclosures. The work [26] performs well for analyzing consumer behavior. However, the model needs evaluation on a standard dataset.

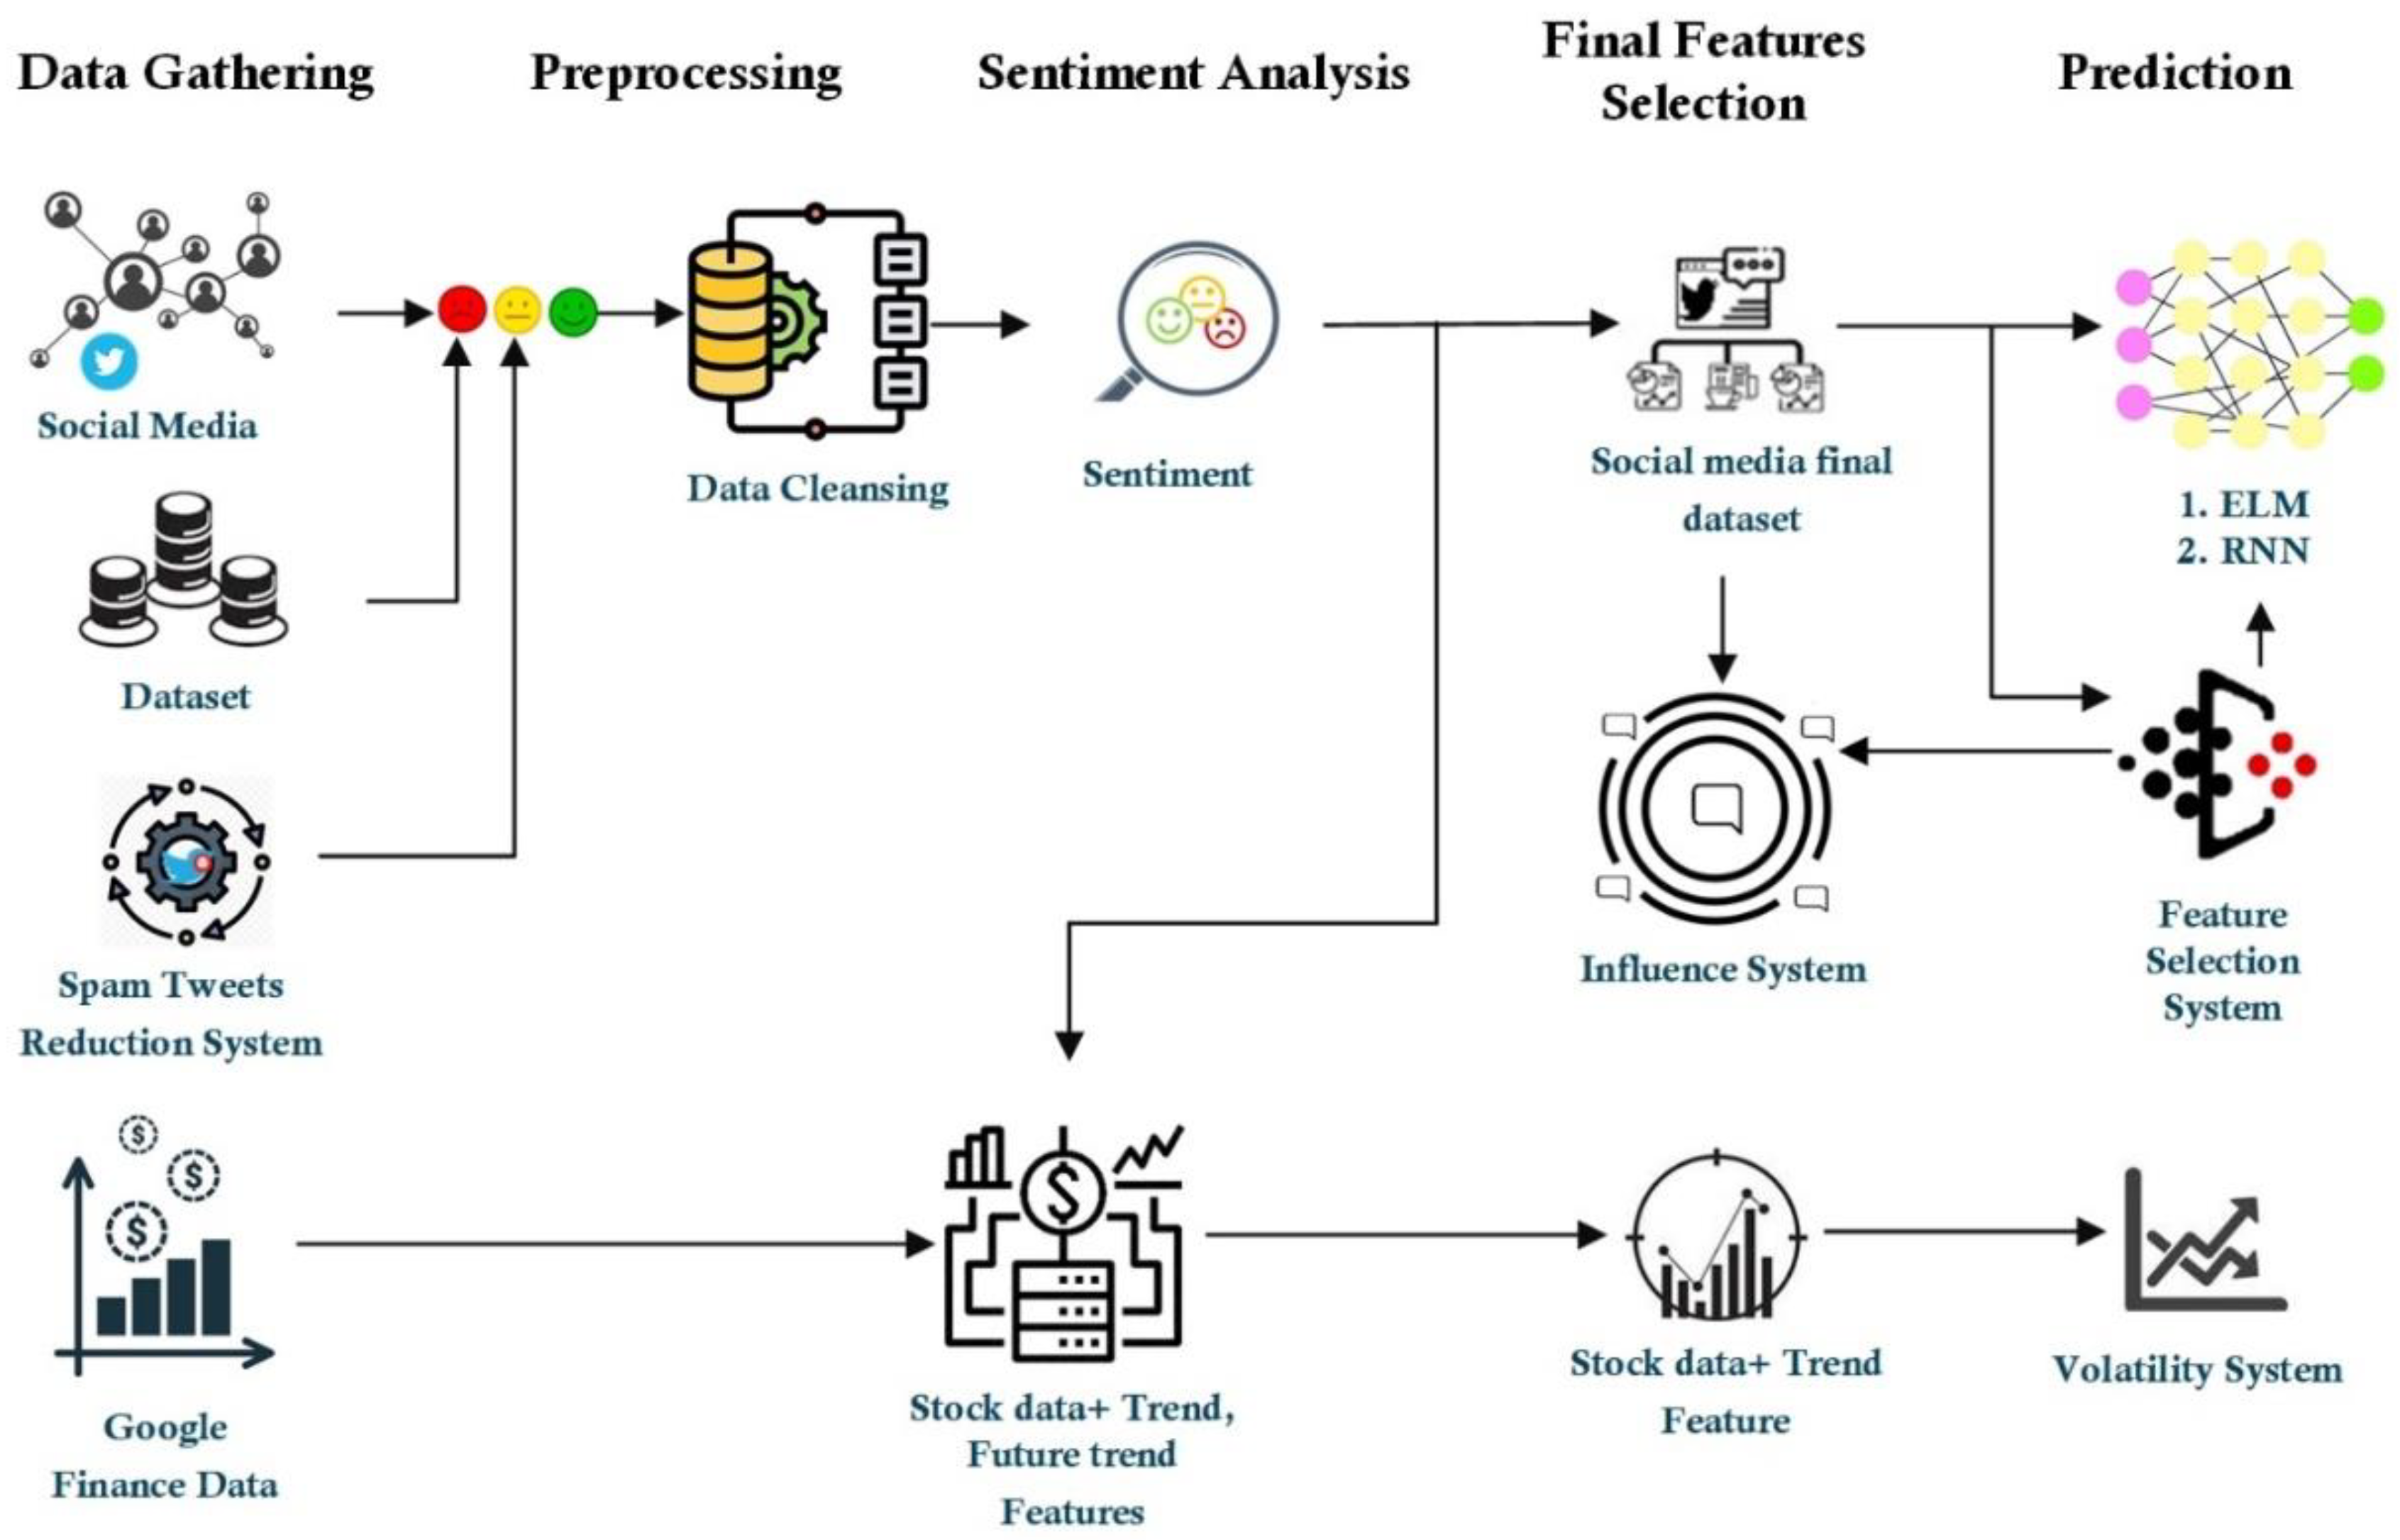
3. Proposed Methodology

Our proposed technique encompasses three steps: data gathering, extraction of sentiments, training, and prediction of the stock market.

3.1. Data Gathering and Cleansing

First, we gather data from Twitter. This social media platform is selected due to its conciseness. In addition to tweets data directly extracted from Twitter, we have used the state-of-the-art dataset named Sentiment140 [27]. After data acquisition, we cleanse this collected data by removing spam, redundant, meaningless or irrelevant tweets by using a reduction system. The preprocessing step further includes the following:
  • Conversion of tweets into word tokens by using bigrams, meaning that the model evaluates two tokens/words at the same time. This means that if a tweet describes something as “not good”, that will be considered as a negative remark, rather than a positive one just because it contains the word “good”.
  • Removal of tags like author tag (@). These labels must be eliminated because they contain no valuable knowledge for obtaining sentiments.
  • Removal of URLs.
  • Elimination of Stop words. Stop words frequently exist in tweets like an, is, are, the, etc.) and have no helpful material for ML classifiers.
  • Conversion of words into the identical stems; called word stemming.
  • Removal of duplicate tweets.
After preprocessing, the cleansed dataset is used for feature extraction and sentiment identification by using the ML algorithm. This process formed the raw twitter data into a standard dataset containing a feature set and tweets with their predicted sentiments, i.e., Positive, Negative and Neutral denoted by 1, −1, and 0, respectively. Furthermore, neutral tweets can cause an imbalance in the training process which can degrade the performance of the classifier. To remove the neutral tweets, we used a simple algorithm which identified them by their label (i.e., 0) and filtered them out of the dataset, resulting in the reduced version of the dataset with no neutral tweets. The dataset is further reduced by removing neutral tweets as they do not play any role in the prediction process. The removal of neutral tweets is necessary for two reasons; (i) neutral tweets do not contain any opinion or sentiment polarity, hence they do not play any significant role in opinion mining, and (ii) the inclusion of neutral set of tweets causes a bigger dataset, resulting in the extra and unnecessary overhead for the classifier during model training [28,29,30]. The overall architecture is shown in Figure 1.
Secondly, we also make use of stock market data provided at Google Finance, where Global historical stock data is available. The price data of chosen stocks is selected and downloaded from the service provider in a CSV file. The collected data maintain seven features named: date, open, high, low, close, volume, and adjusted close. These features indicate traded date, opening price, highest price for trading, lowest price for trading, price at closing, traded shares, and stock closing price when investors are paid their dividends, respectively. This data is also preprocessed by adding some calculated values based on existing features (i.e., 5-day price difference, 10-day price difference, extrapolated prices during holidays, and return of the market (RM)), and removing some columns including adjusted close price, volume, and opening price. The reasons for adding those calculated values are as follow: the 5- and 10-day price difference provides a brief past behavior of the stock under discussion. The closing prices for weekend have been extrapolated to complete the timeline of the dataset, which may result in improved overall accuracy of the model [4]. The return of the market (RM) is calculated to provide an investor a probabilistic idea of risk vs. expected profit.
After the preprocessing stage for both data sources have been completed, the next step is model training and stock prediction. An ELM and RNN-based model have been trained using the extracted features from the Twitter and Google Finance datasets. Both datasets are distributed into two subsets; the first 70% is reserved for training and the second 30% for testing/validation. More details about the incorporated datasets have been provided in the results and discussions section.

3.2. Feature Extraction

Once the data re passed from the preprocessed stage, they are forwarded to the feature extraction stage where further data processing is performed. For this reason, we have proposed a novel approach, namely the SSWN. A detailed description of the proposed approach is given in the subsequent sections.

3.2.1. SWN

Several lexical resources are highly utilized in various investigations. A summary of the highly applied assets is given in Table 1. The first lexical resource mentioned in the table named SenticNet is a semantic resource which is publicly available and used for performing SA at concept-level. It does not use the standard graph mining techniques, rather it uses as custom-devised concept ‘energy flows’ for common sense knowledge representations. On the other hand, AFINN one of the simplest and popular lexicons containing hundreds of synsets and words associated with a polarity score ranging from −5 to 5. Similarly, SO-CAL is also a lexical resource which more than six thousand Synsets while assigning each word a polarity score ranging from −5 to 5. Another popular lexical resource is WordNet, which is a superficial resemblance of thesaurus, grouping the words together based on their meanings. It is a freely available large lexical database which groups nouns, verbs, adverbs and adjectives into synsets, also known as cognitive synonyms. Additionally, WordNet-Affect extends the domains of WordNet by further including a subset of cognitive synonyms (synsets) which are appropriate for representing the affective concepts in a correlation with affective words. There are several applications of SWN in SA that can be employed to predict the stock market as the structure of its key points is convenient to perform the mathematical modeling. SWN is a lexical resource for opinion mining [23], in which every synset of WordNet, a triple of polarity scores is named, i.e., a positivity, negativity, and objectivity score. SWN has been established routinely by implying a mixture of linguistic and statistic classifiers. It has been employed in various opinion-related missions, i.e., for bias analysis and SA with encouraging findings.

3.2.2. SSWN

For predicting the future trends of stock market, we have introduced SSWN, which is based on SWN 3.0 and contains a set of feature words specifically helpful to identify and score tweets related to stock market only. The SSWN creation procedure starts with two seed sets. The first group comprises positive terms while the other contains negative terms. The seed groups are extended by combining all the synsets from SWN related to the seed words. A particular value of the radius is chosen for seed expansion. Another set namely objective word is also introduced. In the second step, the computed seeds are used to classify the SSWN synsets into positive and negative classes. In the presented approach, we have employed classifiers along with four choices of radius = 0, 2, 4, 6. The outputs from all classifiers are averaged to decide the final value of the synset. Table 2 describes a SSWN sample in which every tuple of SSWN specifies a synset comprised of dialogue data, an identifier that links the synset with WordNet, scores, and a gloss that keeps the denotation together with the usage of the values available in each synset. All words/tokens in each row of the cleansed data are replaced with the calculated scores, resulting in a feature matrix which is aligned/standardized with the input requirements of the ELM classifier. The objective score (OS) can be calculated as:
O S = 1 ( P S + N S )
where PS is the positive score while NS is negative. The sentiment score (SS) can be calculated using Equation (2):
S S = P S N S
The strength of sentiment (ST) can be found through Equation (3), in which r is the rank of the feature.
S T = r = 1 n S S ( r ) / r
Table 3 demonstrates the relationship between a term t and a class c.

Information Gain (IG)

IG, also termed as expected mutual information, is an ML-based technique that is employed to compute the term goodness for a given technique [23]. It works by computing the bits of information based on the existence or absence of a word in a file. For example, the collection of groups in a target space is represented by [30] i = 1, …, m. Then, the IG for a term t is computed by using the formula in Equation (4).
G ( t ) = i = 1 m P r ( c i ) log P r ( c i ) + P r ( t ) i = 1 m P r ( c i / t ) log P r ( c i / t ) + P r ( t ¯ ) i = 1 m P r ( c i / t ¯ ) log P r ( c i / t ¯ )
It is a simplified type of binary categorization [21] as text categorization approaches typically use n-array classification space, i.e., the range of n can be up to tens of thousands. Furthermore, the goodness of a value is calculated universally in accordance with all classes on average. The IG value is computed for every distinctive term for a specified corpus. Furthermore, a threshold is defined against the IG score based on which terms are eliminated from the corpus. The computation complexity for IG is O(Vn), where V is vocabulary size and n is n-array categorization. By employing the correlation table, the IG value is computed through Equation (5). The greater the value of IG, the better the union.
I G ( t , c ) B × N × log B ( B + D ) × ( A + B )

Sentiment Knowledge Base (SKB) Generation Procedure

To produce the SKB, the presented approach follows the following steps:
  • Take all rows from SSWN one by one.
  • Compute synset from each selected row.
  • Calculate the sentiment orientation (SO) for each synset.
  • If the computed SO is found to be subjective thengo for step 5, else remove the selected synset and jump to step 1 again.
  • For each subjective synset, locate and calculate the portions of its speech information.
  • Find specific words from the synset.
  • Calculate feature vector by combining all individual terms along with speech chunks differentiated with a hash, i.e., term#POS.
  • Save the computed key points in the list of nominated features.
  • Repeat steps 1–8 for all the rows.
  • The same feature can have replicated records with different polarity and sentiment scores in the keypoints list because of its sense ranking-based usage. So, this step is performed to locate the distinctive features.
  • The positive and negative occurrences are computed for all the features detected in step 10.
  • Based on the count score computed from the step 11, IG is employed to produce sentiment scores.
  • Finally, a distinctive identifier (ID) is allocated to each feature.
The SKBs produced via this procedure are domain-independent as sentiment strength is computed through employing a generic sentiment lexicon that does not require the training from a specific domain. The presented SKBs are capable to deal with the problem of data absence and data diversity. Moreover, these SKBs can easily locate the sentiment orientation, weightage, and sense of words based on their usage. These sentiment resources are used in the introduced technique to improve SA specifically for stock market prediction and for SA in general. Table 4 shows a sample from the proposed lexical resource SSWN. Another challenging problem for effective SA is the constant occurrence of new words or sentences. Hence, there is a need for such a method that can deal with a database comprising frequent out-of-vocabulary (OOV) words. In natural language processing, the words which are present in testing/real data set but not available in the training dataset are called out of vocabulary (OOV) words. The main issue is that the model mistakenly assigns zero probability to OOV words, which results in likelihood of a word equal to zero. This common problem normally occurs when the model is trained on larger dataset. There are multiple solutions to solve this problem, including tokenization, smoothing technique, and semantic representations [42,43]. As OOV terms belong to a specific domain, intensive domain information is needed to specify its strength. To cope with this issue, usually, active learning is employed in which a polarity score is computed through humans. To evade the bias, we have chosen only those OOV words for which at least ten persons have voted. The final sentiment score is computed by taking the average value of all ten scores.

3.3. Prediction Phase

The link between stocks and sentiments is definitely nonlinear. Hence, after discovering a causality association between the moods over the past 3 days and present-day stock prices, we attempted two techniques (ELM and RNN) to discover and examine the definite association [44], and financial markets often follow nonlinear trends. As discussed earlier, the proposed technique incorporates two datasets, i.e., data extracted from Twitter and a state-of-the-art dataset named Sentiment140. The features extracted from Twitter data by using SSWN have been incorporated to predict the stock trends by using the past three days stock data extracted from Google Finance. These extracted features are then utilized to predict the current day’s stock trends of a set of specific brands.

3.3.1. Extreme Learning Machine

The important characteristics of text classification include a large number of training samples and high text dimensionality. The high dimension of the text results is increased computational burden to the ELM. A traditional and effective method to resolve this issue is to reduce text dimensionality by using some text representations which help increase the clarification accuracy. The researchers often use vector space model (VSM) for text representation in text classification. Compared with other text representation methods, word vector representation has proven to have better text representation ability. Word vector deals with dimensionality problem by mapping each term (a distinct word in textual dataset) with a real vector with low dimension by training the unlabeled corpus. We have considered open, high, and low as input to the ELM and closing price as output of the ELM. In the proposed approach, the ELM classifier [45] was initially introduced for a feed-forward neural network with a single hidden layer without the need to tune it. The output with L hidden nodes for training set is explained in Equation (6):
f L ( x ) = i = 1 L β i h i ( x ) = h ( x ) β
Here, β = { β 1 , , β L } T is presenting output weights among the nodes of the hidden and output layer while h ( x ) = { h 1 ( x ) , , h L ( x ) } is the output vector. The decision method for ELM classifier is given as:
f L ( x ) = s i g n ( h ( x ) β )
To obtain the robust performance, the ELM aims to deal with the lowest training error and reach the minimum norm of the resultant weights by reducing the given objective function:
M i n i m i z e : | | H β T | | 2 a n d | | β | |
Here, H is showing the output matrix from hidden layers.
H = h x 1 h x N = h 1 x 1 h L x 1 h 1 x N h L x N
To reduce the norm of the output weights, ELM draws an optimal hyper-plane to classify the samples into different classes through maximizing the margin: 2 / | | β | | by employing the nominal least square approach as:
β = H T
Here, H presents the Moore–Penrose generalized inverse of the matrix that is calculated by using the orthogonalization, orthogonal projection, and singular value decomposition approaches.
The desired output of ELM is:
T t e s t = β H

3.3.2. Recurrent Neural Network

Recurrent neural network, aka RNN is suitable in the problems in which we must deal with a sequence of data. Many researchers recommend using RNN for time series analysis [8,9,10]. In this type of work, the model learns from its current observing, also known as Short-term memory of the network, resembling the frontal lobe of the brain. The reason for using RNN when we are going to deal with sequential data is that the model uses its short-term memory to predict the upcoming data with more accuracy. Rather than using a fix deadline for deleting the past data, the weights allotted to past data determine the time for which these data will be kept in memory. Thus, RNN is more suitable in the case of problems, such as sequence labeling, sentiment analysis, and speech tagging, etc. [46,47].
Time series analysis is generally an important problem which can be resolved by using RNN. In this problem, we need to work with data which is in sequential order. Such works involve learning from the most recent observations, alternatively called short-term memory. This work primarily focuses on text classification. So, RNN in this research, is used for classification of Twitter data. We propose a model to predict the closing price of the stock market.
Twitter data are not in a uniform format, meaning that number of words in a tweet may vary from 3–5 words to 17–20 words, for example. However, our neural network does not accept input in this form. We need to convert this data into a uniform format. The most appropriate solution to this problem can be embedding and padding the data rows. The embedding process involves representing the words with vectors by using the procedure mentioned in the discussion related to ELM. The position of a term or word in a vector space is determined and it is represented in the feature vector. The embedding data then needs to be in the uniform length, so we pad the data with zeros.
RNN [48] employs links among nodes to build a directed graph over a timeframe. This enables it to show sequential vibrant behavior. RNN utilizes its memory to manipulate the varying length sequences of inputs which makes it appropriate for the stock prediction. Every processing unit in an RNN consists of time-based arbitrary real valued activation and adaptable weight which are generated by employing the same set of weights in a loop over a graph-like structure. Equation (12) is used to specify the values of hidden units.
H t = f ( h t 1 , x t ; θ )
In RNN, the size of the input remains same for each learned model, as, it is indicated in the form of shift from one state to another. Moreover, the structure employs the identical transition function having the same parameters for each time step. RNN stores the output of the previous layers to make predictions which enables it to work with sequential data. In this work, we have tested the RNN for prediction of stock market behavior.

4. Experimental Results

This section describes the demographics of datasets used, an overview of the evaluation metrics, and a comprehensive discussion of the results achieved along with a comparison with state-of-the-art techniques.

4.1. Experimental Setup

The test bed consists of a workstation equipped with an x64 Intel Core i7-6700 CPU clocking at 3.40 GHz with 16 GB of DDR4 RAM and 4 GB of NVIDIA GetForce graphics card. The storage capacity is 1 TB HDD and 256 GB of SSD. The 64-bit operating system is Microsoft Windows 10 Professional which is installed on the SSD. The datasets and working environments are stored on SSD to avoid the mechanical delay caused by the HDD and speedup the model training and testing process.
Python version 3.7.15 along with necessary libraries like NLTK, Stanford NER Tagger, and BeautifulSoup, Numpy, Scikit-learn etc. is installed in Anaconda environment. We have used the Relu activation function and learning rate is 0.001 for our model training. For performance evaluation we have employed different metrics, i.e., accuracy, precision, recall, and F-measure.

4.2. Datasets

As described in the previous sections, we incorporated two datasets, i.e., Sentiment140, which is a state-of-the-art dataset widely used for tasks involving SA, and the other dataset is directly collected from Twitter platform using a Twitter API, i.e., Tweepy.

4.2.1. The Sentiment140 Dataset

The Sentiment140 dataset contains a total of 1.6 M tweets extracted by using a Twitter API [49]. All the tweets have been annotated as negative = 0, neutral = 2, and positive = 4 and are utilized to discover their sentiments. The dataset contains six columns described in Table 5. A detailed description of the Sentiment140 dataset can be found here [27].
We filtered out the tweets mentioning one of the specified brand names in the tweet body. This filtration resulted in a new subset of the Sentiment140 dataset consisting of total 56 K tweets. The set of neutral tweets has been ignored and subtracted from the dataset as neutral tweets do not play any significant role in the stock prediction.

4.2.2. Direct Data from Twitter

This dataset is collected using a custom code which uses a Twitter API. Tweets mentioning the brands are shown in Table 6 and posted during 1 March 2021 to 21 March 2021 have been extracted/downloaded by using a Python library called Tweepy. After performing preprocessing and cleansing steps mentioned in the previous sections, the gathered data are finally in a condition to be processed and used for predicting the stock market value of specific brands. Table 6 demonstrates the demographics of data directly collected from Twitter.
Similar to the steps performed on the setntiment140 dataset, we downloaded the tweets mentioning one of the brands under study by using the previously mentioned custom code. This resulted in a new dataset consisting of approximately 506 K tweets. Additionally, we also calculated the term frequency. Figure 2 depicts a word cloud showing frequently used words in the dataset.
The set of neutral tweets was ignored and excluded from the dataset as neutral tweets do not play any significant role in the stock prediction. After performing preprocessing and subtraction of the neutral tweets, the dataset was further reduced to a total of 224.2 K tweets belonging to positive and negative classes only.

4.2.3. Proposed Method Results

This is section is a detailed discussion about the achieved results by proposed approach. For stock price prediction, we trained two models, i.e., ELM and RNN over both the datasets and reported the average results. Figure 3 shows the results of the proposed method in terms of precision, recall, and f-measure. The said figure depicts that the proposed model shows variable performance from stock to stock. The reason for this is the availability of the training data. Some stocks were found to be mentioned less than others on Twitter, resulting in fewer tweets (i.e., training data) for those brands. Thus, the more data you have for certain stocks, the more accurately the model can predict the output values (stock prices in our case) for those stocks.
From the results, we can say our method performs achieved the good results for predating the stock market behavior. The average values of our proposed system in terms of precision, recall and f-measure are 0.8603, 0.811, and 0.8537, respectively. The column graph shows the brand wise results of our method, in which blue, red, and gray bars show precision, recall, and f-measure, respectively. So, we can say that our method can precisely predict the stock market behavior of all brands.
To further evaluate our method, we have plotted accuracies of all brands in boxplot which can be seen in Figure 4. Figure 4a describes the results of ELM classification. The prediction accuracy of all brands, i.e., APPL, TSLA, MSFT, WMT, PYPL, NVDA, INTC, FB, TWTR, and AMZN is 90.3%, 85.01%, 88.21%, 85.18%, 84.716%, 87.35%, 80.733%, 79.25%, 91.05%, and 88.78% respectively. So, the average accuracy of our proposed technique is 86.06% which is impressive and can be used to precisely predict the stock market behavior. Figure 4b shows the results of RNN classifier for all brands. Here, our method achieved the average accuracy of 81.4%, which is less than the accuracy achieved by ELM classifier. According to the results, we can say that our proposed approach more accurately predicts the stock market trends of any brand.

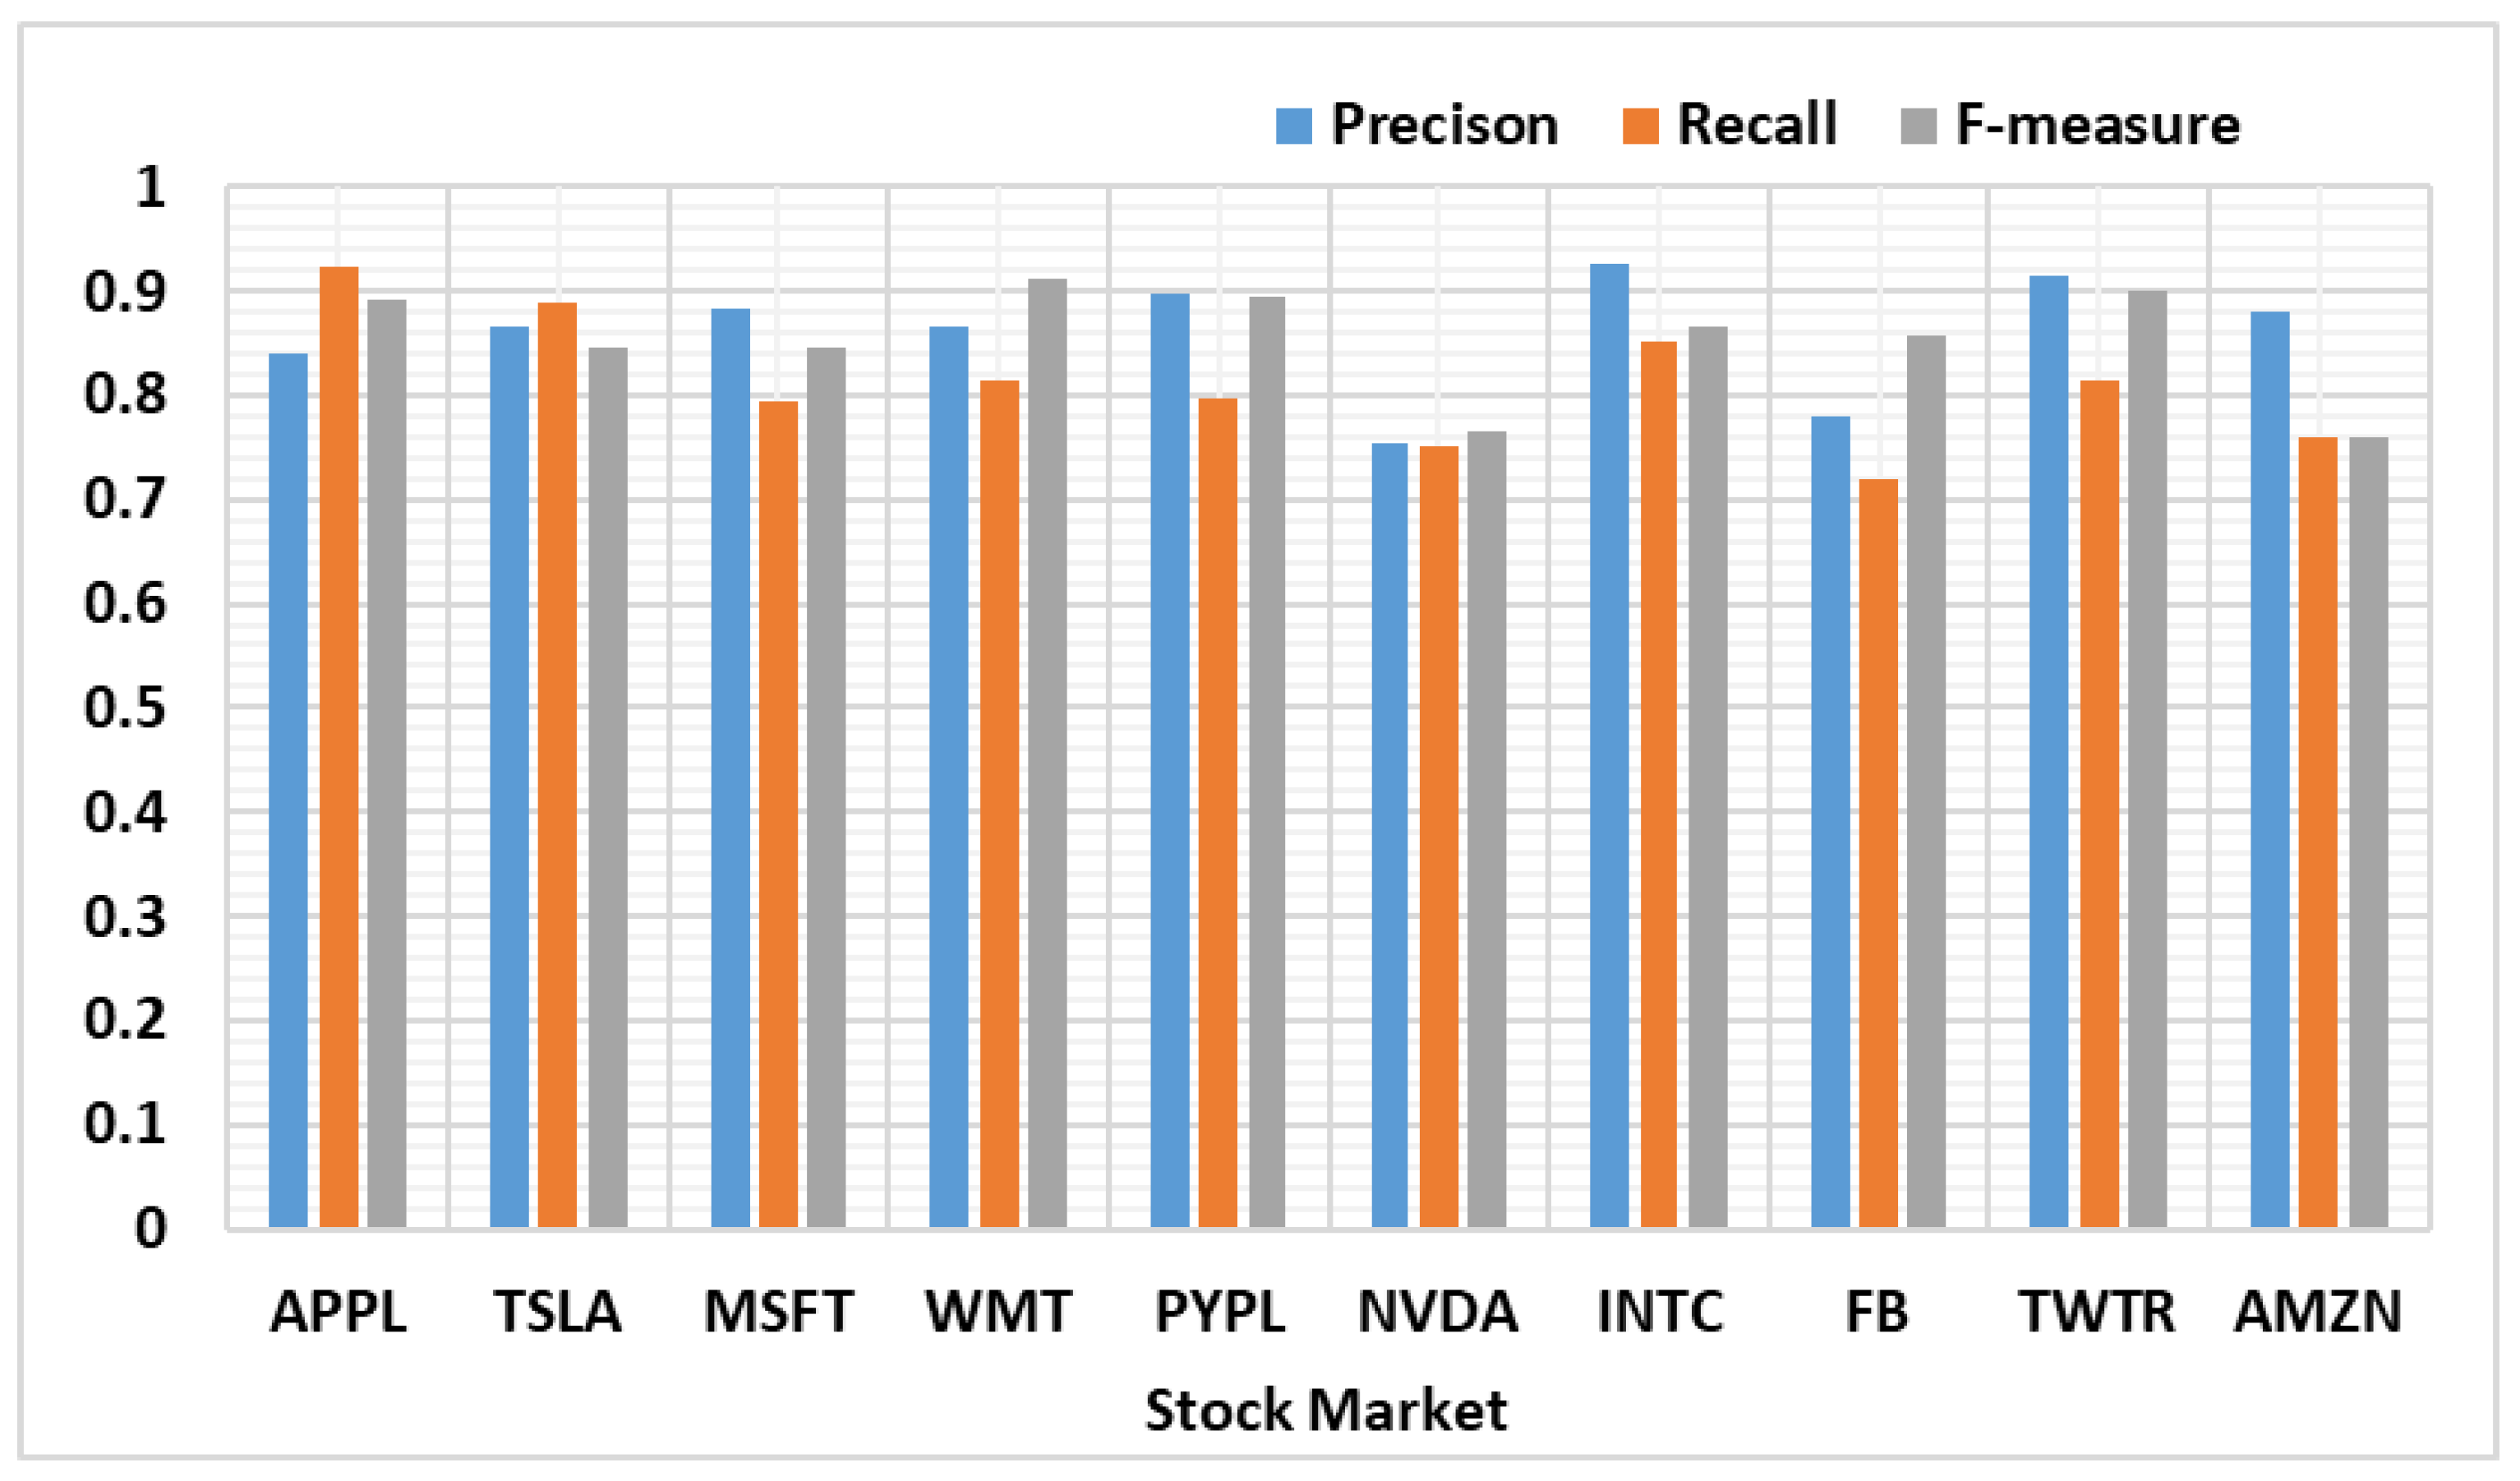
4.2.4. Classifiers’ Performance Evaluation

We selected nine ML algorithms and compared their performance with respect to the prediction accuracy. We trained these algorithms and then tested them on both the datasets to predict future stock market trends. Before applying these ML algorithms, we split the final datasets into two portions, i.e., 70% of the samples as training data and the remaining 30% as testing data. The training and testing of the algorithms are performed by using a Python library for ML named Scikit-learn [31]. Table 7 provides a list of ML algorithms used in this experimentation along with their optimal parameters.

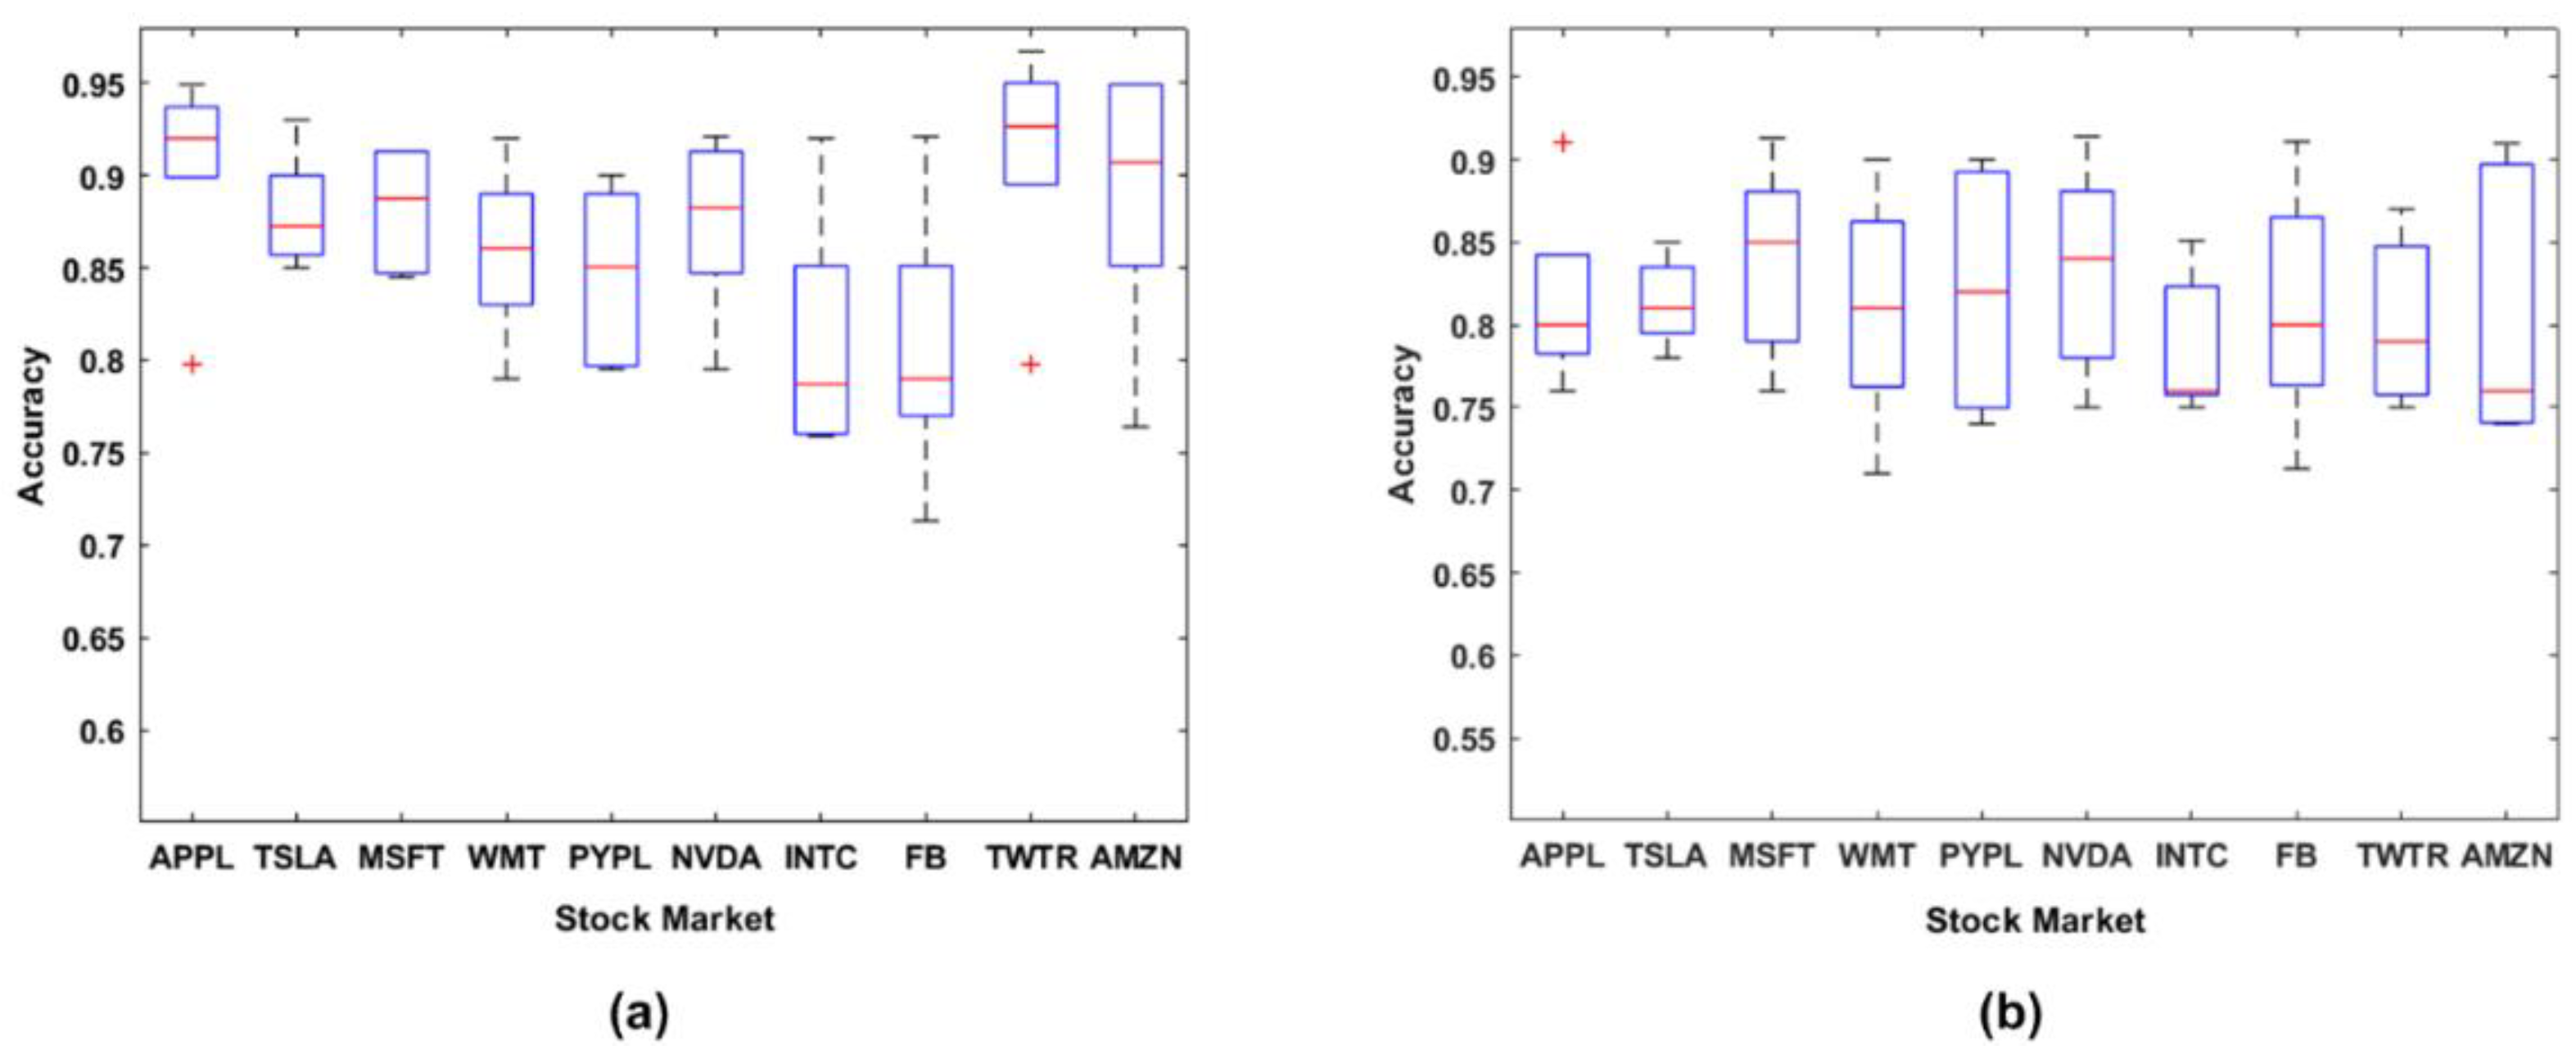
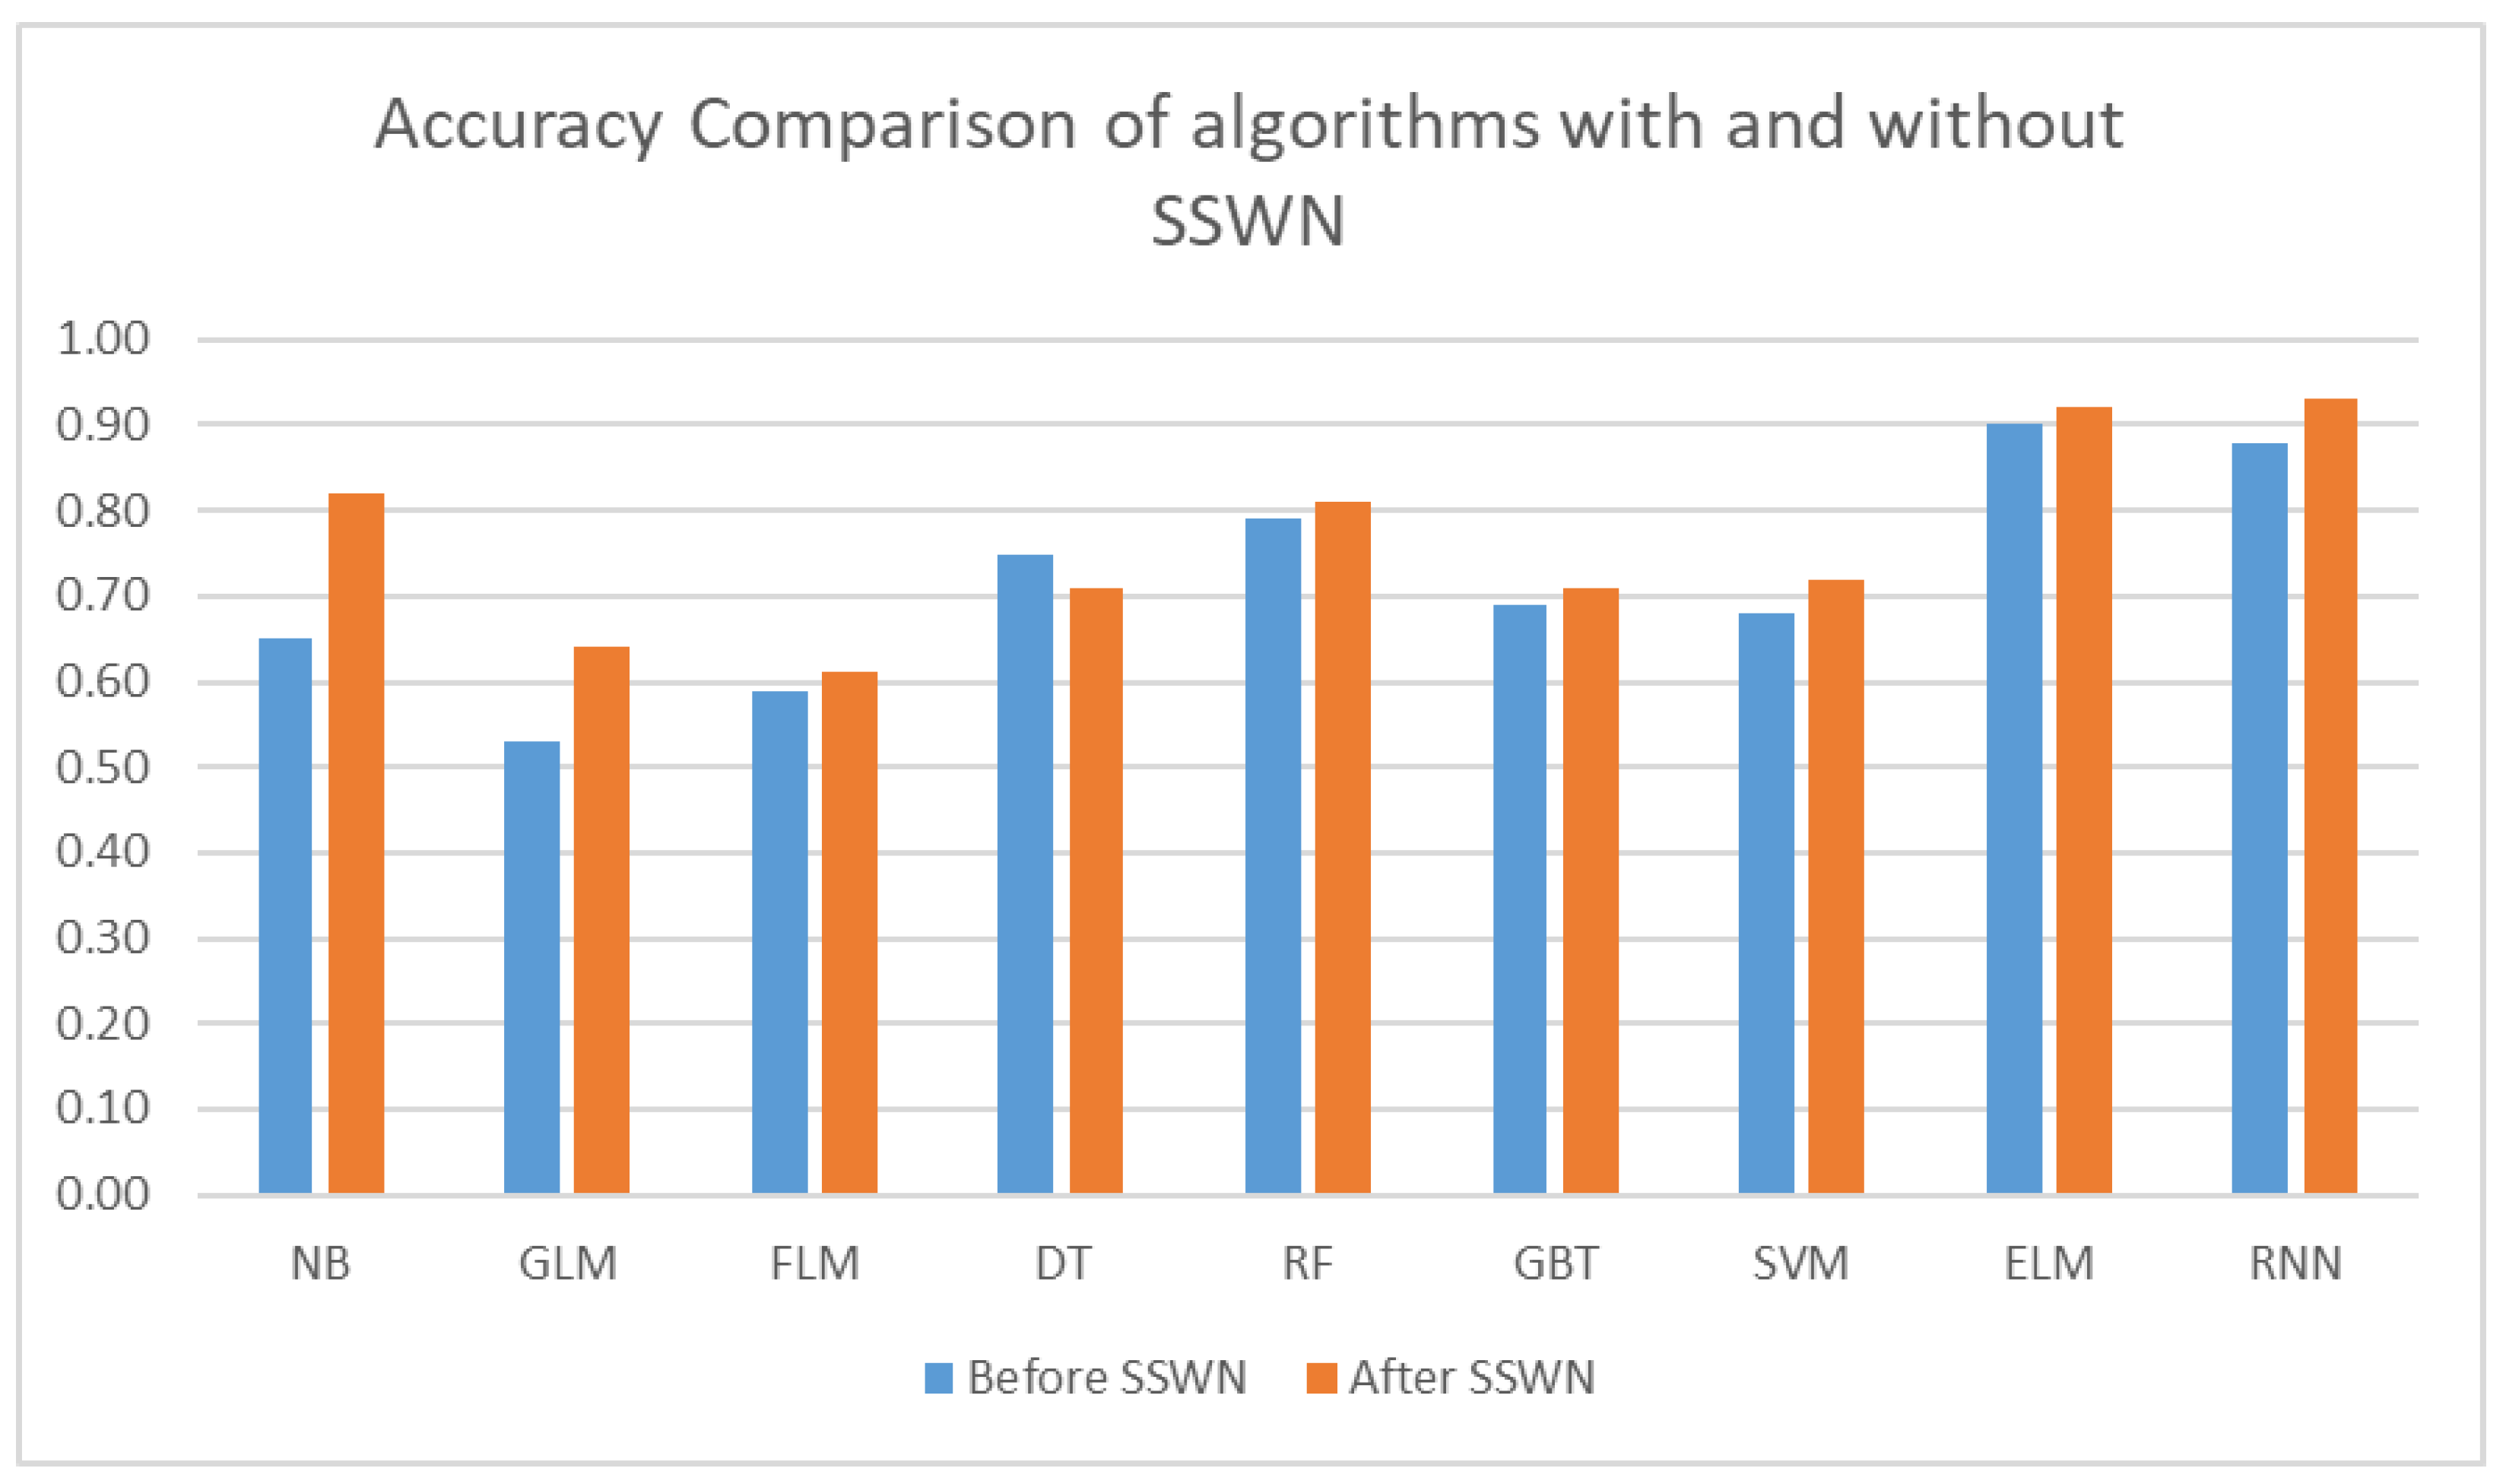
4.2.5. Performance of Algorithms before and after SSWN

We evaluated the performance of the chosen techniques with SSWN and without using it, i.e., by employing the standard SWN. Figure 5 demonstrates an overall increase in the accuracy of all algorithms after employing SSWN.

4.3. Performance of Algorithms on Both Datasets

Along with other comparisons, we also compared the performance of selected algorithms on the standard Sentiment140 dataset, as shown in Table 8.
It is evident from Table 8 that the ELM classifier outperforms other algorithms in terms of accuracy and precision. However, recall and F-measure of ELM cannot remain on top. It can also be observed from the table that that RNN shows second-best performance in terms of accuracy and precision wile remining on top in terms of F-measure.
Table 9 demonstrates the performance of these algorithms on the Twitter dataset.
Table 9 demonstrates the significant performance improvement obtained using a majority of the classifiers. By incorporating SSWN, the performance of all algorithms except for NB DT increased, i.e., these two algorithms did not show any significant improvement in their performance. Whereas RNN here, again, shows the second-best performance in terms of accuracy and precision and best performance in terms of F-measure.

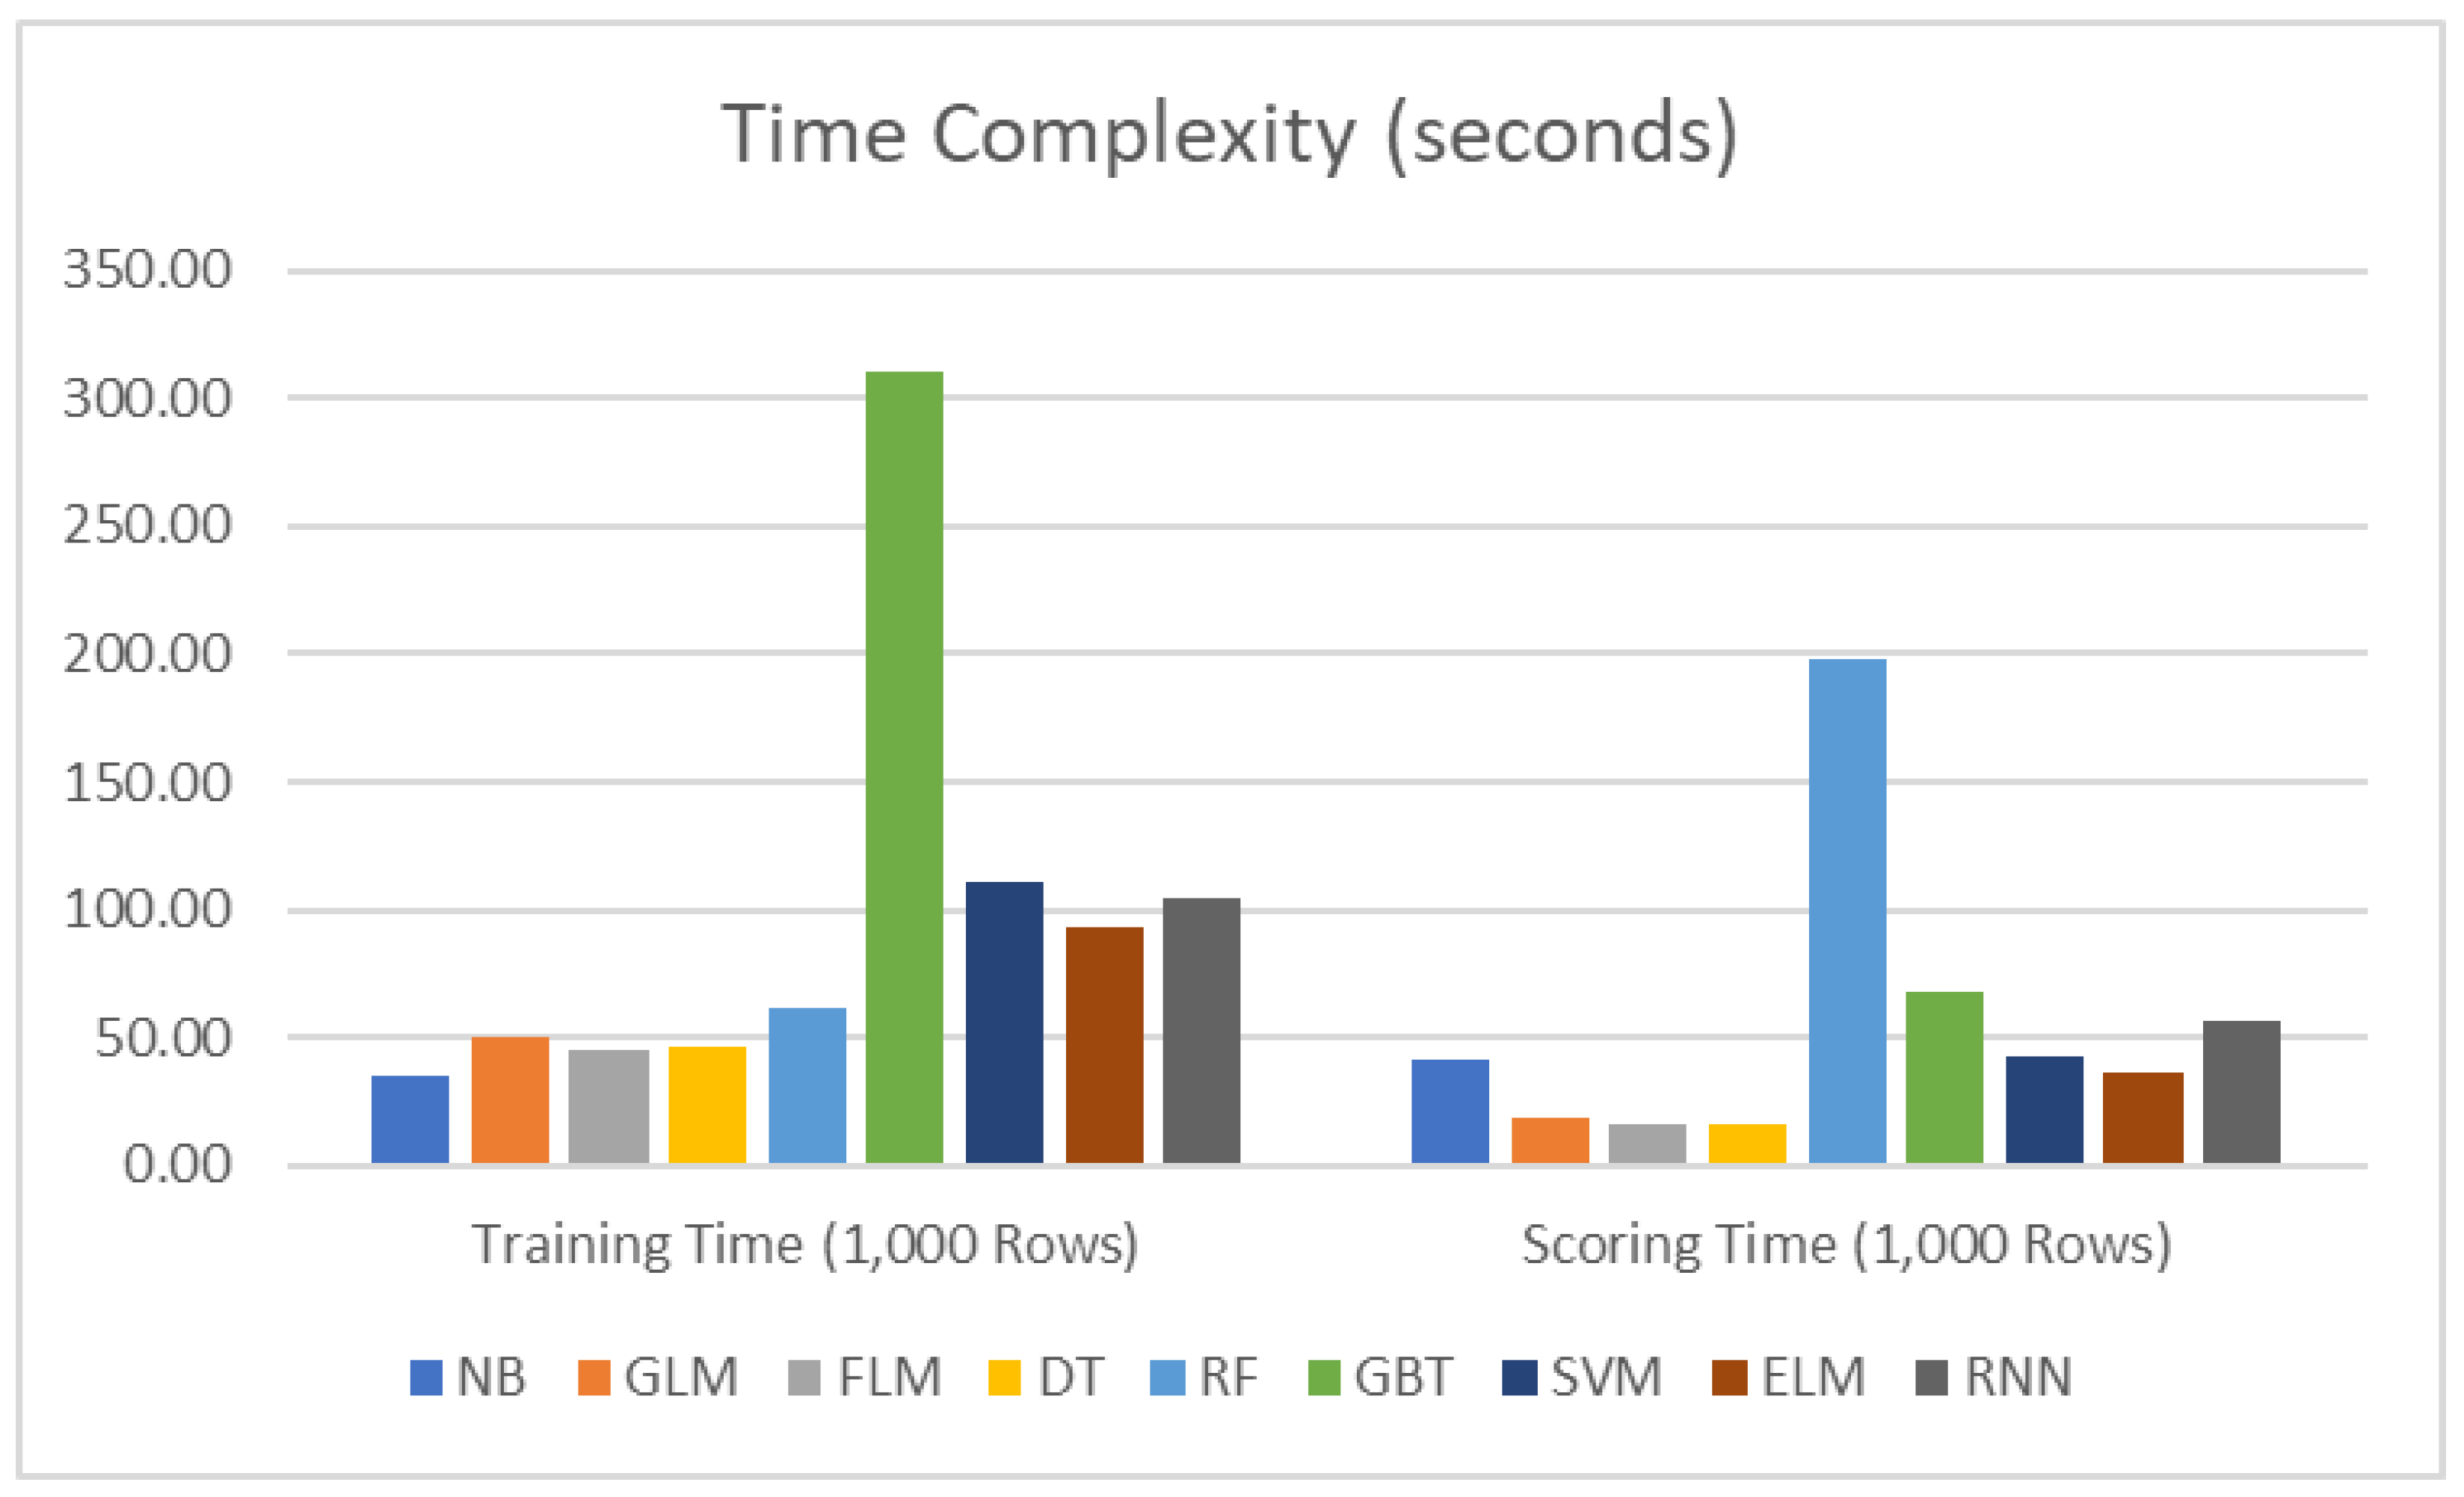
4.4. Time Complexity

The performance of all selected algorithms is also compared with respect to the time taken by the models for training and assigning the sentiment scores. Figure 6 shows a detailed comparison of the performance of algorithms in terms of time taken in seconds for training and scoring. NB took minimum time for training while FLM was the fastest while sentiment scoring. Overall, ELM and RNN were found to perform well with respect to accuracy combined with time complexity.

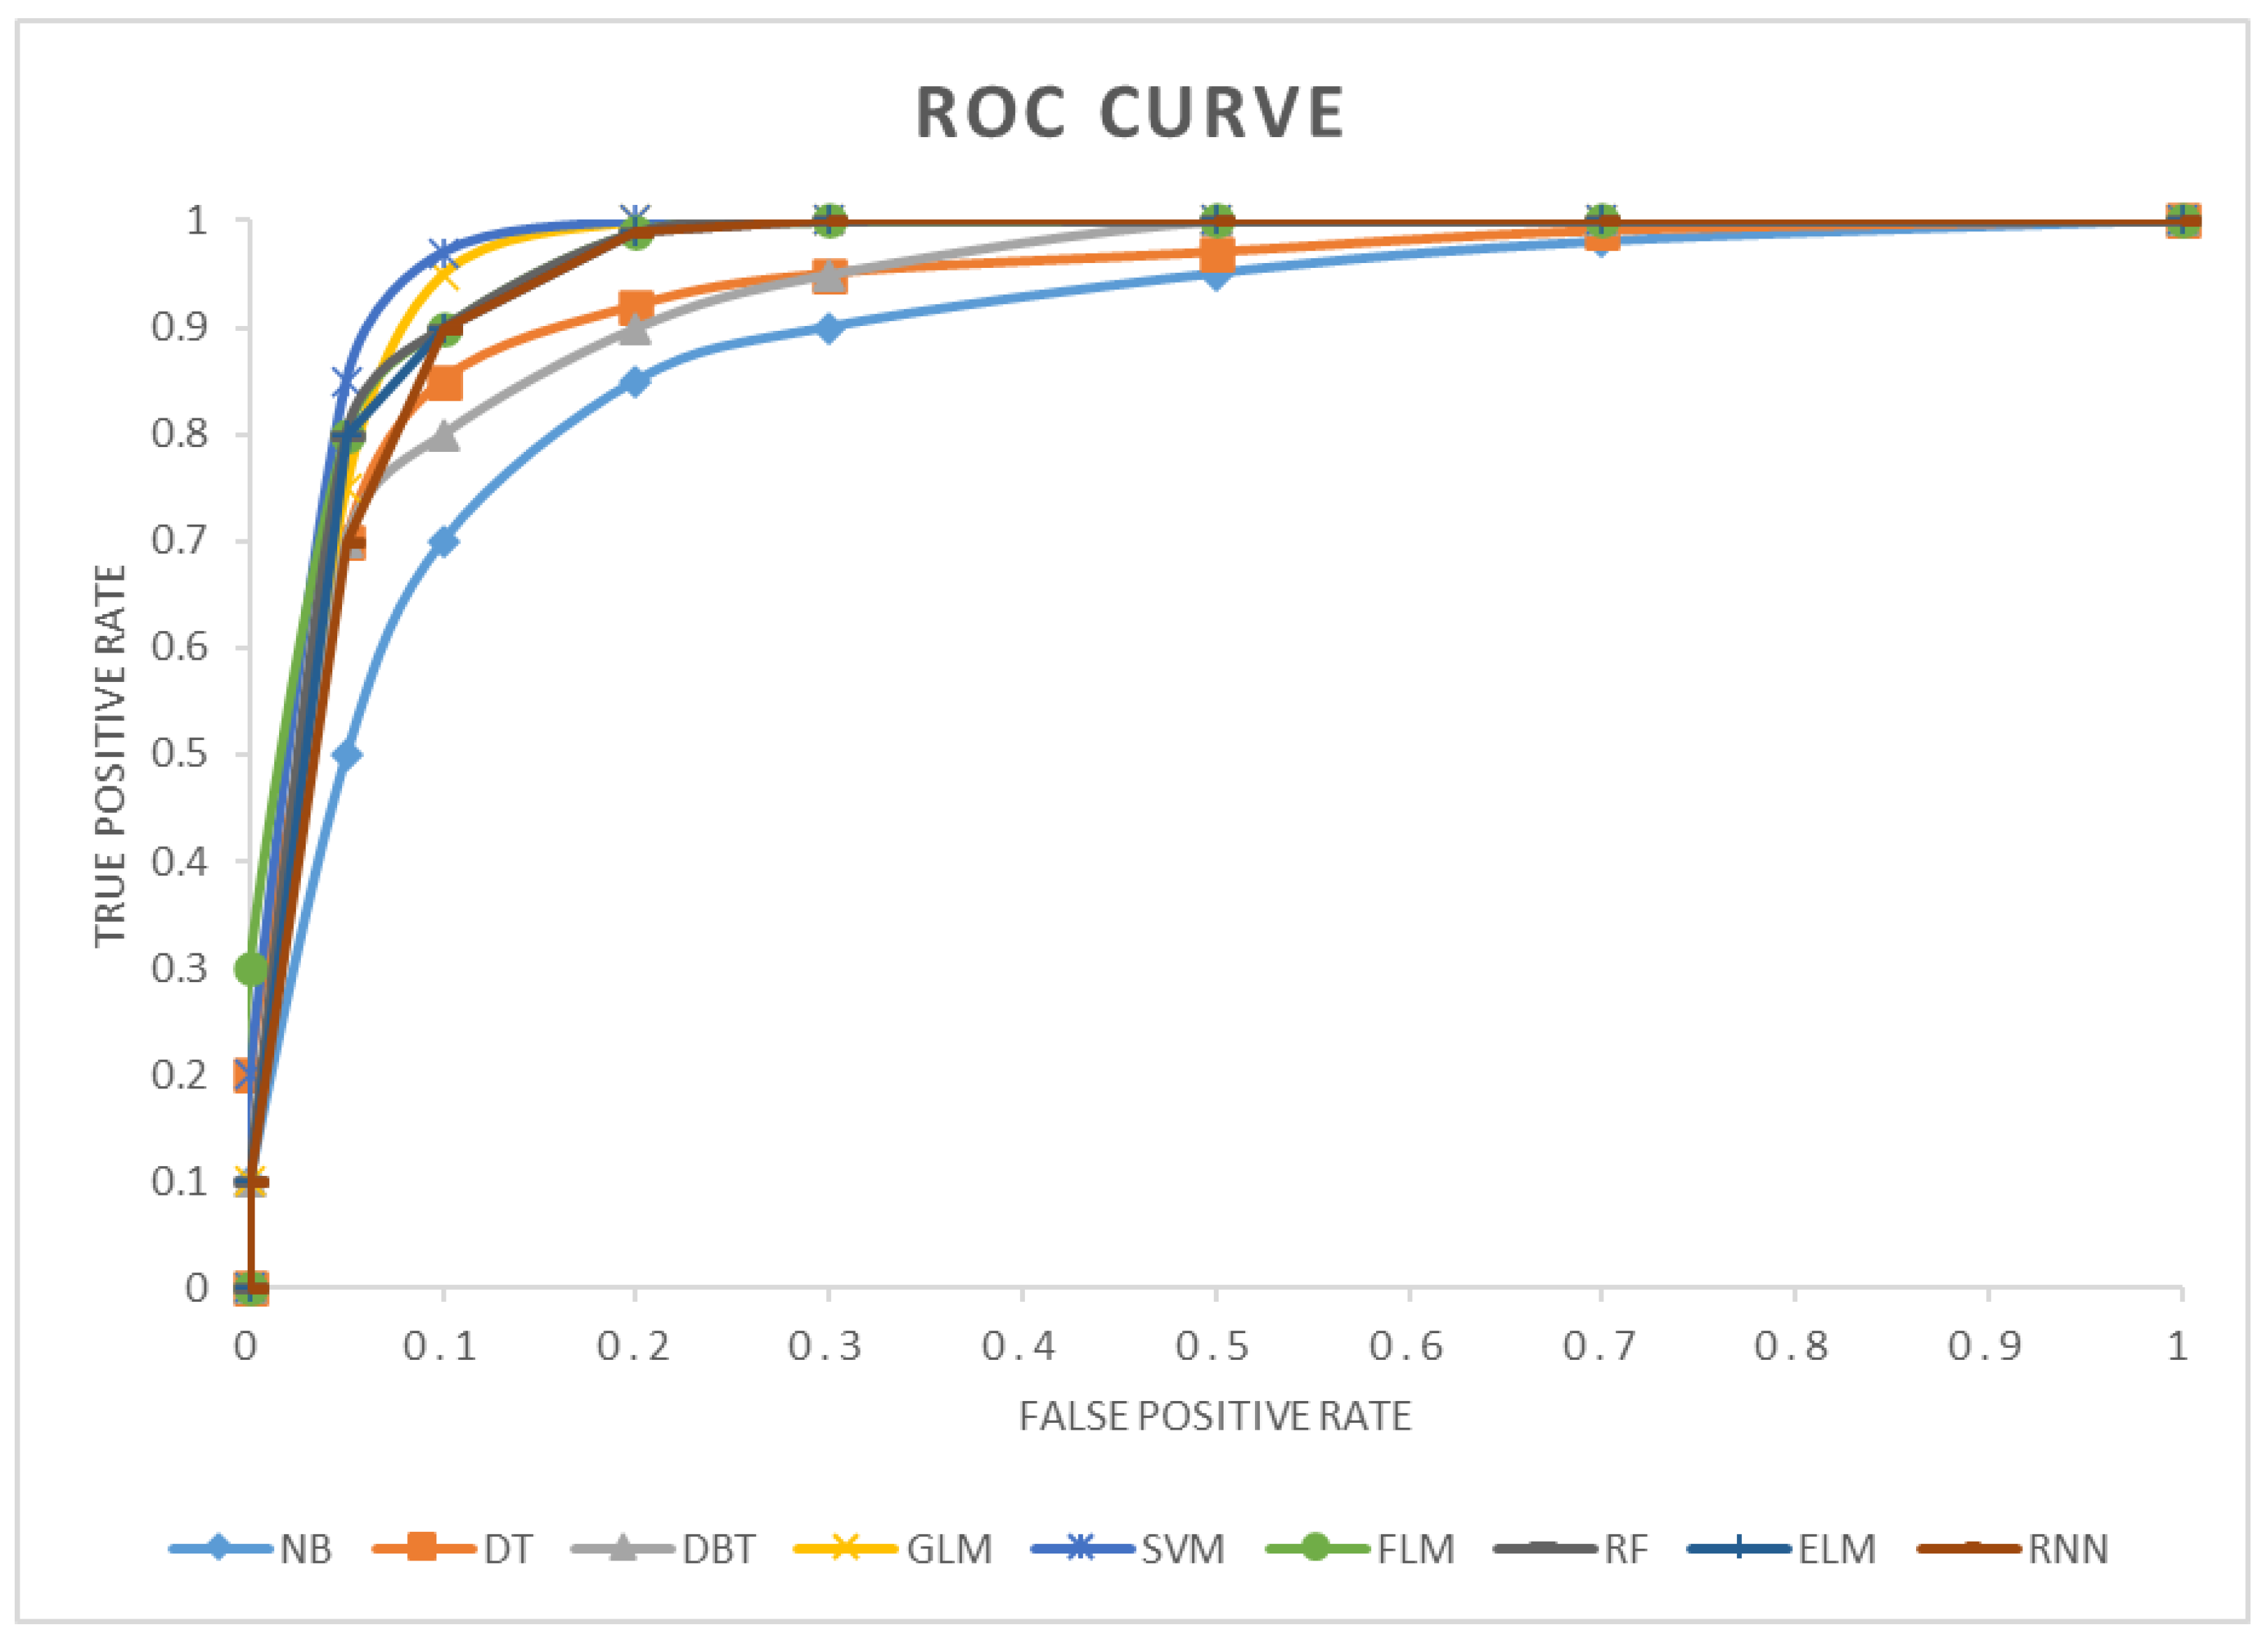
4.5. Classification Performance of the Selected Algorithms

Figure 7 demonstrates a performance comparison of the selected algorithms in the form of a RoC curve plot, which shows that ELM outperforms others in terms of correct classification of the input samples.

4.6. Comparison with State-of-the-Art Techniques

Several researchers have presented ML-based work to predict the future trends for the stock market. Therefore, in this section, to assess the prediction robustness of our approach, we performed a comparative analysis of our framework with the latest ML-based approaches. This analysis is evaluated in terms of employed technique, data, as well as obtained accuracy and precision.
The comparative results are reported in Table 10. Zhou et al. [33] presented an approach for stock market prediction by using the online emotions used by the people to assess their behaviors. The method [33] employed the SVM to perform classification and attained an accuracy of 64.15%. Nguyen et al. [34] introduced a framework for stock market prediction by using the sentiments related to a specific topic of the company and employed the SVM classifier for prediction. This method [34] showed an average accuracy of 54.41%. The work in [35] presented a data mining technique for stock market prediction with obtained accuracy of 66.48%. Khan et al. [25] introduced a framework by using the social sites along with political events for stock market prediction and attained an accuracy of 75.38%. Similarly, the technique in [36] used the same concept with the ANN classifier and attained an average accuracy of 77.12%. Khan et al. [37] presented another approach using financial news data and obtained an accuracy of 80.6%. The technique in [38] employed sentiments of the people from social sites along with naive Bayes and SVM classifier and showed the best average accuracy of 80.6%. From the Table 10, it can be witnessed that the presented approach showed an accuracy value of 85.7%, which is higher than all the comparative methods. Moreover, the comparative methods attained an average accuracy value of 71.24%, which is 85.7% in our case, so our method obtained a 14.46% performance gain.
The reported values demonstrate that the introduced approach outperforms the comparative techniques [25,33,34,35,36,37,38,39], by introducing the SSWN sentiment lexicon which assists in selecting a more representative set of features related to the stock market. Moreover, the methods in [25,33,34,35,36,37,38,39] are computationally more expensive and can result in over-fitting problem. However, in our case, the robustness of the ELM classifier to deal with the over-fitted training data helps to attain efficient accuracy with less processing time. So, the proposed method can be described as more effective and efficient for stock market prediction.

4.7. Discussion

The prediction of stock market prices is an interesting topic of research, and it is a challenging task due to the volatility, diversity, and dynamic behavior of stock market. Recent research has revealed that sentiments and news might influence the stock market movement and act as potential predictors for tradeoff outcomes. So, social media platforms can be considered an important source of information for extracting important chunks of information from the social media posts already published by the users. In this regard, Twitter becomes a more suitable source of information due to the concise nature of tweets posted there. However, this conciseness also makes the job more challenging due to usage of shortened words, duplication, and different types of noise residing in tweets. Combined with the power of machine learning, tweets can be significant for prediction of stock market prices. In this work, we introduced a novel approach for prediction of stock prices by using SA. For this purpose, we implement two distinct classifiers, i.e., RNN and ELM, along with other popular ones that are based on the proposed sentiment lexicon named SSWN and two datasets, i.e., data directly acquired from Twitter and a standard dataset named Sentiment140. We performed the experimentation on ten US market stocks data obtained from Google Finance. Firstly, we compared and evaluated the performance of nine different machine learning algorithms on the said stock data where the performance of ELM remained on top. Secondly, we compared our work with state-of-the-art while achieving a superior overall accuracy due to usage of a dedicated sentiment lexicon specially proposed for the prediction of stock market. The scope and working of the proposed technique can be further enhanced considering other DL-based approaches.

5. Conclusions

People use social media to share their personal ideas and opinions regarding a brand, entity, person, or an affair. Twitter is a globally recognized, modern social media platform for sharing ideas and opinions in a very concise way. Using the power of SA ML, social media posts such as tweets can play a significant role in the prediction of the stock market behavior. This work introduces a novel approach for stock market prediction using SA. The model is based on the proposed SSWN sentiment lexicon along with RNN and ELM classifiers. We have used Twitter data and Sentiment140 dataset for the performance evaluation of the ML models considering ten different brands for stock market prediction. We achieved the average accuracy of 81.40% for RNN and 86.06% for ELM classifier. We compared our approach with various ML models as well as with state-of-the art methods and achieved remarkable results. In future, we plan to enhance the capability and coverage of this approach by adding other popular social media platforms, e.g., Facebook, and Google News. Furthermore, we may evaluate the proposed approach over other challenging datasets while considering more stocks as well.

Author Contributions

Conceptualization, formal analysis, data analysis, data interpretation, literature search, funding acquisition, project administration, S.A.; conceptualization, software, resources, methodology, writing—original draft, T.N.; validation, visualization, writing—original draft, A.M.; supervision, validation, writing—review and editing, A.I.; literature search, investigation, validation, A.A.; conceptualization, supervision, writing—review and editing, proofreading, W.A. All authors have read and agreed to the published version of the manuscript.

Funding

This research was funded by the Deanship of Scientific Research, Qassim University.

Acknowledgments

The researchers would like to thank the Deanship of Scientific Research, Qassim University for funding the publication of this project.

Conflicts of Interest

The authors declare that there is no conflict of interest between authors.

References

  1. Li, X.; Wu, P.; Wang, W. Incorporating stock prices and news sentiments for stock market prediction: A case of Hong Kong. Inf. Process. Manag. 2020, 57, 102212. [Google Scholar] [CrossRef]
  2. Roy, S.S.; Mittal, D.; Basu, A.; Abraham, A. Stock market forecasting using LASSO linear regression model. In Afro-European Conference for Industrial Advancement; Springer: Cham, Switzerland, 2015; pp. 371–381. [Google Scholar]
  3. Ruan, Y.; Durresi, A.; Alfantoukh, L. Using Twitter trust network for stock market analysis. Knowledge-Based Syst. 2018, 145, 207–218. [Google Scholar] [CrossRef] [Green Version]
  4. Oliveira, N.; Cortez, P.; Areal, N. The impact of microblogging data for stock market prediction: Using Twitter to predict returns, volatility, trading volume and survey sentiment indices. Expert Syst. Appl. 2017, 73, 125–144. [Google Scholar] [CrossRef] [Green Version]
  5. Bose, A.; Hsu, C.-H.; Roy, S.S.; Lee, K.C.; Mohammadi-Ivatloo, B.; Abimannan, S. Forecasting stock price by hybrid model of cascading Multivariate Adaptive Regression Splines and Deep Neural Network. Comput. Electr. Eng. 2021, 95, 107405. [Google Scholar] [CrossRef]
  6. Gite, S.; Khatavkar, H.; Kotecha, K.; Srivastava, S.; Maheshwari, P.; Pandey, N. Explainable stock prices prediction from financial news articles using sentiment analysis. PeerJ Comput. Sci. 2021, 7, e340. [Google Scholar] [CrossRef]
  7. Patel, J.; Shah, S.; Thakkar, P.; Kotecha, K. Predicting stock market index using fusion of machine learning techniques. Expert Syst. Appl. 2015, 42, 2162–2172. [Google Scholar] [CrossRef]
  8. Patel, J.; Shah, S.; Thakkar, P.; Kotecha, K. Predicting stock and stock price index movement using Trend Deterministic Data Preparation and machine learning techniques. Expert Syst. Appl. 2015, 42, 259–268. [Google Scholar] [CrossRef]
  9. Derakhshan, A.; Beigy, H. Sentiment analysis on stock social media for stock price movement prediction. Eng. Appl. Artif. Intell. 2019, 85, 569–578. [Google Scholar] [CrossRef]
  10. Pai, P.-F.; Liu, C.-H. Predicting Vehicle Sales by Sentiment Analysis of Twitter Data and Stock Market Values. IEEE Access 2018, 6, 57655–57662. [Google Scholar] [CrossRef]
  11. Panday, H.; Vijayarajan, V.; Mahendran, A.; Krishnamoorthy, A.; Prasath, V. Stock Prediction using Sentiment analysis and Long Short Term Memory. Eur. J. Mol. Clin. Med. 2020, 7, 5060–5069. [Google Scholar]
  12. Shi, Y.; Zheng, Y.; Guo, K.; Ren, X. Stock movement prediction with sentiment analysis based on deep learning networks. Concurr. Comput. Pr. Exp. 2020, 33, e6076. [Google Scholar] [CrossRef]
  13. Kelotra, A.; Pandey, P. Stock market prediction using optimized deep-convlstm model. Big Data 2020, 8, 5–24. [Google Scholar] [CrossRef] [PubMed] [Green Version]
  14. Bouktif, S.; Fiaz, A.; Awad, M. Augmented Textual Features-Based Stock Market Prediction. IEEE Access 2020, 8, 40269–40282. [Google Scholar] [CrossRef]
  15. Ren, R.; Wu, D.D.; Liu, T. Forecasting Stock Market Movement Direction Using Sentiment Analysis and Support Vector Machine. IEEE Syst. J. 2018, 13, 760–770. [Google Scholar] [CrossRef]
  16. Deveikyte, J.; Geman, H.; Piccari, C.; Provetti, A. A sentiment analysis approach to the prediction of market volatility. arXiv 2020, arXiv:2012.05906. [Google Scholar]
  17. Mudinas, A.; Zhang, D.; Levene, M. Market trend prediction using sentiment analysis: Lessons learned and paths forward. arXiv 2019, arXiv:1903.05440. [Google Scholar]
  18. Pimprikar, R.; Ramachadran, S.; Senthilkumar, K. Use of machine learning algorithms and twitter sentiment analysis for stock market prediction. Int. J. Pure Appl. Math. 2017, 115, 521–526. [Google Scholar]
  19. Kilimci, Z.H. Financial sentiment analysis with Deep Ensemble Models (DEMs) for stock market prediction. J. Fac. Eng. Archit. Gazi Univ. 2020, 35, 635–650. [Google Scholar]
  20. AlKubaisi, G.A.A.; Kamaruddin, S.S.; Husni, H. Stock Market Classification Model Using Sentiment Analysis on Twitter Based on Hybrid Naive Bayes Classifiers. Comput. Inf. Sci. 2017, 11, 52–64. [Google Scholar] [CrossRef] [Green Version]
  21. Al-mashhadani, M.I.; Hussein, K.M.; Khudir, E.T. Sentiment analysis using optimized feature sets in different facebook/twitter dataset domains using big data. Iraqi J. Comput. Sci. Math. 2022, 3, 64–70. [Google Scholar] [CrossRef]
  22. Zhang, G.; Xu, L.; Xue, Y. Model and forecast stock market behavior integrating investor sentiment analysis and transaction data. Clust. Comput. 2017, 20, 789–803. [Google Scholar] [CrossRef]
  23. Xu, Q.; Chang, V.; Hsu, C.-H. Event Study and Principal Component Analysis Based on Sentiment Analysis—A Combined Methodology to Study the Stock Market with an Empirical Study. Inf. Syst. Front. 2020, 22, 1021–1037. [Google Scholar] [CrossRef]
  24. Wu, J.-L.; Huang, M.-T.; Yang, C.-S.; Liu, K.-H. Sentiment analysis of stock markets using a novel dimensional valence–arousal approach. Soft Comput. 2021, 25, 4433–4450. [Google Scholar] [CrossRef]
  25. Qian, F.; Gong, C.; Sharma, K.; Liu, Y. Neural User Response Generator: Fake News Detection with Collective User Intelligence. IJCAI 2018, 18, 3834–3840. [Google Scholar]
  26. Munk, M.; Pilkova, A.; Benko, L.; Blazekova, P.; Svec, P. Web usage analysis of Pillar 3 disclosed information by deposit customers in turbulent times. Expert Syst. Appl. 2021, 185, 115503. [Google Scholar] [CrossRef]
  27. Khan, W.; Malik, U.; Ghazanfar, M.A.; Azam, M.A.; Alyoubi, K.H.; Alfakeeh, A.S. Predicting stock market trends using machine learning algorithms via public sentiment and political situation analysis. Soft Comput. 2020, 24, 11019–11043. [Google Scholar] [CrossRef]
  28. Agrawal, A.; Hamling, T. Sentiment Analysis of Tweets to Gain Insights into the 2016 US Election. Columbia Undergrad. Sci. J. 2021, 11. [Google Scholar] [CrossRef]
  29. Ding, X.; Liu, B.; Yu, P.S. A holistic lexicon-based approach to opinion mining. In Proceedings of the 2008 International Conference on Web Search and Data Mining, Palo Alto, CA, USA, 11–12 February 2008; pp. 231–240. [Google Scholar]
  30. Singh, T.; Nayyar, A.; Solanki, A. Multilingual opinion mining movie recommendation system using RNN. In Proceedings of First International Conference on Computing, Communications, and Cyber-Security (IC4S 2019); Springer: Singapore, 2020; pp. 589–605. [Google Scholar]
  31. Cambria, E.; Speer, R.; Havasi, C.; Hussain, A. Senticnet: A publicly available semantic resource for opinion mining. In Commonsense Knowledge: Papers from the AAAI Fall Symposium; AAAI Press: Menlo Park, CA, USA, 2010. [Google Scholar]
  32. Aung, K.Z.; Myo, N.N. Sentiment analysis of students’ comment using lexicon based approach. In Proceedings of the 2017 IEEE/ACIS 16th International Conference on Computer and Information Science (ICIS), Wuhan, China, 24–26 May 2017; pp. 149–154. [Google Scholar]
  33. Taboada, M.; Brooke, J.; Tofiloski, M.; Voll, K.; Stede, M. Lexicon-based methods for sentiment analysis. Comput. Linguist. 2011, 37, 267–307. [Google Scholar] [CrossRef]
  34. de Smedt, T.; Daelemans, W. “Vreselijk mooi!” (terribly beautiful): A Subjectivity Lexicon for Dutch Adjectives. In Proceedings of the Eighth International Conference on Language Resources and Evaluation (LREC’12); European Language Resources Association (ELRA): Luxembourg, 2012; pp. 3568–3572. [Google Scholar]
  35. Bravo-Marquez, F.; Frank, E.; Pfahringer, B. Building a Twitter opinion lexicon from automatically-annotated tweets. Knowledge-Based Syst. 2016, 108, 65–78. [Google Scholar] [CrossRef] [Green Version]
  36. Rao, D.; Ravichandran, D. Semi-supervised polarity lexicon induction. In Proceedings of the 12th Conference of the European Chapter of the ACL (EACL 2009), Athens, Greece, 30 March–3 April 2009; pp. 675–682. [Google Scholar]
  37. de Albornoz, J.C.; Plaza, L.; Gervás, P. SentiSense: An easily scalable concept-based affective lexicon for sentiment analysis. In Proceedings of the Eighth International Conference on Language Resources and Evaluation (LREC’12); European Language Resources Association (ELRA): Luxembourg, 2012; pp. 3562–3567. [Google Scholar]
  38. Cerini, S.; Compagnoni, V.; Demontis, A.; Formentelli, M.; Gandini, C. Micro-WNOp. Language Resources and Linguistic Theory; Franco Angeli: Milan, Italy, 2007; p. 200. [Google Scholar]
  39. Miller, G.A. WordNet: A lexical database for English. Commun. ACM 1995, 38, 39–41. [Google Scholar] [CrossRef]
  40. Strapparava, C.; Valitutti, A. Wordnet affect: An affective extension of wordnet. In Proceedings of the Fourth International Conference on Language Resources and Evaluation (LREC’04); European Language Resources Association (ELRA): Luxembourg, 2004; Volume 4, p. 40. [Google Scholar]
  41. Esuli, A.; Sebastiani, F. Sentiwordnet: A publicly available lexical resource for opinion mining. In Proceedings of the Fifth International Conference on Language Resources and Evaluation (LREC’06); European Language Resources Association (ELRA): Luxembourg, 2006. [Google Scholar]
  42. Schuster, M.; Nakajima, K. Japanese and korean voice search. In Proceedings of the 2012 IEEE International Conference on Acoustics, Speech and Signal Processing (ICASSP), Kyoto, Japan, 25–30 March 2012; pp. 5149–5152. [Google Scholar]
  43. Sennrich, R.; Haddow, B.; Birch, A. Neural machine translation of rare words with subword units. arXiv 2015, arXiv:1508.07909. [Google Scholar]
  44. Lewis, D.D.; Ringuette, M. A comparison of two learning algorithms for text categorization. In Third Annual Symposium on Document Analysis and Information Retrieval; University of Nevada: Reno, NV, USA, 1994; Volume 33, pp. 81–93. [Google Scholar]
  45. Ding, S.; Zhao, H.; Zhang, Y.; Xu, X.; Nie, R. Extreme learning machine: Algorithm, theory and applications. Artif. Intell. Rev. 2015, 44, 103–115. [Google Scholar] [CrossRef]
  46. Bodapati, S.; Bandarupally, H.; Shaw, R.N.; Ghosh, A. Comparison and analysis of RNN-LSTMs and CNNs for social reviews classification. In Advances in Applications of Data-Driven Computing; Springer: Berlin/Heidelberg, Germany, 2021; pp. 49–59. [Google Scholar]
  47. Wei, D.; Wang, B.; Lin, G.; Liu, D.; Dong, Z.; Liu, H.; Liu, Y. Research on Unstructured Text Data Mining and Fault Classification Based on RNN-LSTM with Malfunction Inspection Report. Energies 2017, 10, 406. [Google Scholar] [CrossRef] [Green Version]
  48. Williams, G.; Baxter, R.; He, H.; Hawkins, S.; Gu, L. A comparative study of RNN for outlier detection in data mining. In Proceedings of the 2002 IEEE International Conference on Data Mining, Maebashi City, Japan, 9–12 December 2002; pp. 709–712. [Google Scholar]
  49. Khan, F.H.; Qamar, U.; Bashir, S. A semi-supervised approach to sentiment analysis using revised sentiment strength based on SentiWordNet. Knowl. Inf. Syst. 2017, 51, 851–872. [Google Scholar] [CrossRef]
  50. Zhao, H.; Sun, M.; Deng, W.; Yang, X. A New Feature Extraction Method Based on EEMD and Multi-Scale Fuzzy Entropy for Motor Bearing. Entropy 2016, 19, 14. [Google Scholar] [CrossRef] [Green Version]
  51. Nguyen, T.H.; Shirai, K.; Velcin, J. Sentiment analysis on social media for stock movement prediction. Expert Syst. Appl. 2015, 42, 9603–9611. [Google Scholar] [CrossRef]
  52. Bing, L.; Chan, K.C.; Ou, C. Public sentiment analysis in Twitter data for prediction of a company’s stock price movements. In Proceedings of the 2014 IEEE 11th International Conference on e-Business Engineering, Guangzhou, China, 5–7 November 2014; pp. 232–239. [Google Scholar]
  53. Nti, I.K.; Adekoya, A.F.; Weyori, B.A. Predicting Stock Market Price Movement Using Sentiment Analysis: Evidence From Ghana. Appl. Comput. Syst. 2020, 25, 33–42. [Google Scholar] [CrossRef]
  54. Khan, W.; Ghazanfar, M.A.; Azam, M.A.; Karami, A.; Alyoubi, K.H.; Alfakeeh, A.S. Stock market prediction using machine learning classifiers and social media, news. J. Ambient Intell. Humaniz. Comput. 2020, 13, 3433–3456. [Google Scholar] [CrossRef]
  55. Kordonis, J.; Symeonidis, S.; Arampatzis, A. Stock price forecasting via sentiment analysis on Twitter. In Proceedings of the 20th Pan-Hellenic Conference on Informatics, Patras, Greece, 10–12 November 2016; pp. 1–6. [Google Scholar]
  56. Jing, N.; Wu, Z.; Wang, H. A hybrid model integrating deep learning with investor sentiment analysis for stock price prediction. Expert Syst. Appl. 2021, 178, 115019. [Google Scholar] [CrossRef]
Figure 1. Flow diagram of proposed technique.
Electronics 11 03414 g001
Figure 2. Word cloud diagram of stock words.
Electronics 11 03414 g002
Figure 3. Brand wise Performance.
Electronics 11 03414 g003
Figure 4. Accuracies of All brands using (a) ELM and (b) RNN.
Electronics 11 03414 g004
Figure 5. Accuracy comparison of algorithms before and after SSWN.
Electronics 11 03414 g005
Figure 6. Performance Comparison of algorithms in terms of time taken.
Electronics 11 03414 g006
Figure 7. RoC Curves depicting the performance of the algorithms in terms of True positive rate.
Electronics 11 03414 g007
Table 1. A summary of lexical resources.
ResourceTotal FeaturesScore RangePOS
SynsetsWordsMinMax
SenticNet [31] 15,143N/A−11
AFINN [32]2477N/A−55
SO-CAL [33] 6306N/A−55
Subjectivity Lexicon [34]8221N/AN/AN/A
Opinion Lexicon [35]6786N/AN/AN/A
General Inquirer [36]11,789N/AN/AN/A
SentiSense [37]21905496N/AN/A
Micro-WNOp [38] 1105196001
WordNet [39]117,659155,287N/AN/A
WordNet-Affect [40]28744787N/AN/A
SentiWordNet [41]117,659155,28701
Table 2. A sample from the lexical resource named SWN.
POSIDPos ScoreNeg ScoreSynset Terms
a209800.75unable#1
n370060.6250masterpiece#2
r54530.3750unabashedly#1
v188130.3750waken#1 wake_up#1 wake#5 rouse#4 awaken#1 arouse#5
Table 3. Association between t and c.
Presence of a Term tAbsence of a Term t
Prescence of a class cAC
Absence of a class cBD
Table 4. A sample from the proposed lexical resource SSWN.
POSIDPosNegSynset Terms
A27723470.1250.625volatility#4
N27723170.3750.125blue_chip_stocks#1 blue_chip_stock#1
V27723440.1250.625short_selling#2 short_sale#2 short_sell#2
A27723480.3750.125volume#7
N277233600open#1
V27723140.1250average_down#1
27724530.4250.125bull#1
bullish#
A27724940.1250.625bear#1
bearish#2
N27724580.6250.125Breakout
N27724550.1250Cap
N27724570.1250.125Floor
A27725010.4250.785greed#1
greedy#2
A27724500.1250.625Fear
A2772660P Gain
A277256100.625Loss
A27724620.1250.625late_entry#1
later_entry#2
A27724700.4250.125early_entry
N27724680.6250.125morning_star
N27724650.1250.625evening_star
N27724830.1250.375raising_index_rate
N27724810.3750.125falling_index_rate
A27724630.6250green#1
green_chips#2
A27726100.6250.125blue#1
blue_chips#2
A277262300.425red#1
red_chips#2
A27726120.4250.125low_risk
A27725030.1250.625high_risk
V27724730.1250.625buyer_exhaust
V27724740.4250seller_exhaust
Table 5. Description of the Sentiment140 dataset.
ColumnDescription
targetTweet polarity (negative = 0, neutral = 2, and positive = 4)
idsTweet IDs (e.g., 2088)
dateThe time the tweet was published. (e.g., Sun May 17 22:57:44 UTC 2008)
flagThe query. NO_QUERY flag means there is no query.
userID of the user who posted this tweet. (e.g., the TwitterFellow)
text Body of the tweet. (e.g., The shares of #AAPL have been stable for a week).
Table 6. Details of data directly extracted from Twitter.
Stock
Market
SymbolNumber of Tweets
(Before Preprocessing)
Number of Tweets
(After Preprocessing)
PositiveNegativeNeutralTotalPositiveNegativeTotal
AppleAPPL14,40010,500594030,84012,384913521,519
TeslaTSLA40,05031,29080,916152,25633,64227,22260,864
MicrosoftMSFT26,10020,73021,96368,79322,44617,82840,274
WalmartWMT13,20011,40017,22241,82211,220991821,138
PayPalPYPL10,500567030,18246,3529030482013,850
NvidiaNVDA6150480031,14042,090535139849335
IntelINTC3900336031,75039,010331527896104
FacebookFB15,15010,50028,91254,56213,181882022,001
TwitterTWTR10,65010,35028,17049,1709053900518,057
AmazonAMZN6630630023,24736,1775636541811,054
GrandTotal146,730114,900299,442561,072125,25698,938224,194
Table 7. Selected ML algorithms with their optimal parameter values.
No.AlgorithmAbbreviationOptimal Parameter Set
1Naive BayesNBN/A
2Generalized Linear ModelGLMkernel = rbf, C: 0.6
3Fast Large MarginFLMSolver = L2, C = 0.5, epsilon = 0.25, class_weights = 1, use_bias = false
4Decision TreeDTcriterion:’entropy’, splitter = ’best’, max_depth = 8, min_samples_split = 2, min_samples_leaf = 1, min_weight_fraction_leaf = 0.5, presort = ’true’
5Random ForestRFn_jobs = −1, min_samples_leaf: 2, n_estimators: 25, random_state: 125, criterion: gini,
min_samples_split: 4
6Gradient Boosted TreesGBTmin_samples_split = 2500, min_samples_leaf = 50, max_depth = 8, max_features = ‘sqrt’, subsample = 0.8, random_state = 8
7Support Vector MachineSVMkernel = ‘rbf’, C = 10, gamma = auto,
8Extreme Learning MachineELMhidden_layers = 20, weights = [−1, 1], activation_function = ’sigmoid’
9Recurrent Neural NetworkRNNinit = ‘glorot_uniform’, inner_init = ‘orthogonal’, activation = ‘tanh’, w_regularizer = none, u_regularizer = none, b_regularizer = none, dropout_w = 0.1, dropout_u = 0.02
Table 8. Performance of the algorithms on the data set of sentiment140.
ModelAccuracyPrecisionRecallF-Measure
NB0.820.650.750.66
GLM0.640.530.710.60
FLM0.610.590.950.50
DT0.710.750.660.53
RF0.690.790.300.10
GBT0.710.690.200.27
SVM0.610.680.200.29
ELM0.810.800.770.82
RNN0.860.860.810.85
Table 9. Performance of the algorithms on the data set extracted from Twitter.
ModelAccuracyPrecisionRecallF-Measure
NB0.810.670.720.64
GLM0.670.560.750.63
FLM0.640.620.790.53
DT0.690.710.690.57
RF0.720.830.320.11
GBT0.750.720.210.28
SVM0.640.710.210.31
ELM0.850.840.810.86
RNN0.890.900.850.89
Table 10. Comparative Results.
TechniqueAccuracy (%)Precision
Khan et al. [27]75.380.67
Zhou et al. [50]64.150.65
Nguyen et al. [51]54.41-
Bing et al. [52]66.48-
Nti et al. [53]77.120.69
Wasiat Khan [54]80.53-
Kordonis [55]80.60-
Jing et al. [56]-0.87
Proposed (ELM)86.060.88
Publisher’s Note: MDPI stays neutral with regard to jurisdictional claims in published maps and institutional affiliations.

