Article

Determinants Influencing the Continuous Intention to Use Digital Technologies in Higher Education

1
Department of Computer Networks, College of Computer Sciences and Information Technology, King Faisal University, Al-Ahsa 31982, Saudi Arabia
2
Computing and Creative Industries, Faculty of Art, Universiti Pendidikan Sultan Idris, Tanjong Malim 35900, Malaysia
3
School of Science, Engineering, and Environment, University of Salford, Salford M5 4WT, UK
4
Department of Information Systems, College of Computer and Information Sciences, Princess Nourah Bint Abdulrahman University, P.O. Box 84428, Riyadh 11671, Saudi Arabia
5
English Language & Linguistics Department, Al Buraimi University College, Al Buraimi 512, Oman
6
College of Business, King Faisal University, Al-Ahsa 31982, Saudi Arabia
7
College of Business Administration and Economics, Al-Hussein Bin Talal University, Ma’an 71111, Jordan
8
College of Education, Department of Educational Technologies, King Faisal University, Al-Ahsa 31982, Saudi Arabia
*
Author to whom correspondence should be addressed.
Electronics 2022, 11(18), 2827; https://doi.org/10.3390/electronics11182827
Submission received: 22 July 2022 / Revised: 30 August 2022 / Accepted: 2 September 2022 / Published: 7 September 2022
(This article belongs to the Section Computer Science & Engineering)

Abstract

:
There is increasing evidence that the lack of access to digital information and technologies is not widely considered in the educational sectors when focusing on the perceived experience, tutor quality and students’ satisfaction. In this paper, we report on an evaluation of a project aiming to bridge the use of digital information in the educational sector by proposing an integrated model that measures teachers’ quality, uncertainty avoidance effects and students’ satisfaction concerning TAM constructs and the perceived experience of digital information in education (DIE). The model and hypotheses were validated using data collected from a survey of 553 students at a college level. The results revealed that users may perceive the importance of DIE based on several external factors that enhance their learning and teaching experiences. The personal characteristics of the user including his/her readiness to use technology are crucial in correlation with the perceived ease of use. In addition, the high quality of the tutor in some cultures may enhance the perceived usefulness of the technology. Other factors such as flow of information, uncertain avoidance and satisfaction may strongly assess the continuous intention to use the technology.

1. Introduction

The use of digital technologies to enhance learning has gained considerable attention in higher education. The digital transformation in education has been significantly appreciated. Accessing education using a different learning process path has often been a challenge in recent years. With the development of technology, solutions to problems such as communication, information access, and business or cooperation now exist. Accordingly, the literature is full of studies that tackle the importance of technology self-efficacy. Though most studies are focused on literacy in technology, other studies shed light on the digital technologies which are supposed to play an important role in developing the type of received digital information and the acquired learning skills of students. These studies contribute to the improvement and expansion of digital information and technology in the educational sector. Thus, supporting research opportunities, research results, and the students’ achievement [1,2,3].
Some previous research has focused on the adoption of digital technology in formal education settings [3,4,5,6,7,8]. However, there has been limited empirical research into what influences a student’s digital informal learning, particularly with the effect of experience, TAM, teachers’ role and students’ perceptions. Furthermore, earlier research identified obstacles to digital learning in mainstream education, but its conditions in college-level education remain unclear. Hence, our aim in this paper is to provide insight into the conditions of digital learning in college-level education from two perspectives which are the teachers’ role and students’ satisfaction. We examined whether the continuous intention to use digital learning in special education is predicted by (1) technology readiness, uncertain avoidance and digital flow of information in association with the perceived ease of use of the digital learning, (2) tutor quality and learners’ satisfaction in connection with the perceived usefulness and (3) perceived experience concerning the perceived ease of use and the perceived usefulness.

2. Literature Review and Research Background

Digital technologies have witnessed massive changes in various fields including educational sectors. The recent changes can mirror how technology is progressively becoming pervasive and expanded to reach high levels of innovation. This leads to and reduces the effect of traditional techniques in teaching and learning. Prior studies have focused on digital technology in the educational environment. Starting from the development of digital information literacy, studies have highlighted the users’ literacy in comparison with the rapid changes in information communication technologies in the educational sector [4,5]. Competency in computer skills is a crucial factor that assists users’ participation in society and work. Literacy in digital information is considered as underpinning the ability to maintain lifelong learning due to the simple exposure to digital information. The effect of literacy skills may have a great impact on teachers who are responsible for the development of students’ digital information and communication skills. The level of proficiency in the use of digital information and communication skills is conceptualized by focusing on the types of technology that are used as tools in achieving different educational purposes including accessing, evaluating, sharing and communicating digital information. Teachers’ role in encouraging the use of digital information cannot be overlooked. Studies have shown that strong evidence is found on the role of teachers’ attitudes and encouragement towards the use of digital information. Teachers’ role has remarkable effects on the degree of emphasis on the world of digital information for educational purposes [4,5,6,9].
The purposes of previous studies are variant. A study by [10] has adopted a new model that can measure factors that affect the use of digital information by students; putting in mind that the aim is to investigate computer self-efficacy, computer anxiety, perceived enjoyment and acceptance of digital learning as sustainability in relation to students’ satisfaction. The focus on the problem of security in using digital information was a big concern; therefore, studies attempted to investigate the safety problems with digital education resources’ providing the best solution to overcome the problem of the perceived risk behind security problems [11,12]. However, other studies have tackled the process of adopting digital information. Previous studies have been conducted to investigate the impact of the digital storytelling process on digital literacy skills, focusing on the creation of the adoption of the process in detail [7,8].
The results of prior studies have different implications depending on the type of the adopted model. Most of the findings have focused on factors such as computer self-efficacy, computer anxiety, perceived enjoyment, the TAM constructs, perceived usefulness and ease of use. Furthermore, studies have concluded that digital literacy levels differ after the adoption of new digital information; assuming that both teachers’ and students’ opinions have been changed despite the difficulty they experienced during the use of new digital information highlighting the positive contribution of the process of digital information in educational settings [7,10]. At the organizational level, the results found in the literature review have asserted the significant effect of both self-efficacy and perceived support in digital learning, whereas students’ self-regulation and parental support are the main obstacles. To be able to solve the problem of self-efficacy, a training course should be offered for education teachers, students and interventions in digital learning [8]. The inclusion of other significant factors such as student attendance, digital problems, infrastructure interest and commitment is evident as part of the obstacles that hinder the acceptance of digital information and technologies; therefore, coming up with a group of recommendations such as designing multimedia material that allows bidirectional interactions to improve inter-institutional cooperation [8,12].
In recent studies, TAM has been perceived as an essential model for determining the acceptance of digital information in the educational sector. Satisfaction was another factor that enhances the use of digital information. Though previous studies have adopted different models in investigating the acceptance of digital information, the current study stands away from these studies as it focuses on the effect of other external factors such as technology readiness, perceived experience, uncertainty avoidance and tutor quality. These factors have not been tackled before in a study that explores the impact of digital information. In addition, the current study aims to investigate the relation between the perceived experience and the TAM constructs.

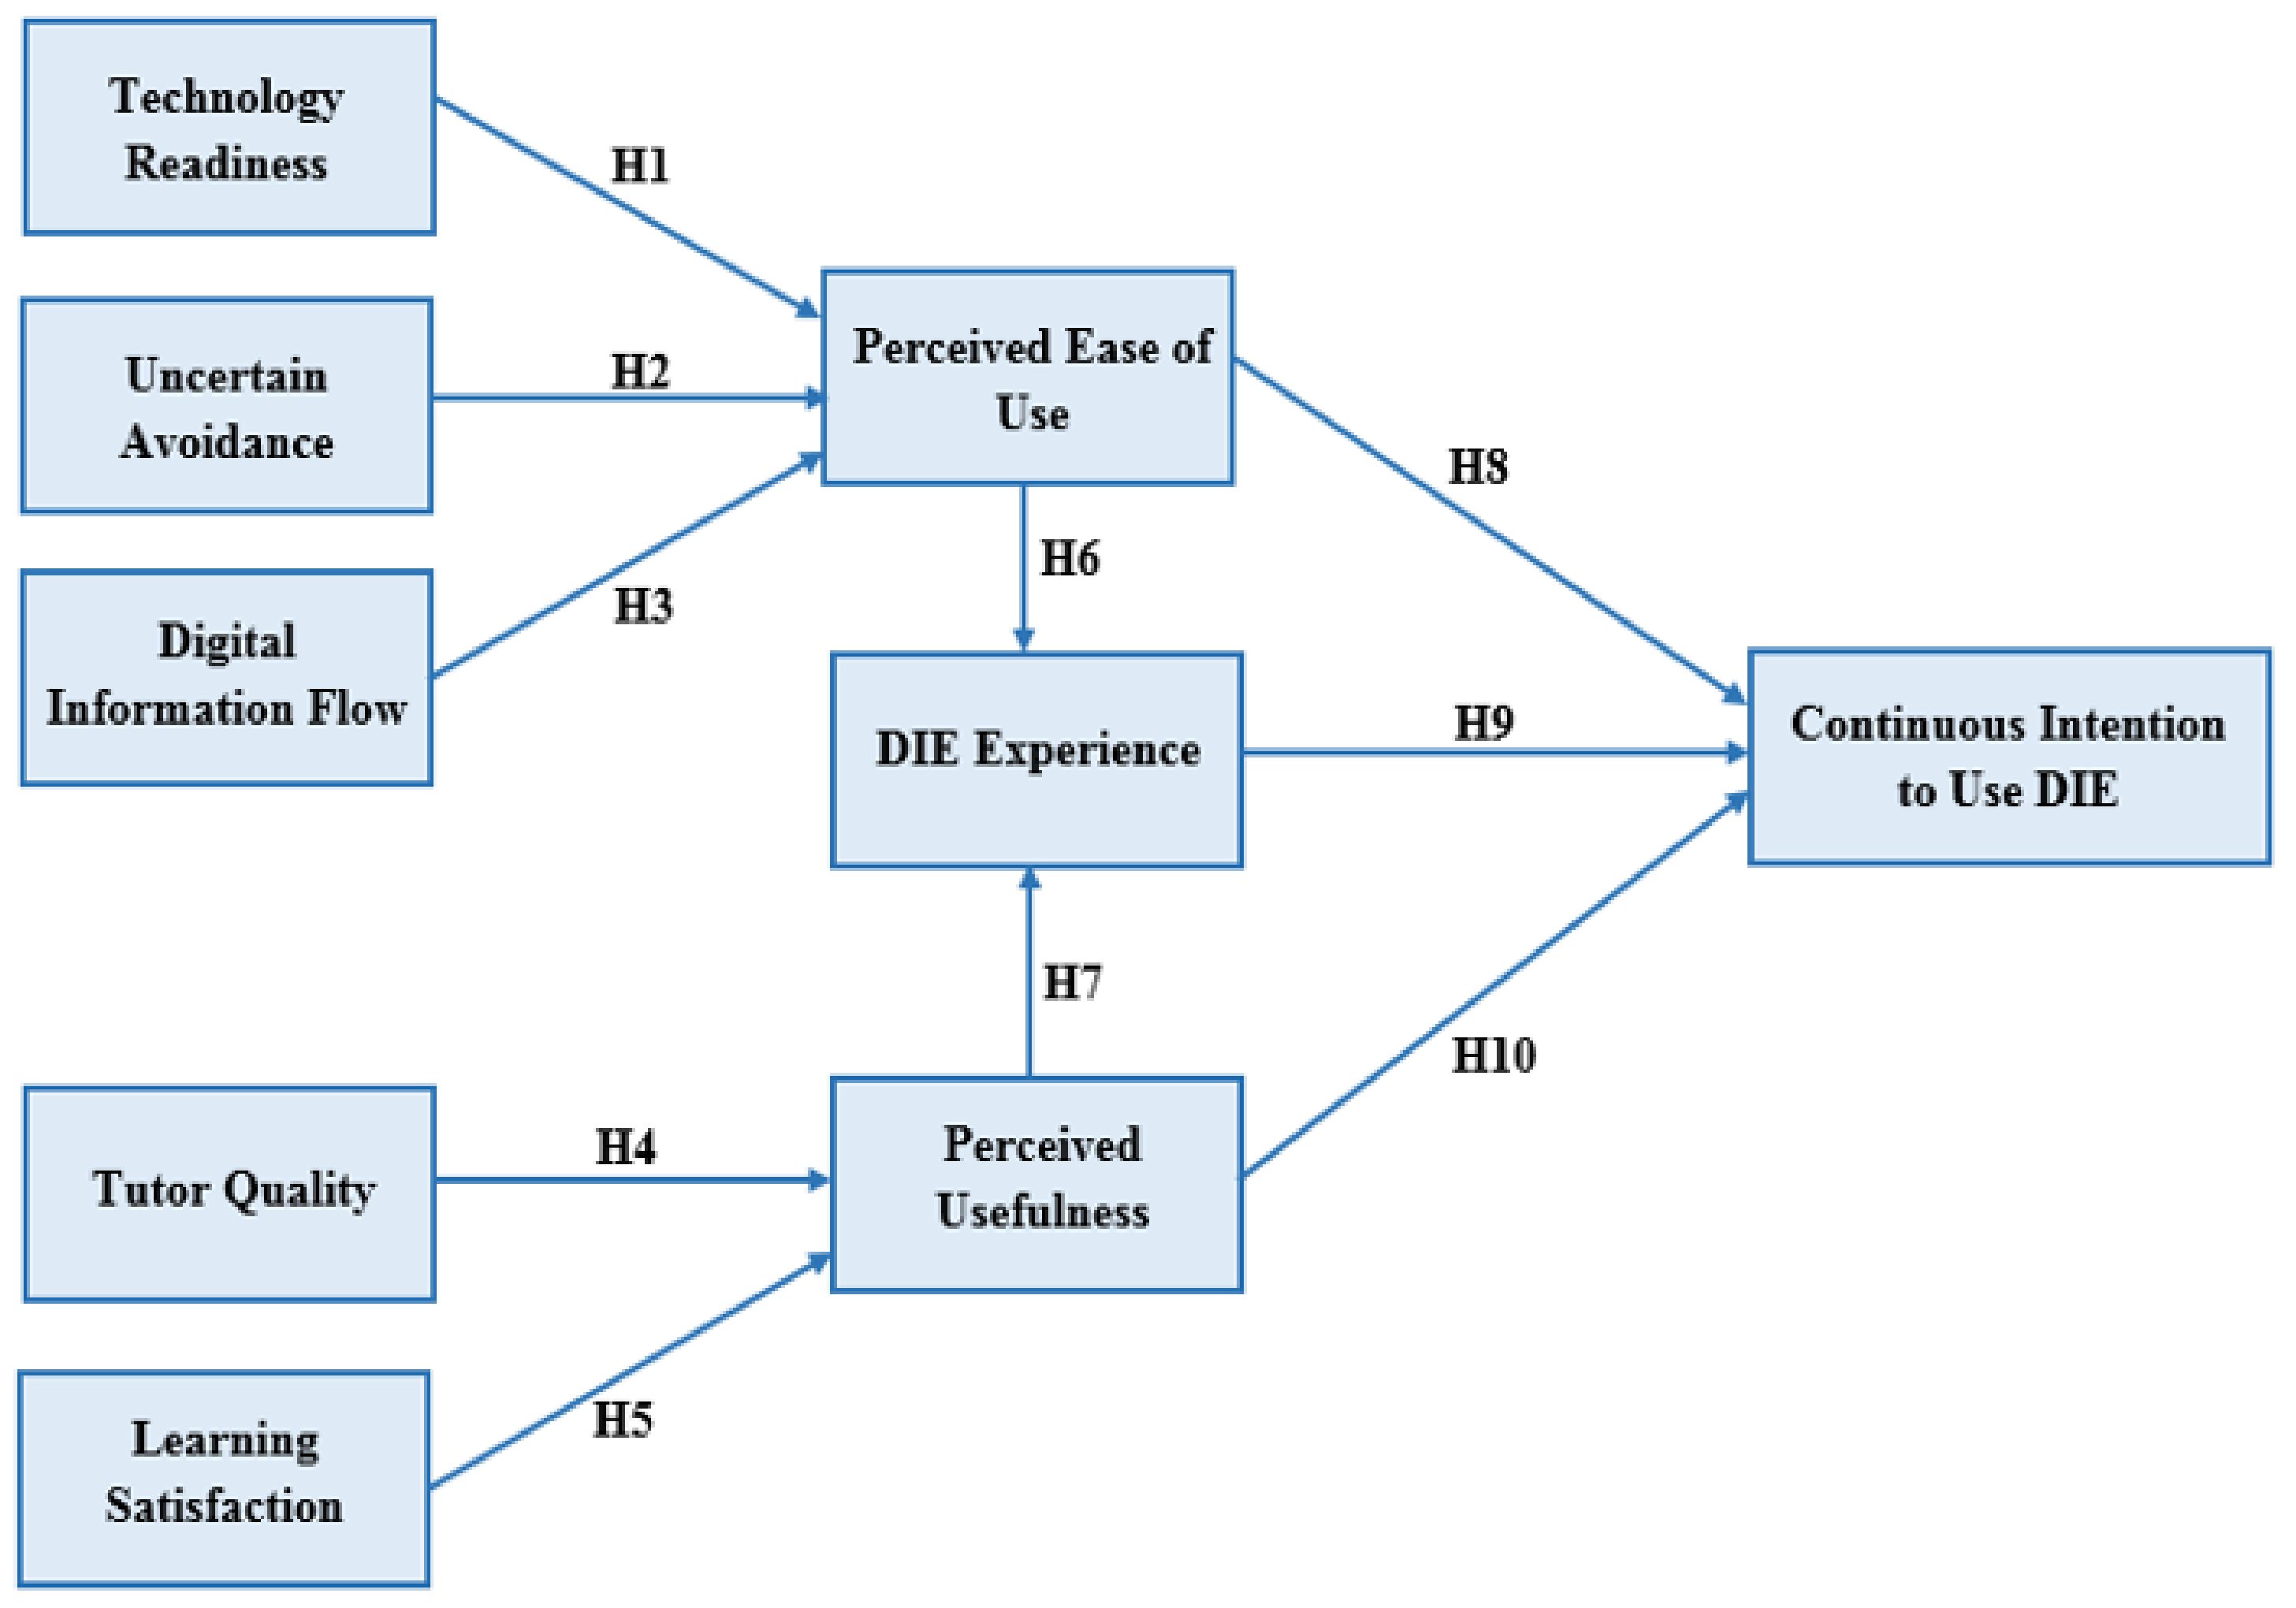
3. Theoretical Framework

3.1. Technology Readiness

Technology readiness (TR) is influencing technology’s behavioural intention which is a psychological condition that appears as a consequence of both positive thoughts and a barrier that controls users’ intention to use technology the customer’s mental readiness to accept new technologies, has been proposed as such a factor. TR includes four dimensions which are innovativeness, optimism, discomfort and insecurity [13]. Readiness is related to the level of threat and the feeling of insecurity. In fact, studies have shown that users feel vulnerable when using technology putting more emphasis on offline tools as a safe and more convenient environment. The cause behind the low openness to using technology is related to security and privacy reasons which may lead to users’ abundance [14,15].
TR has remarkably been considered a crucial factor that can either foster or hinder the adoption of technology. This stems from the fact that TR has a significant impact on people’s propensity to use new technology for the sake of fulfilling their goals. Being a state of mind, TR may result from mental users and inhibitors that can collectively estimate users’ predisposition to use new technologies [13,16,17].

3.2. Uncertainty Avoidance

Uncertainty avoidance (UA) refers to the degree to which members of users feel threatened by the acceptance of new technologies and it is usually developed due to the inability to tolerate an ambiguous situation that appears due to new technologies. The uncertainty avoidance may also appear because of the high number of features, low trust in the e-vendor and low e-loyalty [18]. Uncertainty avoidance has a close relation with the cultures. Therefore, two main cultures are distinguished which are high UA culture and low UA culture. Based on the previous distinction, high UA cultures need more specific details, structures, and features and are less tolerant to the unknown, whereas the low UA cultures have less degree of efficiency and less need for structure and features, but they are more willing to try unexpected technologies because they are open-minded in searching for innovation [18].

3.3. Tutor Quality

The role of the tutor has been changed by the spread of the e-learning environment. The tutor is no longer the transmitter of information to a group of students, rather he or she has many other roles to play. They can act as the facilitator and mentor as well as a trouble shooter or a person that can solve any hardware and software issues, especially in circumstances where learners consider their tutor to be of high quality. The high-quality tutor will encourage students or learners to be engaged in new e-learning environments and use new digital information easily. The shift in the role of the tutor leads to including roles such as providing support via group tutorials, holding face-to-face or online classes for special support, sending emails and creating online forums as well as providing electronic feedback for online assignments [19,20]. Previous studies have made a connection between high-quality tutors and perceived usefulness; assuming that there is a positive relation between students’ intention to use digital information and the perceived usefulness that comes from high tutor quality [19,20].

3.4. Digital Flow Information

Digital information flow elements affect the perceived benefits of technology. The element of digital information represents the flowing continuum to show the variations in the value of technology. Studies have shown that the digital flow of information is associated with the perceived trust that the users can perceive towards the received information. Users who received information through educational platforms show an increasing trust in digital information. Whenever learners evaluate the digital flow of information as trustworthy, they tend to use it regularly. It provides a kind of encouragement to continuously use the digital flow of information. On the other hand, innovation seems to impact negatively the digital flow of information because innovation influence the learners’ perception differently based on the learners’ experiences and types of the offered information [21,22].

3.5. Learning Satisfaction

The investigation of learning satisfaction is considered a complex phenomenon that embraces many factors such as the quality of learning, the type of interaction, the instructors’ feedback as well as peer interactions. Studies have shown that both the quality of learning and interaction may have a direct impact on the level of satisfaction. Similarly, the quality of the tutor and the effectiveness of the peer interaction may affect the level of satisfaction because it strongly contributes to learning achievements and course satisfaction [23,24,25]. Learning satisfaction has proven to be connected with other factors such as readiness to learn via an online environment and tutors’ quality. The higher the readiness and tutors’ quality is, the higher the level of satisfaction will be [26,27].

3.6. TAM Model and Experience

To be able to deal with the concept of acceptance of DIE, the TAM model is used that incorporates two influential factors which are the perceived ease of use and the perceived usefulness The model was originally generated by [28] who paved the way to a group of beliefs and attitudes that are related to technology acceptance.
The concept of experience can be described as a cognitive concept that represents an intrinsic motivation that embraces satisfaction and enjoyment [29,30]. Prior studies that integrate perceived experience with TAM proposed that users with more experience appreciate the use of technology; focusing on-time experience can highly estimate the perceived ease of use and the perceived usefulness. Hence, users can perceive technology as easy to use, assuming that ease of use can lead to free use of technology without cognitive burden, spending little time and effort. This happens whenever experienced users use technology through daily interaction which may lead to a pleasurable and enjoyable environment [31].
The model in Figure 1 has tackled the relations among different variables, proposing a close association between the perceived ease of use with other external variables including technology readiness, uncertain avoidance and digital information flow. In addition, the model traces the relation between the perceived usefulness and other external factors such as tutor quality and learning satisfaction. The main focus is on the relation between the perceived experience and the perceived ease of use and perceived usefulness. Hence, the following hypotheses are proposed:
H1: 
Technology readiness has a positive impact on the perceived ease of use.
H2: 
Uncertain avoidance has a negative impact on the perceived ease of use.
H3: 
Digital information flow has a positive impact on the perceived ease of use.
H4: 
Tutor quality has a positive impact on the perceived usefulness.
H5: 
Learning satisfaction has a positive impact on the perceived usefulness.
H6: 
The perceived ease of use has a positive impact on the DIE experience.
H7: 
The perceived usefulness has a positive impact on the DIE experience.
H8: 
The perceived ease of use has a positive impact on the continuous intention to use DIE.
H9: 
DIE experience has a positive impact on the continuous intention to use DIE.
H10: 
The perceived usefulness has appositive impact on the continuous intention to use DIE.
Figure 1. Research Model.
Electronics 11 02827 g001

4. Methodology

4.1. Data Collection

Data collection took place from 10th June to 20th April 2022 over the winter semester (2021–2022) in Al Buraimi University College by means of online surveys. The research team conducted random distribution of 600 questionnaires. Out of these surveys, 553 questionnaires were answered by the respondent, which makes up a 92% response rate. Apart from that, 47 questionnaires were also rejected based on some missing values. Because of this, the number of usable questionnaires was 553. Krejcie & Morgan [32] suggests that these accepted questionnaires had an appropriate sample size level (the expected sampling size for 306 respondents/1500 population). There is a great difference between the sample size (553) and the minor requirements. Considering this, the sample size could be the evaluation using structural equation modelling [33], which was afterwards used to confirm the hypotheses. It is also worth noting that the previous theories (based on the digital information context) were the foundation of our hypotheses. When it comes to the evaluation of the measurement model, structural equation modelling (SEM) (SmartPLS Version 3.2.7) was used by the research group. Advanced treatment was conducted with the help of the final path model.

4.2. Students’ Personal Information/Demographic Data

The demographic/personal data have been evaluated in Table 1. In addition, there were 44% male students and 56% female students. Plus, 73% respondents were within the age range 18–29 years and the rest of them were above 29. The respondents mostly had university degrees alongside educated background. More specifically, the percentages of students having a bachelor’s degree, master’s degree, and a doctoral degree were 74%, 23%, and 3%, respectively. Al-Emran & Salloum [34] suggests that in cases where the respondents show willingness for volunteering, there can be utilization of the “purposive sampling approach”. When it comes to this sample, the students belonged to different universities, age groups, and educational programs and levels. Other than that, IBM SPSS Statistics ver. 23 was used for measuring the demographic data. Table 1 represents a deeper view of the respondents’ demographic data.

4.3. Study Instrument

In this study, a survey instrument was suggested for validating the hypothesis. In order to measure the questionnaire’s 9 constructs, 34 items were further added to the survey. Table 2 presents the sources of these constructs. For making the research more applicable, the researchers made amendments to the questions of prior research.

4.4. Survey Structure

A questionnaire survey was given to the students [34]. This survey has three sections.
  • The first section focuses on the respondents’ personal data.
  • The second section presents two items that represent the general question related to Continuous Intention to Use Digital Information in Education.
  • The third section consists of 32 items that deal with “Learning Satisfaction, Perceived Ease of Use, Perceived Experience, Perceived Usefulness, Technology Readiness, Tutor Quality, and Uncertain Avoidance”. For measuring the 34 items, a five-point Likert Scale will be considered with options: strongly disagree (1), disagree (2), neutral (3), agree (4) and strongly agreed (5).

5. Findings and Discussion

5.1. Data Analysis

For this study, the data analysis was conducted using the partial least squares-structural equation modelling (PLS-SEM) through SmartPLS V 3.2.7 [42]. The collected data was analyzed by using a two-step assessment approach, which includes the measurement model and structural model [43]. The PLS-SEM was selected in this research for several factors.
Firstly, if the given research aims to work on a current theory, the preference should be given to PLS-SEM [44]. Second of all, the PLS-SEM can help with effectively handling exploratory research that has complex models [45]. Third of all, PLS-SEM carries out an analysis of the entire model as one unit rather than making subdivisions out of it [46]. Lastly, PLS-SEM also provides concurrent analysis for the structural and measurement models, because of which accurate measurements are generated [47].

5.2. Convergent Validity

For assessing the measurement model, [43] suggested the construct reliability (which includes Cronbach’s alpha (CA), Dijkstra-Henseler’s (PA), and composite reliability (CR)) and validity (which includes discriminant and convergent validity). For determining the construct reliability, Cronbach’s alpha (CA) was found to be within the range of 0.755–0.901, with respect to Table 3. The threshold value (0.7) is lower than these figures [48]. According to Table 4, the results show that the composite reliability (CR) values range from 0.782 to 0.900, which exceed the threshold value [49]. Rather, researchers should use the Dijkstra-Henseler’s rho (pA) reliability coefficient for evaluating and reporting construct reliability [50]. As with CA and CR, the reliability coefficient ρA should be at least 0.70 (exploratory research) and 0.80 or 0.90 (advanced research stages) [48,51,52], Table 4 also shows that 0.70 is the minimum reliability coefficient ρA of all measurement constructs. These results confirm the construct reliability, and each construct was considered to be free from errors, ultimately.
When it comes to the measurement of convergent validity, it is necessary to test the mean-variance extracted (AVE) and factor loading [43]. Apart from that, Table 4 suggests that each factor loading value exceeded the threshold value of 0.7. Other than that, according to the Table 1 results, the AVE values ranged from 0.584–0.820, which are determined to exceed the ‘0.5’ threshold value. Based on the following results, it is possible to achieve convergent validity.

5.3. Discriminant Validity

To measure discriminant validity, it was suggested to consider two criteria that include the Heterotrait-Monotrait ratio (HTMT) and Fornell-Larker criterion [43]. Table 5 findings suggest that the Fornell-Larker condition confirm the requirements because each AVE and their square roots exceed its correlation with other constructs [53].
Table 6 show the HTMT ratio findings, which represents that the value of each construct is lower than the ‘0.85’ threshold value [54]. Because of this, there is presence of the HTMT ratio. With the help of these findings, there is calculation of the discriminant validity. According to the analysis results, there was not a single issue related to assessing the measurement model when it comes to its reliability and validity. Because of it, the collected data can be further used for evaluating the structural model.

5.4. Model Fit

The RMS_theta, NFI, Chi-Square, d_ULS, d_G, exact fit criteria, and standard root mean square residual (SRMR) which show the model fit in PLS-SEM are the fit measures provided by SmartPLS [55]. As par the SRMR, how observed correlations are different from model implied correlation matrix [56] and <0.08 values are thought to be good model fit measures [57]. A good model fit is considered to be >0.90 NFI values [58]. The NFI ratio deals with the Chi2 value in the proposed model and the null model or benchmark model [59]. The NFI is directly correlated to the parameters and considering this, model fit indicators do not include NPI [56]. Discrepancy between empirical covariance matrix and covariance matrix implied by composite factor model is offered by the two metrics, the geodesic distance d_G, squared Eucledian distance, and d_ULS [50,56]. RMS theta can only be applied to the reflective models and helps with evaluating the degree of outer model residuals correlation [59]. The PLS-SEM model will improve as the RMS theta value reaches zero, with a good fit being <0.12 and poor fits being other values [60]. According to the suggestion of [56], the relationship between each construct is evaluated by the saturated model, while the estimated model works on model structure and total effects.
According to Table 6, the value of RMS_theta was 0.078. From this, it can be said that the size of the goodness-of-fit for the PLS-SEM model was appropriate for demonstrating global PLS model validity.

5.5. Hypotheses Testing Using PLS-SEM

For determining whether the structural model’s theoretical constructs are interdependent, there was utilization of the structural equation model alongside Smart PLS with maximum likelihood estimation. Accordingly, the analysis of the proposed hypotheses was completed. Table 6 and Table 7 also show the high predictive power of the model [61], i.e., there was 76% variance within Online Transaction/E-relationship.
In Table 8, the beta (β) values, t-values, and p-values for all of the developed hypotheses have been described on the basis of the produced findings with the help of the PLS-SEM technique. There is no doubt that every researcher has supported each hypothesis. Taking into the consideration the data analysis hypotheses, the empirical data shows support for H1, H2, H3, H4, H5, H6, H7, H8, H9, and H10.
The structural equation model was employed with Smart PLS having maximum likelihood estimation to find out the interdependence of various theoretical constructs of the structural model [62,63]. In this way, the proposed hypotheses were analyzed. As appeared in Table 7 and Figure 2, the model had a high predictive power [61], that is the percentage of the variance within continuous intention to use digital information in education is nearly 71%.
Table 8 describes the beta (β) values, t-values, and p-values for each of the developed hypotheses based on the generated results through PLS-SEM technique. It is clear that all the researchers have supported all hypotheses. Based on the data analysis hypotheses H1, H2, H3, H4, H5, H6, H7, H8, H9, and H10 were supported by the empirical data. Technology Readiness (TR), Uncertain Avoidance (UA), and Digital Information Flow (DIF) has significant effects on Perceived Ease of Use (PEOU) (β = 0.159, p < 0.05), (β = 0.599, p < 0.05), and (β = 0.270, p < 0.001), respectively; hence H1, H2, H3, and H3 are supported. The results also showed that Perceived Usefulness (PU) significantly influenced Tutor Quality (TQ) (β = 0.354, p < 0.05), and Learning Satisfaction (LS) (β = 0.716, p < 0.001) supporting hypothesis H4, and H5 respectively. Perceived Ease of Use (PEOU) and Perceived Usefulness (PU) has significant effects on DIE Experience (PE) (β = 0.420, p < 0.05) and (β = 0.101, p < 0.05) respectively; hence H6 and H7 are supported. The relationships between Perceived Ease of Use (PEOU), DIE Experience (PE), and Perceived Usefulness (PU) has significant effects on intention to use DIE (CI) (β = 0.852, p < 0.01), (β = 0.527, p < 0.001), and (β = 0.814, p < 0.001), respectively; hence H8, H9, and H10 are supported.

6. Discussion of Results

The growth in technology has affected universities and the educational system. Universities require advanced technological systems that provide better opportunities for e-research, e-teaching and e-learning. The digital flow of information provides innovative interactions among users of technology by using multimedia applications which are attractive to the technology users. Based on the previous assumption, the current study has formed a conceptual model that attempts to measure the continuous use of digital information in the educational environment. The perceived ease of use is considered one of the crucial factors in the conceptual model that correlates with three main factors which are technology readiness, uncertain avoidance and digital flow of information. On the other hand, perceived ease of use has a direct impact on the continuous intention to use DIE. Based on the previous proposed relations, the results of the current study are in agreement with the previous literature.
In this respect, technology readiness has been considered as having a remarkable impact on the adoption of technology. Studies have shown that technology readiness usually supports the TAM constructs of the perceived ease of use and the perceived usefulness. This stems from the fact that technology readiness is a psychological condition that results from positive thoughts that will affect positively the use of digital information in education. The lack of technology readiness will form a barrier that hinders the acceptance of using digital information. Previous studies are in line with the current result as they state that technology readiness positively affects the perceived usefulness and perceived ease of use [13,64].
Similarly, the results have shown that the factor of uncertainty avoidance can affect positively the perceived ease of use. The effectiveness of uncertainty avoidance is in line with previous studies which show that some cultures are highly dependent on this factor because it reduces the level of risk that a technology user may have [65]. The lack of a high-risk level will in turn enforce the digital information flow that is increased whenever the technology is proved to be crucial. Studies have illustrated that technology users usually have a smoothing experience and perceived the technology as easy whenever the flow of information is viewed as effective [66].
On the other hand, the factors of tutor quality and learning satisfaction correlate with the perceived ease of use. The hypotheses that have been proposed are approved and supported through various pieces of evidence in the literature. In the virtual environment, the tutor quality shifts the teacher from the provider of information to the function of a facilitator who works as a trouble-shooter, thus, the high quality of the tutor implies a higher level of perceived ease of use leading to a sort of higher willingness to use the digital information. Similarly, a higher level of satisfaction may lead to a higher level of usefulness. The accumulation of these three factors may integrate to assess the use of DIE [19,67,68].
The integrated model has focused on the TAM construct in relation to DIE experience that controls the individual’s willingness to use DIE technology. It links the constructs of perceived ease of use, perceived usefulness and DIE experience directly with the continuous intention to use DIE. The current results are in agreement with the previous studies that explore the importance of technology acceptance emphasizing the fact that PEOU and PU can be integrated with external factors to measure the effectiveness of technology depending on various individuals’ characteristics and technology’s innovative features.

6.1. Theoretical and Practical Implications

Concerning the theoretical importance of the study, the integration of various external factors with the TAM constructs can be of benefit to adoption and acceptance studies. It is obvious that this study is a step ahead of other empirical studies because it focuses on the factors that show individual differences by focusing on tutor quality and users’ satisfaction and experience. The emphasis on the individual differences enhances the deep-learning analysis rather than the simple use of SEM analysis seen which can be implemented in other empirical studies. Accordingly, this study is a key contribution to literature paving the way for more research that tackles the acceptance of technology. Moreover, the proposed methodology contributes to the predictive power of the analysis and results of the current study.

6.2. Managerial Implications

The findings of the current study can enhance the future work of universities and other educational institutions by providing up-to-date implications for teaching and learning practice. They indicate that users may comprehend the importance of the technology based on their own needs and preferences as well as the technology’s distinctive features. The use of DIE as a crucial tool in the educational environment may help administration staff to re-think the educational tools that are found in their educational institutions and may urge them to adopt a more innovative point of view and change the educational environment by providing more DIE that differs in quality and quantity. Likewise, the users’ perception of the perceived ease of use and the perceived usefulness may enable developers to focus on the effectiveness of these two features in future invented digital tools. Hence, teachers and technology supporters should provide opportunities to students to feel that certain DIE have to be used as a backup that assists their role as trouble shooters, not a provider of information. Conversely, students will have an obvious positive evaluation of the educational environment throughout time and their willingness to use the technology will increase, leading to more improvement in the educational settings. Future research should take into consideration gender-based individual differences in terms of their personal preference, values, and academic influence [69,70,71,72,73,74,75].

6.3. Limitations of the Study and Future Studies

The current study has several limitations. First, the conceptual model is restricted to a group of external factors that may correlate directly with the TAM constructs. Accordingly, future studies may integrate other external factors that address the features of the technology in question. Second, the sample is limited to a group of university students that have joined different majors. However, the study does not tackle the gender differences among university students, thus, future studies may focus on the individual differences among them. Third, the survey was distributed on the Internet and social media, surveys can be distributed differently for future studies especially after the decrease in the bad effect of the pandemic. Fourth, this study restricts its scope to educational settings where the teaching and learning environment will be highly affected by the DIE [76,77,78,79,80,81,82]. Future studies may focus on health or economic institutions.

7. Conclusions

In higher education, digital technologies have gained considerable attention for enhancing learning. Education has been transformed significantly by the digital revolution. Over the past few years, accessing education through a different learning process has been a challenge. Communication, information access, business, and cooperation problems can now be solved with technology. It is crucial to possess digital information skills in order for users to engage in society and work effectively. As a result of exposure to digital information, digital literacy is considered to underpin the ability to maintain lifelong learning. Educators have a crucial role to play in promoting digital literacy. Thus, it is the responsibility of educational institutions to reconsider of the effectiveness of digital information technology as means of developing educational section.

Author Contributions

Conceptualization, M.A.A. and S.A.S.; methodology, R.A. and O.S.A.S.; software, S.A.-O.; validation, A.L. and M.A.; formal analysis, A.A.M. investigation, A.B.A. and R.S.A.-M.; resources, A.L.; writing original draft preparation, M.A.A. writing—review and editing, S.A.S.; visualization, M.A.A.; supervision, M.A.A.; project administration, M.A.A.; funding acquisition, M.A.A. All authors have read and agreed to the published version of the manuscript.

Funding

This work was funded by King Faisal University and Princess Nourah bint Abdulrahman University.

Data Availability Statement

Not applicable.

Acknowledgments

This work was supported through the Annual Funding track by the Deanship of Scientific Research, Vice Presidency for Graduate Studies and Scientific Research, King Faisal University, Saudi Arabia (Project No. Grant No. 666) and Princess Nourah bint Abdulrahman University Researchers Supporting Project number (PNURSP2022R136), Princess Nourah bint Abdulrahman University, Riyadh, Saudi Arabia.

Conflicts of Interest

All authors declare no conflict of interest.

References

  1. Leshchenko, M.P.; Kolomiiets, A.M.; Iatsyshyn, A.V.; Kovalenko, V.V.; Dakal, A.V.; Radchenko, O.O. Development of informational and research competence of postgraduate and doctoral students in conditions of digital transformation of science and education. J. Physics Conf. Ser. 2021, 1840, 012057. [Google Scholar] [CrossRef]
  2. Dudhat, A.; Santoso, N.P.L.; Henderi, S.S.; Setiawati, R. Blockchain in Indonesia University: A Design Viewboard of Digital Technology Education. Aptisi Trans. Technopreneurship 2021, 3, 68–80. [Google Scholar] [CrossRef]
  3. He, T.; Huang, Q.; Yu, X.; Li, S. Exploring students’ digital informal learning: The roles of digital competence and DTPB factors. Behav. Inf. Technol. 2020, 40, 1406–1416. [Google Scholar] [CrossRef]
  4. Almaiah, M.A.; Al Mulhem, A. Thematic analysis for classifying the main challenges and factors influencing the successful implementation of e-learning system using NVivo. Int. J. Adv. Trends Comput. Sci. Eng. 2020, 9, 142–152. [Google Scholar] [CrossRef]
  5. Siddiq, F.; Scherer, R.; Tondeur, J. Teachers’ emphasis on developing students’ digital information and communication skills (TEDDICS): A new construct in 21st century education. Comput. Educ. 2016, 92–93, 1–14. [Google Scholar] [CrossRef]
  6. Qureshi, M.I.; Khan, N.; Raza, H.; Imran, A.; Ismail, F. Digital Technologies in Education 4.0. Does it Enhance the Effectiveness of Learning? A Systematic Literature Review. Int. J. Interact. Mob. Technol. 2021, 15, 31–47. [Google Scholar] [CrossRef]
  7. Lutfi, A.; Alsyouf, A.; Almaiah, M.A.; Alrawad, M.; Abdo, A.A.K.; Al-Khasawneh, A.L.; Ibrahim, N.; Saad, M. Factors Influencing the Adoption of Big Data Analytics in the Digital Transformation Era: Case Study of Jordanian SMEs. Sustainability 2022, 14, 1802. [Google Scholar] [CrossRef]
  8. Jeffrey, L.; Hegarty, B.; Kelly, O.; Penman, M.; Coburn, D.; McDonald, J. Developing Digital Information Literacy in Higher Education: Obstacles and Supports. J. Inf. Technol. Educ. Res. 2011, 10, 383–413. [Google Scholar] [CrossRef]
  9. Çetin, E. Digital storytelling in teacher education and its effect on the digital literacy of pre-service teachers. Think. Ski. Creat. 2021, 39, 100760. [Google Scholar] [CrossRef]
  10. Althunibat, A.; Almaiah, M.A.; Altarawneh, F. Examining the Factors Influencing the Mobile Learning Applications Usage in Higher Education during the COVID-19 Pandemic. Electronics 2021, 10, 2676. [Google Scholar] [CrossRef]
  11. Börnert-Ringleb, M.; Casale, G.; Hillenbrand, C. What predicts teachers’ use of digital learning in Germany? Examining the obstacles and conditions of digital learning in special education. Eur. J. Spec. Needs Educ. 2021, 36, 80–97. [Google Scholar] [CrossRef]
  12. Moreno-Morilla, C.; Guzmán-Simón, F.; García-Jiménez, E. Digital and information literacy inside and outside Spanish primary education schools. Learn. Cult. Soc. Interact. 2021, 28, 100455. [Google Scholar] [CrossRef]
  13. Mulhem, A.A.; Almaiah, M.A. A conceptual model to investigate the role of mobile game applications in education during the COVID-19 pandemic. Electronics 2021, 10, 2106. [Google Scholar] [CrossRef]
  14. Sayaf, A.M.; Alamri, M.M.; Alqahtani, M.A.; Al-Rahmi, W.M. Information and Communications Technology Used in Higher Education: An Empirical Study on Digital Learning as Sustainability. Sustainability 2021, 13, 7074. [Google Scholar] [CrossRef]
  15. Wahyuningsih, T.; Oganda, F.P.; Anggraeni, M. Design and Implementation of Digital Education Resources Blockchain-Based Authentication System. Blockchain Front. Technol. 2021, 1, 74–86. [Google Scholar] [CrossRef]
  16. Lutfi, A.; Al-Khasawneh, A.L.; Almaiah, M.A.; Alsyouf, A.; Alrawad, M. Business Sustainability of Small and Medium Enterprises during the COVID-19 Pandemic: The Role of AIS Implementation. Sustainability 2022, 14, 5362. [Google Scholar] [CrossRef]
  17. Aydin, E.; Erol, S. The Views of Turkish Language Teachers on Distance Education and Digital Literacy during Covid-19 Pandemic. Int. J. Educ. Lit. Stud. 2021, 9, 60–71. [Google Scholar] [CrossRef]
  18. Liljander, V.; Gillberg, F.; Gummerus, J.; van Riel, A. Technology readiness and the evaluation and adoption of self-service technologies. J. Retail. Consum. Serv. 2006, 13, 177–191. [Google Scholar] [CrossRef]
  19. Almaiah, M.A.; Hajjej, F.; Shishakly, R.; Lutfi, A.; Amin, A.; Awad, A.B. The Role of Quality Measurements in Enhancing the Usability of Mobile Learning Applications during COVID-19. Electronics 2022, 11, 1951. [Google Scholar] [CrossRef]
  20. Parasuraman, A.; Colby, C.L. Techno-Ready Marketing: How and Why Your Customers Adopt Technology; Free Press: New York, NY, USA, 2001. [Google Scholar]
  21. Lutfi, A.; Saad, M.; Almaiah, M.A.; Alsaad, A.; Al-Khasawneh, A.; Alrawad, M.; Alsyouf, A.; Al-Khasawneh, A.L. Actual Use of Mobile Learning Technologies during Social Distancing Circumstances: Case Study of King Faisal University Students. Sustainability 2022, 14, 7323. [Google Scholar] [CrossRef]
  22. Parasuraman, A. Technology Readiness Index (TRI) a multiple-item scale to measure readiness to embrace new technologies. J. Serv. Res. 2000, 2, 307–320. [Google Scholar] [CrossRef]
  23. Parasuraman, A.; Zeithaml, V.A.; Malhotra, A. E-S-QUAL a multiple-item scale for assessing electronic service quality. J. Serv. Res. 2005, 7, 213–233. [Google Scholar] [CrossRef]
  24. Parasuraman, A.; Edvardsson, B.; Gustafsson, A. The impact of national culture on technology readiness, adoption and use. In Proceedings of the QUIS 9, Karlstad, Sweden, 15–18 June 2004. [Google Scholar]
  25. Althunibat, A.; Altarawneh, F.; Dawood, R.; Almaiah, M.A. Propose a New Quality Model for M-Learning Application in Light of COVID-19. Mob. Inf. Syst. 2022, 2022, 3174692. [Google Scholar] [CrossRef]
  26. Hofstede, G. Culture’s Consequences: Comparing Values, Behaviors, Institutions and Organizations Across Nations; Sage Publications: New York, NY, USA, 2001. [Google Scholar]
  27. Teo, T.; Luan, W.S.; Thammetar, T.; Chattiwat, W. Assessing e-learning acceptance by university students in Thailand. Australas. J. Educ. Technol. 2011, 27, 76–85. [Google Scholar] [CrossRef]
  28. Kear, K.; Donelan, H.; Williams, J. Using wikis for online group projects: Student and tutor perspectives. Int. Rev. Res. Open Distrib. Learn. 2014, 15, 70–90. [Google Scholar] [CrossRef]
  29. Labrecque, L.I.; vor dem Esche, J.; Mathwick, C.F.; Novak, T.P.; Hofacker, C. Consumer Power: Evolution in the Digital Age. J. Interact. Mark. 2013, 27, 257–269. [Google Scholar] [CrossRef]
  30. Peltier, J.W.; Dahl, A.J.; Swan, E.L. Digital information flows across a B2C/C2C continuum and technological innovations in service ecosystems: A service-dominant logic perspective. J. Bus. Res. 2020, 121, 724–734. [Google Scholar] [CrossRef]
  31. Kuo, Y.-C.; Walker, A.E.; Schroder, K.E.; Belland, B.R. Interaction, Internet self-efficacy, and self-regulated learning as predictors of student satisfaction in online education courses. Internet High. Educ. 2014, 20, 35–50. [Google Scholar] [CrossRef]
  32. Almaiah, M.A.; Hajjej, F.; Lutfi, A.; Al-Khasawneh, A.; Shehab, R.; Al-Otaibi, S.; Alrawad, M. Explaining the Factors Affecting Students’ Attitudes to Using Online Learning (Madrasati Platform) during COVID-19. Electronics 2022, 11, 973. [Google Scholar] [CrossRef]
  33. Dhawan, S. Online Learning: A Panacea in the Time of COVID-19 Crisis. J. Educ. Technol. Syst. 2020, 49, 5–22. [Google Scholar] [CrossRef]
  34. Eichelberger, A.; Ngo, H.T. College students’ perception of an online course in special education. Int. J. Educ. Media Technol. 2018, 12, 123–133. [Google Scholar]
  35. Joosten, T.; Cusatis, R. Online Learning Readiness. Am. J. Distance Educ. 2020, 34, 180–193. [Google Scholar] [CrossRef]
  36. Hsu, H.-C.K.; Wang, C.V.; Levesque-Bristol, C. Reexamining the impact of self-determination theory on learning outcomes in the online learning environment. Educ. Inf. Technol. 2019, 24, 2159–2174. [Google Scholar] [CrossRef]
  37. Davis, F.D. Perceived usefulness, perceived ease of use, and user acceptance of information technology. MIS Q. 1989, 13, 319–340. [Google Scholar] [CrossRef]
  38. Agarwal, R.; Karahanna, E. Cognitive absorption and beliefs about information technology usage. MIS Q. 2000, 24, 665–694. [Google Scholar] [CrossRef]
  39. Saadé, R.; Bahli, B. The impact of cognitive absorption on perceived usefulness and perceived ease of use in on-line learning: An extension of the technology acceptance model. Inf. Manag. 2005, 42, 317–327. [Google Scholar] [CrossRef]
  40. Csikszentmihalyi, M. Literacy and intrinsic motivation. Daedalus 1990, 115–140. [Google Scholar]
  41. Krejcie, R.V.; Morgan, D.W. Determining Sample Size for Research Activities. Educ. Psychol. Meas. 1970, 30, 607–610. [Google Scholar] [CrossRef]
  42. Chuan, C.L.; Penyelidikan, J. Sample size estimation using Krejcie and Morgan and Cohen statistical power analysis: A comparison. J. Penyelid. IPBL 2006, 7, 78–86. [Google Scholar]
  43. Al-Emran, M.; Salloum, S. Students’ Attitudes towards the Use of Mobile Technologies in e-Evaluation. Int. J. Interact. Mob. Technol. 2017, 11, 195–202. [Google Scholar] [CrossRef]
  44. Wang, Y.-S.; Wu, M.-C.; Wang, H.-Y. Investigating the determinants and age and gender differences in the acceptance of mobile learning. Br. J. Educ. Technol. 2009, 40, 92–118. [Google Scholar] [CrossRef]
  45. Almaiah, M.A.; Al-Otaibi, S.; Lutfi, A.; Almomani, O.; Awajan, A.; Alsaaidah, A.; Alrawad, M.; Awad, A.B. Employing the TAM Model to Investigate the Readiness of M-Learning System Usage Using SEM Technique. Electronics 2022, 11, 1259. [Google Scholar] [CrossRef]
  46. Almaiah, M.A.; Jalil, M.M.A.; Man, M. Empirical investigation to explore factors that achieve high quality of mobile learning system based on students’ perspectives. Eng. Sci. Technol. Int. J. 2016, 19, 1314–1320. [Google Scholar] [CrossRef] [Green Version]
  47. Vargo, S.L.; Lusch, R.F. Service-dominant logic: Continuing the evolution. J. Acad. Mark. Sci. 2008, 36, 1–10. [Google Scholar] [CrossRef]
  48. Reigeluth, C.M. Instructional Design Theories and Models: An Overview of Their Current Status; Routledge: London, UK, 1983. [Google Scholar]
  49. Donkor, F. Assessment of learner acceptance and satisfaction with video-based instructional materials for teaching practical skills at a distance. Int. Rev. Res. Open Distrib. Learn. 2011, 12, 74–92. [Google Scholar] [CrossRef]
  50. Okazaki, S. Excitement or sophistication? A preliminary exploration of online brand personality. Int. Mark. Rev. 2006, 23, 279–303. [Google Scholar] [CrossRef]
  51. Almaiah, M.A.; Ayouni, S.; Hajjej, F.; Lutfi, A.; Almomani, O.; Awad, A.B. Smart Mobile Learning Success Model for Higher Educational Institutions in the Context of the COVID-19 Pandemic. Electronics 2022, 11, 1278. [Google Scholar] [CrossRef]
  52. Nunnally, J.C.; Bernstein, I.H. Psychometric Theory. McGraw Hill: New York NY, USA, 1994. [Google Scholar]
  53. Ringle, C.M.; Wende, S.; Becker, J.-M. SmartPLS 3; SmartPLS: Bönningstedt, Germany, 2015. [Google Scholar]
  54. Hair, J.; Hollingsworth, C.L.; Randolph, A.B.; Chong, A.Y.L. An updated and expanded assessment of PLS-SEM in information systems research. Ind. Manag. Data Syst. 2017, 117, 442–458. [Google Scholar] [CrossRef]
  55. Urbach, N.; Ahlemann, F. Structural equation modeling in information systems research using partial least squares. J. Inf. Technol. theory Appl. 2010, 11, 5–40. [Google Scholar]
  56. Hair, J.F., Jr.; Hult, G.T.M.; Ringle, C.M.; Sarstedt, M. A Primer on Partial Least Squares Structural Equation Modeling (PLS-SEM); Sage Publications: Newbury Park CA, USA, 2016. [Google Scholar]
  57. Goodhue, D.L.; Lewis, W.; Thompson, R. Does PLS have adavantages for small sample size or non-normal data? MIS Q. 2012, 36, 981–1001. [Google Scholar] [CrossRef]
  58. Barclay, D.; Higgins, C.; Thompson, R. The Partial Least Squares (pls) Approach to Casual Modeling: Personal Computer Adoption Ans Use as an Illustration, 1995.
  59. Almaiah, M.A.; Al-Khasawneh, A.; Althunibat, A.; Almomani, O. Exploring the main determinants of mobile learning application usage during COVID-19 pandemic in Jordanian universities. In Emerging Technologies during the Era of COVID-19 Pandemic; Springer: Cham, Switzerland, 2021; pp. 275–290. [Google Scholar]
  60. Kline, R.B. Principles and Practice of Structural Equation Modeling, 4th ed.; Guilford Publications: New York, NY, USA, 2018. [Google Scholar]
  61. Dijkstra, T.K.; Henseler, J. Consistent and asymptotically normal PLS estimators for linear structural equations. Comput. Stat. Data Anal. 2015, 81, 10–23. [Google Scholar] [CrossRef]
  62. Hair, J.F.; Ringle, C.M.; Sarstedt, M. PLS-SEM: Indeed a Silver Bullet. J. Mark. Theory Pract. 2011, 19, 139–152. [Google Scholar] [CrossRef]
  63. Henseler, J.; Ringle, C.M.; Sinkovics, R.R. The use of partial least squares path modeling in international marketing. In New Challenges to International Marketing; Emerald Group Publishing Limited: Bingley, UK, 2009; Volume 20, pp. 277–319. [Google Scholar] [CrossRef]
  64. Fornell, C.; Larcker, D.F. Evaluating Structural Equation Models with Unobservable Variables and Measurement Error. J. Mark. Res. 1981, 18, 39–50. [Google Scholar] [CrossRef]
  65. Henseler, J.; Ringle, C.M.; Sarstedt, M. A new criterion for assessing discriminant validity in variance-based structural equation modeling. J. Acad. Mark. Sci. 2015, 43, 115–135. [Google Scholar] [CrossRef]
  66. Trial, D. Model Fit.
  67. Almaiah, M.A. Acceptance and usage of a mobile information system services in University of Jordan. Educ. Inf. Technol. 2018, 23, 1873–1895. [Google Scholar]
  68. Hu, L.T.; Bentler, P.M. Fit indices in covariance structure modeling: Sensitivity to underparameterized model misspecification. Psychol. Methods 1998, 3, 424. [Google Scholar] [CrossRef]
  69. Bentler, P.M.; Bonett, D.G. Significance tests and goodness of fit in the analysis of covariance structures. Psychol. Bull. 1980, 88, 588. [Google Scholar] [CrossRef]
  70. Lohmöller, J.B. Latent Variable Path Modeling with Partial Least Squares; Physica-Verlag: Heidelberg, Germany, 1989. [Google Scholar]
  71. Henseler, J.; Dijkstra, T.K.; Sarstedt, M.; Ringle, C.M.; Diamantopoulos, A.; Straub, D.W.; Calantone, R.J. Common beliefs and reality about PLS: Comments on Rönkkö and Evermann (2013). Organ. Res. Methods 2014, 17, 182–209. [Google Scholar] [CrossRef]
  72. Chin, W.W. The partial least squares approach to structural equation modeling. Mod. Methods Bus. Res. 1998, 295, 295–336. [Google Scholar]
  73. Al-Emran, M.; Arpaci, I.; Salloum, S.A. An empirical examination of continuous intention to use m-learning: An integrated model. Educ. Inf. Technol. 2020, 25, 2899–2918. [Google Scholar] [CrossRef]
  74. Salloum, S.A.; Alhamad, A.Q.M.; Al-Emran, M.; Monem, A.A.; Shaalan, K. Exploring Students’ Acceptance of E-Learning Through the Development of a Comprehensive Technology Acceptance Model. IEEE Access 2019, 7, 128445–128462. [Google Scholar] [CrossRef]
  75. Ho, C.-W.; Wu, C.-C. Exploring Intention toward Using an Electric Scooter: Integrating the Technology Readiness and Acceptance into Norm Activation Model (TRA-NAM). Energies 2021, 14, 6895. [Google Scholar] [CrossRef]
  76. Karahanna, E.; Williams, C.K.; Polites, G.L.; Liu, B.; Seligman, L. Uncertainty Avoidance and Consumer Perceptions of Global Ecommerce Sites: A Multi-Level Model; Drake University: Des Moines, IA, USA, 2013. [Google Scholar]
  77. Lin, Y.-C.; Hou, H.-T. The evaluation of a scaffolding-based augmented reality educational board game with competition-oriented and collaboration-oriented mechanisms: Differences analysis of learning effectiveness, motivation, flow, and anxiety. Interact. Learn. Environ. 2022, 24, 1–20. [Google Scholar] [CrossRef]
  78. Sapta, I.; Muafi, M.; Setini, N.M. The role of technology, organizational culture, and job satisfaction in improving employee performance during the Covid-19 pandemic. J. Asian Financ. Econ. Bus. 2021, 8, 495–505. [Google Scholar]
  79. Monardo, G.; Pavese, C.; Giorgi, I.; Godi, M.; Colombo, R. Evaluation of Patient Motivation and Satisfaction During Technology-Assisted Rehabilitation: An Experiential Review. Games Heal. J. 2021, 10, 13–27. [Google Scholar] [CrossRef]
  80. Kabát, M. Teaching Metaverse. What and how to (not) teach using the medium of virtual reality. Edutainment 2016, 1, 120–132. [Google Scholar]
  81. Louro, L.C. METAVERSE-The Learning in the Immersive Worlds. SLACTIONS 2009, 2009, 142. [Google Scholar]
  82. Tatnall, A. Editorial for EAIT issue 2, 2019. Educ. Inf. Technol. 2019, 24, 953–962. [Google Scholar] [CrossRef] [Green Version]
Figure 2. Path coefficient of the model (significant at p ** < = 0.01, p * < 0.05).
Electronics 11 02827 g002
Table 1. Demographic data of the respondents.
CriterionFactorFrequencyPercentage
GenderFemale31056%
Male24344%
AgeBetween 18 to 2940373%
Between 30 to 399217%
Between 40 to 49499%
Between 50 to 5991%
Education qualificationBachelor41074%
Master12723%
Doctorate163%
Table 2. Measurement Items.
ConstructsItemsDefinitionInstrumentSources
Continuous Intention to Use Digital Information in Education CI1Continuous intention refers to “users’ preference to use new technology in the present and the future time”.I will continue to use DIE in the future to gain more digital information in my education.[35]
CI1I will use DIE as a facilitating tool in searching for digital information in my education.
Perceived Ease of UsePEOU1Perceived ease of use refers to “the degree where users of DIE feel that getting new digital information is not hard and is effortless”.My interaction with DIE is effortless and understandable.[36]
PEOU2Interacting with DIE is clearly stated by the university staff.
PEOU3Interacting with DIE needs mental effort.
PEOU4It is easy to search, evaluate and select the digital rousers via DIE.
PEOU5It is easy to control the digital information via DIE
Perceived UsefulnessPU1Perceived usefulness refers to “the users’ conception of the significance of digital information. Therefore the new technology is described as useful and can support the teaching and learning environment digitally”.Using DIE improves my daily class contribution.[36]
PU2Using DIE enhances my understanding of the practical subjects
I registered.
PU3Using DIE helps in my theoretical assignments and homework.
PU4Using DIE enables me to integrate my theoretical study with the practical everyday experience.
PU5Using DIE helps in searching, evaluating and selecting digital resources.
Technology Readiness TR1Technology readiness is “a concept initiated by [15] which is used to measure users’ readiness to accept new technology. Technology readiness is hard to achieve because users find it difficult to accept new technology. It is affected by motivational factors (optimism and innovation) and threat factors (insecurity and discomfort)”.I am ready to use DIE in my search selection and evaluation of information.[15]
TR2I am ready to accept new technology if it is easy to get digital information.
TR3I am ready to accept new technology to integrate my theoretical information with everyday practices.
TR4I am ready to use new technology that facilitates reaching digital information.
Uncertain Avoidance UA1UA refers to “users’ perceptions of the threat that digital information technology may have. Users feel threatened by the unknown situation which includes the organization of the digital information, the availability of all resources and the quality of the digital information”.The given guidelines in DIE are clear and understandable.[18]
UA2The policy indie facilitates integrating my theoretical and practical information.
UA3Instructions given by the tutors in DIE is reachable.
UA4The rules and procedures in every DIE can answer my inquiries.
Digital Information FlowDIF1Digital information flow is “a key feature that facilitate the exchange of information among users and it enhances innovation as it is a basic tool for sharing information rapidly among users which in turn facilitates the information flow. It is closely related to the concept of value in use”.I find DIE valuable because it helps in sharing the information.[37]
DIF2I thinks DIE helps in creating new useful technology.
DIF3It is easy to use DIE to exchange information among groups.
Learning Satisfaction LS1Learning satisfaction is “related to students’’ perception of the total positive environment throughout the learning process which impacts their assessment and achievement. It is a key factor that measures the success and the significance of new technology”.I am satisfied with DIE because it has significance information.[38,39]
LS2I have high level of satisfaction in using DIE because it is useful.
LS3DIE contribute effectively to my acquisition of new skills in learning.
LS4DIE encourages me to spend more time in learning.
Tutor QualityTQ1The tutor works as “a facilitator of knowledge that can be accessed using DIE. He/she is the troubleshooting that can solve any hardware or software issues. Therefore students’ willingness to use new technology is higher whenever they think that the tutor is highly qualified”.My tutor can explain the teaching material through DIE.[19]
TQ2My tutor helps me in developing my skills in learning using DIE.
TQ3My tutor clarifies the process and procedures to use DIE.
TQ4I find the tutor’s explanation useful through DIE.
Perceived ExperiencePE1Perceived experience is a crucial key feature that enhances the continuity of using new technology and it is closely related to the users’ personality. The perceived experience can enhance the innovation in technology as well as the flow of information in technology.I have good experience in using DIE.[16,40,41]
PE2I gained experience to use DIE because it is effortless.
PE3My experience in using DIE is high because it is useful.
Table 3. Convergent validity results which assure acceptable values (Factor loading, Cronbach’s Alpha, composite reliability, Dijkstra-Henseler’s rho ≥ 0.70 & AVE > 0.5).
ConstructsItemsFactor
Loading
Cronbach’s AlphaCRPAAVE
Continuous Intention to Use Digital Information in EducationCI10.7990.8260.8390.8320.636
CI20.796
Digital Information FlowDIF10.8270.8290.8930.7890.672
DIF20.742
DIF30.852
Learning SatisfactionLS10.9340.7550.8090.7930.656
LS20.909
LS30.911
LS40.803
Perceived Ease of UsePEOU10.8620.9010.8510.8310.712
PEOU20.869
PEOU30.837
PEOU40.803
PEOU50.843
Perceived ExperiencePE10.7740.8570.9000.8910.707
PE20.818
PE30.852
Perceived UsefulnessPU10.8510.8400.8010.8490.584
PU20.862
PU30.849
PU40.806
PU50.840
Technology Readiness TR10.8000.8630.7820.9070.785
TR20.864
TR30.808
TR40.766
Tutor QualityTQ10.7140.8910.8690.8220.786
TQ20.715
TQ30.792
TQ40.777
Uncertain AvoidanceUA10.7600.8000.8920.7990.820
UA20.867
UA30.805
UA40.860
Table 4. Fornell-Larcker Scale.
CIDIFLSPEOUPEPUTRTQUA
CI0.902
DIF0.2500.823
LS0.1550.4000.848
PEOU0.5360.3500.5800.816
PE0.2570.2010.2540.1040.785
PU0.3360.1110.3110.2580.1500.887
TR0.5200.1580.3990.3360.4800.2330.781
TQ0.5890.1180.4050.4500.4980.2220.6050.876
UA0.4560.2780.5750.4580.4650.2010.5550.6310.905
Table 5. Heterotrait-Monotrait Ratio (HTMT).
CIDIF LS PEOUPEPUTRTQUA
CI
DIF0.478
LS0.5050.258
PEOU0.4440.6120.463
PE0.7120.2200.1980.282
PU0.1190.6350.5690.3600.285
TR0.3350.2250.4880.5740.1470.130
TQ0.2870.1550.4020.5550.4960.1220.702
UA0.2200.1870.4780.5600.4580.3900.6320.630
Table 6. Model fit indicators.
Complete Model
Saturated ModelEstimated Mod
SRMR0.0480.049
d_ULS0.8192.324
d_G0.6510.651
Chi-Square463.736474.268
NFI0.7290.734
Rms Theta0.078
Table 7. R2 of the endogenous latent variables.
ConstructR2Results
PEOU0.763High
DIE0.775High
PU0.708High
CI0.712High
Table 8. Hypotheses-testing of the research model (significant at p ** < = 0.01, p * < 0.05).
HRelationshipPatht-Valuep-ValueDirectionDecision
H1TR ≥ PEOU0.1592.9050.044PositiveSupported *
H2UA ≥ PEOU0.5993.0090.030PositiveSupported *
H3DIF ≥ PEOU0.27021.8330.000PositiveSupported **
H4TQ ≥ PU0.3543.6990.025PositiveSupported *
H5LS ≥ PU0.71619.4890.000PositiveSupported **
H6PEOU ≥ PE0.4208.3330.013PositiveSupported *
H7PU ≥ PE0.1011.2350.046PositiveSupported *
H8PEOU ≥ CI0.85225.9770.000PositiveSupported **
H9PE ≥ CI0.39617.1170.002PositiveSupported **
H10PU ≥ CI0.52710.5520.011PositiveSupported *
Publisher’s Note: MDPI stays neutral with regard to jurisdictional claims in published maps and institutional affiliations.

