
Industry-Fit AI Usage for Crack Detection in Ground Steel


Abstract
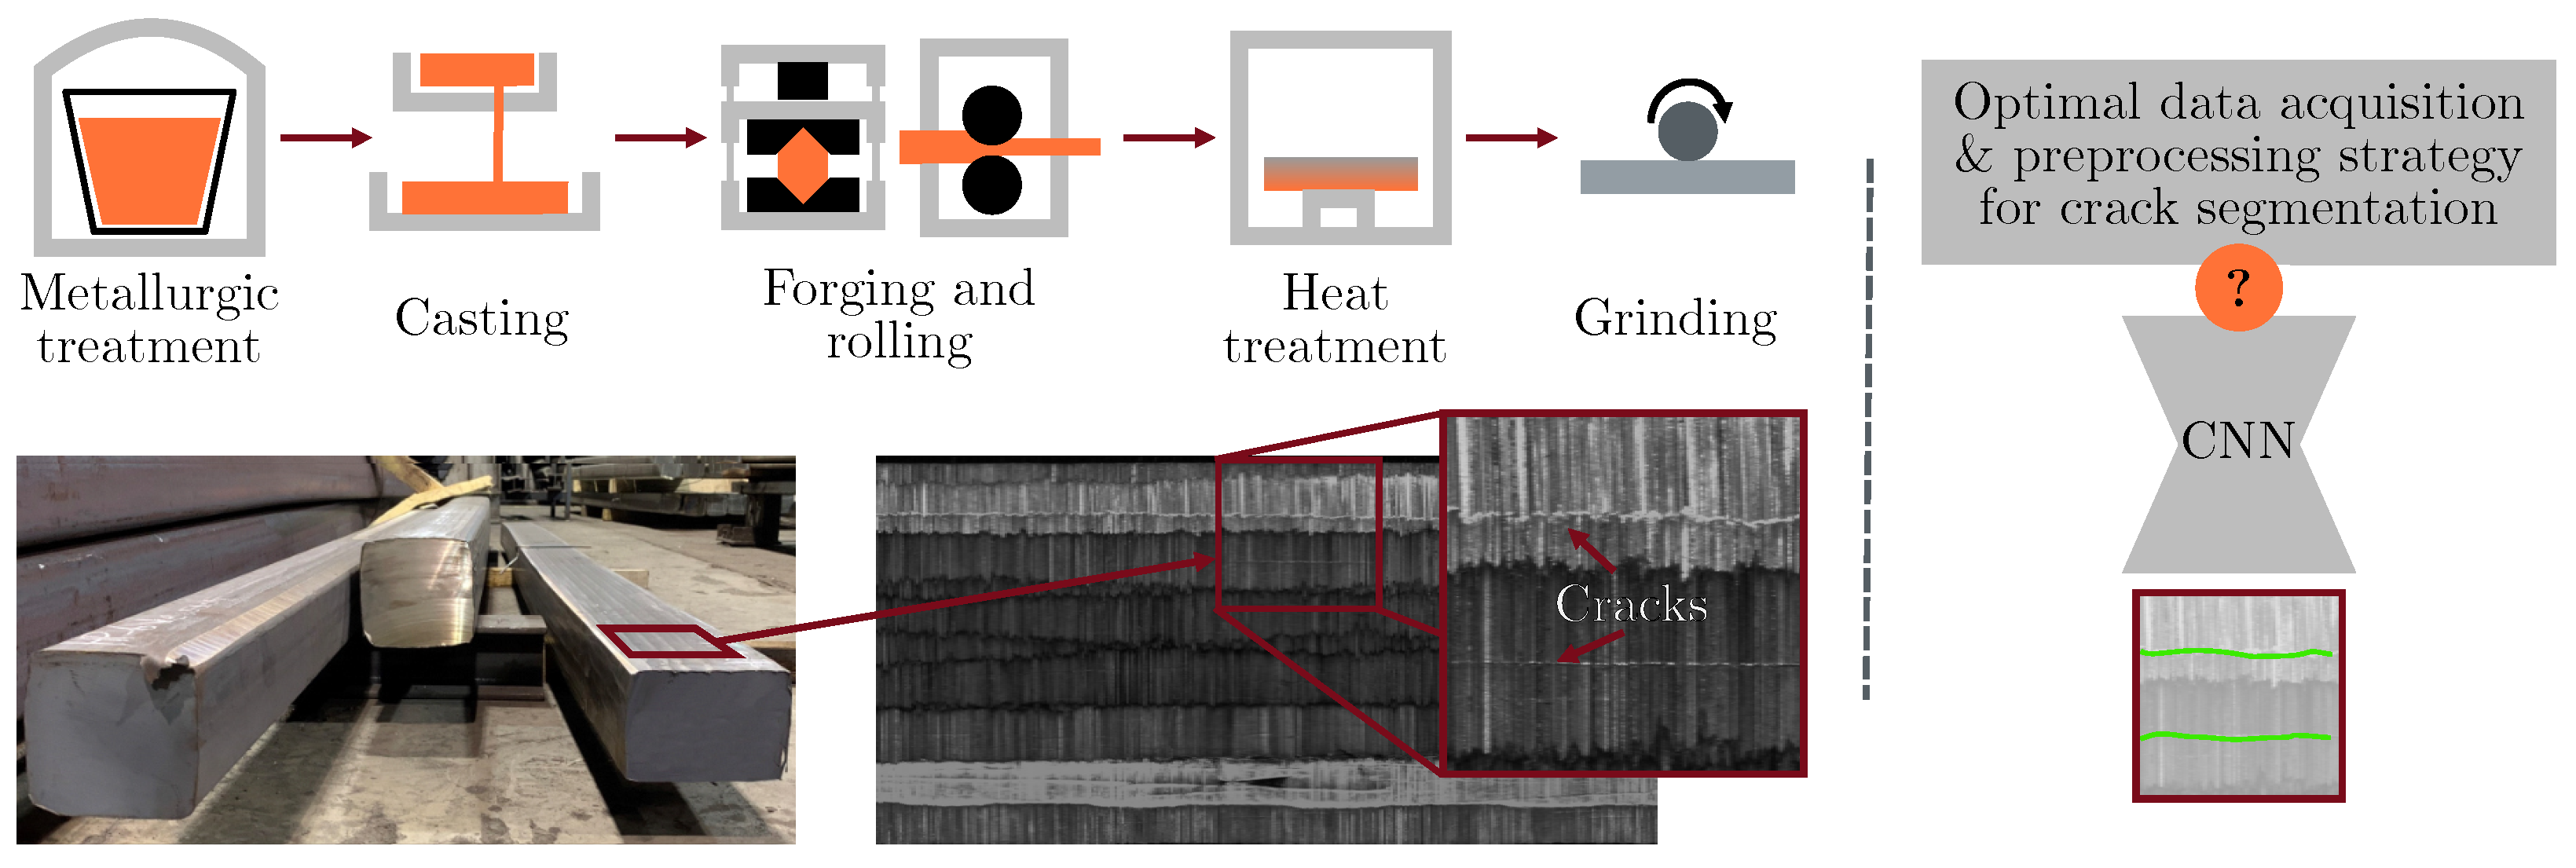
:1. Introduction
- Cracks in the presented metal surfaces can be detected more reliably using data acquired with a specialised 3D machine vision setup rather than simple 2D texture images, and
- Calculating surface models from the raw camera data by means of conventional computational image processing algorithms and using those as input for neural network crack detectors rather than raw camera images yields
- -
- Better crack detection performance and
- -
- Better generalisation with regards to newly presented objects (i.e., billet surfaces) as well as different image acquisition conditions (lab vs. on-site acquisition).
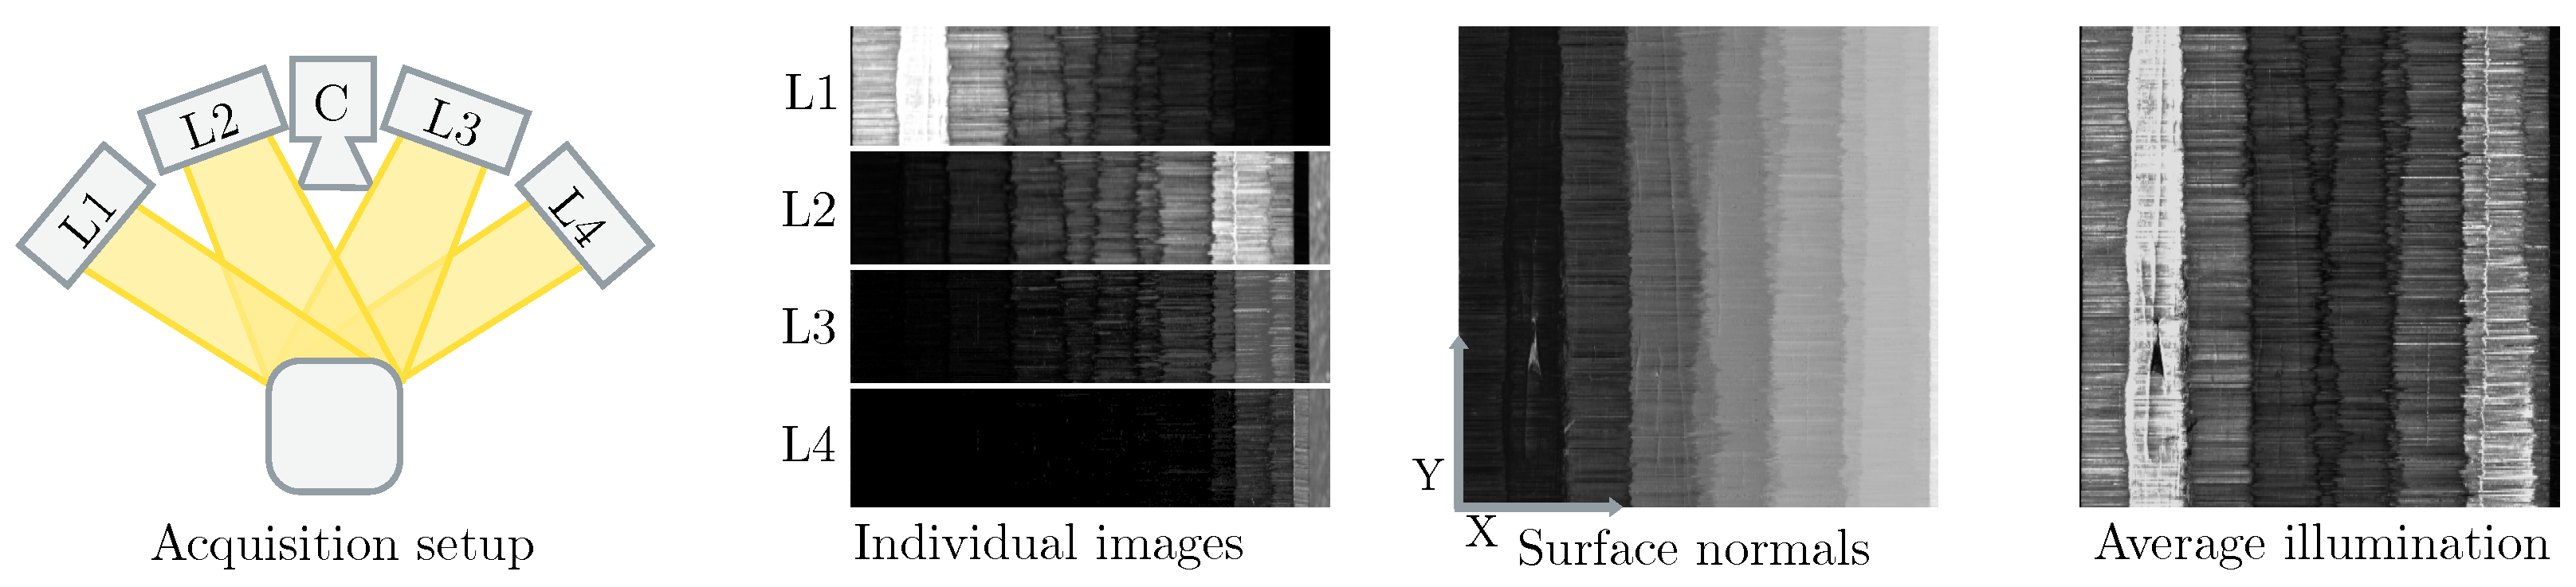
2. Inline Steel Surface Acquisition Using Photometric Stereo
2.1. Related Works
2.2. System Design
2.3. From Photometric Stereo Images to Surface Structure
3. Algorithms for Crack Detection Using PS Data
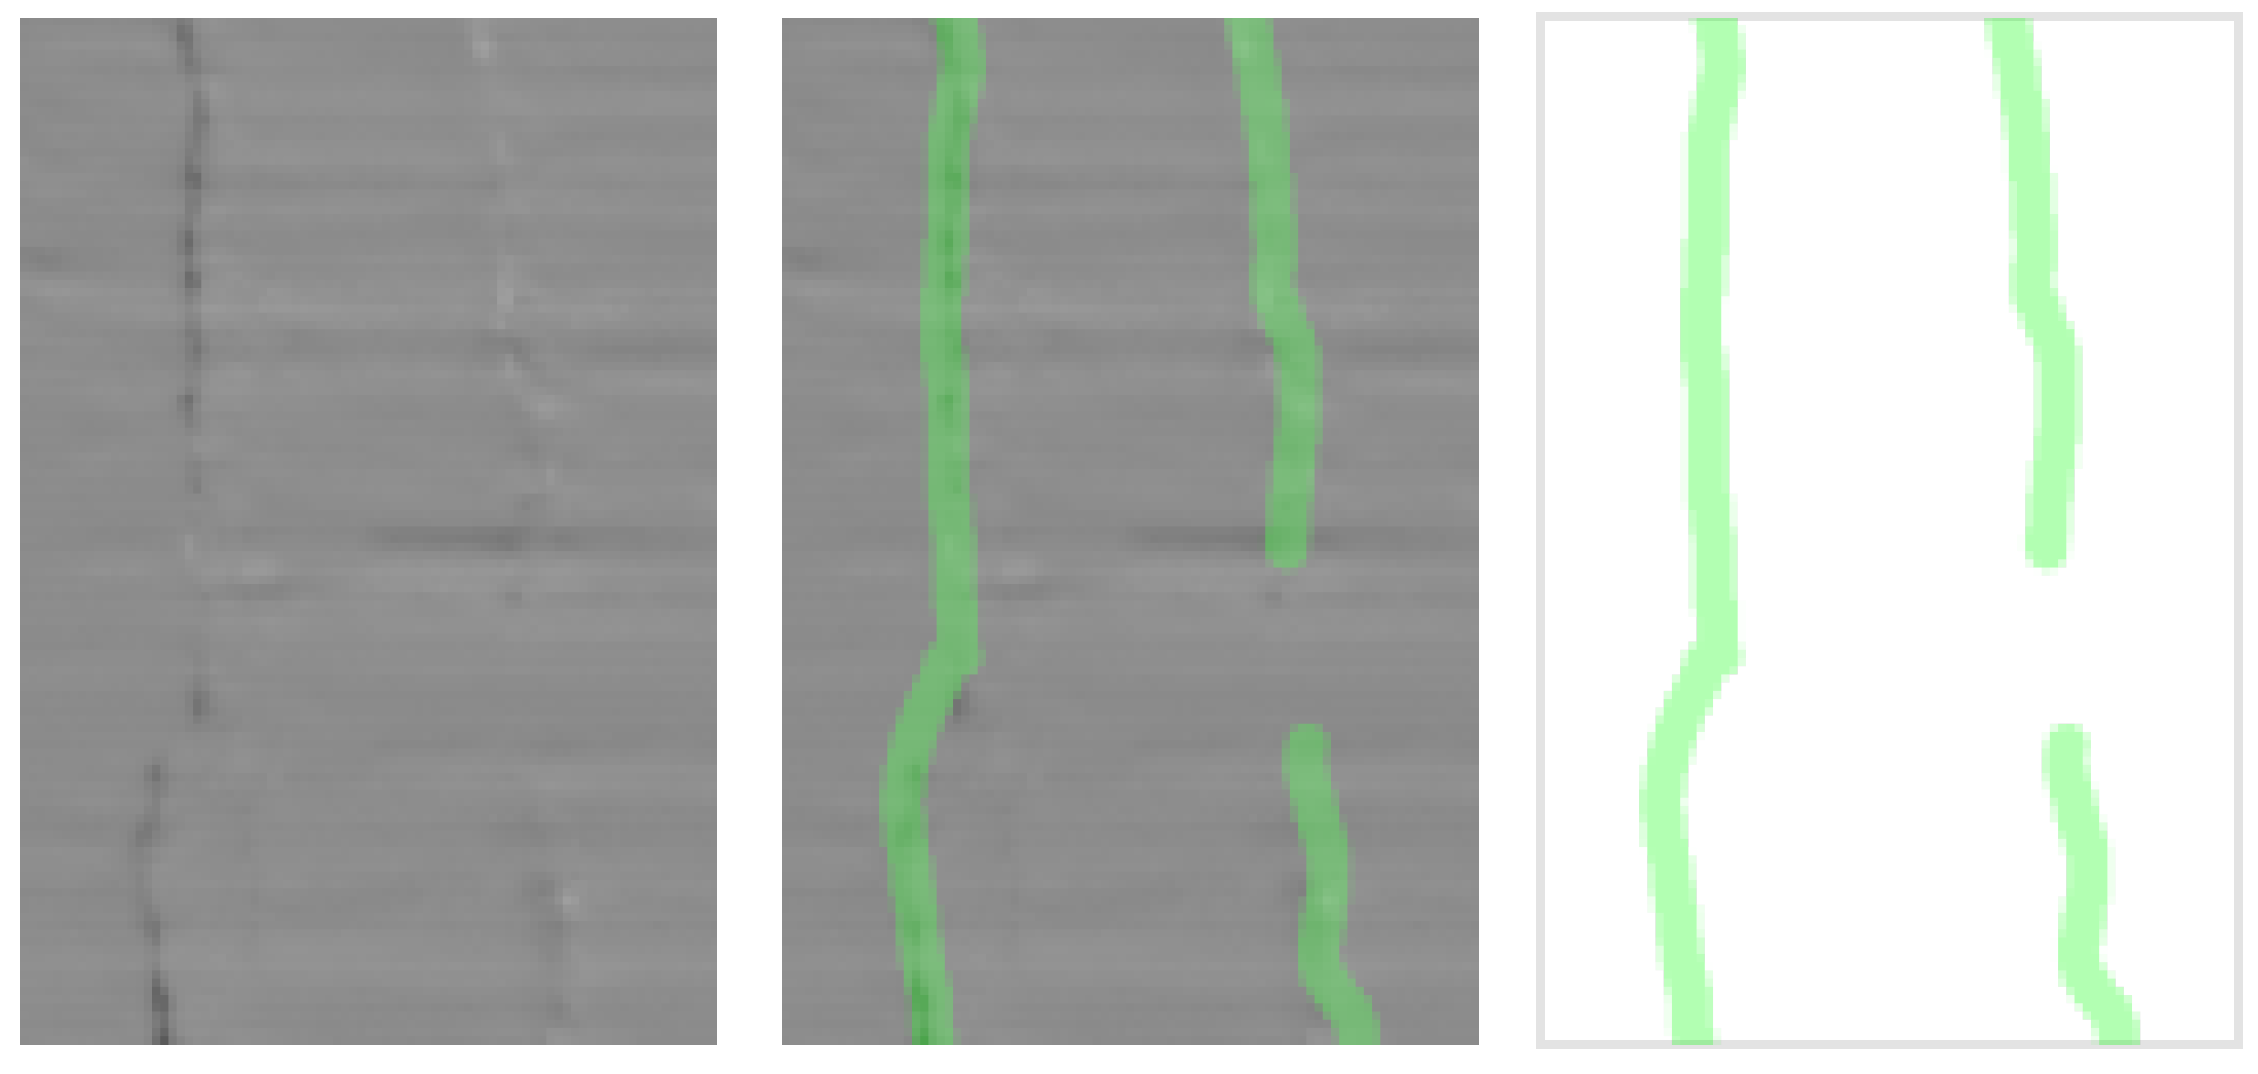
3.1. Annotation: Ground-Truth Crack Masks
3.2. Neural Network for Crack Detection in Image Data
4. Experiments
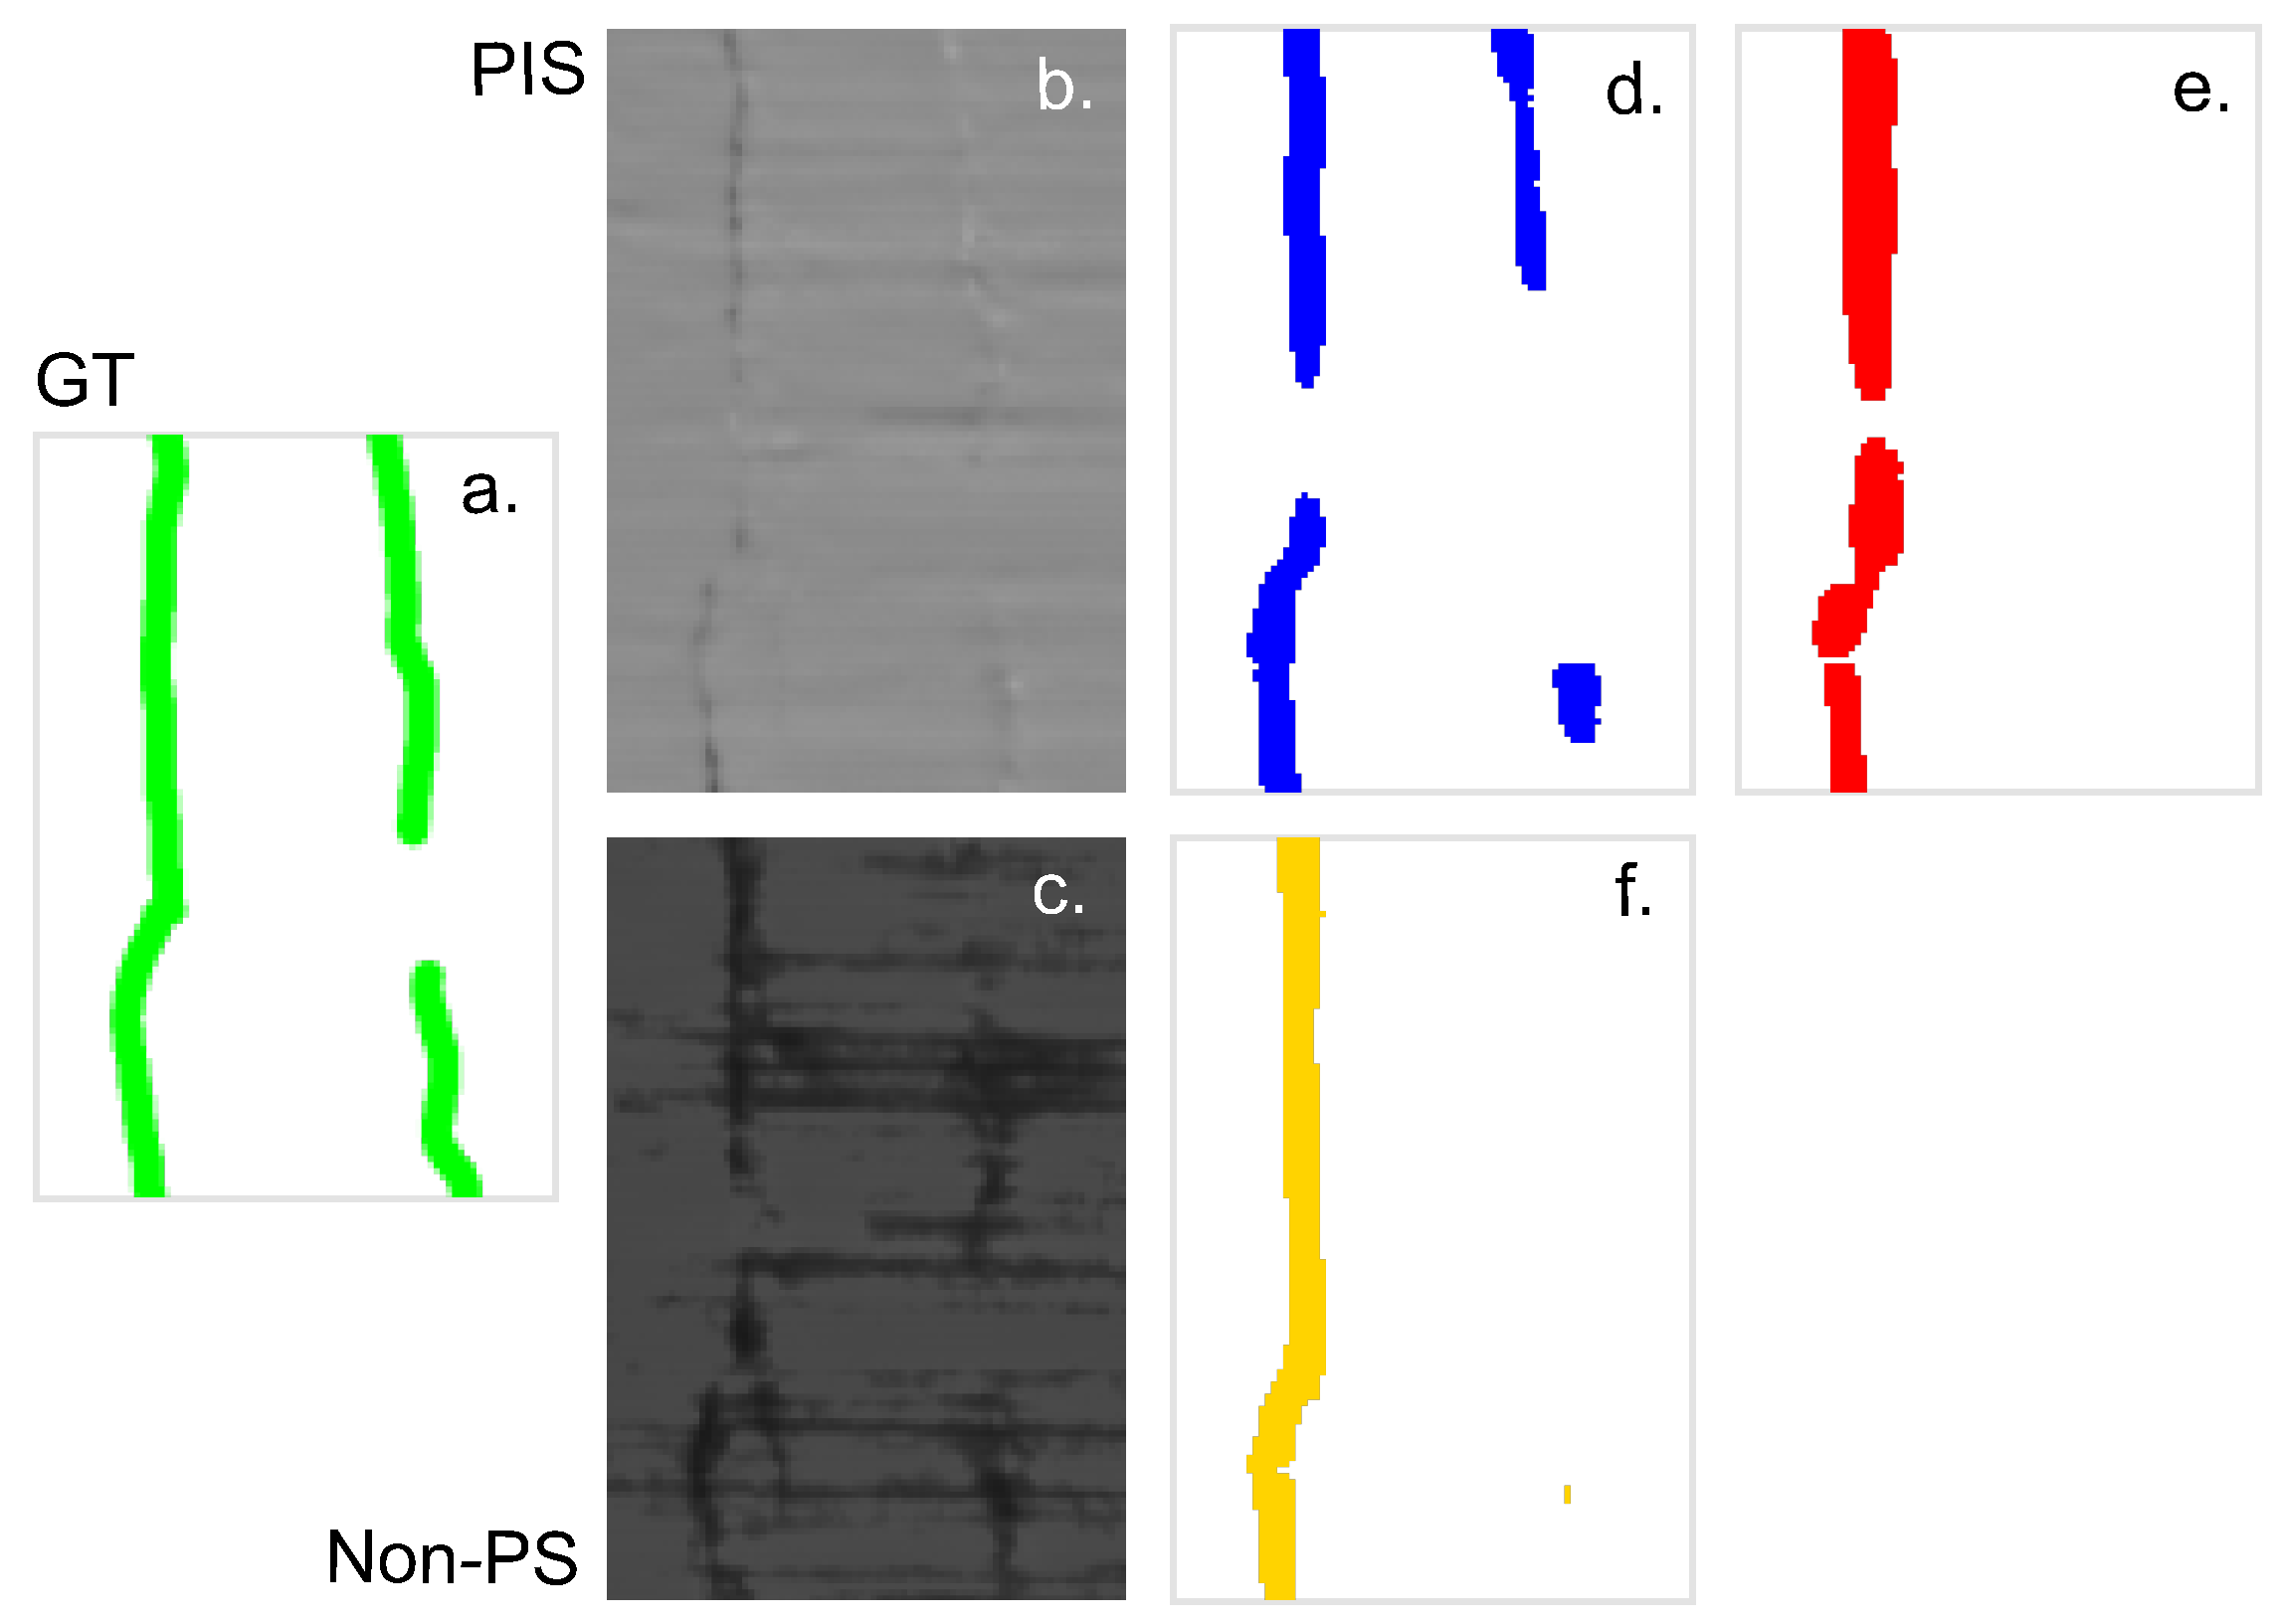
4.1. Data Sets and Compared Data Preprocessing Strategies
- ‘PIS-Raw’: PIS stack of 4 images corresponding to the 4 illumination units, as they come from the camera. Similar to [25], who use a multi-illumination setup and train a crack classifier on all images without applying the PS algorithm.
- ‘PIS-PS’: Surface model calculated with the photometric stereo algorithm from the PIS, i.e., images/maps, containing the x-components of the derived surface normal vectors per object point or pixel, as explained in Section 2.3.
- ‘Non-PS’: Standard gray-scale imaging with a single illumination unit, without taking the photometric stereo into account at all. That strategy was simulated by averaging the 4 images of the PIS.
4.2. Results and Discussion
5. Conclusions
Author Contributions
Funding
Acknowledgments
Conflicts of Interest
Abbreviations
| PS | Photometric Stereo |
| PIS | Photometric Stereo Image Stack |
| PIS-Raw | Raw Photometric Stereo image stack |
| PIS-PS | 3D surface model extracted from PIS-Raw with PS algorithm |
| Non-PS | Image data not using Photometric Stereo methods |
| nPS | Near-Field Photometric Stereo |
| CNN | Convolutional Neural Network |
| TPR | True Positive Rate |
| TNR | True Negative Rate |
| G-Mean | Geometric mean of TPR and TNR |
References
- Karabelchtchikova, O.; Rivero, I.; Hsiang, S. Modeling of residual stress distribution in D2 steel via grinding dynamics using a second-order damping system. J. Mater. Process. Technol. 2008, 198, 313–322. [Google Scholar] [CrossRef]
- Otis, P.T.; Triantis, K.P. The Impact of Quality Control Scrap and Rework Reduction on Energy Use. In Proceedings of the Thirty-Seventh Industrial Energy Technology Conference, New Orleans, LA, USA, 2–4 June 2015; Texas A&M University: College Station, TX, USA, 2015. Available online: http://www.tamu.edu (accessed on 4 February 2022).
- Wang, J.Q.; Li, Y. Energy Economics in Multistage Manufacturing Systems with Quality Control: A Modeling and Improvement Approach. IEEE Access 2019, 7, 171163–171172. [Google Scholar] [CrossRef]
- European Commission. White Paper on Artificial Intelligence: A European Approach to Excellence and Trust; White Paper COM(2020) 65 Final; European Commission: Brussels, Belgium, 2020.
- Agnisarman, S.; Lopes, S.; Chalil Madathil, K.; Piratla, K.; Gramopadhye, A. A survey of automation-enabled human-in-the-loop systems for infrastructure visual inspection. Autom. Constr. 2019, 97, 52–76. [Google Scholar] [CrossRef]
- Lou, P.; Wei, S.; Yan, J.; Hu, J. Intelligent Perception of CNC Machine Tools Based on Human-Machine Collaboration. In Proceedings of the 11th International Conference on Intelligent Human-Machine Systems and Cybernetics (IHMSC), Hangzhou, China, 24–25 August 2019; Volume 1, pp. 260–265. [Google Scholar] [CrossRef]
- Russakovsky, O.; Li, L.J.; Fei-Fei, L. Best of both worlds: Human-machine collaboration for object annotation. In Proceedings of the 2015 IEEE Conference on Computer Vision and Pattern Recognition (CVPR), Boston, MA, USA, 7–12 June 2015; pp. 2121–2131. [Google Scholar] [CrossRef] [Green Version]
- Alhaji, B.; Beecken, J.; Ehlers, R.; Gertheiss, J.; Merz, F.; Müller, J.; Prilla, M.; Rausch, A.; Reinhardt, A.; Reinhardt, D.; et al. Engineering Human–Machine Teams for Trusted Collaboration. Big Data Cogn. Comput. 2020, 4, 35. [Google Scholar] [CrossRef]
- Woodham, R.J. Photometric Method for Determining Surface Orientation from Multiple Images. Opt. Eng. 1980, 19, 139–144. [Google Scholar] [CrossRef]
- Quéau, Y.; Durix, B.; Wu, T.; Cremers, D.; Lauze, F.; Durou, J.D. LED-Based Photometric Stereo: Modeling, Calibration and Numerical Solution. J. Math. Imaging Vis. 2018, 60, 313–340. [Google Scholar] [CrossRef]
- Logothetis, F.; Budvytis, I.; Mecca, R.; Cipolla, R. A CNN Based Approach for the Near-Field Photometric Stereo Problem. In Proceedings of the British Machine Vision Conference, Virtual Event, 7–10 September 2020; pp. 1–12. [Google Scholar] [CrossRef]
- Mecca, R.; Logothetis, F.; Budvytis, I.; Cipolla, R. LUCES: A Dataset for Near-Field Point Light Source Photometric Stereo. In Proceedings of the British Machine Vision Conference, Virtual Event, 22–25 November 2021; pp. 1–21. [Google Scholar] [CrossRef]
- Pernkopf, F.; O’Leary, P. Image acquisition techniques for automatic visual inspection of metallic surfaces. NDT E Int. 2003, 36, 609–617. [Google Scholar] [CrossRef]
- Kang, D.; Jang, Y.J.; Won, S. Development of an inspection system for planar steel surface using multispectral photometric stereo. Opt. Eng. 2013, 52, 039701. [Google Scholar] [CrossRef] [Green Version]
- Landström, A.; Thurley, M.J.; Jonsson, H. Sub-Millimeter Crack Detection in Casted Steel Using Color Photometric Stereo. In Proceedings of the 2013 International Conference on Digital Image Computing: Techniques and Applications (DICTA), Hobart, TAS, Australia, 26–28 November 2013; pp. 1–7. [Google Scholar] [CrossRef] [Green Version]
- Drbohlav, O.; Chantler, M. On optimal light configurations in photometric stereo. In Proceedings of the IEEE International Conference on Computer Vision, Beijing, China, 17–21 October 2005; pp. 1707–1712. [Google Scholar] [CrossRef]
- Ren, M.; Wang, X.; Xiao, G.; Chen, M.; Fu, L. Fast Defect Inspection Based on Data-Driven Photometric Stereo. IEEE Trans. Instrum. Meas. 2019, 68, 1148–1156. [Google Scholar] [CrossRef]
- Ikehata, S. CNN-PS: CNN-based Photometric Stereo for General Non-Convex Surfaces. In Proceedings of the European Conference on Computer Vision (ECCV), Munich, Germany, 8–14 September 2018. [Google Scholar]
- Protopapadakis, E.; Voulodimos, A.; Doulamis, A.; Doulamis, N.; Stathaki, T. Automatic Crack Detection for Tunnel Inspection Using Deep Learning and Heuristic Image Post-Processing. Appl. Intell. 2019, 49, 2793–2806. [Google Scholar] [CrossRef]
- Lee, T.; Yoon, Y.; Chun, C.; Ryu, S. CNN-Based Road-Surface Crack Detection Model That Responds to Brightness Changes. Electronics 2021, 10, 1402. [Google Scholar] [CrossRef]
- Ali, L.; Alnajjar, F.; Jassmi, H.A.; Gocho, M.; Khan, W.; Serhani, M.A. Performance Evaluation of Deep CNN-Based Crack Detection and Localization Techniques for Concrete Structures. Sensors 2021, 21, 1688. [Google Scholar] [CrossRef] [PubMed]
- Soukup, D.; Huber-Mörk, R. Convolutional Neural Networks for Steel Surface Defect Detection from Photometric Stereo Images. In Proceedings of the Advances in Visual Computing, Las Vegas, NV, USA, 8–10 December 2014; Bebis, G., Boyle, R., Parvin, B., Koracin, D., McMahan, R., Jerald, J., Zhang, H., Drucker, S.M., Kambhamettu, C., El Choubassi, M., et al., Eds.; Springer International Publishing: Cham, Switzerland, 2014; pp. 668–677. [Google Scholar] [CrossRef]
- Lee, J.H.; Oh, H.M.; Kim, M.Y. Deep learning based 3D defect detection system using photometric stereo illumination. In Proceedings of the International Conference on Artificial Intelligence in Information and Communication (ICAIIC), Okinawa, Japan, 11–13 February 2019; pp. 484–487. [Google Scholar] [CrossRef]
- Antensteiner, D.; Stolc, S.; Soukup, D. Single Image Multi-Spectral Photometric Stereo Using a Split U-Shaped CNN. In Proceedings of the IEEE Conference on Computer Vision and Pattern Recognition Workshops, CVPR Workshops 2019, Long Beach, CA, USA, 16–20 June 2019; pp. 481–483. [Google Scholar] [CrossRef]
- Padalkar, M.G.; Beltrán-González, C.; Bustreo, M.; Del Bue, A.; Murino, V. A versatile crack inspection portable system based on classifier ensemble and controlled illumination. In Proceedings of the International Conference on Pattern Recognition (ICPR), Milan, Italy, 10–15 January 2020; pp. 4009–4016. [Google Scholar] [CrossRef]
- Ronneberger, O.; Fischer, P.; Brox, T. U-Net: Convolutional Networks for Biomedical Image Segmentation. In Proceedings of the Medical Image Computing and Computer-Assisted Intervention (MICCAI), Munich, Germany, 5–9 October 2015; pp. 234–241. [Google Scholar] [CrossRef]
- Buchholz, T.O.; Prakash, M.; Schmidt, D.; Krull, A.; Jug, F. DenoiSeg: Joint denoising and segmentation. In Proceedings of the European Conference on Computer Vision, Glasgow, UK, 23–28 August 2020; Springer: Cham, Switzerland, 2020; pp. 324–337. [Google Scholar] [CrossRef]
- Zhang, Z.; Liu, Q.; Wang, Y. Road Extraction by Deep Residual U-Net. IEEE Geosci. Remote Sens. Lett. 2018, 15, 749–753. [Google Scholar] [CrossRef] [Green Version]
- Saiz, F.A.; Barandiaran, I.; Arbelaiz, A.; Graña, M. Photometric Stereo-Based Defect Detection System for Steel Components Manufacturing Using a Deep Segmentation Network. Sensors 2022, 22, 882. [Google Scholar] [CrossRef] [PubMed]
- Ioffe, S.; Szegedy, C. Batch Normalization: Accelerating Deep Network Training by Reducing Internal Covariate Shift. In Proceedings of the 32nd International Conference on Machine Learning, Lille, France, 7–9 July 2015; Bach, F., Blei, D., Eds.; PMLR: Lille, France, 2015; Volume 37, pp. 448–456. [Google Scholar] [CrossRef]
- Kingma, D.P.; Ba, J. Adam: A Method for Stochastic Optimization. In Proceedings of the 3rd International Conference on Learning Representations, ICLR 2015, San Diego, CA, USA, 7–9 May 2015. [Google Scholar] [CrossRef]


| Valid (Lab) | TPRvalid | TNRvalid | Ḡvalid | Test (On-Site) | TPRtest | TNRtest | Ḡtest |
|---|---|---|---|---|---|---|---|
| PIS-PS | 40.55 | 99.66 | 63.57 | PIS-PS | 26.83 | 99.58 | 51.69 |
| PIS-Raw | 31.30 | 99.69 | 55.86 | PIS-Raw | 12.13 | 99.68 | 34.77 |
| Non-PS | 19.07 | 99.68 | 43.60 | Non-PS | 11.50 | 99.91 | 33.90 |
| Abs. Dec. | TPR | TNR | Ḡ | Rel. Dec. | TPR | TNR | Ḡ |
|---|---|---|---|---|---|---|---|
| PIS-PS | −13.72 | −0.08 | −11.88 | PIS-PS | −0.34 | 0.00 | −0.19 |
| PIS-Raw | −19.17 | −0.01 | −21.09 | PIS-Raw | −0.61 | 0.00 | −0.38 |
| Non-PS | −7.57 | 0.23 | −9.70 | Non-PS | −0.40 | 0.00 | −0.22 |
Publisher’s Note: MDPI stays neutral with regard to jurisdictional claims in published maps and institutional affiliations. |
© 2022 by the authors. Licensee MDPI, Basel, Switzerland. This article is an open access article distributed under the terms and conditions of the Creative Commons Attribution (CC BY) license (https://creativecommons.org/licenses/by/4.0/).
Share and Cite
Soukup, D.; Kapeller, C.; Raml, B.; Ruisz, J. Industry-Fit AI Usage for Crack Detection in Ground Steel. Electronics 2022, 11, 2643. https://doi.org/10.3390/electronics11172643
Soukup D, Kapeller C, Raml B, Ruisz J. Industry-Fit AI Usage for Crack Detection in Ground Steel. Electronics. 2022; 11(17):2643. https://doi.org/10.3390/electronics11172643
Chicago/Turabian StyleSoukup, Daniel, Christian Kapeller, Bernhard Raml, and Johannes Ruisz. 2022. "Industry-Fit AI Usage for Crack Detection in Ground Steel" Electronics 11, no. 17: 2643. https://doi.org/10.3390/electronics11172643