Article

Deep Learning Algorithm to Predict Cryptocurrency Fluctuation Prices: Increasing Investment Awareness

by
Mohammed Abdullah Ammer
1,2 and
Theyazn H. H. Aldhyani
1,3,*
1
The Saudi Investment Bank Chair for Investment Awareness Studies, The Deanship of Scientific Research, The Vice Presidency for Graduate Studies and Scientific Research, King Faisal University, Al-Ahsa 31982, Saudi Arabia
2
Department of Finance, School of Business, King Faisal University, Al-Ahsa 31982, Saudi Arabia
3
Applied College in Abqaiq, King Faisal University, P.O. Box 400, Al-Ahsa 31982, Saudi Arabia
*
Author to whom correspondence should be addressed.
Electronics 2022, 11(15), 2349; https://doi.org/10.3390/electronics11152349
Submission received: 5 July 2022 / Revised: 18 July 2022 / Accepted: 24 July 2022 / Published: 28 July 2022
(This article belongs to the Section Artificial Intelligence)

Abstract

:
Digital currencies such as Ethereum and XRP allow for all transactions to be carried out online. To emphasize the decentralized nature of fiat currency, we can refer, for example, to the fact that all virtual currency users may access services without third-party involvement. Cryptocurrency price swings are non-stationary and highly erratic, similarly to the price changes of conventional stocks. Owing to the appeal of cryptocurrencies, both investors and researchers have paid more attention to cryptocurrency price forecasts. With the rise of deep learning, cryptocurrency forecasting has gained great importance. In this study, we present a long short-term memory (LSTM) algorithm that can be used to forecast the values of four types of cryptocurrencies: AMP, Ethereum, Electro-Optical System, and XRP. Mean square error (MSE), root mean square error (RMSE), and normalize root mean square error (NRMSE) analyses were used to evaluate the LSTM model. The findings obtained from these models showed that the LSTM algorithm had superior performance in predicting all forms of cryptocurrencies. Thus, it can be regarded as the most effective algorithm. The LSTM model provided promising and accurate forecasts for all cryptocurrencies. The model was applied to forecast the future closing prices of cryptocurrencies over a period of 180 days. The Pearson correlation metric was applied to assess the correlation between the prediction and target values in the training and testing processes. The LSTM algorithm achieved the highest correlation values in training (R = 96.73%) and in testing (96.09%) in predicting XRP currency prices. Cryptocurrency prices could be accurately predicted using the established LSTM model, which displayed highly efficient performance. The relevance of applying these models is that they may have huge repercussions for the economy by assisting investors and traders in identifying trends in the sales and purchases of different types of cryptocurrencies. The results of the LSTM model were compared with those of existing systems. The results of this study demonstrate that the proposed model showed superior accuracy based on the low prediction errors of the proposed system.

1. Introduction

Several cryptocurrencies, such as Ethereum, have emerged since Satoshi Nakamoto originally created the cryptocurrency known as Bitcoin in 2008 [1]. Currently, cryptocurrency significantly influences the world’s financial markets and is becoming more commonplace in daily life. Cryptocurrencies have grown in popularity as a means of making speculative investments and day-to-day purchases of goods and services. Forgery and falsification may be prevented using decentralized ledgers with blockchain technology, which has received much interest [2,3]. In addition to the Internet of Things, blockchain technology has been used in a wide range of industries because of its high security and simplicity of administration. Cryptocurrency does not have a central authority, which removes central banks from the money supply management process. In contrast to more stable financial assets, the cryptocurrency price has an unusually wide range of movement (e.g., in relation to gold, stock indexes, and commodities).
Price movement and transaction volume are important factors that determine the value of each cryptocurrency. Furthermore, each cryptocurrency has its own characteristics (i.e., value deviations, transaction speed, usages, ecosystem, and unpredictability). Owing to the independence of cryptocurrencies, forecasting their prices is a challenging task. For example, the price of the most well-known cryptocurrency, Bitcoin, during the period from 2009 to 2017 climbed from practically nothing to approximately USD 20,000, attracting the attention of both investors and policymakers. This significant gain in its price was followed by a continuous expansion of the Bitcoin market. As of December 2019, the average daily market volume was roughly USD 19.45 billion, according to CoinMarketCap. When used as money, Bitcoin has various qualities, including decentralized transactions, auditability, and anonymity [4,5]. Despite the fact that Bitcoin has been regarded as a bubble and a danger to the stability of the financial system [6], it continues to be pitched as an appealing and possibly high-earning investment alternative. On the other hand, the dangers associated with investing in Bitcoin are great. The price of Bitcoin is far more volatile than the prices of traditional financial assets such as stocks and bonds [7,8].
Empirical asset pricing is a prominent field of financial study that has been researched extensively. It has become relatively popular to use machine learning (ML) approaches in this sector because of their capacity to dynamically make selections among a potentially enormous number of characteristics and to understand complicated, high-dimensional correlations between features and goals [9]. The pricing of shares and bonds has been the subject of extensive studies, which have examined numerous potentially market-predictive factors [10]. However, little attention has been dedicated to the unique stream of cryptocurrency pricing research. No thorough examination of the predictability of the cryptocurrency market, particularly in the short term, has been performed to date. Furthermore, most research studies have focused primarily on technical aspects and have not examined the impacts of the features of ML models that have been utilized [11]. This is the context in which we attempted to close the research gap by comparing and contrasting various ML models for forecasting the market movements of some important cryptocurrencies at the time of the study. Even though Bitcoin had a market valuation of approximately 170 billion US dollars as of September 2020, accounting for approximately 58% of the cryptocurrency market [12], we focused on other cryptocurrencies such as AMP, Ethereum, Electro-Optical System (EOS), and XRP, as prior studies have been limited to Bitcoin.
Financial market forecasting is a well-established discipline of financial research. Regarding the predictability and efficiency of financial markets, a contradictory body of information exists [13,14]. Regression analysis of probable signals with the aim of explaining asset returns is a well-established method of analyzing return-predictive signals and it has been used for many years [15,16]. Various characteristics may be included in linear regressions, but they are not flexible in their incorporation and they impose strict assumptions on the functional form of how signals suggest market movements. On the other hand, ML approaches are increasingly being used for financial market prediction because they do not impose these limits [17]. Neuronal network-based approaches, which have previously been characterized as the leading methods for forecasting the dynamics of financial markets, may be especially well suited among such methods [18].
Several academics have examined the degree of market efficiency in the Bitcoin market across various periods, and their findings have been published. Time series prediction techniques such as the simple exponential smoothing, univariate autoregressive (AR), and autoregressive-integrated moving average (ARIMA) methods have been used for some time [19]. According to Kaiser [20], time series models have been utilized to investigate the seasonality trends associated with Bitcoin trading. Time series methods were not able to capture long-term dependencies in the face of significant volatility, which is a hallmark of the cryptocurrency market due to the very nature of the market itself. In contrast to this, ML strategies such as neural networks use iterative optimization methods such as “gradient descent” in conjunction with hyperparameter tweaking to obtain the optimal solution that best fits the data [21]. As a result, ML methods have been applied for asset price/return prediction in recent years by incorporating nonlinearity [22], showing a higher prediction accuracy than that of traditional time series models [23,24,25]. The difficulty is that the published research on predicting cryptocurrency prices does not present a significant number of examples of ML applications. Artificial intelligence allows for the capturing of the nonlinear characteristics of the severe volatility of cryptocurrency prices, in contrast to the standard linear statistical models such as the ARIMA approach [26]. This is possible because artificial intelligence is capable of learning.
In the field of artificial intelligence, ML is considered a type of artificial intelligence that can forecast future prices by analyzing present and past data. Previous research has shown that model-based forecasting models have many advantages over other forecasting models. They produce results that are exactly or nearly the same as the actual results, thus improving upon the precision and accuracy of the models. Owing to these advantages, model-based forecasting models have more advantages than other forecasting models. Deep learning, also known as neural networks, as well as support vector machines (SVM) and other similar approaches, are ML methods that may be utilized. A previous study [27] demonstrated that the inclusion of cryptocurrencies in a portfolio boosts the efficiency of the portfolio in two distinct ways, proving the authors’ assertions. The first objective in that study was to reduce the standard deviation, and the second objective was to provide investors with a wider range of options for asset allocation. It was hypothesized that the optimal allocation of cryptocurrencies should lie anywhere between 5% and 20%, depending on the investor’s level of risk tolerance. They employed two different ML approaches, random forests (RF) and a stochastic gradient boosting machine (SGBM), in time series data forecasting. The authors of [28] utilized an SGBM strategy based on a ML ensemble approach to estimate Bitcoin prices.
Making the proper choice at the appropriate time is critical to reducing the risks associated with the investment process, and this can be achieved through careful planning. With an emphasis on two cryptocurrencies, Litecoin and Monero, the authors of [29] offered a hybrid cryptocurrency prediction system based on the long short-term memory (LSTM) and gated recurrent unit (GRU) approaches. In a study by Huang et al. [30], high-dimensional technical indicators were used to predict daily Bitcoin returns using tree-based prediction models from January 2012 to December 2017. They discovered that technical analyses can be useful in the markets of assets with difficult-to-value fundamentals (e.g., Bitcoin). Chen et al. [31] used various ML approaches to forecast the direction of Bitcoin price changes. Researchers showed that relatively basic approaches (e.g., logistic regressions) outperformed more complicated algorithms (e.g., recurrent neural networks (RNNs)). when data were collected between February 2017 and February 2019. A class split can be used to determine the direction of the price movement; however, an uneven training set is likely to arise, which may lead to erroneous conclusions [32]. Unbalanced training sets may lead classifiers to consistently forecast the majority class, especially for financial time series, which are often noisy. In predicting the volatility of cryptocurrencies, Peng et al. [33] used support vector regression (SVR). More recently, a few studies have used deep learning models to estimate financial market prices, as they have shown higher performance than their shallow learning counterparts [34,35]. For example, Altan et al. [36] used an LSTM neural network to uncover nonlinear features of the Bitcoin price time series, which were previously unknown.
Previous studies [37,38,39,40] have employed classic ML techniques to the forecasting of Bitcoin prices, including random forest, XGBoost, and SVM. On the other hand, traditional ML algorithms cannot capture the temporal dependence of time series. Deep learning approaches [41,42,43] such as RNNs have recently been developed to deal with the problem of temporal dependence. However, because of the diminishing gradient, RNNs have shown difficulty in learning long-term relationships in the data. The LSTM and GRU versions of RNN, which are the most frequently used types of RNN, can solve the vanishing gradient issue. For example, the LSTM network was employed in one study [44] to forecast the direction of the Bitcoin price movement. According to Wu et al. [45], they used two distinct LSTM models to anticipate Bitcoin prices. These models included a standard LSTM model and an LSTM model that included an AR model. The authors of another study used GRU to predict Bitcoin prices. According to their findings, GRU performed better than the RNN and LSTM models in estimating Bitcoin prices [46]. However, all these studies merely used the standard ML algorithms that are used in stock price prediction and applied them to Bitcoin, and they were unsuccessful in capturing the distinctive characteristics of the cryptocurrency. In addition, another study offered forecasts of Bitcoin prices based on the unique characteristics of the cryptocurrency that set it apart from stocks. Other researchers used a Bitcoin transaction graph to forecast Bitcoin prices. As all Bitcoin transactions are recorded in a public ledger that is accessible to the public, developers have created tools that can predict Bitcoin prices on the basis of the transaction identifier, sender, receiver, value, and timestamp included in each transaction [47]. The authors of devised a complex technique for forecasting future Bitcoin prices based on identifying the edges that occur most frequently in the transaction network. This strategy obtained positive results [48]. According to the findings of another study many indicators have been utilized to forecast the development of Bitcoin prices over time. These indicators include blockchain data (e.g., the number of transactions per block, median confirmation time, hash rate, and level of difficulty) and macroeconomic variables (e.g., S&P500 and gold) [49,50].
Owing to the volatility of cryptocurrency prices, predicting them is difficult and time-consuming. Researchers worldwide have focused only on price predictions for known cryptocurrencies. However, other cryptocurrencies cannot be used in any way, shape, or form either as money or as a platform. To complete the process of analysis and obtain results for several cryptocurrencies, in this study a fully linked layer was applied to the final hidden representation. The four most significant contributions of this study are as follows:
  • In this work, we studied and took on the challenge of predicting how the prices of various cryptocurrencies would fluctuate. Moreover, herein, we provide a precise explanation of the problem and discuss four distinct types of characteristics. This work has the potential to contribute to the advancement of research on cryptocurrencies and to supply investors with more tools for conducting investment assessments.
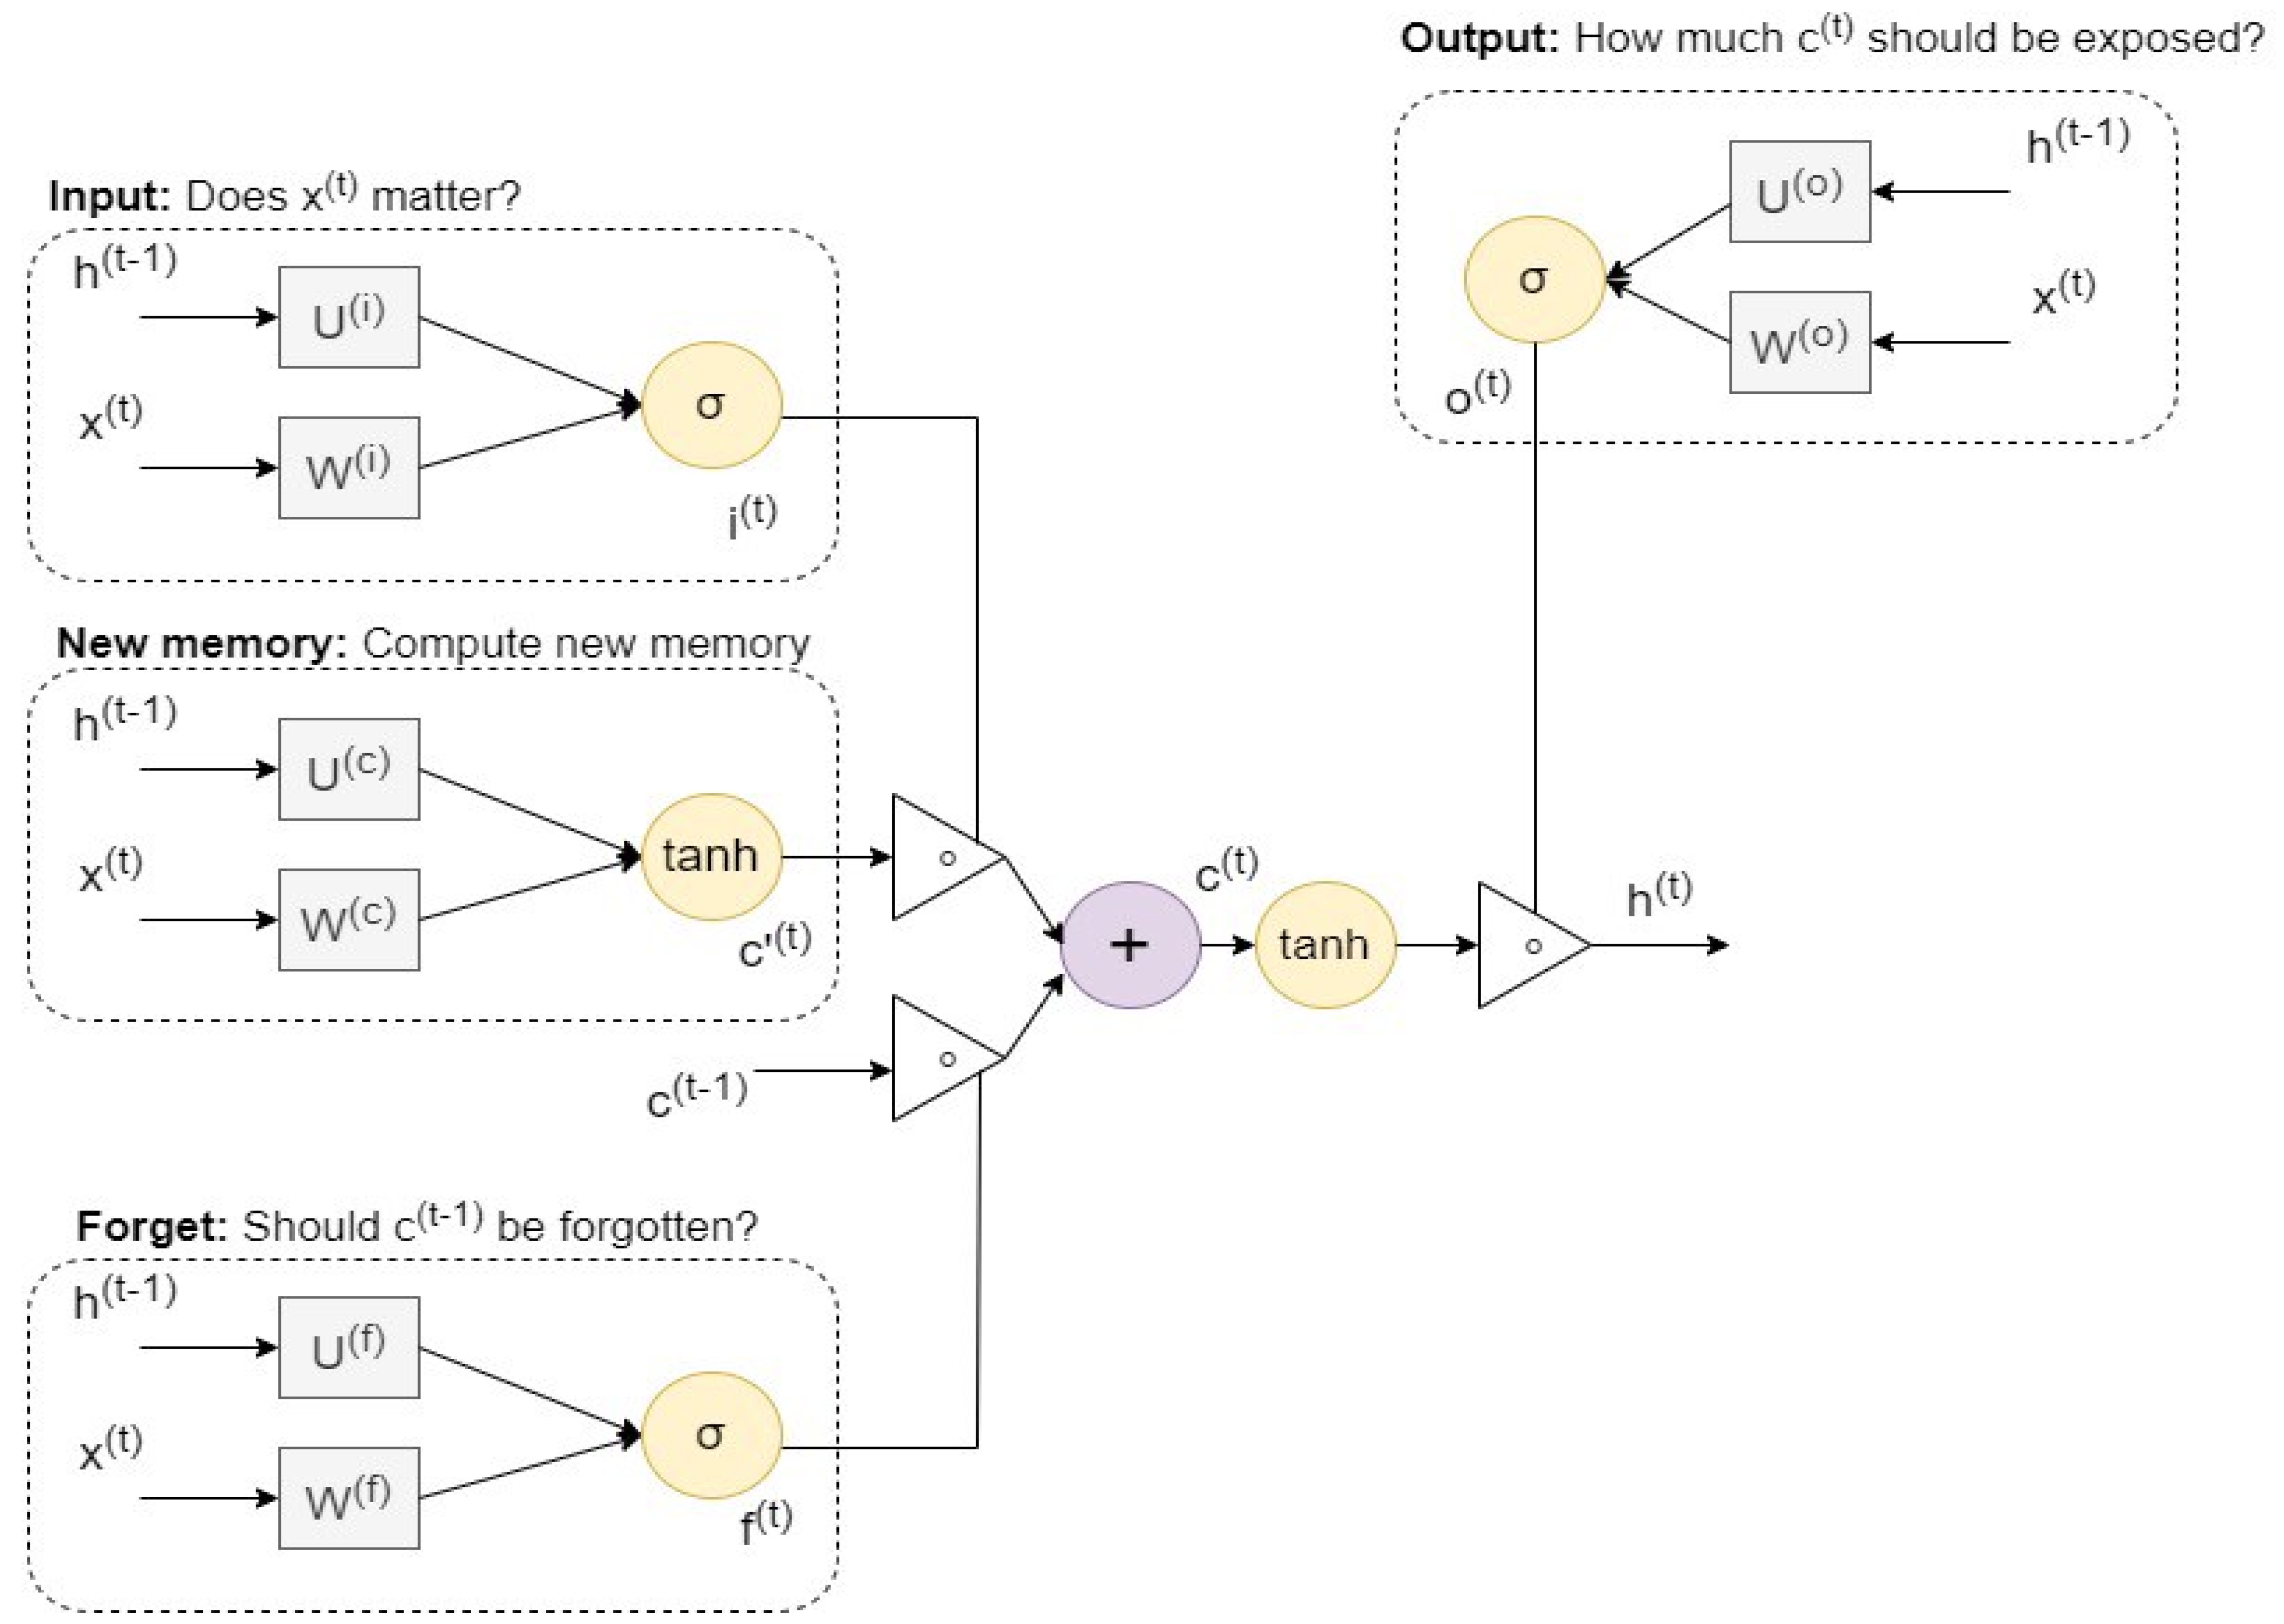
  • To overcome the problem of price fluctuation prediction, we propose an innovative model known as LSTM.
  • The LSTM model is used to capture the time dependency aspects of the prices of cryptocurrencies, and an embedding network is presented to capture the hidden representations from linked cryptocurrencies. Both networks are employed in conjunction with each another.
  • The developed technique was used to show the future fluctuations of the prices of the different types of cryptocurrencies over a period of 180 days as a form of long-term forecasting.
  • In the real-world cryptocurrency market, we experimentally demonstrated the usefulness of our LSTM model. In addition, LSTM showed state-of-the-art performance that was superior to those of all other existing models.
The remainder of our study is structured as follows. In Section 2 we present the materials and methods followed and implemented in the present study. In Section 3 we describe the experiments and present the results. In Section 4 we discuss the results. Finally, in Section 5 we present the conclusions.

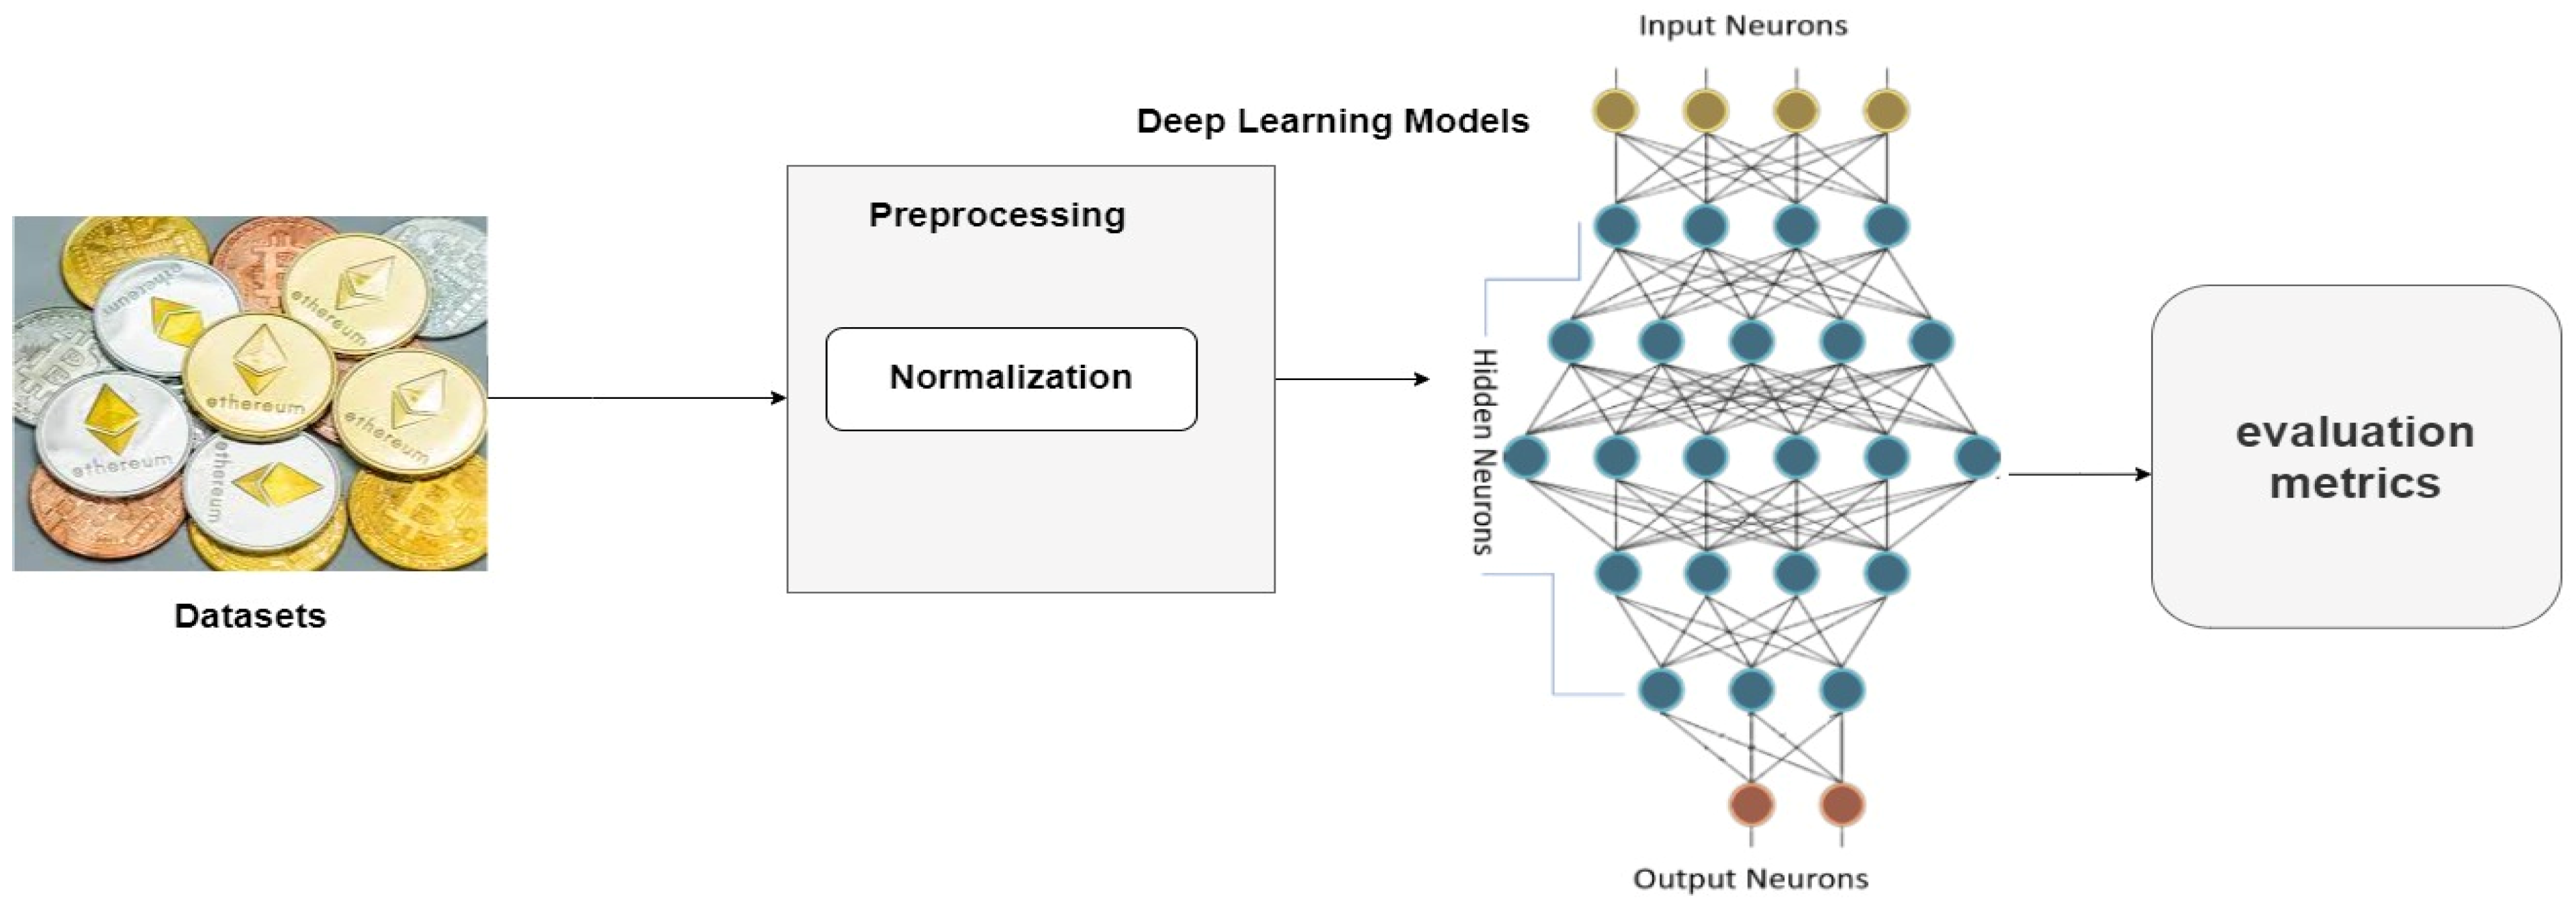
2. Materials and Methods
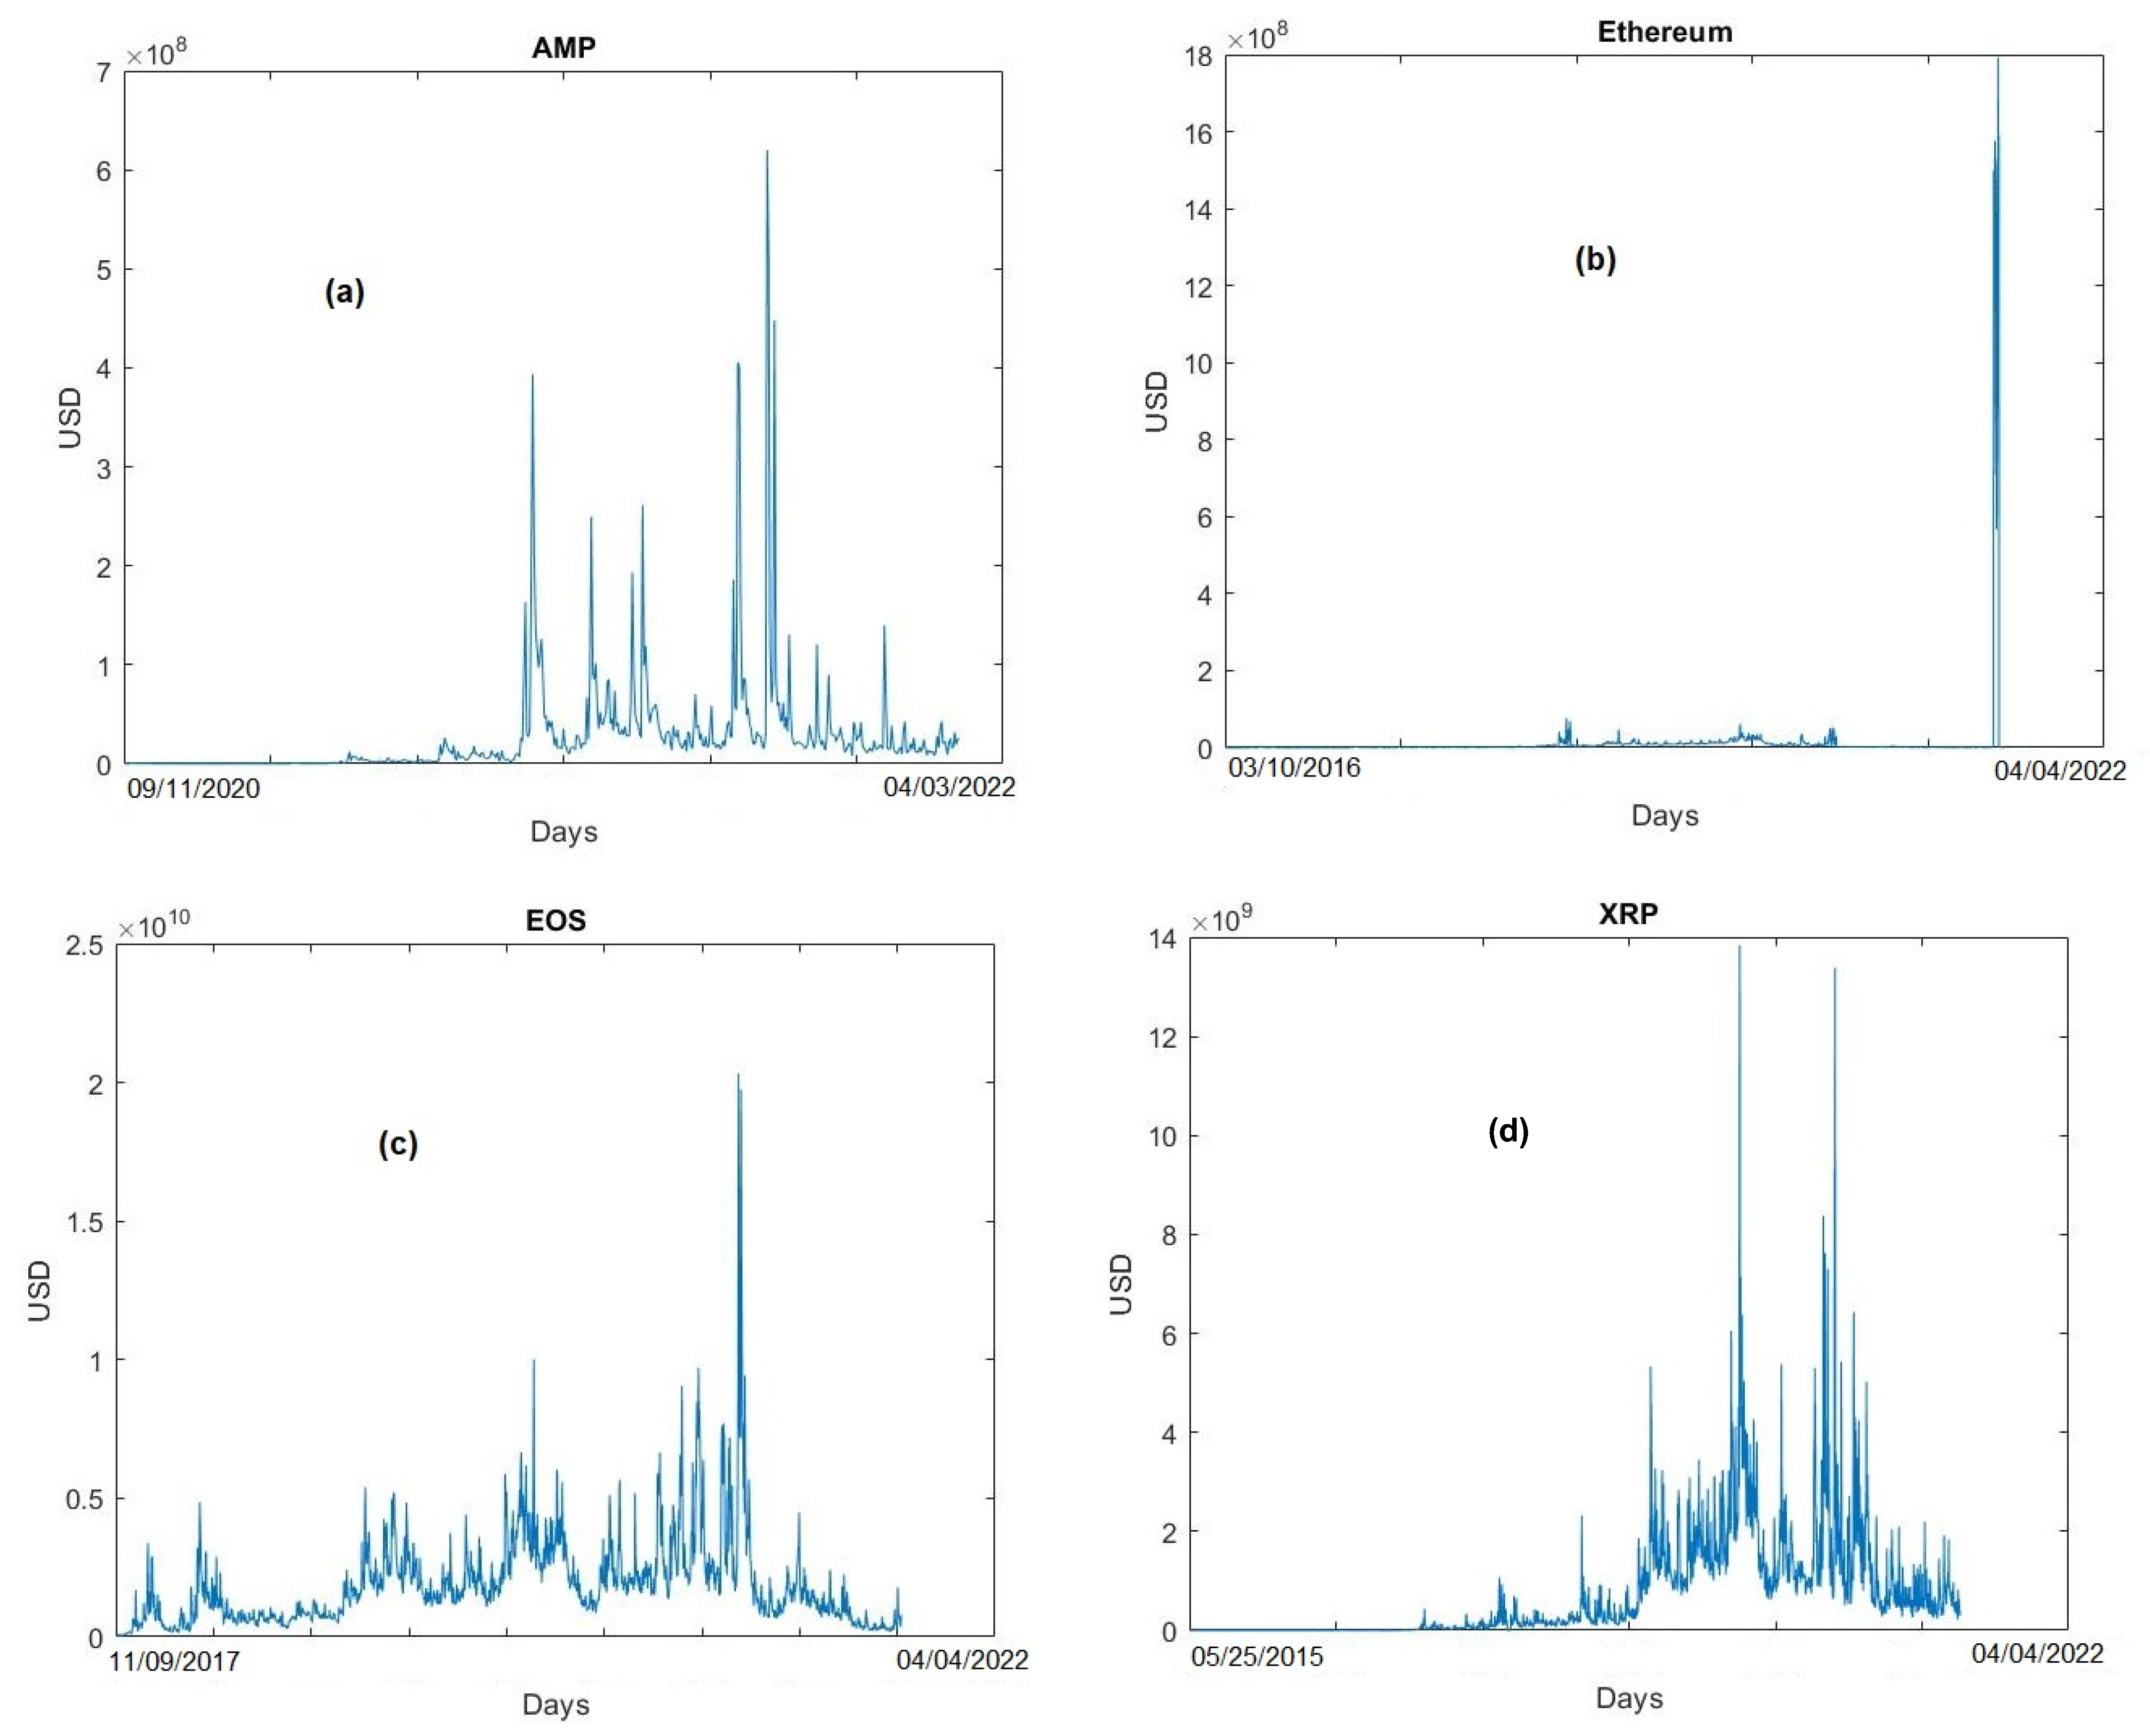
Figure 1 shows the proposed framework for predicting the prices of cryptocurrencies. To achieve the objectives of this study, we trained an LSTM model to predict the prices of four types of cryptocurrencies using historical cryptocurrency price data. Then, to assess the performances of the given schemes, we compared the accuracy of our proposed model to those of existing models.

2.1. Data Sets

The data used in this study included daily historical data from the website CoinMarketCap.com (accessed on 20 June 2022). In this study, four cryptocurrencies, namely, AMP, Ethereum, EOS, and XRP, were investigated. When working with cryptocurrency data, it is helpful and vital to understand the distribution and behavior of the data by using a chart of steady and understandable fluctuation prices of the cryptocurrencies. All data sets were collected from May 2015 through April 2022 at 1 h intervals. Investors have been engaged in active trading in 2022 with cryptocurrencies such as AMP, Ethereum, EOS, and XRP. We collected data from 2015 for XRP, 2016 for Ethereum, 2017 for EOS, and 2020 for AMP. Figure 2 presents graphical representations of the time series for the targeted cryptocurrencies’ distributions during different periods. The figure demonstrates that the price increased throughout this particular period, according to the price at which the transaction closed. Table 1 shows the features of the cryptocurrencies used in this study. The period used for each cryptocurrency is presented in Table 2.
The proposed model has the ability to work with all cryptocurrencies but we selected only four cryptocurrencies to examine the proposed model. The reason we chose lesser-known cryptocurrencies was to help investors select the appropriate cryptocurrencies for investment. Since most new investors favor new and cheap cryptocurrencies for investment, the prices of these cryptocurrencies decrease suddenly, which affects their investment value. Finally, we believe this model can predict all cryptocurrencies successfully.

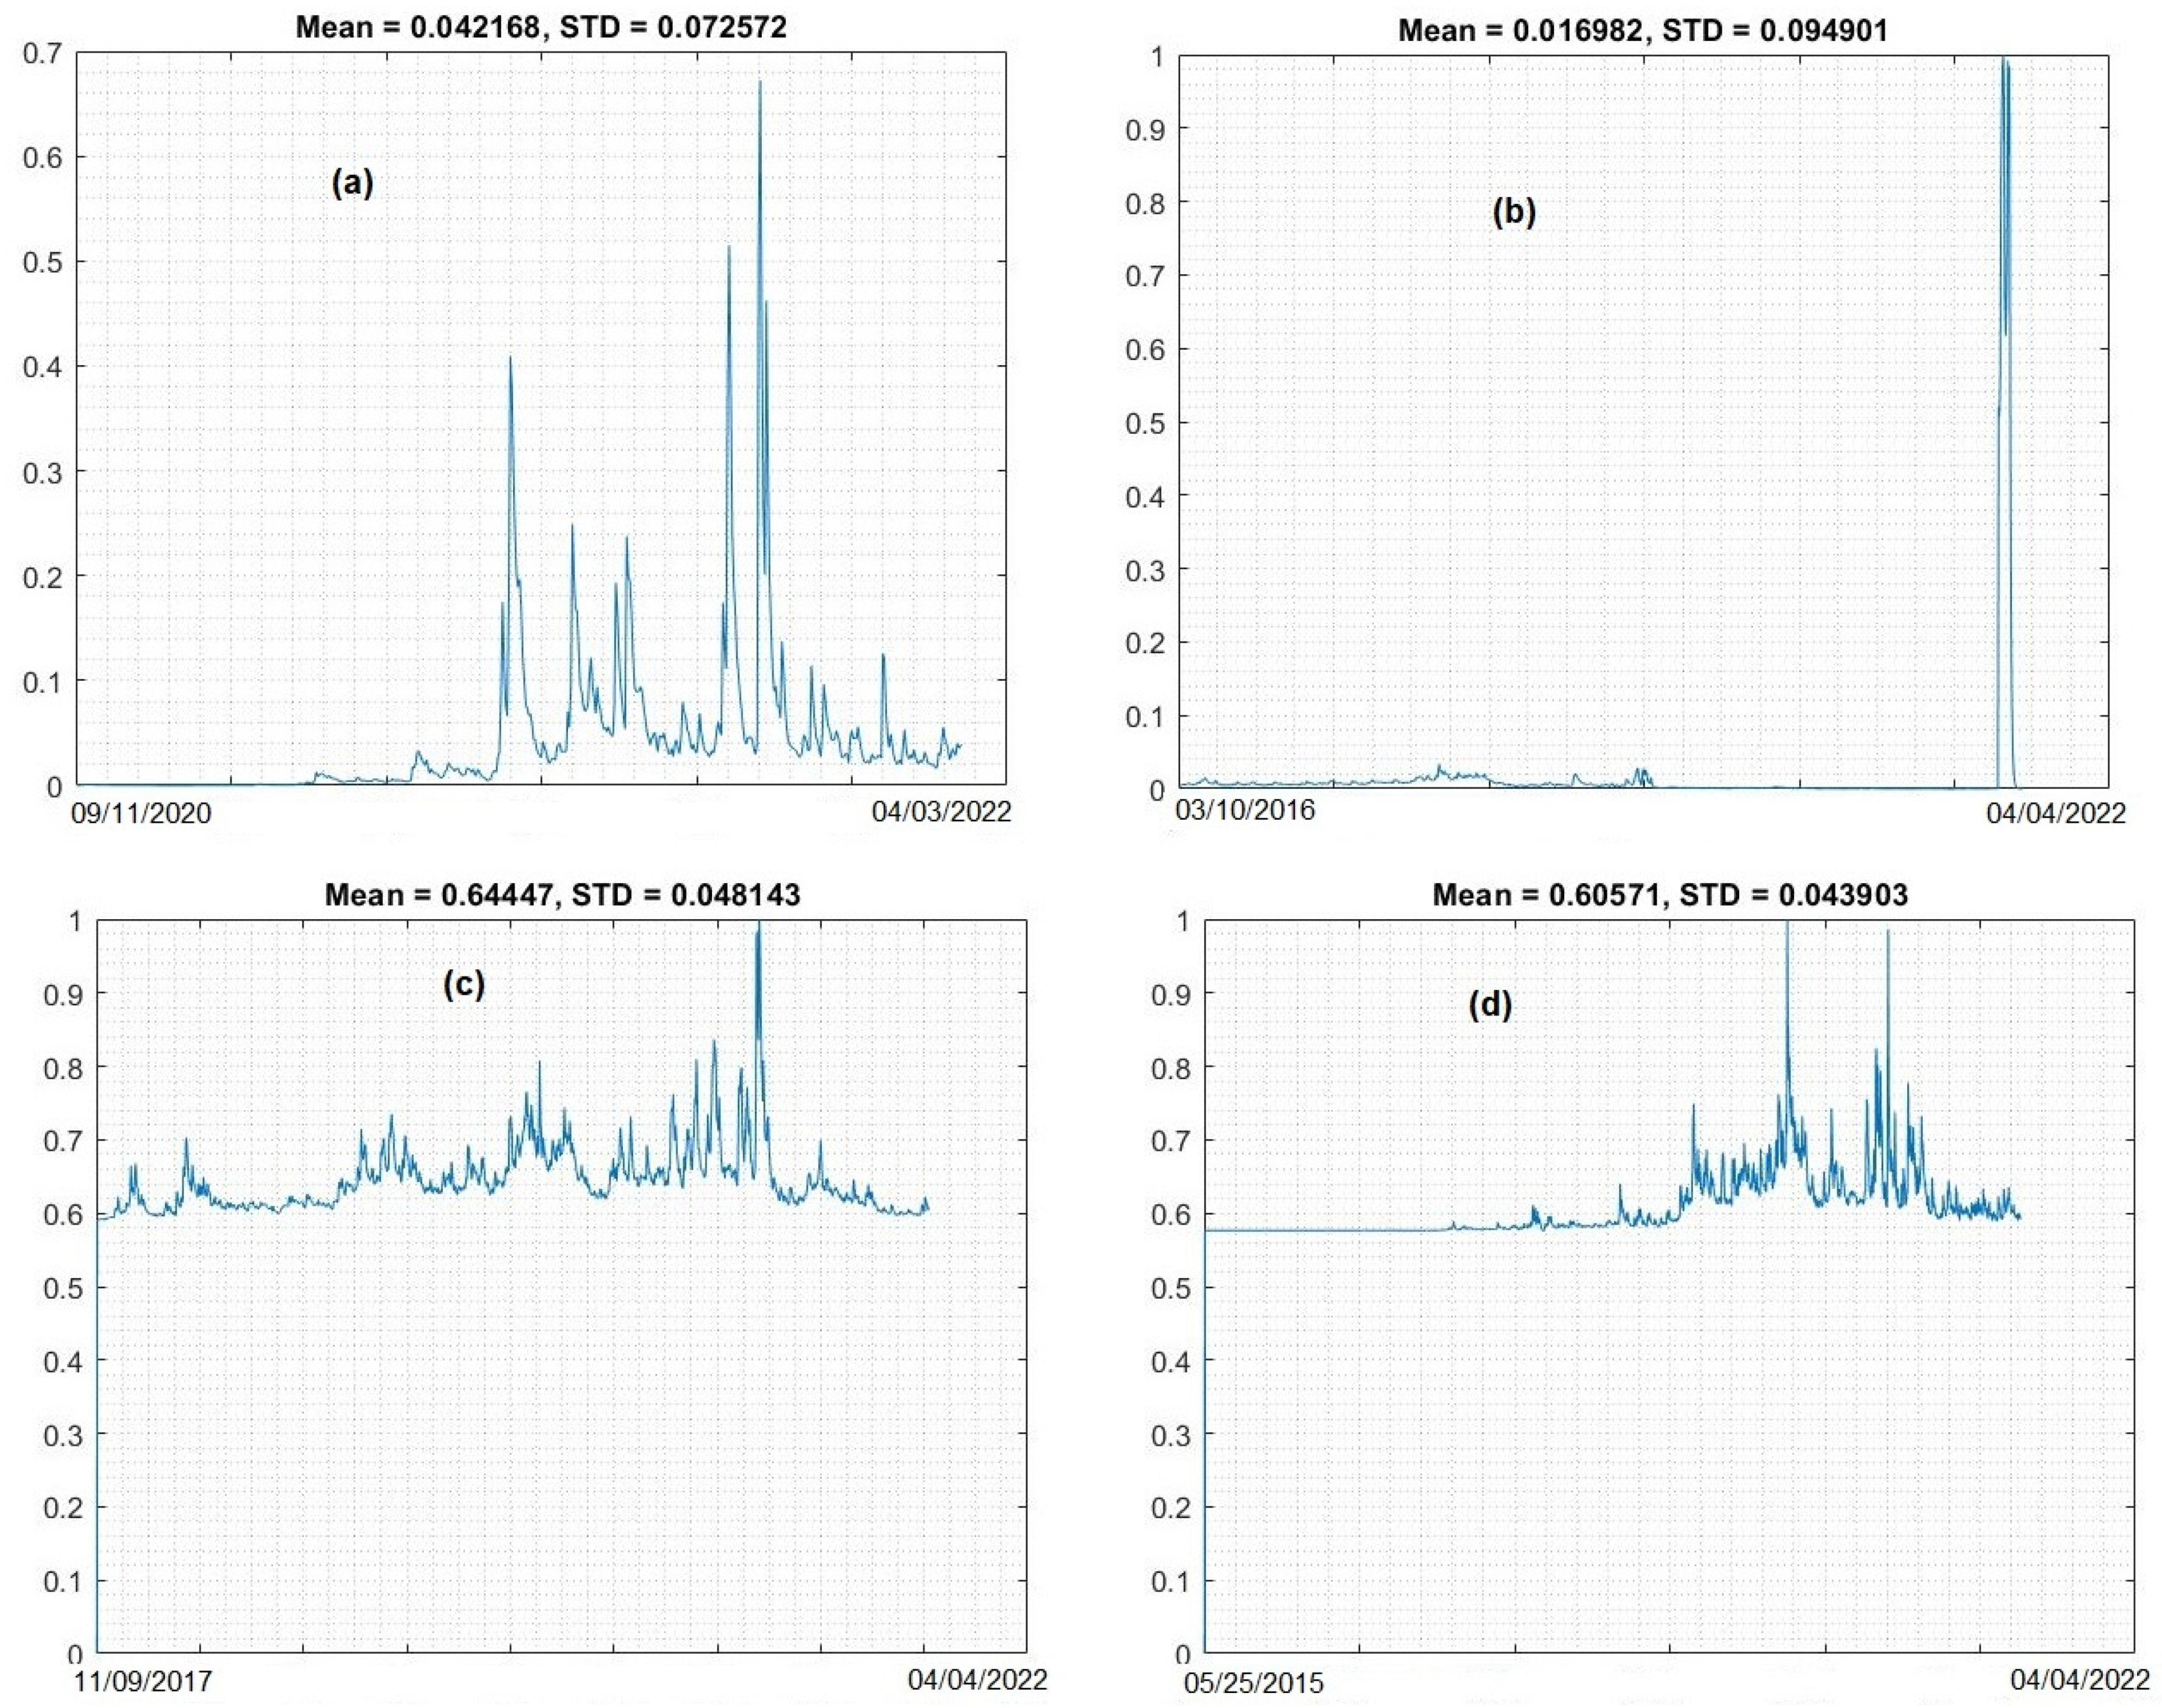
2.2. Normalization Method

One of the most prevalent approaches to normalizing data is called min-max normalization. For each feature, the minimum value is changed to zero, the highest value is changed to 1, and all other values are changed to a decimal between 0 and 1.
z n = x x m i n x m a x x m i n ( N e w m a x x N e w m i n x ) + N e w m i n x
where x_max and x_min are the maximum and minimum values, 1 and 0, respectively. Newmin_x is the smallest number, whereas Newmax_x is the largest number. Figure 3 shows the cryptocurrency data sets after normalization. The mean and standard division metrics are presented to calculate the time series data set.

2.3. LSTM Algorithm

To learn sequences designed to capture temporal contextual information in time series data, RNNs use recurrent connections between the input and the output of their neurons or layers. Recently, they have become popular in deep learning because of their capacity to transcend the limitations of traditional neural network designs when it comes to learning across extended data sequences. The long-term reliance problem is specifically avoided with LSTMs. When it comes to remembering long-term knowledge, they do not have to think twice about it. Neural networks that use an RNN structure feature a chain of neural network modules that repeat themselves [51,52]. A single tanh layer is required for this repeating module in ordinary RNNs. Using memory cells and a gating mechanism in place of the RNN nodes, deep learning LSTM neural networks solve the vanishing gradient problem through their ability to retain both long- and short-term temporal information. Figure 4 shows the architecture of the LSTM model.
The LSTM uses a three-gate technique to store the state of the network. Memory loss from a concealed state can be controlled by means of the forget gate ( f t ), the first gate. When a new piece of information is received, an input gate ( i t =) determines how much of it is to be kept in the current cell state. In the last gate, the output gate ( o t ), the current cell’s output value is calculated. An LSTM cell has three gates, and various related equations are utilized in an LSTM.
Forget   gate   layer : f t   = σ   ( W e f X t + W e f h t 1 + W c f C t 1 + U f )
Input   gate   layer :   i t = σ   ( W x i X t + W h i h t 1 + W c i C t 1 + U i )
New   memory   cell :   C t = σ   ( f t c t 1 + i t tanh ( W x c X t + W h c   h t 1 + U )
Output   gate   layer :   o t = σ   ( W x o X t + W h o h t 1 + W c o C t 1 + U o ) ,
h t = O t × tan h ( C t )
The candidate cell state ( C t 1 ) is shown in the above equations. W e f , W x i , W x c , and W x o are the weights of all networks; Ui and UC are bias variables; and U f , b i , U c , and U o are the bias variables of the individual networks. h t represents the current hidden state value, whereas xt represents new information at the current cell. X t represents new information at the current cell. The sigmoid () and tangent hyperbolic (tanh) activation functions are both used in this case. Artificial neural networks typically utilize activation functions like this one.

2.4. Performance Measurement

The models’ forecasts of price trends and movement directions were evaluated using various measures. In experiments, four commonly used markers were used to measure the performances of the models: RMSE, MAE, NRMSE, and the Pearson correlation coefficient error criterion were employed for the evaluations of prediction outcomes.
MSE = 1 n   i = 1 n ( y i , o b s e r v y i ,   e s t i m ) 2
RMSE = i = 1 n ( y i , o b s e r v y i ,   e s t i m ) 2 n
NRMSE = 1 n i = 1 n ( y i , o b s e r v y i ,   e s t i m ) 2 x ¯
R % = n ( i = 1 n y i , o b s e r v   × y i , e s t i m ) ( i = 1 n y i , o b s e r v ) ( i = 1 n y i , e s t i m ) [ n ( i = 1 n y i , o b s e r v ) 2 ( i = 1 n y i , o b s e r v ) 2 ] [ n ( i = 1 n y i , e s t i m ) 2 ( i = 1 n y i , e s t i m ) 2 ] × 100 ,
where y(i,observ) is the experimental value of data point I, y(i,estim) is the anticipated value, and n is the number of samples.

3. Experiments

To evaluate the models’ performance, we used them to make price predictions for the four cryptocurrency data sets in isolation. The deep learning LSTM model was used with the aim of accurately forecasting the prices of various cryptocurrencies in the future. To locate errors in predictions, evaluation metrics including MSE, RMSE, and NRMES were utilized. The data set was split into two groups—70% for training to build the model and 30% for testing to examine the model. The LSTM model was used to predict the prices of different cryptocurrencies. The goal of this investigation was to discover whether the model had a higher level of accuracy than other models.

3.1. Environment Developing System

The proposed system was developed in different environments, including hardware and software environments. Tensor Flow and Keras software have been previously used to build deep learning techniques such as LSTM models. Scikit-learn was used for the normalization process. The software was configured with an Intel (R) Core (TM) i7-4770 processor, operating at 3.20 GHz, with 8 GB of memory, and 64-bit Windows 10.

3.2. Results

In this section, the results of the four experiments conducted to predict the prices of the cryptocurrencies, namely AMP, Ethereum, EOS, and XRP, are presented.

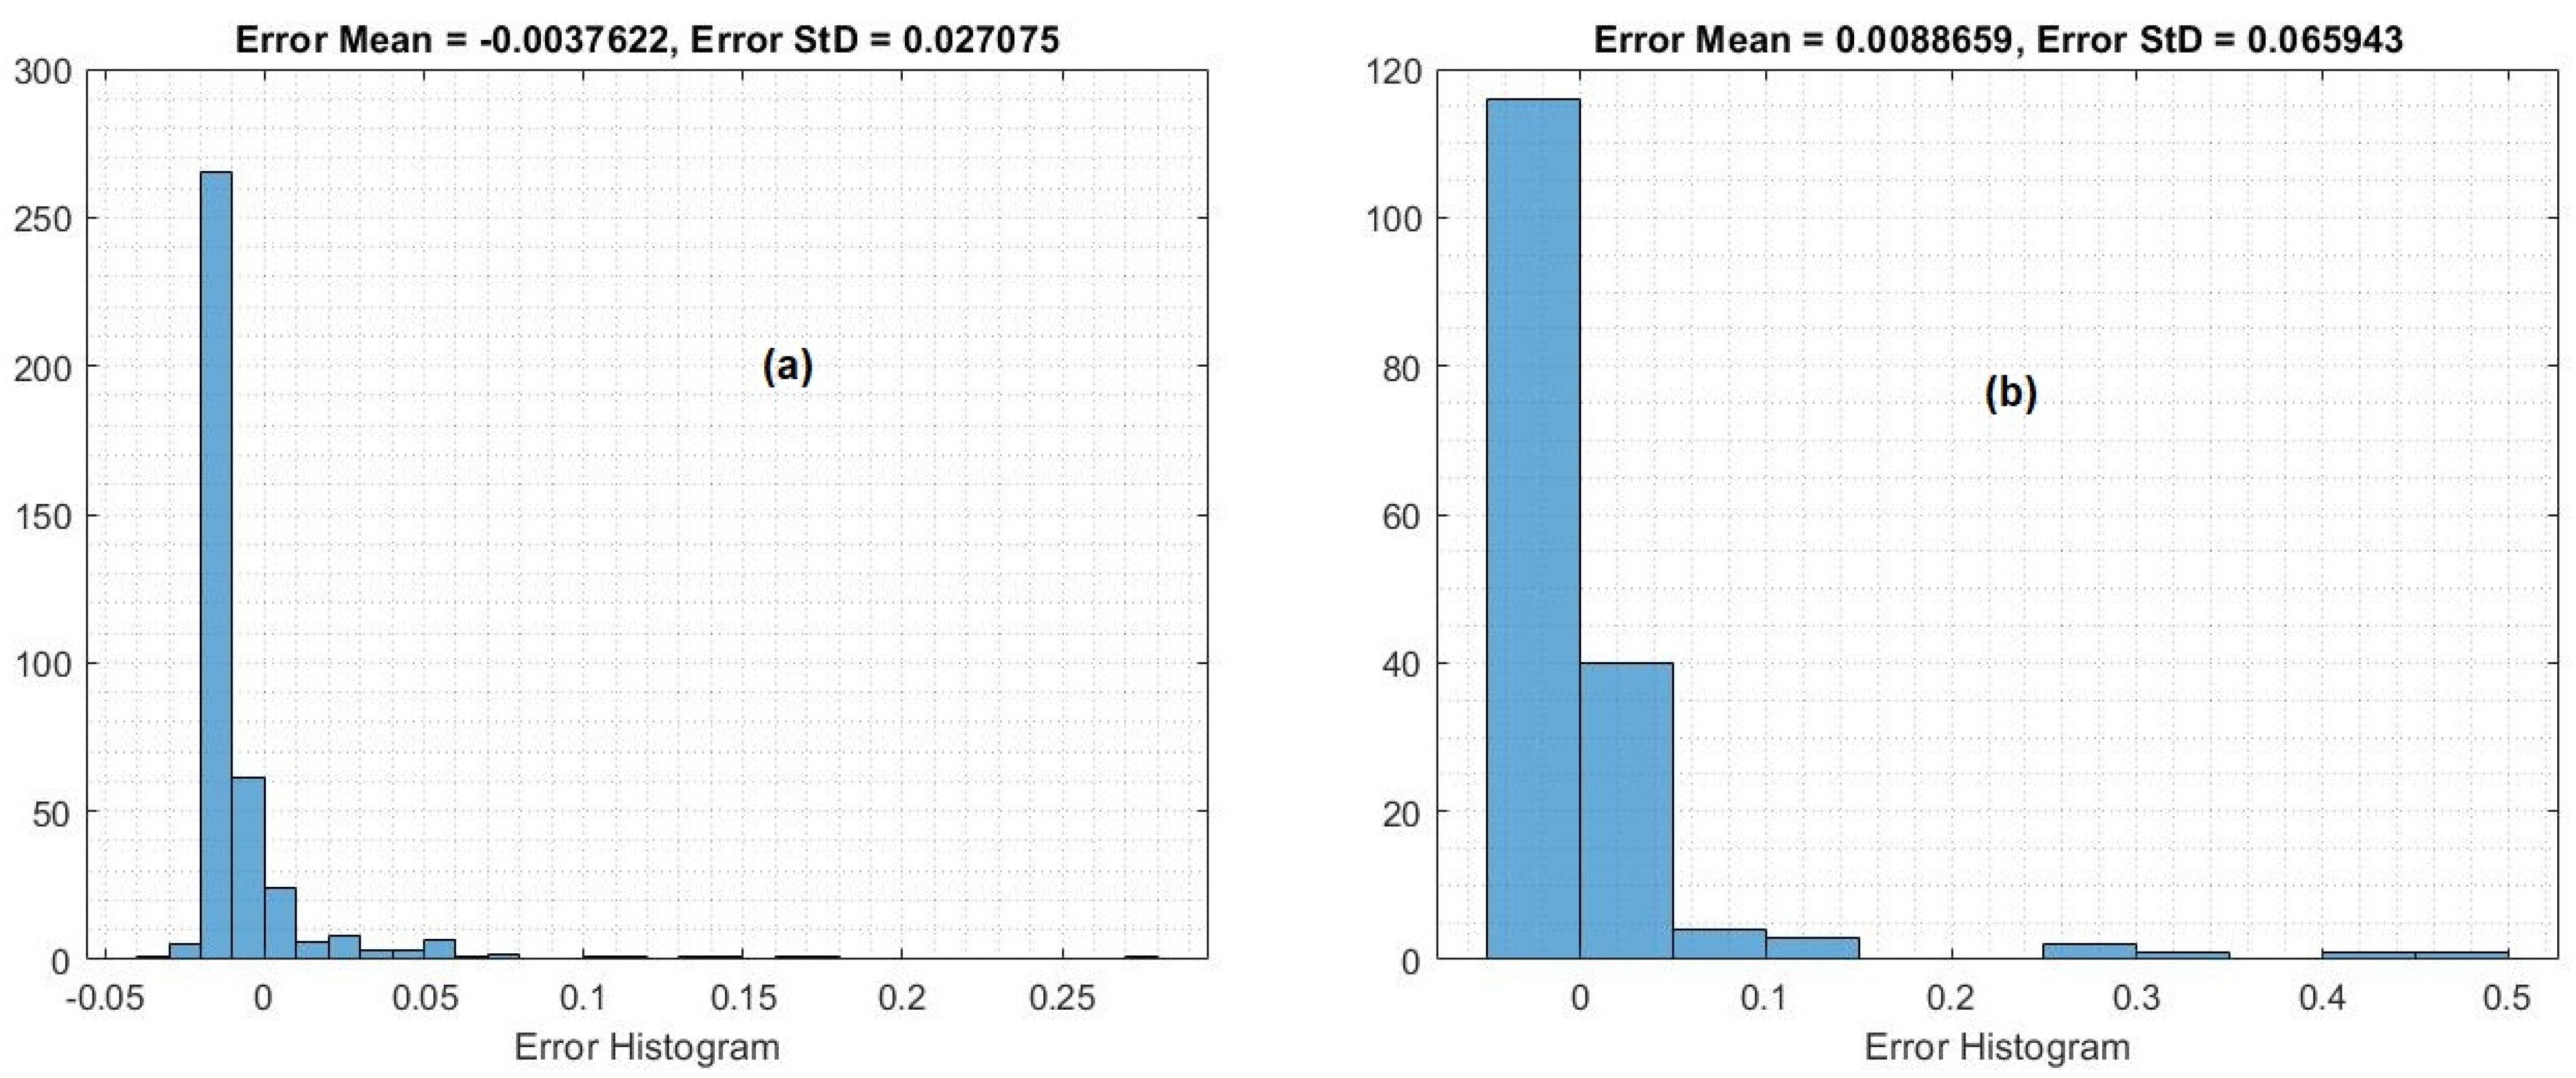
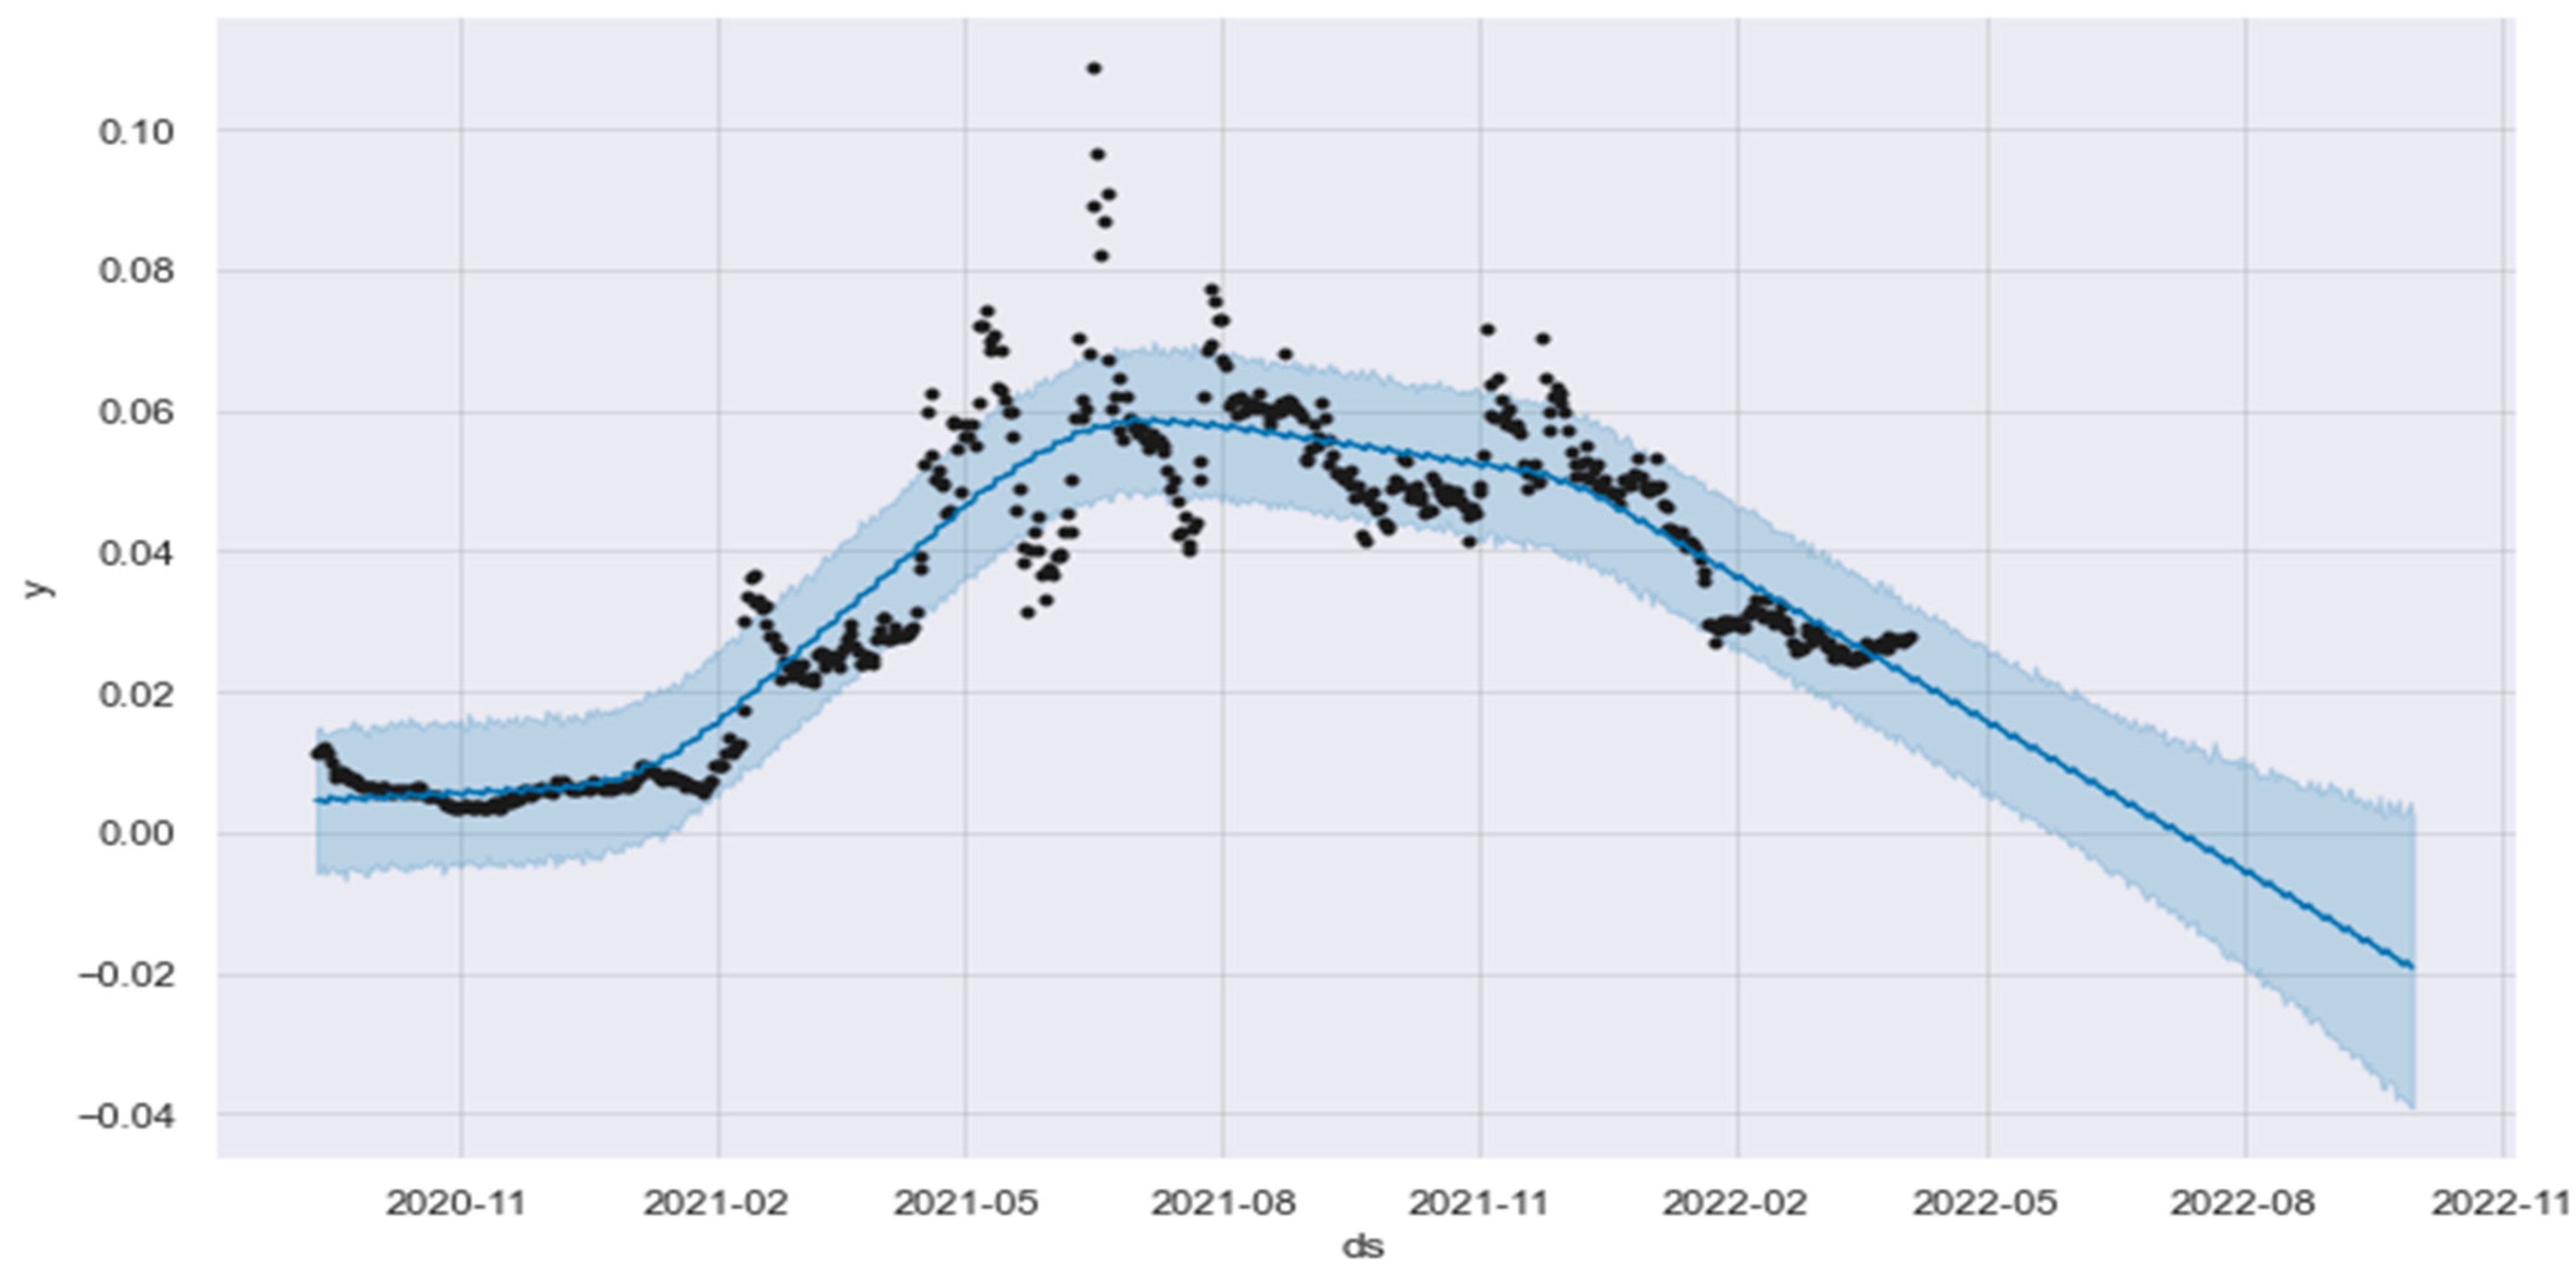
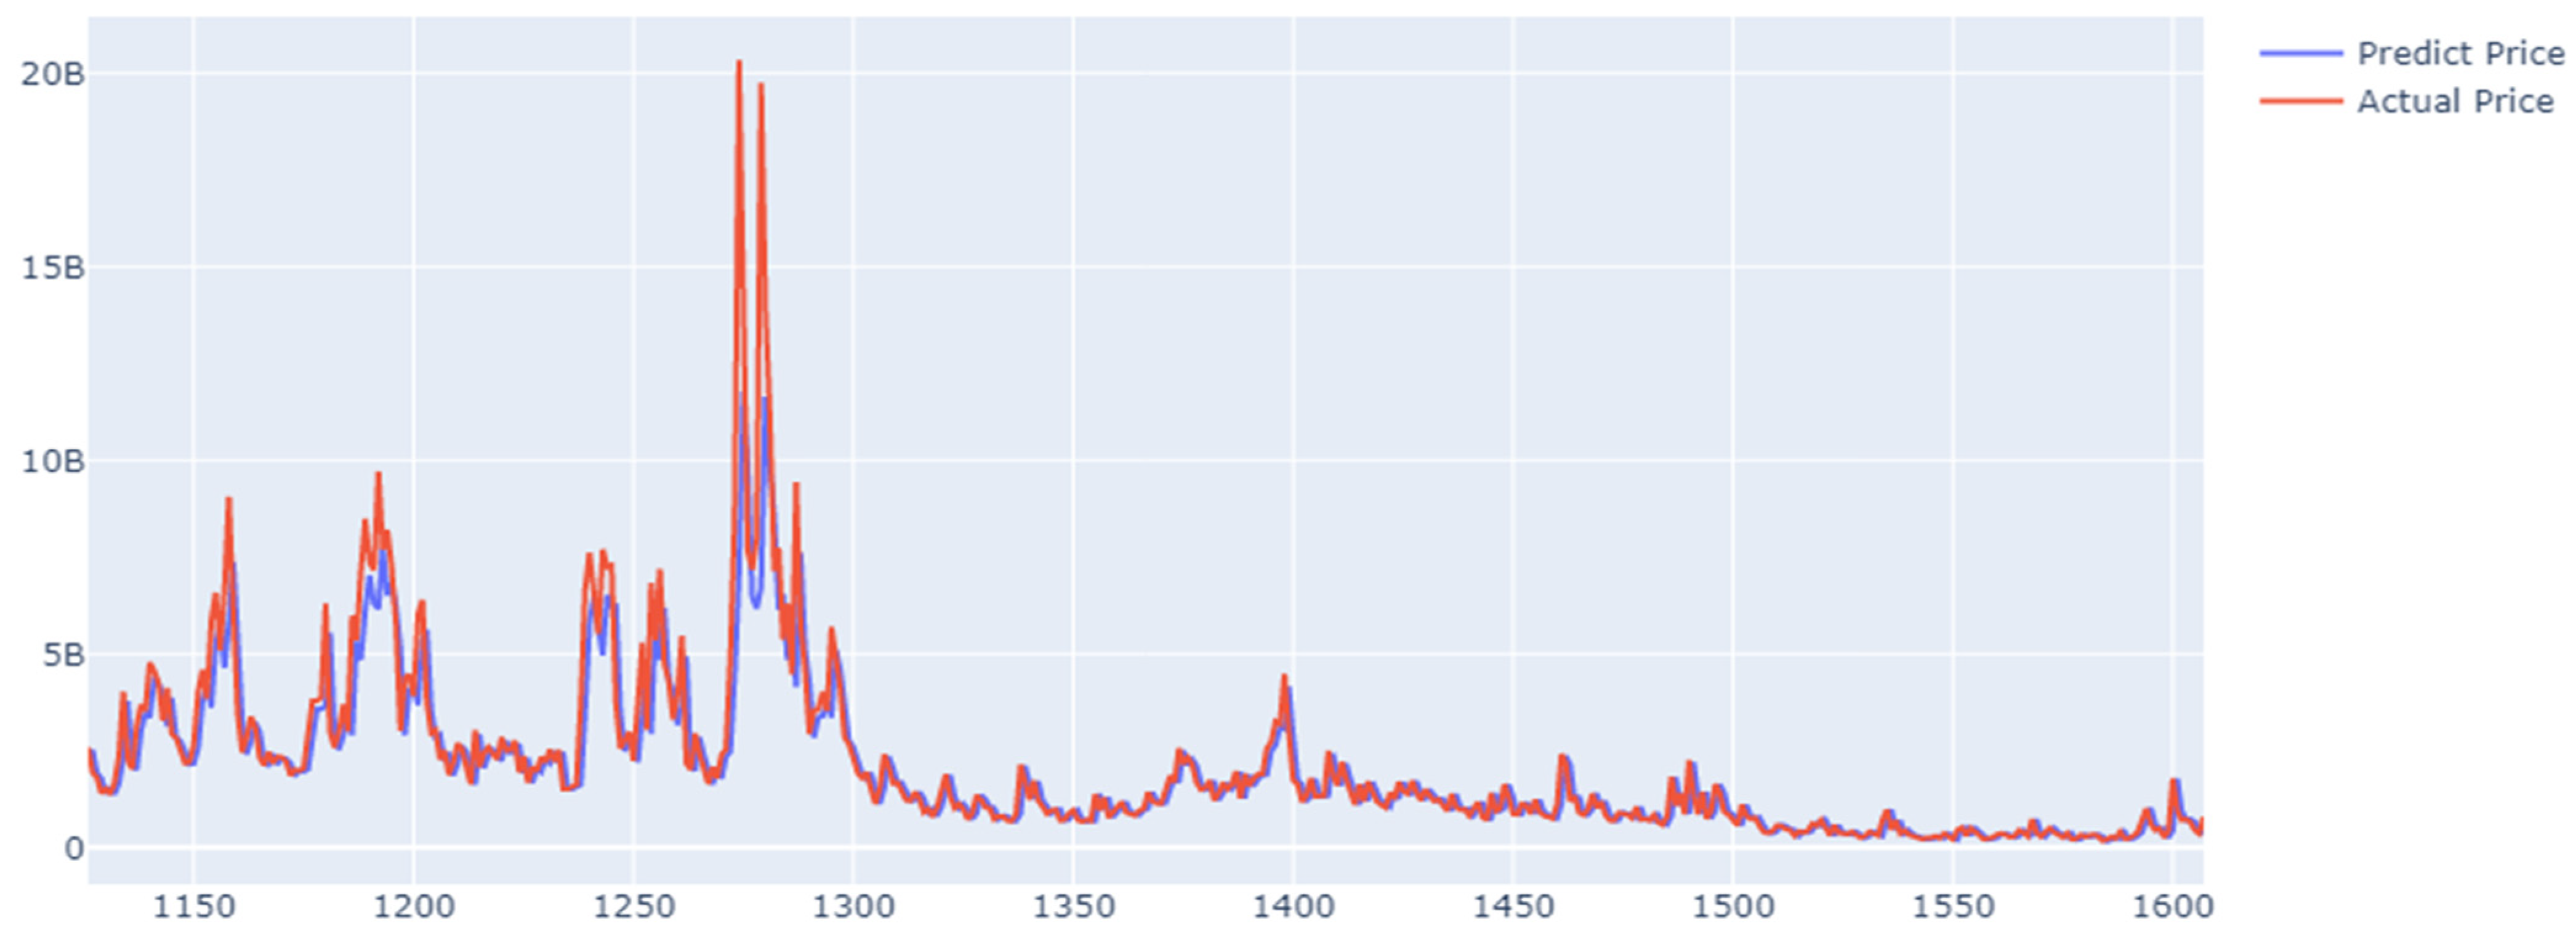
3.2.1. Results of the LSTM Model for the AMP Cryptocurrency

AMP is the digital asset token used to collateralize payments in the Flexa Network, making them quick and safe. It is based on Ethereum, in accordance with the ERC20 standard for tokens. It may be purchased and exchanged for fiat cash or other digital currencies. The LSTM model was used to predict the fluctuation price of the AMP cryptocurrency from 11 September 2020 to 3 April 2022. Table 3 shows the results of the LSTM model in predicting the prices in the training and testing processes.
Figure 5 shows a time series plot of the LSTM model’s results in predicting the price of the AMP cryptocurrency. The prediction values were close to those of the observation model. The prediction error of the LSTM model was MSE = 0.00360 in training and MSE = 0.0999 in testing.
Figure 6 shows a histogram of the errors in the training and testing processes. Error histogram metrics were investigated to find discrepancies between the expected and target values. Negative error numbers demonstrate how the expected values deviated from the target values. The histogram also shows differences between the predicted and target values. The mean error in the error histogram was 0.0037622 in the training phase and 0.0088659 in the testing phase in the prediction of the price of the AMP cryptocurrency.
The LSTM model was proposed to forecast the future prices of the AMP cryptocurrency over a period of 180 days, from 15 September 2022 to 1 October 2022. Table 4 shows the forecasting values for the last month. A graphical representation of the 180-day forecast is presented in Figure 7. It shows the lower and upper forecasting values. We investigated the time series of AMP and found that it was declining over the next 180 days.

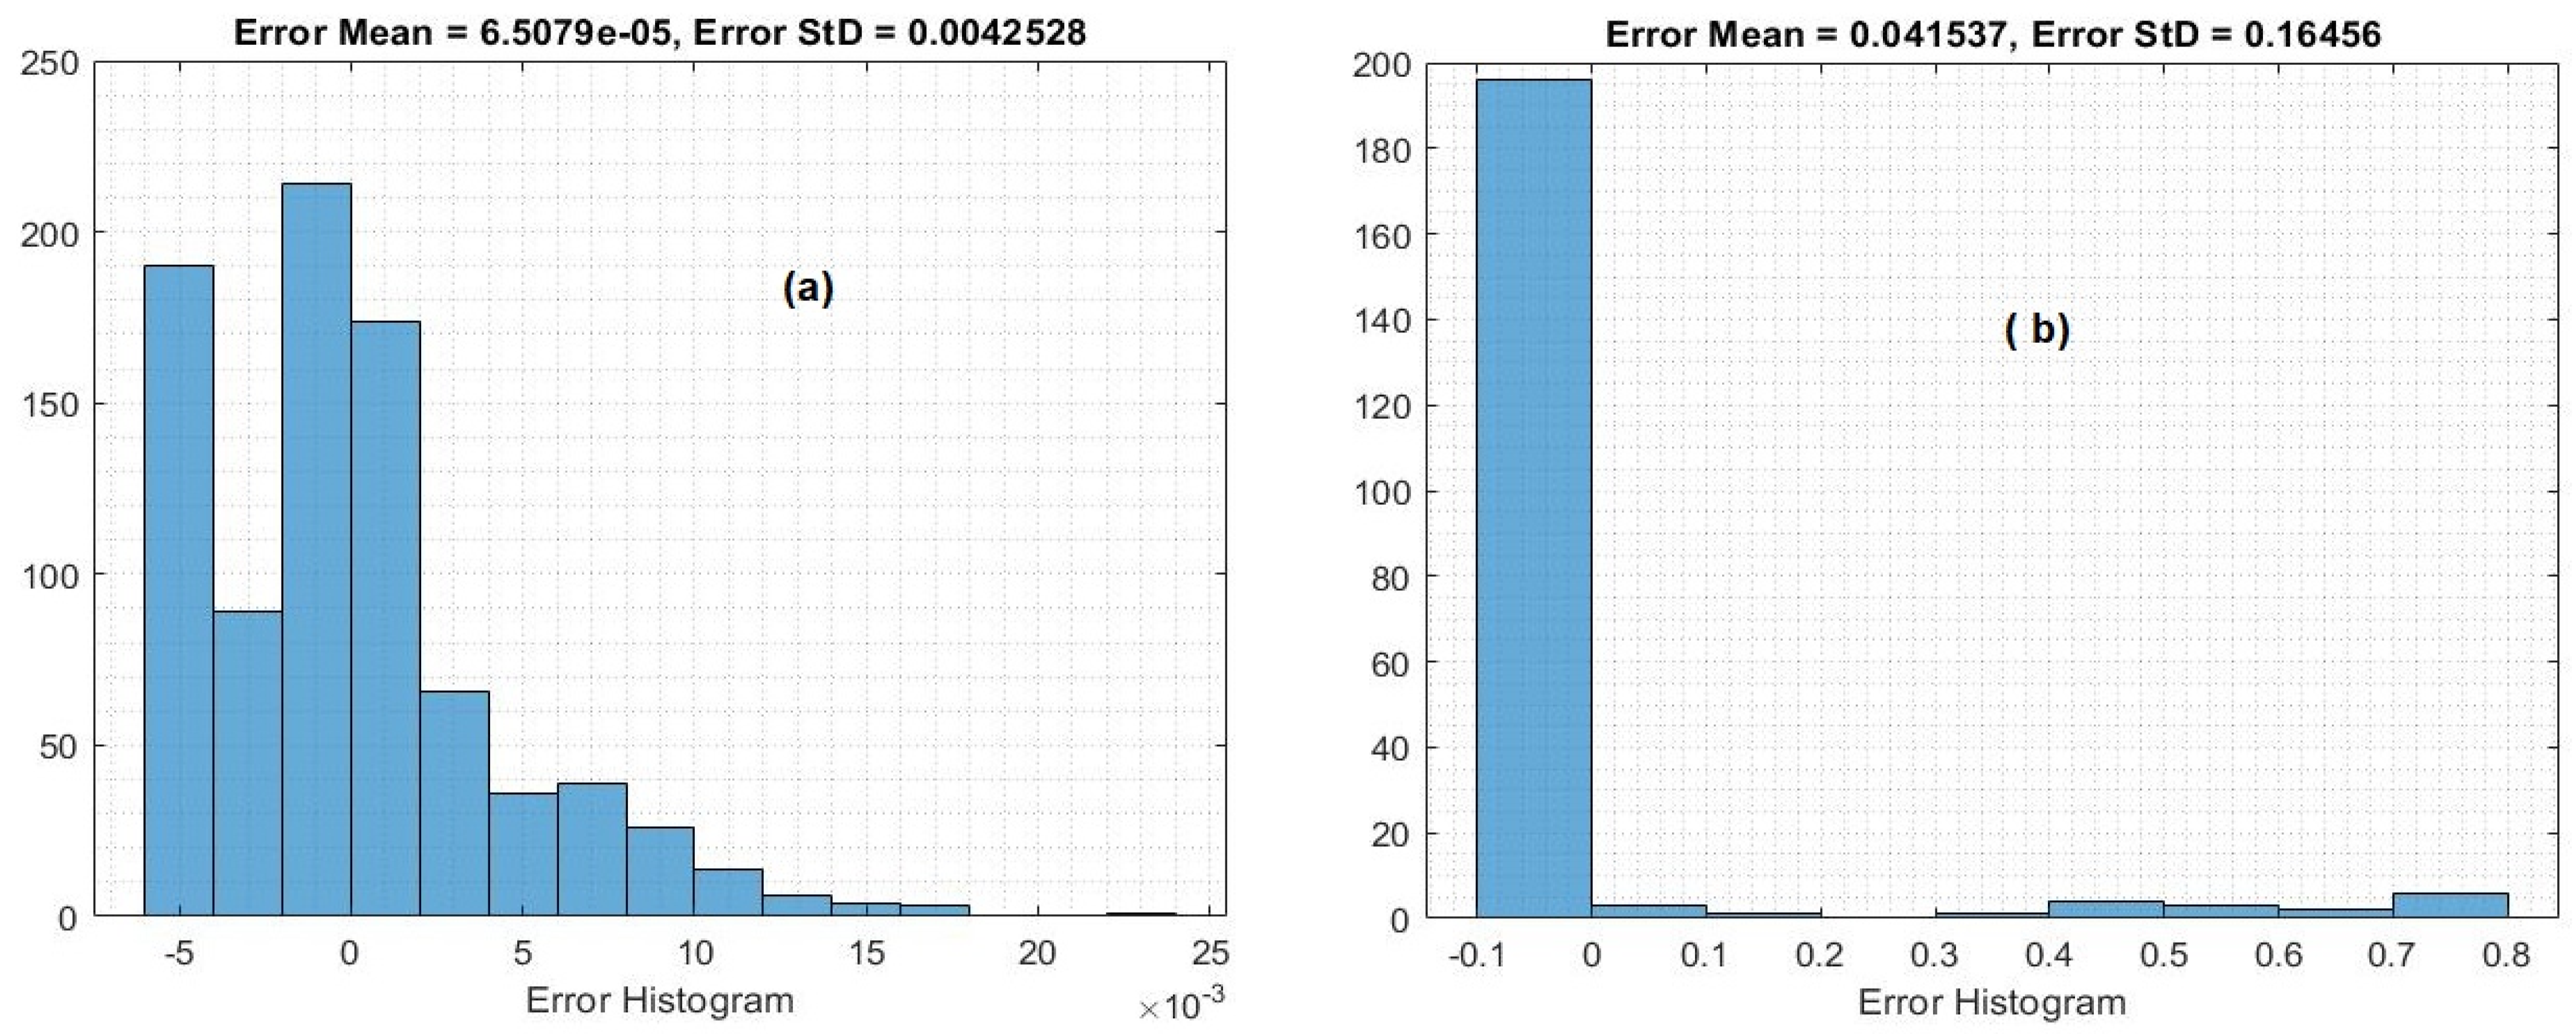
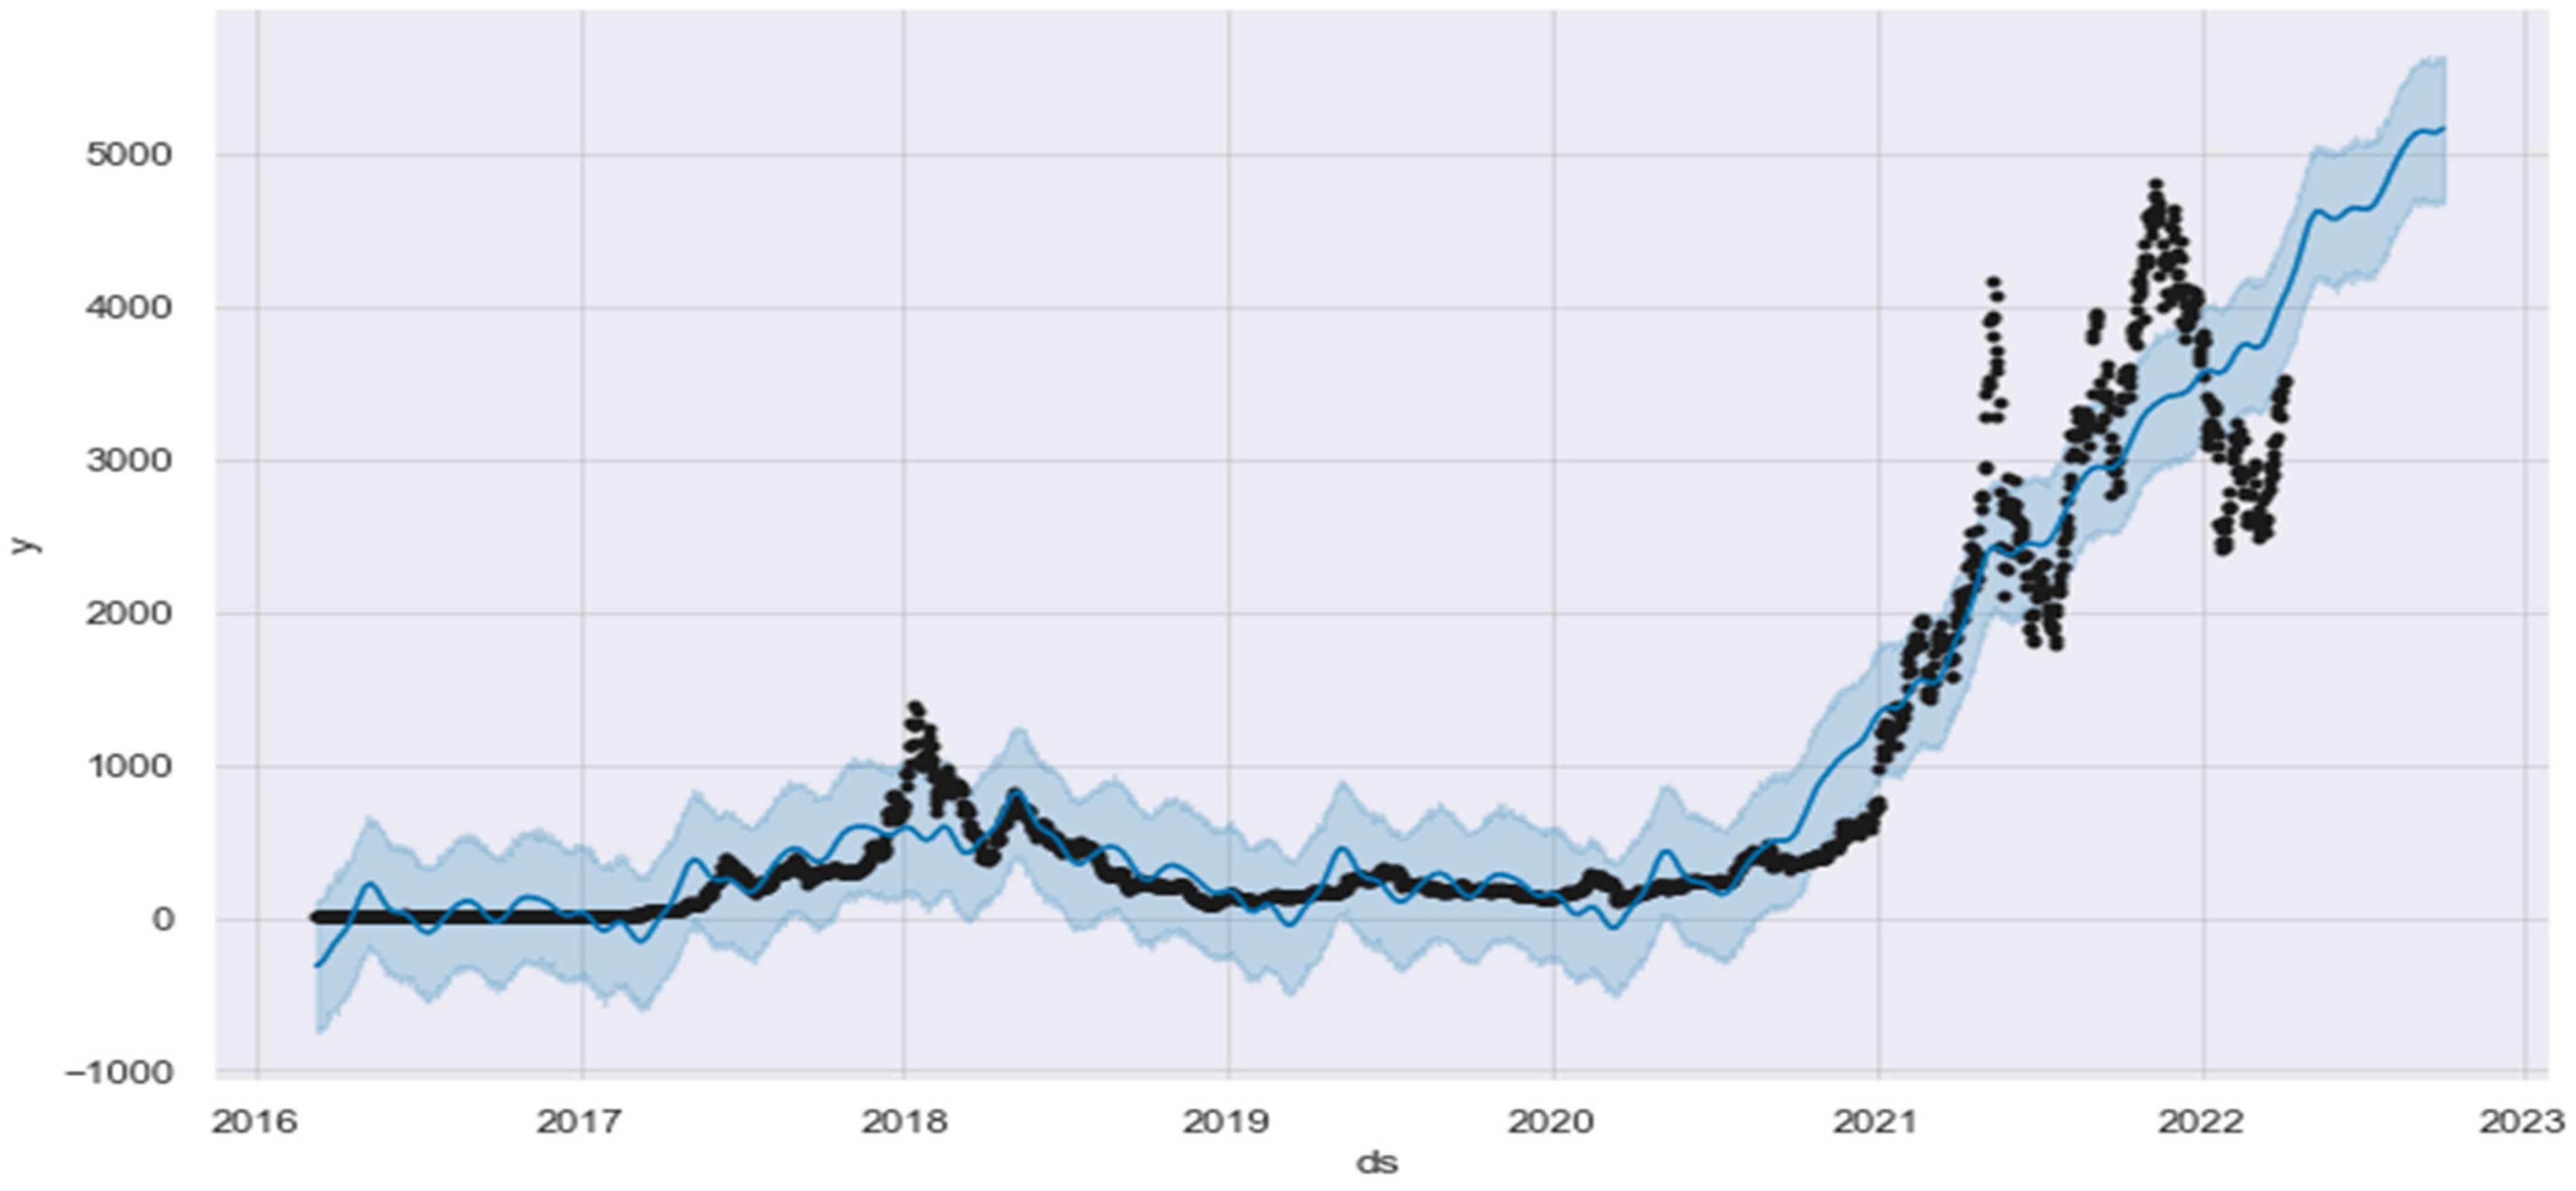
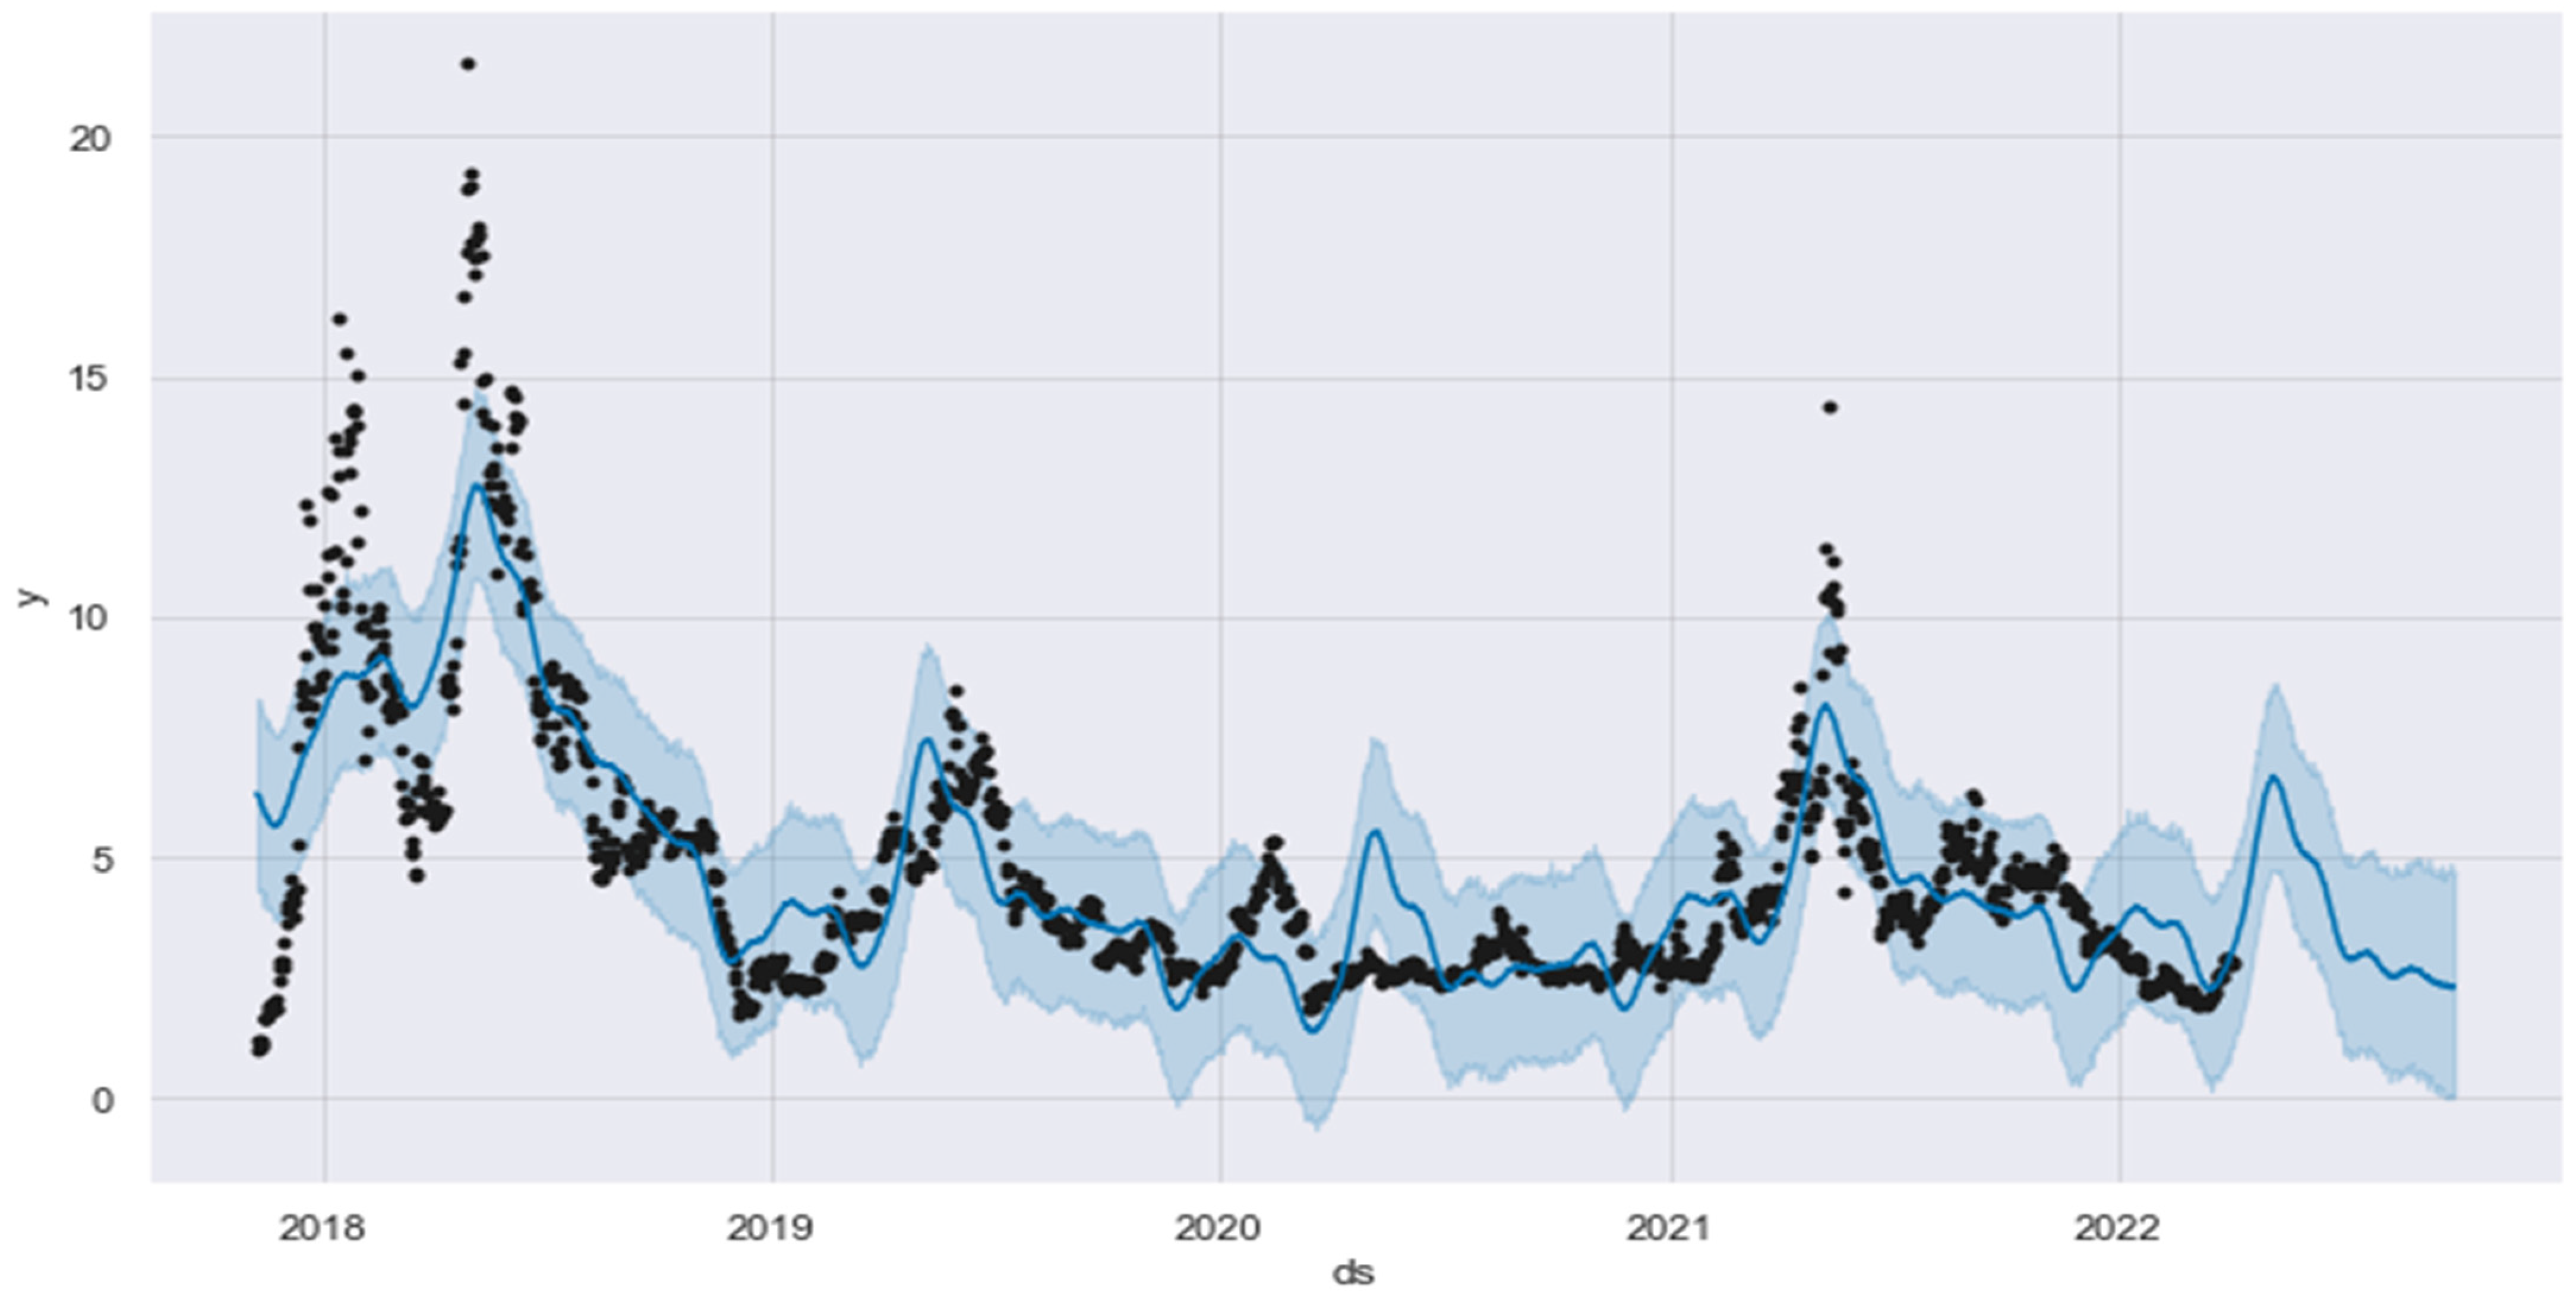
3.2.2. Results for the Ethereum Digital Cryptocurrency

Ethereum is essentially a worldwide decentralized software platform driven by the aforementioned blockchain technology. Ether, abbreviated as ETH, is the cryptocurrency developed specifically for use in this platform. Anyone can use Ethereum to construct any type of safe digital technology. The deep leaning LSTM model was proposed to predict the fluctuations in the price of this digital currency over a given period. Table 5 presents the prediction results of the LSTM model for predicting the prices of the cryptocurrency, showing that the LSTM model achieved good prediction accuracy.
A time series plot of the LSTM model is presented in Figure 8, where the x-axis represents the time (days), and the y-axis represents the price in US dollars. The prediction errors of the LSTM model in predicting the prices of Ethereum were MSE = 0.1616 and 0.00422 in training and testing, respectively.
An error histogram of the LSTM model’s performance in predicting the prices of the Ethereum digital currency is presented in Figure 9. The error was 6.5079 × 10−05 in training and 0.041537 in testing, indicating low error values.
Figure 10 shows a forecast of the prices of Ethereum over 180 days. The price of this digital currency was predicted to continue to increase up to 5619.857287 USD between 15 September 2022 and 1 October 2022. Table 6 summarizes the lower and upper values of the forecasted future closing prices in the last 15 days.

3.2.3. Results of the EOS Digital Cryptocurrency

EOS is a platform for the development, hosting, and operation of decentralized applications (dApps) that is underpinned by blockchain technology. It was released in June 2018, following an initial coin offering that garnered USD 4.1 billion in cryptocurrency for the business. Table 7 shows the results of the LSTM model for predicting the prices of the EOS cryptocurrency. The LSTM model achieved very low prediction errors according to the performance measurement.
A comparison between the actual outcomes and the expected results is illustrated in Figure 11. The results of the model simulations showed few instances in which the predicted outcome did not match the actual findings. The prediction results had an MSE of 0.0525 in training and 0.0365 in testing.
A histogram of the accuracy results obtained for the LSTM model during training and testing in predicting the prices of the EOS cryptocurrency is depicted in Figure 12. An error histogram is a statistical tool that can be used to identify differences between actual and expected data. The predictions obtained for the prices of the EOS cryptocurrency had mean error values of 0.000094, 0.00544, and 0.00025, as shown in their respective histograms.
Figure 13 displays the future prices of the EOS cryptocurrency over 180 days. The plot showed that the future prices of EOS would remain normal. The price forecast for the last 15 days, from 15 September 2022 to 1 October 2022, is presented in Table 8.

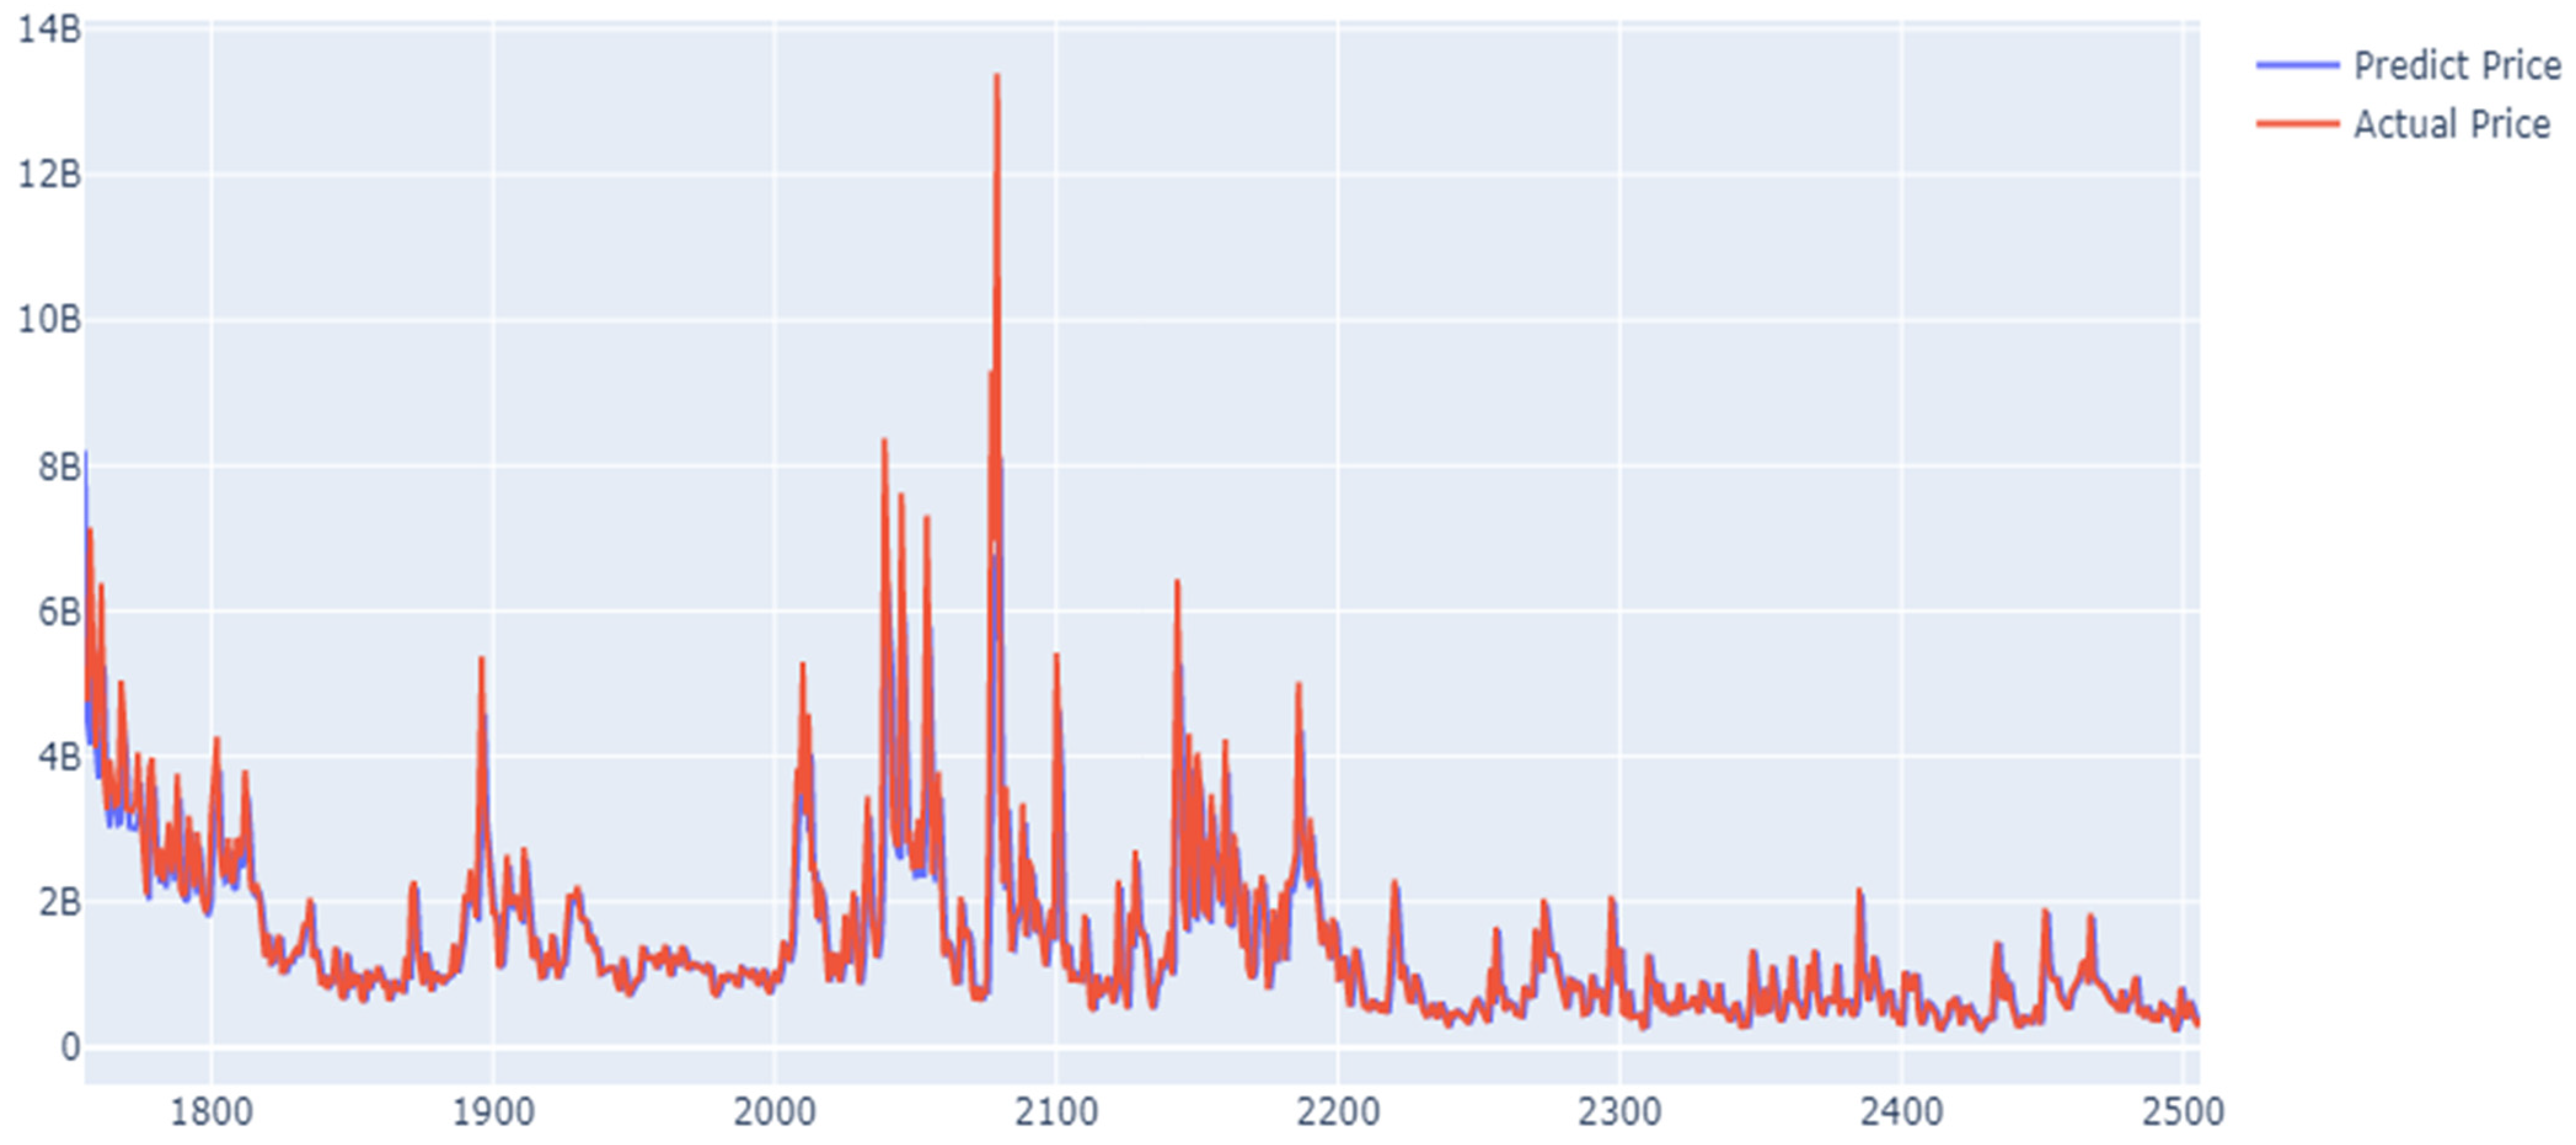
3.2.4. Results of the XRP Digital Cryptocurrency

XRP is a digital asset classification standard developed by CoinDesk. It is categorized as a currency (DACS). XRP is a cryptocurrency native to the XRP Ledger, which is an open-source, public blockchain created to make transactions quicker and more affordable. In this study, the XRP cryptocurrency was chosen to test the accuracy of the LSTM model in predicting cryptocurrency prices. The results of the LSTM model in predicting the prices of XRP are presented in Table 9.
Figure 14 shows the predicted values for the XRP digital cryptocurrency from 25 May 2015 to 4 April 2022. The plot demonstrates that the prediction values were very close to the observed values. According to the MSE metric, the LSTM model achieved very low prediction errors of 0.04042 in training and 0.06324 in testing.
An error histogram of the LSTM model’s performance in predicting the future prices of the XRP cryptocurrency is presented in Figure 15. The mean error value of the prediction and target values of the LSTM model was 0.000256 in the training phase and 0.02941 in the testing phase.
A forecast of the prices of the XRP cryptocurrency over 180 days, from 15 September 2022 to 1 October 2022, is presented in Figure 16. The plot shows that the price of XRP was predicted to continue to increase over the next 180 days. Table 10 shows a 15-day forecast of the price of XRP obtained using the LSTM model.

4. Discussion

In this study, the deep learning LSTM model was proposed for predicting the prices of four cryptocurrencies: AMP, Ethereum, EOS, and XRP. The data sets of these cryptocurrencies were collected from different periods. The proposed system was used to forecast the prices of these cryptocurrencies with a time interval 180 days. According to the results of the forecast, in the next 180 days, the price of the AMP currency was predicted to decrease, whereas the prices of the Ethereum and XRP cryptocurrencies were predicted to increase and the price of the EOS currency was predicted to show normal growth.
The relationships between the target values of the AMP, Ethereum, EOS, and XRP cryptocurrencies and the predicted values obtained from the LSTM model are depicted in Figure 17. During the testing and training phases, the LSTM model exhibited the highest regression scores, with R = (96.73) in training and R = (96.09) in testing, when predicting the prices of the EOS currency.
The cryptocurrencies studied here, namely, AMP, Ethereum, EOS, and XRP, have five significant features. The Pearson correlation method was applied to find correlations between these features. Figure 18 shows the correlations between the features of each cryptocurrency.
To approve the performance of the LSTM model in predicting the prices of different cryptocurrencies, we compared the presented results with the results of existing systems that used the same or different cryptocurrencies. Table 11 summarizes the results of the LSTM model, compared with those of other existing machine learning and deep learning models.

5. Conclusions

During the pandemic and the Russia–Ukraine conflict, daily returns and volatility spillover significantly increased, making accurate forecasting difficult. An innovative artificial intelligence methodology was used instead of the standard time series models to estimate the returns of cryptocurrencies. We found that this new method provided accurate forecasting results for the categorization of returns. On the basis of the promising outcomes of the present research, the following conclusions can be derived:
  • The first step in preprocessing each cryptocurrency data set was data imputation, which was performed to account for missing values. The step was followed by data reshaping, which was performed so that the LSTM algorithms could be applied to the data.
  • The data set was normalized using the MinMax transformation approach and then reorganized so that it could be used in a multivariate model. The following stage involved separating the data into training and testing sets. For every coin, we used a 70% success rate in training and a 20% success rate in testing.
  • The Pearson correlation approach was used to find any relationships between the various characteristics of the cryptocurrencies. In the course of this inquiry, a multivariate prediction model, as opposed to one that was based solely on a single variable, was constructed using Close, Open, High/Low, and Volume as variables.
  • In the forecasts of the future prices of cryptocurrencies for a period of 180 days, Ethereum and XRP showed increasing prices, whereas AMP showed a decreasing price.
  • The results of the experiments demonstrated that the defined features were appropriate for the problem that we presented, and a state-of-the-art performance level, higher than all baseline values, could be attained by our suggested LSTM model. In addition, we analyzed the effects of various parameters on the issues we presented. This research has the potential to provide the groundwork for a genuine trading environment for investors to utilize in the near future.
  • One contribution of this study is that it provides investors and policymakers with a solid understanding of the volatility of the most widely used cryptocurrencies. The LSTM model was utilized in this investigation, in which we examined the volatility of four cryptocurrencies, namelym AMP, Ethereum, EOS, and XRP. The data sets were collected at different time intervals.
  • One limitation of this study was the use of four cryptocurrencies for the testing of the proposed prediction model.
  • In the future, one of our goals is to create accurate prediction models that can be used to make forecasts for all cryptocurrencies, as well as to conduct an evaluation of the proposed model using data for all cryptocurrencies.

Author Contributions

Conceptualization, M.A.A. and T.H.H.A.; methodology, T.H.H.A. and M.A.A.; software, T.H.H.A.; validation, T.H.H.A. and M.A.A.; formal analysis, T.H.H.A. and M.A.A.; investigation, T.H.H.A. and M.A.A.; resources, T.H.H.A.; data curation, T.H.H.A. and M.A.A.; writing—original draft preparation, T.H.H.A. and M.A.A.; writing—review and editing, M.A.A.; visualization, T.H.H.A. and M.A.A.; supervision, T.H.H.A.; project administration, T.H.H.A.; funding acquisition, T.H.H.A. and M.A.A. All authors have read and agreed to the published version of the manuscript.

Funding

This research and the APC were funded by the Saudi Investment Bank Chair for Investment Awareness Studies, the Deanship of Scientific Research, The vice Presidency for Graduate Studies and Scientific Research, King Faisal University, Al Ahsa, Saudi Arabia (Grant No. 22).

Institutional Review Board Statement

Not applicable.

Informed Consent Statement

Not applicable.

Data Availability Statement

The data presented in this study are available here: CoinMarketCap.com (accessed on 20 June 2022).

Conflicts of Interest

The authors declare that they have no conflict of interest.

References

  1. Nakamoto, S. Bitcoin: A Peer-To-Peer Electronic Cash System. Bitcoin. 2008. Available online: https://git.dhimmel.com/bitcoin-whitepaper/ (accessed on 5 May 2022).
  2. Corbet, S.; Lucey, B.; Urquhart, A.; Yarovaya, L. Cryptocurrencies as a financial asset: A systematic analysis. Int. Rev. Financ. Anal. 2019, 62, 182–199. [Google Scholar] [CrossRef] [Green Version]
  3. Zheng, Z.; Xie, S.; Dai, H.; Chen, X.; Wang, H. An overview of blockchain technology: Architecture, Consensus, and Future Trends. In Proceedings of the 2017 IEEE 6th International Congress on Big Data (BigData Congress), Honolulu, HI, USA, 25–30 June 2017. [Google Scholar]
  4. Zheng, Z.; Xie, S.; Dai, H.N.; Chen, X.; Wang, H. Blockchain challenges and opportunities: A survey. Int. J. Web Grid Serv. 2018, 14, 352–375. [Google Scholar] [CrossRef]
  5. Li, L.; Liu, J.; Chang, X.; Liu, T.; Liu, J. Toward conditionally anonymous Bitcoin transactions: A lightweight-script approach. Inf. Sci. 2020, 509, 290–303. [Google Scholar] [CrossRef]
  6. Böhme, R.; Christin, N.; Edelman, B.; Moore, T. Bitcoin: Economics, technology, and governance. J. Econ. Perspect. 2015, 29, 213–238. [Google Scholar] [CrossRef] [Green Version]
  7. Garcia, D.; Tessone, C.J.; Mavrodiev, P.; Perony, N. The digital traces of bubbles: Feedback cycles between socio-economic signals in the Bitcoin economy. J. R. Soc. Interface 2014, 11, 20140623. [Google Scholar] [CrossRef] [PubMed]
  8. Yu, J.H.; Kang, J.; Park, S. Information availability and return volatility in the bitcoin Market: Analyzing diferences of user opinion and interest. Inf. Processing Manag. 2019, 56, 721–732. [Google Scholar] [CrossRef]
  9. Gu, S.; Kelly, B.; Xiu, D. Empirical asset pricing via machine learning. Rev. Financ. Stud. 2020, 33, 2223–2273. [Google Scholar] [CrossRef] [Green Version]
  10. Feng, G.; Giglio, S.; Xiu, D. Taming the factor zoo: A test of new factors. J. Financ. 2020, 75, 1327–1370. [Google Scholar] [CrossRef]
  11. Jaquart, P.; Dann, D.; Martin, C. Machine learning for bitcoin pricing—A structured literature review WI 2020 Proceedings. In Wirtschaftsinformatik (Zentrale Tracks); GITO Verlag: Berlin, Germany, 2020; pp. 174–188. [Google Scholar]
  12. Coinmarketcap. Available online: https://coinmarketcap.com (accessed on 15 September 2020).
  13. Fama, E.F. Efficient capital markets: A review of theory and empirical work. J. Financ. 1970, 25, 383–417. [Google Scholar] [CrossRef]
  14. Lo, A.W. The Adaptive Markets Hypothesis Adaptive Markets; Princeton University Press: Princeton, NJ, USA, 2019; Volume 30, pp. 176–221. [Google Scholar]
  15. Fama, E.F.; MacBeth, J.D. Risk, return, and equilibrium: Empirical tests. J. Polit. Econ. 1973, 81, 607–636. [Google Scholar] [CrossRef]
  16. Fama, E.F.; French, K.R. Dissecting anomalies. J. Financ. 2007, 63, 1653–1678. [Google Scholar] [CrossRef]
  17. Fischer, T.; Krauss, C. Deep learning with long short-term memory networks for financial market predictions. Eur. J. Oper. Res. 2018, 270, 654–669. [Google Scholar] [CrossRef] [Green Version]
  18. Krollner, B.; Vanstone, B.; Finnie, G. Financial time series forecasting with machine learning techniques: A survey. In Proceedings of the 18th European Symposium on Artificial Neural Networks: Computational and Machine Learning, Bruges, Belgium, 28–30 April 2010; Springer: Berlin/Heidelberg, Germany, 2010; pp. 1–7. [Google Scholar]
  19. Siami-Namini, S.; Namin, A.S. Forecasting Economics and Financial Time Series: ARIMA vs. LSTM. arXiv 2018, arXiv:1803.06386. Available online: https://arxiv.org/abs/1803.06386v1 (accessed on 2 February 2020).
  20. Kaiser, L. Seasonality in cryptocurrencies. Financ. Res. Lett. 2019, 31, 232–238. [Google Scholar] [CrossRef]
  21. Aldhyani, T.H.H.; Alkahtani, H. A Bidirectional Long Short-Term Memory Model Algorithm for Predicting COVID-19 in Gulf Countries. Life 2021, 11, 1118. [Google Scholar] [CrossRef] [PubMed]
  22. Enke, D.; Thawornwong, S. The use of data mining and neural networks for forecasting stock market returns. Expert Syst. Appl. 2005, 29, 927–940. [Google Scholar] [CrossRef]
  23. Huang, W.; Nakamori, Y.; Wang, S.-Y. Forecasting stock market movement direction with support vector machine. Comput. Oper. Res. 2005, 32, 2513–2522. [Google Scholar] [CrossRef]
  24. Sheta, A.F.; Ahmed, S.E.M.; Faris, H. A comparison between regression, artificial neural networks and support vector machines for predicting stock market index. Soft Comput. 2015, 7, 8. [Google Scholar]
  25. McNally, S.; Roche, J.; Caton, S. Predicting the Price of Bitcoin Using Machine Learning. In Proceedings of the 26th Euromicro International Conference on Parallel, Distributed and Network-Based Processing (PDP), Cambridge, UK, 21–23 March 2018. [Google Scholar]
  26. Andrianto, Y. The Effect of Cryptocurrency on Investment Portfolio Effectiveness. J. Financ. Account. 2017, 5, 229–238. [Google Scholar] [CrossRef] [Green Version]
  27. Derbentsev, V.; Babenko, V.; Khrustalev, K.; Obruch, H.; Khrustalova, S. Comparative Performance of Machine Learning Ensemble Algorithms for Forecasting Cryptocurrency Prices. Int. J. Eng. Trans. A Basics 2021, 34, 140–148. [Google Scholar]
  28. Patel, M.M.; Tanwar, S.; Gupta, R.; Kumar, N. A Deep Learning-based Cryptocurrency Price Prediction Scheme for Financial Institutions. J. Inf. Secur. Appl. 2020, 55, 102583. [Google Scholar] [CrossRef]
  29. Miura, R.; Pichl, L.; Kaizoji, T. Artificial Neural Networks for Realized Volatility Prediction in Cryptocurrency Time Series. In Advances in Neural Networks—ISNN 2019; Lu, H., Tang, H., Wang, Z., Eds.; Lecture Notes in Computer Science; Springer: Cham, Switzerland, 2019; Volume 11554. [Google Scholar]
  30. Huang, J.-Z.; Huang, W.; Ni, J. Predicting bitcoin returns using high-dimensional technical indicators. J. Financ. Data Sci. 2019, 5, 140–155. [Google Scholar] [CrossRef]
  31. Chen, Z.; Li, C.; Sun, W. Bitcoin price prediction using machine learning: An approach to sample dimension engineering. J. Comput. Appl. Math. 2020, 365, 112395. [Google Scholar] [CrossRef]
  32. Kubat, M.; Matwin, S. Addressing the curse of imbalanced training sets: One-sided selection. In Proceedings of the 14th International Conference on Machine Learning, Nashville, TN, USA, 8–12 July 1997; Citeseer, Morgan Kaufmann: San Francisco, CA, USA, 1997; pp. 179–186. [Google Scholar]
  33. Peng, Y.; Albuquerque, P.H.M.; de Sá, J.M.C.; Padula, A.J.A.; Montenegro, M.R. The best of two worlds: Forecasting high frequency volatility for cryptocurrencies and traditional currencies with Support Vector Regression. Expert Syst. Appl. 2018, 97, 177–192. [Google Scholar] [CrossRef]
  34. Thakkar, A.; Chaudhari, K. A comprehensive survey on portfolio optimization, stock price and trend prediction using particle swarm optimization. Arch. Comput. Methods Eng. 2020, 28, 2133–2164. [Google Scholar] [CrossRef]
  35. Chaudhari, K.; Thakkar, A. iCREST: International cross-reference to exchange-based stock trend prediction using long short-term memory. In Applied Soft Computing and Communication Networks; Springer: Singapore, 2021; pp. 323–338. [Google Scholar]
  36. Altan, A.; Karasu, S.; Bekiros, S. Digital currency forecasting with chaotic meta-heuristic bio-inspired signal processing techniques. Chaos Solitons Fractals 2019, 126, 325–336. [Google Scholar] [CrossRef]
  37. Zhang, S.; Li, M.; Yan, C. The Empirical Analysis of Bitcoin Price Prediction Based on Deep Learning Integration Method. Comput. Intell. Neurosci. 2022, 2022, 1265837. [Google Scholar] [CrossRef] [PubMed]
  38. Alessandretti, L.; ElBahrawy, A.; Aiello, L.M.; Baronchelli, A. Anticipating cryptocurrency prices using machine learning. Complexity 2018, 2018, 8983590. [Google Scholar] [CrossRef]
  39. Jain, A.; Tripathi, S.; DharDwivedi, H.; Saxena, P. Forecasting Price of Cryptocurrencies Using Tweets Sentiment Analysis. In Proceedings of the 2018 Eleventh International Conference on Contemporary Computing (IC3), Noida, India, 2–4 August 2018; pp. 1–7. [Google Scholar]
  40. Kumar, D.; Rath, S. Predicting the Trends of Price for Ethereum Using Deep Learning Techniques. In Artificial Intelligence and Evolutionary Computations in Engineering Systems; Springer: Berlin/Heidelberg, Germany, 2020; pp. 103–114. [Google Scholar]
  41. Livieris, I.E.; Pintelas, E.; Stavroyiannis, S.; Pintelas, P. Ensemble Deep Learning Models for Forecasting Cryptocurrency Time-Series. Algorithms 2020, 13, 121. [Google Scholar] [CrossRef]
  42. Ji, S.; Kim, J.; Im, H. A comparative study of Bitcoin price prediction using deep learning. Mathematics 2019, 7, 898. [Google Scholar] [CrossRef] [Green Version]
  43. Huisu, J.; Lee, J.; Ko, H.; Lee, W. Predicting bitcoin prices by using rolling window lstm model. In Proceedings of the KDD Data Science in Fintech Workshop, London, UK, 19–23 August 2018. [Google Scholar]
  44. Alkahtani, H.; Aldhyani, T.H.H. Artificial Intelligence Algorithms for Malware Detection in Android-Operated Mobile Devices. Sensors 2022, 22, 2268. [Google Scholar] [CrossRef]
  45. Wu, C.H.; Lu, C.C.; Ma, Y.F.; Lu, R.S. A new forecasting framework for bitcoin price with LSTM. In Proceedings of the 2018 IEEE International Conference on Data Mining Workshops (ICDMW), Singapore, 17–20 November 2018; pp. 168–175. [Google Scholar]
  46. Dutta, A.; Kumar, S.; Basu, M. A Gated Recurrent Unit Approach to Bitcoin Price Prediction. J. Risk Financ. Manag. 2020, 13, 23. [Google Scholar] [CrossRef] [Green Version]
  47. Greaves, A.; Au, B. Using the Bitcoin Transaction Graph to Predict the Price of Bitcoin; Stanford University: Stanford, CA, USA, 2015. [Google Scholar]
  48. Kurbucz, M.T. Predicting the price of Bitcoin by the most frequent edges of its transaction network. Econ. Lett. 2019, 184, 108655. [Google Scholar] [CrossRef]
  49. Jang, H.; Lee, J. An empirical study on modeling and prediction of bitcoin prices with bayesian neural networks based on blockchain information. IEEE Access 2017, 6, 5427–5437. [Google Scholar] [CrossRef]
  50. Aldhyani, T.H.H.; Alkahtani, H. Attacks to Automatous Vehicles: A Deep Learning Algorithm for Cybersecurity. Sensors 2022, 22, 360. [Google Scholar] [CrossRef]
  51. Alkahtani, H.; Aldhyani, T.; Al-Yaari, M. Adaptive anomaly detection framework model objects in cyberspace. Appl. Bionics Biomech. 2020, 2020, 6660489. [Google Scholar] [CrossRef]
  52. Yamak, P.T.; Yujian, L.; Gadosey, P.K. A Comparison between ARIMA, LSTM, and GRU for Time Series Forecasting. In Proceedings of the 2nd International Conference on Algorithms, Computing and Artificial Intelligence, Sanya, China, 20–22 December 2019; pp. 49–55. [Google Scholar]
  53. Sebastião, H.; Godinho, P. Forecasting and trading cryptocurrencies with machine learning under changing market conditions. Financ. Innov. 2021, 7, 3. [Google Scholar] [CrossRef]
Figure 1. Framework of the system.
Electronics 11 02349 g001
Figure 2. Cryptocurrency data sets: (a) AMP, (b) Ethereum, (c) EOS, and (d) XRP.
Electronics 11 02349 g002
Figure 3. Normalization cryptocurrency data sets: (a) AMP, (b) Ethereum, (c) EOS, and (d) XRP.
Electronics 11 02349 g003
Figure 4. Structure of the LSTM model.
Electronics 11 02349 g004
Figure 5. Time series plot of the LSTM model for predicting the price of the AMP cryptocurrency.
Electronics 11 02349 g005
Figure 6. Error histograms of the LSTM model for predicting the price of the AMP cryptocurrency in (a) training and (b) testing.
Electronics 11 02349 g006
Figure 7. Future prices of the AMP cryptocurrency.
Electronics 11 02349 g007
Figure 8. Time series plot of the LSTM for predicting the prices of the Ethereum cryptocurrency.
Electronics 11 02349 g008
Figure 9. Error histograms of the LSTM model’s predictions of the prices of the Ethereum cryptocurrency in (a) training and (b) testing.
Electronics 11 02349 g009
Figure 10. Future prices of the Ethereum cryptocurrency.
Electronics 11 02349 g010
Figure 11. Time series plot of the LSTM model in predicting the prices of the EOS cryptocurrency.
Electronics 11 02349 g011
Figure 12. Error histograms of the LSTM model in predicting the prices of the EOS cryptocurrency in (a) training and (b) testing.
Electronics 11 02349 g012
Figure 13. Future prices of the EOS cryptocurrency.
Electronics 11 02349 g013
Figure 14. Time series plot of the LSTM model in predicting the prices of the XRP cryptocurrency.
Electronics 11 02349 g014
Figure 15. Error histograms of the LSTM model in predicting the prices of the XRP cryptocurrency in (a) training and (b) testing.
Electronics 11 02349 g015
Figure 16. Future prices of the XRP cryptocurrency.
Electronics 11 02349 g016
Figure 17. Regression plot of the LSTM model for (a) AMP, (b) Ethereum, (c) EOS, and (d) XRP.
Electronics 11 02349 g017
Figure 18. Pearson correlations between the features of the cryptocurrencies (a) AMP (b) Ethereum (c) EOS (d) XRP.
Electronics 11 02349 g018
Table 1. Features of the cryptocurrencies used in this study.
DescriptionFeature TypeFeature
TimeDateLowest cryptocurrency price for the day
LowNumericalHighest cryptocurrency price for the day
HighNumericalOpening cryptocurrency price for the day
OpenNumericalClosing cryptocurrency price for the day
CloseNumericalCryptocurrency volume traded on the day
VolumeNumerical
Table 2. Period used for each cryptocurrency.
CryptocurrencyStart TimeEnd Time
AMP9 November 20203 April 2022
Ethereum3 October 20164 April 2022
EOS9 November 20174 April 2022
XRP25 May 20154 April 2022
Table 3. Results of the LSTM model for the AMP cryptocurrency.
MSERMSENRMES
Training0.003600.05790.08877
Testing0.09990.042890.00184
Table 4. Results of the AMP dataset for the last 15 days.
DateYhat_LowerYhat_Upper
15 September 20220.0333580.004007
16 September 20220.0351220.002405
17 September 20220.0341850.004088
18 September 20220.0352890.004145
19 September 20220.0355500.002510
20 September 20220.0364660.003886
21 September 20220.0361690.003065
22 September 20220.0376350.002911
23 September 20220.0381760.002818
24 September 20220.0389440.002759
25 September 20220.0381740.003079
26 September 20220.0390460.002894
27 September 20220.0389000.001161
28 September 20220.0387880.003102
29 September 20220.0396800.002595
30 September 20220.0393570.003808
Table 5. Results of the LSTM model in predicting the prices of the Ethereum cryptocurrency.
MSERMSENRMES
Training0.16160.16930.02868
Testing0.004220.0042501.807 × 100−5
Table 6. Results of the Ethereum data set for the last 15 days.
DateYhat_LowerYhat_Upper
15 September 20224677.9039085609.095990
16 September 20224688.5385875621.289890
17 September 20224702.7701085591.677580
18 September 20224678.1115975621.169491
19 September 20224693.6033835617.486797
20 September 20224665.6134445575.324879
21 September 20224710.0743745597.400108
22 September 20224729.7711865589.593962
23 September 20224694.1204565632.626349
24 September 20224691.7208175597.651285
25 September 20224688.4409775605.991738
26 September 20224684.4309265620.691021
27 September 20224720.2834195616.356363
28 September 20224714.1687255619.857287
29 September 20224708.0969615624.059944
30 September 20224691.0833875624.886372
15 September 20224711.6867275620.812830
Table 7. Results of the LSTM model’s performance in predicting the prices of the EOS cryptocurrency.
MSERMSENRMES
Training0.05250.05780.003345
Testing0.03650.038550.00148
Table 8. Results of the EOS data set for the last 15 days.
DateYhat_LowerYhat_Upper
15 September 20220.0864124.678990
16 September 20220.0857074.755874
17 September 20220.2130804.694373
18 September 20220.0667924.649735
19 September 20220.0030344.635850
20 September 20220.1267494.700749
21 September 20220.1613474.492018
22 September 20220.0464884.559961
23 September 20220.1803594.621102
24 September 20220.1198624.652601
25 September 20220.0330374.476590
26 September 2022−0.1437184.640157
27 September 20220.0117724.778431
28 September 20220.2349304.649232
29 September 20220.0682254.841558
30 September 2022−0.1567794.636795
1 October 2022−0.0581284.701538
Table 9. Results of the LSTM model’s performance in predicting the prices of the XRP cryptocurrency.
MSERMSENRMES
Training0.040420.0420660.001769
Testing0.063240.069130.0478
Table 10. Results of the XRP data set for the last 15 days.
DateYhat_LowerYhat_Upper
15 September 20221.0303581.582593
16 September 20221.0411821.565411
17 September 20221.0422171.576260
18 September 20221.0336771.569240
19 September 20221.0426461.585327
20 September 20221.0337971.591424
21 September 20221.0145971.575083
22 September 20221.0444771.570961
23 September 20221.0366211.583856
24 September 20221.0404931.575192
25 September 20221.0220041.620774
26 September 20221.0260471.575642
27 September 20221.0377901.577444
28 September 20221.0494071.588724
29 September 20221.0335131.605739
30 September 20221.0536321.607500
1 October 20221.0508161.602266
Table 11. Comparison results between the proposed system and the existing models.
ReferenceModelCurrencyResults
[52]Logistic regression and linear discriminant analysisLTCR2 score LR: 66%
LDA: 65.3%
[53]Random forests (RFs) and support vector machines (SVMs)Ethereum and LitecoinRMSE:
SVM = 19.69
RF = 5.05
Proposed system (LSTM)AMPMSE = 0.000745
RMSE = 0.042
Proposed system (LSTM)EthereumMSE = 0.02868
RMSE = 0.042
Proposed system (LSTM)EOSMSE = 0.003345
RMSE = 0.0385
Proposed system (LSTM)XRPMSE = 0.001769
RMSE = 0.069
Publisher’s Note: MDPI stays neutral with regard to jurisdictional claims in published maps and institutional affiliations.

