
Performance Evaluation of a PET of 7T Bruker Micro-PET/MR Based on NEMA NU 4-2008 Standards
by
 , , and
Kishore Krishnagiri Manoj Doss
1,
Pei En Mion
1,
Yu-Chieh Jill Kao
1,
Tsung-Ter Kuo
2 and
Jyh-Cheng Chen
1,2,3,* 1
Department of Biomedical Imaging and Radiological Sciences, National Yang Ming Chiao Tung University, Taipei 11221, Taiwan
2
Department of Medical Imaging and Radiological Technology, Yuanpei University of Medical Technology, Hsinchu 30015, Taiwan
3
School of Medical Imaging, Xuzhou Medical University, Xuzhou 221004, China
*
Author to whom correspondence should be addressed.
Electronics 2022, 11(14), 2194; https://doi.org/10.3390/electronics11142194
Submission received: 16 June 2022
/
Revised: 7 July 2022
/
Accepted: 11 July 2022
/
Published: 13 July 2022
/
Corrected: 20 September 2022
(This article belongs to the Special Issue Feature Papers in the Optoelectronics Section)
Abstract
:Purpose: This study aimed to measure the performance evaluation of the Bruker sequential micro-positron emission tomography/magnetic resonance imaging (PET/MRI) scanner by following National Electrical Manufacturers Association (NEMA) NU 4-2008 standards’ protocol. The system consists of a high-performance silicon photomultiplier (SiPM) advanced technology detector and a continuous lutetium-yttrium oxyorthosilicate (LYSO) crystal. Methods: A 22Na (sodium-22) point source was utilized to assess the spatial resolution and system sensitivity, and the Micro-PET scatter phantom measurements were conducted to measure count rate measurements and scatter fractions (SF). A mouse-like Micro-PET image quality (IQ) phantom was utilized as a model to analyze the uniformity, recovery coefficient (RC), and spillover ratio (SOR). A small animal PET/MRI imaging study was performed in a rat. Results: We calculated the spatial resolutions of filtered back-projection (FBP), and used 3D-MLEM to reconstruct PET images at the axial center and ¼ of the axial field of view (FOV) in axial, radial, and tangential directions. The best observed spatial resolutions in both reconstructed images were obtained in the tangential direction, and the values were 0.80 mm in 3D-MLEM and 0.94 mm in FBP. The peak noise equivalent count rate (NECR) in the 358–664 keV energy window was 477.30 kcps at 95.83 MBq and 774.45 kcps at 103.6 MBq for rat and mouse-sized scatter phantoms, respectively. The rat and mouse-sized phantoms scatter fractions (SF) were 14.2% and 6.9%, respectively. Conclusions: According to our results, the performance characteristics of the scanner are high sensitivity, good spatial resolution, low scatter fraction, and good IQ, indicating that it is suitable for preclinical imaging studies.
1. Introduction
PET imaging system is a vital tool for analyzing the functional and metabolic processes of the body in oncology, cardiology, and neurology. It is necessary to select the appropriate radioactive isotope to diagnose the subject in different regions in body, such as tissue and organs. Thus, radiotracers are a key component of PET imaging which can help to identify or study body lesions [1,2]. In preclinical study and medical applications, PET and MRI are investigated jointly as hybrid imaging modalities. Preclinical PET imaging studies have been significantly improved by using various new technologies, including SiPM [3,4,5,6,7]. Advanced SiPM-based PET technology can provide high-resolution information in brain imaging studies.
The benefits of using a preclinical PET system are many compared to a clinical PET system, including similarly high spatial resolution, good system sensitivity, less scatter, and fewer attenuation problems (due to smaller object size) [8]. Preclinical PET scanners afford high spatial resolution of objects such as rodents and phantoms. PET scanners need to be evaluated to characterize the machine’s performance and constraints. Micro-PET phantoms and small animals were used in our study as objects [9,10]. Preclinical MRI is a good means of visualization for studying small animals. The magnetic field strength of MRI systems in preclinical research that is most used is 7T [11].
The NEMA standard NU 4-2008 is an ideal testing method for preclinical PET scanners. Before this standard, preclinical PET systems had no standard examining methods [12,13,14]. Following the NEMA regulation is enough to estimate the performances of PET systems. For our research, we followed the NEMA NU 4-2008 standards to scan different phantoms, and performed various types of analysis methods, including uniformity, SOR, RC, SF, and NECR [15]. In addition to the NEMA phantom, we have studied the rat and mouse-like Derenzo phantoms to examine the spatial resolution with different sizes of rods.
2. Materials and Methods
2.1. System Characterization
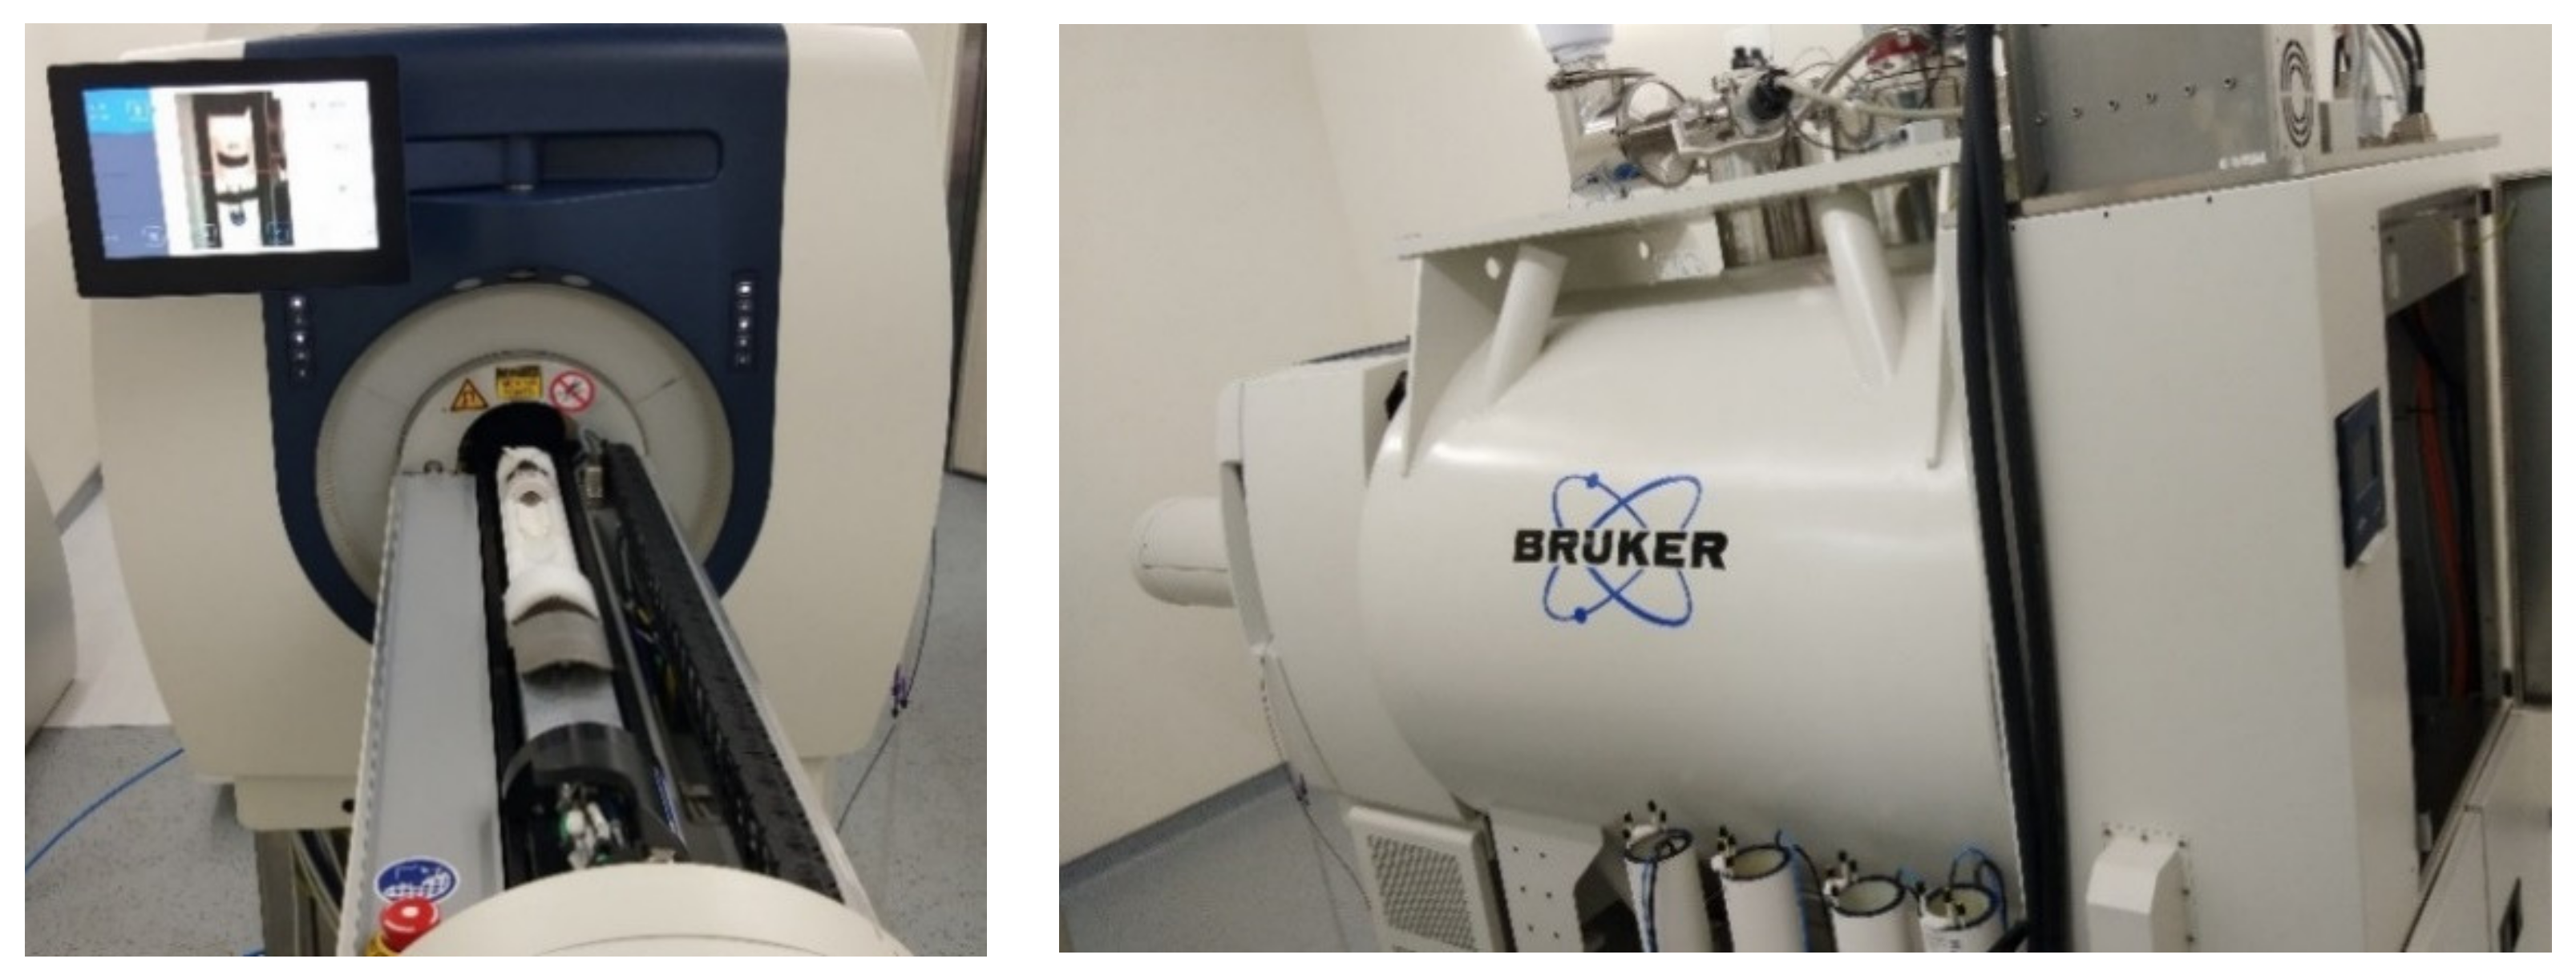
The manufacturer of the small animal 7T PET/MRI is Bruker BioSpin MRI GmbH, Ettlingen, Germany, the type of PET system for the PET/MRI is PET Inline, and the manufacturer’s model name for the MRI is Bruker BioSpec 70/18 Ultra Shielded and Refrigerated (USR). Figure 1 exhibits a picture of our Bruker small animal 7T PET/MRI machine, Ettlingen, Germany. The scanner consists of a patented continuous LYSO crystal [4,16,17] instead of traditional pixelated crystal. It is a stationary system that contains three detector rings in a cylindrical shape. In each ring, there are eight crystals arranged in an octagonal shape. Every crystal in the PET system is shaped like a truncated pyramid, with a 50 × 50 mm base, 48 × 48 mm top, and 10 mm depth. The LYSO crystal depth is segmented into ten layers for depth of interaction (DOI) correction. Parallax errors can be avoided by applying DOI information. This system has advanced high-performance solid-state-based photomultiplier technology called SiPM [18,19,20]. The photon multiplier element/crystal count is 12 × 12 = 144. A SiPM panel is coupled with every crystal block with a gap of 0.5 mm. The transaxial FOV diameter of the system is 80 mm, the axial FOV is 150 mm, and an inner ring diameter is 105 mm.
Moreover, scatter, random, isotope decay, dead-time, and attenuation corrections can be applied beforehand and afterward to the images. The PET data are recorded in list mode (lm) or raw data format. It helps to analyze the data during an examination. The primary reconstruction method of the system is 3D-MLEM. The MLEM algorithm is implemented on an ultra-fast 4×GPU reconstruction. The software in the system allows the user to select the different voxel sizes in the reconstruction method. There are three voxels available: 0.25, 0.50, and 0.75 mm. The energy window was kept to 30% (358–664 keV), and the coincidences timing window was 12 ns for all phantoms and animal measurements.
Bruker MRI systems offer excellent performance for translational research on small animals with a high magnetic field, dedicated fast and strong imaging gradients, and application-optimized radio frequency (RF) coils. The SiPM works at low voltage, is non-vulnerable to the magnetic field, and is more compatible with the MR part. The high-field magnets has a free accessible bore size of 18 cm, and the magnetic field strength is 7 Tesla. Consequently, this makes it possible to study small animals with a greater signal to noise ratio (SNR). Gradient strength is up to 900 mT/m. Table 1 lists the technical specifications of the Bruker sequential preclinical PET/MRI system. We used NEMA standard phantoms and Micro-PET Derenzo phantoms for our experiments, as seen in Figure 2.
2.2. Spatial Resolution
Spatial resolution is a fundamental measurement for analyzing the performances of PET systems. We calculated the spatial resolution values of the scanner from data obtained from the 22Na point source. A 0.25 mm diameter point source was enclosed to a 1 cm3 cube of acrylic. Before beginning the measurements, the point source’s radioactivity was calibrated, and was found to be 0.379 MBq. We gently held the source in the source holder and connected the holder to the bed. Then, the source was well positioned at two axial locations, namely, axial center and ¼ axial FOV from the center, at the pursuing radial intervals: 0, 5, 10, 15, 25, and 35 mm [21,22]. At each position, data were collected for 10 min. The spatial resolution was not measured at 20 and 30 mm positions because the source holder could not hold the source at these positions.
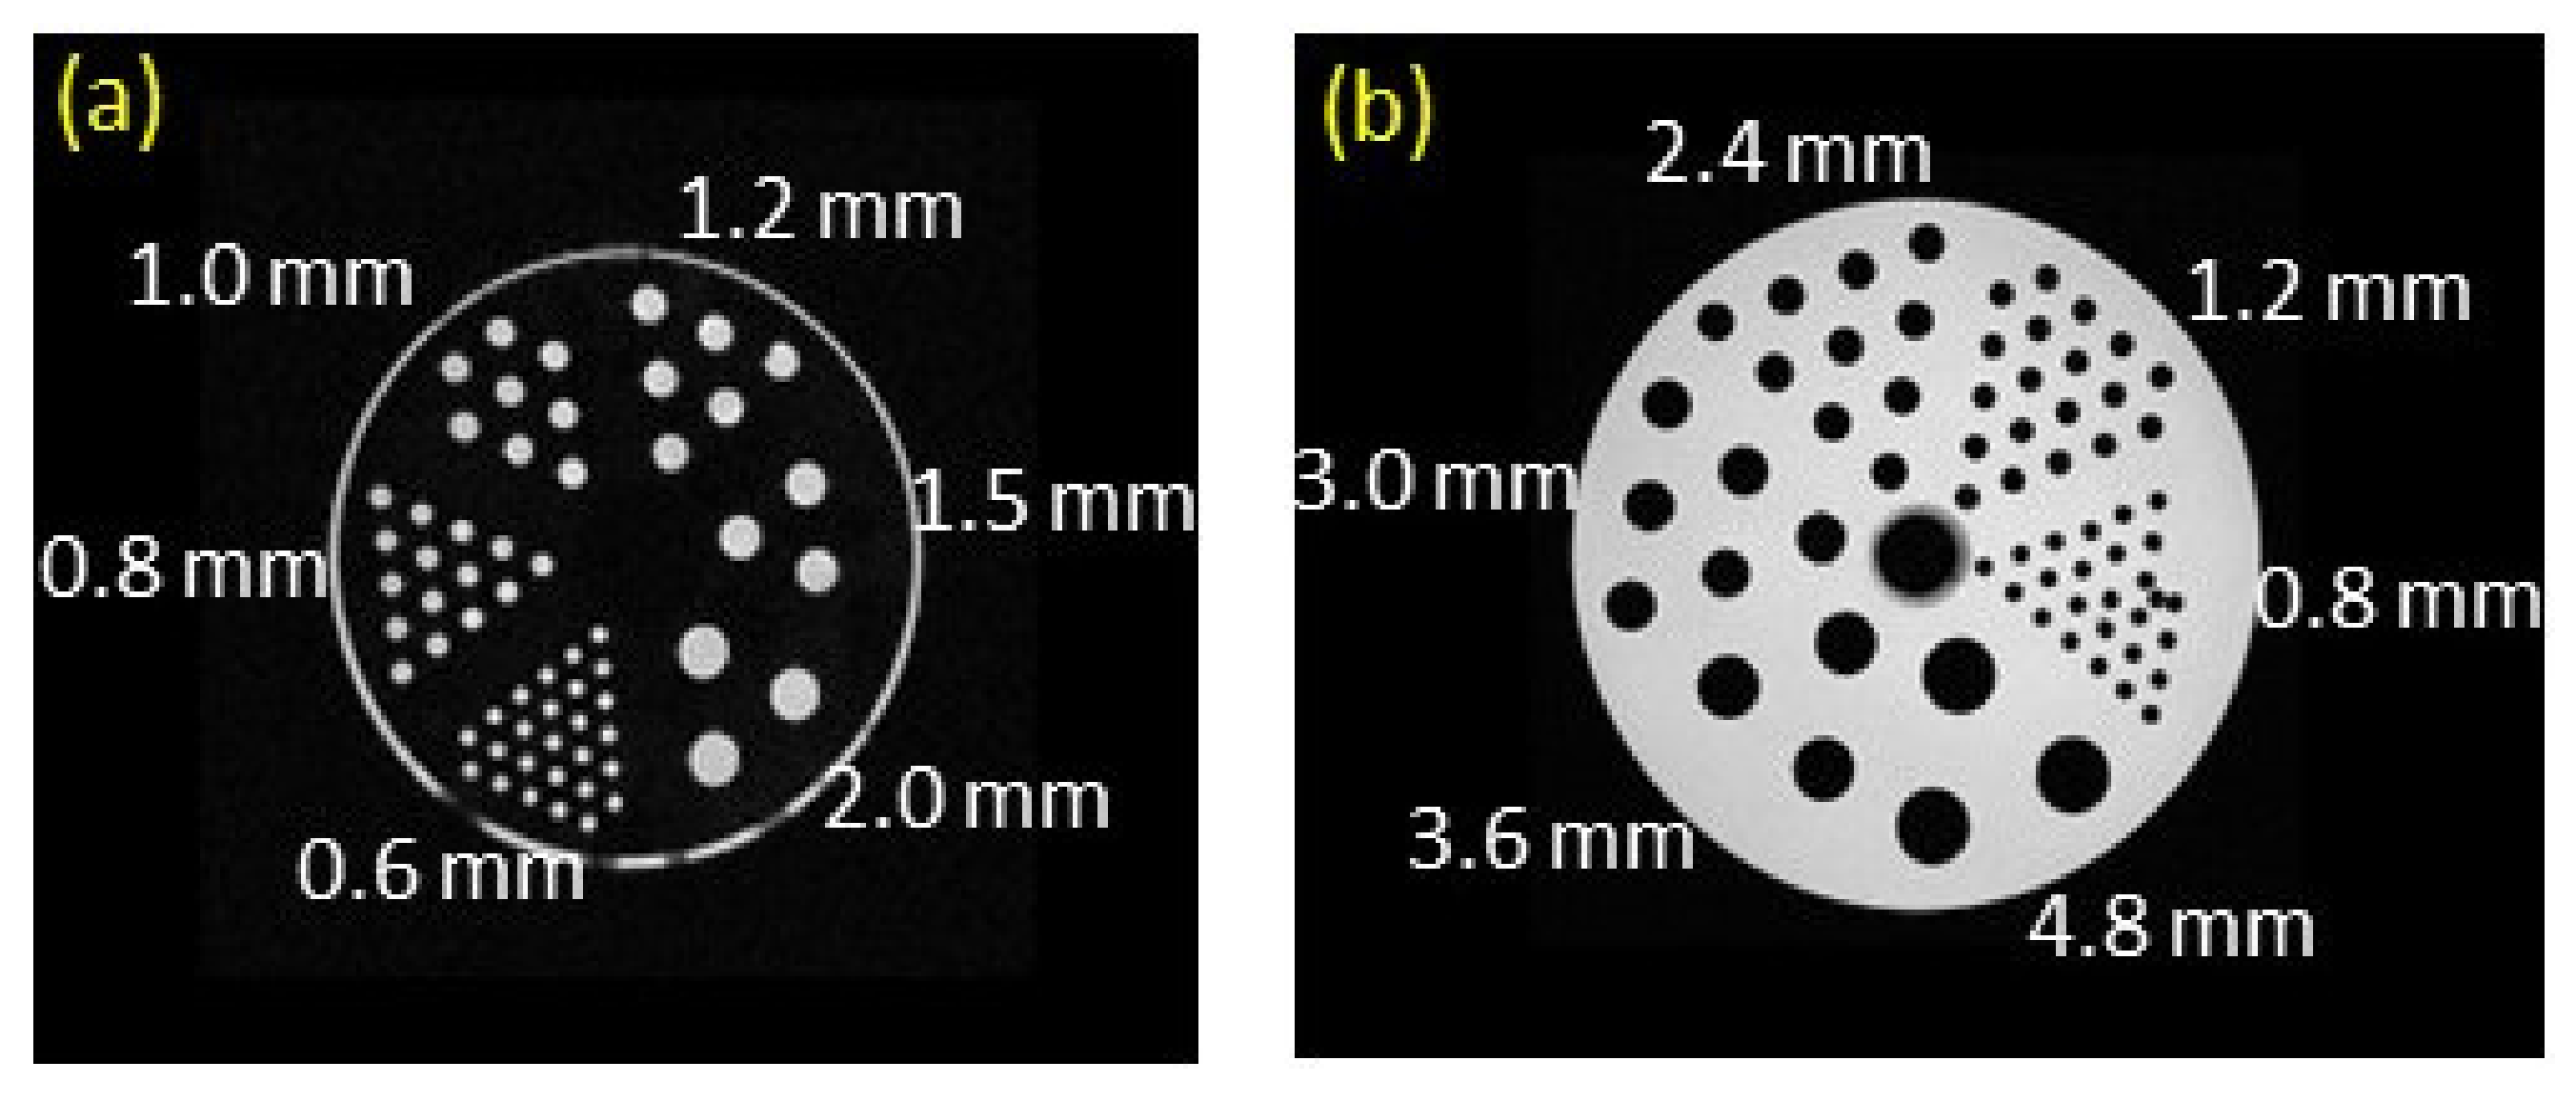
We also analyzed the system’s spatial resolution by using two different sizes of Micro-PET Derenzo phantom. The diameters of the holes in mouse and rat-sized phantoms are 0.6, 0.8, 1.0, 1.2, 1.5, and 2.0; and 0.8, 1.2, 2.4, 3, 3.6, and 4.8 mm, respectively. Figure 2a,b shows pictures of the Micro-PET Derenzo phantoms. We administered a small amount of 18F-FDG radioactivity in both mouse and rat-typed phantoms, and during the acquisition time of 10 min, the phantoms had radioactivity of 10.5 and 17.3 MBq, respectively. Reconstruction of the PET images was performed using 18 iterations of the 3D-MLEM algorithm. The reconstructed image matrix size was 320 × 320, pixel spacing was 1 mm, and slice thickness was 0.25 mm.
Following the NEMA standards, we calculated the spatial resolution. The list-mode (lm) dataset was acquired at the center and ¼th FOV, and sorted into a 3D dataset. Three-dimensional (3D) images were rebinned with the single-slice rebinning method (SSRB). The 2D datasets were obtained after the rebinning, and then we applied the two-dimensional filtered back-projection algorithm (2D FBP) to the 2D datasets [23]. We also calculated spatial resolution in 3D-MLEM-reconstructed images compared to FBP-reconstructed images.
Based on the general Gaussian model shown in Equation (1), we calculated the spatial resolution values, where a is an amplitude, is the standard deviation obtained from the fitted function, and b is the mean of the distribution; and we used Gaussian fitting to fit the to measure the full-width half maximum (FWHM), as expressed in Equation (2).
2.3. Sensitivity
For sensitivity measurement, the 22Na source was mounted at the axial center of the FOV of the scanner. The activity of the point source used for the observation was very low (0.379 MBq). The source was axially moved to one end from the center of the scanner using an animal positioning tool, and then the source stepped into another end of the axial center of FOV. Then, following the NEMA protocol, the system sensitivity was calculated.
where Si is the system sensitivity of slice i, SA,i is the absolute system sensitivity, Ri is the count rate of slice i, Acal is the source activity, and RB,i is the background count rate of slice i. The branching ratio of a 22Na source is 0.906.
2.4. Count Rate Measurements and Scatter Fraction
We acquired emission scans of NEMA standard scatter phantoms to quantify the count rates. Our research evaluated SF and count rate performance using two dissimilar sizes of phantom, mouse and rat type scatter phantoms, and we analyzed the phantoms based on the NEMA standard [6,24,25,26].
The phantoms consist of high-density polyethylene (HD PE) material. The diameter of the mouse-type phantom is 25 mm, and its length is 70 mm. The rat-type phantom’s diameter is 50 mm, and its length is 150 mm. There is a cylindrical bore for placing the line source; the diameter of the bore is 3.2 mm, which is drilled 10 mm (mouse) or 17.5 mm (rat) straight through the center of axis, as shown in Figure 2d. The carbon-11 radioactivity was used, and filled from one end and sealed at the other end to avoid leakage of radioactivity. Following injection of the tracer into the flexible tube, we inserted the line source inside the bore, blocked both ends, and then scanned the phantoms. The line source in the phantom was positioned closest to the bed. We calibrated the radioactivity levels before and after every scan by placing the line source in the well counter. The initial activity of the mouse-like scatter phantom is 336.30 MBq, and it is 541.31 MBq for the rat-like scatter phantom [27,28,29,30,31].
At the end of the experiment, the radioactivity measured in both phantoms went below 0.1 MBq. The time given for every acquisition was one minute, and we used a 10 min time gap for each acquisition for both phantoms. We noted the level of activity before every acquisition. The sum of all the count rates in a sinogram determines the total count rate. We calculated the SF by taking the ratio of scatter count rate to the sum of scattered coincidence and true count rates, assuming that there are a number of random events that occur, though less than 1% of all true events. In order to calculate the activity of inbuilt scintillation material of the scanner, we measured the intrinsic count rate for three minutes without radioactivity in the measurement phantoms. The SF and NECR were calculated using Equations (5)–(7).
where Rtotal, Rtrue, Rscatter, Rrandom, and Rint are total, true, scatter, random, and intrinsic count rates.
Rscatter = Rtotal − Rtrue − Rrandom − Rint
2.5. Imaging Studies
2.5.1. NEMA Micro-PET IQ and Derenzo Phantoms Used for PET Imaging
We assessed the image quality using Micro-PET image quality phantoms. The phantom comprises a cylindrical shape of polymethyl methacrylate (PMMA) material. The phantom consists of a large chamber in the first half of the cylinder that can be filled with isotopes to calculate uniformity. The fillable isotope region is called the hot region. The volume of the large chamber also has two smaller cavities. In those cavities (cold region), water and air were present. SOR can be measured in these cavities. It also contains five fillable hot rods interconnected to the first half of the phantom with diameters of 1, 2, 3, 4, and 5 mm, respectively, as shown in Figure 2c. These hot rods regions were used to calculate the RC as a function of rod diameter. FDG solution was infused into the IQ phantom and scanned for 20 min at the scanner’s isocenter. We reconstructed the list-mode data using 18 iterations of 3D-MLEM. The image analysis of the phantom, such as uniformity, RC, and SOR, were calculated using Equations (8)–(11). A micro-Derenzo phantom with very low radioactivity and a short acquisition time (30 s) was used for the measurements. However, the results indicate that the amounts of radioactivity and scanning time were not sufficient to visualize the rods in the phantoms.
where %STD is a percentage standard deviation.
2.5.2. Micro-PET Phantoms Used for MRI Imaging
For MRI imaging, we utilized the micro-PET Derenzo and image quality phantoms. Following the PET acquisition, the phantoms with an injected 18F-FDG radiotracer were moved to the MRI system. The phantoms for PET are not suitable for evaluating the quality of MR images. Due to the lack of a proper MRI phantom for the measurements, we used PET phantoms to obtain the MRI scans to assess their quality. The purpose was simply to view the MRI images using PET phantoms. MRI image resolution was good, even with PET phantoms. In MRI, the phantoms were scanned for around 12 min, and the T1-weighted images were formed with short repetition times (TR) and short echo times (TE). TR and TE were 5 and 2.4 ms for IQ phantoms; TR and TE were 50 and 8 ms for Derenzo phantoms. The slice thickness of images was 0.25 mm.
2.5.3. Animal Studies
We performed a small animal study with our scanner. A healthy rat was injected with 0.3 mL of saline and 38.9 MBq of 18F-FDG radiotracer passed into the tail vein of the animal. The rat was 23 cm in length and 375.3 g in weight, and the animal was kept inside an acrylic cage for 45 min after the administration of radioactivity. The PET scans were performed for 15 min. During the animal experiment, oxygen and isoflurane (anesthesia gas) were administrated to the animal. PET data were analyzed and reconstructed by 3D-MLEM with 18 iterations.
After proceeding with PET scan, we performed a T1 weighted MRI scan with a short TR of 5 ms and a TE of 2.4 ms. The slice thickness of T1-weighted images is 0.75 mm.
3. Results
3.1. Spatial Resolution
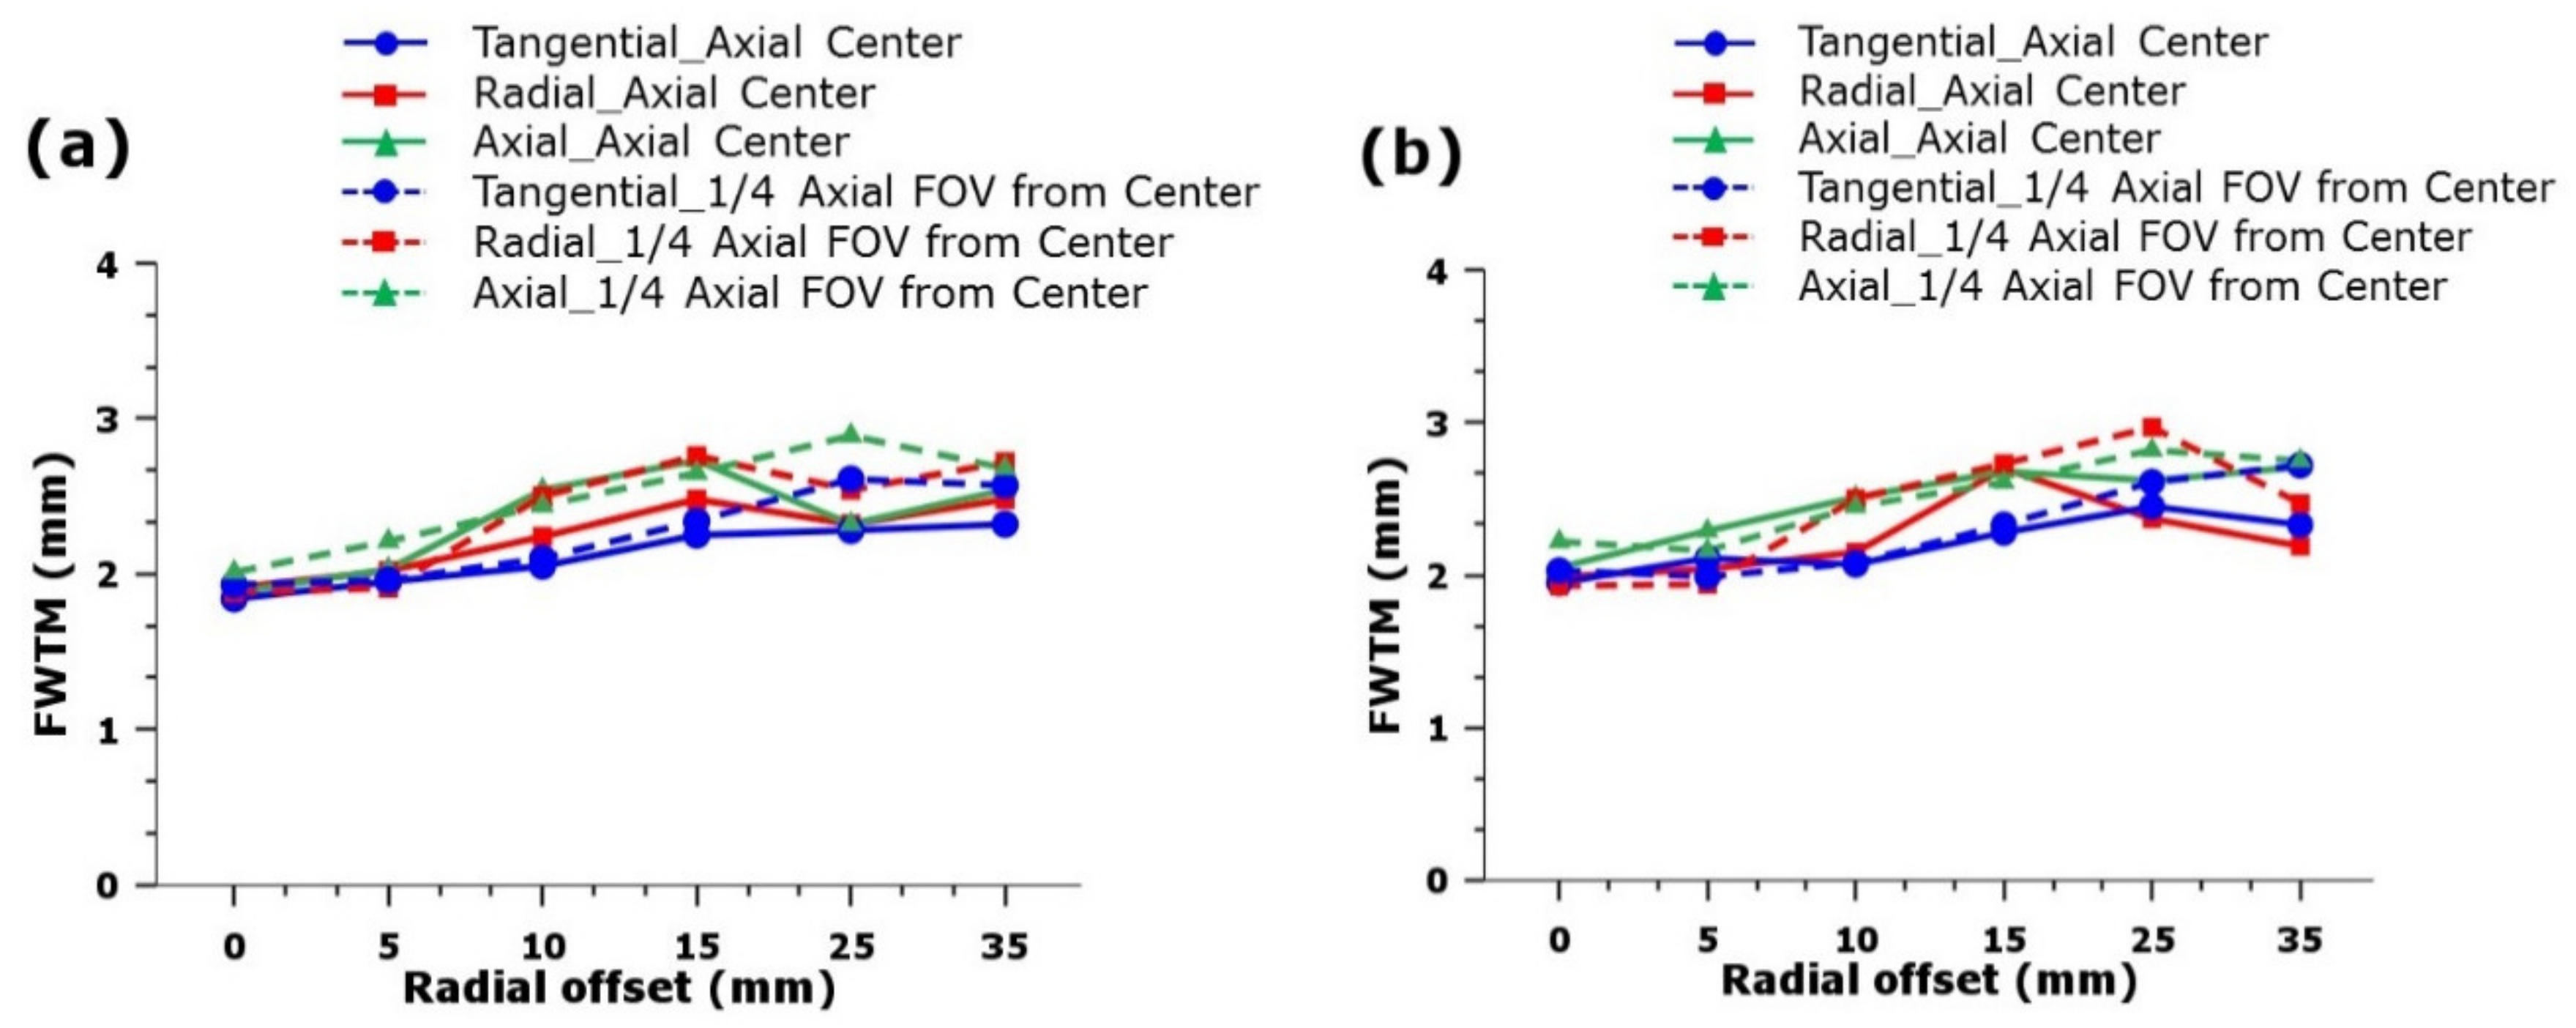
We quantified the spatial resolution of the system utilizing a sodium-22 point source to determine the resolution from 3D-MLEM and FBP-reconstructed images in three directions: tangential, radial, and axial. The FWHM values obtained at the axial center in all three directions of 3D-MLEM-reconstructed images ranged from 0.80 to 1.07, 0.90 to 1.12, and 1.01 to 1.27 mm; and the resolutions of FBP-reconstructed images ranged from 0.94 to 1.11, 1.0 to 1.27, and 1.12 to 1.38, within the radius of 35 mm. Furthermore, we applied Gaussian fitted functions to the data to calculate accurate spatial resolution values from the reconstructed images. The calculated FWHM and full-width tenth maximum (FWTM) results are plotted in the Figure 3 and Figure 4.
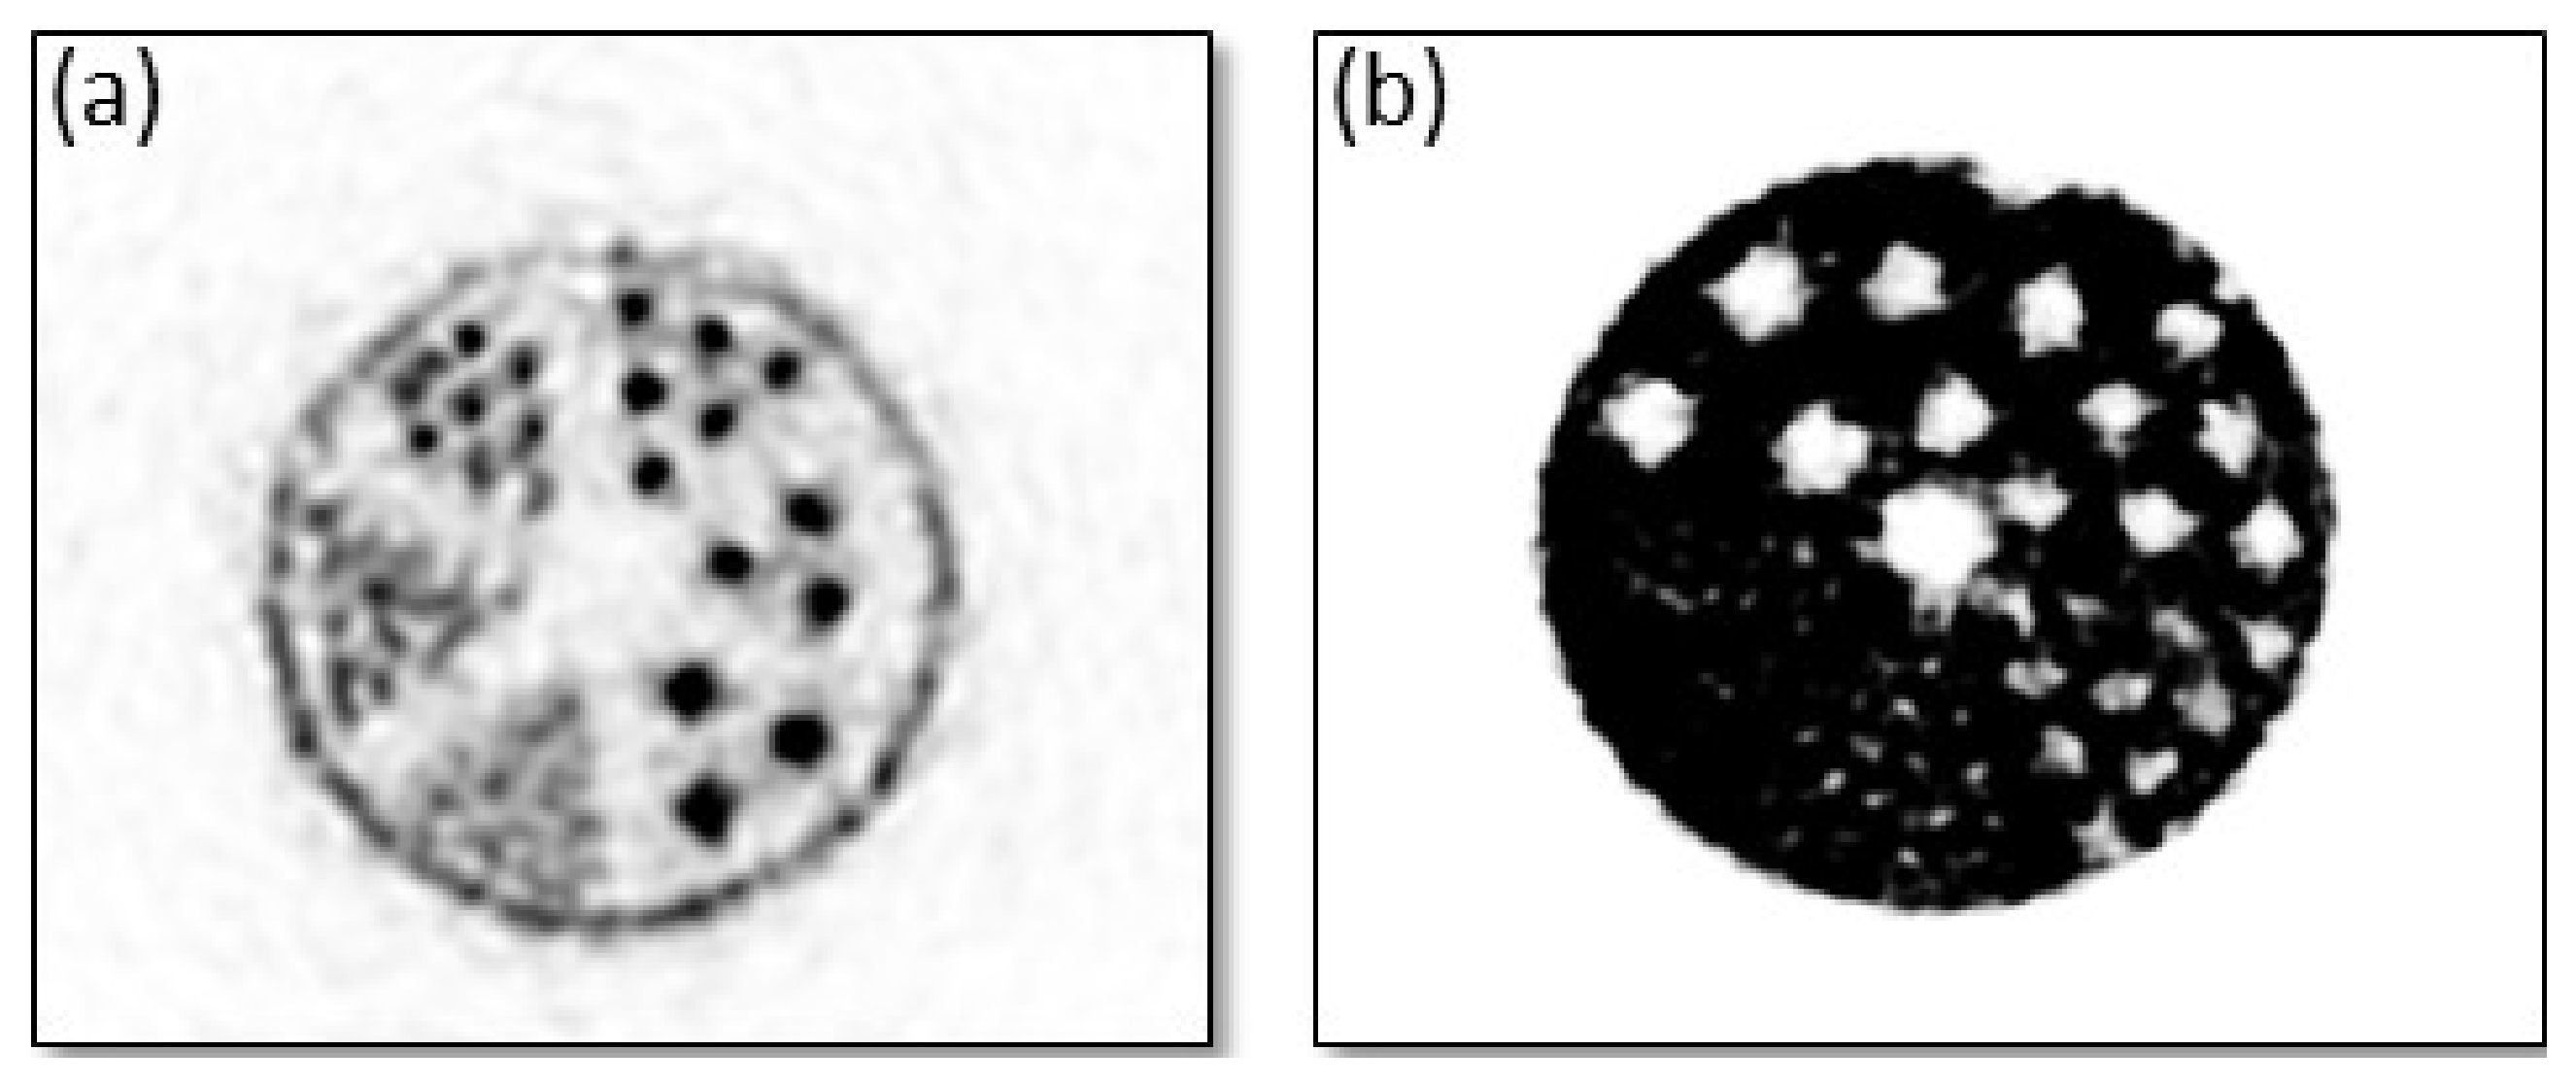
Figure 5a,b shows the spatial resolution of reconstructed images using different sizes of rods with a low dose of radiation injected into mouse and rat-like Derenzo phantoms. Figure 5a represents hot rod slice from the mouse-like Derenzo phantom, and Figure 5b illustrates the cold rod slice from the rat-like Derenzo phantom. The slice thickness of the images is 0.25 mm. We used 3D-MLEM reconstruction methods with a 5 min acquisition time. Figure 6a,b shows MRI images of Derenzo phantoms.
3.2. Sensitivity
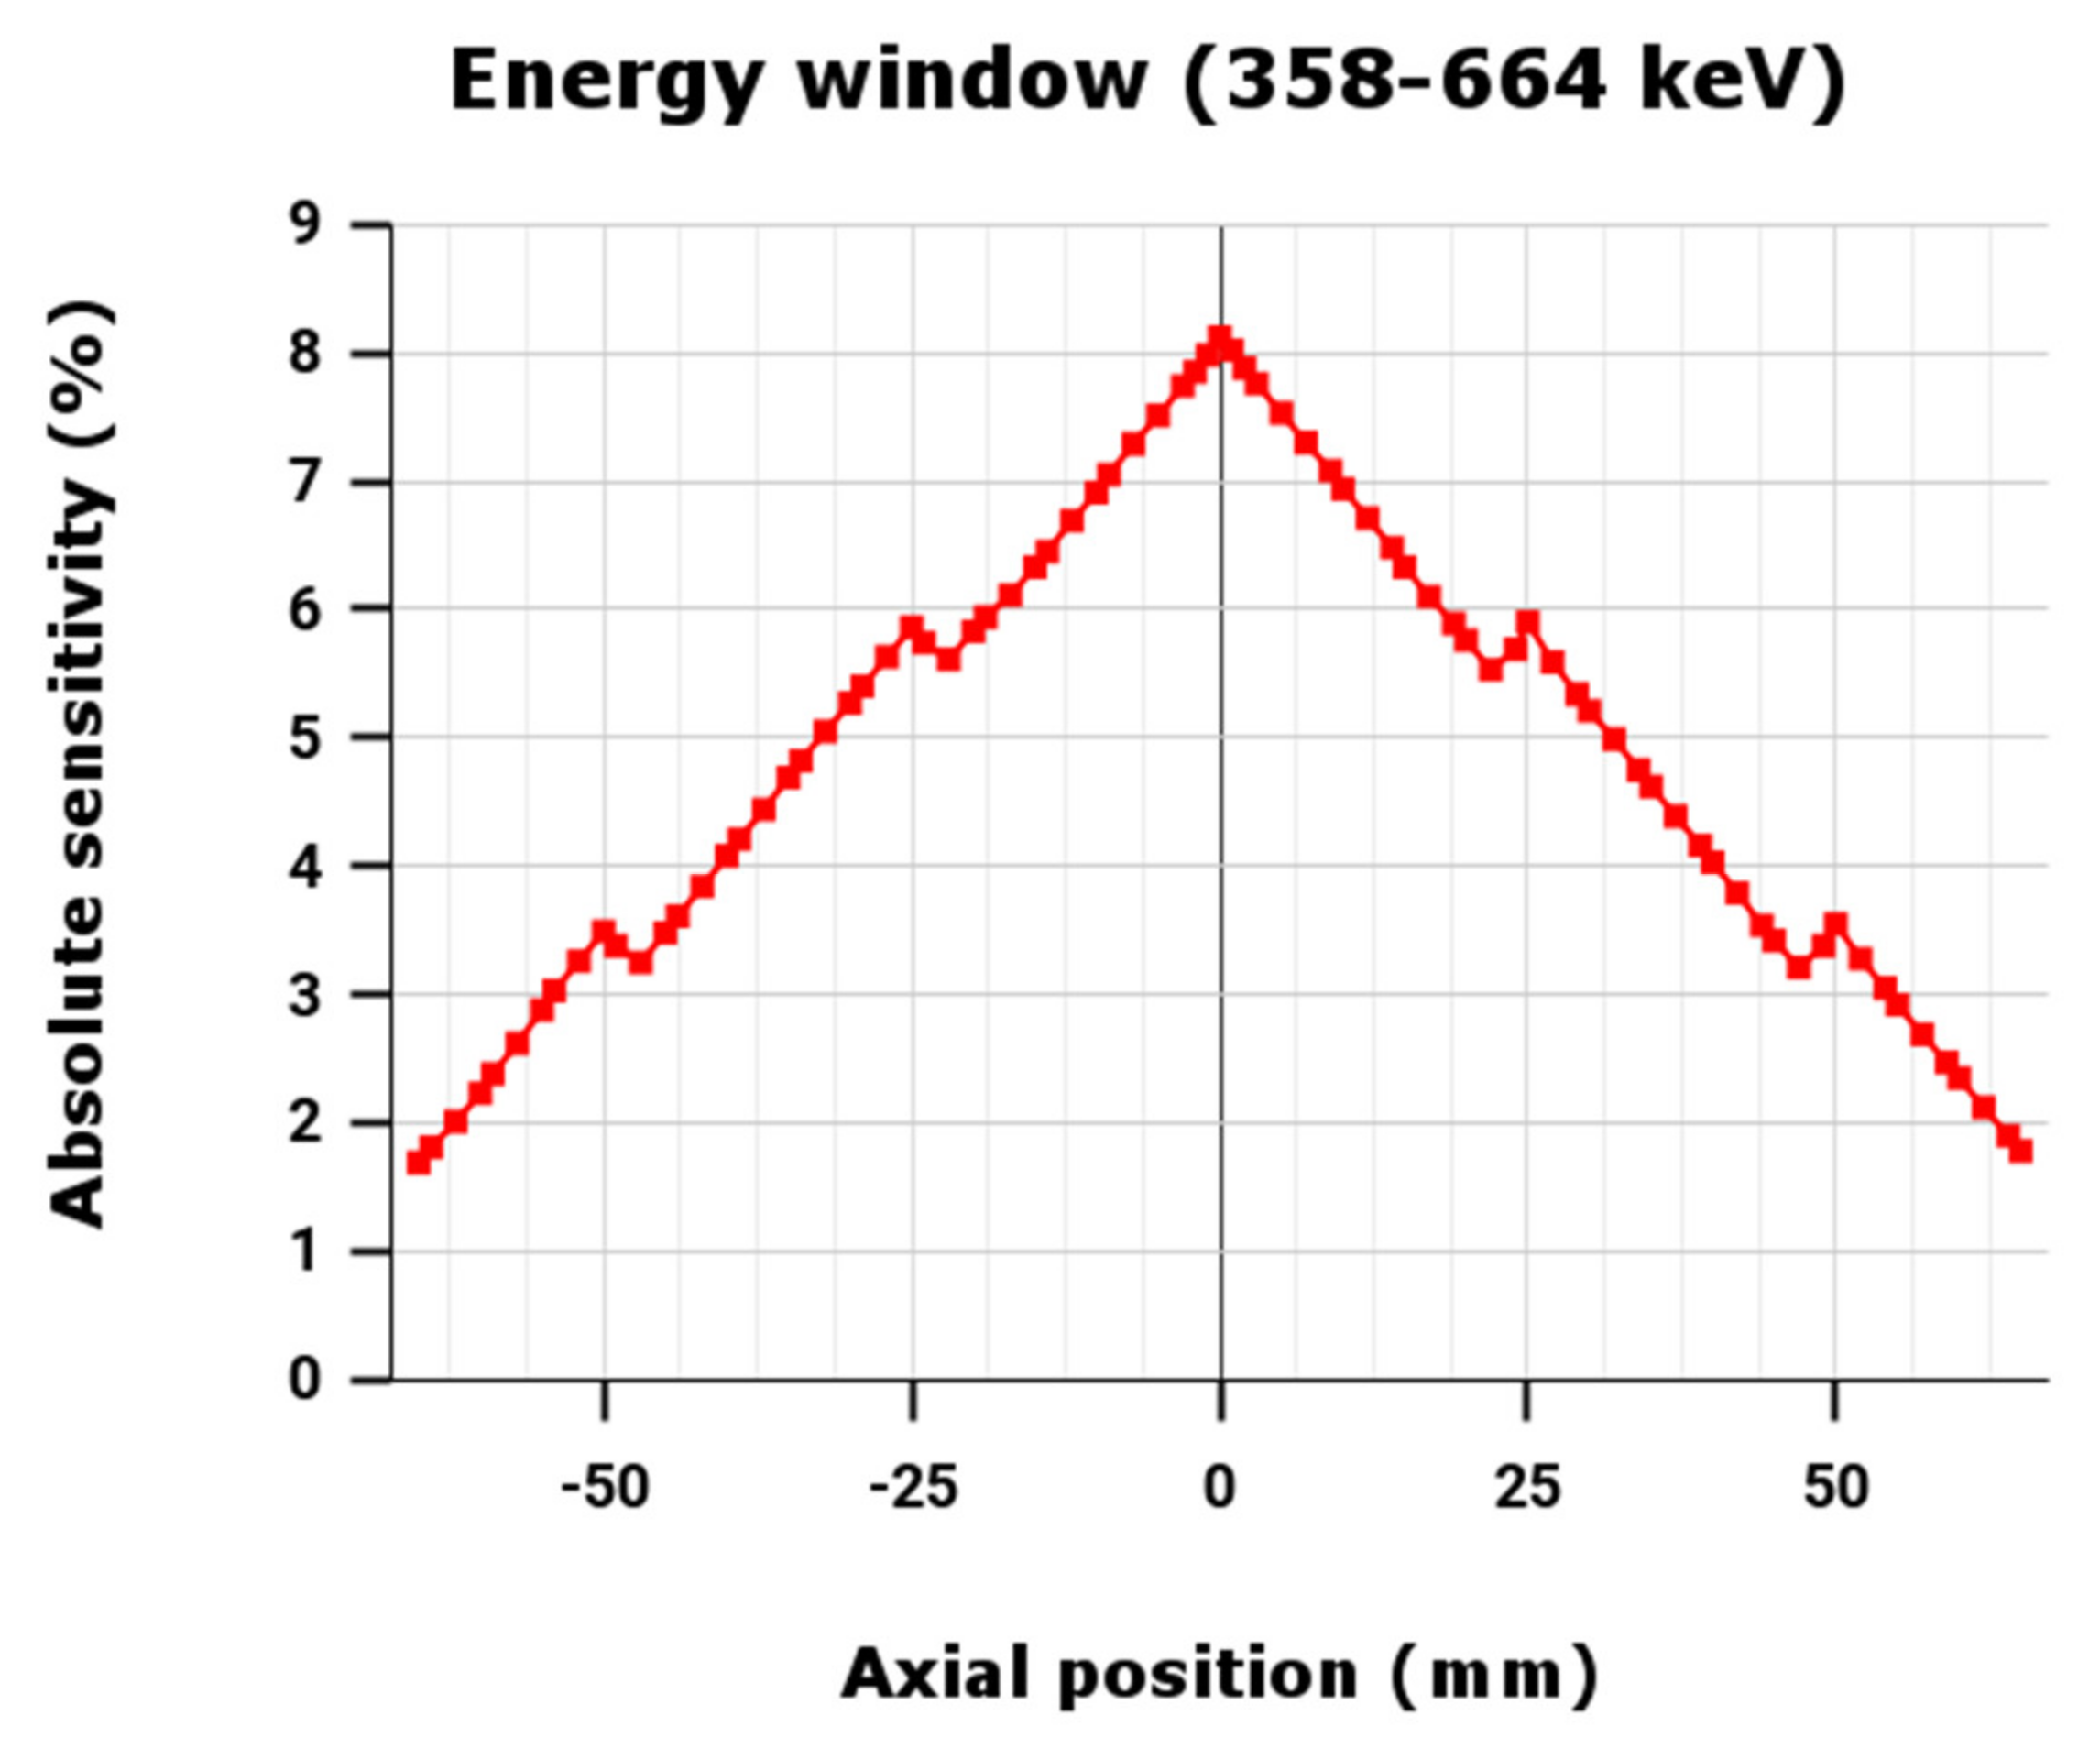
The system absolute peak sensitivity is 8.1% at the center of the FOV, and maximum sensitivity is 0.073 cps/Bq at a 358–664 keV energy window with a 12 ns timing window. There are four outer peaks corresponding to the center of the remaining two rings. At the edges, the sensitivity profile did not reach zero. It is because we moved the source from 0 to 65 mm. The maximum FOV is 150 mm. Therefore, the source must move 75 mm from either end to fall to zero. Figure 7 shows axial absolute sensitivity profile of the system.
3.3. Count Rate Measurements and Scatter Fraction
Before calculating the SF and count rates, the original data (list-mode data) had to be converted into a sinogram, and then the values were measured using the formulas described above.
We measured the count rates without applying any correction methods to the data. The peak NECR and total count rate values for mouse and rat-sized scatter phantoms were 774.45 and 1298.49 kcps at 103.6 MBq, and 477.33 and 1220.49 kcps at 95.83 MBq, respectively. The SF was 6.9% for the mouse-type phantom and 14.2% for the rat-type phantom in the 358–664 keV energy window. The system count rates of mouse and rat-like scatter phantoms, such as total, true, scatter, random, and noise equivalent, are charted as factors of activity (MBq) in Figure 8a,b.
3.4. Imaging Studies
3.4.1. NEMA Micro-PET Image Quality Phantom Study
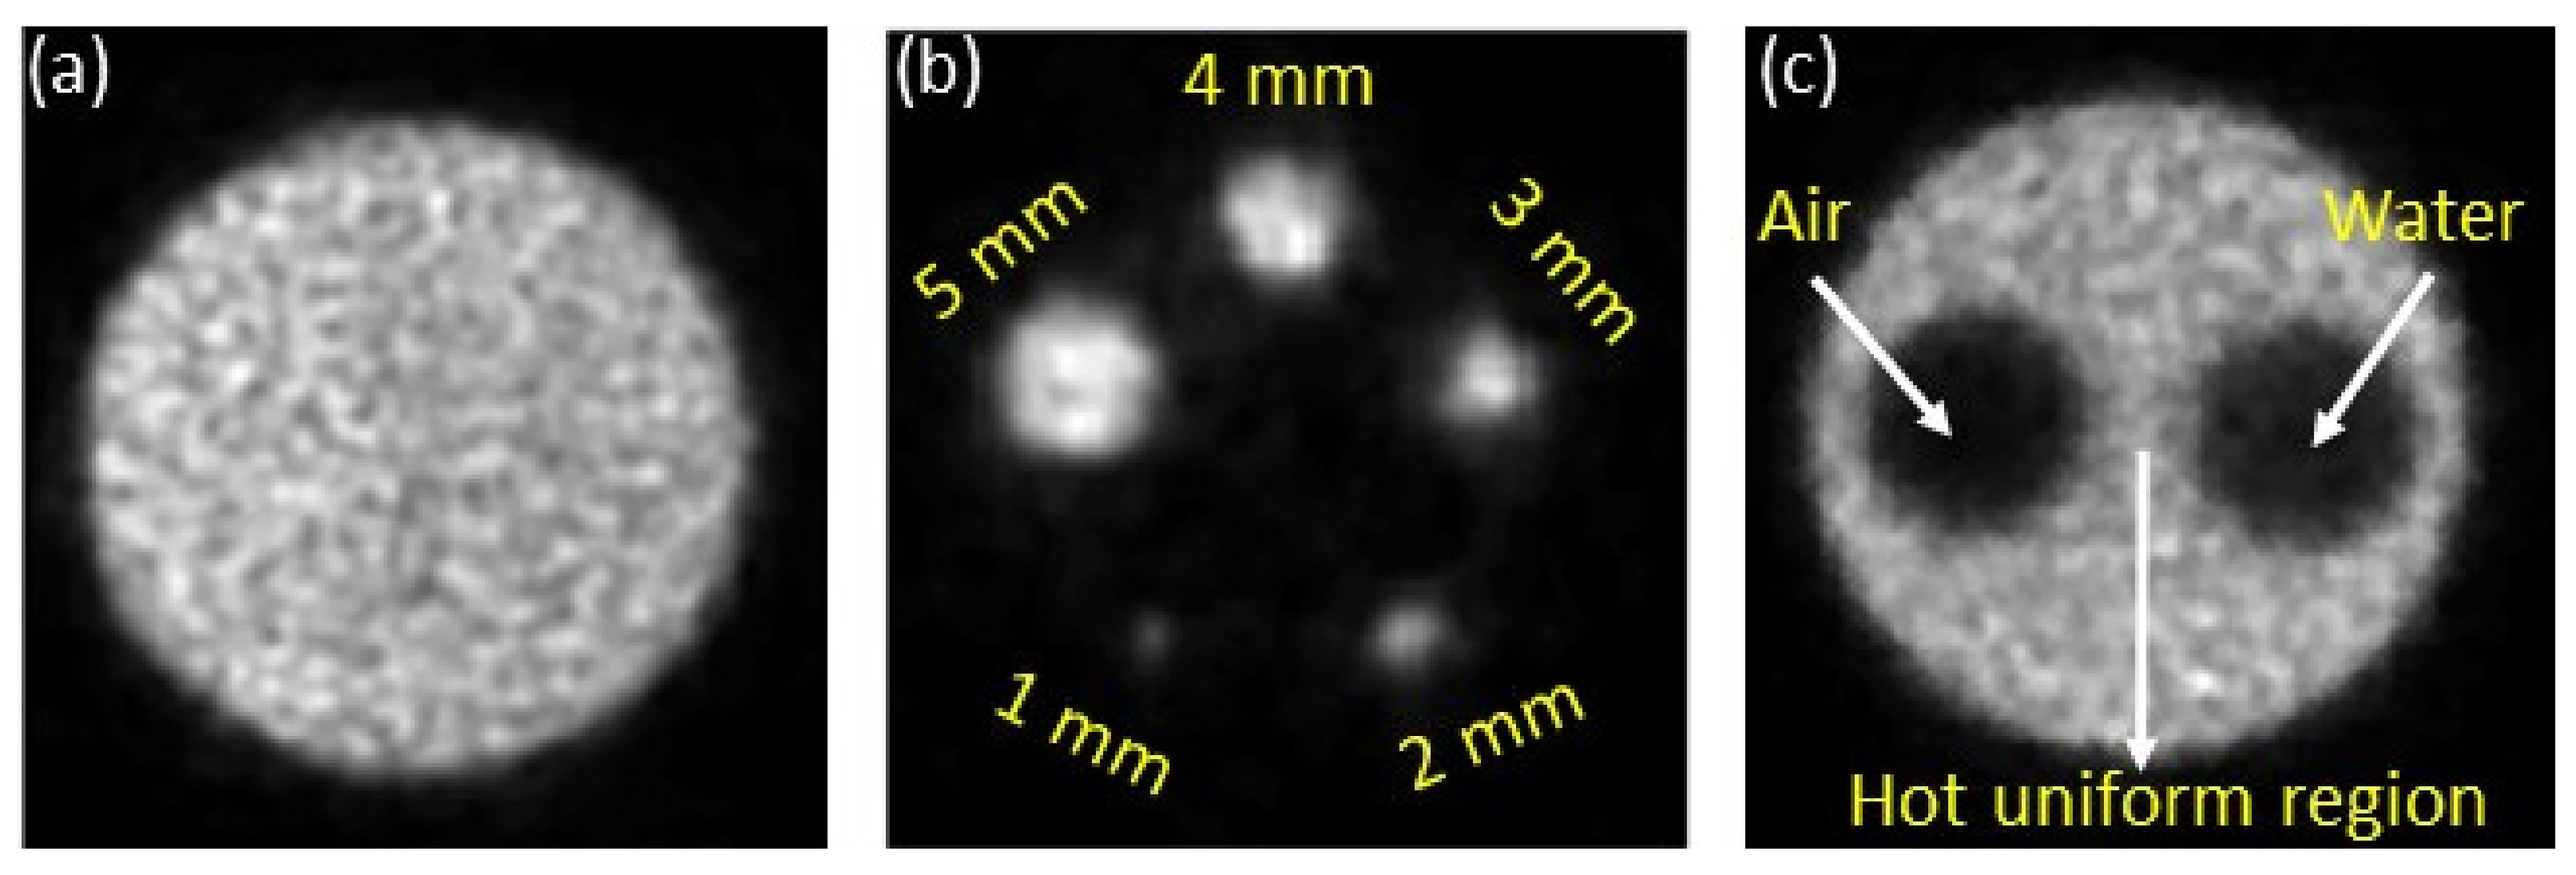
Figure 9 exhibits the uniform region’s transverse plane and five rods of the NEMA standard Micro-PET mouse-sized IQ phantom. For uniformity calculations, a diameter of 22.5 mm (75% of effective diameter) and 10 mm length of the cylinder volume of interest were figured at the center FOV uniform region of the IQ phantom. The data from the uniform area in Figure 9a were averaged, and the minimum and maximum activity concentration amounts in the volume of interest (VOI) region were also measured, and then the percentage of standard deviation was calculated. The calculated uniformity values are tabulated in Table 2.
The RC values were calculated from Figure 9b. The size and diameter values of the rods are labelled in Figure 9b. The smallest rod (1 mm) value was 0.17, and biggest (5 mm) was 0.94. The RC values of each rod are given in Table 3. We used 3D-MLEM to reconstruct the images with 18 iterations. The percentage standard deviation values of five different rods were 28.4% (1 mm), 17.7% (2 mm), 14.2% (3mm), 9.3% (4 mm), and 7.2% (5 mm). The regions of interest (ROI) have been drawn on the cavities of IQ phantom. To circle the central 7.5 mm in length, we selected 30 slices, and then measured the mean values in both cold and hot regions. The diameter of the ROI was 4 mm, and the thickness of each slice was 0.25 mm. Here, the hot region was uniform, and the cold regions were cavities (water and air). The hot and cold regions are marked in Figure 9c.
The standard deviation and spillover ratio were calculated using NEMA NU-2008 equations. The calculated SOR values were 0.17 for the water-filled chamber and 0.14 for the air-filled chamber. The standard deviation values were 24.7% and 28.2% for air and water-filled sections. The SOR values were calculated and tabulated in Table 4. Table 5 compares the image quality of Bruker’s small animal PET scanner with other preclinical scanners.
3.4.2. NEMA Micro-PET Image Quality Phantom Study
Figure 10 represents transverse slice MRI images of the image quality phantoms. The smallest rods are clearly visible, as we can see in MRI images from both IQ and Derenzo phantoms. The resolution of the MRI image is good because of the high magnetic field strength, so it can enable a good signal-to-noise ratio (SNR).
3.4.3. Animal Studies
Figure 11 shows the three different planes of PET and MRI and PET/MRI fused images of the small animal. We used PMOD software for the fusion process of PET and MRI images.
4. Discussion
According to NEMA NU4-2008 standards, the performance of the Micro-PET system was evaluated. The standard protocols are necessary to improve the scanner’s geometries, compare the scanner’s performance result with the different preclinical PET systems, or update information on new technologies in the scanner. We followed this standard protocol and analyzed the image quality, scatter fraction, and NECR measurements. The multimodality preclinical imaging improved and solved several limitations in the imaging. A combination of PET and MRI mainly provides functional information in PET and structural information in MRI with greater spatial resolution.
Moreover, NEMA standards assume that the scanner’s best spatial resolution is in the area around the center, corresponding to the cross-section of its axial and transaxial FOV. The system’s spatial resolution varies based on the scanner geometry, and it can also differ for scanners obtaining non-cylindrical arrangements of detectors and non-pixelated designs of detectors. Following the protocol, we should place the source at the center of scanner, not at center of the individual ring. Detectors with two rings have challenges achieving best spatial resolution at the center of scanner. Suppose the system with 1 or 3 detector rings can achieve best spatial resolution at the axial center of the scanner. A three-ring system will have the second ring as its center; in a one-ring system, there will be no other ring, so that the first ring will meet its resolution at the center. Therefore, the 2-ring Bruker Albira PET [17] has no ring differences in spatial resolution at the center, which is why the best spatial resolution cannot be obtained in the center of scanner. In contrast, our Bruker scanner consists of three rings, so the best spatial resolution is found at its axial center.
The PET system consists of a monolithic LYSO crystal with dimensions of 40 × 40 × 10 mm, combined with multi-anode photomultiplier tubes (MA-PMT) and DOI measurements. FWHM values will improve more by pairing LYSO crystals with advanced PMT technology (SiPM) and DOI information than by using the pixelated crystal PET scanner [16]. As part of the spatial resolution calculation, a Gaussian fitting function was applied to fit the profile curve of data. These functions were involved in all three directions, namely, tangential, radial, and axial directions. The resulting spatial resolution of 3D-MLEM PET reconstructed images is good at the axial center. We observed that the spatial resolution values at 0 mm radial offsets in the MLEM-reconstructed images did not cross greater than 1 mm at axial center and at ¼ axial FOV from center in radial and tangential directions. DOI information improved the quality of PET images, resulting in improved spatial resolution values in both tangential and radial directions. The contribution of DOI measurements improved the results of the PET system without compromising the properties of PET imaging, especially spatial resolution and sensitivity. We compared the image quality results to those of other preclinical scanners, and the values are summarized and plotted in Table 5. We scanned the image quality phantom based on the settings and parameters available to our scanner.
The reconstruction methods and correction factors were not the same as those used by all systems. During the image quality tests, no attenuation and scatter corrections were applied in four other imaging systems: IRIS PET/CT [32], VrPET/CT [35], LabPET-8TM [36], and XTRIM-PET [7], as displayed in Table 5. We used different data reconstruction methods, such as 2D and 3D-OSEM. In the FLEX triumph X-PET [33], only attenuation is performed, the scatter correction is not taken into account, and two different type of reconstruction algorithm are used, 2D-FBP and 2D-OSEM. Inveon [30], Argus PET [34], MetisTM PET/CT [37], LFER 150 PET/CT [38], and Bruker PET/MRI both apply corrections in their data, but their reconstruction techniques are different—e.g., FORE + 2D FBP (Inveon), 3D-OSEM (Argus PET and Metis PET/CT), 2D-MLEM (LFER 150 PET/CT), and 3D-MLEM (Bruker PET/MRI)). The image quality test’s reconstruction algorithms and correction factors strongly affect the results. As a result, our scanner is better than other systems in terms of %STD for uniformity at 8.8%; spillover ratio is 24.7% (air) or 28.2% (water). Overall, the performance results of our preclinical scanner were better than those of other preclinical scanners, since we used standard reconstruction methods and correction factors.
In a 358–664 keV energy window, the absolute sensitivity of our scanner is 8.1% at the center of the FOV. Considering the same energy window in other scanners, peak absolute sensitivity is 4.1% in the 2-ring Bruker Albira PET [17] and 6.7% in the 3-ring Albira PET [39]. This shows that our scanner has higher sensitivity at the center of FOV in the 358–664 keV (30%) energy window. Although we did not analyze the sensitivity of our scanner in a 50% (255–767 keV) energy window, we assume that it will improve sensitivity in a 50% energy window.
Owing to the continuous LYSO crystal, there were no high variations in the sensitivity profile. If the scanner’s sensitivity is increased, the NECR values will significantly improve. The true event rate for the rat was 763.25 kcps, and for the mouse was 1002.81 kcps, and the SFs were 6.9% for the mouse and 14.2% for the rat, which are adequate in small animal studies. The NECR at 3.7 MBq in rat and mouse-like scatter phantoms were 33.08 and 41.74 kcps. The scatter fractions for an energy window at 358–664 keV ranged from 6.9% to 14.2% for both phantoms, which is better than some commercial systems. Overall, all the measurement values of our scanner have shown promising results. These results show that the scanner is suitable for small animal research.
Overall, our scanner’s spatial resolutions have good values compared with other preclinical systems. It will enable us to study mouse images at a submillimeter level. The image resolution of low-dose PET images of phantoms is good enough at a low activity concentration. In addition to the PET scanner, it has an MRI section. By incorporating the MRI information into the PET analysis, we can provide preliminary information and enhance the image quality. It will also improve the performance of MRI equipment for examining small animals. Combined with start-of-the-art software and accessories, the high field magnets address translational research needs. Bruker’s PET/MRI, having good spatial resolution and high sensitivity in the imaging modalities, can perform non-invasive approaches.
5. Conclusions
In our research, we analyzed the performance evaluation of Bruker’s preclinical PET/MRI scanner. We studied the spatial resolution using FWHM calculations, and the scanner had good spatial resolution values with the 3D-MLEM image reconstruction technique. The MRI image has good resolution at high field magnetic strength. The image quality phantom measurements, such as uniformity, spillover ratio, and recovery coefficient values, are better than those of other imaging systems. While comparing test results with other preclinical PET scanners, Bruker was proven in overall system performance, giving favorable or at least comparable results. A preclinical PET/MRI system with a 7.0 Tesla magnetic field provides high resolution and good quantitative accuracy for preclinical molecular imaging for multi-disciplinary and multi-institutional research. In conclusion, Bruker’s small animal PET scanner is applicable for preclinical imaging-related studies.
Author Contributions
Conceptualization, J.-C.C.; methodology, J.-C.C. and K.K.M.D.; software, K.K.M.D.; validation, K.K.M.D.; formal analysis, K.K.M.D.; investigation, J.-C.C. and K.K.M.D.; resources, P.E.M. and Y.-C.J.K.; data curation, K.K.M.D.; writing—original draft preparation, K.K.M.D.; writing—review and editing, J.-C.C.; visualization, K.K.M.D.; supervision, J.-C.C.; project administration, T.-T.K.; funding acquisition, J.-C.C. All authors have read and agreed to the published version of the manuscript.
Funding
This work was funded by the NYMU-NCTU Interdisciplinary Research group of the molecular cell and imaging, grant number 109AC-DYC605.
Institutional Review Board Statement
The animal experiments were reviewed and approved by Affidavit of Approval of Animal Use Protocol Institutional Animal Care and Use Committee (IACUC) of National Yang Ming Chiao Tung University. The animal experiment application form and consent number (1100407).
Data Availability Statement
The data used to support the findings of this study are available from the corresponding author upon request.
Acknowledgments
The authors would like to thank Taipei Veterans General Hospital for providing the experimental platform, and we want to thank Joe Chen for his valuable assistance in arranging the 18F-FDG radiotracer for our experiments. We also want to thank David Jin for fixing a minor coding issue.
Conflicts of Interest
The authors declare no conflict of interest.
References
- Vaquero, J.J.; Kinahan, P. Positron emission tomography: Current challenges and opportunities for technological advances in clinical and preclinical imaging systems. Annu. Rev. Biomed. Eng. 2015, 17, 385–414. [Google Scholar] [CrossRef] [PubMed]
- Sun, X.; Cai, W.; Chen, X. Positron emission tomography imaging using radiolabeled inorganic nanomaterials. Acc. Chem. Res. 2015, 48, 286–294. [Google Scholar] [CrossRef] [PubMed]
- Lu, Y.; Yang, K.; Zhou, K.; Zhang, Q.; Pang, B.; Ren, Q. Development of a SiPM-based PET imaging system for small animals. Nucl. Instrum. Methods Phys. Res. Sect. A Accel. Spectrom. Detect. Assoc. Equip. 2014, 743, 30–38. [Google Scholar] [CrossRef]
- Xu, J.; Xie, S.; Zhang, X.; Tao, W.; Yang, J.; Zhao, Z.; Weng, F.; Huang, Q.; Yi, F.; Peng, Q. A preclinical PET detector constructed with a monolithic scintillator ring. Phys. Med. Biol. 2019, 64, 155009. [Google Scholar] [CrossRef]
- Ma, T.; Xu, T.; Liu, H.; Wei, Q.; Peng, F.; Deng, Z.; Gong, G.; Gong, H.; Wang, S.; Liu, Y. Development of a SiPM based preclinical PET SPECT imaging system imaging system. J. Nuclear Med. 2017, 58 (Suppl. 1), 397. [Google Scholar]
- Schug, D.; Lerche, C.; Weissler, B.; Gebhardt, P.; Goldschmidt, B.; Wehner, J.; Dueppenbecker, P.M.; Salomon, A.; Hallen, P.; Kiessling, F. Initial PET performance evaluation of a preclinical insert for PET/MRI with digital SiPM technology. Phys. Med. Biol. 2016, 61, 2851. [Google Scholar] [CrossRef]
- Amirrashedi, M.; Sarkar, S.; Ghafarian, P.; Hashemi Shahraki, R.; Geramifar, P.; Zaidi, H.; Ay, M.R. NEMA NU-4 2008 performance evaluation of Xtrim-PET: A prototype SiPM-based preclinical scanner. Med. Phys. 2019, 46, 4816–4825. [Google Scholar] [CrossRef]
- Yao, R.; Lecomte, R.; Crawford, E.S. Small-animal PET: What is it, and why do we need it? J. Nucl. Med. Technol. 2012, 40, 157–165. [Google Scholar] [CrossRef]
- Lancelot, S.; Zimmer, L. Small-animal positron emission tomography as a tool for neuropharmacology. Trends Pharmacol. Sci. 2010, 31, 411–417. [Google Scholar] [CrossRef]
- Yamamoto, S.; Imaizumi, M.; Kanai, Y.; Tatsumi, M.; Aoki, M.; Sugiyama, E.; Kawakami, M.; Shimosegawa, E.; Hatazawa, J. Design and performance from an integrated PET/MRI system for small animals. Ann. Nucl. Med. 2010, 24, 89–98. [Google Scholar] [CrossRef]
- Vandenberghe, S.; Marsden, P.K. PET-MRI: A review of challenges and solutions in the development of integrated multimodality imaging. Phys. Med. Biol. 2015, 60, R115. [Google Scholar] [CrossRef]
- NEMA NU 4-2008; Performance Measurements of Small Animal Positron Emission Tomographs; National Electrical Manufacturers Association: Rosslyn, VA, USA, 2008; pp. 1–23.
- Goertzen, A.L.; Bao, Q.; Bergeron, M.; Blankemeyer, E.; Blinder, S.; Cañadas, M.; Chatziioannou, A.F.; Dinelle, K.; Elhami, E.; Jans, H.-S. NEMA NU 4-2008 comparison of preclinical PET imaging systems. J. Nucl. Med. 2012, 53, 1300–1309. [Google Scholar] [CrossRef]
- Buchert, R.; Bohuslavizki, K.H.; Fricke, H.; Mester, J.; Clausen, M. Performance evaluation of PET scanners: Testing of geometric arc correction by off-centre uniformity measurement. Eur. J. Nucl. Med. 2000, 27, 83–90. [Google Scholar] [CrossRef]
- Schmitz, R.E.; Harrison, R.L.; Stearns, C.W.; Lewellen, T.K.; Kinahan, P.E. Optimization of noise equivalent count rate performance for a partially collimated PET scanner by varying the number of septa. IEEE Trans. Med. Imaging 2007, 26, 935–944. [Google Scholar] [CrossRef]
- Sanchez, F.; Moliner, L.; Correcher, C.; Gonzalez, A.; Orero, A.; Carles, M.; Soriano, A.; Rodriguez-Alvarez, M.J.; Medina, L.; Mora, F. Small animal PET scanner based on monolithic LYSO crystals: Performance evaluation. Med. Phys. 2012, 39, 643–653. [Google Scholar] [CrossRef]
- Pajak, M.Z.; Volgyes, D.; Pimlott, S.L.; Salvador, C.C.; Asensi, A.S.; McKeown, C.; Waldeck, J.; Anderson, K.I. NEMA NU4-2008 performance evaluation of Albira: A two-ring small-animal PET system using continuous LYSO crystals. Open Med. J. 2016, 3, 12–26. [Google Scholar] [CrossRef]
- Grant, A.M.; Deller, T.W.; Khalighi, M.M.; Maramraju, S.H.; Delso, G.; Levin, C.S. NEMA NU 2-2012 performance studies for the SiPM-based ToF-PET component of the GE SIGNA PET/MR system. Med. Phys. 2016, 43, 2334–2343. [Google Scholar] [CrossRef]
- Hallen, P.; Schug, D.; Weissler, B.; Gebhardt, P.; Salomon, A.; Kiessling, F.; Schulz, V. PET performance evaluation of the small-animal Hyperion IID PET/MRI insert based on the NEMA NU-4 standard. Biomed. Phys. Eng. Express 2018, 4, 065027. [Google Scholar] [CrossRef]
- Hsu, D.F.; Ilan, E.; Peterson, W.T.; Uribe, J.; Lubberink, M.; Levin, C.S. Studies of a next-generation silicon-photomultiplier–based time-of-flight PET/CT system. J. Nucl. Med. 2017, 58, 1511–1518. [Google Scholar] [CrossRef]
- Stortz, G.; Thiessen, J.D.; Bishop, D.; Khan, M.S.; Kozlowski, P.; Retière, F.; Schellenberg, G.; Shams, E.; Zhang, X.; Thompson, C.J. Performance of a PET insert for high-resolution small-animal PET/MRI at 7 tesla. J. Nucl. Med. 2018, 59, 536–542. [Google Scholar] [CrossRef]
- Visser, E.P.; Disselhorst, J.A.; Brom, M.; Laverman, P.; Gotthardt, M.; Oyen, W.J.; Boerman, O.C. Spatial resolution and sensitivity of the Inveon small-animal PET scanner. J. Nucl. Med. 2009, 50, 139–147. [Google Scholar] [CrossRef] [PubMed]
- Baghaei, H.; Uribe, J.; Li, H.; Wang, Y.; Wong, W.-H. Comparison of the SSRB, MSRB, and FORE methods with the 3DRP algorithm using data from a high resolution PET scanner. In Proceedings of the 2000 IEEE Nuclear Science Symposium, Conference Record (Cat. No. 00CH37149), Lyon, France, 15–20 October 2000; Volume 192, pp. 15/199–115/202. [Google Scholar]
- Watson, C.C. New, faster, image-based scatter correction for 3D PET. IEEE Trans. Nucl. Sci. 2000, 47, 1587–1594. [Google Scholar] [CrossRef]
- Kemp, B.J.; Hruska, C.B.; McFarland, A.R.; Lenox, M.W.; Lowe, V.J. NEMA NU 2-2007 performance measurements of the Siemens Inveon™ preclinical small animal PET system. Phys. Med. Biol. 2009, 54, 2359. [Google Scholar] [CrossRef] [PubMed]
- Gu, Z.; Taschereau, R.; Vu, N.; Wang, H.; Prout, D.; Silverman, R.; Bai, B.; Stout, D.; Phelps, M.; Chatziioannou, A. NEMA NU-4 performance evaluation of PETbox4, a high sensitivity dedicated PET preclinical tomograph. Phys. Med. Biol. 2013, 58, 3791. [Google Scholar] [CrossRef]
- García Hernández, T.; Vicedo González, A.; Ferrer Rebolleda, J.; Sánchez Jurado, R.; Roselló Ferrando, J.; Brualla González, L.; Granero Cabañero, D.; del Puig Cozar Santiago, M. Performance evaluation of a high resolution dedicated breast PET scanner. Med. Phys. 2016, 43, 2261–2272. [Google Scholar] [CrossRef]
- Zhang, J.; Maniawski, P.; Knopp, M.V. Performance evaluation of the next generation solid-state digital photon counting PET/CT system. EJNMMI Res. 2018, 8, 97. [Google Scholar] [CrossRef]
- Queiroz, M.A.; Wollenweber, S.D.; von Schulthess, G.; Delso, G.; Veit-Haibach, P. Clinical image quality perception and its relation to NECR measurements in PET. EJNMMI Phys. 2014, 1, 103. [Google Scholar] [CrossRef]
- Bao, Q.; Newport, D.; Chen, M.; Stout, D.B.; Chatziioannou, A.F. Performance evaluation of the inveon dedicated PET preclinical tomograph based on the NEMA NU-4 standards. J. Nucl. Med. 2009, 50, 401–408. [Google Scholar] [CrossRef]
- Constantinescu, C.C.; Mukherjee, J. Performance evaluation of an Inveon PET preclinical scanner. Phys. Med. Biol. 2009, 54, 2885. [Google Scholar] [CrossRef]
- Belcari, N.; Camarlinghi, N.; Ferretti, S.; Iozzo, P.; Panetta, D.; Salvadori, P.A.; Sportelli, G.; Del Guerra, A. NEMA NU-4 performance evaluation of the IRIS PET/CT preclinical scanner. IEEE Trans. Radiat. Plasma Med. Sci. 2017, 1, 301–309. [Google Scholar] [CrossRef]
- Prasad, R.; Ratib, O.; Zaidi, H. Performance evaluation of the FLEX triumph X-PET scanner using the national electrical manufacturers association NU-4 standards. J. Nucl. Med. 2010, 51, 1608–1615. [Google Scholar] [CrossRef]
- Cañadas, M.; Sanz, E.R.; Vives, M.O.; Vaquero, J.J.; Desco, M.; Vicente, E.; Udías, J.M.; Romero, L. Performance evaluation for 68 Ga and 18 F of the ARGUS small-animal PET scanner based on the NEMA NU-4 standard. In Proceedings of the IEEE Nuclear Science Symposuim & Medical Imaging Conference, Knoxville, TN, USA, 30 October–6 November 2010; pp. 3454–3457. [Google Scholar]
- Lage, E.; Vaquero, J.J.; Sisniega, A.; España, S.; Tapias, G.; Abella, M.; Rodriguez-Ruano, A.; Ortuño, J.E.; Udias, A.; Desco, M. Design and performance evaluation of a coplanar multimodality scanner for rodent imaging. Phys. Med. Biol. 2009, 54, 5427. [Google Scholar] [CrossRef]
- Prasad, R.; Ratib, O.; Zaidi, H. NEMA NU-04-based performance characteristics of the LabPET-8™ small animal PET scanner. Phys. Med. Biol. 2011, 56, 6649. [Google Scholar] [CrossRef]
- Liu, Q.; Li, C.; Liu, J.; Krish, K.; Fu, X.; Zhao, J.; Chen, J.C. Performance evaluation of a small-animal PET/CT system based on NEMA NU 4–2008 standards. Med. Phys. 2021, 48, 5272–5282. [Google Scholar] [CrossRef]
- Sarnyai, Z.; Nagy, K.; Patay, G.; Molnár, M.; Rosenqvist, G.; Tóth, M.; Takano, A.; Gulyás, B.; Major, P.; Halldin, C. Performance evaluation of a high-resolution nonhuman primate PET/CT system. J. Nucl. Med. 2019, 60, 1818–1824. [Google Scholar] [CrossRef]
- Spinks, T.; Karia, D.; Leach, M.; Flux, G. Quantitative PET and SPECT performance characteristics of the Albira Trimodal pre-clinical tomograph. Phys. Med. Biol. 2014, 59, 715. [Google Scholar] [CrossRef]
Figure 1.
Photographs of Bruker’s small animal 7 Tesla PET/MRI scanner.

Figure 2.
The pictures of NEMA standard and Derenzo phantoms. (a) Mouse-sized Derenzo phantom, (b) rat-sized Derenzo phantom, (c) image quality phantom, and (d) mouse and rat-sized scatter phantoms.
Figure 2.
The pictures of NEMA standard and Derenzo phantoms. (a) Mouse-sized Derenzo phantom, (b) rat-sized Derenzo phantom, (c) image quality phantom, and (d) mouse and rat-sized scatter phantoms.

Figure 3.
(a) FWHM of the 3D-MLEM-reconstructed images and (b) FWHM of the FBP-reconstructed images.
Figure 3.
(a) FWHM of the 3D-MLEM-reconstructed images and (b) FWHM of the FBP-reconstructed images.

Figure 4.
(a) FWTM of the 3D-MLEM-reconstructed images and (b) FWTM of the FBP-reconstructed images.
Figure 4.
(a) FWTM of the 3D-MLEM-reconstructed images and (b) FWTM of the FBP-reconstructed images.

Figure 5.
The transverse PET images of mouse and rat-like Derenzo phantoms. (a) Mouse-sized hot rod image and (b) rat-sized cold rod image.
Figure 5.
The transverse PET images of mouse and rat-like Derenzo phantoms. (a) Mouse-sized hot rod image and (b) rat-sized cold rod image.

Figure 6.
The transverse MRI images of mouse, and rat like Derenzo phantoms (a) Mouse-sized hot rod image and (b) rat-sized cold rod image.
Figure 6.
The transverse MRI images of mouse, and rat like Derenzo phantoms (a) Mouse-sized hot rod image and (b) rat-sized cold rod image.

Figure 7.
The axial absolute sensitivity profile of the PET/MRI scanner.

Figure 8.
The system count rates, such as total, true, random, scatter, and NECR, as factors of activity (MBq). (a) Mouse-type scatter phantom. (b) Rat-type scatter phantom.
Figure 8.
The system count rates, such as total, true, random, scatter, and NECR, as factors of activity (MBq). (a) Mouse-type scatter phantom. (b) Rat-type scatter phantom.

Figure 9.
The 3D-MLEM reconstructed PET transverse images of NEMA standard IQ phantom. (a) The uniformity region, (b) five rods, and (c) two-chamber region.
Figure 9.
The 3D-MLEM reconstructed PET transverse images of NEMA standard IQ phantom. (a) The uniformity region, (b) five rods, and (c) two-chamber region.

Figure 10.
The MRI transverse images of NEMA standard IQ phantom. (a) The uniformity region, (b) five rods, and (c) two-chamber region.
Figure 10.
The MRI transverse images of NEMA standard IQ phantom. (a) The uniformity region, (b) five rods, and (c) two-chamber region.

Figure 11.
A healthy rat study was conducted using 38.9 MBq of 18F-FDG. The rat with injected anesthesia was mounted on the bed, scanned PET (15 min), and underwent T1-weighted MRI (~6 min). The image was reconstructed by the system’s default reconstruction method, 3D-MLEM, with 18 iterations. Shown and labeled are the three different views of PET images, MRI images, and PET/MRI fused images. Coronal (a–c), sagittal (d–f), and transverse (g–i). (a,d,g) PET images, (b,e,h) MRI images, and (c,f,i) PET/MRI fused images.


Table 1.
Technical specifications of Bruker’s preclinical PET/MRI system.
| PET Specifications | |
|---|---|
| Parameter | Specifications |
| Photon Multiplier (PM) | SiPM |
| Detector crystal | Continuous LYSO |
| PM element/crystal | 12 × 12 = 144 |
| Number of detector rings | 3 |
| Transaxial FOV | 80 mm |
| Axial FOV | 150 mm |
| Detector ring inner diameter | 105 mm |
| Number of individual crystals | 24 |
| Number of crystals in a ring | 8 |
| Number of modules in PET scanner | 24 |
| Crystal size | Truncated pyramid |
| 48 × 48 mm at entrance window | |
| 50 × 50 mm at base 10 mm thick | |
| Data collection method | List mode (or) raw data |
| Reconstruction method | 3D-MLEM |
| MRI Specifications | |
| Magnetic field strength | 7 Tesla |
| Inner diameter | 105 mm |
| Outer diameter | 169 mm |
| Maximum gradient strength | 900 mT/m |
| Maximum linear slew rate | 4200 T/m/s |
Table 2.
The calculated uniformity values.
| Analysis Method | Minimum (kBq/mL) | Maximum (kBq/mL) | Average Concentration (kBq/mL) | %STD |
|---|---|---|---|---|
| Uniformity | 536.8 | 951.6 | 739.9 | 8.8 |
Table 3.
The calculated recovery coefficients for five different sizes if rods and their percentage standard deviations.
Table 3.
The calculated recovery coefficients for five different sizes if rods and their percentage standard deviations.
| Rod Diameter (mm) | Recovery Coefficient | %STD |
|---|---|---|
| 1 | 0.17 | 28.4 |
| 2 | 0.41 | 17.7 |
| 3 | 0.69 | 14.2 |
| 4 | 0.85 | 9.3 |
| 5 | 0.94 | 7.2 |
Table 4.
The calculated spillover ratio values.
| Analysis Method | Chamber | SOR | %STD |
|---|---|---|---|
| Spillover ratio (SOR) | Air | 0.14 | 24.7 |
| Water | 0.17 | 28.2 |
Table 5.
Comparing Bruker’s PET performance with other preclinical scanners, such as IRIS PET/CT [32], Inveon [30], FLEX Triumph X-PET (2D-FBP) [33], FLEX Triumph X-PET (2D-OSEM) [33], Argus PET [34], VrPET/CT [35], LabPET-8TM [36], MetisTM PET/CT [37], XTRIM-PET [7], and LFER 150 PET/CT [38].
| Analysis Methods | Bruker’s Small Animal 7T PET/MRI | IRIS PET/CT | Inveon | FLEX Triumph X-PET (2D-FBP) | FLEX Triumph X-PET (2D-OSEM) | Argus PET | VrPET/CT | Lab PET-8TM | MetisTM PET/CT | XTRIM-PET | LFER 150 PET/CT | |
|---|---|---|---|---|---|---|---|---|---|---|---|---|
| Uniformity | %STD | 8.8 | 7.0 | 5.3 | 6.3 | 6.0 | 6.0 | 15.3 | 7.0 | 10.9 | 3.82 | 3.3 |
| Recovery Coefficient (RC) | 1 mm | 0.17 | 0.14 | 0.17 | 0.13 | 0.15 | 0.28 | 0.22 | 0.13 | 0.22 | 0.12 | 0.08 |
| 2 mm | 0.41 | 0.58 | 0.48 | 0.38 | 0.43 | 0.77 | 0.62 | 0.32 | 0.50 | 0.40 | 0.75 | |
| 3 mm | 0.69 | 0.73 | 0.72 | 0.54 | 0.56 | 0.88 | 0.72 | 0.80 | 0.81 | 0.68 | 1.05 | |
| 4 mm | 0.85 | 0.82 | 0.54 | 0.67 | 0.68 | 0.98 | 0.75 | 0.83 | 0.88 | 0.86 | 1.07 | |
| 5 mm | 0.94 | 0.89 | 0.93 | 0.85 | 0.88 | 0.92 | 0.75 | 0.96 | 0.89 | 0.90 | 1.06 | |
| Spillover ratio (SOR) | Air | 24.7% | 11% | −0.6% | 9.3% | 6.1% | 13% | 8.5% | 13.7% | 17.7% | 35% | 12.6% |
| Water | 28.2% | 16% | 1.7% | 11% | 8.2% | 15% | 9.3% | 24.4% | 19.4% | 25% | 15.9% |
Publisher’s Note: MDPI stays neutral with regard to jurisdictional claims in published maps and institutional affiliations. |
© 2022 by the authors. Licensee MDPI, Basel, Switzerland. This article is an open access article distributed under the terms and conditions of the Creative Commons Attribution (CC BY) license (https://creativecommons.org/licenses/by/4.0/).
Share and Cite
MDPI and ACS Style
Doss, K.K.M.; Mion, P.E.; Kao, Y.-C.J.; Kuo, T.-T.; Chen, J.-C. Performance Evaluation of a PET of 7T Bruker Micro-PET/MR Based on NEMA NU 4-2008 Standards. Electronics 2022, 11, 2194. https://doi.org/10.3390/electronics11142194
AMA Style
Doss KKM, Mion PE, Kao Y-CJ, Kuo T-T, Chen J-C. Performance Evaluation of a PET of 7T Bruker Micro-PET/MR Based on NEMA NU 4-2008 Standards. Electronics. 2022; 11(14):2194. https://doi.org/10.3390/electronics11142194
Chicago/Turabian StyleDoss, Kishore Krishnagiri Manoj, Pei En Mion, Yu-Chieh Jill Kao, Tsung-Ter Kuo, and Jyh-Cheng Chen. 2022. "Performance Evaluation of a PET of 7T Bruker Micro-PET/MR Based on NEMA NU 4-2008 Standards" Electronics 11, no. 14: 2194. https://doi.org/10.3390/electronics11142194
Note that from the first issue of 2016, this journal uses article numbers instead of page numbers. See further details here.