Article

The Use of Excess Electric Charge for Highly Sensitive Protein Detection: Proof of Concept

Institute of Biomedical Chemistry, 119121 Moscow, Russia
*
Author to whom correspondence should be addressed.
Electronics 2022, 11(13), 1955; https://doi.org/10.3390/electronics11131955
Submission received: 7 May 2022 / Revised: 15 June 2022 / Accepted: 20 June 2022 / Published: 22 June 2022
(This article belongs to the Special Issue New Technologies for Biomedical Circuits and Systems)

Abstract

:
In highly sensitive bioanalytical systems intended for the detection of protein biomarkers at low and ultra-low concentrations, the efficiency of capturing target biomolecules from the volume of the analyzed sample onto the sensitive surface of the detection system is a crucial factor. Herein, the application of excess electric charge for the enhancement of transport of target biomolecules towards the sensitive surface of a detection system is considered. In our experiments, we demonstrate that an uncompensated electric charge is induced in droplets of protein-free water owing to the separation of charge in a part of the Kelvin dropper either with or without the use of an external electric field. The distribution of an excess electric charge within a protein-free water droplet is calculated. It is proposed that the efficiency of protein capturing onto the sensitive surface correlates with the sign and the amount of charge induced per every single protein biomolecule. The effect described herein can allow one to make the protein capturing controllable, enhancing the protein capturing in the desired (though small) sensitive area of a detector. This can be very useful in novel systems intended for highly sensitive detection of proteins at ultra-low (≤10−15 M) concentrations.

1. Introduction

It is known that the majority of proteins, their isoforms, and diagnostically relevant markers are present in blood at low (<10−13 M) and ultra-low (less than 10−15 M) concentrations [1]. Within the concentration range of 10−14 M and above, immunoaffinity-based, fluorescence-based, and mass spectrometric methods are commonly employed [1,2,3]. The lower limit of detection (LOD) attainable with the use of these methods, however, does not allow one to perform reliable detection of the majority of diagnostically relevant markers of socially significant human diseases such as cancer [2]. Rissin et al. [2] justified that for early diagnosis of socially significant diseases, the highest attainable LOD value must be 10−15 M. Furthermore, Macchia et al. emphasized that this LOD value should be as low as possible—down to the single-molecule level in an ideal case [4]. The latter is particularly important since the presence of even a single biomolecule, whose behavior differs from that of the majority of biomolecules, can determine the specific performance of the entire system, and this is crucial for clinical diagnosis [4,5].
The LOD value can be shifted down by increasing the efficiency of a bioanalytical system intended for biomarker detection [6]. This efficiency is determined by two main factors. The first factor is the sensitivity of the detector employed in the bioanalytical system; the second factor is the efficiency of the delivery of the target biomolecules to a sensitive surface of a sensor element of the detector [6]. Accordingly, the LOD threshold reported by Rissin et al. [2] can be overcome with the use of so-called molecular detectors, which allow one to register a reliable signal from single biomolecules of target biomarkers [1,4,6].
Atomic force microscopes (AFM), nanowire-based electrical detectors, and optical tweezers represent typical molecular detectors. These detectors allow one to attain a very high sensitivity owing to the size of sensor elements employed in them, which is comparable to the size of biomolecules [6,7,8,9,10]. Namely, AFM allows one to register single biological macromolecules (DNA [11,12] and proteins [13,14]) and their complexes [15,16,17], while the sensitivity of nanowire-based detectors can reach a single charge per sensor element [18]. Owing to such a high sensitivity, these detectors allow one to attain very low LOD values down to femtomolar and subfemtomolar ones [6], as was demonstrated experimentally with the use of AFM [14] and nanowire detectors [19,20].
The crucial point in using molecular detectors is the way of capturing target biomolecules onto the sensitive surface of the detection system [14]. In the majority of bioanalytical systems, the so-called “molecular fishing” [21,22]—that is, capturing of the target biomolecules from the volume of the analyzed solution onto the surface of the detection system—is employed [6]. For this purpose, target biomolecules must be delivered from the volume of analyzed solution to the surface of the detection system and concentrated thereon in order to make them detectable [6]. In our previously published review, we introduced the term “fishing efficiency”, which determines the ratio between the concentration of the target biomolecules in the volume of the analyzed solution and that in the near-surface layer of the capturing surface [6]. The higher this ratio is, the more efficiently are the target biomolecules captured onto the surface.
In the case of molecular detectors, the analyzed solution volume is typically large, while the surface area available for the capturing is relatively small [6]. While at high (of the order of 10−7 M) concentrations of target biomolecules in the solution, the delivery of target biomolecules to the capturing surface occurs even in diffusion-limited mode [23,24,25], at lower concentrations (at which molecular detectors are typically employed) the use of additional enhancing mechanisms is required [6]. These enhancement mechanisms include hydrodynamically assisted intensification of molecular transport towards the sensitive surface [6,14,26] and application of electric fields [8,9,10,13,18]. Upon hydrodynamic intensification at ultra-low concentrations, the time required to capture a sufficient amount of target biomolecules is fairly long (up to several hours [14]). In contrast, upon application of an electric field, the capturing process is typically much faster [3,4,5], allowing one to detect the target biomolecules in real time [10,19,20]. This is why herein we consider the latter factor—the application of an electric field for the enhancement of transport of target biomolecules towards the sensitive surface of a detection system.
The application of an electric field can be organized in two ways. The first way is the application of an external electric field [27]; it is used, for instance, for the electrophoretic separation of proteins [28]. The second way is the use of electrostatic effects occurring in an analytical system upon a motion of a liquid medium [29,30,31,32,33,34,35,36]. This effect of the occurrence of an electric field (that is, the generation of charge) in the analytical system influences its properties. This was employed previously in our experiments reported elsewhere [13] for highly sensitive AFM-based detection of human serum albumin (HSA) and cytochrome b5 using capturing of these proteins onto highly oriented pyrolytic graphite (HOPG) [13]. Therein, experiments with flowing protein solutions were carried out. In [13], the protein capturing efficiency was quite different at various protein concentrations [13]. Surprisingly, the efficiency of protein capturing at lower (10−14 M) protein concentrations was considerably higher than that at higher (10−12 M) concentrations. Within the framework of the diffusion model, these results are paradoxical and can only be explained by the strong influence of one more “participant”. We supposed that the electric charge serves as such a “participant”. Similar conclusions were made by Choi et al. [30], and our present study was performed in order to study this phenomenon in more detail.
For this purpose, we calculated the distribution of electric charge in a protein-free water droplet ejected from a polypropylene tip nozzle and the charge concentration in the center of this droplet. Our calculations have indicated that at a low (10−14 M) concentration of elementary electric charges in the water droplet, the charge distribution over the volume of the drop is approximately uniform. With increasing the total charge of the droplet, the elementary charges are electrostatically localized on the droplet surface.
Moreover, herein, we also have experimentally measured the charge induced in the protein-free water droplet in a system using the principle of the Kelvin dropper [37,38]. Our experimental setup has allowed us to improve the reproducibility of the measurements and to tune the amount of the total charge of the drop. In our experiments performed with the use of protein-free deionized water, we demonstrate that an uncompensated electric charge appears in water owing to the separation of charge in a part of the Kelvin dropper. Accordingly, this charge can well be accepted by protein biomolecules if they are present in the solution. In this way, the protein biomolecules become an excess electric charge, which forces their adsorption onto the grounded substrate surface when the protein solution is dropped onto it. It is to be emphasized that the amount of free charge in each water droplet is limited. Accordingly, the higher the number of protein biomolecules in the drop, the lower the charge accepted by each molecule.
The results obtained herein are of interest in the development of novel analytical systems intended for the highly sensitive detection of proteins with the use of molecular detectors.

2. Materials and Methods

2.1. Calculating the Charge Distribution within a Droplet

In the first step of our study, we performed a calculation of the distribution of an excess electric charge, which occurs in a droplet of an aqueous solution owing to the separation of charge in the Kelvin dropper within a 2.8 mm diameter water droplet. We expected that the distribution of the excess electric charge carried by the drop over the volume of the drop would be non-uniform. In order to calculate the distribution of the charge along the radius of the droplet, we used the Poisson–Boltzmann equation [39]. In the case of a charged droplet, this equation has the form (see the Appendix A for detailed mathematical justification):
y ` ` ( r ) r r + 2 r   y ` ( r ) r = α   e x p ( y ( r ) )
where c(r) = exp(y(r)), and α = e2/(kTεεo).
In Equation 1, c(r) is the concentration of elementary charges [m−3], e is the electron charge (e = 1.6 × 10⁻¹⁹ C), k is the Boltzmann constant (k = 1.23 × 10⁻²³ J/K), T is the temperature [K], ε is the dielectric constant of water, and εo is the vacuum permittivity (εo = 8.85 × 10⁻¹² F/m).
It should be noted that the Poisson–Boltzmann equation is commonly used in the calculation of the potential and charge distributions in near-surface layers of an electrolyte in order to determine the characteristics of an electric double layer [39]. Herein, the Poisson–Boltzmann equation was employed to calculate the distributions of charge and potential within a charged liquid droplet.
The differential equation (Equation (1)) describes the charge distribution along the radius of the droplet. It does not have an analytical solution, which could be expressed in terms of elementary functions, but, nevertheless, can be solved numerically. Herein, it was solved by the iteration method.

2.2. Generation of Electric Charge and Its Separation in Water Droplets

In order to confirm our calculations and our previous assumption [13] (see Section 1), we performed experiments on the triboelectric generation of electric charge in water droplets with further separation of this charge in a setup representing a part of the Kelvin dropper [37,38]. This setup has allowed us to generate water droplets bearing a defined amount of electric charge of a known sign. The schematic representation of the experimental setup is shown in Figure 1.
Upon the operation of the setup, water was spontaneously dropped from the upper feed tank (a 50 mL polypropylene test tube, Corning) into the measuring cell through a sterile silicone pipe with a polypropylene tip (0.1–10 µL pipette tips, Eppendorf, Germany) by gravity. The tip was located in the center of a metallic ring, to which a high (from −3 kV to +3 kV) voltage was applied. In this way, a dropwise gravity flow of water with the droplet formation in an external electric field was organized. After the formation (which took from 1 to 5 s) on the tip nozzle, the droplet detached and fell into the measuring cell.
Upon the flow of water through the plastic pipe and the tip, an electric charge was generated in it owing to a triboelectric effect [29,30,31,32,33,34,35,36,40,41]. The electric field, organized around the tip, induced charge separation in water. Therefore, upon application of a negative voltage to the metallic ring, the negative charge under the action of the electric field flows down to the ground through the channel supplying the solution (in the form of an upstream), while the positive charge remains on the drop and, when it is detached, enters the receiving cell. In this way, the water droplets become an excess electric charge of a sign opposite to the potential applied to the metallic ring [42]. Dropwise water flowed into the measuring cell, provided an ohmic break in the electrical circuit, and temporarily prevented the positive charge, borne by the droplets, from draining. It is very important to ensure that the feed tank is well-grounded; otherwise, the charge separation in the area of the tip nozzle occurs in an unpredictable way. Moreover, the HOPG substrate in the measuring cell must also be grounded. The charged droplet falls onto the HOPG substrate in the cell, and the charge is drained to the ground. The amount of the drained charge was measured in both cases with highly sensitive electrometers (nanocoulomb meters, home-made in IBMC, Moscow, Russia). The charge drained from the feed tank must be equal in value and opposite in sign to the one drained from the HOPG substrate. If this is not the case, then there is a reason to check the system for current leakage. Such a system is well known; the main characteristics and equations describing the dependence of the magnitude of the induced charge of a drop on the physical and geometric parameters of a Kelvin dropper are given in [37].

3. Results

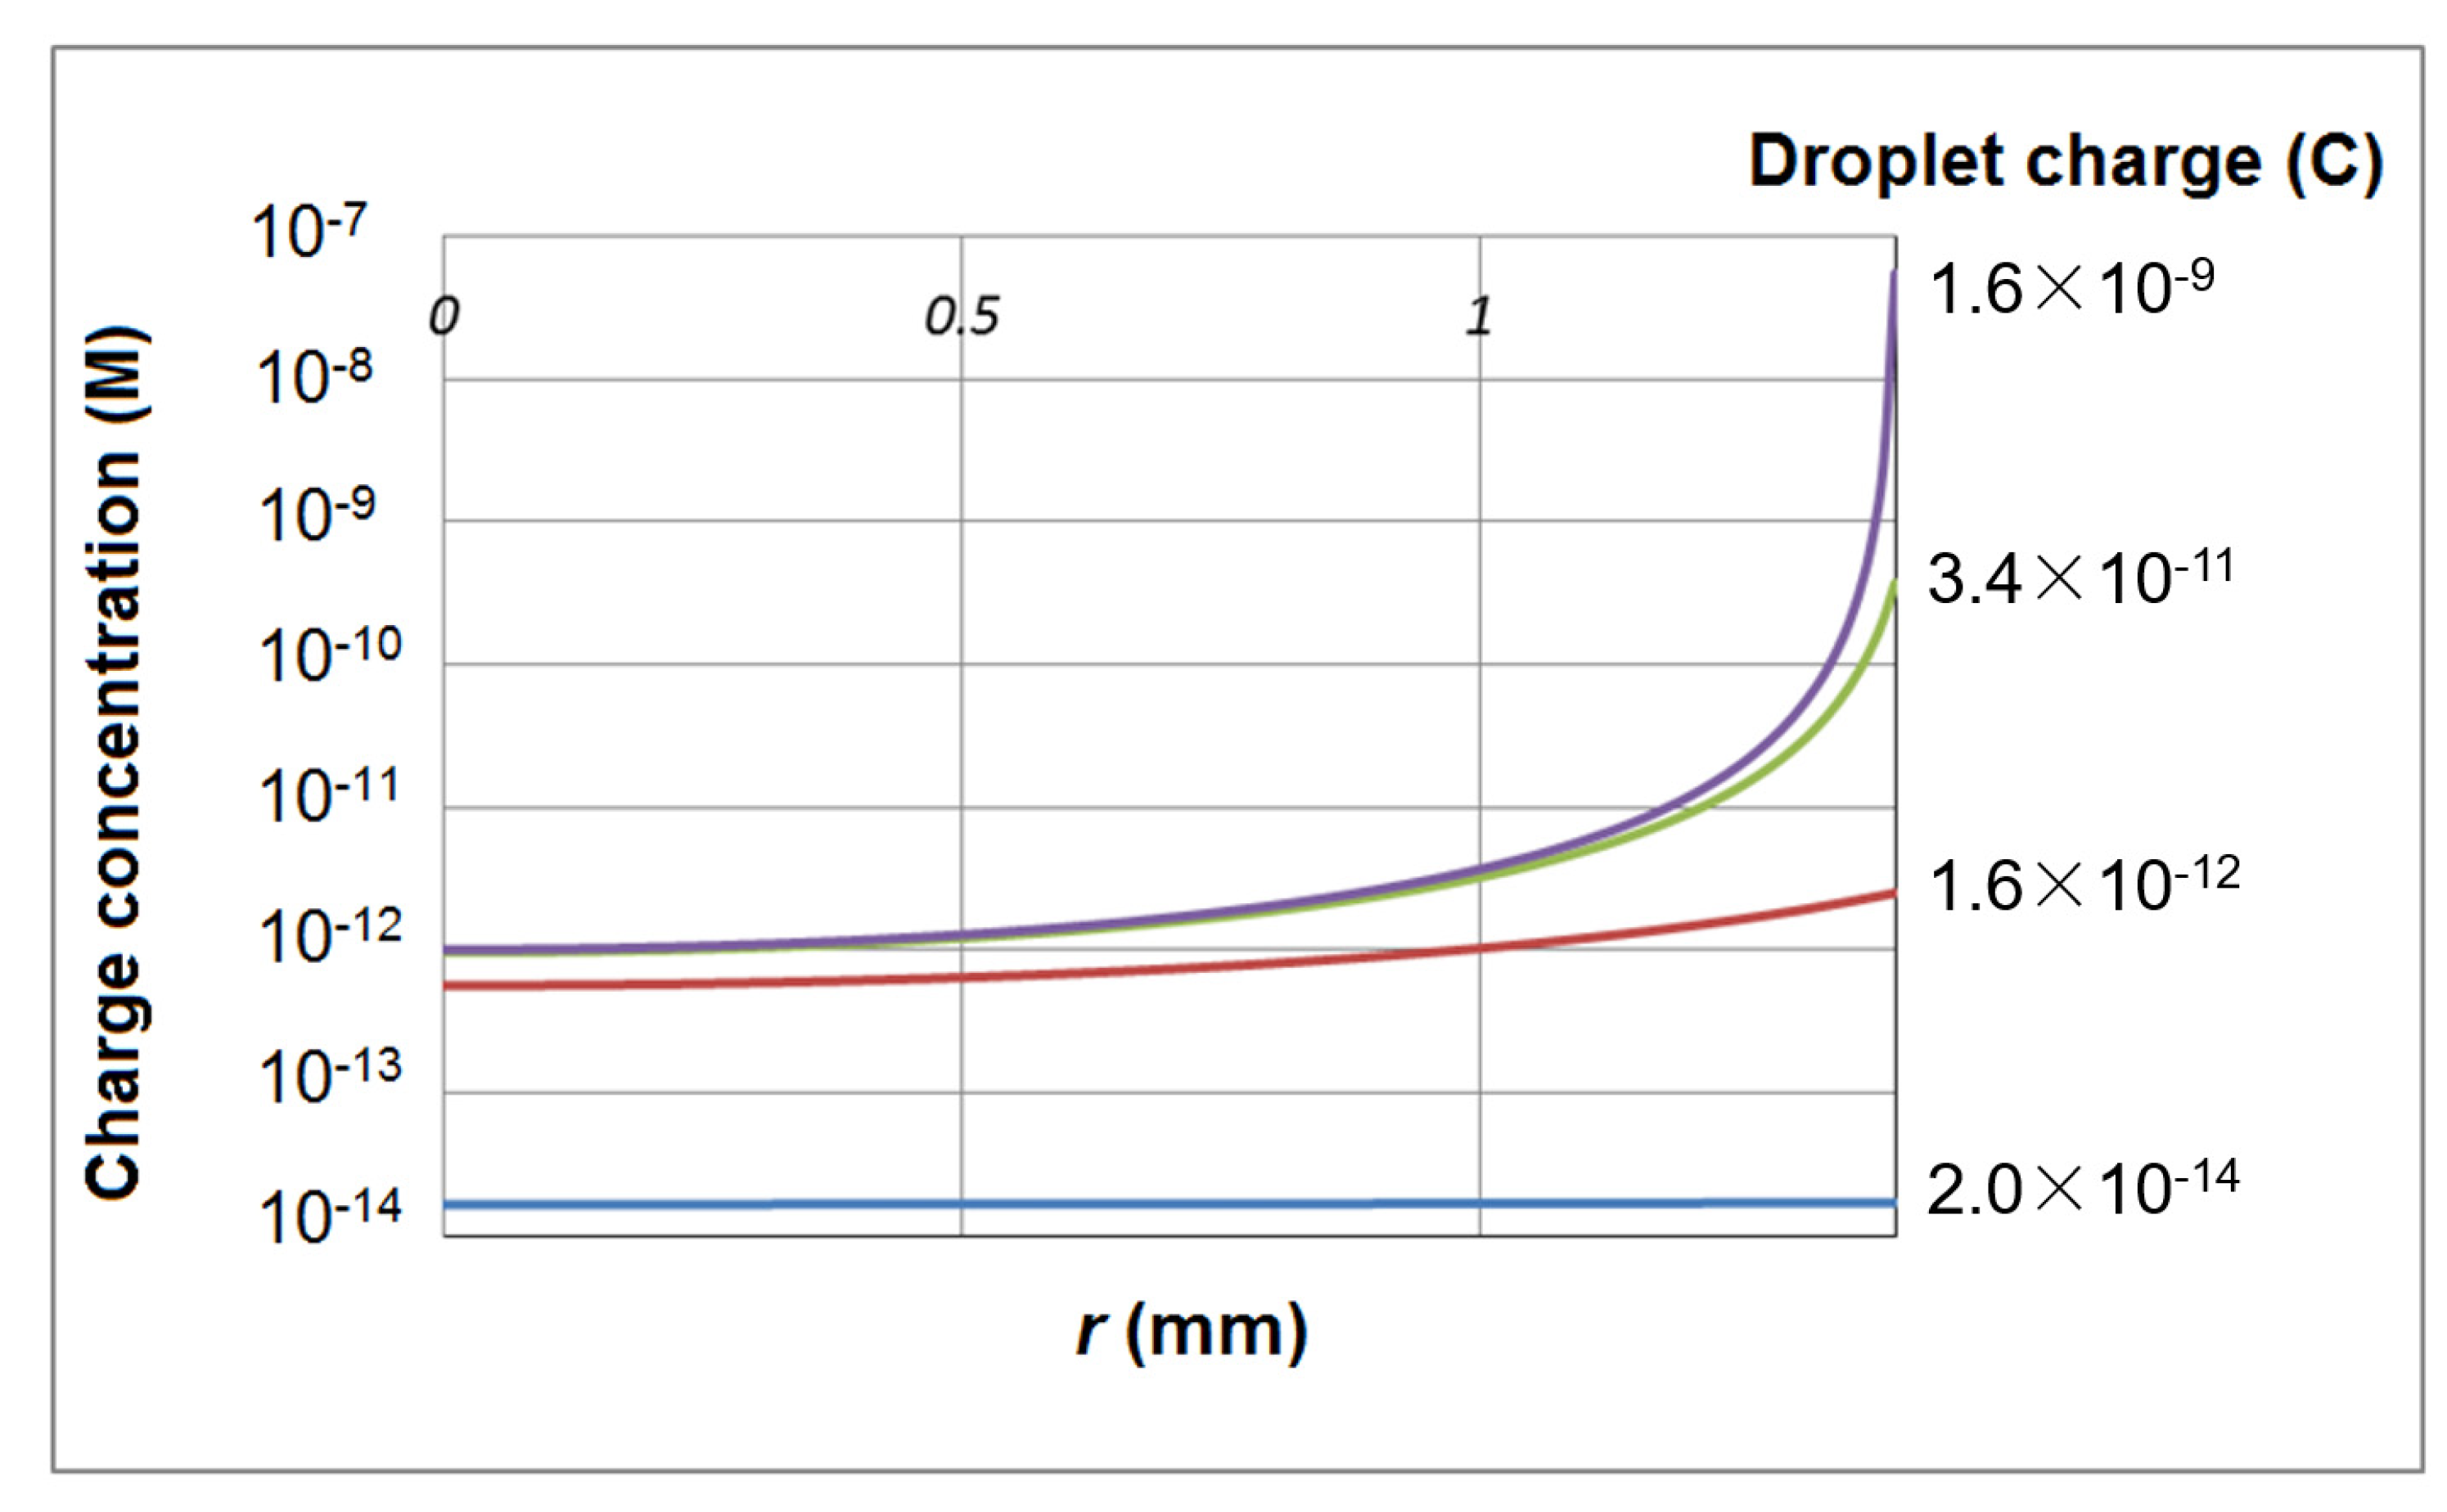
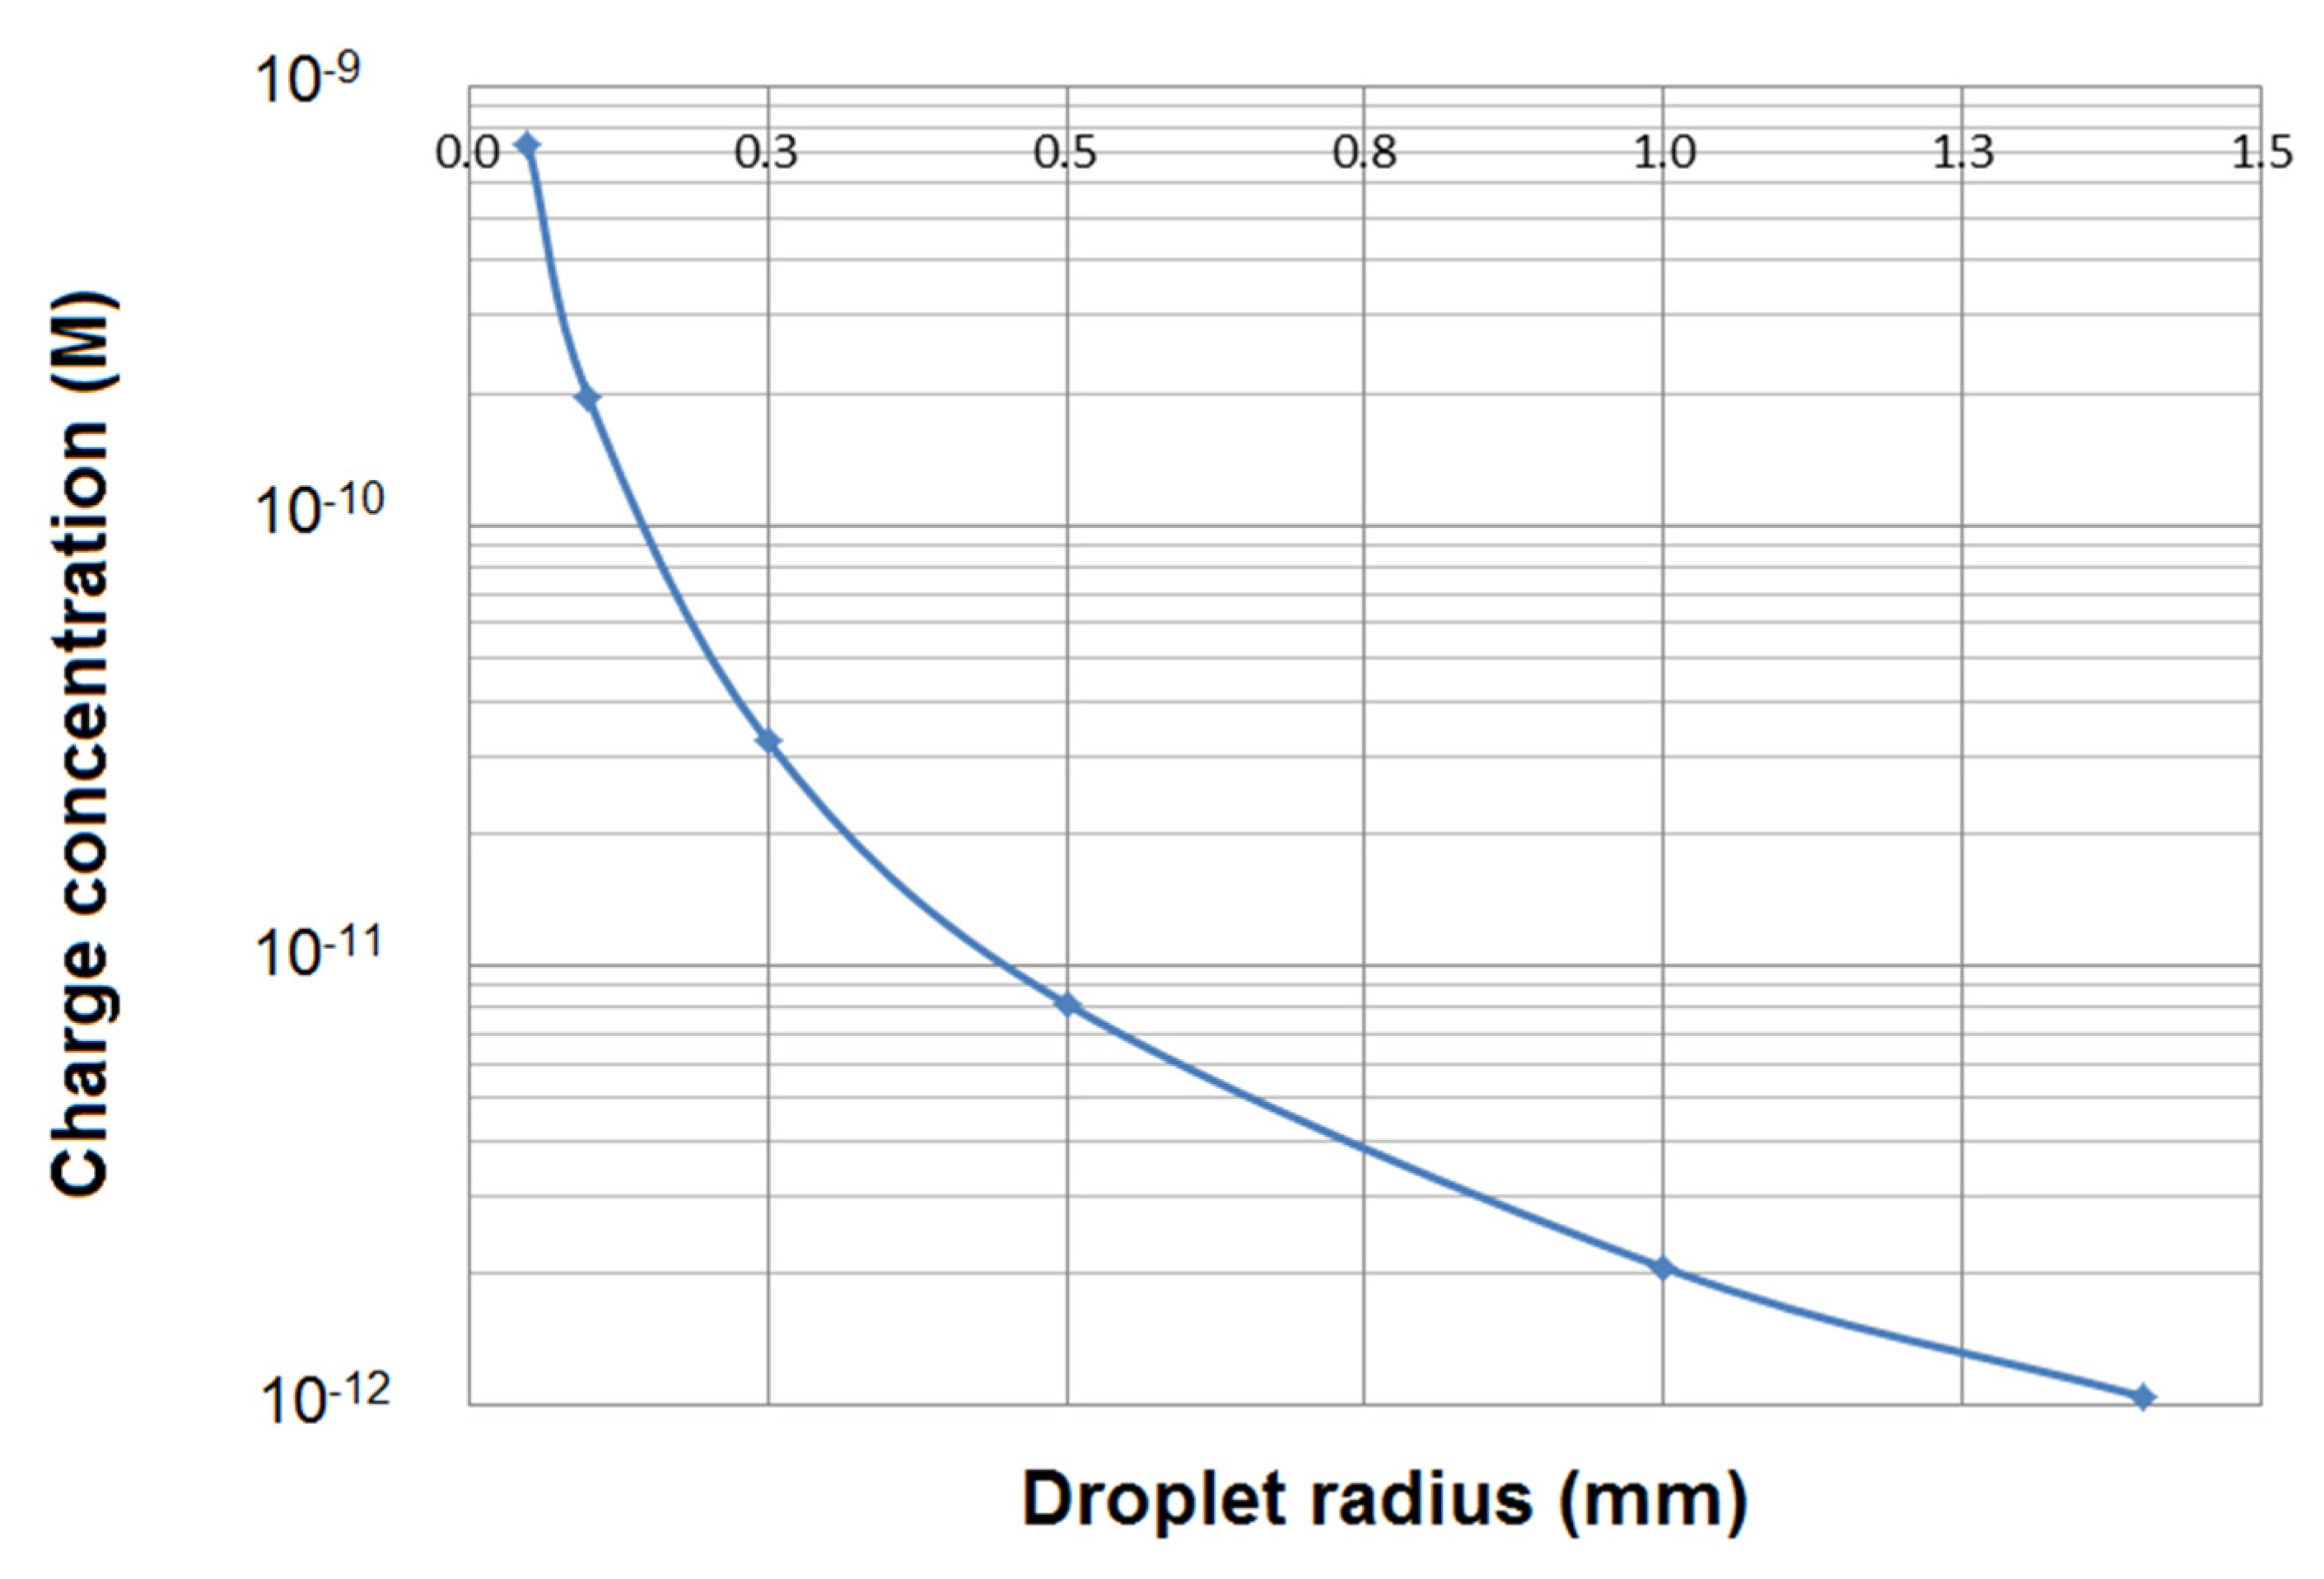
3.1. Charge Distribution within the Water Droplet

The results of the calculation of the electric charge distribution along the radius of a 2.8 mm water droplet are shown in Figure 2 in the form of dependencies of the volume concentration of elementary charges (expressed in molar units) on the distance from the center of the droplet. The dependencies obtained indicate that the major portion of the electric charge concentrates within a relatively narrow surface layer of the droplet. At that, the minor portion of the charge is, nevertheless, distributed inside the droplet bulk volume.
The dependencies shown in Figure 2 indicate that at low volume concentration of elementary charges, they do not interact with each other, and their distribution over the droplet volume is approximately uniform. With increasing the total charge borne by the drop, the majority of the charges is distributed in the surface layer owing to the influence of electrostatic repulsion. At greater (≥10−11 C) total charge of the droplet, the concentration of elementary charges in bulk virtually does not exceed the value of 6 × 10¹⁴ e/m3 (here, e = 1.6 × 10⁻¹⁹ C), while their vast majority accumulates at the periphery of the droplet. Thus, the concentration of charges in the bulk of the droplet (apart from its near-surface layer) does not exceed ~10−11 moles of electrons per liter.
It should be noted that the results shown in Figure 2 are only valid for a 2.8 mm diameter droplet, and the charge distributions will be different at other droplet sizes.
Then, we have calculated the dependence of the volume concentration of elementary charges on the distance from the center of the droplet. This dependence is shown in Figure 3.
The non-zero concentration of elementary charges in the center of the droplet, independent of its total net charge, is a feature of the solution of differential Equation (1). However, the value of this concentration depends on the droplet size. The smaller the drop, the higher the concentration of elementary charges in the center of the droplet.

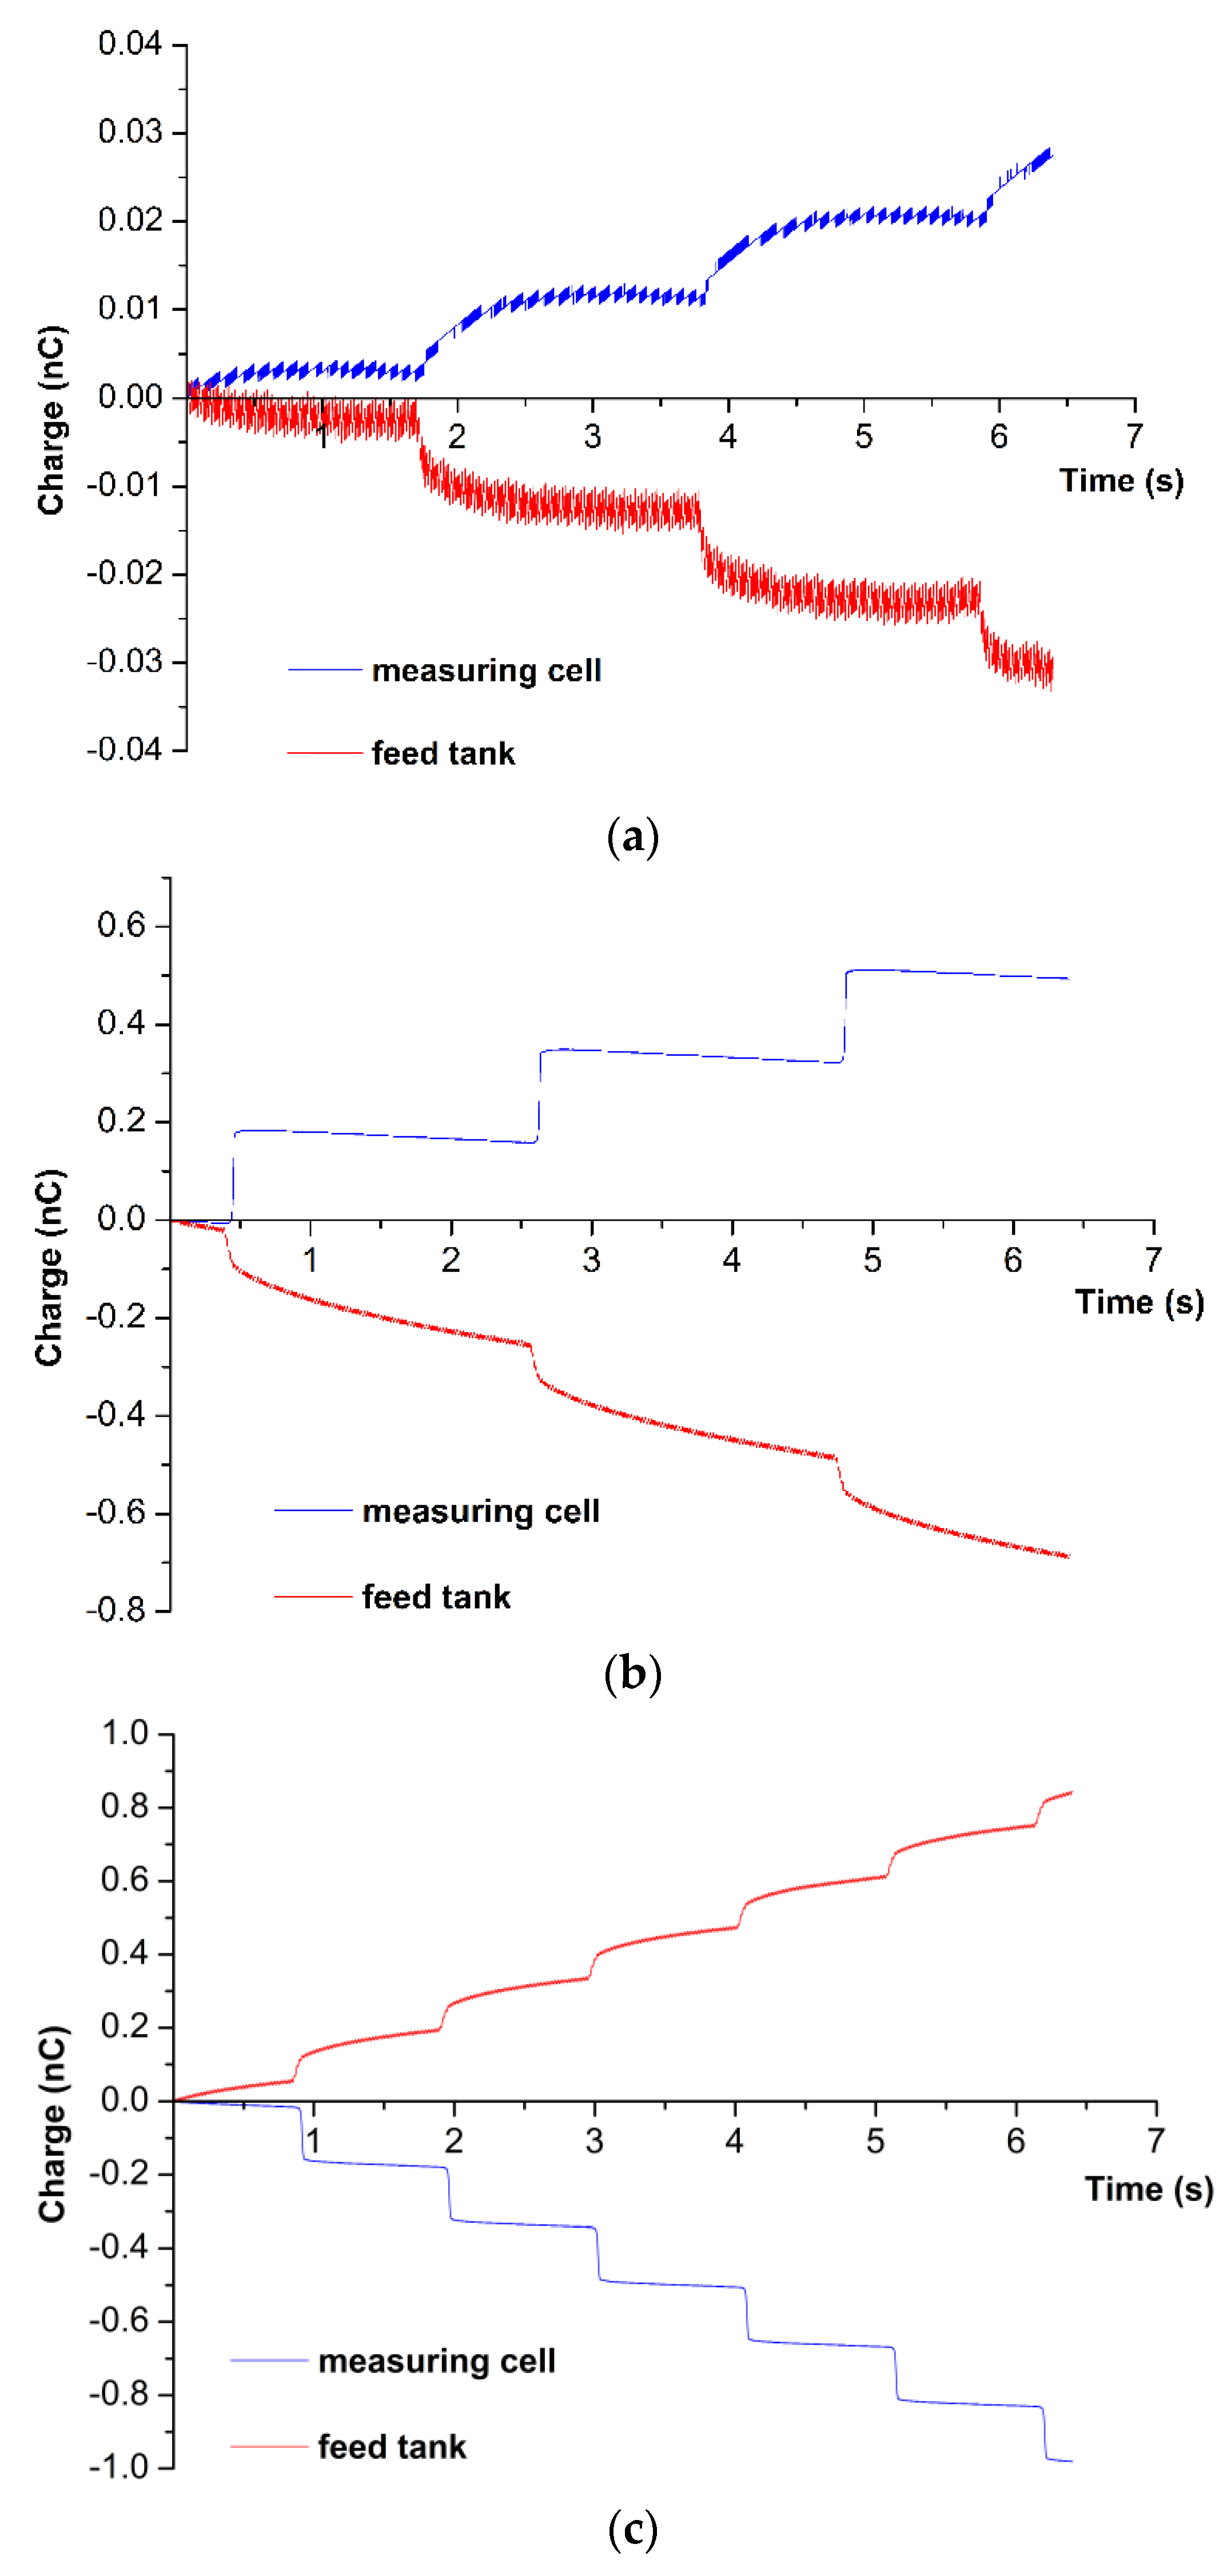
3.2. Droplet Charge Measurements

First of all, it should be emphasized that the charge separation strongly depends on the relative position of the plastic tip to the metallic ring. This is consistent with the well-known fact that the capacitance of a capacitor does not depend on its material but strongly depends on its geometry [37]. This result is in accordance with [37].
According to the description given in the Materials and Methods, during the formation, detachment, and flight to the measuring cell (which takes from 1 to 5 s), the droplet bears an excess charge. The latter, according to our assumption, is distributed within the droplet. The characteristic value of the excess charge borne by a 2.8 mm droplet makes up +0.2 nC at a 3 kV negative voltage applied to the ring.
An important feature of our experimental setup (Figure 1) is that each portion of water inside the cell inevitably finds itself at a 0.5–0.7 mm distance from the deposition area of the HOPG plate. In this conductive area, the excess electric charge, which enters the cell with the droplets, is drained to the ground.
In our experiments, we observed that at −3 kV applied to the ring, +0.2 nC of positive charge entered the measuring cell with every droplet. Figure 4 displays the time dependencies of the charge entering the measuring cell with the water droplets (blue curves) and returning to the feed tank (red curves) at various voltages applied to the ring.
The curves shown in Figure 4 indicate that the time dependence of the charge entering the measuring cell has a stepwise character. At the same time, the time dependence of the charge entering the feed tank is somewhat smoothened.
The curves shown in Figure 4a describe charge separation at zero applied voltage. In this case, a true triboelectric charge generation is observed. Indeed, upon flowing through a polypropylene tip, water spontaneously accumulates a positive charge, while the tip surface becomes a negative charge. These results are in agreement with the data obtained by Choi et al. [30].
The comparison of Figure 4a with Figure 4b,c shows that the amount of charge generated spontaneously is 30 times lower than the one observed in the case of charge separation upon application of external voltage to the metallic ring. That is, applied voltage allows one to control the sign and magnitude of the charge transferred by every single droplet.

4. Discussion

Electrostatic interactions are known to have a governing role in protein adsorption onto substrate surface [43], though the contribution of hydrophobic interactions also can be quite significant in certain cases [44,45]. In aqueous solutions, protein biomolecules are known to bear an electric charge [46], and the amount of this charge depends on the pH of the medium and the amino acid composition (hence, the structure) of the protein [43,46,47]. Moreover, it should be taken into account that the protein molecules have domains with local charges and hydrophobicity [45,47,48]. The presence of hydrophobic domains in protein biomolecules determines the contribution of hydrophobic interactions with the substrate surface to the protein adsorption [45]. The presence of charged domains determines the adsorption rate and the orientation of the adsorbed protein on the surface in the case of electrostatically-driven adsorption [48]. Moreover, with respect to electrostatic protein–surface interactions, it should be noted that the presence of various counterions—particularly multivalent ones—in the protein solution can significantly influence the protein adsorption process [48]. At high protein concentration, the intrinsic charge of a protein biomolecule is sufficient to make the protein adsorb onto the substrate surface in case of absence of strong electrostatic repulsion between the protein biomolecules and the surface (and such a repulsion can only occur in a case when the protein and the substrate surface bear a charge of the same sign). Moreover, at a sufficiently high concentration, a protein may (though slowly) adsorb even onto a substrate, which is charged similarly [43,48]. In analytical systems employing molecular detectors, the target protein is to be adsorbed onto a surface of a small area, while the concentration of a target protein is very low [6]. This is why one needs to find a way to enhance the protein adsorption onto the substrate in such systems, and herein, we explain how the excess electric charge induced in the droplets of aqueous protein solution can help in this respect.
The polypeptide chain of any protein molecule consists of amino acids, thus bearing chemical groups, which can serve as charge acceptors [47]. It is known that a protein molecule is capable of accepting up to several tens of elementary charges [48,49,50]. If protein solution is dropped from the polypropylene tip instead of pure water, protein biomolecules will act as acceptors of excess electric charge generated in aqueous droplets. The results of our calculations indicate that at low (≤10−14 M) concentrations of aqueous protein solution, the lower the concentration of a protein in its aqueous solution is, the higher the charge accepted by each protein macromolecule upon the charge separation. Our experiments indicate the occurrence of the phenomenon of charge separation in water droplets. This confirms our previous assumption reported in [13]. In this respect, the crucial point is the amount of electric charge accepted by each protein molecule (the charge per molecule ratio).
At a protein concentration from 10−12 to 10−11 M, one protein biomolecule can accept only from 1 to 10 excess elementary charges. Since protein is capable of accepting up to several tens of elementary charges per biomolecule [48,49,50], apparently, such an intervention is not enough for a significant change in protein structure and its deposition in the cell. Accordingly, at such relatively high concentrations, the protein adsorption onto the substrate surface is determined by the above-discussed electrostatic and hydrophobic interactions. In contrast, at lower (≤10−14 M) protein concentrations, the relative amount of excess charges per one protein biomolecule is three orders of magnitude higher (103 to 104). Accepting such a large amount of charge can lead to fundamental changes in the structure and properties of protein biomolecules, including their adsorbability. In this regard, our approach proposed herein, which is based on the introduction of an uncompensated excess electric charge into a solution containing protein biomolecules, can allow for a controlled changing of the conformation of protein biomolecules. By accepting electric charge, protein biomolecules can overcome the energy barrier separating various conformal states; irreversible changes in their structure are quite possible. These changes can well lead to a change in protein adsorbability. Further experiments involving protein solutions are required to exactly determine the effect of excess charge on the conformation and adsorption properties of proteins.
At the moment the drop lands in the cell, the entire excess charge of the drop flows down to the ground; however, it is likely that the changes will be irreversible, and the protein molecule will remain in the newly acquired configuration, and with a different solubility limit.
The presence of the maximum possible concentration of charges in the volume of the droplet allows us to explain the paradoxical results obtained in our previous paper [13]. Therein, HSA and cytochrome b5 proteins were captured onto a small surface area of grounded conductive HOPG plate from a 10−15 M solution; at the same time, at a concentration of 10−12 M, no protein was captured onto the surface under the same conditions. This phenomenon occurred owing to changes in the conformation of protein owing to accepting a large amount of charge at low concentration; these conformational changes allowed the protein to adsorb onto the HOPG surface. It is to be emphasized that the protein biomolecules retain the changes in their conformation after the excess charge is drained to the ground after the adsorption of the protein onto a grounded conductive surface. Another explanation of the absence of protein desorption in our experiments consists in that adsorbed state of a protein is preferable [43] since protein adsorption allows the “protein solution—surface” system to minimize its free surface energy. At the same time, an insufficient quantity of excess electric charge accepted by the biomolecules of the protein at its high concentration did not allow them to adsorb onto the surface owing to the absence of conformational changes necessary for the adsorption.
As was noted in the Introduction, for successful registration of protein biomolecules with the AFM-based molecular detector, it is also necessary to provide binding of the target biomolecules in a relatively small surface area. In our present study, this has been realized in the following way. A feature of this installation is that all its elements are made of dielectric materials, except for the HOPG plate (and electrical wires). At that, only a small (~0.05 mm2) area of the plate was in direct contact with the liquid in the measuring cell, while a major part of the plate was covered with an insulating polytetrafluoroethylene film. Throughout our experiments, each droplet of water carrying an excess charge is inevitably located at a distance of 0.5–0.7 mm from the conductive area, thus allowing the excess charge to drain to the ground, and in the case of protein solution, the protein biomolecules can only get rid of the excess charge only after their adsorption onto this small area of electrically grounded conductive surface. It is to be emphasized that the charge draining from the protein biomolecules is also favorable in terms of minimizing the total free energy of the system [51]. Additionally, again, once adsorbed, the protein biomolecules preferably remain on the surface [43]. Thus, the effect of charge separation observed herein can be well employed for the enhancement of the efficiency of delivery and capturing of protein biomolecules in highly sensitive bioanalytical systems. This efficiency, in its turn, determines the sensitivity of a bioanalytical system [6]. It should be noted that, in perspective, not only molecular detectors such as AFM but also detectors of other types can be employed in bioanalytical systems intended for highly sensitive protein detection.
The effect described herein can allow one to make the protein capturing controllable, enhancing the protein capturing in the desired (though small) sensitive area of a detector. This can be very useful in novel systems intended for highly sensitive detection of proteins at ultra-low (≥10−15 M) concentrations.

Author Contributions

Conceptualization, S.L.K.; Data curation, S.L.K., A.F.K., V.S.Z. and A.N.A.; Formal analysis, S.L.K., A.F.K. and A.N.A.; Investigation, S.L.K., R.A.G. and I.A.I.; Methodology, S.L.K., T.O.P. and Y.D.I.; Project administration, Y.D.I.; Resources, Y.D.I., V.S.Z. and A.N.A.; Software, S.L.K. and R.A.G.; Supervision, Y.D.I.; Validation, T.O.P. and V.S.Z.; Visualization, I.D.S.; Writing—original draft, S.L.K. and I.D.S.; Writing—review and editing, I.D.S. and T.O.P. All authors have read and agreed to the published version of the manuscript.

Funding

The work was performed within the framework of the Program for Basic Research in the Russian Federation for a long-term period (2021–2030) (No. 122030100168-2).

Data Availability Statement

The data underlying this manuscript can be obtained from the corresponding author (Yu.D.I.) upon reasonable request.

Conflicts of Interest

The authors declare no conflict of interest.

Appendix A. A Poisson–Boltzmann Equation

Let us assume that the extra charges are freely located inside the sphere with the concentration c(r). We also assume that their distribution obeys the Boltzmann statistics.
Then,
c ( r 1 ) c ( r 2 ) = e x p ( W 2 W 1 k T ) ,
where W1 and W2 are the energy of charged particles at points r1 and r2, respectively, and c(r1) and c(r2) are the concentration of charged particles at points r1 and r2, respectively.
Or
E ( r ) = d Φ ( r ) d r = ( k T / e ) c ` ( r ) c ( r ) = ( k T / e ) d d r l n c ( r )
Here, c(r) is the charge concentration at the distance r from the center of the droplet, W(r) is the energy, Φ(r) is the potential, and E(r) is the strength of the electric field.
According to Gauss Theorem, the field strength inside a charged sphere can be calculated as follows:
E ( r ) = q / ( 4 π ε ε o r 2 ) E ( r ) = e / ( ε ε o r 2 )   0 r c ( x ) x 2 d x   ( k T / e )   c ` ( r ) c ( r ) = e / ( ε ε o r 2 ) 0 r c ( x ) x 2 d x   c ` ( r ) c ( r ) = e 2 / ( k T ε ε o r 2 ) 0 r c ( x ) x 2 d x
By combining (A2) and (A3), one can obtain the differential equation
  y ` ` ( r ) r r + 2 r   y ` ( r ) r = α   e x p ( y ( r ) ) ,
where c(r) = exp(y(r)), α = e2/(kTεεo).
The differential Equation (A4) given above describes the radial charge distribution along the radius of the droplet. It does not have a solution that can be expressed in terms of elementary functions, but it can be solved numerically.
We are aware that this equation describes the distribution of charge inside a sphere that does not contain other charged particles. In a dissociating liquid, screening effects are fairly expected, but we neglected them.

References

  1. Archakov, A.I.; Ivanov, Y.D.; Lisitsa, A.L.; Zgoda, V.G. AFM fishing nanotechnology is the way to reverse the Avogadro number in proteomics. Proteomics 2007, 7, 4–9. [Google Scholar] [CrossRef] [PubMed]
  2. Rissin, D.M.; Kan, C.W.; Campbell, T.G.; Howes, S.C.; Fournier, D.R.; Song, L.; Piech, T.; Patel, P.P.; Chang, L.; Rivnak, A.J.; et al. Single-Molecule Enzyme-Linked Immunosorbent Assay Detects Serum Proteins at Subfemtomolar Concentrations. Nat. Biotechnol. 2010, 28, 595–599. [Google Scholar] [CrossRef] [PubMed] [Green Version]
  3. Macchia, E.; Sarcina, L.; Picca, R.A.; Manoli, K.; Di Franco, C.; Scamarcio, G.; Torsi, L. Ultra-low HIV-1 p24 detection limits with a bioelectronic sensor. Anal. Bioanal. Chem. 2020, 412, 811–818. [Google Scholar] [CrossRef] [PubMed] [Green Version]
  4. Macchia, E.; Torricelli, F.; Bollella, P.; Sarcina, L.; Tricase, A.; Di Franco, C.; Torsi, L. Large-Area Interfaces for Single-Molecule Label-free Bioelectronic Detection. Chem. Rev. 2022, 122, 4636–4699. [Google Scholar] [CrossRef]
  5. Macchia, E.; Manoli, K.; Di Franco, C.; Scamarcio, G.; Torsi, L. New trends in single-molecule bioanalytical detection. Anal. Bioanal. Chem. 2020, 412, 5005–5014. [Google Scholar] [CrossRef] [Green Version]
  6. Pleshakova, T.O.; Shumov, I.D.; Ivanov, Y.D.; Malsagova, K.A.; Kaysheva, A.L.; Archakov, A.I. AFM-based technologies as the way towards the reverse Avogadro number. Biochem. Mosc. Suppl. Ser. B 2015, 9, 244–257. [Google Scholar] [CrossRef]
  7. Kasas, S.; Thomson, H.; Smith, B.; Hansma, P.; Miklossy, J.; Hansma, H. Biological applications of the AFM: From single molecules to organs. Int. J. Imaging Syst. Technol. 1997, 8, 151. [Google Scholar] [CrossRef]
  8. Zheng, G.; Patolsky, F.; Cui, Y.; Wang, W.U.; Lieber, C.M. Multiplexed electrical detection of cancer markers with nanowire sensor arrays. Nat. Biotechnol. 2005, 23, 1294–1301. [Google Scholar] [CrossRef]
  9. Stern, E.; Vacic, A.; Rajan, N.K.; Criscione, J.M.; Park, J.; Ilic, B.R.; Mooney, D.J.; Reed, M.A.; Fahmy, T.M. Label-free biomarker detection from whole blood. Nat. Nanotechnol. 2010, 5, 138–142. [Google Scholar] [CrossRef] [Green Version]
  10. Ivanov, Y.; Pleshakova, T.; Kozlov, A.; Malsagova, K.; Krohin, N.; Shumyantseva, V.; Shumov, I.; Popov, V.; Naumova, O.; Fomin, B.; et al. SOI nanowire for the high-sensitive detection of HBsAg and α-fetoprotein. Lab. Chip 2012, 12, 5104–5111. [Google Scholar] [CrossRef]
  11. Limanskaya, L.A.; Limanskii, A.P. Compaction of single supercoiled DNA molecules adsorbed onto amino mica. Russ. J. Bioorganic Chem. 2006, 32, 444–459. [Google Scholar] [CrossRef]
  12. Crampton, N.; Bonass, W.A.; Kirkham, J.; Thomson, N.H. Formation of aminosilane-functionalized mica for atomic force microscopy imaging of DNA. Langmuir 2005, 21, 7884–7891. [Google Scholar] [CrossRef] [PubMed]
  13. Ivanov, Y.D.; Pleshakova, T.O.; Malsagova, K.A.; Kozlov, A.F.; Kaysheva, A.L.; Kopylov, A.T.; Izotov, A.A.; Andreeva, E.A.; Kanashenko, S.L.; Usanov, S.A.; et al. Highly sensitive protein detection by combination of atomic force microscopy fishing with charge generation and mass spectrometry analysis. FEBS J. 2014, 281, 4705–4717. [Google Scholar] [CrossRef] [PubMed] [Green Version]
  14. Ivanov, Y.D.; Danichev, V.V.; Pleshakova, T.O.; Shumov, I.D.; Ziborov, V.S.; Krokhin, N.V.; Zagumenniy, M.N.; Ustinov, V.S.; Smirnov, L.P.; Archakov, A.I. Irreversible chemical AFM-based fishing for the detection of low-copied proteins. Biochem. Suppl. Ser. B Biomed. Chem. 2013, 7, 46–61. [Google Scholar] [CrossRef]
  15. Wang, H.; Bash, R.; Yodh, J.G.; Hager, G.L.; Lohr, D.; Lindsay, S.M. Glutaraldehyde modified mica: A new surface for atomic force microscopy of chromatin. Biophys. J. 2002, 83, 3619–3625. [Google Scholar] [CrossRef] [Green Version]
  16. Ierardi, V.; Ferrera, F.; Millo, E.; Damonte, G.; Filaci, G.; Valbusa, U. Bioactive surfaces for antibody-antigen complex detection by Atomic Force Microscopy. J. Phys. Conf. Ser. 2013, 439, 012001. [Google Scholar] [CrossRef]
  17. Ramacviciene, A.; Snitka, V.; Mieliauskiene, R.; Ramanavicius, A. AFM-study of complement system assembly initiated by antigen-antibody complex. Cent. Eur. J. Chem. 2006, 4, 194–206. [Google Scholar] [CrossRef]
  18. Elfström, N.; Juhasz, R.; Sychugov, I.; Engfeldt, T.; Karlström, A.E.; Linnros, J. Surface charge sensitivity of silicon nanowires: Size dependence. Nano Lett. 2007, 7, 2608–2612. [Google Scholar] [CrossRef] [Green Version]
  19. Tian, R.; Regonda, S.; Gao, J.; Liu, Y.; Hu, W. Ultrasensitive protein detection using lithographically defined Si multinanowire field effect transistors. Lab. Chip 2011, 11, 1952–1961. [Google Scholar] [CrossRef]
  20. Ivanov, Y.D.; Pleshakova, T.O.; Malsagova, K.A.; Kozlov, A.F.; Kaysheva, A.L.; Shumov, I.D.; Galiullin, R.A.; Kurbatov, L.K.; Popov, V.K.; Naumova, O.V.; et al. Detection of marker miRNAs in plasma using SOI-NW biosensor. Sens. Actuat. B Chem. 2018, 261, 566–571. [Google Scholar] [CrossRef]
  21. Ivanov, A.S.; Medvedev, A.; Ershov, P.; Molnar, A.; Mezentsev, Y.; Yablokov, E.; Kaluzhsky, L.; Gnedenko, O.; Buneeva, O.; Haidukevich, I.; et al. Protein interactomics based on direct molecular fishing on paramagnetic particles: Practical realization and further SPR validation. Proteomics 2014, 14, 2261–2274. [Google Scholar] [CrossRef] [PubMed]
  22. Archakov, A.I.; Ivanov, Y.D.; Lisitsa, A.L.; Zgoda, V.G. Biospecific irreversible fishing coupled with atomic force microscopy for detection of extremely low-abundant proteins. Proteomics 2009, 9, 1326–1343. [Google Scholar] [CrossRef] [PubMed]
  23. Myszka, D.G.; He, X.; Dembo, M.; Morton, T.A.; Goldstein, B. Extending the role of rate constants available from BIACORE: Interpreting mass transport-influenced binding data. Biophys. J. 1998, 75, 583–594. [Google Scholar] [CrossRef] [Green Version]
  24. Schuck, P. Kinetics of ligand binding to receptor immobilized in a polymer matrix, as detected with an evanescent wave biosensor. I. A computer simulation of the influence of mass transport. Biophys. J. 1996, 70, 1230–1249. [Google Scholar] [CrossRef] [Green Version]
  25. Vijayendran, R.A.; Ligler, F.S.; Leckband, D.E. A computational reaction-diffusion model for the analysis of transport-limited kinetics. Anal. Chem. 1998, 71, 5405–5412. [Google Scholar] [CrossRef]
  26. Haas, P.; Then, P.; Wild, A.; Grange, W.; Zorman, S.; Hegner, M.; Calame, M.; Aebi, U.; Flammer, J.; Hecht, B. Fast quantitative single-molecule detection at ultralow concentrations. Anal. Chem. 2010, 82, 6299–6302. [Google Scholar] [CrossRef]
  27. Tramis, O.; Iizuka, R.; Nakao, H.; Imanaka, H.; Ishida, N.; Imamura, K. Immobilization of surface non-affinitive protein onto a metal surface by an external electric field. J. Biosci. Bioeng. 2020, 129, 348–353. [Google Scholar] [CrossRef]
  28. Kaur, H.; Beckman, J.; Zhang, Y.; Li, Z.J.; Szigeti, M.; Guttman, A. Capillary electrophoresis and the biopharmaceutical industry: Therapeutic protein analysis and characterization. Trends Anal. Chem. 2021, 144, 116407. [Google Scholar] [CrossRef]
  29. Ivanov, Y.D.; Kozlov, A.F.; Galiullin, R.A.; Kanashenko, S.L.; Usanov, S.A.; Ivanova, N.D.; Ziborov, V.S.; Pleshakova, T.O. Spontaneous generation of charge in the flow-based AFM fishing system. J. Electrost. 2018, 91, 16–20. [Google Scholar] [CrossRef]
  30. Choi, D.; Lee, H.; Im, D.J.; Kang, I.S.; Lim, G.; Kim, D.S.; Kang, K.H. Spontaneous electrical charging of droplets by conventional pipetting. Sci. Rep. 2013, 3, 2037. [Google Scholar] [CrossRef]
  31. Stetten, A.Z.; Golovko, D.S.; Weber, S.A.L.; Butt, H.-J. Slide electrification: Charging of surfaces by moving water drops. Soft Matter 2019, 15, 8667–8679. [Google Scholar] [CrossRef] [PubMed] [Green Version]
  32. Xu, W.; Zheng, H.; Liu, Y.; Zhou, X.; Zhang, C.; Song, Y.; Deng, X.; Leung, M.; Yang, Z.; Xu, R.X. A droplet-based electricity generator with high instantaneous power density. Nature 2020, 578, 392–396. [Google Scholar] [CrossRef] [PubMed]
  33. Zhao, L.; Liu, L.; Yang, X.; Hong, H.; Yang, Q.; Wang, J.; Tang, Q. Cumulative charging behavior of water droplets driven freestanding triboelectric nanogenerator toward hydrodynamic energy harvesting. J. Mater. Chem. A 2020, 8, 7880–7888. [Google Scholar] [CrossRef]
  34. Haque, R.I.; Arafat, A.; Briand, D. Triboelectric effect to harness fluid flow energy. J. Phys. Conf. Ser. 2019, 1407, 012084. [Google Scholar] [CrossRef]
  35. Ivanov, Y.D.; Kozlov, A.F.; Galiullin, R.A.; Tatur, V.Y.; Ziborov, V.S.; Usanov, S.A.; Pleshakova, T.O. Influence of a Pulsed Electric Field on Charge Generation in a Flowing Protein Solution. Separations 2018, 5, 29. [Google Scholar] [CrossRef] [Green Version]
  36. Ivanov, Y.D.; Kozlov, A.F.; Galiullin, R.A.; Valueva, A.A.; Pleshakova, T.O. The Dependence of Spontaneous Charge Generation in Water on its Flow Rate in a Flow-Based Analytical System. Appl. Sci. 2020, 10, 2444. [Google Scholar] [CrossRef] [Green Version]
  37. Planinsic, G.; Prosen, T. Conducting rod on the axis of a charged ring: The Kelvin water drop generator. Am. J. Phys. 2000, 68, 1084–1089. [Google Scholar] [CrossRef]
  38. Burgo, T.A.L.; Galembeck, F.; Pollack, G.H. Where is water in the triboelectric series? J. Electrost. 2016, 80, 30–33. [Google Scholar] [CrossRef]
  39. Gur, Y.; Ravina, I.; Babchin, A.J. On the electrical double layer theory. II. The Poisson—Boltzmann equation including hydration forces. J. Coll. Interface Sci. 1978, 64, 333–341. [Google Scholar] [CrossRef]
  40. Ivanov, Y.D.; Pleshakova, T.O.; Shumov, I.D.; Kozlov, A.F.; Romanova, T.S.; Valueva, A.A.; Tatur, V.Y.; Stepanov, I.N.; Ziborov, V.S. Investigation of the Influence of Liquid Motion in a Flow-based System on an Enzyme Aggregation State with an Atomic Force Microscopy Sensor: The Effect of Water Flow. Appl. Sci. 2020, 10, 4560. [Google Scholar] [CrossRef]
  41. Ziborov, V.S.; Pleshakova, T.O.; Shumov, I.D.; Kozlov, A.F.; Ivanova, I.A.; Valueva, A.A.; Tatur, V.Y.; Negodailov, A.N.; Lukyanitsa, A.A.; Ivanov, Y.D. Investigation of the Influence of Liquid Motion in a Flow-Based System on an Enzyme Aggregation State with an Atomic Force Microscopy Sensor: The Effect of Glycerol Flow. Appl. Sci. 2020, 10, 4825. [Google Scholar] [CrossRef]
  42. Santos, L.P.; Ducati, T.R.D.; Balestrin, L.B.S.; Galembeck, F. Water with excess electric charge. J. Phys. Chem. C 2011, 115, 11226–11232. [Google Scholar] [CrossRef]
  43. McUmber, A.C.; Randolph, T.W.; Schwartz, D.K. Electrostatic Interactions Influence Protein Adsorption (but not Desorption) at the Silica-Aqueous Interface. J. Phys. Chem. Lett. 2015, 6, 2583–2587. [Google Scholar] [CrossRef] [PubMed]
  44. Felgueiras, H.P.; Antunes, J.C.; Martins, M.C.L.; Barbosa, M.A. Fundamentals of protein and cell interactions in biomaterials. Biomed. Pharmacother. 2017, 88, 956–970. [Google Scholar]
  45. Andrade, J.D.; Hlady, V.; Wei, A.P. Adsorption of complex proteins at interfaces. Pure Appl. Chem. 1992, 64, 1777–1781. [Google Scholar] [CrossRef] [Green Version]
  46. Gitlin, I.; Carbeck, J.D.; Whitesides, G.M. Why Are Proteins Charged? Networks of Charge–Charge Interactions in Proteins Measured by Charge Ladders and Capillary Electrophoresis. Angew. Chem. Int. Ed. 2006, 45, 3022–3060. [Google Scholar] [CrossRef]
  47. Prasad, S.; Mandal, I.; Singh, S.; Paul, A.; Mandal, B.; Venkatramani, R.; Swaminathan, S. Near UV-Visible electronic absorption originating from charged amino acids in a monomeric protein. Chem. Sci. 2017, 8, 5416. [Google Scholar] [CrossRef] [Green Version]
  48. Andrade, J.D.; Hlady, V.; Wei, A.P.; Golander, C.-G. A domain approach to the adsorption of complex proteins: Preliminary analysis and application to albumin. Croat. Chim. Acta 1990, 63, 527–538. [Google Scholar]
  49. Adamczyk, Z.; Nattich, M.; Wasilewska, M. Irreversible adsorption of latex particles on fibrinogen covered mica. Adsorption 2010, 16, 259–269. [Google Scholar] [CrossRef] [Green Version]
  50. Fogh-Andersen, N.; Bjerrum, P.J.; Siggaard-Andersen, O. Ionic binding, net charge, and Donnan effect of human serum albumin as a function of pH. Clin. Chem. 1993, 39, 48–52. [Google Scholar] [CrossRef]
  51. Shchukin, E.D.; Pertsov, A.V.; Amelina, E.A.; Zelenev, A.S. Colloid and Surface Chemistry, 1st ed.; Elsevier: Amsterdam, The Netherlands, 2001. [Google Scholar]
Figure 1. Experimental setup.
Electronics 11 01955 g001
Figure 2. Calculated dependencies of the volume concentration of elementary charges on the distance from the center of the droplet. The droplet diameter is 2.8 mm (accordingly, its radius is r0 = 1.4 mm).
Electronics 11 01955 g002
Figure 3. Calculated dependence of the volume concentration of elementary charges on the distance from the center of the droplet. The droplet diameter is 2.8 mm (accordingly, its radius is r0 = 1.4 mm).
Electronics 11 01955 g003
Figure 4. Experimentally obtained time dependencies of the charge entering the measuring cell with the water droplets (blue) and returning to the feed tank (red) at various voltages applied to the ring: 0 V (a), −3 kV (b), and +3 kV (c).
Electronics 11 01955 g004
Publisher’s Note: MDPI stays neutral with regard to jurisdictional claims in published maps and institutional affiliations.

