Review

Evaluating the Quality of Machine Learning Explanations: A Survey on Methods and Metrics

1
Data Science Institute, University of Technology Sydney, Ultimo, NSW 2007, Australia
2
Human-Centered AI Lab, Institute of Medical Informatics/Statistics, Medical University of Graz, 8036 Graz, Austria
*
Authors to whom correspondence should be addressed.
Electronics 2021, 10(5), 593; https://doi.org/10.3390/electronics10050593
Submission received: 25 January 2021 / Revised: 21 February 2021 / Accepted: 28 February 2021 / Published: 4 March 2021
(This article belongs to the Special Issue Machine Learning Technologies for Big Data Analytics)

Abstract

:
The most successful Machine Learning (ML) systems remain complex black boxes to end-users, and even experts are often unable to understand the rationale behind their decisions. The lack of transparency of such systems can have severe consequences or poor uses of limited valuable resources in medical diagnosis, financial decision-making, and in other high-stake domains. Therefore, the issue of ML explanation has experienced a surge in interest from the research community to application domains. While numerous explanation methods have been explored, there is a need for evaluations to quantify the quality of explanation methods to determine whether and to what extent the offered explainability achieves the defined objective, and compare available explanation methods and suggest the best explanation from the comparison for a specific task. This survey paper presents a comprehensive overview of methods proposed in the current literature for the evaluation of ML explanations. We identify properties of explainability from the review of definitions of explainability. The identified properties of explainability are used as objectives that evaluation metrics should achieve. The survey found that the quantitative metrics for both model-based and example-based explanations are primarily used to evaluate the parsimony/simplicity of interpretability, while the quantitative metrics for attribution-based explanations are primarily used to evaluate the soundness of fidelity of explainability. The survey also demonstrated that subjective measures, such as trust and confidence, have been embraced as the focal point for the human-centered evaluation of explainable systems. The paper concludes that the evaluation of ML explanations is a multidisciplinary research topic. It is also not possible to define an implementation of evaluation metrics, which can be applied to all explanation methods.

1. Introduction

Machine Learning (ML) systems are increasingly used in various fields and becoming increasingly capable of solving different tasks range from the everyday life assistant (smart health) to decision-making in high-stake domains (clinical decision support). Some examples are: in human’s everyday life, ML systems can recognise objects in images, it can transcribe speech to text, it can translate between languages, it can recognise emotions in the images of faces or speech; in traveling, ML makes self-driving cars possible, ML systems enables drones to fly autonomously; in medicine, ML can discover new uses for existing drugs, it can detect a range of conditions from images, it enables precision medicine and personalised medicine; in agriculture, ML can detect crop disease, and spray pesticide to crops with pinpoint accuracy and can help to save our forest ecosystems [1,2,3,4]; and, in scientific research, ML can fuse heterogeneous bibliographic information to efficiently extract knowledge [5]. However, because of the black box nature of ML models [6,7], the deployment of ML algorithms, especially in high stake domains, such as medical diagnosis, criminal justice, financial decision-making, and other regulated safety critical domains, requires verification and testing for plausibility by domain experts not only for safety but for legal reasons [8]. Users also want to understand reasons behind specific decisions based on ML models. Such requirements result in high societal and ethical demands to provide explanations for such ML systems. ML explanations are becoming indispensable to interpret black box results and to allow users to gain insights into the system’s decision-making process, which is a key component in fostering trust and confidence in ML systems [9,10,11].
The issue of ML explanation has experienced a significant surge in interest since the launch of the USA’s Defense Advanced Research Projects Agency (DARPA) initiative [12], from the international research community [13,14,15,16] and to various application domains in recent years [17,18,19], which can be demonstrated by the enormous and quickly growing research publications on ML explanations, as shown in Figure 1. Various approaches for ML explanations are proposed from different perspectives, such as algorithmic approaches and visual analytics approaches. However, this was at a time where Deep Learning was not used very much [20].
However, most of the work in the ML explanation research field focuses on creating new methods and techniques to improve explainability in prediction tasks and try to minimise the decrease in the prediction accuracy [17]. While various explanations have been explored, it remains unclear which way is the most appropriate explanation for a specific ML solution in a given context on a given task for a given domain expert.
Consequently, there is a huge need for evaluations to quantify the quality of explanatory methods as well as approaches to assess and choose the most appropriate explanation in practices. As a result, existing research has been starting attempts to formulate some approaches for explainability assessments. However, there are no agreed metrics for the quality of explanation methods [17], and comparisons are difficult. One of reasons behind the unsolved problem is that explainability is an inherently very subjective concept, and the perceived quality of an explanation is contextual and dependent on users, the explanation itself, as well as the type of information that users are interested in. It is hard to formalise it [17,21]. Explanation is also a domain-specific note, and there cannot be an all-purpose explanation [22], and different types of explanations might be useful. For example, one might want to personally know the main reasons why a mortgage was declined by the bank, but, in a legal scenario, a full explanation with a list of all factors might be required.
This paper takes a stand on what metrics are available to assess the quality of ML explanations and how to assess the quality of ML explanations effectively in practical applications. The aim of the paper is to thoroughly review the existing scientific literature to categorise approaches that are available for assessing the quality of ML explanations and suggest future research directions. This review focuses on metrics for evaluating ML explanations, including both human-centred subjective evaluations and quantitative objective evaluations that are not fully investigated in the current review papers.
To the best of our knowledge, this is the first survey that specifically reports on the quality evaluation of ML explanations. The contributions of this review paper are:
  • We identify properties of explainability by reviewing definitions of explainability from recent papers. The identified properties of explainability are used as objectives that evaluation metrics should achieve;
  • A systematic analysis on the human-centred explanation evaluations and quantitative objective explanation evaluations are performed to learn the current status of ML explanation evaluations;
  • The gaps and future research directions on the evaluation of ML explanations are identified.
The organisation of the paper is as follows. In Section 2, the definition of explainability that is mostly relevant to the quality evaluation of ML explanations is given. In Section 3, the taxonomy of explanation approaches is reviewed with an emphasis on the taxonomy based on high level explanation methods, which are model-based, attribution-based, and example-based explanations. Visualisation approaches for ML explanations are also reviewed to provide a full landscape of approaches of ML explanations. Afterward, Section 4 details and explains goals of the evaluation of ML explanations, and categorises evaluation approaches of ML explanations. Following that, Section 5 describes application-grounded and human-grounded evaluations, and Section 6 reviews functionality-grounded evaluation metrics. We give detailed discussions to identify gaps and future research directions in Section 7 before conclusions are drawn in Section 8.

2. Definitions

In machine learning case studies, various terms are used to refer to the process of solving the problem of a black box nature of ML for better understanding the decision-making process. Some examples are explainability, interpretability, comprehensibility, intelligibility, transparency, and understandability [23]. There are also other terms that are related to explanation, such as causality, which refers to the relationship between cause and effect from Pearl [24]. While causability refers to the measurable extent to which an explanation to a human achieves a specified level of causal understanding [25], and it does refer to a human model. The name of causability was picked with reference to the already well-known concept of usability, which has been established in software engineering for years [26].
Among these terms, explainability and interpretability are more often used than others, and they are also often used interchangeably [27]. Adadi and Berrada [28] stated that interpretable systems are explainable if their operations can be understood by humans, which shows explainability is closely related to the concept of interpretability. However, Gilpin et al. [29] stated that interpretability and fidelity are both necessary components for explainability. They argued that a good explanation should be understandable to humans (interpretability) and accurately describe model behaviour in the entire feature space (fidelity) [23]. Interpretability is important to manage the social interaction of explainability, while fidelity is important to assist in verifying other model desiderata or discover new insights of explainability. Fidelity is also called faithfulness in some studies [23].
Interpretability can have properties of clarity and parsimony. Clarity implies that the explanation is unambiguous, while parsimony means that the explanation is presented in a simple and compact form [23]. Lombrozo [30] showed that explanations considered good are simple and broad. Therefore, broadness, which describes how generally applicable is an explanation, is another property of interpretability. Furthermore, Fidelity has properties of completeness and soundness, according to Reference [23]. Completeness implies that the explanation describes the entire dynamic of the ML model, while soundness concerns how correct and truthful the explanation is. Figure 2 shows the concept of explainability and its related properties [23]. Explainability is used in the remainder of this paper and the taxonomy of evaluation metrics is based on this definition in the paper.

3. Machine Learning Explanation Approaches

The machine learning explainability has been reviewed thoroughly in recent years [10,14,17,23,28,31,32]. This survey does not investigate more details of explanation approaches as various survey work has done. Instead, we focus on the taxonomy of explanation approaches that are more relevant from the evaluation’s perspective.

3.1. Taxonomy of Explanation Approaches

Different taxonomies have also been proposed based on the explanation-generation approaches, the type of explanation, the scope of explanation, the type of model it can explain, or combinations of these methods [10]. For example, by considering when explanations are applicable, explanation methods can be grouped into pre-model (ante-hoc), in-model, and post-model methods. The explanation methods can also be classified into intrinsic and post-hoc methods for distinguishing whether explainability is achieved through constraints imposed on the ML model directly (intrinsic) or by applying explanation methods that analyse the model after training (post-hoc).
There are also model-specific and model-agnostic methods, as well as global and local explanation methods. Furthermore, Arya et al. [10] set up hierarchical relations of these different explanation methods. Arya et al. [10] also categorised the explanations based on techniques used and associated them with the hierarchical relations. These categories include:
  • Saliency methods [static -> model -> local -> post-hoc -> feature]: This category of explanation methods highlights different parts in the data to understand classification tasks. This category belongs to local post-hoc explanation methods, which use static and feature-based explanations. Local Interpretable Model-Agnostic Explanations (LIME) [33] and SHapley Additive exPlanations (SHAP) [34] fall under the umbrella of this category of explanations.
  • Neural network visualisation methods [static -> model -> global -> post-hoc -> visualise]: This category of explanation methods is mainly used for neural network explanations and visualizes intermediate representations/layers of a neural network. It allows us to inspect a high level of features of a model with visualisations to understand the model. Therefore, this category belongs to the global post-hoc and static explanation methods. For example, Nguyen et al. [35] introduced multifaceted feature visualisations to explain neural networks.
  • Feature relevance methods [static -> model -> global -> post-hoc -> feature]: This category of explanation methods studies the input features’ relevance to and global effects on the target/output values. This category belongs to the static global and post-hoc explanation methods through visualisations for explanations. The Partial Dependence Plot [36] showing the marginal effect that one or two features have on the predicted outcome belongs to this category.
  • Exemplar methods [static -> model -> local -> post-hoc -> samples]: This category explains the predictions of test instances using similar or influential training instances [37,38]. It is considered as static local post-hoc explanations with samples.
  • Knowledge distillation methods [static -> model -> global -> post-hoc -> surrogate]: Machine learning models, such as deep learning models, are usually black boxes to users and difficult to understand. Knowledge distillation methods learn a simpler model, such as a linear model, to simulate a complex model and explain it. This category of explanations is considered as global post-hoc explanations with surrogate models. For example, Hinton et al. [39] explained an ensemble of models, such as neural networks with a single model effectively.
  • High-level feature learning methods [static -> data -> feature]: This category of explanations learns a high level of interpretable features using approaches such as Variational AutoEncoder (VAE) or Generative Adversarial Network (GAN) for explanations. For example, Chen et al. [40] described a GAN-based approach to learn interpretable representations. This kind of explanation is under the data followed by a feature category.
  • Methods that provide rationales [static -> model -> local -> self]: This category of explanations generates explanations derived from input data, which could be considered as local self-explanations. For example, Hendricks et al. [41] proposed a visual explanation generation approach, which describes visual content in a specific image instance and constrains information to explain why an image instance belongs to a specific class.
  • Restricted neural network architectures [static -> model -> global -> direct]: This category of explanations applies certain restrictions on the neural network architecture to make it interpretable. It falls under the global direct explanation category. For example, Zhang et al. [42] proposed to modify a traditional Convolutional Neural Network (CNN) into an explainable CNN by allowing clear knowledge representations (e.g., a specific object part) in high cov-layers of the CNN.
The ML explanation has benefits for both the organisation and individuals. It can help an organisation comply with the law, build trust with its customers, and improve its internal governance. Individuals also benefit by being more informed, experiencing better outcomes and being able to engage meaningfully in the decision-making process. Organisations and individuals could face regulatory action, reputational damage, disengagement by the public, distrust, and many other adverse effects if no ML explanation is provided or the ML explanation is not effective [43]. Following these benefits and risks, References [43,44] identified six types of explanations as follows:
  • Rationale explanation. This type of explanation is about the “why” of an ML decision and provides reasons that led to a decision, and is delivered in an accessible and understandable way, especially for lay users. If the ML decision was not what users expected, this type of explanation allows users to assess whether they believe the reasoning of the decision is flawed. While, if so, the explanation supports them to formulate reasonable arguments for why they think this is the case.
  • Responsibility explanation. This type of explanation concerns “who” is involved in the development, management, and implementation of an ML system, and “who” to contact for a human review of a decision. This type of explanation helps by directing the individual to the person or team responsible for a decision. It also makes accountability traceable.
  • Data explanation. This type of explanation focuses on what the data is and how it has been used in a particular decision, as well as what data and how it has been used to train and test the ML model. This type of explanation can help users understand the influence of data on decisions.
  • Fairness explanation. This type of explanation provides steps taken across the design and implementation of an ML system to ensure that the decisions it assists are generally unbiased, and whether or not an individual has been treated equitably. This type of explanation is key to increasing individuals’ confidence in an Artificial Intelligence (AI) system. It can foster meaningful trust by explaining to an individual how bias and discrimination in decisions are avoided.
  • Safety and performance explanation. This type of explanation deals with steps taken across the design and implementation of an ML system to maximise the accuracy, reliability, security, and robustness of its decisions and behaviours. This type of explanation helps to assure individuals that an ML system is safe and reliable by explanation to test and monitor the accuracy, reliability, security, and robustness of the ML model.
  • Impact explanation. This type of explanation concerns the impact that the use of an ML system and its decisions has or may have on an individual and on a wider society. This type of explanation gives individuals some power and control over their involvement in ML-assisted decisions. By understanding the possible consequences of the decision, an individual can better assess his/her participation in the process and how the outcomes of the decision may affect them. Therefore, this type of explanation is often suited to delivery before an ML-assisted decision is made.
Of all these explanations, responsibility and fairness are two ethical principles of artificial intelligence, which are different from explainability [45]. While impact explanation concerns the impact of the use of an ML system. Therefore, rational explanation, data explanation, and safety and performance explanation are directly related to ML explainabilities. We can associate these explanation types with explanation techniques as categorised by Arya et al. [10]. Table 1 shows examples of associations between explanation types from Reference [43] and explanation technique categories from Reference [10]. Some explanation techniques could serve multiple explanation types.
This paper reviews evaluation metrics of ML explanations based on these three types of explanations.
Molnar et al. [46] listed challenges that ML explanations face currently. They mainly include:
  • Statistical uncertainty and inferences. Not only the machine learning model itself, but also its explanations, are computed from data and, hence, are subject to uncertainty. However, many ML explanation methods, such as featuring importance-based approaches, provide explanations without quantifying the uncertainty of the explanation.
  • Causal explanation. Ideally, an ML model should reflect the true causal relations of its underlying phenomena, in order to enable causal explanation. However, most statistical learning procedures reflect correlation structures between features instead of its true, inherent, causal structure that is the true goal of explanation.
  • Evaluation of explainability. This challenge is caused because the ground truth explanation is not known, and any straightforward way is not available to quantify how interpretable a model is or how correct an explanation is.
  • Feature dependence. Feature dependence introduces problems with attribution and extrapolation. Extrapolation and correlated features can cause misleading explanations.

3.2. Visualisation Approaches

Besides algorithmic approaches as categorised in the previous section, visualisation has been becoming another approach to help users understand ML processes. In the early years, visualisation is primarily used to explain the ML process of simple ML algorithms in order to understand the ML process. For example, different visualisation methods are used to examine specific values and show probabilities of picked objects visually for Naïve-Bayes [47] and Support Vector Machines (SVMs) [48]. Advanced visualisation techniques are then proposed to present more complex ML processes. For example, visualisation has been used to help users to understand and guide the clustering process [49]. The similarity tree visualisation has been developed to distinguish groups of interest within the data set in classifications [50]. Zhou et al. [6] revealed states of key internal variables of ML models with interactive visualisation to let users perceive what is going on inside a model. Visualisation is also used as an interaction interface for users in machine learning. For example, a visual interface named Nugget Browser [51] is introduced to allow users to interactively submit subgroup mining queries for discovering unique patterns dynamically. EnsembleMatrix [52] allows users to visually ensemble multiple classifiers together and provides a summary visualisation of results of these multiple classifiers.
More recent work tries to use visualisation as an interactive tool to facilitate ML diagnosis. The ModelTracker [53] provides an intuitive visualisation interface for ML performance analysis and debugging. Chen et al. [54] proposed an interactive visualisation tool by combining ten state-of-the-art visualisation methods in ML (shaded confusion matrix, ManiMatrix, learning curve, learning curve of multiple models, McNemar Test matrix, EnsembleMatrix, Customized SmartStripes, Customized ModelTracker, confusion matrix with sub-categories, and force-directed graph) to help users interactively carry out a multi-step diagnosis for ML models. Neto and Paulovich [55] presented a matrix-like visual metaphor to explain rule-based Random Forest models, where logic rules are rows, features are columns, and rule predicates are cells. The visual explanation allows users to effectively obtain overviews of models (global explanations) and audit classification results (local explanations). Chan et al. [56] presented an interactive visual analytics system to construct an optimal global overview of the model and data behaviour by summarising the local explanations using information theory. The explanation summary groups similar features and instances from local explanations and is presented with visualisations. Zhou et al. [57] presented a radial visualisation to compare machine learning models with a different number of features and identify important features directly from visualisation. Gomez et al. [58] proposed a visual analytics tool to generate counterfactual explanations by identifying the minimal set of changes needed to flip the model’s output. Such explanations are displayed in a visual interface by highlighting counterfactual information to contextualise and evaluate model decisions. Visualisation is also specifically designed to help users understand deep learning processes. For example, TensorFlow Graph Visualizer [59] is used to visualise data flow graphs of deep learning models in TensorFlow to help users understand, debug, and share the structure of their deep learning models.

4. Evaluation of ML Explanations

4.1. The Goal of Evaluation of ML Explanations

Markus et al. [23] summarised that the goal of evaluation methods are two-fold:
  • To compare available explanation methods and find preferred explanations from the comparison. The challenge is that there is no ground truth when evaluating post-hoc explanations, as the real inner workings of the model is not known [60].
  • To assess if explainability is achieved in an application. The focus of the assessment lies in determining if the provided explainability achieves the defined objective [61].
The ultimate goal of the evaluation of quality of ML explanations is to assess to what extent the properties of explainability, i.e., interpretability (consisting of clarity, parsimony, and broadness) and fidelity (consisting of completeness and soundness), are satisfied (see Figure 2) [23].

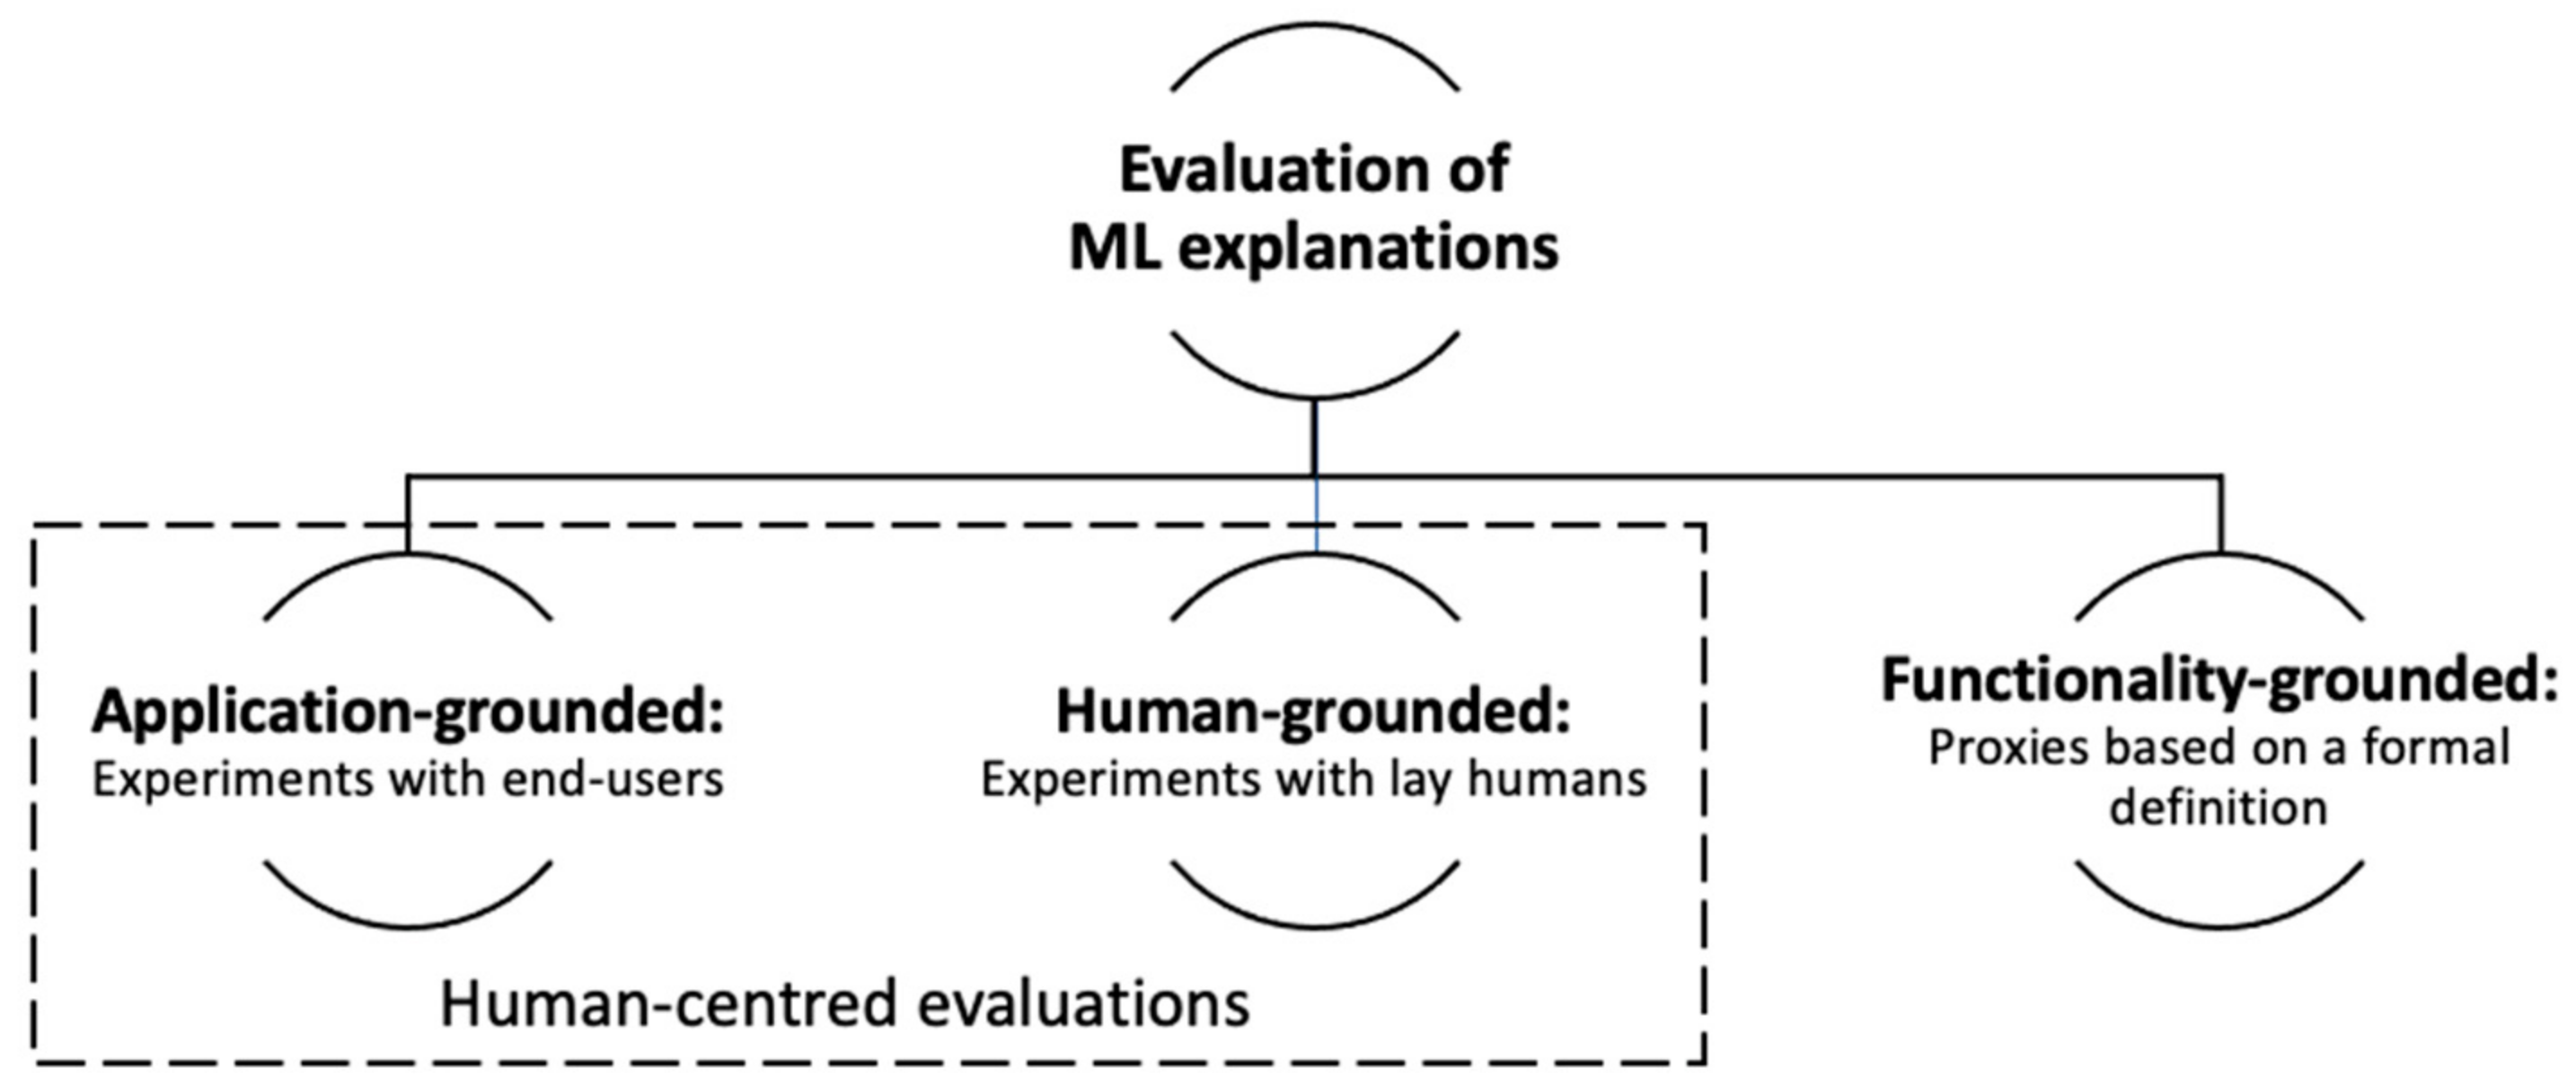
4.2. Taxonomy of Evaluation of ML Explanations

It is argued that two factors determine understandability of an ML system: the features of the ML system and the human’s capacity for understanding [62]. Understandability is a function of the two factors in combination. Therefore, the involvement of human users is important in the evaluation of ML explanations. A widely cited taxonomy of evaluation from Doshi-Velez and Kim [9] divided evaluation approaches into three categories (see Figure 3):
  • Application-grounded evaluation (experiments with end-users). This kind of evaluation requires conducting end-user experiments using the explanation within a real-world application. It directly tests the objective that the system is built for in a real-world application, and, thus, performance with respect to that objective gives strong evidence of the success of explanations. An important baseline for this is how well explanations assist in humans trying to complete tasks, such as decision-making tasks.
  • Human-grounded evaluation (experiments with lay humans). It refers to conducting simpler human–subject experiments that maintain the essence of the target application. Compared with the application-grounded evaluation, the experiments in this kind of evaluation are not carried out with the domain experts but with lay humans, allowing a big subject pool and less expenses for the evaluation. Ideally, this evaluation approach will depend only on the quality of the explanation, regardless of the types of explanations and the accuracy of the associated prediction.
  • Functionality-grounded evaluation (proxies based on a formal definition of interpretability). This kind of evaluation does not require human experiments. In this type of evaluation, some formal definition of interpretability serves as a proxy to evaluate the explanation quality, e.g., the depth of a decision tree.
Application-grounded and human-grounded evaluations depend on the selected pool of humans for various experimental tasks. In these evaluations, ML systems with explanations are repeatedly updated and evaluated with humans. Within human experiments, both qualitative and quantitative metrics can be used to evaluate explanation qualities. Qualitative metrics include asking about the usefulness of, satisfaction with, confidence in, and trust in provided explanations by means of interviews or questionnaires [3,63,64,65]. Quantitative metrics include measuring human-machine task performance in terms of accuracy, response time needed, likelihood to deviate, or ability to detect errors [3,66], and even physiological responses from humans during experimental tasks [67]. Functionality-grounded evaluation does not require human experiments and uses a formal definition of interpretability as a proxy for the explanation quality.
The advantages of application-grounded and human-grounded evaluations are that they can provide direct and strong evidence of success of explanations [9]. However, these evaluations are usually expensive and time-consuming because of invitation of humans and necessary approvals (e.g., Human Research Ethics Committees’ review) as well as additional time for experimental conductions. Most importantly, these evaluations are subjective. Comparatively, functionality-grounded evaluation can provide objective quantitative metrics without human experiments [60].

5. Application-Grounded and Human-Grounded Evaluations

Application-grounded and human-grounded evaluations use human experiments to assess the effectiveness of ML explanations. Doshi-Velez and Kim [9] mentioned four task-related factors for explanations:
  • Global vs. local explanation. Global explanation means explaining why patterns are present in general, while local explanation implies knowing the reasons for a specific decision (such as why a particular prediction was made).
  • Area and severity of incompleteness. This relates to incompletely specified inputs, constraints, domains, internal model structure, costs, or even the need to understand the training algorithm. The types of explanations needed may vary depending on whether the source of concern is due to different incompleteness. The severity of the incompleteness may also affect explanation needs.
  • Time constraints. This refers to the time that the user can afford to spend to understand the explanation. Different applications may have different times end-users can spend on the explanation. Such constraints may affect approaches and effectiveness of explanations.
  • Nature of user expertise. This is related to how experienced the user is in the task. The nature of user expertise will affect the level of sophistication of explanation, the organisation of explanation information, and others. For example, domain-users, machine learning researchers, and layman users have different background knowledge and communication styles.
These factors can impact the explanation goal of understandability and efficiency. Each of these factors can be isolated in human-grounded experiments in simulated tasks to determine which methods work best when they are presented.
In the current studies, there are at least two types of human studies on ML systems:
  • Studies using actual tasks to evaluate the performance of human and the system on the ML-informed decision-making tasks [68,69]. In these studies, participants are told to focus on making good decisions, but are flexible in terms of using ML to accomplish tasks.
  • Studies using proxy tasks to evaluate how well users are able to simulate the model’s decisions [6,70,71] or decision boundaries [72]. In such studies, participants are specifically instructed to pay attention to the ML to evaluate human’s mental model of the ML system with the system’s predictions and explanations, but do not necessarily evaluate how well users are able to perform real decision-making tasks with the ML system.
Besides evaluation tasks for ML explanations, the choice of evaluation metrics plays a critical role in the correct evaluation of ML systems. Two types of evaluation metrics can be found in explainable ML research (also see Figure 4):
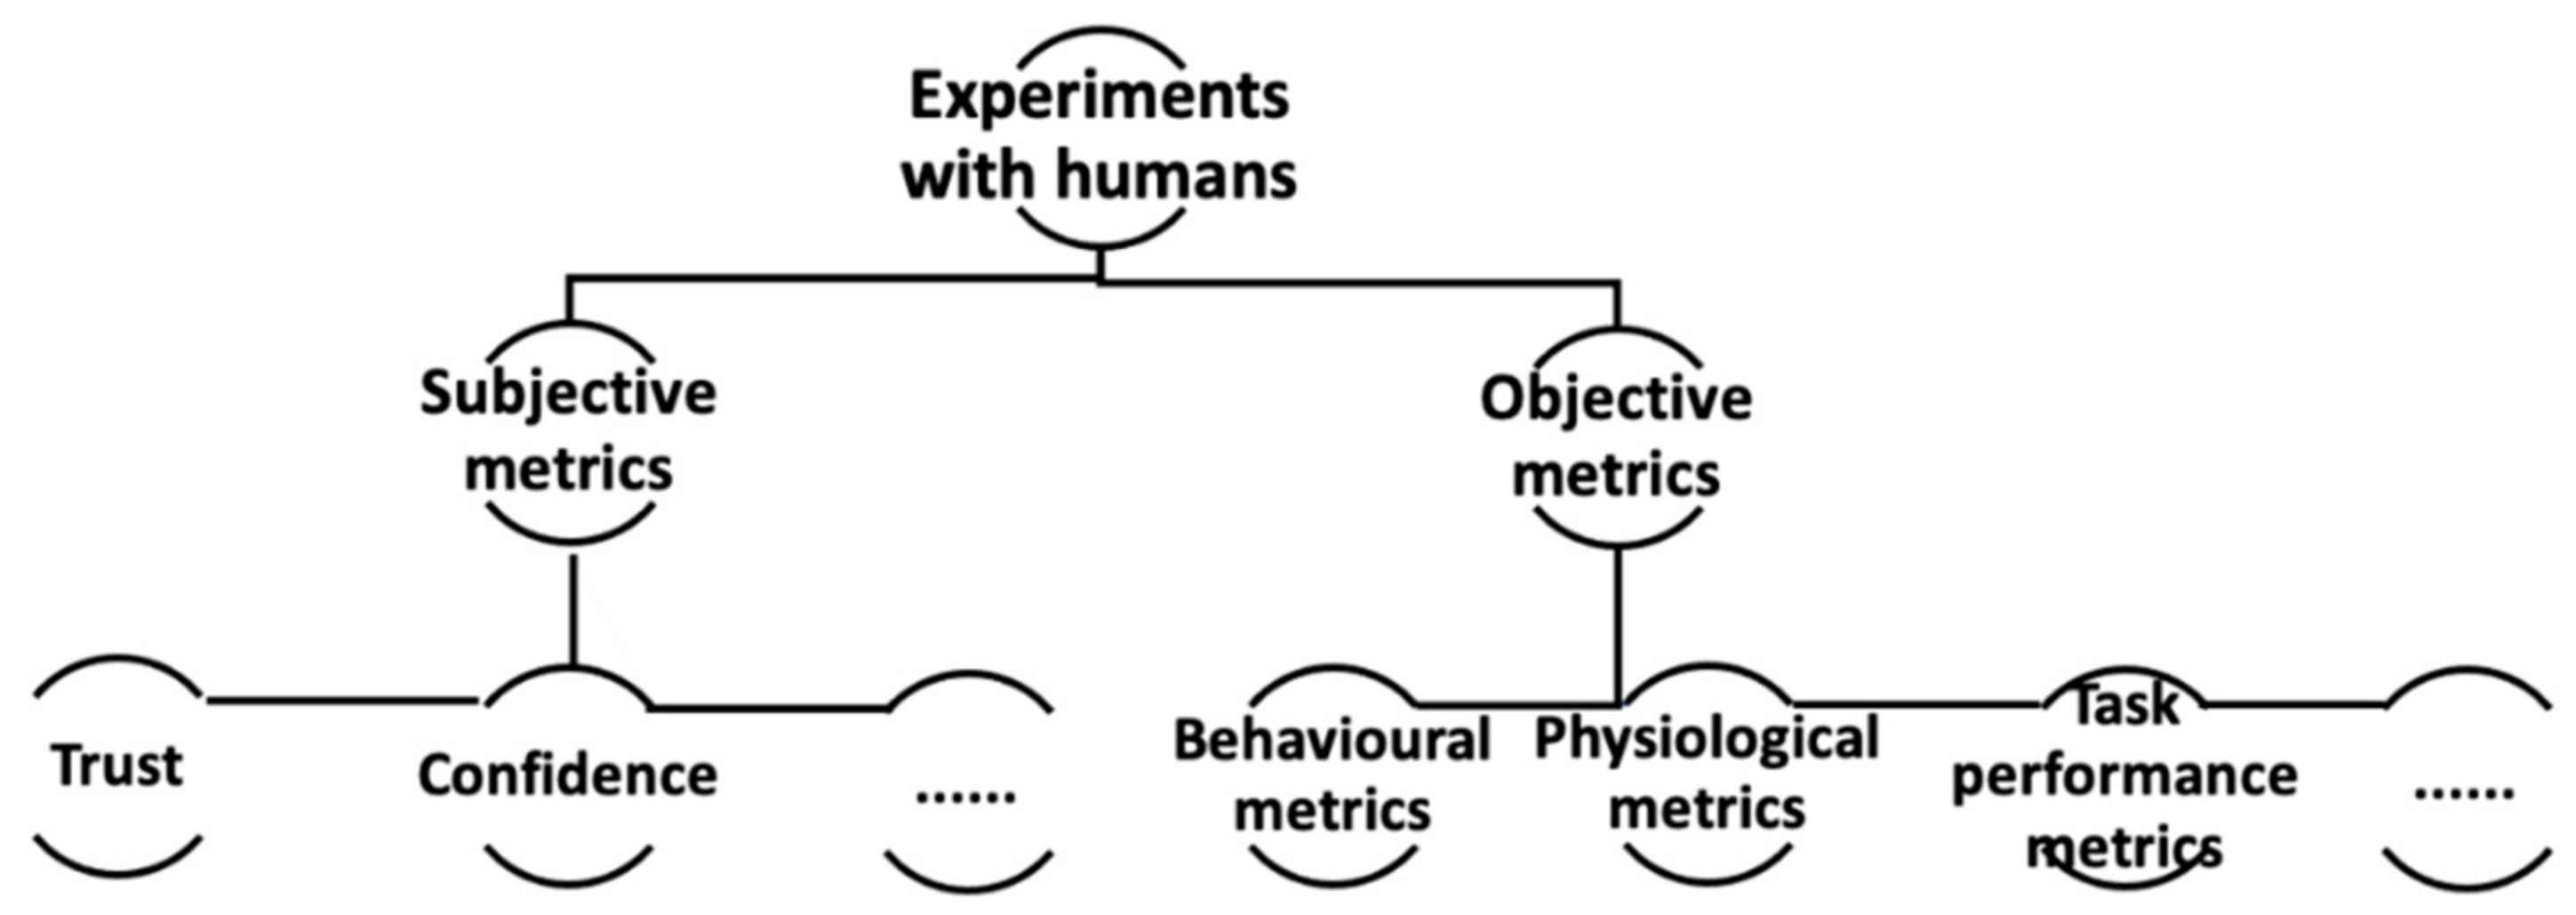
  • Subjective metrics. Subjective questionnaires are designed for users on tasks and explanations, and are asked during or after task time to obtain user’s subjective responses on tasks and explanations. Examples of subjective metrics are user trust, confidence, and preference (see Figure 4), which have been largely embraced as the focal point for the evaluation of explainable systems [33,64,65,73]. For example, Hoffman et al. [74] presented metrics for explainable systems that are grounded in the subjective evaluation of a system (e.g., user trust, satisfaction, and understanding). Zhou, et al. [65,75] investigated factors such as uncertainty and correlation that affect user confidence in ML-informed decision-making. Zhou et al. [64] found that the explanation of influence of training data points significantly affected user trust in ML-informed decision-making. Yu et al. [76] investigated the trust dynamics corresponding to ML performance changes. Holzinger et al. [77] developed a scale named System Causability Scale to quickly determine whether and to what extent an explanation or an explanation process itself is suitable for the intended purpose.
  • Objective metrics. This refers to objective information on tasks or humans before, after, or during the task time. Examples include human metrics, such as physiological and behaviour indicators of humans, during ML-informed decision-making, or task-related metrics, such as task time length and task performance [37] (see Figure 4). For example, Zhou et al. [37] found that physiological signals such as Galvanic Skin Response (GSR) and Blood Volume Pulse (BVP) showed significant differences with the explanation presentation influencing training data points [38] on ML predictions, and these physiological responses can be used as indicators of user trust to assess the quality of ML explanations. Based on approaches that quantify response times in user studies as well as agreement between human labels and model predictions [63,72], Schmidt and Biessmann [78] proposed that faster and more accurate decisions indicate intuitive understanding of explanations. A trust metric was then derived based on these explainability metrics.

6. Functionality-Grounded Evaluation Metrics

The ML explanation methods can also be divided into three types [23]:
  • Model-based explanations. It refers to explanations that use a model to explain original task models. In this category, either the task model itself (e.g., decision tree) is used as an explanation or more interpretable models are generated to explain the task model.
  • Attribution-based explanations. This kind of explanation ranks or measures the explanatory power of input features and use this to explain the task model. For example, feature importance [79] or influence [38,64] based explanation approaches belong to this category.
  • Example-based explanations. This kind of method explains the task model by selecting instances from the training/testing dataset or creating new instances. For example, selecting instances that are well predicted or not well predicted by the model as explanations, or creating counterfactual examples as explanations.
This section reviews quantitative metrics for measuring the quality of three types of explanation methods: model-based explanations, attribution-based explanations, and example-based explanations.

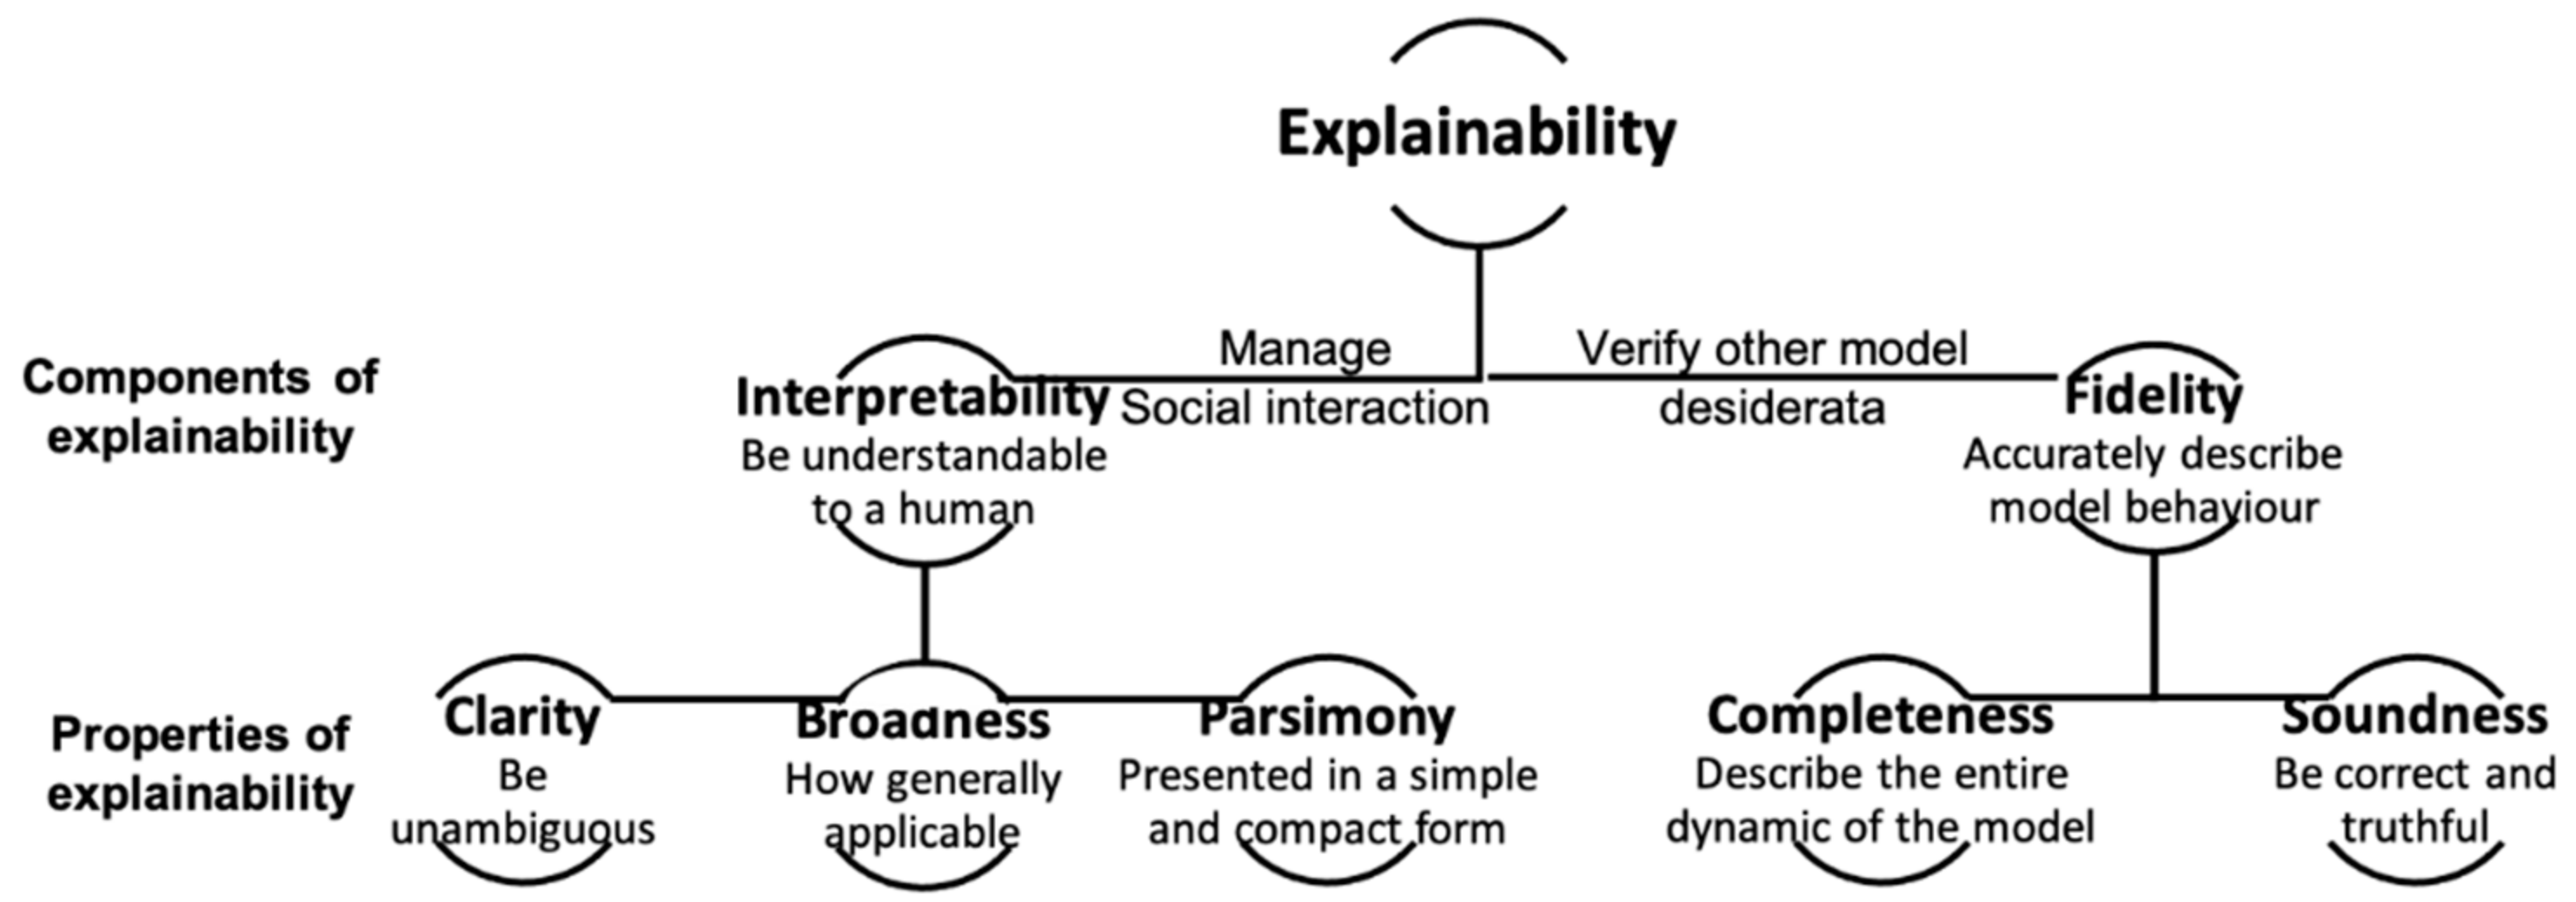
6.1. Explainability Properties

A general computational benchmark across all possible ML explanation methods is unlikely to be possible [80]. The explanation is an inherently subjective matter, and the perceived quality of an explanation is contextual and dependent on users, the explanation itself, and the type of information that users are interested in. As demonstrated in Section 2 on the definition of explainability, three properties of clarity, broadness, and parsimony can be used to describe interpretability and two properties of completeness. Soundness can be used to describe fidelity of explainability. One way to objectively evaluate explanations is to verify whether the explanation mechanism satisfies (or does not satisfy) certain axioms, or properties [34]. Therefore, various quantitative metrics are developed to objectively assess the quality of the explanation, according to these evaluation properties. These metrics can guide the practitioner in the selection of the most appropriate explanation method for tasks [80]. They are not to replace human-centred evaluations, but to guide the selection of a small subset of explanations to present to participants a user-study, improving the efficiency of the assessment of ML explanations.
Table 2 shows the summary of quantitative metrics for measuring the quality of three types of explanation methods (model-based explanations, attribution-based explanations, and example-based explanations) across three explainability properties for interpretability and two explainability properties for fidelity. The following subsections review these metrics in detail.

6.2. Quantitative Metrics for Model-Based Explanations

Since model-based explanations use the task model itself or create new models to explain ML, various metrics regarding the model are proposed to assess the quality of explanations. Since model size can reflect the complexity of models, it is used to measure the quality of model interpretability [14,46]. Examples of metrics based on model size for decision tree include the number of rules, length of rules, and depth of trees. In addition, model-agnostic metrics are proposed to measure the quality of explanations. Motivated by the definition of explainability with simulatability, which refers to a user’s ability to run a model on a given input, runtime operation counts [81] are introduced to measure the number of Boolean and arithmetic operations needed to run the explainable model for a given input. It is argued that model complexity and explainability are deeply intertwined and reducing complexity can help to make the model explanation more reliable and compact [89]. For example, the feature effect expresses how a change in a feature changes the predicted outcome. Based on this, the main effect complexity [46] is defined to measure the extent to which the effect on the model outcome changes with the value of features. The main effect complexity for each feature is measured by the number of parameters needed to approximate the accumulated local effect with a piece-wise linear model. The overall main effect complexity is obtained by averaging the main effects weighted by their variance of all features [23]. If there are interactions between features, the prediction cannot be expressed as a sum of independent feature effects. Therefore, interaction strength [23,46] is defined to measure the extent to which the effect of features depends on values of other features. It is measured by approximating errors between a model consisting of the sum of accumulated local effects and the original task model with interactions.
The above metrics of model size, runtime operation counts, main effect complexity, and interaction strength are used to evaluate the parsimony/simplicity of local and global model-based explanations. Furthermore, the level of (dis)agreement [82] is defined as the percentage of predictions that are the same between the task model and model explanations, which can be used to quantify the clarity of interpretability and soundness of fidelity of ML systems (see Table 2).

6.3. Quantitative Metrics for Attribution-Based Explanations

Attribution-based explanations are the major body of ML explanations in the current literature [10]. Therefore, many approaches are proposed to assess the quality of such explanations.
Feature extraction is leveraged to create an interpretable data representation. Since this processing may change the information content of the original data samples, Nguyen and Martinez [80] proposed to use feature mutual information between original samples and corresponding features extracted for explanations to monitor simplicity and broadness of explanations, while the target mutual information between extracted features and corresponding targets to monitor fidelity of explanations. Nguyen and Martinez [80] also defined monotonicity, non-sensitivity, and effective complexity for the assessment of explanation qualities with individual features. In order to measure the strength and direction of association between attributes and explanations, monotonicity is proposed as an explanation metric, which is defined as the Spearman’s correlation between feature’s absolute performance measure of interest and corresponding expectations. In order to ensure that zero-importance is only assigned to features to which the model is not functionally dependent on, non-sensitivity is proposed as an explanation metric, which is defined as the cardinality of the symmetric difference between features with assigned zero attribution and features to which the model is not functionally dependent on. Furthermore, in order to assess effects of non-important features, effective complexity is defined to be the minimum number of attribution-ordered features that can meet an expected performance measure of interest. Among these metrics, monotonicity and non-sensitivity are indicative of how faithful a feature attribution explanation is. A low effective complexity means that some of the features can be ignored, even if they do have an effect (reduced cognitive salience) because the effect is actually small (non-sensitivity). Explanations with low effective complexity are both simple and broad.
Ancona et al. [88] proposed an approach called sensitivity-n to test the gradient-based attribution methods in deep neural networks. An attribution method satisfies sensitivity-n when the sum of the attributions for any subset of features of cardinality n is equal to the variation of the output caused removing the features in the subset [88]. In this method, if all the models satisfy sensitivity-n for all n, it can be concluded that the model explanation behaves linearly and sensitivity-n is used to measure the soundness of fidelity of explanations. However, it is not clear how to use this metric to compare the methods in terms of explanation. Perturbations are often used in ML explanations. Sensitivity [84,85] is proposed to measure the degree to which the explanation is affected by insignificant perturbations from the test point. Yeh et al. [84] also proposed to improve the sensitivity of explanations by smoothing explanations.
A commonly used strategy for feature importance estimations is to remove one feature from the input and look at its effect on the model performance. However, if a subset of features removed has a different distribution from the training data, it is unclear whether the degradation in model performance comes from the distribution shift or because of features removed. For this reason, Hooker et al. [86] presented a re-training strategy (RemOve And Retrain—ROAR) as a metric for explanation evaluation. The strategy approximates accuracy of feature importance estimates in deep neural networks by removing data points estimated to be most important with a fixed, uninformative value and retraining the model to measure the change to the model. Since a re-trained model may give little insight about the decision process of the original model to be explained, this re-training strategy measures the data explanation to some degree. Ribeiro et al. [33] used the recall of truly important features to measure the soundness of fidelity of explanations. Sundararajan et al. [85] argued that explanations should always be two identical, functionally equivalent, neural models, and, therefore, defined a metric of implementation invariance to evaluate this attribute.
In order to make sure the explanatory behaviour for the corresponding explanations of two data points are closely identical if two closely identical data points have a closely identical model response, explanation continuity is defined as a quality metric [87]. In order to assess the ability of an explanation to give relevance to variables that have the strongest impact on the prediction value, explanation selectivity [87] is defined to measure how fast the prediction value goes down when removing features with the highest relevance scores (see Table 2).

6.4. Quantitative Metrics for Example-Based Explanations

Example-based explanations provide a summarised overview of a model using representative examples or high-level concepts [80,90,91]. Nguyen and Martinez [80] defined quantitative metrics to assess example-based explanations. First, since examples are often limited, the representativeness of examples for the explanations need to be evaluated. Non-representativeness [80] is defined to assess the representativeness of examples for explanations, which measures the fidelity of the explanation. Second, it is argued that a highly diverse set of examples may demonstrate the high degree of integration of the explanation. Therefore, diversity [80] is defined and used to measure the degree of integration of the explanation (see Table 2). Furthermore, the simplicity of the explanation is encoded in the number of examples used for the computation of non-representativeness and diversity. The least number of examples, the easier it is for a human to process the explanation [80].

7. Discussion

The explanation is indispensable for ML solutions, especially in high-stake applications where life and health of humans are involved or when there is potential of a huge valuable source and monetary losses. Most of the work in the ML explanation research field focuses on the development of new methods and techniques to improve explainability. While numerous explanation methods have been explored, there is a need for evaluations to quantify the quality of explanation methods [23] to determine if the offered explainability achieves the defined objective, and compare available explanation methods and suggest the best explanation from the comparison. This paper reviews methods and metrics that the current research has investigated to achieve these goals of explanation evaluations.

7.1. Human-Centred Evaluations

First of all, the quality evaluation of ML explanations is inherently a subject concept. Therefore, human-centered evaluations are indispensable to the overall quality evaluations. Since human-centered evaluations employ experiments with end-users or lay humans to assess the quality of explanations, subjective measures, such as trust and confidence, have been embraced as the focal point for the evaluation of explainable systems [33,64,65,69,92,93]. Despite various investigations on human-centred evaluations, there are no agreed criteria on human-centred evaluations, especially human experimental design and subjective measures to be used, which make it hard to compare the quality of different evaluations. Various compelling open questions can be proposed for these aspects. For example, what subjective measures should be used for an explanation evaluation? What are human’s tasks in experiments? How many participants should be recruited and what are their background? It is understandable that human-centred evaluations are dependent on application domains and target users. However, from a practical perspective, we argue that the criteria on common components in human-centred evaluations are helpful for effective evaluations. Therefore, the future work of the human-centred evaluations needs to focus on the investigation of effective user experiment designs as well as innovative approaches used to collect subjective measures for explanation evaluations. It is expected that these investigations can help reach agreed criteria on human-centred evaluations in order to simplify the comparison of different explanations.

7.2. Functionality-Grounded Evaluations

Functionality-grounded objective evaluations occupy the major body in the current literature to evaluate ML explanations. As summarised in Table 2, it is found that quantitative evaluation metrics, which are important for objective evaluation, are still in shortage according to explainability properties (e.g., clarity) or types of explanators (e.g., example-based methods). First, from the explanation type’s perspective, investigations have put an emphasis on the attribution-based explanations and more quantitative metrics have been proposed for this type of explanation. This may be because most of the current explanations themselves are on attribution-based explanations. The future work on evaluations needs to pay more attention to other types of explanations, especially example-based explanations. Second, from the explainability properties’ perspective, investigations have focused more on the evaluation of soundness of fidelity of explanations, which is how accurate the explanation is. However, other explainability properties, such as clarity and broadness of interpretability as well as completeness of fidelity, are also important for users to understand the quality of explanations. It is also interesting to find that the quantitative metrics for both model-based and example-based explanations are primarily used to evaluate the parsimony/simplicity of interpretability, while the quantitative metrics for attribution-based explanations are primarily used to evaluate the soundness of fidelity of explainability. Therefore, future work on objective evaluations needs to focus more on explainability properties of clarity and broadness of interpretability as well as completeness of fidelity with a consideration of the types of explanators.

7.3. Comparison of Explanations

Despite quantitative proxy metrics being necessary for an objective assessment of explanation quality and a formal comparison of explanation methods, they should be complemented with human-centred evaluation methods in practices because good performance of quantitative metrics may not give direct evidence of success [92]. Therefore, human-centred subjective evaluations and functionality-grounded objective evaluations need to be integrated together to evaluate explanations comprehensively. It is also helpful for practitioners to know the contribution of each metric in the comprehensive evaluation when integrating subjective and objective evaluations together.
After both human-centred evaluation metrics and functionality-grounded evaluation metrics are obtained for explanations, it is important to compare different explanations by considering these evaluation metrics together and suggest the most appropriate explanation for users. However, little research has been found in this area from the current findings. The most appropriate explanation depends on the task and on the target user of the explanation. These two aspects will define the trade-off among explainability properties of clarity, broadness, parsimony, completeness, and soundness.
The evaluation of ML explanations is a multidisciplinary research, which covers the research on human-computer interaction, machine learning, and visualisation as well as other areas. It is also not possible to define an implementation of metrics, which can be applied to all the state-of-the-art explanation methods because of the contextual nature of explanations [80]. All these give us cues to develop approaches for effective evaluation of the ML explanation quality under the right direction with appropriate techniques.

8. Conclusions

This survey presented a comprehensive overview of methods proposed in the current literature for the evaluation of ML explanations. By reviewing the definition of explainability, we listed properties of ML explainability to which the evaluation of explanations should meet. We then connected the properties of explainability with categories of ML explanation methods. It was found that the quantitative metrics for both model-based and example-based explanations are primarily used to evaluate the parsimony/simplicity of interpretability, while the quantitative metrics for attribution-based explanations are primarily used to evaluate the soundness of fidelity of explainability. The survey also demonstrated that subjective measures, such as trust and confidence, have been embraced as the focal point for the human-centred evaluation of explainable systems. However, there are no agreed criteria on important aspects related to human experimental designs and subjective measures to be used in human-centred evaluations. We concluded that the evaluation of ML explanations is a multidisciplinary research. It is not possible to define an implementation of evaluation metrics, which can be applied to all explanation methods. Future work needs to consider these aspects to develop approaches for effective evaluation of the ML explanation quality.

Author Contributions

Conceptualisation, J.Z., A.H.G., and F.C.; Data (paper) collection, J.Z., A.H.G., and A.H.; Formal analysis, J.Z., A.H.G., F.C., and A.H.; Writing—original draft, J.Z. and A.H.G.; Writing—reviewing and editing, A.H. and F.C.; Project administration, A.H.G. and F.C.; Funding acquisition, A.H.G. All authors have read and agreed to the published version of the manuscript.

Funding

University of Technology Sydney Internal Fund for A.H.G. Parts of this work has received funding by the Austrian Science Fund (FWF), Project: P-32554 xAI.

Conflicts of Interest

The authors declare no conflict of interest.

References

  1. Taddeo, M.; Floridi, L. How AI Can Be a Force for Good. Science 2018, 361, 751–752. [Google Scholar] [CrossRef] [PubMed] [Green Version]
  2. Zhou, J.; Chen, F. AI in the public interest. In Closer to the Machine: Technical, Social, and Legal Aspects of AI; Bertram, C., Gibson, A., Nugent, A., Eds.; Office of the Victorian Information Commissioner: Melbourne, Australia, 2019. [Google Scholar]
  3. Zhou, J.; Chen, F. (Eds.) Human and Machine Learning: Visible, Explainable, Trustworthy and Transparent; Human–Computer Interaction Series; Springer: Berlin/Heidelberg, Germany, 2018; ISBN 978-3-319-90402-3. [Google Scholar]
  4. Lee, B.; Kim, N.; Kim, E.-S.; Jang, K.; Kang, M.; Lim, J.-H.; Cho, J.; Lee, Y. An Artificial Intelligence Approach to Predict Gross Primary Productivity in the Forests of South Korea Using Satellite Remote Sensing Data. Forests 2020, 11, 1000. [Google Scholar] [CrossRef]
  5. Liu, M.; Liu, J.; Chen, Y.; Wang, M.; Chen, H.; Zheng, Q. AHNG: Representation Learning on Attributed Heterogeneous Network. Inform. Fusion 2019, 50, 221–230. [Google Scholar] [CrossRef]
  6. Zhou, J.; Khawaja, M.A.; Li, Z.; Sun, J.; Wang, Y.; Chen, F. Making Machine Learning Useable by Revealing Internal States Update—A Transparent Approach. Int. J. Comput. Sci. Eng. 2016, 13, 378–389. [Google Scholar] [CrossRef]
  7. Castelvecchi, D. Can We Open the Black Box of AI? Nat. News 2016, 538, 20. [Google Scholar] [CrossRef] [Green Version]
  8. Schneeberger, D.; Stöger, K.; Holzinger, A. The European Legal Framework for Medical AI. In Proceedings of the Machine Learning and Knowledge Extraction, Dublin, Ireland, 25–28 August 2020; pp. 209–226. [Google Scholar]
  9. Doshi-Velez, F.; Kim, B. Towards A Rigorous Science of Interpretable Machine Learning. arXiv 2017, arXiv:1702.08608. [Google Scholar]
  10. Arya, V.; Bellamy, R.K.E.; Chen, P.-Y.; Dhurandhar, A.; Hind, M.; Hoffman, S.C.; Houde, S.; Liao, Q.V.; Luss, R.; Mojsilović, A.; et al. One Explanation Does Not Fit All: A Toolkit and Taxonomy of AI Explainability Techniques. arXiv 2019, arXiv:1909.03012. [Google Scholar]
  11. Holzinger, K.; Mak, K.; Kieseberg, P.; Holzinger, A. Can We Trust Machine Learning Results? Artificial Intelligence in Safety-Critical Decision Support. ERCIM News 2018, 112, 42–43. [Google Scholar]
  12. Gunning, D.; Aha, D. DARPA’s Explainable Artificial Intelligence (XAI) Program. AIMag 2019, 40, 44–58. [Google Scholar] [CrossRef]
  13. Hagras, H. Toward Human-Understandable, Explainable AI. Computer 2018, 51, 28–36. [Google Scholar] [CrossRef]
  14. Guidotti, R.; Monreale, A.; Ruggieri, S.; Turini, F.; Giannotti, F.; Pedreschi, D. A Survey of Methods for Explaining Black Box Models. ACM Comput. Surv. (CSUR) 2018, 51, 1–42. [Google Scholar] [CrossRef] [Green Version]
  15. Holzinger, A. From Machine Learning to Explainable AI. In Proceedings of the 2018 World Symposium on Digital Intelligence for Systems and Machines (DISA), Kosice, Slovakia, 23–25 August 2018; pp. 55–66. [Google Scholar]
  16. Goebel, R.; Chander, A.; Holzinger, K.; Lecue, F.; Akata, Z.; Stumpf, S.; Kieseberg, P.; Holzinger, A. Explainable AI: The New 42? In Proceedings of the Machine Learning and Knowledge Extraction, Hamburg, Germany, 27–30 August 2018; pp. 295–303. [Google Scholar]
  17. Carvalho, D.V.; Pereira, E.M.; Cardoso, J.S. Machine Learning Interpretability: A Survey on Methods and Metrics. Electronics 2019, 8, 832. [Google Scholar] [CrossRef] [Green Version]
  18. Lage, I.; Doshi-Velez, F. Human-in-the-Loop Learning of Interpretable and Intuitive Representations. In Proceedings of the ICML Workshop on Human Interpretability in Machine Learning, Vienna, Austria, 17 July 2020. [Google Scholar]
  19. Holzinger, A. Interactive Machine Learning for Health Informatics: When Do We Need the Human-in-the-Loop? Brain Inf. 2016, 3, 119–131. [Google Scholar] [CrossRef] [PubMed] [Green Version]
  20. Keim, D.A.; Mansmann, F.; Schneidewind, J.; Thomas, J.; Ziegler, H. Visual Analytics: Scope and Challenges. In Visual Data Mining: Theory, Techniques and Tools for Visual Analytics; Simoff, S.J., Böhlen, M.H., Mazeika, A., Eds.; Lecture Notes in Computer Science; Springer: Berlin/Heidelberg, Germany, 2008; pp. 76–90. ISBN 978-3-540-71080-6. [Google Scholar]
  21. Rüping, S. Learning Interpretable Models. Ph.D. Thesis, University of Dortmund, Dortmund, Germany, 2006. [Google Scholar]
  22. Rudin, S. Stop Explaining Black Box Machine Learning Models for High Stakes Decisions and Use Interpretable Models Instead. Nat. Mach. Intell. 2019, 1, 206–215. [Google Scholar] [CrossRef] [Green Version]
  23. Markus, A.F.; Kors, J.A.; Rijnbeek, P.R. The Role of Explainability in Creating Trustworthy Artificial Intelligence for Health Care: A Comprehensive Survey of the Terminology, Design Choices, and Evaluation Strategies. arXiv 2020, arXiv:2007.15911. [Google Scholar]
  24. Pearl, J. Causality: Models, Reasoning, and Inference, 2nd ed.; Cambridge University Press: Cambridge, UK, 2009; ISBN 978-0-521-89560-6. [Google Scholar]
  25. Holzinger, A.; Langs, G.; Denk, H.; Zatloukal, K.; Müller, H. Causability and Explainability of Artificial Intelligence in Medicine. WIREs Data Min. Knowl. Discov. 2019, 9, e1312. [Google Scholar] [CrossRef] [PubMed] [Green Version]
  26. Stickel, C.; Ebner, M.; Holzinger, A. The XAOS Metric—Understanding Visual Complexity as Measure of Usability. In Proceedings of the HCI in Work and Learning, Life and Leisure; Leitner, G., Hitz, M., Holzinger, A., Eds.; Springer: Berlin/Heidelberg, Germany, 2010; pp. 278–290. [Google Scholar]
  27. Miller, T. Explanation in Artificial Intelligence: Insights from the Social Sciences. Artif. Intell. 2019, 267, 1–38. [Google Scholar] [CrossRef]
  28. Adadi, A.; Berrada, M. Peeking Inside the Black-Box: A Survey on Explainable Artificial Intelligence (XAI). IEEE Access 2018, 6, 52138–52160. [Google Scholar] [CrossRef]
  29. Gilpin, L.H.; Bau, D.; Yuan, B.Z.; Bajwa, A.; Specter, M.; Kagal, L. Explaining Explanations: An Overview of Interpretability of Machine Learning. In Proceedings of the 2018 IEEE 5th International Conference on Data Science and Advanced Analytics (DSAA), Turin, Italy, 1–4 October 2018; pp. 80–89. [Google Scholar]
  30. Lombrozo, T. Explanatory Preferences Shape Learning and Inference. Trends Cognit. Sci. 2016, 20, 748–759. [Google Scholar] [CrossRef]
  31. Verma, S.; Dickerson, J.; Hines, K. Counterfactual Explanations for Machine Learning: A Review. arXiv 2020, arXiv:2010.10596. [Google Scholar]
  32. Mi, J.-X.; Li, A.-D.; Zhou, L.-F. Review Study of Interpretation Methods for Future Interpretable Machine Learning. IEEE Access 2020, 8, 191969–191985. [Google Scholar] [CrossRef]
  33. Ribeiro, M.T.; Singh, S.; Guestrin, C. “Why Should I Trust You?”: Explaining the Predictions of Any Classifier. Proceeding of the 22nd ACM SIGKDD International Conference on Knowledge Discovery and Data Mining, San Francisco, CA USA, 13–17 August 2016; pp. 1135–1144. [Google Scholar]
  34. Lundberg, S.M.; Lee, S.-I. A Unified Approach to Interpreting Model Predictions. In Proceedings of the Advances in Neural Information Processing Systems (NIPS2017), Long Beach, CA, USA, 4–9 December 2017; Volume 30, pp. 4765–4774. [Google Scholar]
  35. Nguyen, A.; Yosinski, J.; Clune, J. Multifaceted Feature Visualization: Uncovering the Different Types of Features Learned By Each Neuron in Deep Neural Networks. arXiv 2016, arXiv:1602.03616. [Google Scholar]
  36. Molnar, C. Interpretable Machine Learning. Available online: https://originalstatic.aminer.cn/misc/pdf/Molnar-interpretable-machine-learning_compressed.pdf (accessed on 21 February 2019).
  37. Zhou, J.; Hu, H.; Li, Z.; Yu, K.; Chen, F. Physiological Indicators for User Trust in Machine Learning with Influence Enhanced Fact-Checking. In International Cross-Domain Conference for Machine Learning and Knowledge Extraction; Holzinger, A., Kieseberg, P., Tjoa, A.M., Weippl, E., Eds.; Springer: Cham, Switzerland, 2019; pp. 94–113. [Google Scholar]
  38. Koh, P.W.; Liang, P. Understanding Black-Box Predictions via Influence Functions. In Proceedings of the ICML 2017, Sydney, Australia, 9 July 2017. [Google Scholar]
  39. Hinton, G.; Vinyals, O.; Dean, J. Distilling the Knowledge in a Neural Network. arXiv 2015, arXiv:1503.02531. [Google Scholar]
  40. Chen, X.; Duan, Y.; Houthooft, R.; Schulman, J.; Sutskever, I.; Abbeel, P. InfoGAN: Interpretable Representation Learning by Information Maximizing Generative Adversarial Nets. arXiv 2016, arXiv:1606.03657. [Google Scholar]
  41. Hendricks, L.A.; Akata, Z.; Rohrbach, M.; Donahue, J.; Schiele, B.; Darrell, T. Generating Visual Explanations. arXiv 2016, arXiv:1603.08507. [Google Scholar]
  42. Zhang, Q.; Wu, Y.N.; Zhu, S. Interpretable Convolutional Neural Networks. In Proceedings of the 2018 IEEE/CVF Conference on Computer Vision and Pattern Recognition, Salt Lake City, UT, USA, 18–22 June 2018; pp. 8827–8836. [Google Scholar]
  43. Explaining Decisions Made with AI: Draft Guidance for Consultation—Part 1: The Basics of Explaining AI; ICO & The Alan Turing Institute: Wilmslow/Cheshire, UK, 2019; p. 19.
  44. Webb, M.E.; Fluck, A.; Magenheim, J.; Malyn-Smith, J.; Waters, J.; Deschênes, M.; Zagami, J. Machine Learning for Human Learners: Opportunities, Issues, Tensions and Threats. Educ. Tech. Res. Dev. 2020. [Google Scholar] [CrossRef]
  45. Zhou, J.; Chen, F.; Berry, A.; Reed, M.; Zhang, S.; Savage, S. A Survey on Ethical Principles of AI and Implementations. In Proceedings of the 2020 IEEE Symposium Series on Computational Intelligence (IEEE SSCI), Canberra, Australia, 1–4 December 2020. [Google Scholar]
  46. Molnar, C.; Casalicchio, G.; Bischl, B. Interpretable Machine Learning—A Brief History, State-of-the-Art and Challenges. arXiv 2020, arXiv:2010.09337. [Google Scholar]
  47. Becker, B.; Kohavi, R.; Sommerfield, D. Visualizing the Simple Bayesian Classifier. In Information Visualization in Data Mining and Knowledge Discovery; Morgan Kaufmann Publishers Inc: San Francisco, CA, USA, 2001; pp. 237–249. [Google Scholar]
  48. Caragea, D.; Cook, D.; Honavar, V.G. Gaining Insights into Support Vector Machine Pattern Classifiers Using Projection-Based Tour Methods. In Proceedings of the Seventh ACM SIGKDD International Conference on Knowledge Discovery and Data Mining, San Francisco, CA, USA, 26–29 August 2001; pp. 251–256. [Google Scholar]
  49. Erra, U.; Frola, B.; Scarano, V. An Interactive Bio-Inspired Approach to Clustering and Visualizing Datasets. In Proceedings of the 15th International Conference on Information Visualisation 2011, London, UK, 13–15 July 2011; pp. 440–447. [Google Scholar]
  50. Paiva, J.G.; Florian, L.; Pedrini, H.; Telles, G.; Minghim, R. Improved Similarity Trees and Their Application to Visual Data Classification. IEEE Trans. Vis. Comput. Graph. 2011, 17, 2459–2468. [Google Scholar] [CrossRef] [PubMed]
  51. Guo, Z.; Ward, M.O.; Rundensteiner, E.A. Nugget Browser: Visual Subgroup Mining and Statistical Significance Discovery in Multivariate Datasets. In Proceedings of the 2011 15th International Conference on Information Visualisation, London, UK, 13–15 July 2011; IEEE Computer Society: Washington, DC, USA, 2011; pp. 267–275. [Google Scholar]
  52. Talbot, J.; Lee, B.; Kapoor, A.; Tan, D.S. EnsembleMatrix: Interactive Visualization to Support Machine Learning with Multiple Classifiers. In Proceedings of the SIGCHI Conference on Human Factors in Computing Systems, Boston, MA, USA, 4–9 April 2009; pp. 1283–1292. [Google Scholar]
  53. Amershi, S.; Chickering, M.; Drucker, S.M.; Lee, B.; Simard, P.; Suh, J. ModelTracker: Redesigning Performance Analysis Tools for Machine Learning. In Proceedings of the 33rd Annual ACM Conference on Human Factors in Computing Systems, Seoul, Korea, 18–23 April 2015; pp. 337–346. [Google Scholar]
  54. Chen, D.; Bellamy, R.K.E.; Malkin, P.K.; Erickson, T. Diagnostic Visualization for Non-Expert Machine Learning Practitioners: A Design Study. In Proceedings of the 2016 IEEE Symposium on Visual Languages and Human-Centric Computing (VL/HCC), Cambridge, UK, 4–8 September 2016; pp. 87–95. [Google Scholar]
  55. Neto, M.P.; Paulovich, F.V. Explainable Matrix—Visualization for Global and Local Interpretability of Random Forest Classification Ensembles. IEEE Trans. Vis. Comput. Graph. 2020. [Google Scholar] [CrossRef] [PubMed]
  56. Chan, G.Y.-Y.; Bertini, E.; Nonato, L.G.; Barr, B.; Silva, C.T. Melody: Generating and Visualizing Machine Learning Model Summary to Understand Data and Classifiers Together. arXiv 2020, arXiv:2007.10614. [Google Scholar]
  57. Zhou, J.; Huang, W.; Chen, F. A Radial Visualisation for Model Comparison and Feature Identification. In Proceedings of the IEEE PacificVis 2020, Tianjin, China, 14–17 April 2020. [Google Scholar]
  58. Gomez, O.; Holter, S.; Yuan, J.; Bertini, E. ViCE: Visual Counterfactual Explanations for Machine Learning Models. In Proceedings of the 25th International Conference on Intelligent User Interfaces, Cagliari, Italy, 17 March 2020; Association for Computing Machinery: New York, NY, USA, 2020; pp. 531–535. [Google Scholar]
  59. Wongsuphasawat, K.; Smilkov, D.; Wexler, J.; Wilson, J.; Mané, D.; Fritz, D.; Krishnan, D.; Viégas, F.B.; Wattenberg, M. Visualizing Dataflow Graphs of Deep Learning Models in TensorFlow. IEEE Trans. Vis. Comput. Graph. 2018, 24, 1–12. [Google Scholar] [CrossRef] [PubMed]
  60. Samek, W.; Montavon, G.; Vedaldi, A.; Hansen, L.K.; Müller, K.-R. (Eds.) Explainable AI: Interpreting, Explaining and Visualizing Deep Learning; Lecture Notes in Artificial Intelligence, Lect.Notes ComputerState-of-the-Art Surveys; Springer: Berlin/Heidelberg, Germany, 2019; ISBN 978-3-030-28953-9. [Google Scholar]
  61. Lipton, Z.C. The Mythos of Model Interpretability: In Machine Learning, the Concept of Interpretability Is Both Important and Slippery. Queue 2018, 16, 31–57. [Google Scholar] [CrossRef]
  62. Holland Michel, A. The Black Box, Unlocked: Predictability and Understand-Ability in Military AI; United Nations Institute for Disarmament Research: Geneva, Switzerland, 2020. [Google Scholar]
  63. Huysmans, J.; Dejaeger, K.; Mues, C.; Vanthienen, J.; Baesens, B. An Empirical Evaluation of the Comprehensibility of Decision Table, Tree and Rule Based Predictive Models. Decis. Support Syst. 2011, 51, 141–154. [Google Scholar] [CrossRef]
  64. Zhou, J.; Li, Z.; Hu, H.; Yu, K.; Chen, F.; Li, Z.; Wang, Y. Effects of Influence on User Trust in Predictive Decision Making. In Proceedings of the 2019 CHI Conference on Human Factors in Computing Systems, Glasgow, Scotland, UK, 4–9 May 2019; pp. 1–6. [Google Scholar]
  65. Zhou, J.; Arshad, S.Z.; Yu, K.; Chen, F. Correlation for User Confidence in Predictive Decision Making. In Proceedings of the 28th Australian Conference on Computer-Human Interaction, OzCHI 2016, Launceston, TAS, Australia, 29 November–2 December 2016. [Google Scholar]
  66. Poursabzi-Sangdeh, F.; Goldstein, D.G.; Hofman, J.M.; Vaughan, J.W.; Wallach, H. Manipulating and Measuring Model Interpretability. arXiv 2019, arXiv:1802.07810. [Google Scholar]
  67. Zhou, J.; Sun, J.; Chen, F.; Wang, Y.; Taib, R.; Khawaji, A.; Li, Z. Measurable Decision Making with GSR and Pupillary Analysis for Intelligent User Interface. ACM Trans. Comput.-Hum. Interact. 2015, 21, 33. [Google Scholar] [CrossRef]
  68. Bansal, G.; Nushi, B.; Kamar, E.; Lasecki, W.; Weld, D.S.; Horvitz, E. Beyond Accuracy: The Role of Mental Models in Human-AI Team Performance. In Proceedings of the AAAI Conference on Human Computationand Crowdsourcing, Stevenson, WA, USA, 28–30 October 2019; p. 10. [Google Scholar]
  69. Yu, K.; Berkovsky, S.; Taib, R.; Conway, D.; Zhou, J.; Chen, F. User Trust Dynamics: An Investigation Driven by Differences in System Performance. In Proceedings of the IUI 2017, Limassol, Cyprus, 13–16 March 2017. [Google Scholar]
  70. Lage, I.; Chen, E.; He, J.; Narayanan, M.; Kim, B.; Gershman, S.J.; Doshi-Velez, F. Human Evaluation of Models Built for Interpretability. In Proceedings of the AAAI Conference on Human Computation and Crowdsourcing, Skamania Lodge, WA, USA, 28 October 2019; Volume 7, pp. 59–67. [Google Scholar]
  71. Chang, J.; Boyd-Graber, J.; Gerrish, S.; Wang, C.; Blei, D.M. Reading Tea Leaves: How Humans Interpret Topic Models. In Proceedings of the 22nd International Conference on Neural Information Processing Systems, Vancouver, BC, Canada, 7–10 December 7 2009; Curran Associates Inc.: Red Hook, NY, USA, 2009; pp. 288–296. [Google Scholar]
  72. Lakkaraju, H.; Bach, S.H.; Leskovec, J. Interpretable Decision Sets: A Joint Framework for Description and Prediction. In Proceedings of the 22nd ACM SIGKDD International Conference on Knowledge Discovery and Data Mining, San Francisco, CA, USA, 13–17 August 2016; pp. 1675–1684. [Google Scholar]
  73. Weitz, K.; Schiller, D.; Schlagowski, R.; Huber, T.; André, E. “Do You Trust Me?”: Increasing User-Trust by Integrating Virtual Agents in Explainable AI Interaction Design. In Proceedings of the 19th ACM International Conference on Intelligent Virtual Agents, Paris, France, 2–5 July 2019; pp. 7–9. [Google Scholar]
  74. Hoffman, R.R.; Mueller, S.T.; Klein, G.; Litman, J. Metrics for Explainable AI: Challenges and Prospects. arXiv 2019, arXiv:1812.04608. [Google Scholar]
  75. Zhou, J.; Bridon, C.; Chen, F.; Khawaji, A.; Wang, Y. Be Informed and Be Involved: Effects of Uncertainty and Correlation on User’s Confidence in Decision Making. In Proceedings of the ACM SIGCHI Conference on Human Factors in Computing Systems (CHI2015) Works-in-Progress, Seoul, Korea, 18–23 April 2015. [Google Scholar]
  76. Yu, K.; Berkovsky, S.; Conway, D.; Taib, R.; Zhou, J.; Chen, F. Do I Trust a Machine? Differences in User Trust Based on System Performance. In Human and Machine Learning: Visible, Explainable, Trustworthy and Transparent; Zhou, J., Chen, F., Eds.; Human–Computer Interaction Series; Springer International Publishing: Cham, Switzerland, 2018; pp. 245–264. ISBN 978-3-319-90403-0. [Google Scholar]
  77. Holzinger, A.; Carrington, A.; Müller, H. Measuring the Quality of Explanations: The System Causability Scale (SCS). KI-Künstl. Intell. 2020, 34, 193–198. [Google Scholar] [CrossRef] [PubMed] [Green Version]
  78. Schmidt, P.; Biessmann, F. Quantifying Interpretability and Trust in Machine Learning Systems. In Proceedings of the AAAI-19 Workshop on Network Interpretability for Deep Learning, Honolulu, HI, USA, 27 January–2 February 2019; p. 8. [Google Scholar]
  79. Yang, M.; Kim, B. Benchmarking Attribution Methods with Relative Feature Importance. arXiv 2019, arXiv:1907.097011907. [Google Scholar]
  80. Nguyen, A.; Martínez, M.R. On Quantitative Aspects of Model Interpretability. arXiv 2020, arXiv:2007.07584. [Google Scholar]
  81. Slack, D.; Friedler, S.A.; Scheidegger, C.; Roy, C.D. Assessing the Local Interpretability of Machine Learning Models. arXiv 2019, arXiv:1902.03501. [Google Scholar]
  82. Lakkaraju, H.; Kamar, E.; Caruana, R.; Leskovec, J. Interpretable & Explorable Approximations of Black Box Models. arXiv 2017, arXiv:1707.01154. [Google Scholar]
  83. Ylikoski, P.; Kuorikoski, J. Dissecting Explanatory Power. Philos. Stud. 2010, 148, 201–219. [Google Scholar] [CrossRef]
  84. Yeh, C.-K.; Hsieh, C.-Y.; Suggala, A.; Inouye, D.I.; Ravikumar, P.K. On the (In)Fidelity and Sensitivity of Explanations. In Proceedings of the 33rd Conference on Neural Information Processing Systems (NeurIPS 2019), Vancouver, BC, Canada, 8–14 December 2019; pp. 10967–10978. [Google Scholar]
  85. Sundararajan, M.; Taly, A.; Yan, Q. Axiomatic Attribution for Deep Networks. In Proceedings of the 34th International Conference on Machine Learning—Volume 70, Sydney, NSW, Australia, 6–11 August 2017; pp. 3319–3328. [Google Scholar]
  86. Hooker, S.; Erhan, D.; Kindermans, P.-J.; Kim, B. A Benchmark for Interpretability Methods in Deep Neural Networks. In Proceedings of the 33rd Conference on Neural Information Processing Systems (NeurIPS 2019), Vancouver, BC, Canada, 8–14 December 2019; p. 12. [Google Scholar]
  87. Montavon, G.; Samek, W.; Müller, K.-R. Methods for Interpreting and Understanding Deep Neural Networks. Dig. Signal Process. 2018, 73, 1–15. [Google Scholar] [CrossRef]
  88. Ancona, M.; Ceolini, E.; Öztireli, C.; Gross, M. Towards Better Understanding of Gradient-Based Attribution Methods for Deep Neural Networks. Available online: https://openreview.net/pdf?id=Sy21R9JAW (accessed on 7 March 2018).
  89. Molnar, C.; Casalicchio, G.; Bischl, B. Quantifying Model Complexity via Functional Decomposition for Better Post-hoc Interpretability. In Machine Learning and Knowledge Discovery in Databases; Cellier, P., Driessens, K., Eds.; Communications in Computer and Information Science; Springer International Publishing: Cham, Switzerland, 2020; Volume 1167, pp. 193–204. ISBN 978-3-030-43822-7. [Google Scholar]
  90. Alvarez-Melis, D.; Jaakkola, T.S. Towards Robust Interpretability with Self-Explaining Neural Networks. arXiv 2018, arXiv:1806.07538. [Google Scholar]
  91. Guidotti, R.; Monreale, A.; Matwin, S.; Pedreschi, D. Black Box Explanation by Learning Image Exemplars in the Latent Feature Space. arXiv 2020, arXiv:2002.03746. [Google Scholar]
  92. Buçinca, Z.; Lin, P.; Gajos, K.Z.; Glassman, E.L. Proxy Tasks and Subjective Measures Can Be Misleading in Evaluating Explainable AI Systems. In Proceedings of the 25th International Conference on Intelligent User Interfaces, Cagliari, Italy, 17 March 2020; pp. 454–464. [Google Scholar]
  93. Zhou, J.; Arshad, S.Z.; Luo, S.; Chen, F. Effects of Uncertainty and Cognitive Load on User Trust in Predictive Decision Making. In Proceedings of the INTERACT 2017, Mumbai, India, 25–29 September 2017. [Google Scholar]
Figure 1. The number of research publications on ML explanations (based on Scopus.com until December 2020).
Electronics 10 00593 g001
Figure 2. Definition of machine learning (ML) explainability and related properties (adapted from Reference [23]).
Electronics 10 00593 g002
Figure 3. Taxonomy of evaluation of machine learning explanations.
Electronics 10 00593 g003
Figure 4. Metrics of human-centred evaluations.
Electronics 10 00593 g004
Table 1. Associations between explanation types from Reference [43] and explanation technique categories from Reference [10].
Explanation Types from Reference [43]Explanation Categories from Reference [10]
Rationale explanationMethods that provide rationales
Saliency methods
Neural network visualisation methods
Knowledge distillation methods
Restricted neural network architecture
Data explanationFeature relevance methods
Exemplar methods
High-level feature learning methods
Safety and performance explanationRestricted neural network architecture
Table 2. Quantitative metrics for machine learning (ML) explanations.
Explanation TypesQuantitative
Metrics
Properties of Explainability
InterpretabilityFidelity
ClarityBroadnessParsimony/
Simplicity
CompletenessSoundness
Model-based explanationsModel size [14,46]
Runtime operation counts [81]
Interaction strength [23,46]
Main effect complexity [46]
Level of (dis)agreement [82]
Attribution- based explanationsMonotonicity [80]
Non-sensitivity [80,83],
Sensitivity [84,85]
Effective complexity [80]
Remove and retrain [86]
Recall of important features [33]
Implementation invariance [85]
Selectivity [87]
Continuity [87]
Sensitivity-n [88]
Mutual information [80]
Example-based explanationsNon-representativeness [80]
Diversity [80]
Publisher’s Note: MDPI stays neutral with regard to jurisdictional claims in published maps and institutional affiliations.

