Article

Design and Implementation of a Smart Energy Meter Using a LoRa Network in Real Time

by
Francisco Sánchez-Sutil
*,
Antonio Cano-Ortega
and
Jesús C. Hernández
Department of Electrical Engineering, University of Jaen, Campus Lagunillas s/n, Edificio A3, 23071 Jaén, Spain
*
Author to whom correspondence should be addressed.
Electronics 2021, 10(24), 3152; https://doi.org/10.3390/electronics10243152
Submission received: 22 November 2021 / Revised: 9 December 2021 / Accepted: 15 December 2021 / Published: 17 December 2021
(This article belongs to the Special Issue 10th Anniversary of Electronics: Recent Advances in Power Electronics)

Abstract

:
Nowadays, the development, implementation and deployment of smart meters (SMs) is increasing in importance, and its expansion is exponential. The use of SMs in electrical engineering covers a multitude of applications ranging from real-time monitoring to the study of load profiles in homes. The use of wireless technologies has helped this development. Various problems arise in the implementation of SMs, such as coverage, locations without Internet access, etc. LoRa (long range) technology has great coverage and equipment with low power consumption that allows the installation of SMs in all types of locations, including those without Internet access. The objective of this research is to create an SM network under the LoRa specification that solves the problems presented by other wireless networks. For this purpose, a gateway for residential electricity metering networks using LoRa (GREMNL) and an electrical variable measuring device for households using LoRa (EVMDHL) have been created, which allow the development of SM networks with large coverage and low consumption.

1. Introduction

The use of smart meters (SMs) is currently fundamental for the development of the electricity sector. SMs have a wide range of applications, including monitoring consumption in homes and industries, characterising consumption profiles in homes, forecasting demand in the electricity systems of countries, studying the quality of electrical energy, defining and characterising energy consumption, etc.
IoT (Internet of Things) systems and cloud computing are ideal systems for developing SM networks with real-time data. There are a multitude of cloud service providers that make this type of system a reality.
On the other hand, wireless technologies help to create SMs with great communications capacity. Wireless networks such as ZigBee, Wireless Fidelity (Wi-Fi), Narrowband Internet of Things (NB-IoT), SigFox or Long Range (LoRa) offer great development possibilities for this type of system. Among them, networks with low power consumption and long communication distances, as in the case of LoRa, help to overcome coverage and Internet access problems at distant points where networks such as Wi-Fi do not reach.
In this paper, a LoRa network is used to develop an SM network that is as transparent as possible for the user to whom a meter is installed. Two prototypes were developed and built to create such networks.

2. Related Works

Rodriguez-Pajaron et al. [1] studied total harmonic distortion (THD) in residential distribution networks using a limited number of SMs. Ashok-Kumar et al. [2] designed a SM that monitors non-linear loads. The SM controls and calculates energy consumption using the Fast Fourier Transform (FFT).
Liu et al. [3] proposed the solution of super-resolution perception in SMs, thus improving the accuracy of the obtained data. Rodrigues-Junior et al. [4] used SMs to measure the power quality, thereby detecting disturbances in smart grids. Oh et al. [5] studied analysis methods to characterise energy savings in smart homes by analysing the behaviour of electrical devices. Muralidhara et al. [6] developed an SM to monitor the energy consumption of electrical devices and displayed the results in the cloud using the ThingSpeak platform.
Andersen et al. [7] used SMs to study electricity consumption in Denmark and plan electricity production, as well as create capacity policies and grid design. Tureczek et al. [8] examined the consumption of grid-connected heat generating equipment in Denmark by analysing the correlation of data obtained by SMs. Wang et al. [9] used SM data to analyse energy consumption in the UK.
Donaldson et al. [10] proposed a novel method to identify utility customers with Photovoltaic (PV) production through consumption measured with SMs. England et al. [11] used SMs to provide the parameters of the Thevenin equivalent. Kablaci et al. [12] designed and implemented an SM network for low-voltage grids using Wi-Fi technology. Abate et al. [13] developed a low-cost IoT-connected SM that adapts to network variability while maintaining a high level of measurement accuracy.
Westermann et al. [14] identified the type of air conditioning and building by using data recorded by SMs. Zhan et al. [15] performed a method that uses time-series energy consumption data to categorise buildings and frame them within each energy category. Cano-Ortega et al. [16] developed an algorithm to optimise the configuration of the parameters of a LoRaWAN (long-range wide-area network) applied to the measurement of electrical variables in dwellings by using SMs.
Mbungu et al. [17] presented a model of an energy control system for a connected microgrid for residential applications with the data measured by SMs. Kong et al. [18] proposed a method for estimating errors in SMs based on an estimation model for dimension reduction. Razavi et al. [19] analysed the consumption of 5000 households for 18 months using SMs and artificial intelligence to predict the occupancy of households.
Roach et al. [20] used SMs in 129 commercial buildings to understand the impact of load profiles on building characteristics. Kumatsu et al. [21] developed a method to parametrise the demand that controls the accuracy of alerts. Czétány et al. [22] evaluated the database obtained from the use of SMs to determine electricity consumption profiles from time series and annual electricity load. Sánchez-Sutil et al. [23] built a device to monitor and control the functions of a power quality analyser.
Wang et al. [24] proposed a methodology using data collected from a three-phase low-voltage feeder for 40 customers with a single-phase power supply. Lui et al. [25] explored the combination of differential privacy with cost savings to address the impact of inherent battery constraints on noise generation in differential privacy. Sánchez-Sutil et al. [26] implemented a control system for street lighting using SMs and a LoRaWAN network. Sánchez-Sutil et al. [27] built a street lighting system for energy efficiency with LoRaWAN and SM network uses.
Venkatraman et al. [28] developed a model based on data collected by SMs that recover loads related to distribution networks. Hemanth et al. [29] proposed a method to recover missing data from SM measurements by using a particle swarm optimization (PSO) algorithm. Al Khafaf et al. [30] studied the impact of using electrical energy storage in residential environments based on the use of SMs. Funde et al. [31] studied data mining applied to the use of clustering to determine electricity usage patterns with SMs.
Stegner et al. [32] compared load profiles obtained with SMs with standard load profiles. Smajla et al. [33] investigated the optimal number of SMs using an adjusted data distribution to obtain sufficient accuracy. Mokhtar et al. [34] proposed an architecture based on a deep-learning neural network to predict the voltage distribution in the coverage of a low-voltage grid operator. Cano-Ortega et al. [35] developed a system for monitoring the operating conditions of induction motors using SMs.
Morello et al. [36] investigated the role that SMs should play in the smart grids of the future, studying the potential of collection systems of electrical energy data in IoT systems. Koutroumpina et al. [37] evaluated a set of characteristics that SMs should possess. Ünal et al. [38] developed an advanced pre-processing technique together with a sequential hybrid technique based on artificial intelligence to improve the power consumption prediction pressure. Sánchez-Sutil et al. [39] developed a system for controlling and managing energy efficiency in irrigation systems using SMs and a LoRaWAN network.
Alkawsi et al. [40] studied an acceptance model to evaluate user experience and innovation factors for application with residential consumers. Yang et al. [41] investigated the cost-effective design and privacy control of SMs in energy systems using rechargeable batteries. Nainar et al. [42] created an SM for monitoring low-voltage networks, applying a measurement estimation algorithm. Bañales et al. [43] proposed a clustering method based on two-stage K-medoids clustering with normalised load profiles organised in time series. Zhao et al. [44] addressed the problem of improving the efficiency of malfunction detection in SMs using deep learning techniques.
Rajkumar et al. [45] developed a low-cost smart PQ meter with a simple and user-friendly interface that implements an algorithm for electricity tariff control. Shaukat et al. [46] proposed a time series analysis for load profile prediction through mathematical statistical modelling.

3. Background

The authors have developed a line of research on SMs with several published research papers. In [47], the authors developed an SM, and in [48], they highlight the importance of granularity in the accuracy of electrical measurements.
The first work deals with the development of an SM for homes with the capacity to take measurements with a granularity of 0.5 s or less. The SM uploaded the data to the cloud at that time rate. On the other hand, it also had a memory card to store the data, which served a dual function: (i) backup of the information and (ii) logging of all the data in case the network connection was lost.
The capacities of the SM were at 230 V with 30 A or 100 A of current depending on the current sensor used, which raised the power that could be measured to 22 kW. The complete hardware and software design of the equipment was performed so that a fully functional, operational and low-cost prototype was built.
The current regulations on calibration tests for electrical measuring equipment were dealt with in depth, and the tests were designed. The calculation of errors was also defined to characterise the device. Finally, a complete study of the uncertainty in the electrical measurements that led to the complete characterisation of the SM was performed. To complete the study, all the calibration and uncertainty tests were carried out on the SM, and the result graphs were obtained, obtaining an accuracy with an error of less than 1%.
The second paper deals with the influence of the granularity of electrical measurements on the accuracy of the obtained results. A wide range of electrical measurement databases were studied, looking at the granularity used in the measurements and the data available for download.
This was followed by a study of time series theory, covering seasonality, metrics for statistics and probability, correlation and spectrum analysis. Temporality at granularity was also addressed. In addition, a plan of the data collection and analysis framework in households was created.
The time horizon of the study was extended to one year, studying four houses with different typologies and electrical equipment. An analysis of the reliability of the data upload to the cloud was performed. Subsequently, time studies were performed with sub-hourly, daily, weekly and yearly time stress with granularities between 0.5 s and 30 min. On the other hand, a complete annual statistical study was performed showing the probability density function, statistical moments, periodogram, autocorrelation and partial autocorrelation functions.
The installation of the prototypes in homes encountered some difficulties. These included the reluctance of users to provide their Wi-Fi key and installing the equipment inside the home, which means that the installation had to be performed outside. This option led to many cases in which the coverage was not good and involved the loss of real-time information, although it was saved on the microSD memory card fitted in the equipment. In view of these problems, the researchers are trying to find solutions that will allow the installation of more SMs to extend the observation network in order to make progress in future research.
The use of long-range wireless technologies makes it possible to avoid having to use the Wi-Fi connection of the monitored homes. LPWAN (low-power wide-area network) technologies make it possible to extend coverage over longer distances. These technologies include the following: (i) SigFox, (ii) NB-IoT and (iii) LoRa. The SigFox system is proprietary and requires a contract with the company to be implemented. NB-IoT works with SIM cards that need a data contract, which logically increases the cost of implementation.
LoRa, therefore, offers an ideal system for deployments of this type. The LoRaWAN specification is limited by the 1% duty cycle rule, which means that messages with the required granularity of 0.5 s cannot be sent. However, LoRa systems can be configured under the specification defined by RadioHead, which allows LoRa equipment to be used without the LoRaWAN limitations on the duty cycle or network configuration. Therefore, the target granularity of 0.5 s or lower can be achieved.
LoRa systems have a range of up to 5 km, making them ideal for such deployments. This research creates a gateway for residential electricity metering networks using LoRa (GREMNL) as a concentrator for up to 255 electrical variable measuring devices for households using LoRa (EVMDHLs). The use of LoRa solves the problems encountered with Wi-Fi systems. As no user key is needed, coverage problems are solved, and the location becomes unimportant due to the increased coverage of the LoRa networks.
The authors present a number of new contributions to previous work and work observed in the state of the art such as the following:
  • Solution of Wi-Fi coverage problems;
  • Possibility of placing equipment in remote locations where Internet access is not available;
  • Equipment with reduced consumption that has the least possible impact on the locations where it will be installed;
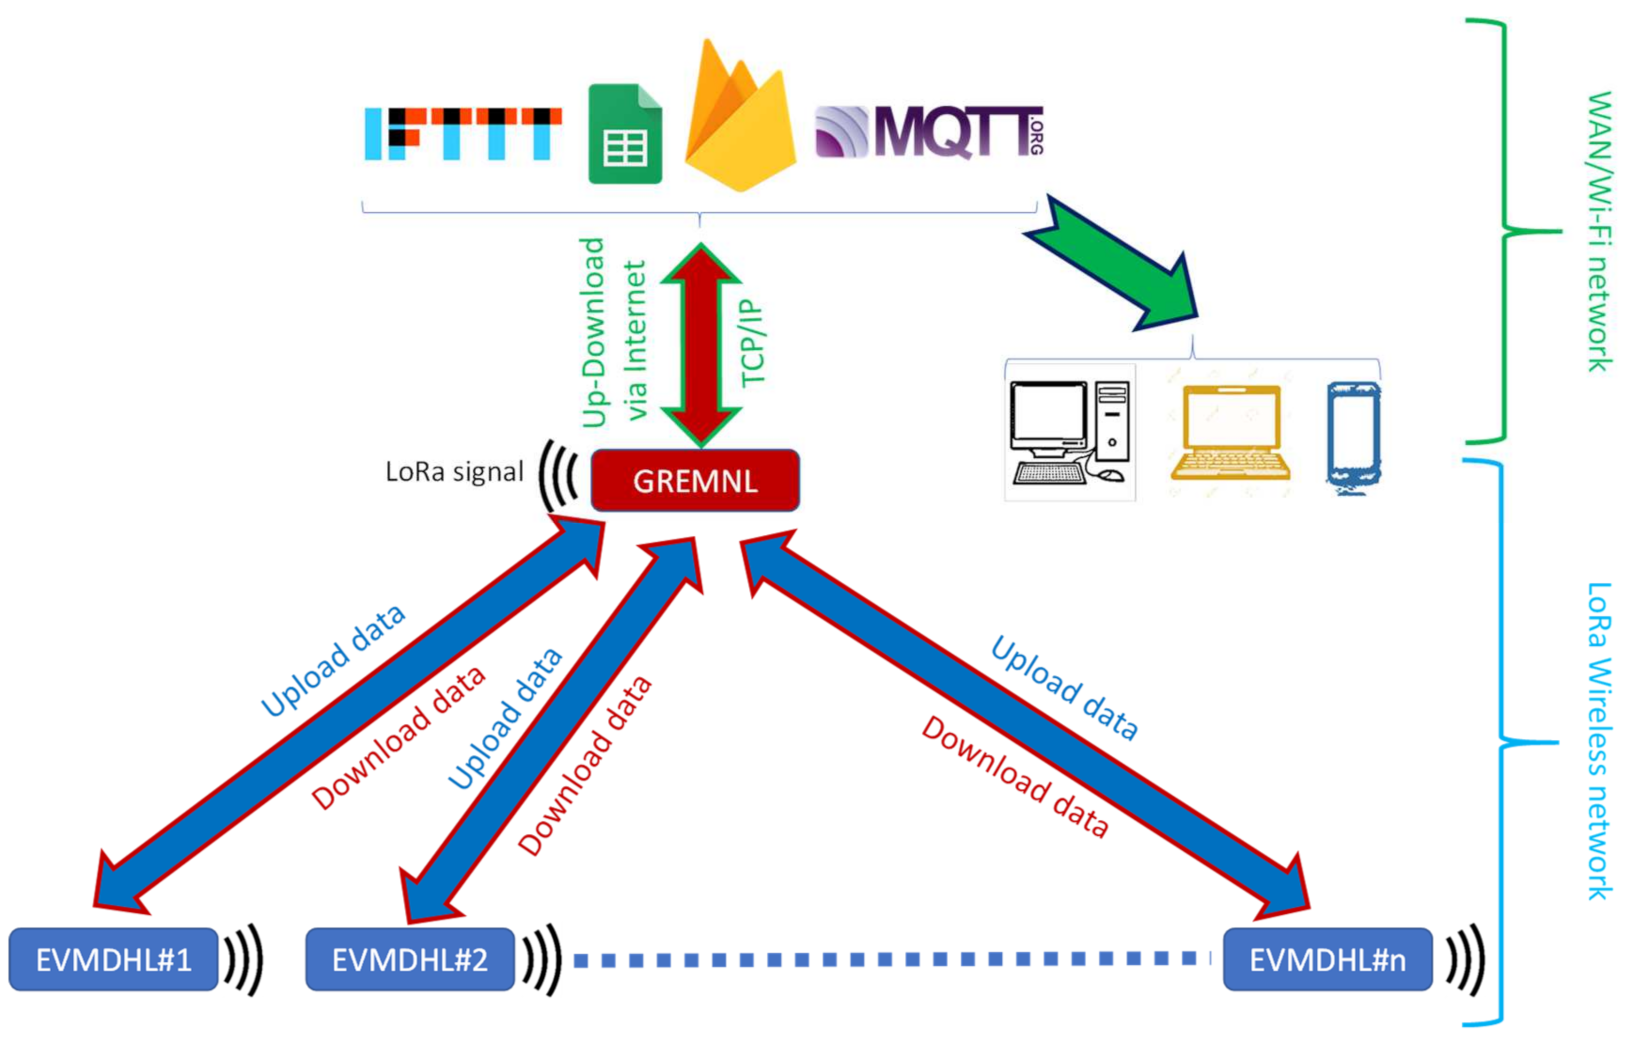
  • Creation of the GREMNL that allows the concentration of a large number of associated devices;
  • Creation of the EVMDHL with LoRa communication to extend wireless coverage to distances of up to 5 km;
  • Measurement granularities of 0.5 s or less.

4. Methodology and Design

4.1. Network scheme

The proposed network is a mix of two sub-networks: (i) LoRa network and (ii) WAN (wide area network). The LoRa network is controlled by the GREMNL, which can monitor up to 255 EVMDHLs that can be part of its network. If the system to be built has more than 255 devices, more GREMNL units will be available to cover the number of devices required in the system. On the other hand, the WAN can use an Ethernet or Wi-Fi protocol depending on the availability at the connection point. This network connects directly to the cloud storage and provides subsequent data access from mobile devices or computers.
The communication between GREMNL and the cloud, as well as with the EVMDHLs, is bidirectional. GREMNL sends the data received from the LoRa network to the cloud and receives orders from the cloud, which it passes on to the EVMDHLs. On the other hand, with EVMSDLs, in addition to sending commands from the cloud, it receives measurement information from each one.
The information in the cloud can be sent to different services available to the user. The selection of one or the other will depend on the needs of each implementation. These services include the following: (i) AWS IoT [49], (ii) Akenza core [50], (iii) Datacake [51], (iv) deZem [52], (v) InfluxDB Cloud 2. 0 [53], (vi) Microsoft Azure [54], (vii) Qubitro [55], TagoIO [56], (ix) thethings.iO [57], (x) ThingsBoard [58], (xi) ThingSpeak [59], (xii) Ubidots [60] and (xiii) UIB [61].
In addition, more popular services used by the cloud developer community can be found. These services are the following: (i) MQTT (Message Queuing Telemetry Transport) [62], (ii) LoRa cloud [63], (iii) Node-RED [64], IFTTT (IF This, Then That) [65], (iv) Google Sheets [66] and (v) Google Firebase [67]. Figure 1 shows the proposed network scheme.

4.2. Hardware Design

4.2.1. Design Challenges and Objectives

This research aims to design fully functional devices that offer the user full functionality under the required design objectives. The correct definition of the objectives to be met by the devices has a decisive influence on the components and technologies used in their construction. The correct choice of components also determines the software and the length of the programmes that are implemented. In order to meet the required functionality of the devices, the following objectives are set for the hardware part:
  • Low consumption. Low consumption means high efficiency. On the other hand, it will be much less costly for the user to install these metering devices on the final electricity bill. High consumption could also imply distortion of the measurements made due to the inclusion of the high consumption of the meter.
  • Operational security. The devices monitor the installations constantly on a 24/7 basis. This implies that the hardware design must be as reliable as possible to minimise the possibility of malfunctions.
  • Fault response, modular design and component integration. It is essential that components can be replaced by other components without affecting the performance of the system. In this sense, the device has to maintain all its functional characteristics while the damaged component is being replaced. This feature gives the device a high degree of operational reliability.
  • Reduced price. As a final objective, a reduced price will make the construction and mass production of the designed devices feasible. This objective makes it accessible to the majority of potential users who wish to install a device of these characteristics to monitor their electrical installations.
Achieving the proposed hardware design objectives involves a component search and selection tasks. For this, it is necessary to perform tasks that entail great difficulties and challenges that lead to final devices that are as optimal as possible. Among them are the following:
  • Estimation of alternatives. This is fundamental to achieve an optimal design. In this sense, a search of the different techniques and implementations available must be conducted, leading to an adequate selection of the components and techniques to be used.
  • Modular design. It must be related to the rest of the proposed objectives and must offer a safe and robust design of the device. In this way, the device cannot be put out of service if one of the components fails. To this end, the modular design allows the device to continue to function in the event of the failure of one of the components used.
  • Component selection. Component selection is critical to achieving the proposed design objectives. If it is not performed correctly, the device may malfunction or not perform the functions assigned to it correctly.
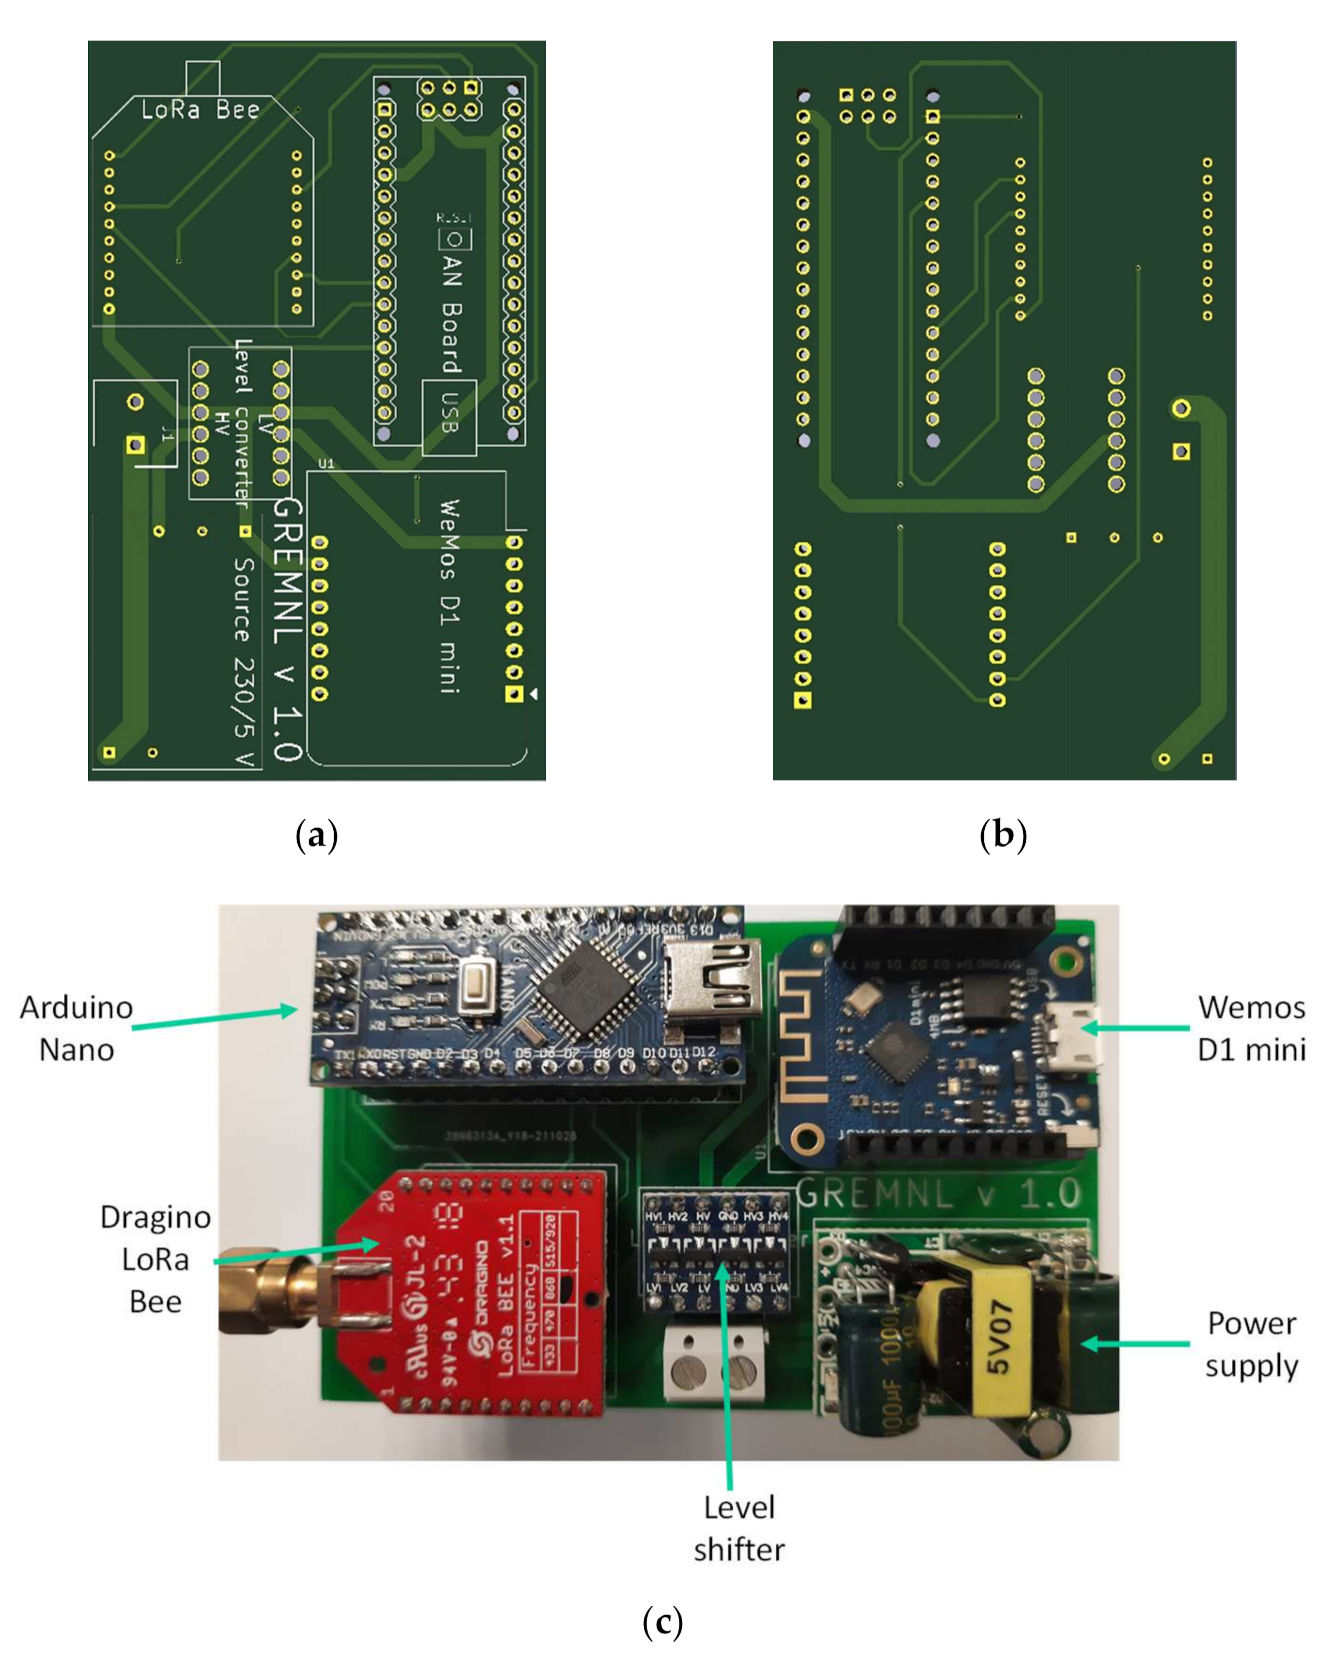
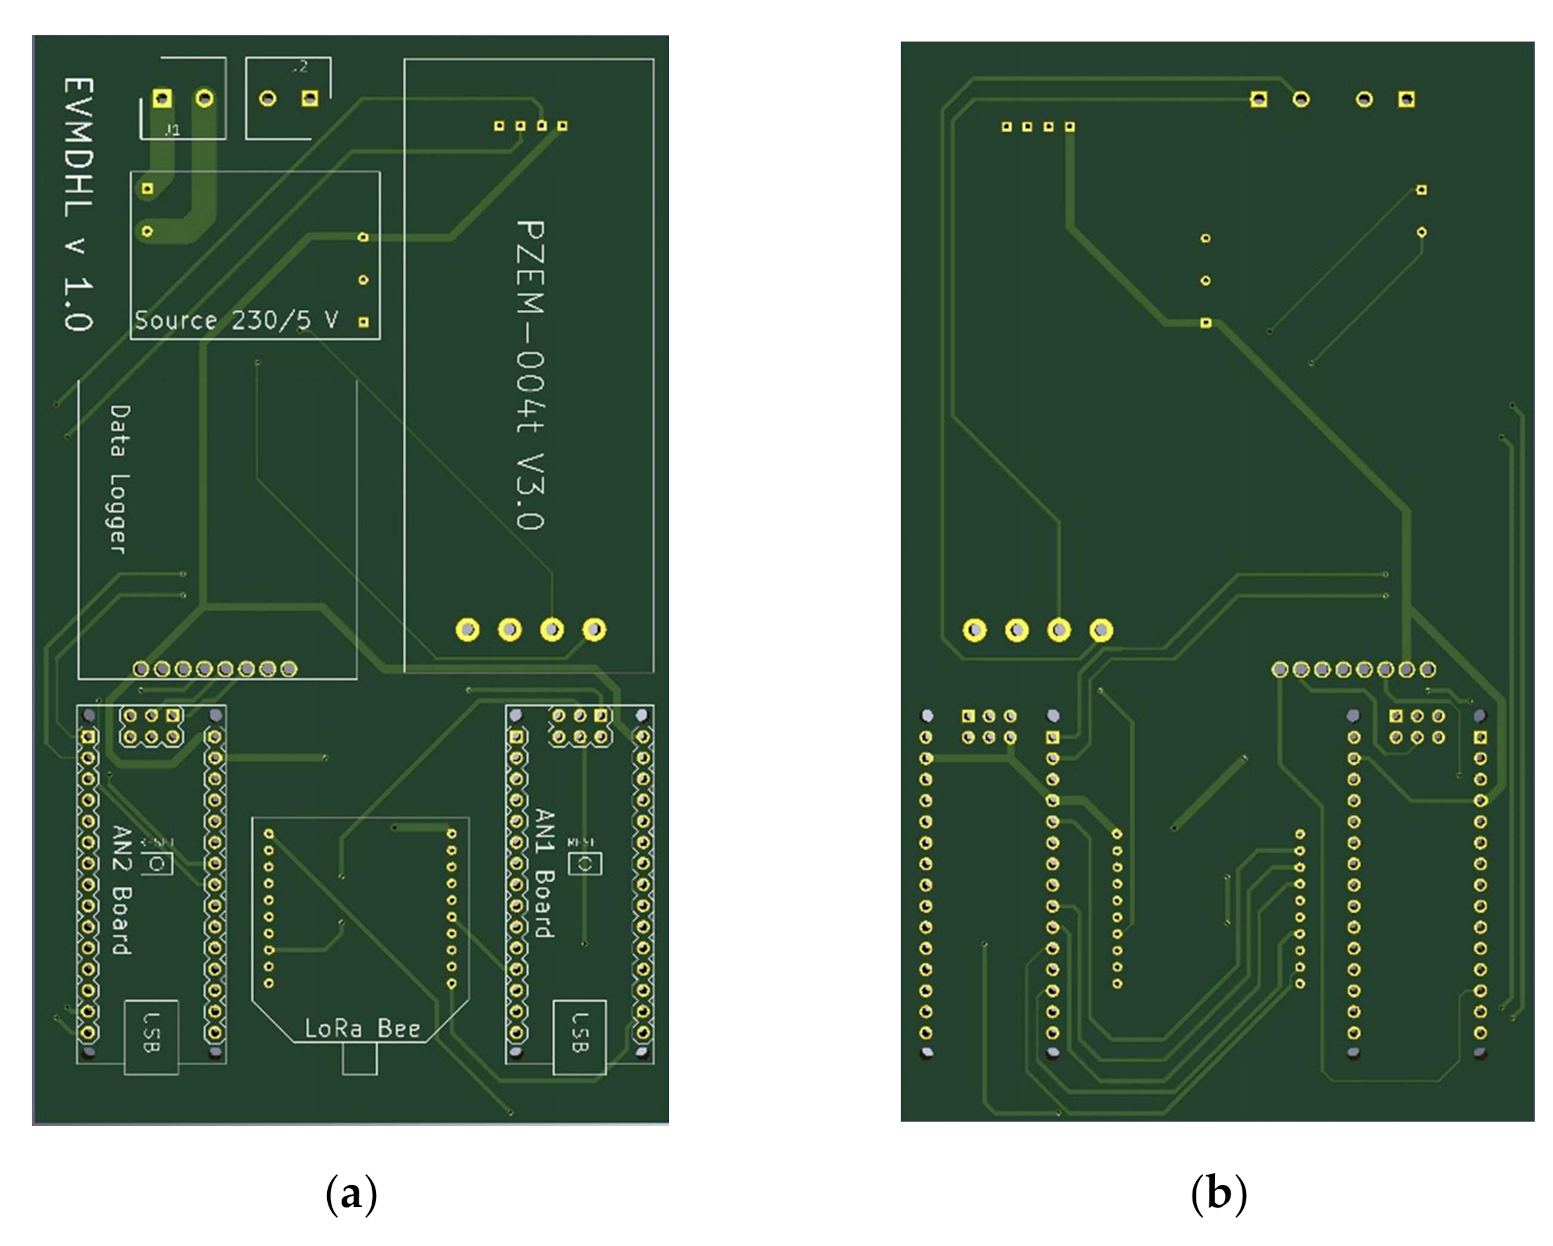
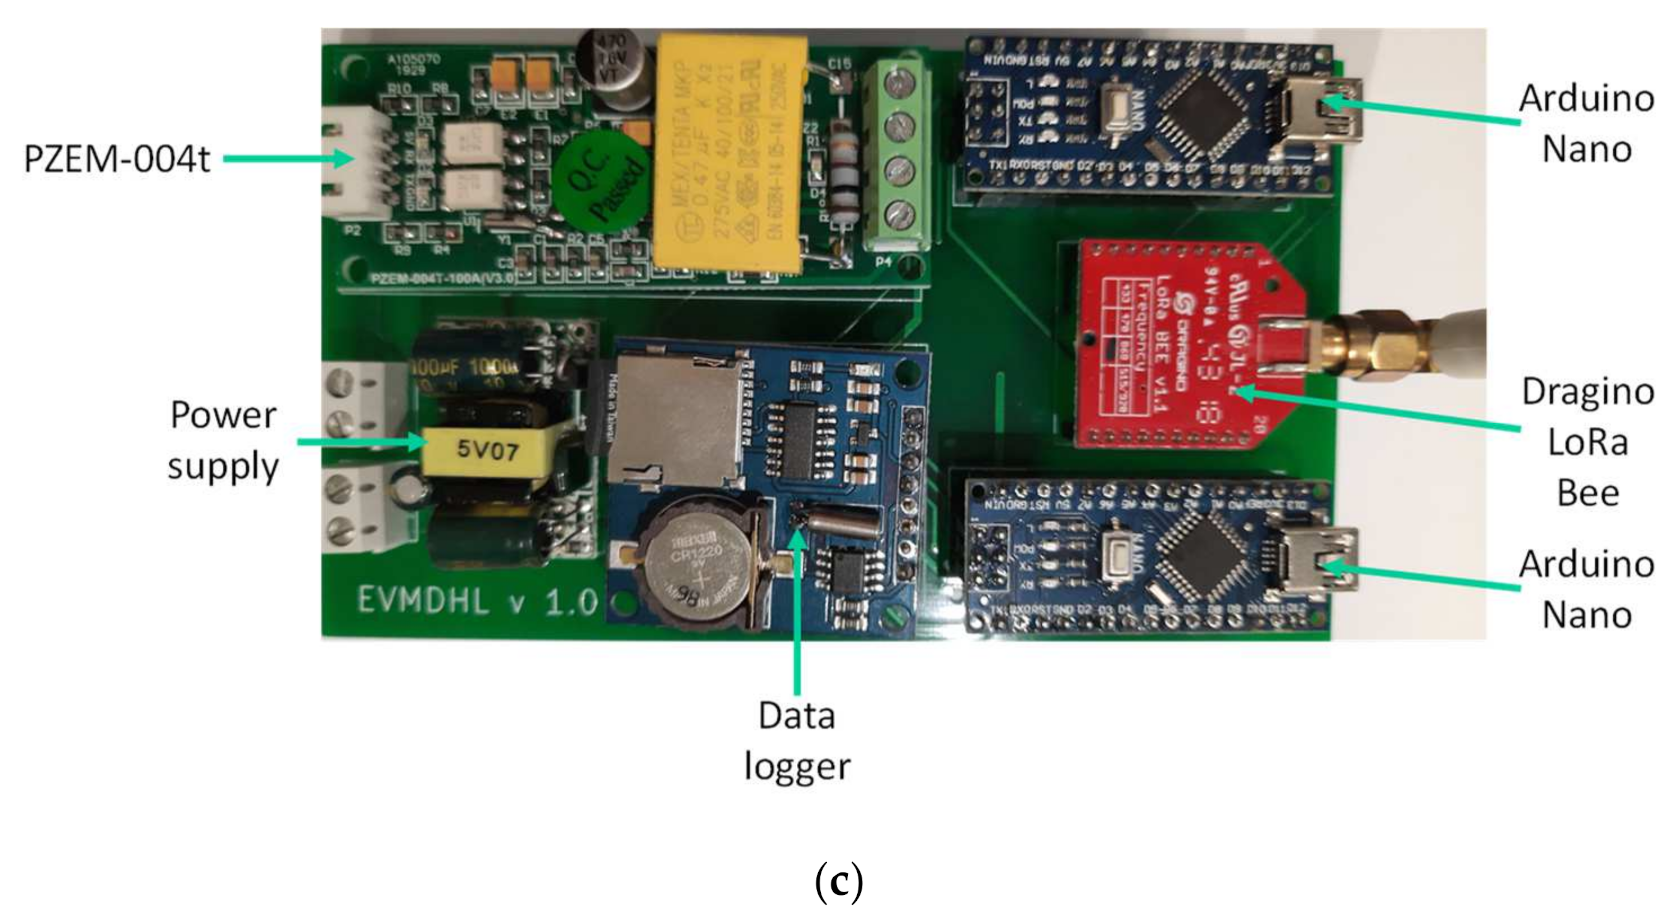
  • Printed circuit board (PCB) design. The electronic board must integrate all the selected components in the smallest possible space. The use of PCB boards gives the dissipative devices an ideal robustness so that the final assembly is as robust as possible. Two boards have been designed, one for GREMNL and one for EVMDHL.
  • Software implementation. The programmes have been created in the GERMNL and EVMDHL devices to provide the devices with the functionalities required in the definition of objectives so that these devices fully comply with the functions they must perform at all moments.

4.2.2. Components

Microcontroller

The microcontroller must be the core of the device’s operations and be able to perform all the tasks assigned to the device. This component must allow dialogue and communication between the other components installed in the device. For this purpose, the microcontroller has to integrate elements such as memories, digital and analogue inputs and outputs, communication ports, etc. A fundamental characteristic of microprocessors is the ability to modify their functions in relation to the applications that need to be obtained. This allows it to be used in industrial and domestic applications, thus covering a wide range of possibilities.
There are different families of microcontrollers on the market that can meet the proposed design objectives. Each of them offers different possibilities of computing power and component integration with different price ranges. In this research, the Arduino family has been chosen. This platform offers a high degree of integration with components of a different nature. At the same time, it has plenty of computing power for this type of application. It is also worth noting the low price, small size and open-source platform. A large amount of code is available for developers to use as a basis for the development of their specific applications.
Table 1 shows the characteristics of the microcontrollers of the Arduino family analysed. All of them have sufficient features in terms of processing capacity, memory, inputs/outputs and communication ports. Therefore, there are other criteria that lead to the choice of one of the microprocessors in the family, such as power consumption and small size. For the above reasons, Arduino Nano (AN) [68] was the one chosen for implementation in the GREMNL and EVMDHL.

Wi-Fi System

The Arduino family also has microcontrollers with wireless communication capabilities via Wi-Fi protocol. This access can be achieved through external boards connected to the central microcontroller, or there are also microcontrollers with integrated Wi-Fi capabilities. The second option seems more interesting to us and was the option used.
There are basically two Wi-Fi access platforms, ESP32 and ESP8266. The latter is the one chosen for GREMNL. ESP8266 has the Wired Equivalent Privacy (WEP) and Wi-Fi Protected Access (WPA/WAP2) communication security protocols, which provides great power to the system. In addition, it works with the 801.11 b/g/n specifications supported by almost all routers available on the market.
Looking at the data in Table 2, it can be concluded that several microcontrollers have similar memory, power and processor characteristics. Therefore, the size and price options defined the component to be used. In this case, we decided to use Wemos d1 mini (Wd1M) [72].

LoRa Wireless System

In addition to the Wi-Fi system ultimately responsible for uploading data to the Internet, the proposed network uses a LoRa protocol network for communication between the EVMDHLs and the GREMNL. Both devices have to be embedded with a LoRa chip to create such a network.
Table 3 illustrates the result of the comparison of the analysed LoRa equipment models. There are the following five models: (i) Arduino MKRWAN 1310 (Arduino AG, Ivrea, Italy) [77]; (ii) Monteino (LowPow-erLab, Canton-Michigan, USA) [78]; (iii) Libelium (Libe-lium, Zaragoza, Spain) [79]; (iv) Lopy4 (Pycom, Bucharest, Romania) [80]; and (v) Dragino LoRa Bee (DLB) (Dragino Technology Co., LTD., Shenzhen, China) [81].
The models analysed use the following different chips: (i) Semtech (Semtech Corporation, Camarillo, CA, USA) SX1308 [82], SX1301 [83], SX1276 [84], SX1278 [84] and SX1257 [85]; (ii) HOPERF chip RFM95/96/97/98 [86] (HOPERF, Shenzhen, China); and (iii) Murata CMWX1ZZABZ (Murata Manufacturing, Nagaokakyo, Japan) [87]. The chips contained in each of the models are as follows: (i) Murata CMWX1ZZABZ for the Arduino MKR WAN 1310; (ii) HOPERF chip RFM95/96/97/98 for the Monteino; (iii) SX1276 and SX1278 for the Lopy4 and DLB, respectively; and (iv) Semtech SX1272 for the Libelium.
The several models analysed have similar characteristics; therefore, the choice was made on the basis of cost. The DLB of the Dragino brand was chosen.

Electrical Variables Meter

To obtain the derived electrical variables, it was necessary to measure the two fundamental variables, voltage and current. As for the current, there are the following two basic procedures: intrusive and non-intrusive (NLIM). The former needs to modify the installation it monitors, and the latter does not modify the installation it monitors. An example is the ACS7xx family and its version ACS712 [88] (Allegro MicroSystems, Worcester, Massachusett, USA), available in 5, 20 and 30 A versions. In terms of an NLIM sensor, the STC-013 [89] from YHDC (YHDC, Hebei, China) is worth mentioning.
Different techniques are also available for voltage measurement. The nominal AC mains voltage must be reduced to the voltage of the analogue inputs of AN, which is 5 V DC. Several alternatives have been evaluated, among which the following are worth mentioning: (i) 230/12 or 24 V transformer, AC/DC rectifier and voltage divider; (ii) 230/24 V transformer, AC/DC rectifier and FZ0430 [90] meter; and (iii) ZMPT101b [91] voltage transformer from 230 to 5 V.
Once the voltage and current have been obtained by one of the above methods, the necessary calculations must be carried out to obtain the derived variables, such as active and reactive power, etc. In addition, it is necessary to use optocouplers to capture the zero crossing of the voltage and current signals. Subsequently, the root mean square (RMS) values must be obtained by calculation. All this leads to the consumption of extra computational time by the microprocessor.
The above paragraph makes it clear that using individual meters increases the complexity of the system. The PZEM-004t (PZEM) sensor (Ningbo Peacefair Electronic Technology, Zhejiang, China) can be used [92]. This sensor is equipped with optocouplers and can measure and calculate voltage, current, active power, power factor (PF) and energy independently of the system microcontroller. In this way, the meter provides the RMS values with only one software call. Therefore, we implemented in it the EVMDHL. Table 4 shows the characteristics of the tested devices.

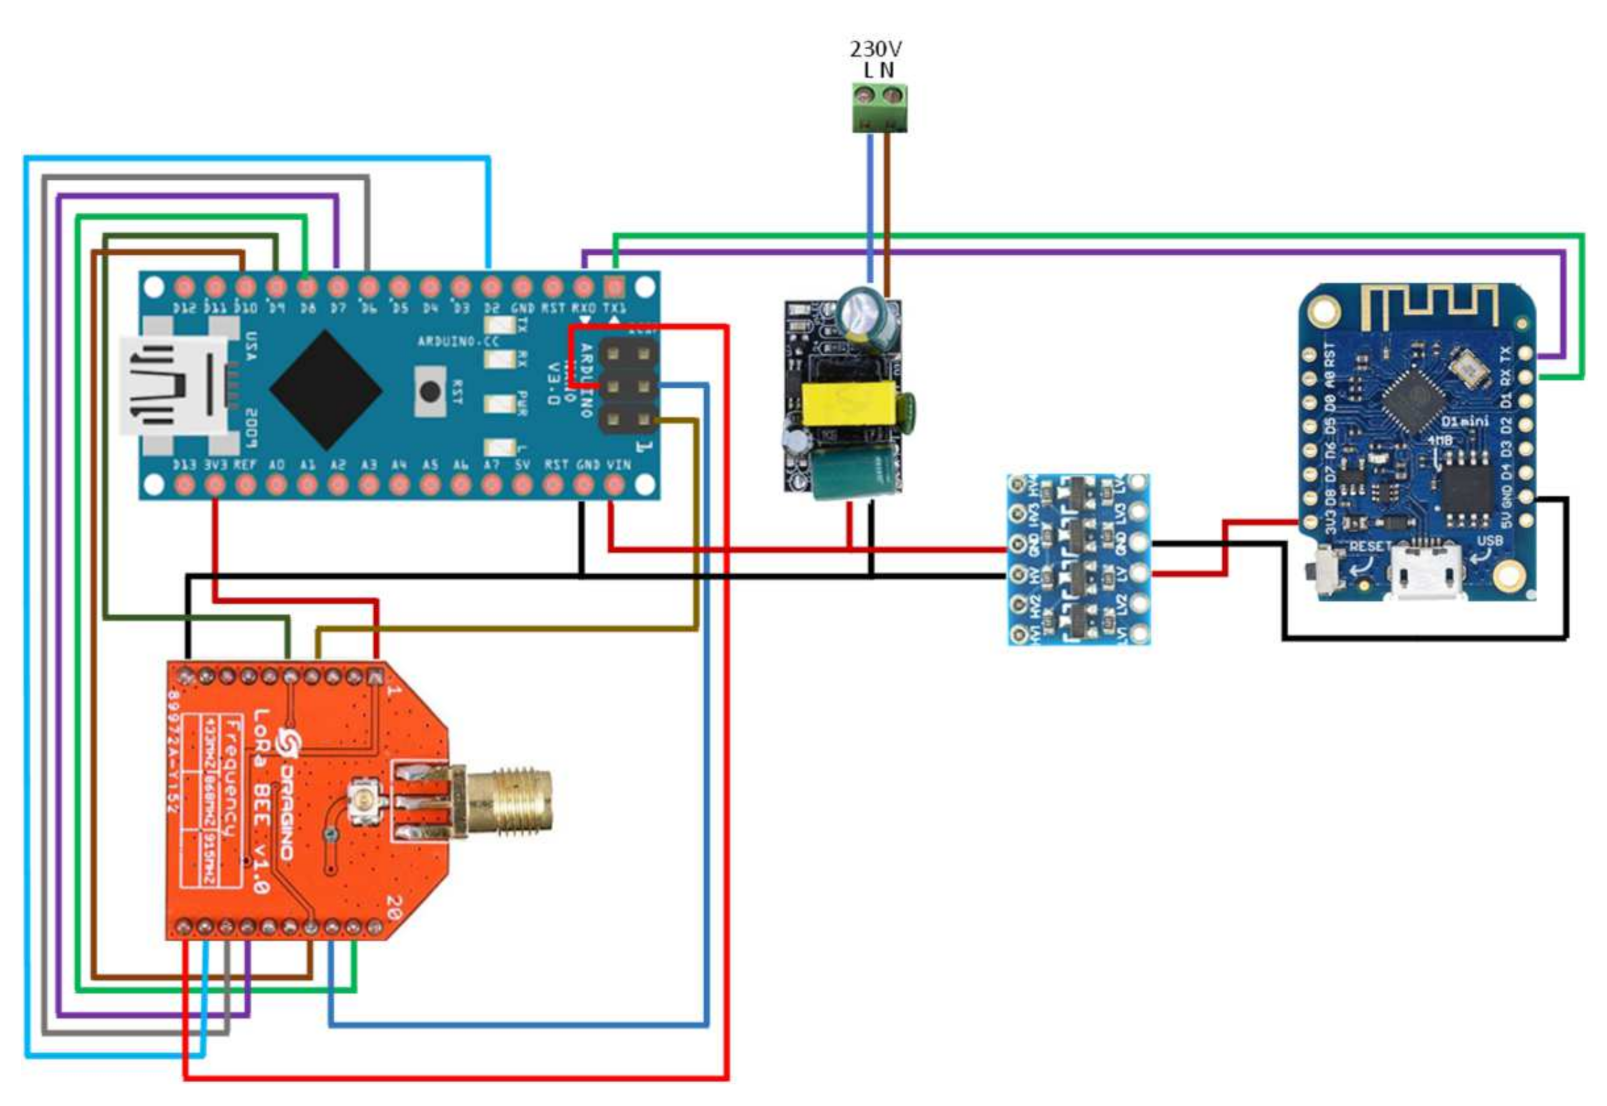
4.2.3. Hardware Implementation for the GREMNL

Two microcontrollers were used in the construction of GREMNL. AN is responsible for the LoRa network communications. Wd1M is responsible for the Wi-Fi system and the uploading of data to the Internet. Both microcontrollers communicate via the serial port using bidirectional communication. When measurement data are received from any EVMDHL, they are sent through the serial port to Wd1M, which uploads it to the Internet. On the other hand, when any command is received from the Internet by Wd1M, it is sent to AN to be executed.
The system is powered by a power supply with a 5 V DC output. This voltage is required by AN. However, Wd1M works at 3.3 V DC; therefore, a level converter is needed to switch from the 5 V DC output of the power supply to the 3.3 V DC input of Wd1M.
It is important to define the maximum number of LoRa devices (EVMDHLs) that can be controlled by the GREMNL. There is a maximum of 255 EVMDHLs. To do this, in the programming of each of the devices, an identifier is assigned to them, which is used to store the data in the cloud for each of the devices used. Figure 2 shows the block diagram of the GREMNL.
Figure 3 shows the wiring diagram of the GREMNL. The wiring diagram serves as a complement to the block diagram. Both are intended to enable interested researchers to replicate the GREMNL. The electrical connections are represented in the wiring diagram. These connections provide insight into the relationships between components.
The PCB board for the GREMNL was designed and built. The board allows the connection of all the components used in the GREMNL, which are soldered and, therefore, it is a solid and resistant final system. The dimensions of the PCB board are 88 × 55 mm. Figure 4 shows the design of the two sides of the GREMNL PCB board.
In order to know whether the GREMNL is capable of mass production, it is necessary to make an economic assessment of the cost of the materials used. The budget also serves to validate the low-cost objective proposed earlier. The prices shown are from the manufacturers’ official shops. As these are open-source components, compatible components can be found to further reduce the price. Table 5 shows the cost of the different components used.

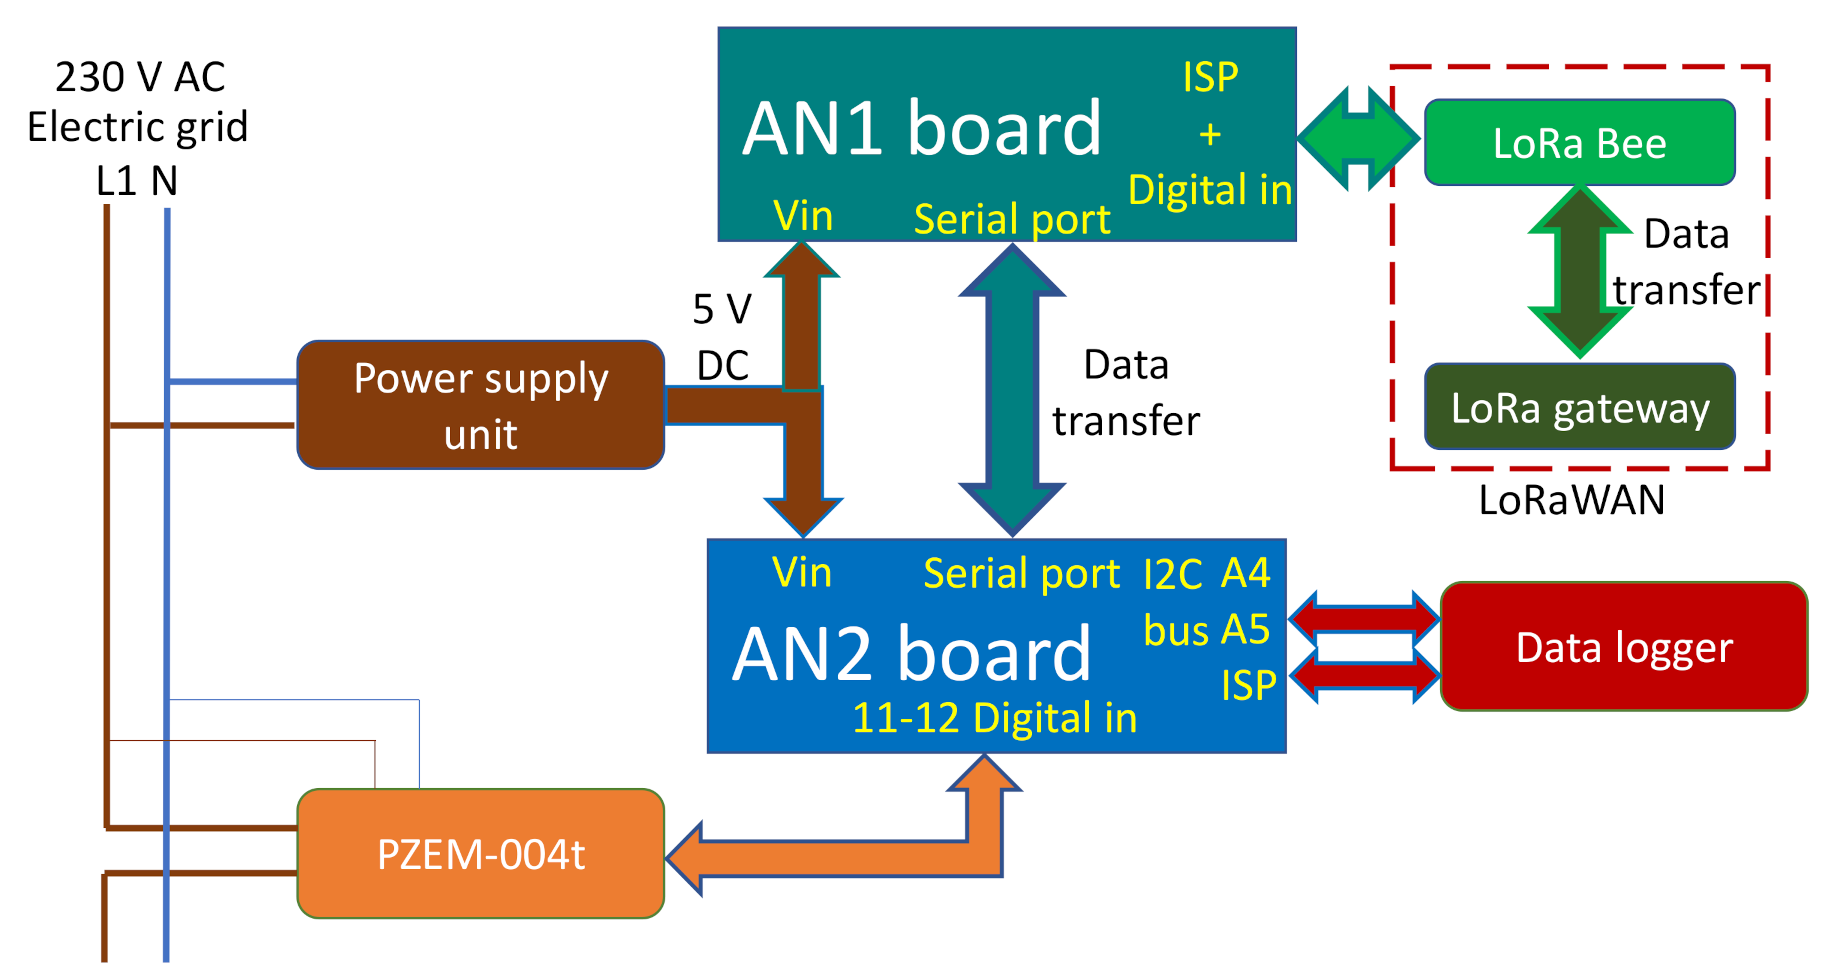
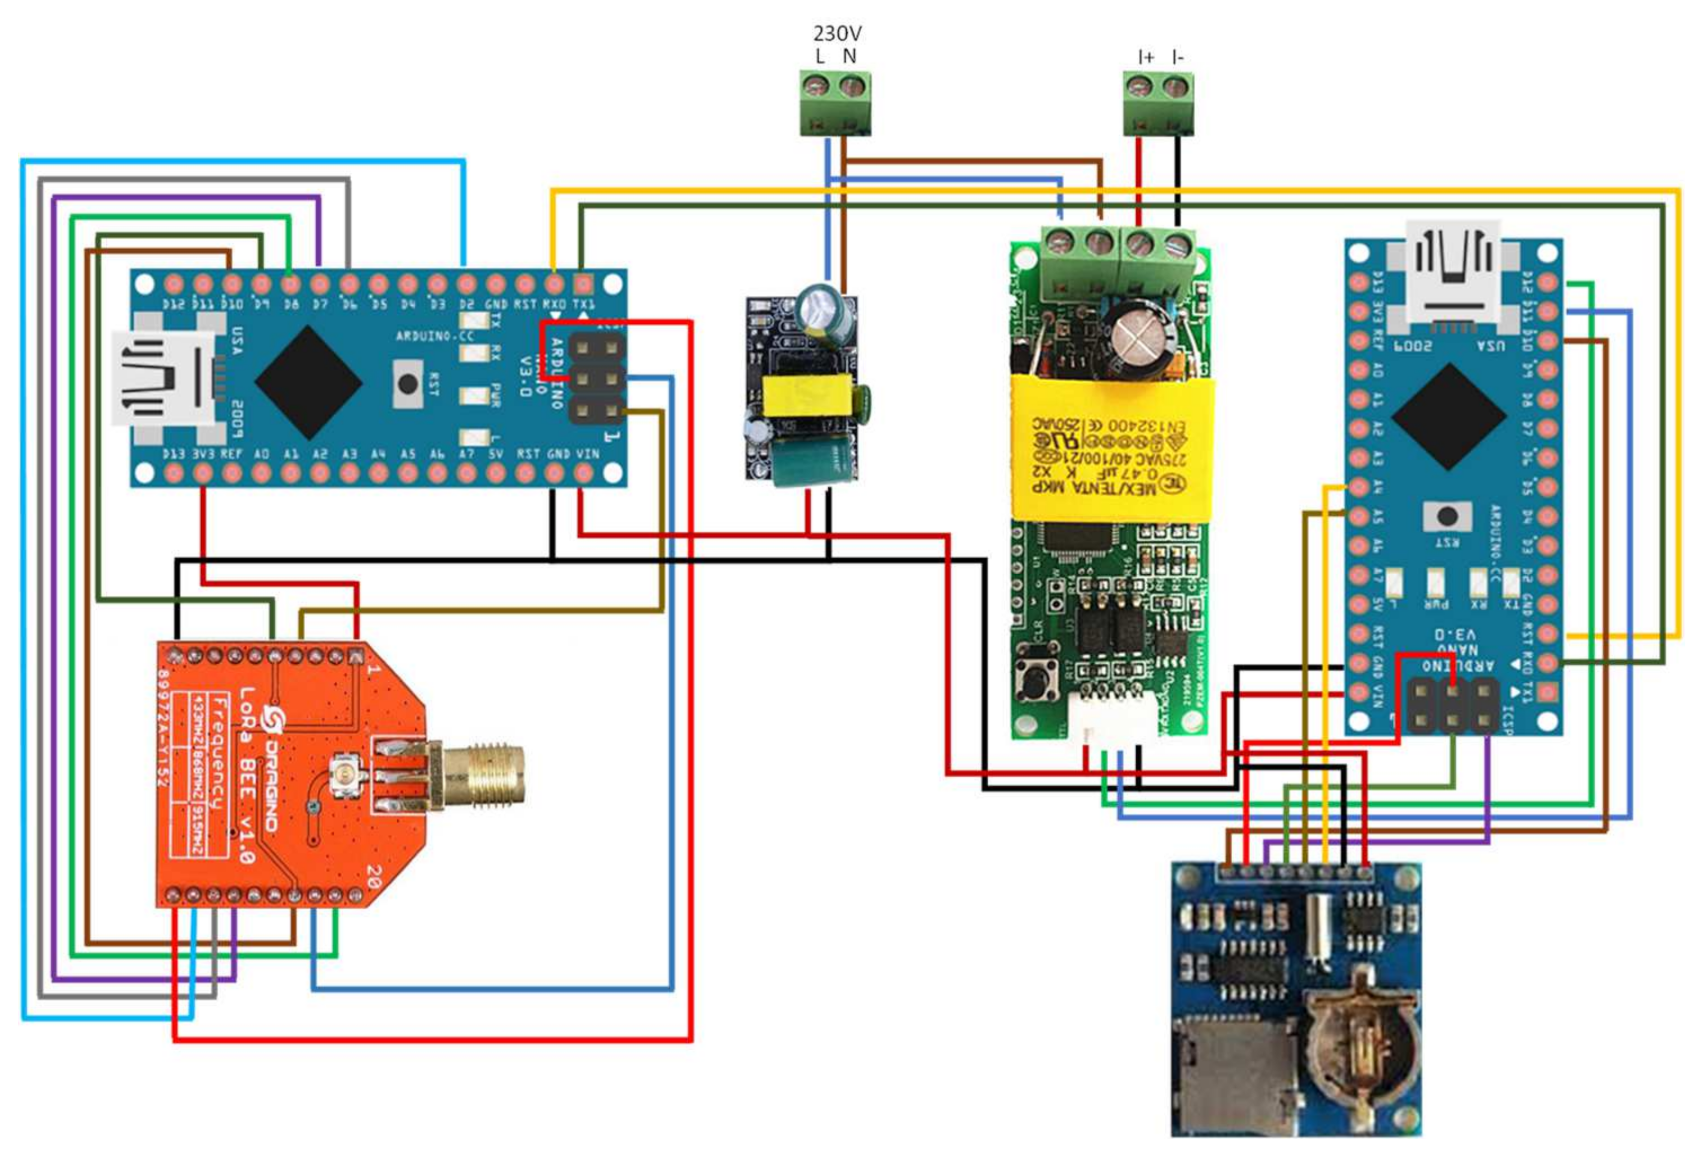
4.2.4. Hardware Implementation for the EVMDHL

The EVMDHL designed uses two ANs. This is because both DLB and the data logger implemented use AN’s ISP connections and are, therefore, incompatible. AN1 is responsible for communication with the LoRa network, sending measurement commands and receiving measurement data from AN2. Measurements are performed every 0.5 s. This time can be varied depending on the granularity assigned to the system.
AN2 receives the measurement command via the serial port. It then sends the measurement command to PZEM. Next, it saves the measurement data together with the measurement time on the data logger’s microSD card, thus ensuring that no data is lost. The use of the microSD card is justified because wireless communication is not 100% reliable and some packets are lost. However, the rate of packet loss is very low. The memory card can be up to 32 GB, which ensures about 14 years of data storage. It also sends the date and time together with the measured data to AN1 via the serial port.
Finally, AN1 adds the assigned EVMDHL number and sends it over the LoRa network to the GREMNL, which uploads it to the Internet, in this case, to Google’s Firebase service. The components are powered by a power supply with a 5 V DC output. Figure 5 shows the block diagram of the EVMDHL.
As in the case of the GREMNL, the wiring diagram is included as a complement to the EVMDHL block diagram. With all this information, it is possible for any interested researcher to reproduce EVMDHL. Figure 6 shows the wiring diagram with the electrical connections between the components used in the EVMDHL.
Finally, the PCB boards designed for the EVMDHL are shown in Figure 7. In this case, the board dimensions are 77 × 131 mm.
Table 6 shows the economic valuation of the components used in the EVMDHL. It can be seen that the price reduction target is achieved. As with the GREMNL, these are prices from official manufacturers, which can be reduced by using compatible devices.

4.3. Software Design

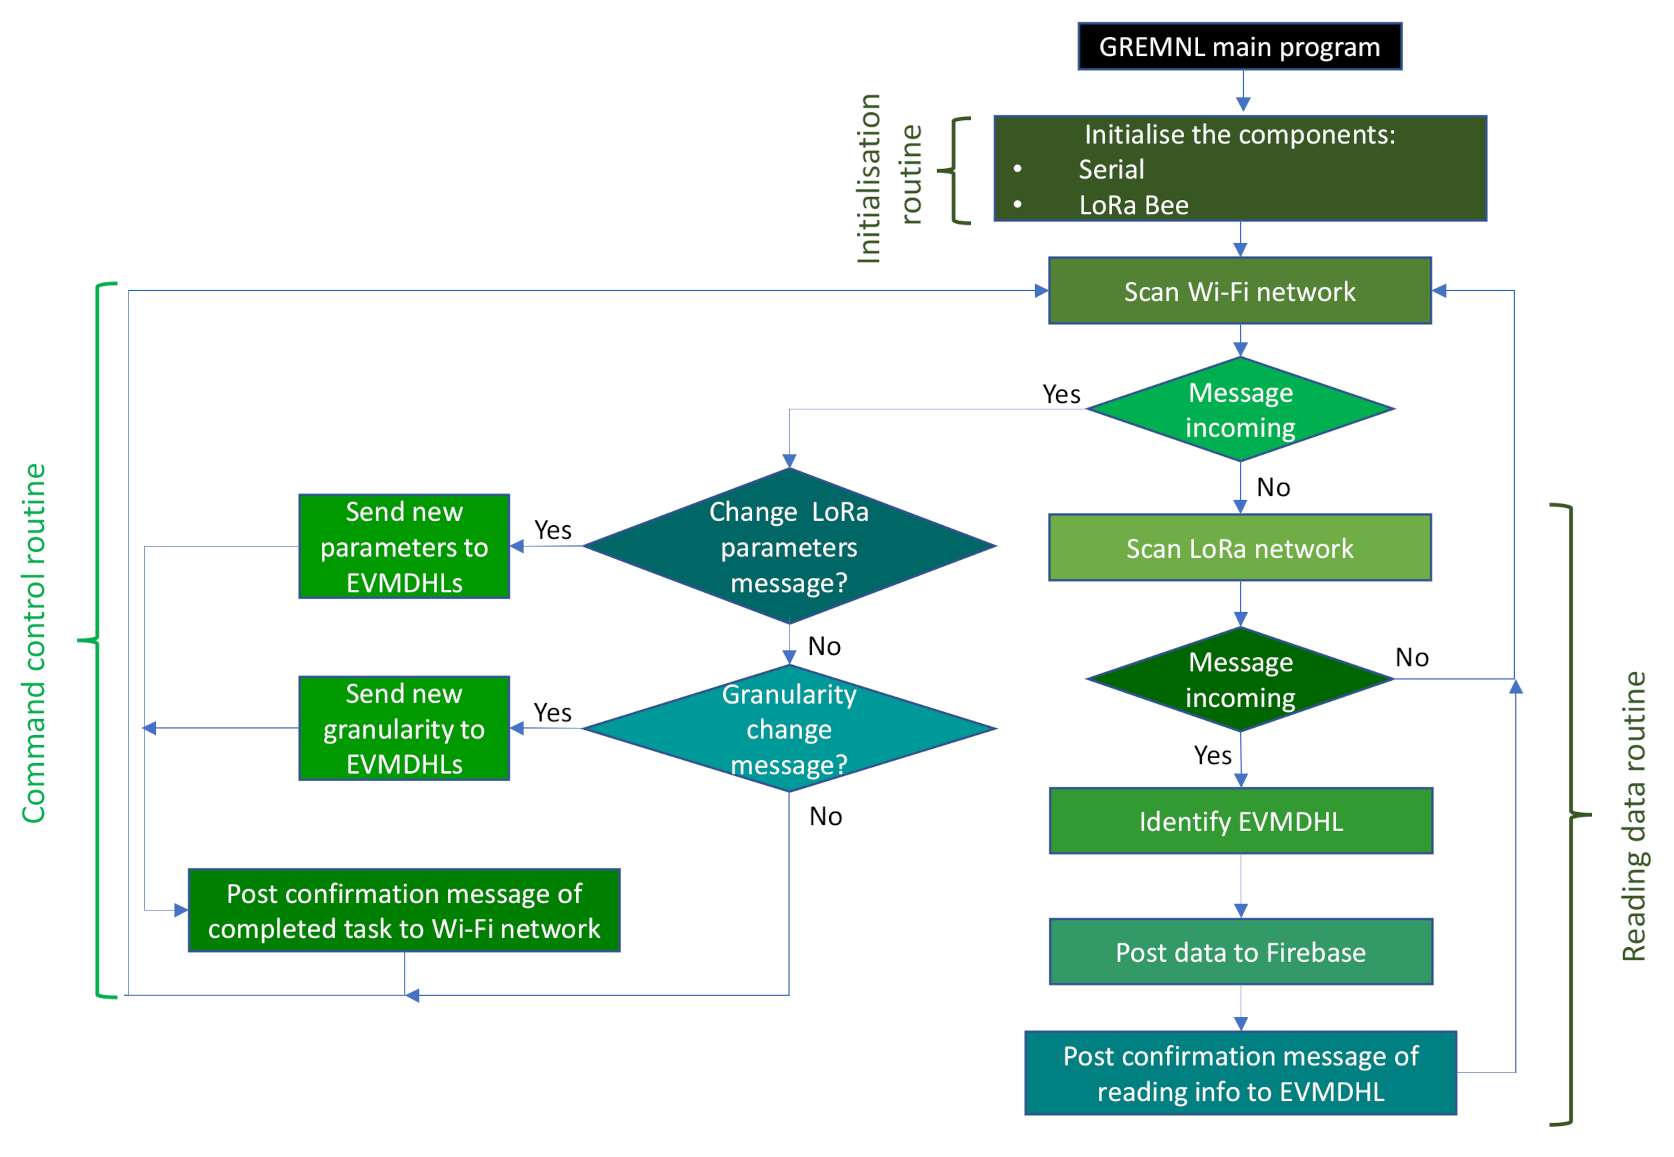
4.3.1. Software Implementation for the GREMNL

The GREMNL program consists of the following three routines: (i) initialisation, (ii) command control and (iii) reading data. The first initialisation routine is only performed when the GREMNL is powered on or when the device is reset. The remaining routines are performed continuously as long as GREMNL is energised.
The command control routine reads the Wi-Fi network and checks for any incoming system messages to change the network configuration. Messages received can be of the following two types: (i) modification of LoRa network parameters or (ii) modification of the granularity of the measurement being performed. The LoRa parameter modification should be sent to all the EVMDHLs to improve the efficiency of the network communication and minimise the rate of lost information packets. This message is the most common message received. As for the change of the granularity message, it implies a change in the temporal resolution at which the electrical variable data is read. Therefore, it also has to be sent to all the EVMDHLs that are part of the network. When the changed messages have been sent to the associated devices, a confirmation message is sent to the system.
The data reading routine monitors the LoRa network. If a message arrives, the sending EVMDHL is identified, and the data are uploaded to the cloud via Wi-Fi to the Firebase, where it is stored. A confirmation message is sent to allow the EVMDHL to continue its measurement activity. Figure 8 shows the GREMNL flowchart.

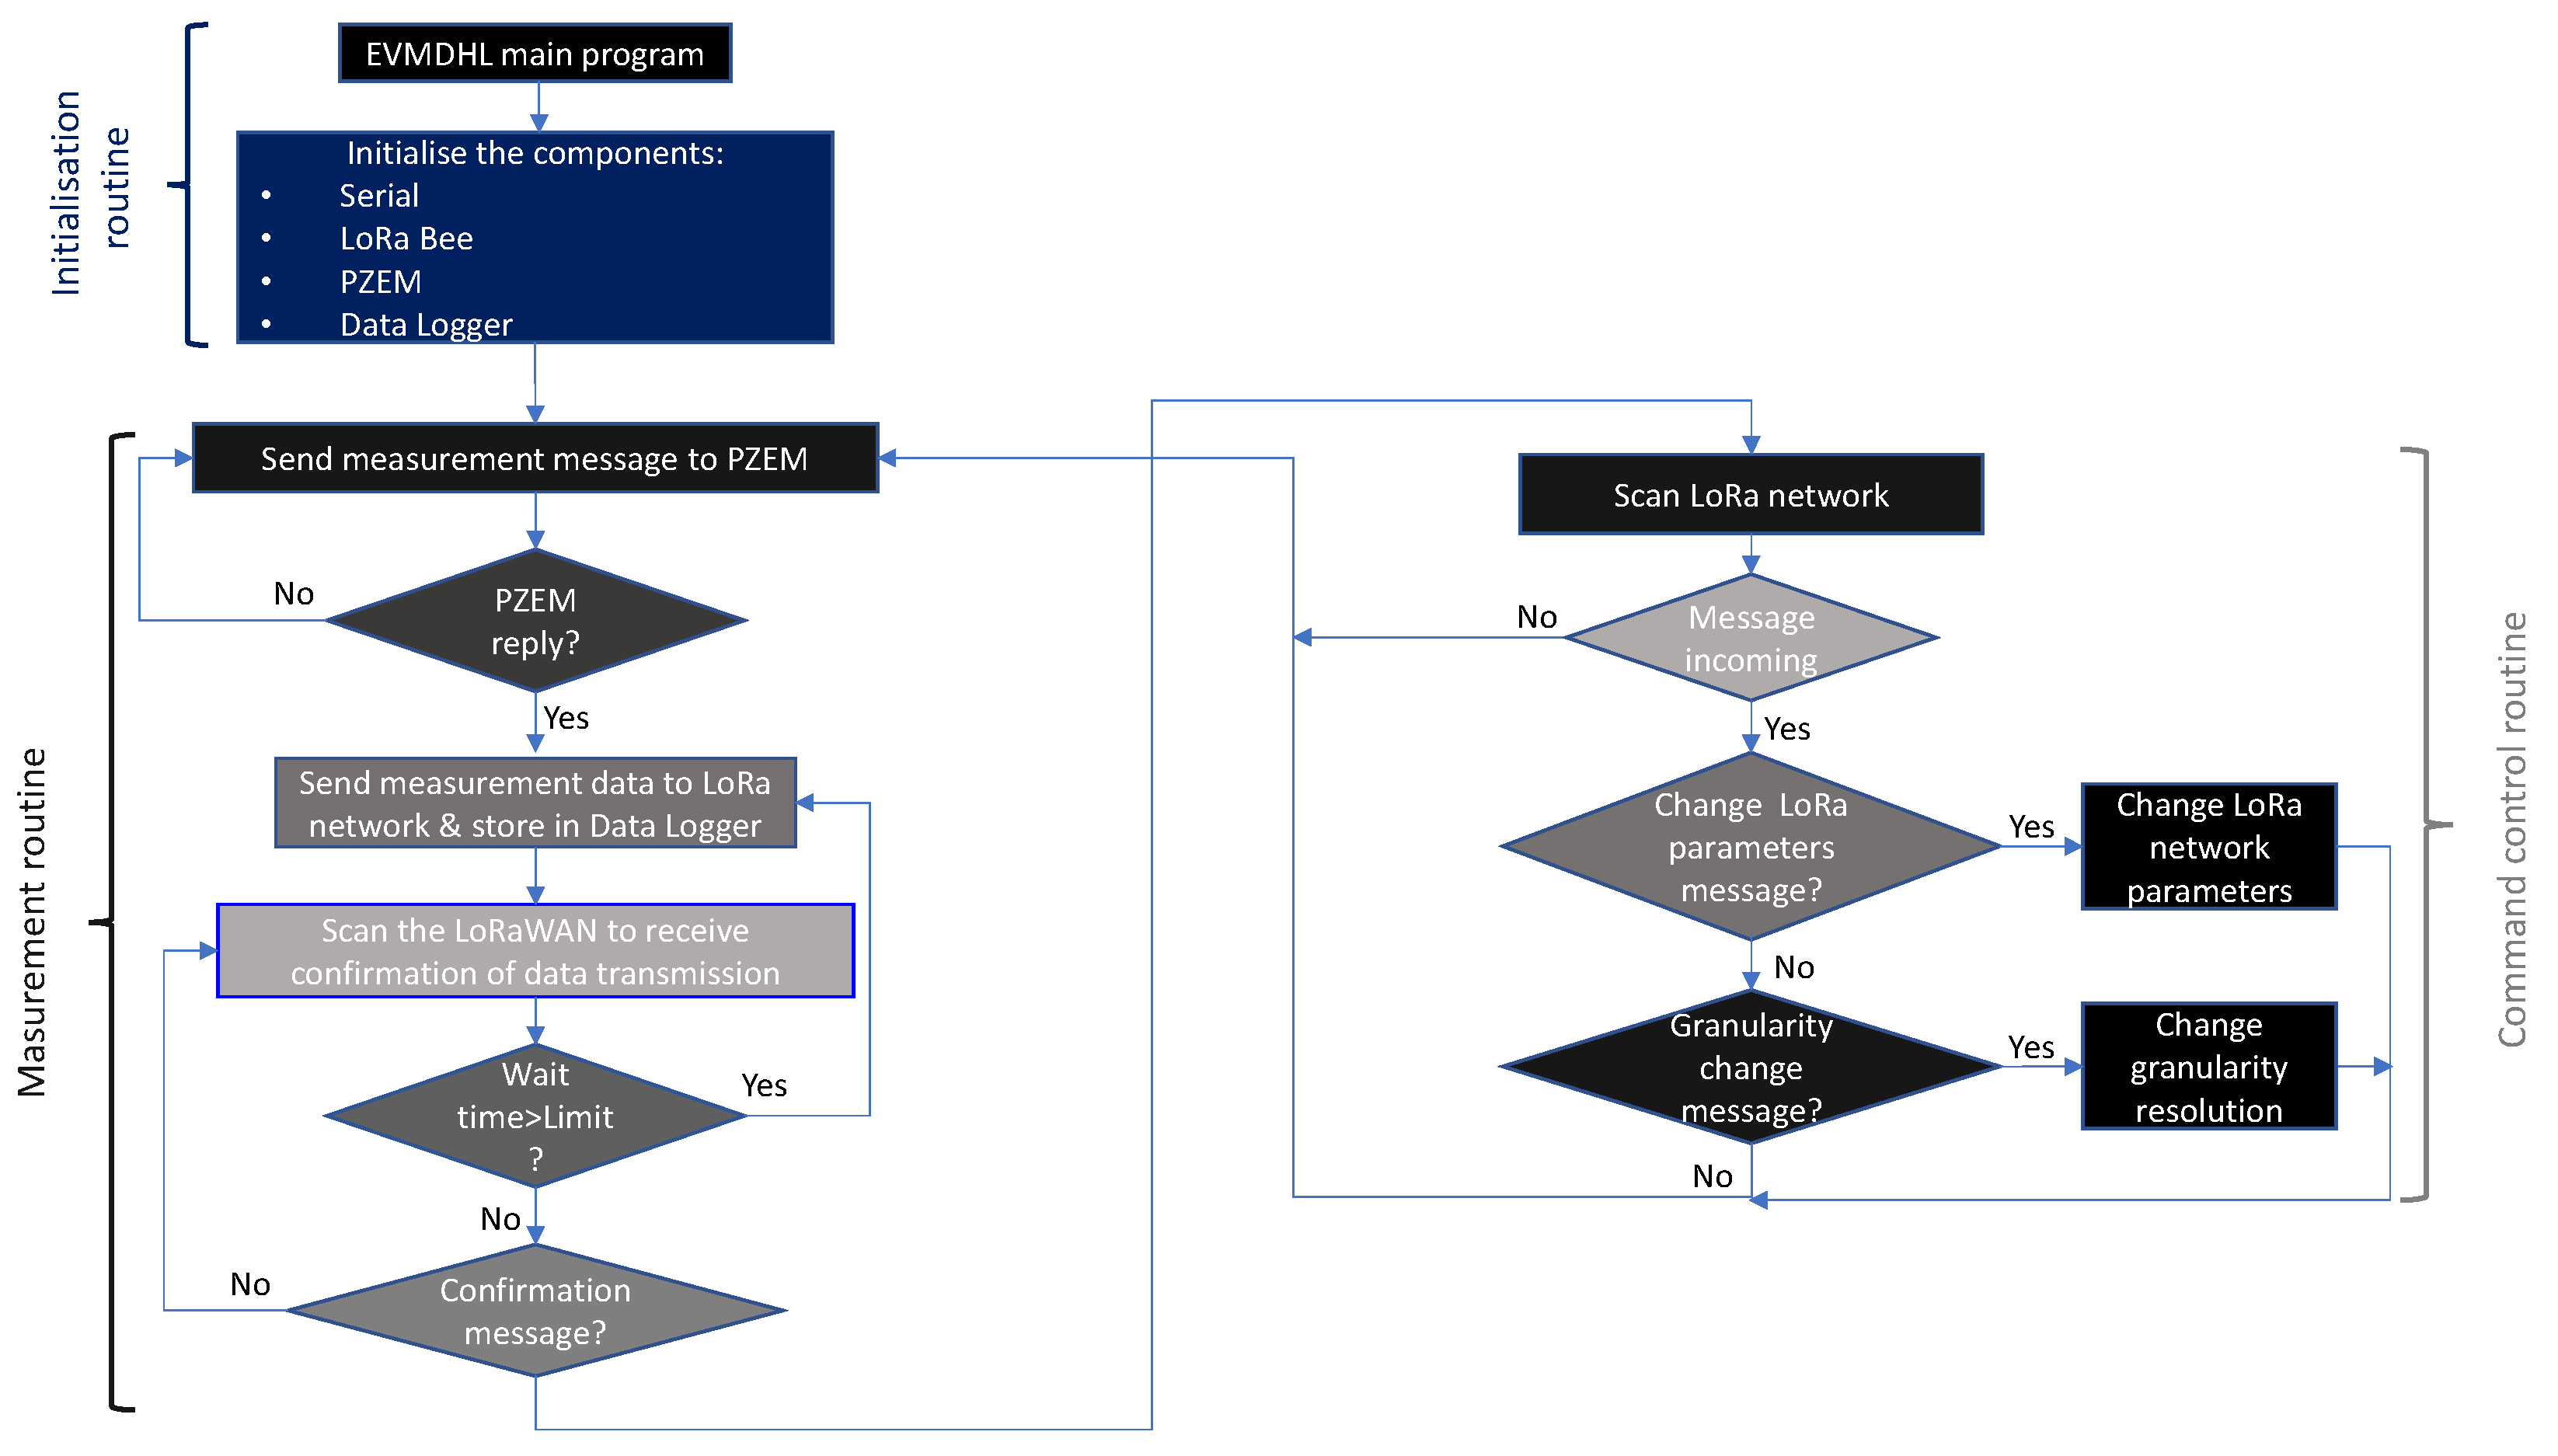
4.3.2. Software Implementation for the EVMDHL

Similar to the GREMNL, the EVMDHL programme is structured in the following three main routines: (i) initialisation, (ii) measurement and (iii) command control. As in the previous case, initialisation is only performed when the equipment is switched on or when the equipment is reset.
The measurement routine is executed at the required granularity time. For this, it checks whether PZEM is available, in which case it performs the measurement. Subsequently, the data are saved to the microSD memory and assigned a date and time. Then, the data together with the date and time plus the device identifier are sent over the LoRa network to the GREMNL, which uploads them to Firebase. The routine has implemented a message control system with a predefined timeout that resends the message in case of no confirmation from the GREMNL.
The received command messages are handled by the command control routine. For this purpose, once the measurement has been performed, the LoRa network is scanned for any incoming message and the action is executed. The messages can be of two types, a change of LoRa parameters and a change of measurement granularity. Figure 9 shows the flowchart of the main EVMDHL routine.
The effective voltage is defined by the square root of the mean value. Equation (1) allows the calculation of the RMS voltage, where VRMS represents the value of the effective voltage, N is the number of samples and vj is the jth measurement of the voltage signal.
V RMS = 1 N - 1 j = 0 N - 1 v j 2
The effective current is obtained in the same way as the voltage. For this purpose, Equation (2) has been used, where IRMS represents the value of the effective current, N is the number of samples, ij is the jth measurement of the current signal and ij is the jth measurement of the current signal.
I RMS = 1 N - 1 j = 0 N - 1 i j 2
To obtain the active power, Equation (3) is used, which is calculated from the voltage and current in each sample, where P is the active power.
P = j = 0 N - 1 v j · i j N
The apparent power is obtained from Equation (4), where S is the apparent power.
S = V RMS · I RMS
The power factor can be calculated from the ratio of active to apparent power as defined in Equation (5), where PF is the power factor.
PF = P S

5. Results

This section shows the results obtained with the equipment developed in this research. The data obtained in five houses, with one house equipped with photovoltaic generation, are illustrated. The results are shown at various granularities that highlight the importance of high resolutions to achieve high precision measurements. Furthermore, the results from the measurements on the LoRa are presented.

5.1. Case Study

Several real installations in Jaén, Andalusia, Spain were selected to study the devices that are the object of this research. This study is focused on the measurement of electrical variables in residential environments. In order to test the operation of the GREMNL and EVMDHL, installations of different natures were selected to obtain results. Thus, the peaks, loads and fluctuations are different, reflecting the different load profiles that can be found in real installations.
For the selection of installations different criteria were followed such as (i) contracted power, (ii) number of phases and (iii) mains voltage. Households #3 and #5 have a three-phase supply, and the remaining ones have a single-phase supply. In terms of contracted power, there are different levels according to Spanish legislation, with a range between 2.3 and 6.9 kW. Household #6 has a 2 kWp photovoltaic power generation installation that feeds the house and sends the excess energy generated to the grid. It also receives the necessary power consumption from the grid when there is no photovoltaic generation, or it is not enough to cover the household’s consumption.
It can be seen that all the households have some type of electric air conditioning installed. All of them have air conditioning due to the hot summers in Jaén. Additionally, houses #3 and #5 have electric heating, as they have cold winters with hot summers.
The Department of Electrical Engineering of the University of Jaén has a 2.97 kWp PV generation installation that is used for laboratory practice with students and research. This installation was monitored by the authors, and the results are shown in the following sections. On the other hand, an EVMDHL unit was also installed to monitor a plug-in hybrid electric vehicle (PHEV), specifically a BMW 2 series model.
Table 7 shows the main characteristics and configuration of each of the houses studied.

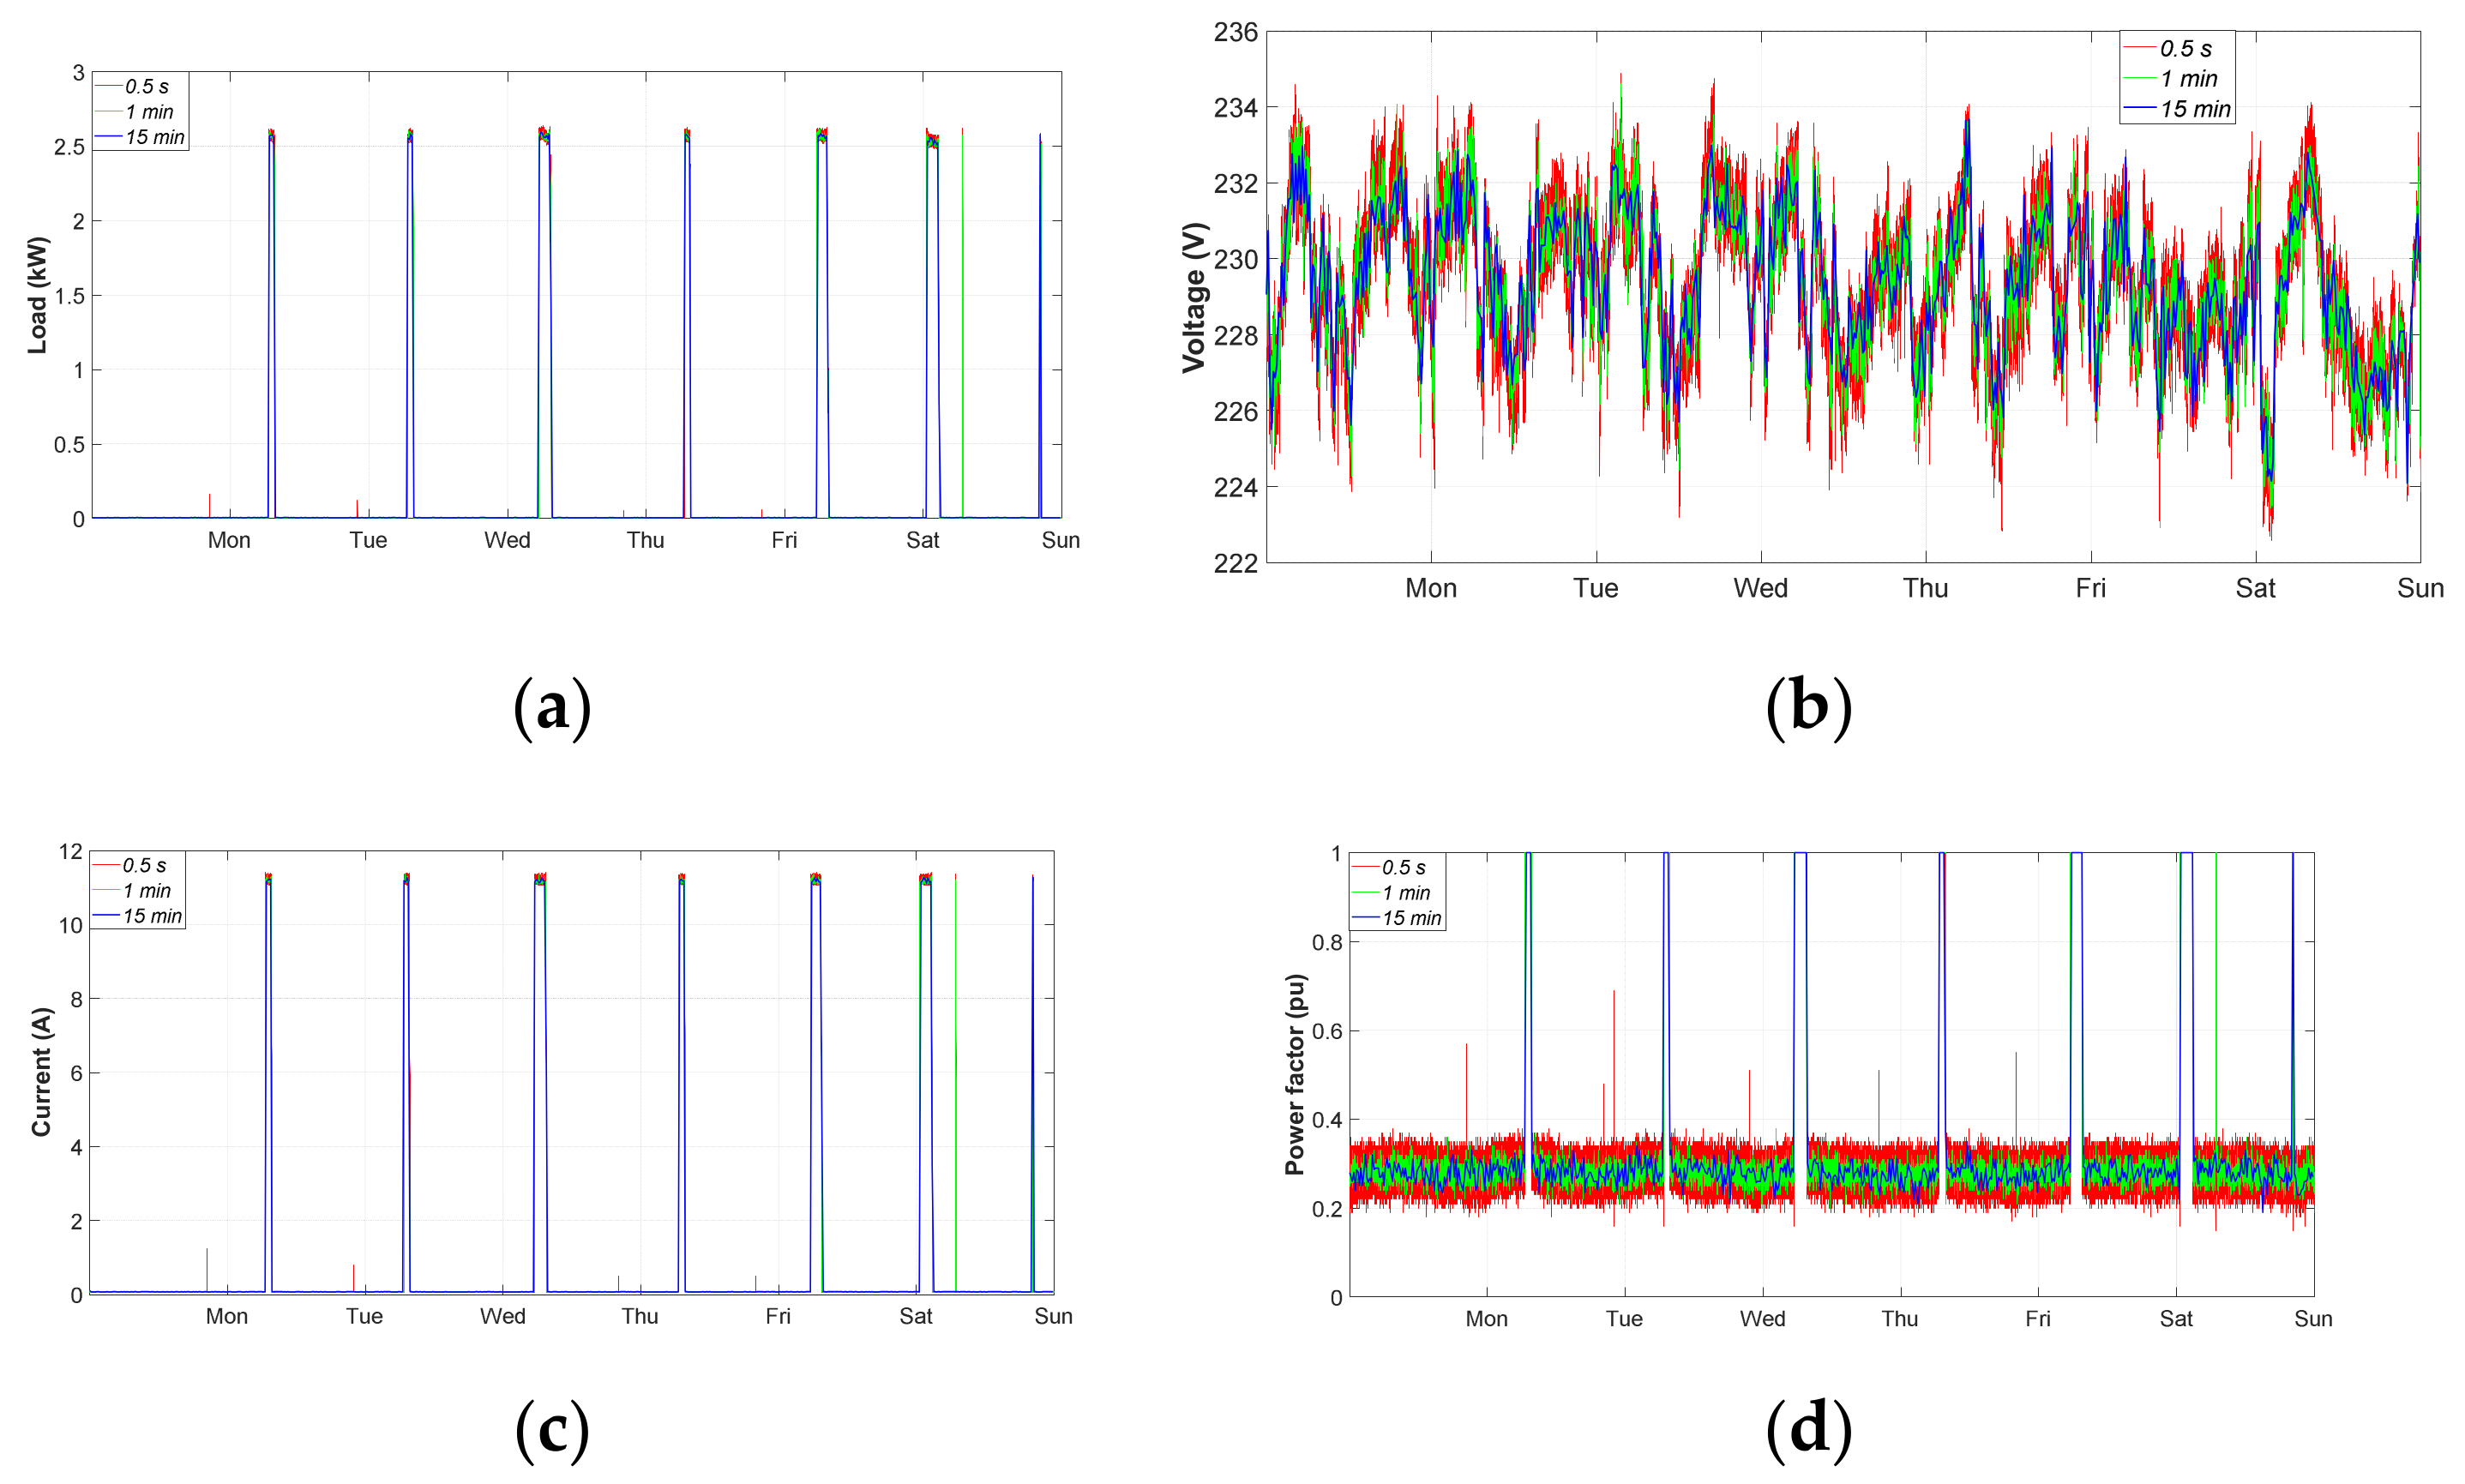
5.2. Measurement Results

The period analysed was one week from 12 to 18 July 2021. The study shows the granularities of 0.5 s, 1 min and 15 min to study the influence of granularity on the accuracy of the results obtained.

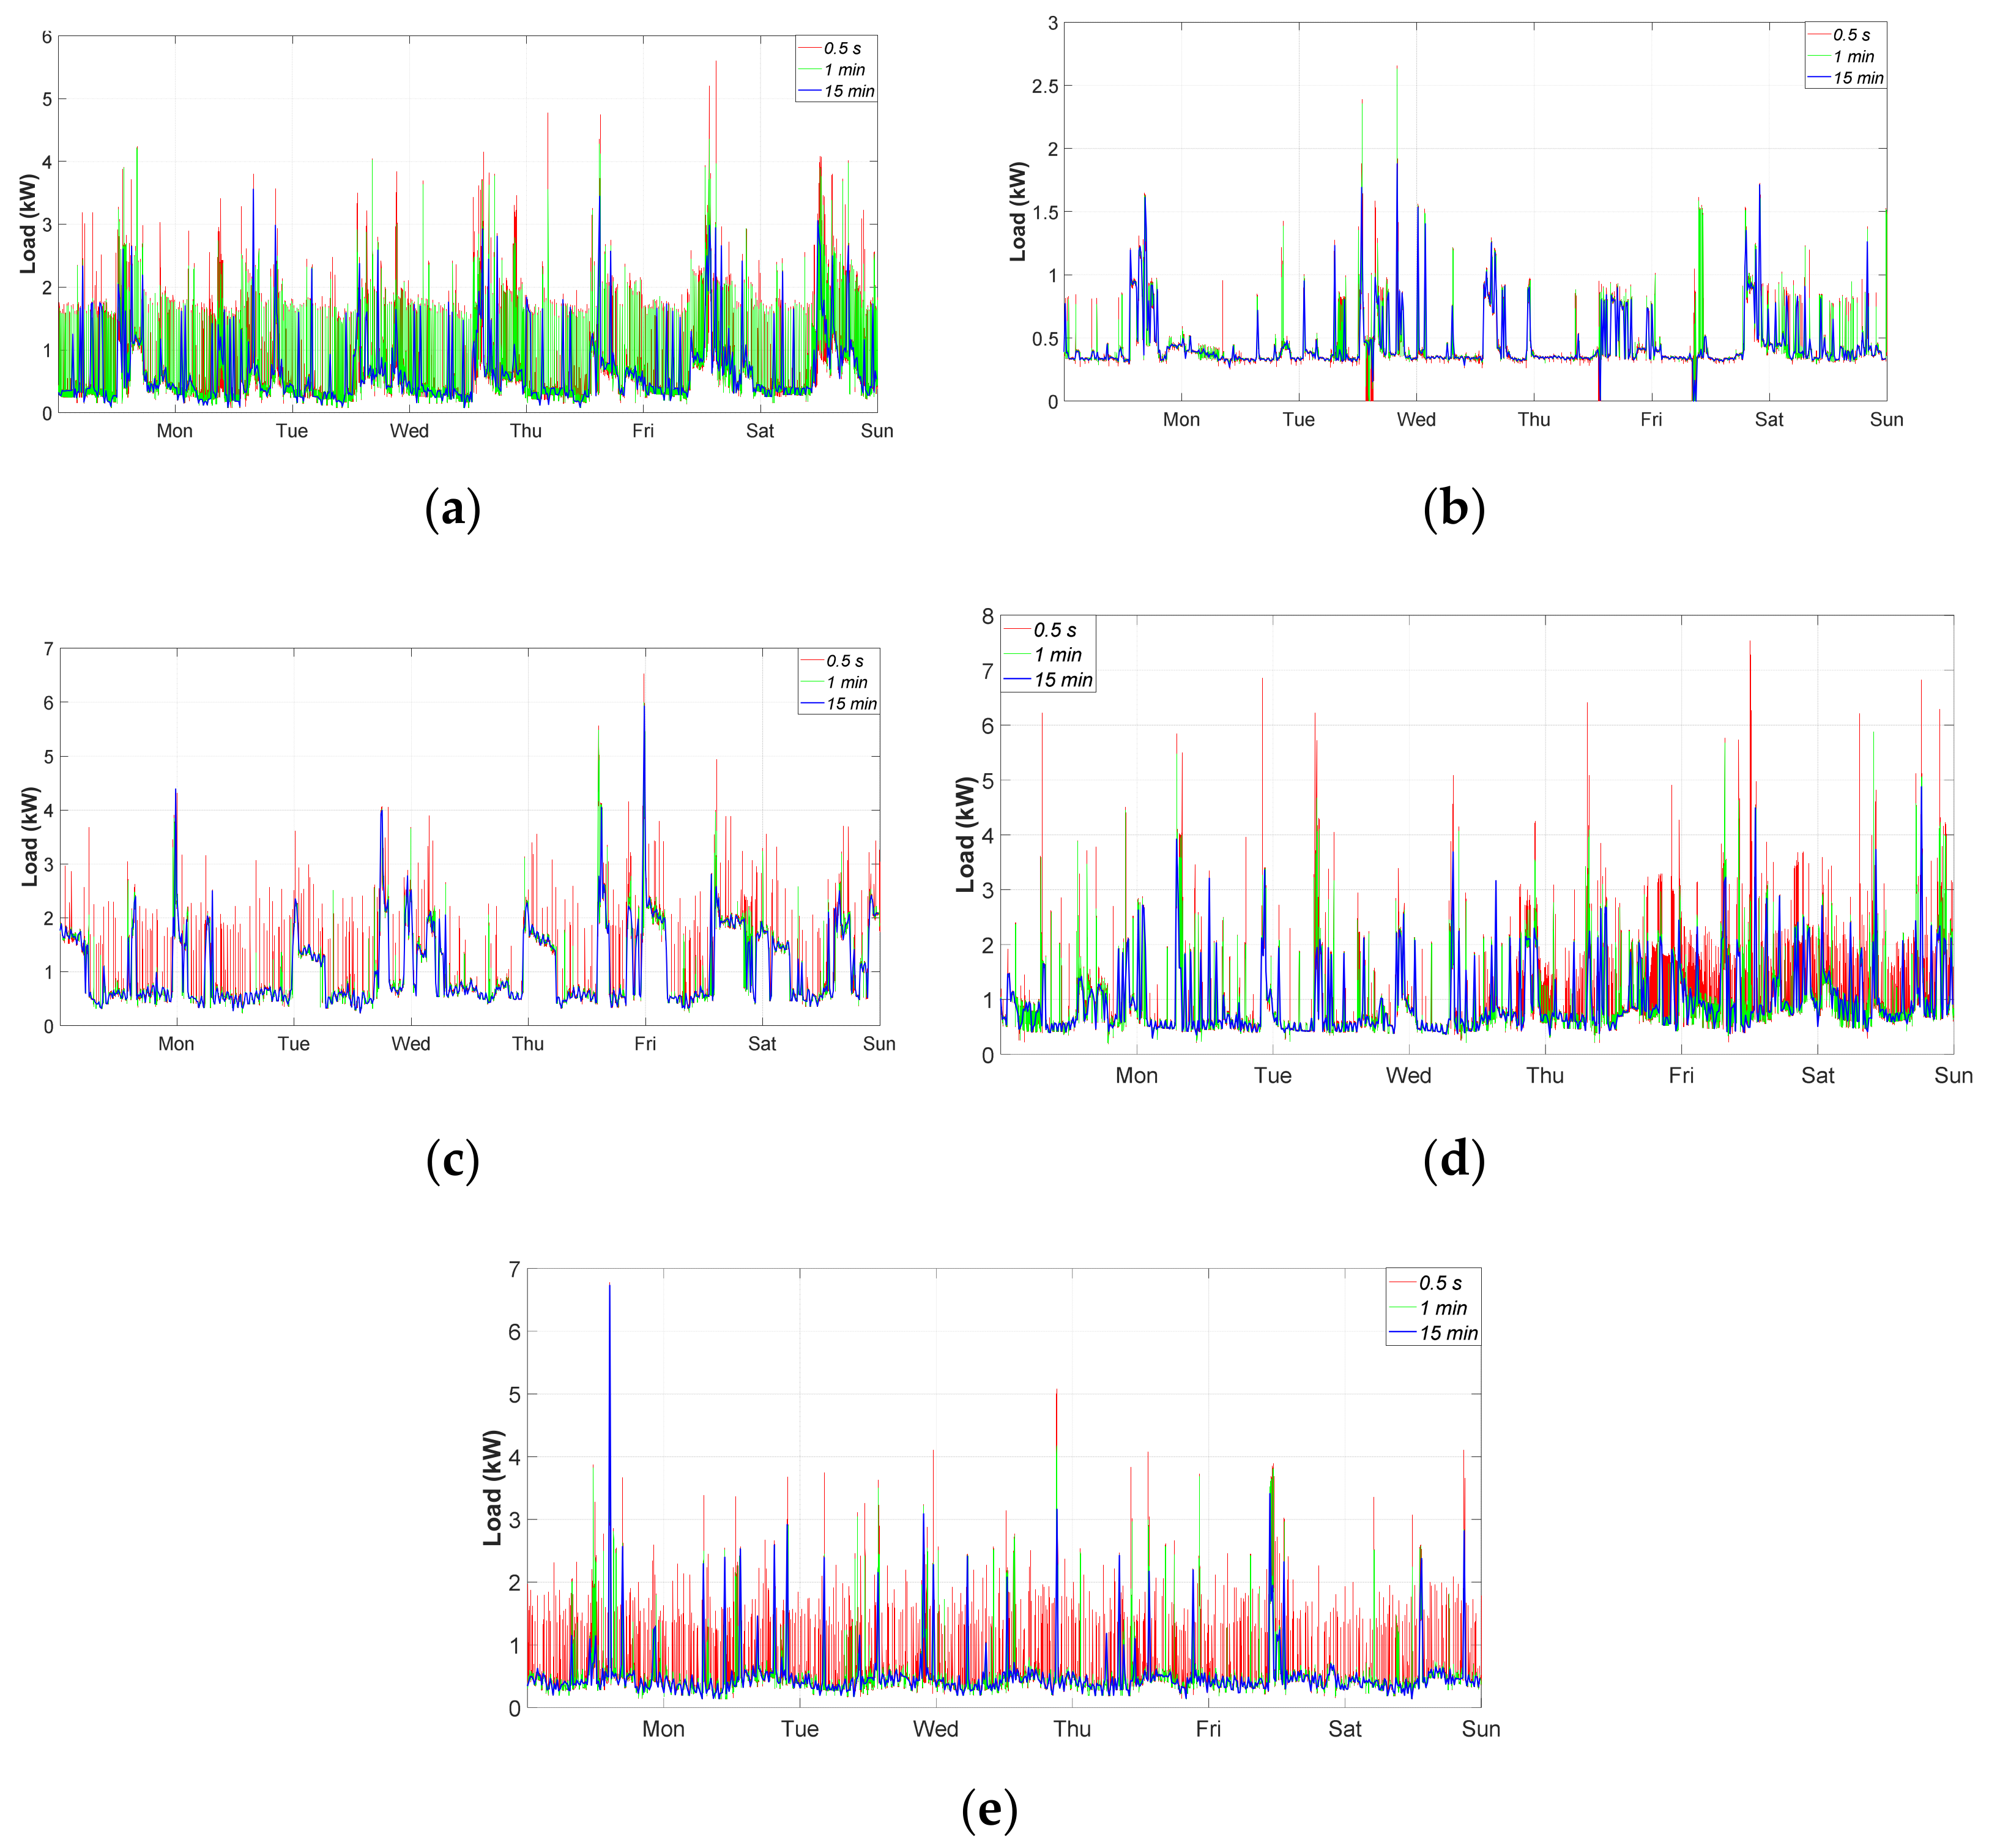
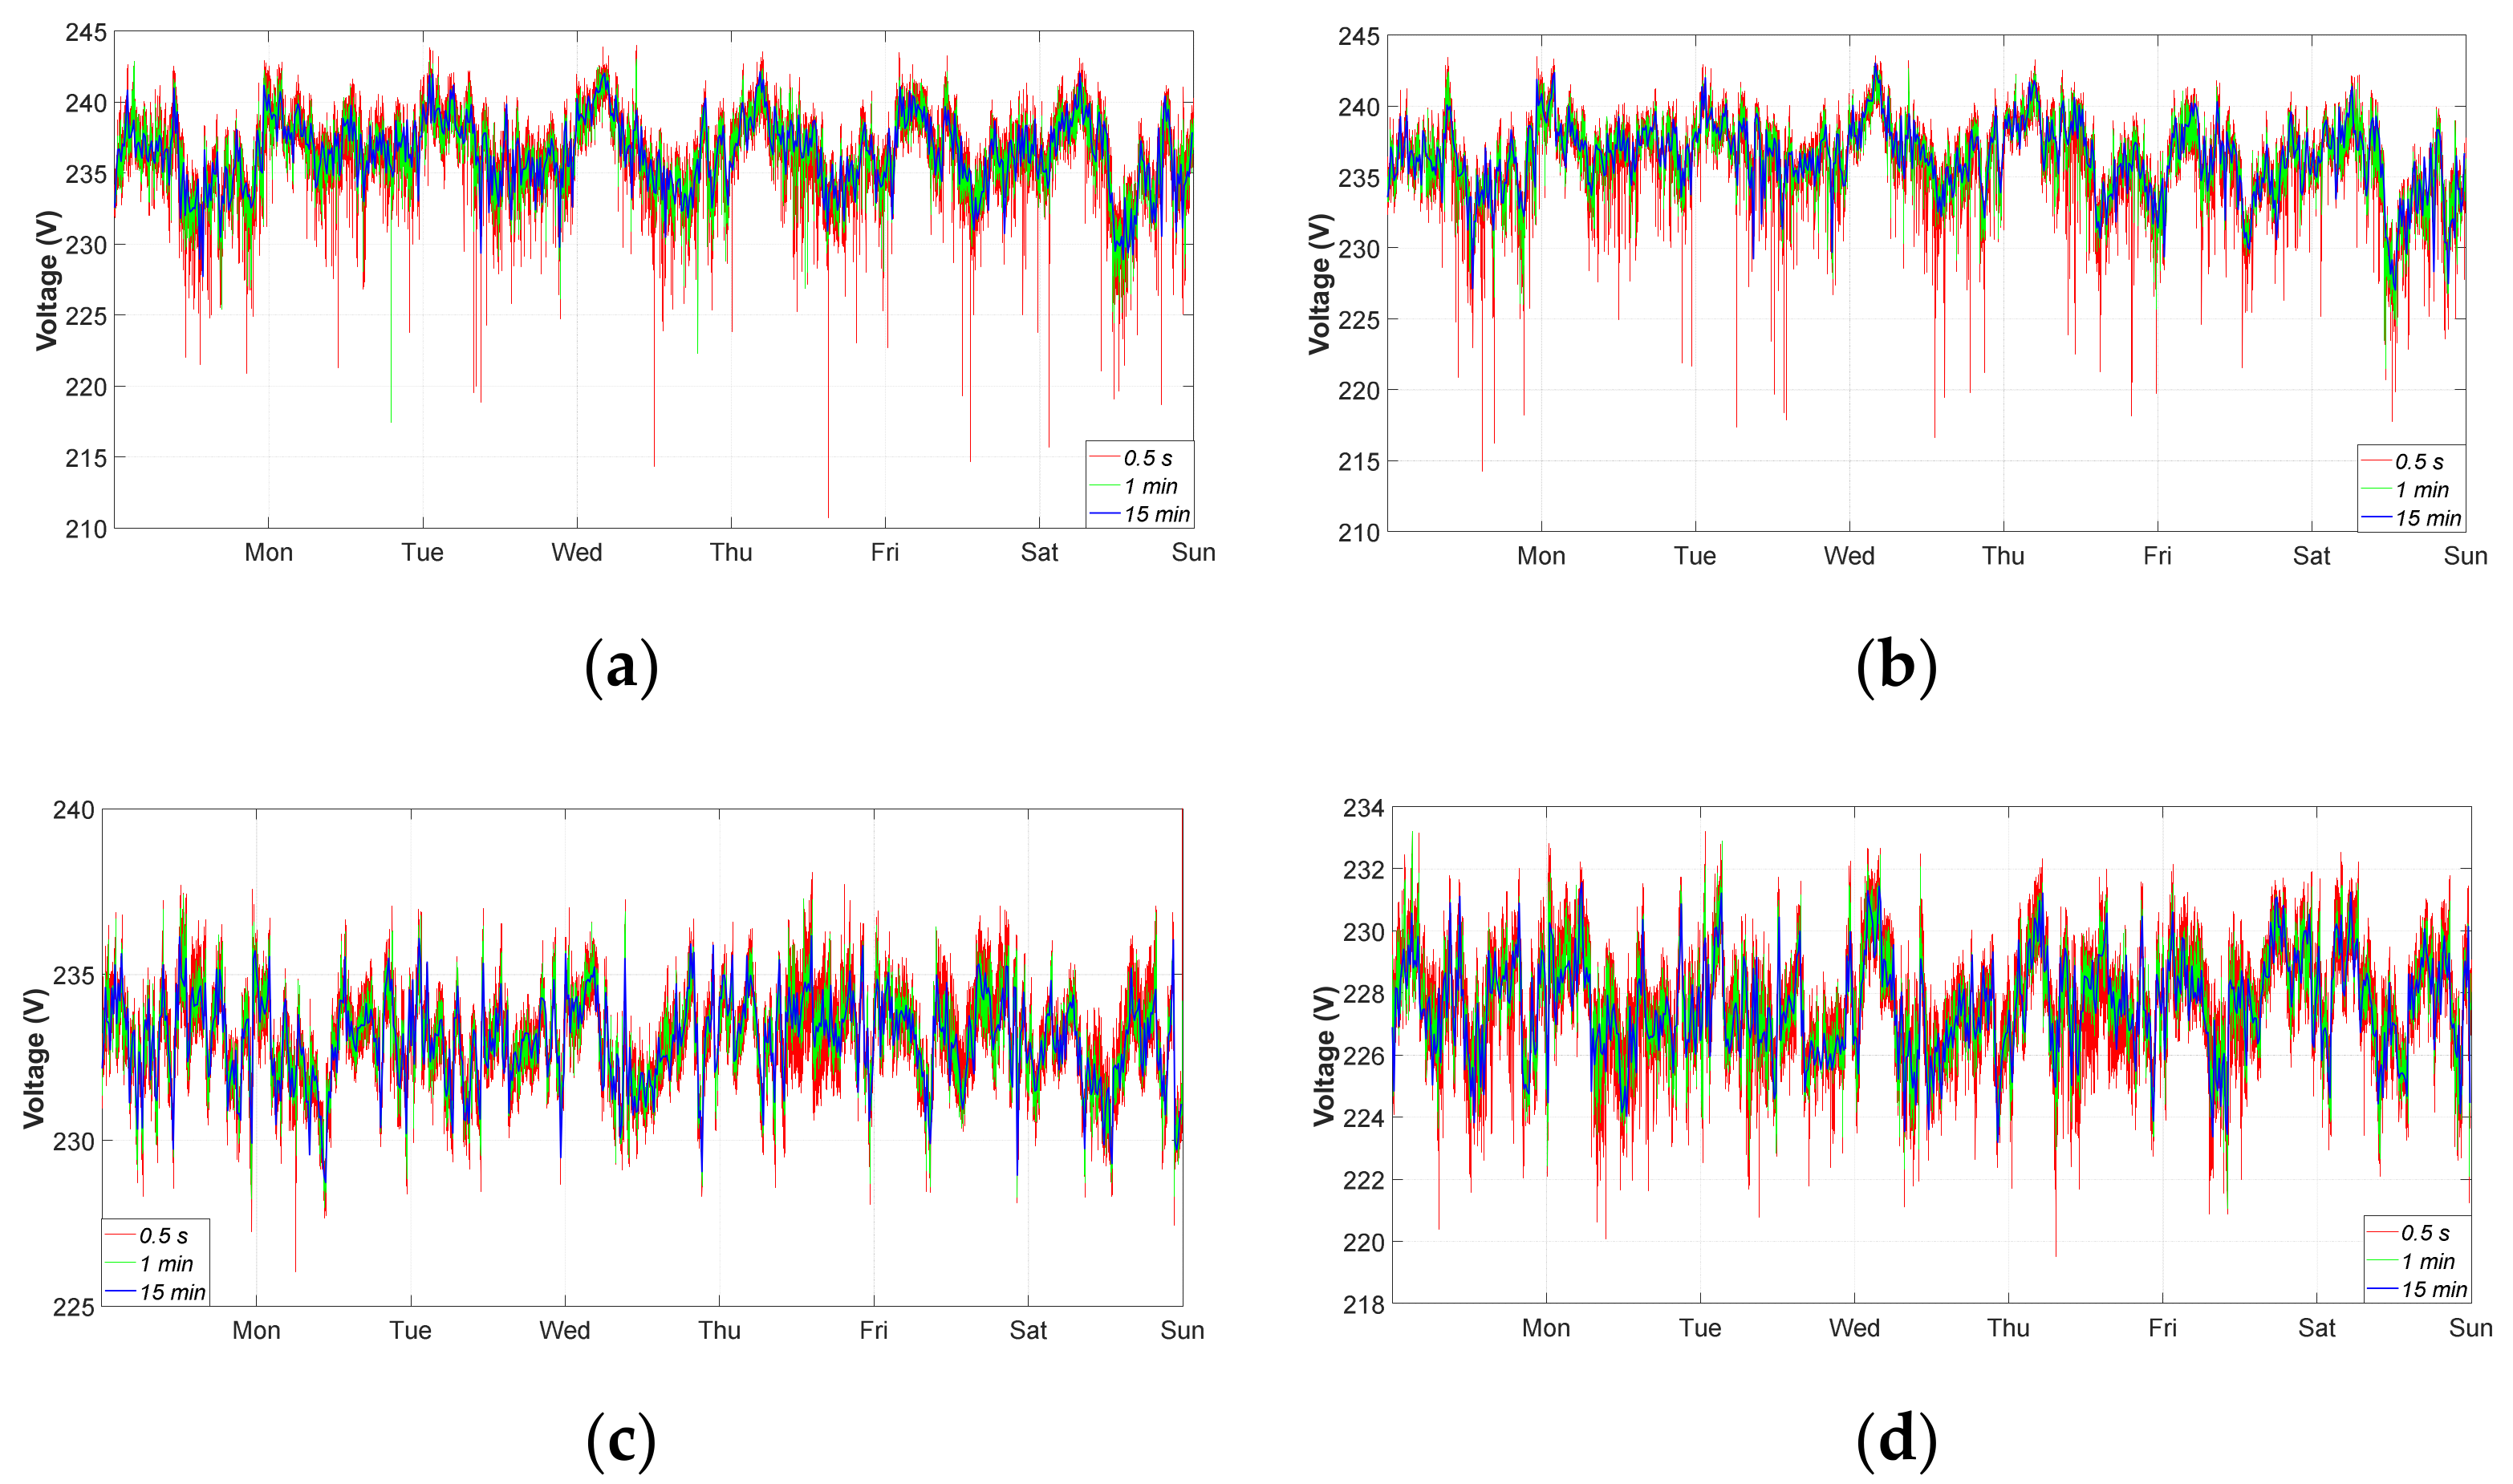
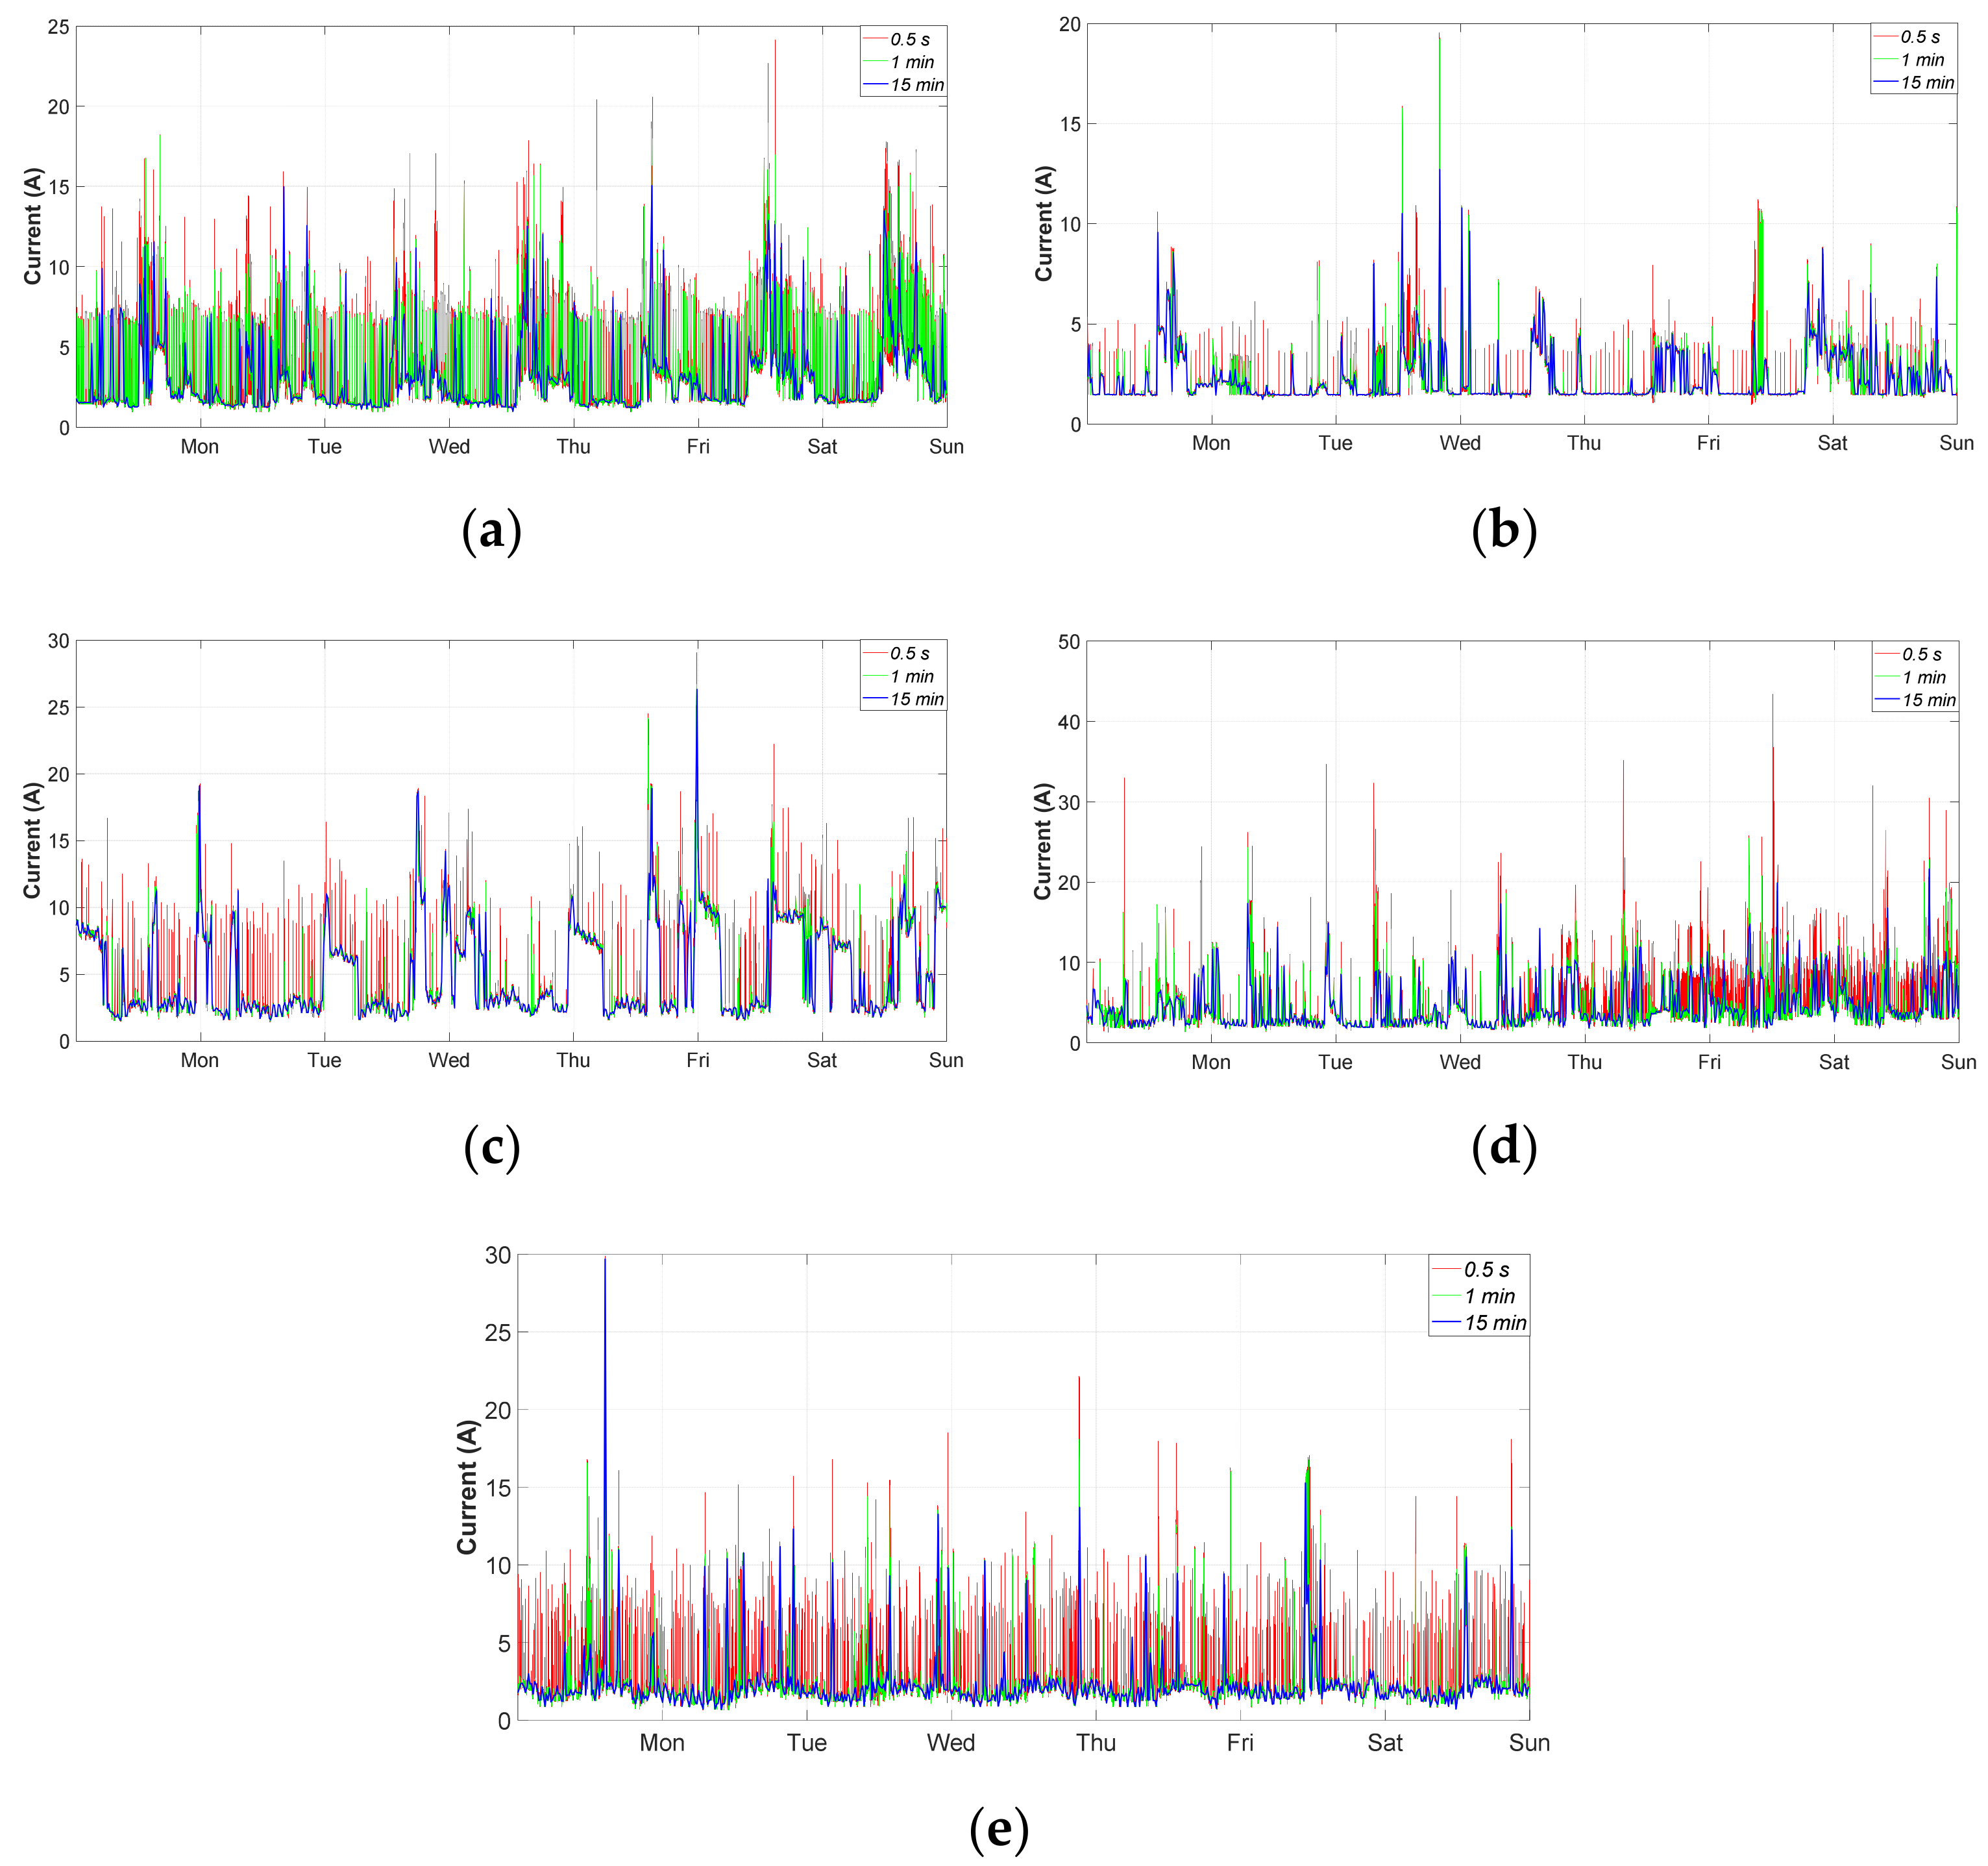
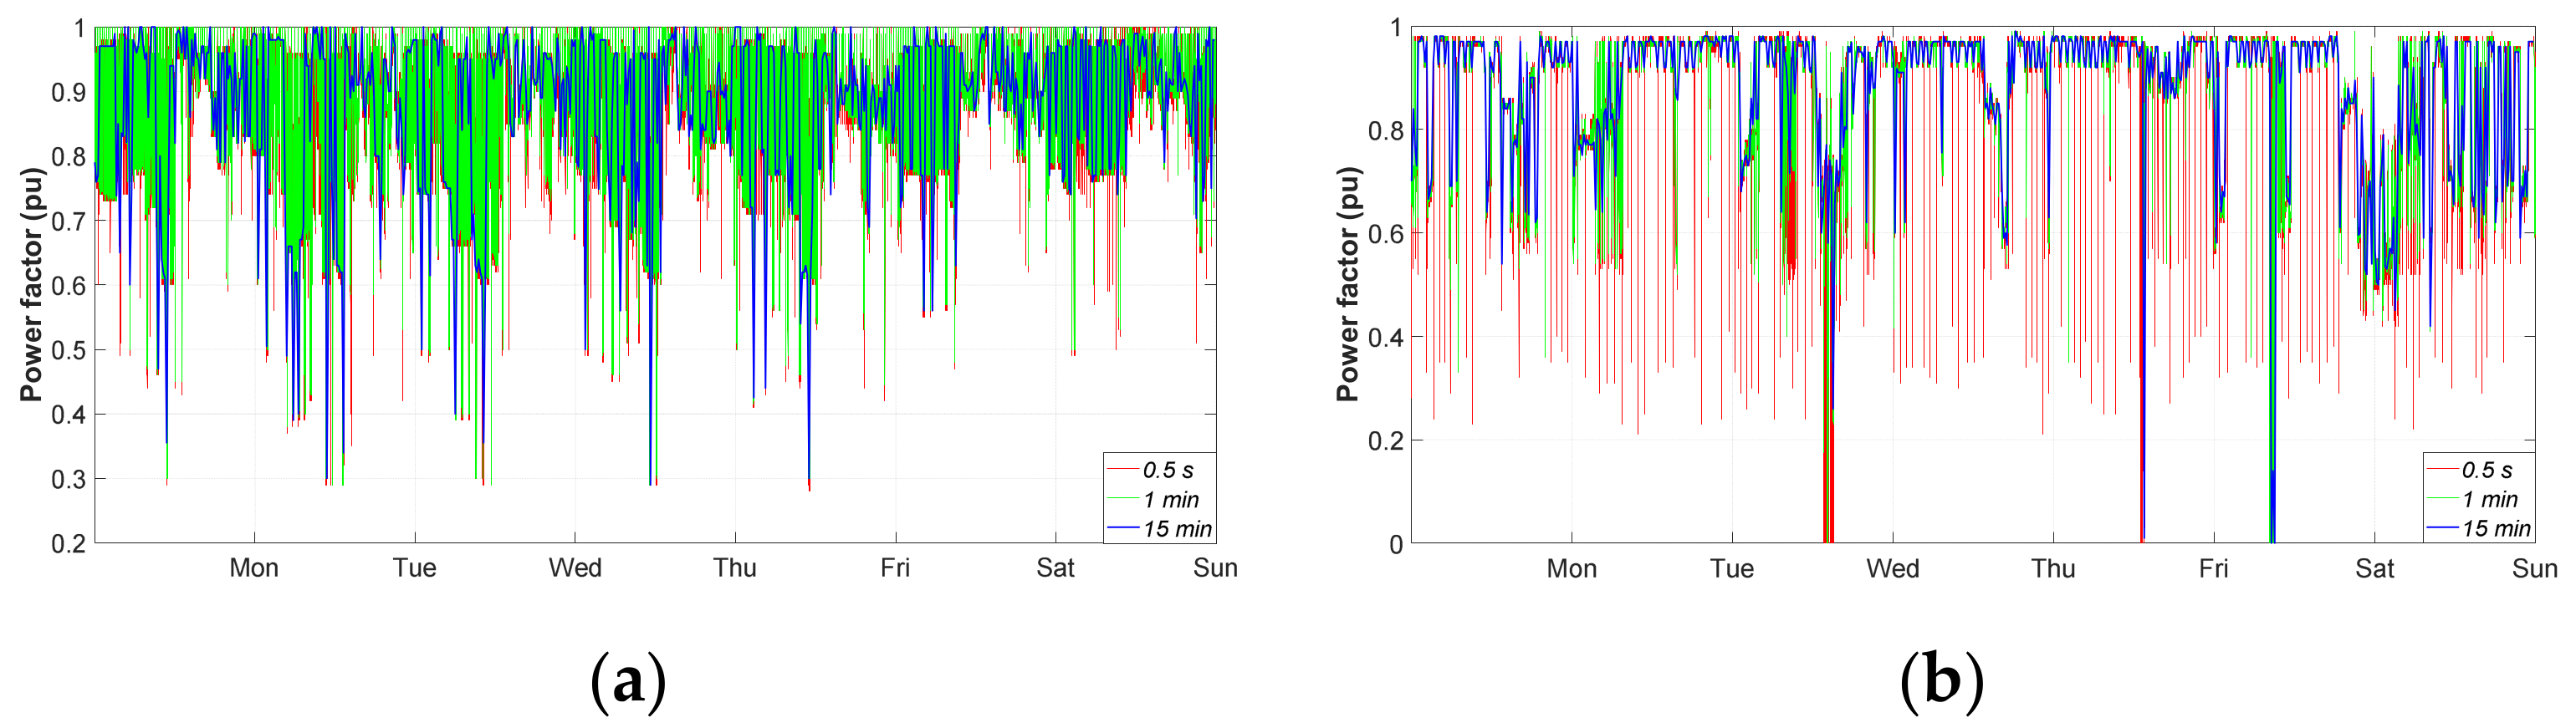
5.2.1. Households #1 to #5
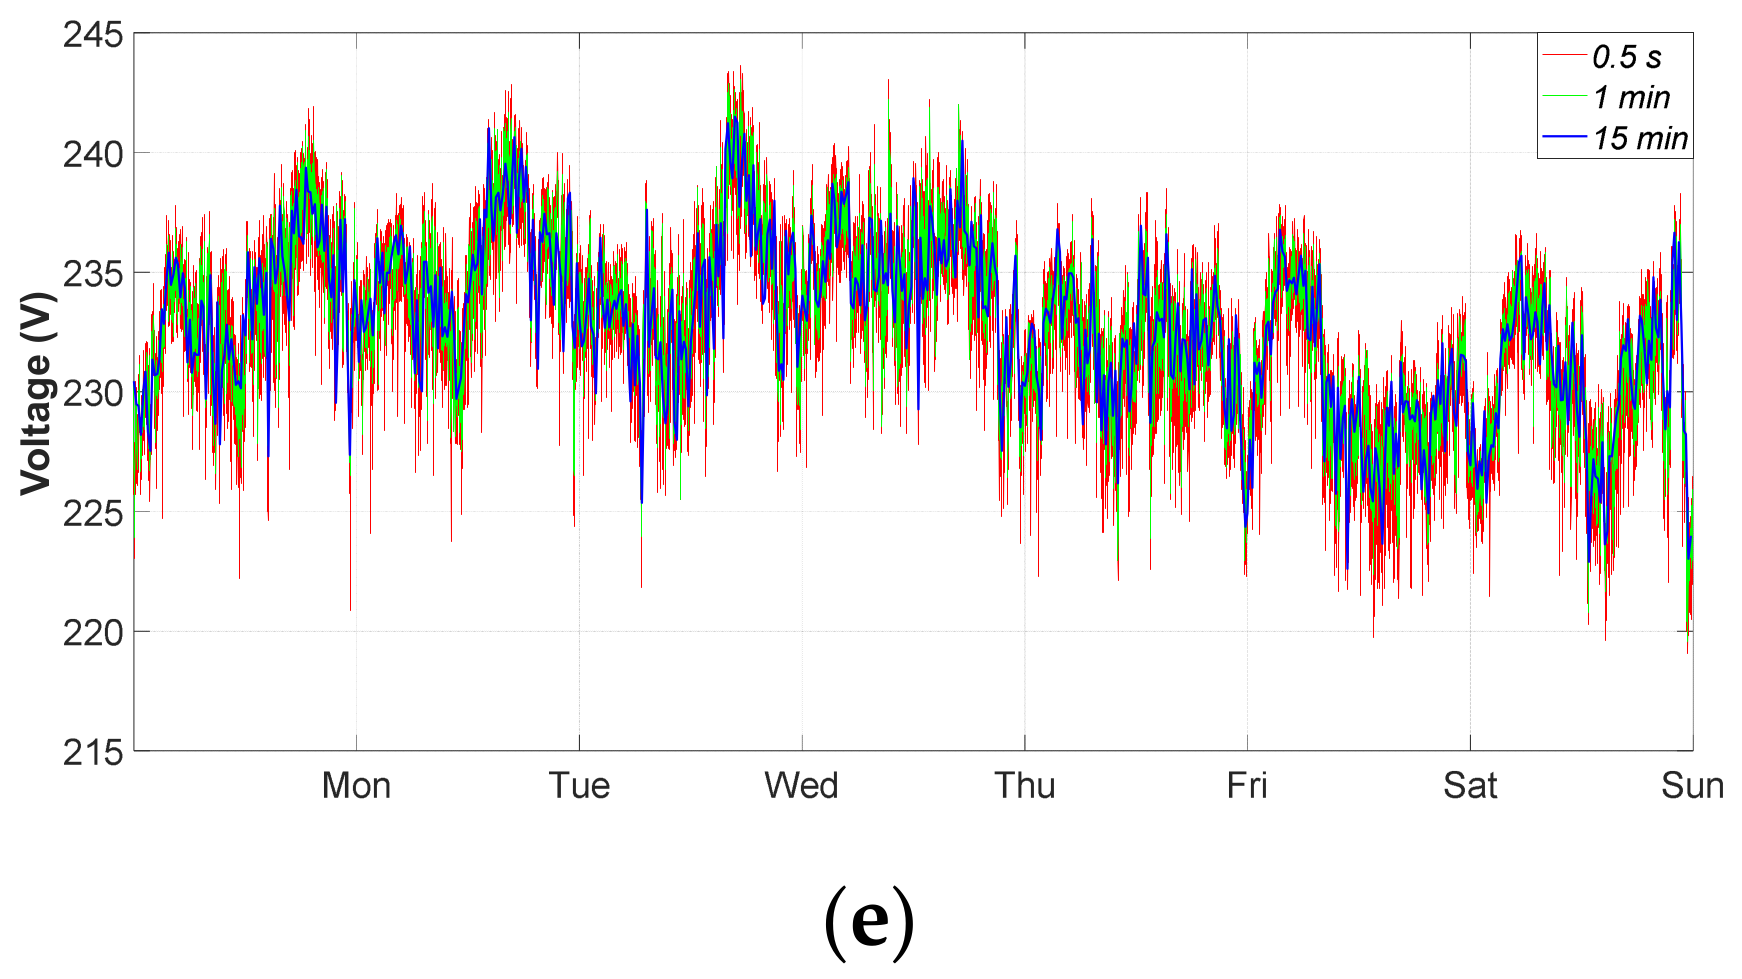
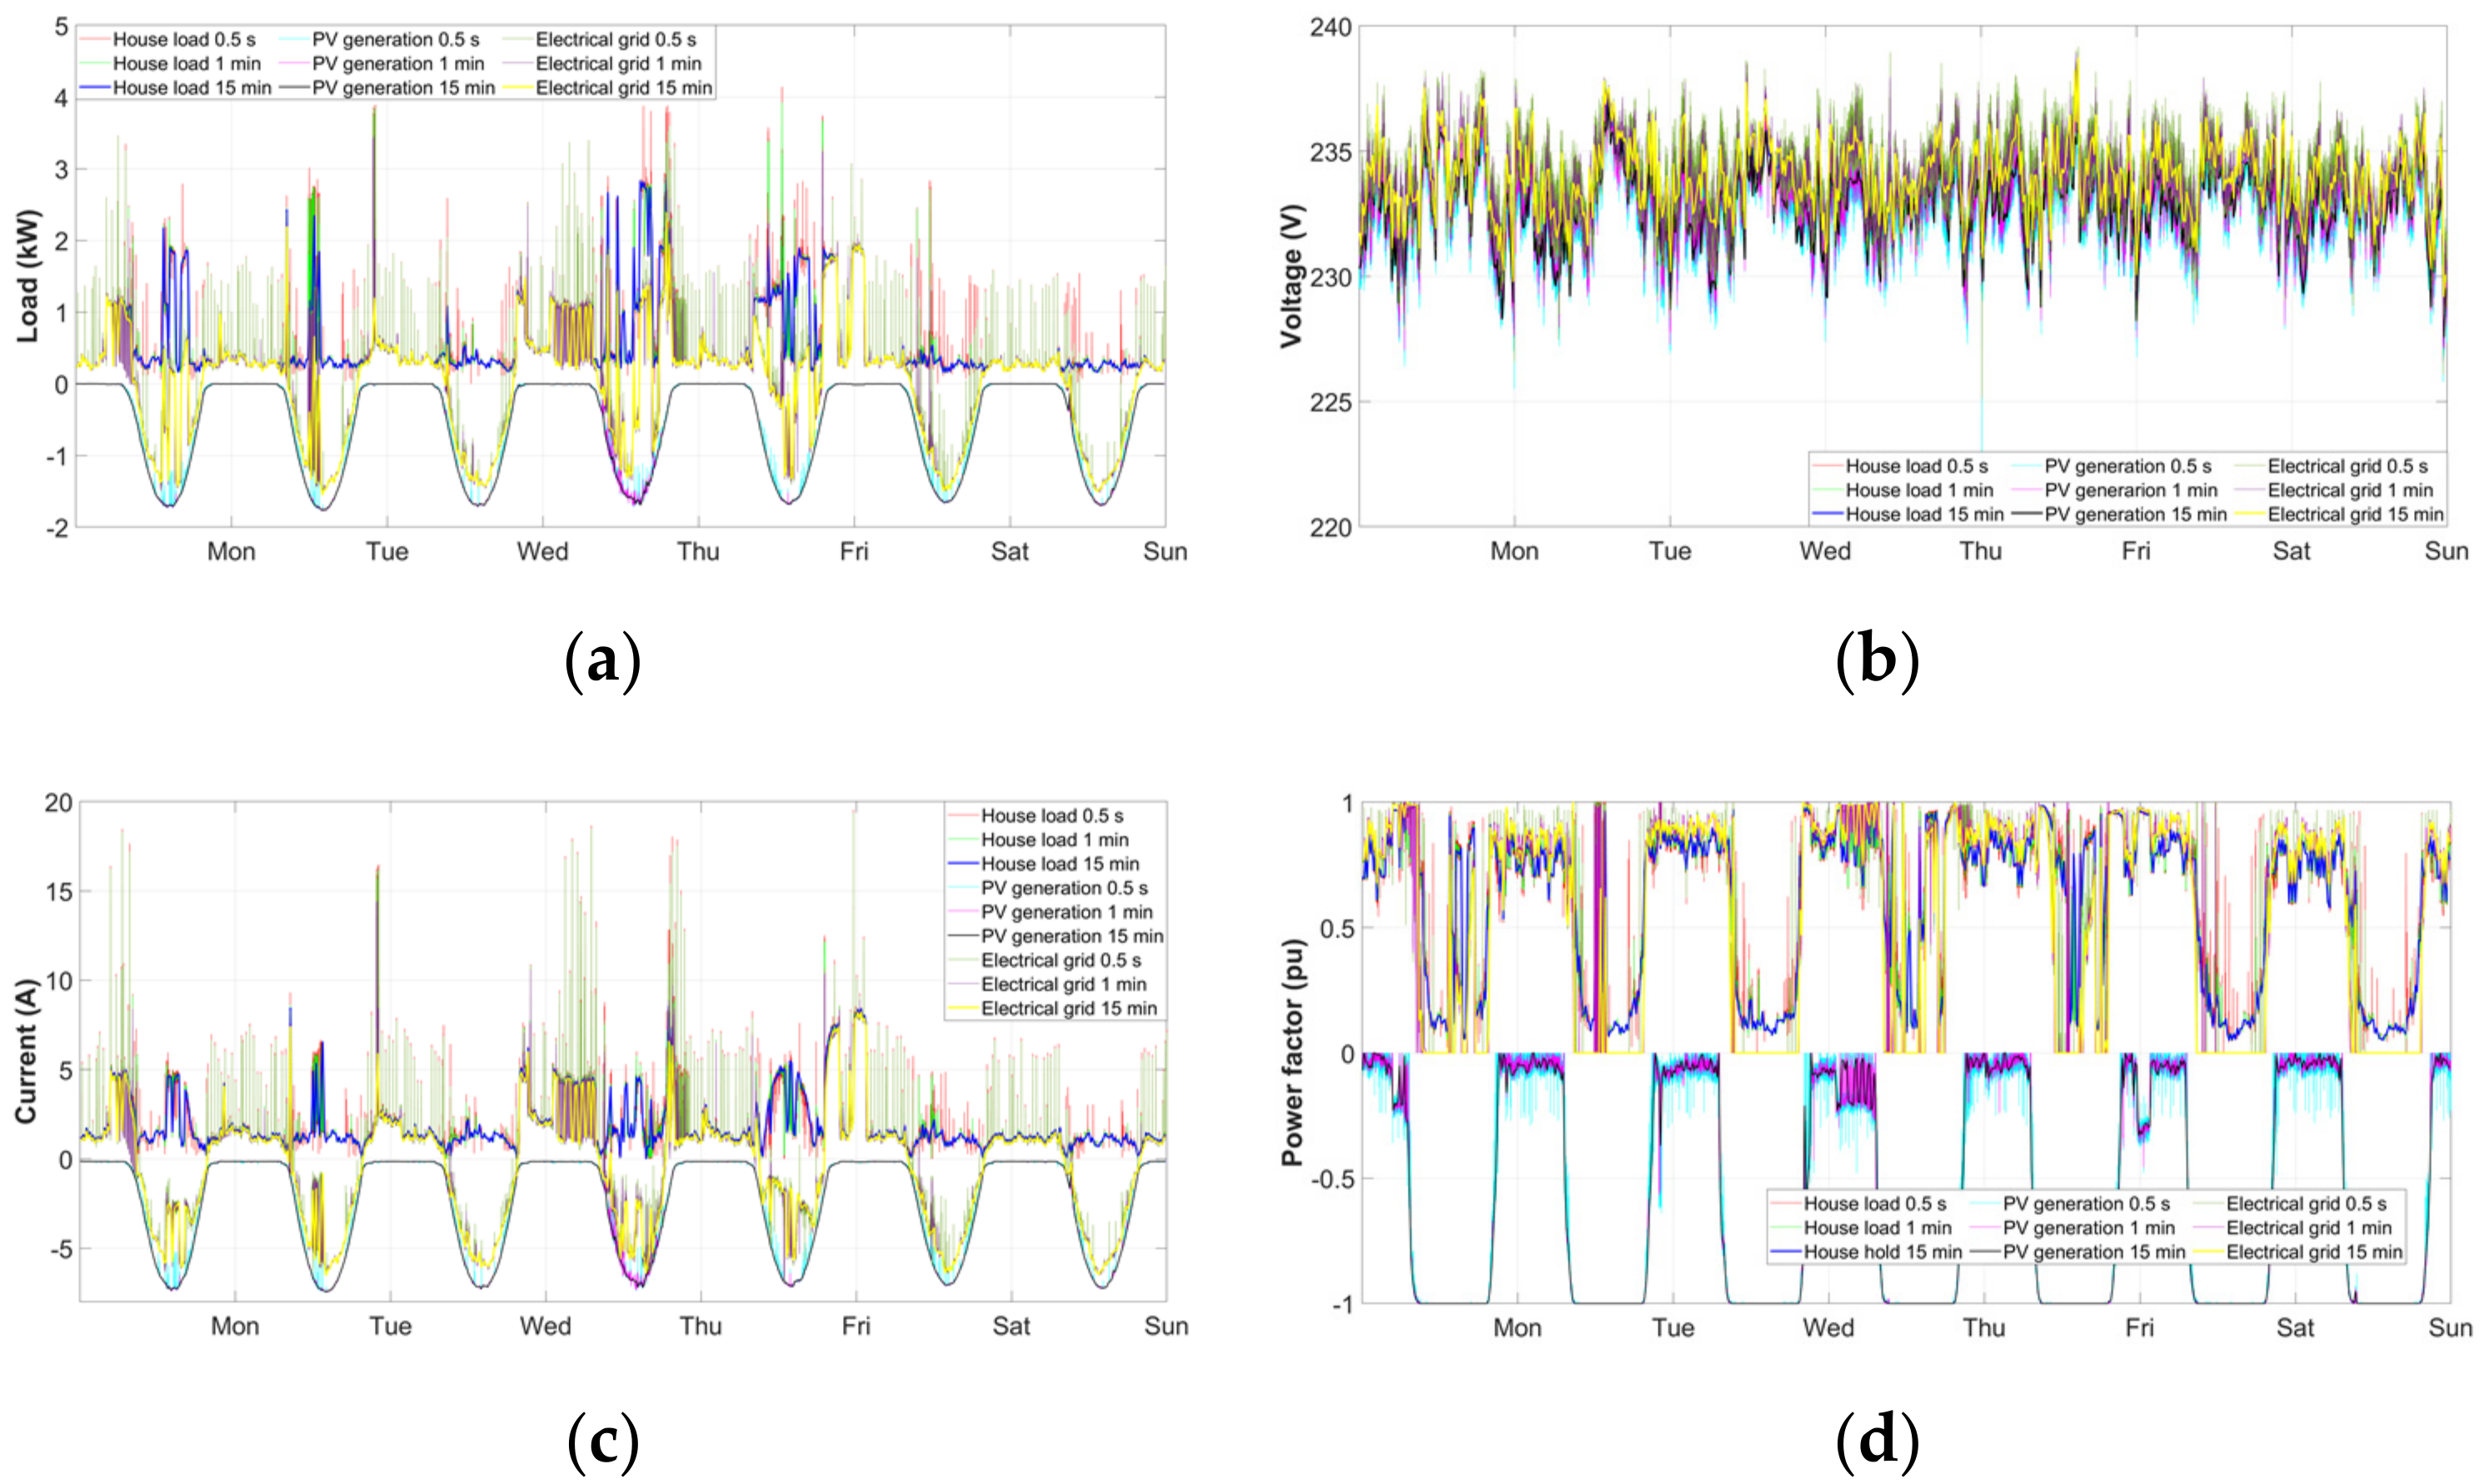
The first five houses were studied in this section because none of them have PV generation; therefore, household #6 will be studied separately.
The maximum peaks at a granularity of 0.5 s were 5.59, 2.65, 6.52, 7.53 and 6.76 kW for each of the households, respectively. At the 1 min granularity, the peaks were 3.96, 2.62, 6.01, 2.85 and 6.61 kW, respectively. Finally, the 15 min granularity gave peaks of 2.94, 1.88, 5.93, 0.77 and 6.58 kW, respectively. The peak reduction for 1 min and 15 min were 29.15 and 47.40%, 1.14 and 29.05%, 7.82 and 9.04%, 62.15 and 89.77% and 2.21 and 2.66% for each of the households, respectively. Figure 10 shows the power data obtained during the measurement period.
Table 8 shows the statistics of the power data obtained for the five households studied. It can be seen that the mean data are similar, but there are differences in different values. For the maximum values, there are differences of 36.49, 30.22, 9.20, 35.32 and 0.07% for each household, respectively, which shows the importance of the granularity of 0.5 s. This granularity is more appropriate for obtaining precise results since measurements with a lower granularity can miss areas of maximum consumption that are not reflected in the measurements.
The analysis of the symmetry indicates that, as it is positive in all cases, the concentration of consumption extends the distribution to the right with values above the mean. The study of the kurtosis indicates a leptokurtic distribution (kurtosis greater than three) with a high kurtosis and the data concentrated around the mean for all the households analysed.
In addition to the graphs for power, the graphs for the measured voltage, current and power factor data are shown, which reinforce the importance of the accuracy of the measurements made in relation to the granularity chosen. It should be noted that the granularity of 0.5 s reflects the changes in the evolution of electricity consumption in the households analysed much more accurately. Figure 11 shows the measured voltages. Figure 12 shows the data collected for current, and Figure 13 shows the power factor data.

5.2.2. Household #6

This household was analysed separately because it has photovoltaic generation. The installed power is 2 kWp, which helps the consumption of the house. For the construction of the graphs, consumption has been taken as positive and generation as negative.
Figure 14a shows the consumption and generation produced, as well as the exchanges with the electricity grid. It can be clearly seen that the PV generation covers a large part of the consumption during the generation hours, and even excess energy is fed into the grid. The differences in readings obtained with the lower granularity, which is more accurate than the others, can also be observed.
The distribution of generation and consumption currents is similar to that of power, with these two variables being linked. The voltages have a very similar distribution as they are connected to the same electrical network. Finally, Figure 14c shows the power factor distribution obtained in the measurement.

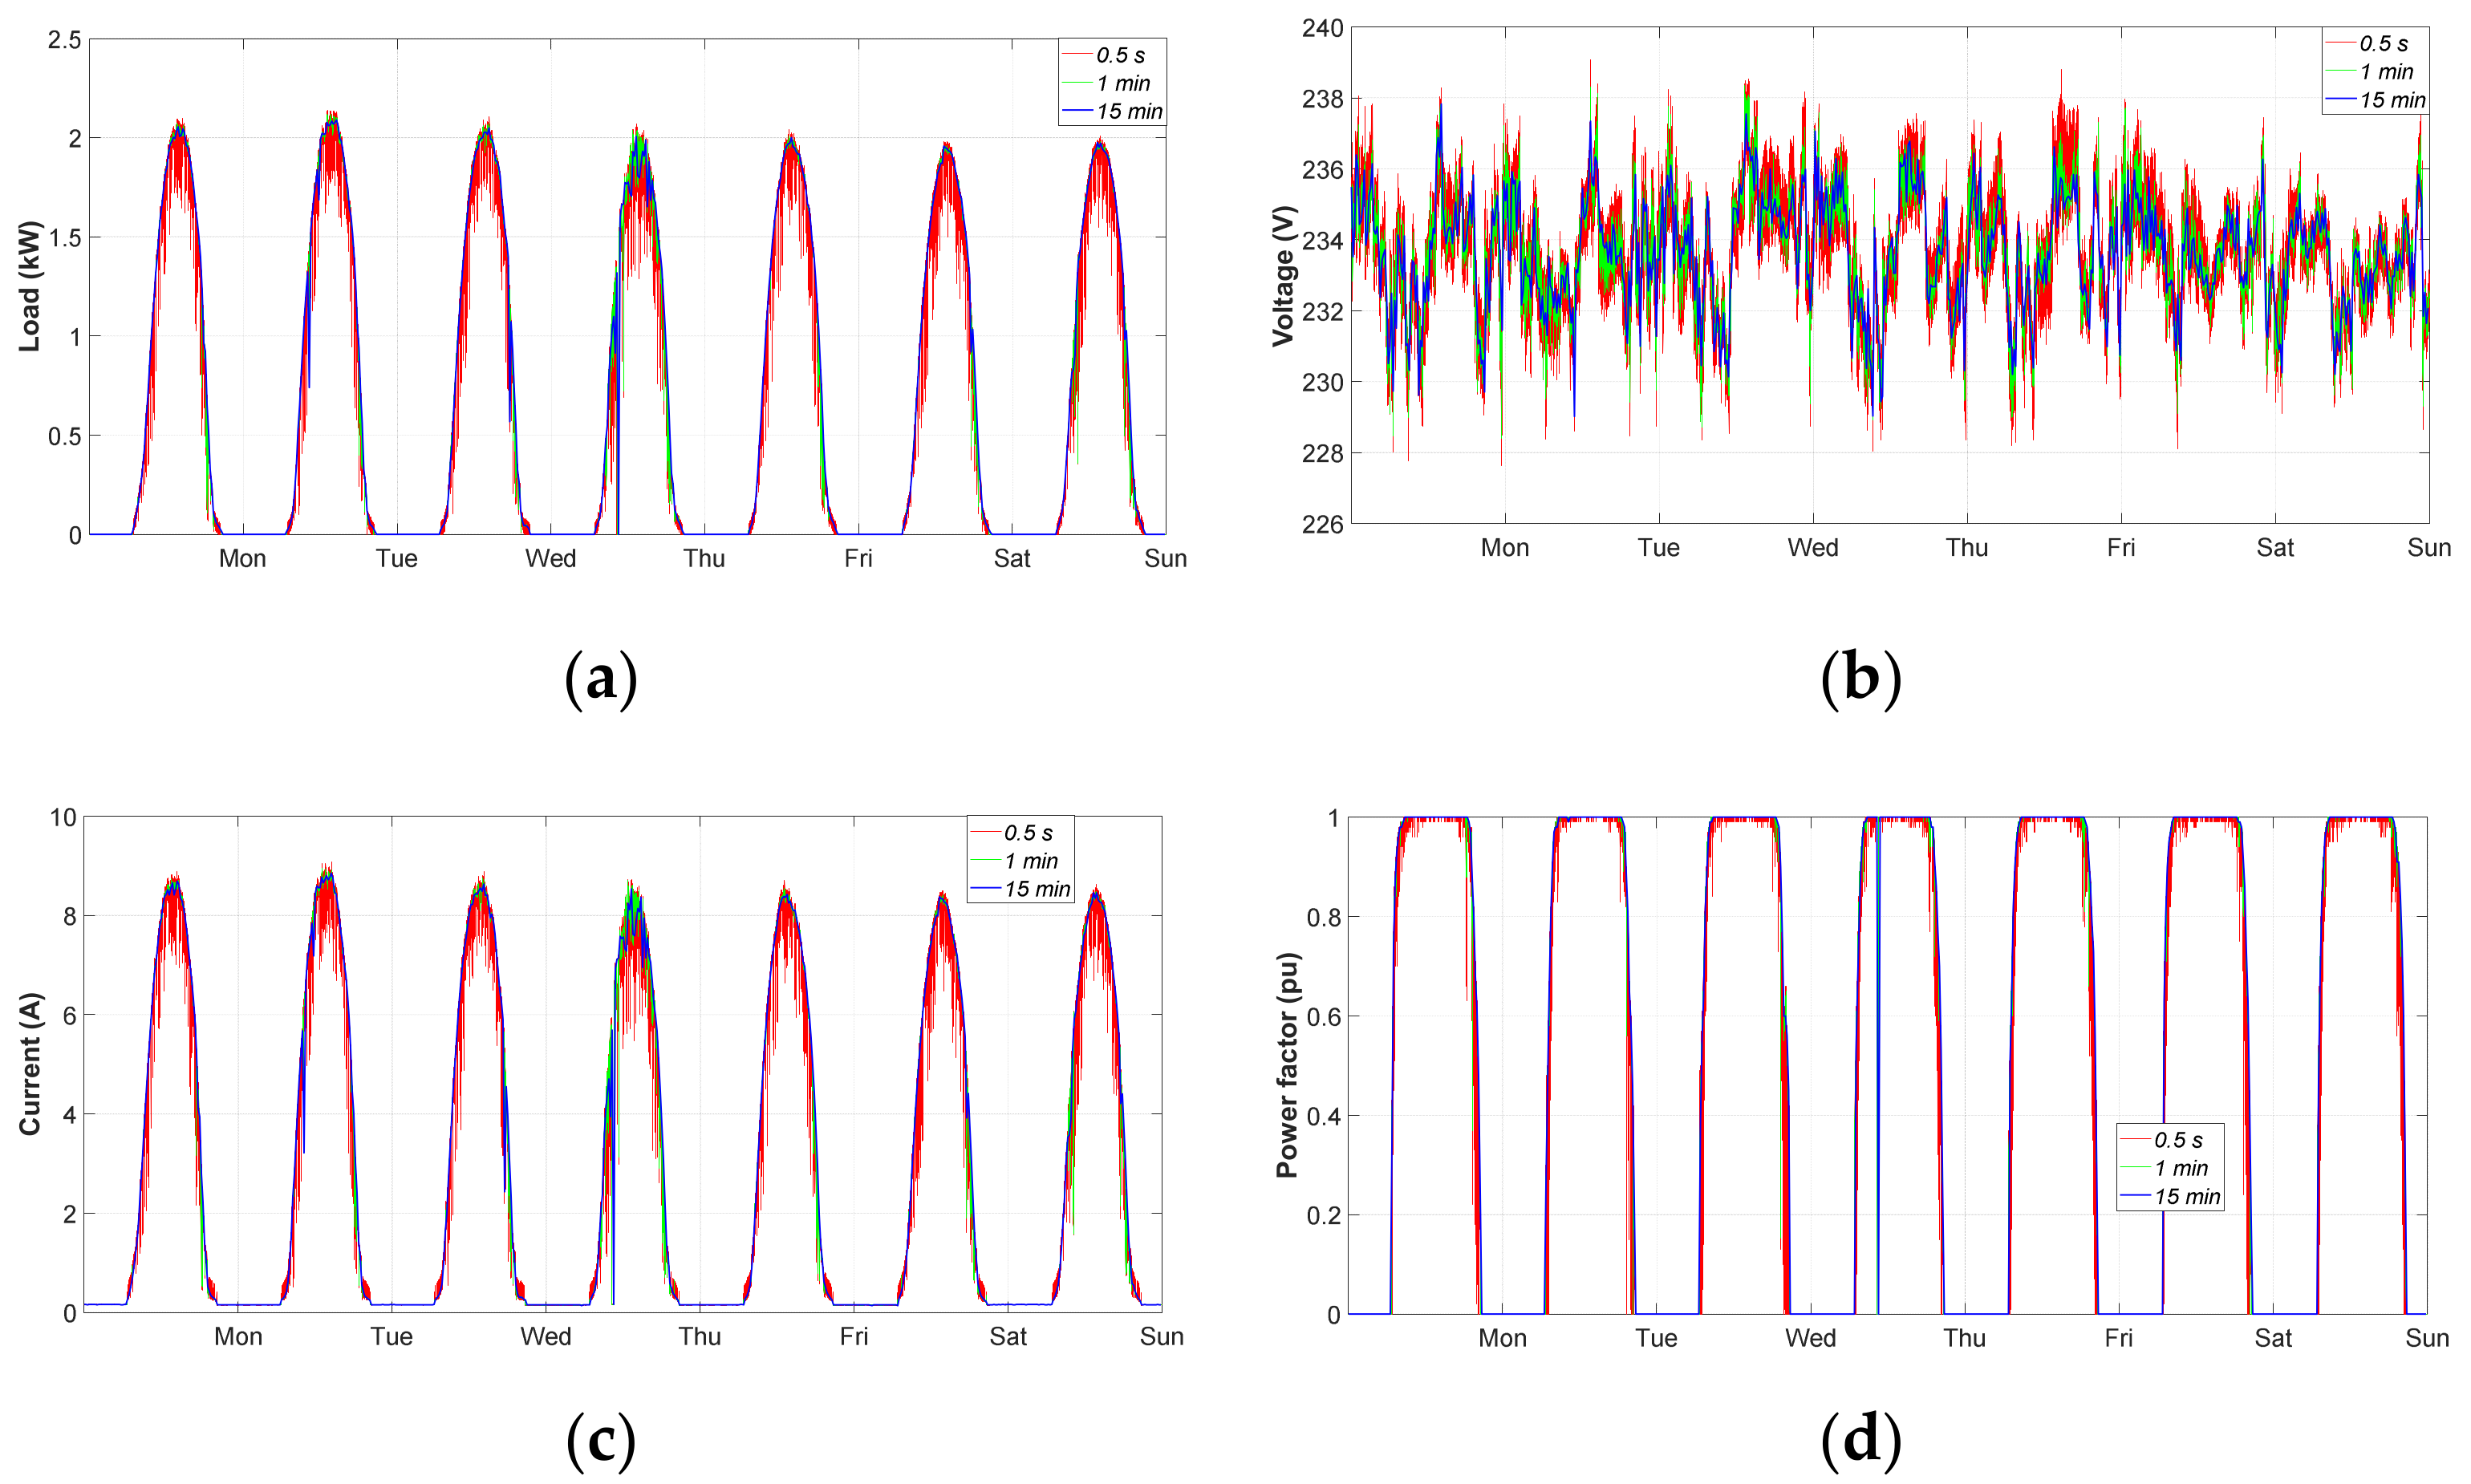
5.2.3. PV generation

It is also interesting to check the performance of the equipment used in this research. The monitored installation is a 2.97 kWp installation belonging to the Electrical Engineering Department of the University of Jaén.
As in previous cases, the meter has been used with different granularities, as can be seen in Figure 15. It can be clearly seen that the 0.5 s granularity reflects the rapid changes produced in the generation. As in the case of households, it is particularly interesting to know the rapid changes in generation that may occur, e.g., due to a decrease in solar radiation in the presence of clouds.

5.2.4. PHEV Measurement

This section shows the monitoring of a PHEV, specifically the BMW 2-series model. The battery has a capacity of 7.6 kWh. It can be seen from the graphs that the vehicle’s battery is switched on every day because the owner uses the vehicle in the city with almost electric mode consumption on the journeys made. It can also be seen that the same charging does not take place every day due to the shorter or longer distance travelled.
Figure 16 shows the results of the measurements made.

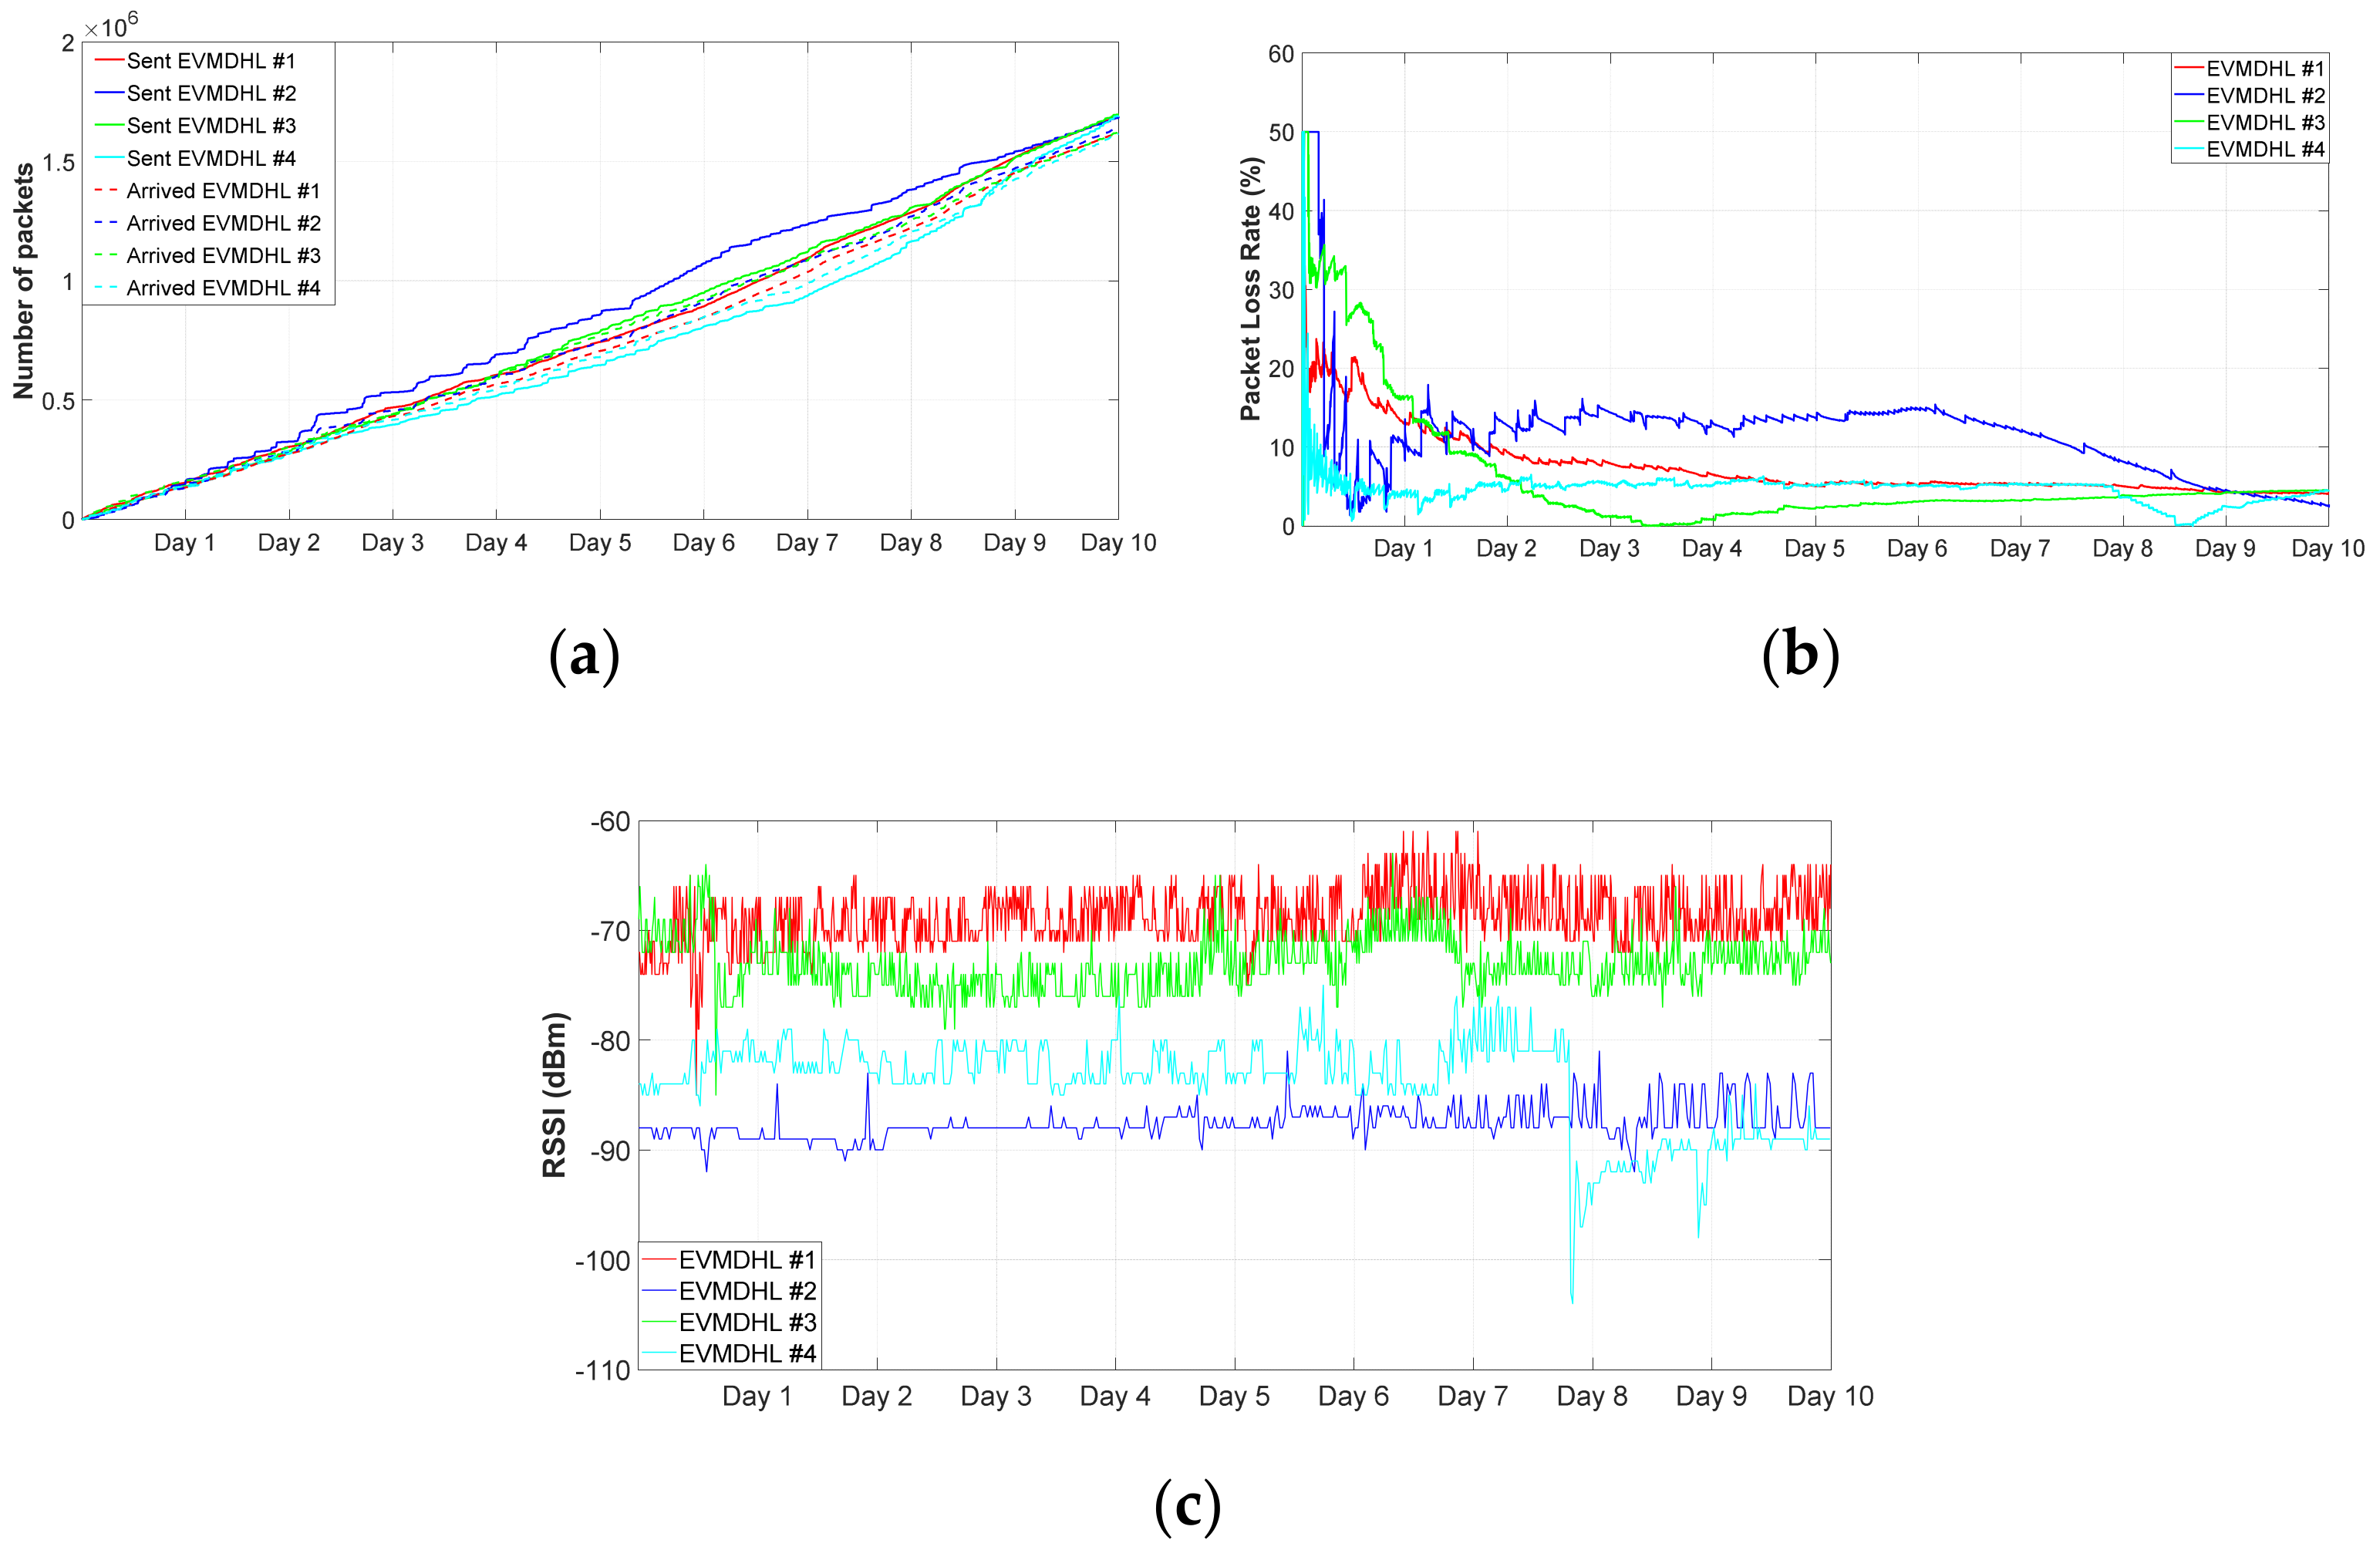
5.3. LoRa Network Measurements

In order to test the LoRa network, the study was extended to 10 days, with packets sent every 0.5 s on four EVMDHLs. The aim was to obtain a sufficiently long-time horizon to be able to draw conclusions about the quality of the implemented system.
It can be seen in Figure 17b that the loss of information packets is below 17%, with averages below 11% for EVMDHL #2 and a maximum standard deviation of 5.1865% for EVMDHL #3. These are very acceptable values and make the proposed network very efficient in terms of information loss.
As for the Received Signal Strength Indicator (RSSI), the analysed EVMDHLs are −68.8131 and −83.9871 dBm for EVMDHL #1 and #4, respectively. Moreover, the standard deviations are 2.4463 and 4.0688 for EVMDHL #3 and #4, respectively.
Figure 17 shows the measurements performed. Part (a) shows the packets sent and received, (b) the packet loss rate (PLR) and (c) the RSSI. On the other hand, Table 9 shows the statistics obtained from the transmission.

6. Conclusions

This research successfully designed and implemented a GREMNL and an EVMDHL from scratch to create fully functional prototypes. These devices enable the construction of SM networks that make it possible to collect data in homes in 0.5 s or less.
The results section clearly shows the efficiency of the solutions developed in this research. In this sense, the monitoring of different electricity consumption profiles is performed. The measured information is obtaining efficiently and in real time in the cloud. On the other hand, the usefulness of the devices was also demonstrated in the monitoring of houses with photovoltaic generation, where the generation, consumption and contribution or discharge to the electricity grid can be observed. A grid-connected photovoltaic power generation installation was also monitored, which confirms the use of the devices in the monitoring of renewable generation installations. Electric vehicles can also be monitored using the devices created in this research.
All this demonstrates the usefulness of the equipment in a wide range of applications in low-voltage electrical installations that can be included in smart grids and distributed generation installations through the use of IoT technology and cloud computing.
On the other hand, the design objectives such as reduced power consumption, operational safety, fault response and reduced price were achieved. The estimation of alternatives has allowed the use of highly efficient components, which, combined with the open-source option, opens up a wide range of programming possibilities and adaptations for the needs of each implementation to be carried out. The modular design offers robustness to the equipment and allows the equipment to continue working in the event of a failure of any of its components. A PCB board that integrates all the components of the GREMNL and EVMDHL was created.
As for the results that the authors proposed as novelties of this research, they have been fully achieved, as the coverage of the LoRa network is much greater than that of Wi-Fi or similar networks, which allows the range of the equipment to be extended. In addition, there is no need to use the Internet, as the data uploaded to the cloud are concentrated in the GREMNL, which is the only device that needs Internet access. This avoids needing the user’s Wi-Fi key and the problem of locating an EVMDHL. The reduced power consumption also makes the device more transparent in terms of the data obtained and the additional power consumption for the user. This low power consumption feature is especially interesting in locations where there is no mains power supply, such as where the device would have to be provided with a battery to keep it running. Thus, the reduced power consumption would extend the battery discharge time.

Author Contributions

Conceptualization, F.S.-S. and A.C.-O.; methodology, F.S.-S. and A.C.-O.; software, F.S.-S. and A.C.-O.; validation, J.C.H.; formal analysis, F.S.-S.; investigation, A.C.-O.; writing—original draft preparation, F.S.-S. and A.C.-O.; writing—review and editing, J.C.H. All authors have read and agreed to the published version of the manuscript.

Funding

This research received no external funding.

Data Availability Statement

Data sharing not applicable.

Acknowledgments

The authors would like to thank the Department of Electrical Engineering of the University of Jaen for allowing the use of their laboratories and materials in the development of this research.

Conflicts of Interest

The authors declare no conflict of interest.

Abbreviations

The following abbreviations are used in this manuscript.
ANArduino Nano
BWBandwidth
DLBDragino LoRa Bee
EVMDHLElectrical variable measuring device for households using LoRa
GREMNLGateway for residential electricity metering networks using LoRa
IFTTTIf This, Then That
IoTInternet of Things
LoRaLong range
LoRaWANLong-range wide-area network
LPWANLow-power wide-area network
MQTTMessage Queuing Telemetry Transport
NB-IoTNarrowband Internet of Things
PCBPrinted circuit board
PHEVPlug-in hybrid electric vehicle
PLRPacket loss rate
PZEMPZEM-004t
RSSIReceive Signal Strength Indicator
SMSmart meter
WANWide area network
Wd1MWemos d1 mini
Wi-FiWireless fidelity

References

  1. Rodríguez-Pajarón, P.; Bayo, A.H.; Milanović, J.V. Forecasting voltage harmonic distortion in residential distribution networks using smart meter data. Int. J. Electr. Power Energy Syst. 2022, 136, 107653. [Google Scholar] [CrossRef]
  2. Kumar, L.A.; Indragandhi, V.; Selvamathi, R.; Vijayakumar, V.; Ravi, L.; Subramaniyaswamy, V. Design, power quality analysis, and implementation of smart energy meter using internet of things. Comput. Electr. Eng. 2021, 93, 107203. [Google Scholar] [CrossRef]
  3. Liu, G.; Gu, J.; Zhao, J.; Wen, F.; Liang, G. Super Resolution Perception for Smart Meter Data. Inf. Sci. 2020, 526, 263–273. [Google Scholar] [CrossRef]
  4. Junior, W.L.R.; Borges, F.; Veloso, A.F.D.S.; Rabêlo, R.D.A.; Rodrigues, J.J. Low voltage smart meter for monitoring of power quality disturbances applied in smart grid. Measurement 2019, 147, 106890. [Google Scholar] [CrossRef]
  5. Oh, S.; Haberl, J.S.; Baltazar, J.-C. Analysis methods for characterizing energy saving opportunities from home automation devices using smart meter data. Energy Build. 2020, 216, 109955. [Google Scholar] [CrossRef]
  6. Muralidhara, S.; Hegde, N.; Pm, R. An internet of things-based smart energy meter for monitoring device-level consumption of energy. Comput. Electr. Eng. 2020, 87, 106772. [Google Scholar] [CrossRef]
  7. Andersen, F.; Gunkel, P.; Jacobsen, H.; Kitzing, L. Residential electricity consumption and household characteristics: An econometric analysis of Danish smart-meter data. Energy Econ. 2021, 100, 105341. [Google Scholar] [CrossRef]
  8. Tureczek, A.M.; Nielsen, P.S.; Madsen, H.; Brun, A. Clustering district heat exchange stations using smart meter consumption data. Energy Build. 2019, 182, 144–158. [Google Scholar] [CrossRef]
  9. Wang, S.; Chen, H.; Wu, L.; Wang, J. A novel smart meter data compression method via stacked convolutional sparse auto-encoder. Int. J. Electr. Power Energy Syst. 2020, 118, 105761. [Google Scholar] [CrossRef]
  10. Donaldson, D.L.; Jayaweera, D. Effective solar prosumer identification using net smart meter data. Int. J. Electr. Power Energy Syst. 2020, 118, 105823. [Google Scholar] [CrossRef]
  11. England, B.S.; Alouani, A.T. Real time voltage stability prediction of smart grid areas using smart meters data and improved Thevenin estimates. Int. J. Electr. Power Energy Syst. 2020, 122, 106189. [Google Scholar] [CrossRef]
  12. Kabalcı, E.; Kabalcı, Y.; Siano, P. Design and implementation of a smart metering infrastructure for low voltage microgrids. Int. J. Electr. Power Energy Syst. 2021, 134, 107375. [Google Scholar] [CrossRef]
  13. Abate, F.; Carratu’, M.; Liguori, C.; Paciello, V. A low cost smart power meter for IoT. Measurement 2019, 136, 59–66. [Google Scholar] [CrossRef]
  14. Westermann, P.; Deb, C.; Schlueter, A.; Evins, R. Unsupervised learning of energy signatures to identify the heating system and building type using smart meter data. Appl. Energy 2020, 264, 114715. [Google Scholar] [CrossRef]
  15. Zhan, S.; Liu, Z.; Chong, A.; Yan, D. Building categorization revisited: A clustering-based approach to using smart meter data for building energy benchmarking. Appl. Energy 2020, 269, 114920. [Google Scholar] [CrossRef]
  16. Cano-Ortega, A.; Sánchez-Sutil, F. Performance Optimization LoRa Network by Artificial Bee Colony Algorithm to Determination of the Load Profiles in Dwellings. Energies 2020, 13, 517. [Google Scholar] [CrossRef] [Green Version]
  17. Mbungu, N.T.; Bansal, R.C.; Naidoo, R.M.; Bettayeb, M.; Siti, M.W.; Bipath, M. A dynamic energy management system using smart metering. Appl. Energy 2020, 280, 115990. [Google Scholar] [CrossRef]
  18. Kong, X.; Zhang, X.; Li, G.; Dong, D.; Li, Y. An estimation method of smart meter errors based on DREM and DRLS. Energy 2020, 204, 117774. [Google Scholar] [CrossRef]
  19. Razavi, R.; Gharipour, A.; Fleury, M.; Akpan, I.J. Occupancy detection of residential buildings using smart meter data: A large-scale study. Energy Build. 2019, 183, 195–208. [Google Scholar] [CrossRef]
  20. Roach, C. Estimating electricity impact profiles for building characteristics using smart meter data and mixed models. Energy Build. 2020, 211, 109686. [Google Scholar] [CrossRef]
  21. Komatsu, H.; Kimura, O. Peak demand alert system based on electricity demand forecasting for smart meter data. Energy Build. 2020, 225, 110307. [Google Scholar] [CrossRef]
  22. Czétány, L.; Vámos, V.; Horváth, M.; Szalay, Z.; Mota-Babiloni, A.; Deme-Bélafi, Z.; Csoknyai, T. Development of electricity consumption profiles of residential buildings based on smart meter data clustering. Energy Build. 2021, 252, 111376. [Google Scholar] [CrossRef]
  23. Sánchez-Sutil, F.; Cano-Ortega, A. Design and Testing of a Power Analyzer Monitor and Programming Device in Industries with a LoRA LPWAN Network. Electronics 2021, 10, 453. [Google Scholar] [CrossRef]
  24. Wang, Y.; Liu, M.Z.; Ochoa, L.F. Assessing the effects of DER on voltages using a smart meter-driven three-phase LV feeder model. Electr. Power Syst. Res. 2020, 189, 106705. [Google Scholar] [CrossRef]
  25. Liu, X.; Wang, H.; Chen, G.; Zhou, B.; Rehman, A.U. Intermittently differential privacy in smart meters via rechargeable batteries. Electr. Power Syst. Res. 2021, 199, 107410. [Google Scholar] [CrossRef]
  26. Sutil, F.S.; Cano-Ortega, A. Smart Public Lighting Control and Measurement System Using LoRa Network. Electronics 2020, 9, 124. [Google Scholar] [CrossRef] [Green Version]
  27. Sanchez-Sutil, F.; Cano-Ortega, A. Smart regulation and efficiency energy system for street lighting with LoRa LPWAN. Sustain. Cities Soc. 2021, 70, 102912. [Google Scholar] [CrossRef]
  28. Venkatraman, A.; Thatte, A.A.; Xie, L. A smart meter data-driven distribution utility rate model for networks with prosumers. Util. Policy 2021, 70, 101212. [Google Scholar] [CrossRef]
  29. Hemanth, G.; Raja, S.C. Proposing suitable data imputation methods by adopting a Stage wise approach for various classes of smart meters missing data—Practical approach. Expert Syst. Appl. 2021, 187, 115911. [Google Scholar] [CrossRef]
  30. Al Khafaf, N.; Rezaei, A.A.; Amani, A.M.; Jalili, M.; McGrath, B.; Meegahapola, L.; Vahidnia, A. Impact of battery storage on residential energy consumption: An Australian case study based on smart meter data. Renew. Energy 2021, 182, 390–400. [Google Scholar] [CrossRef]
  31. Funde, N.A.; Dhabu, M.M.; Paramasivam, A.; Deshpande, P.S. Motif-based association rule mining and clustering technique for determining energy usage patterns for smart meter data. Sustain. Cities Soc. 2019, 46, 101415. [Google Scholar] [CrossRef]
  32. Stegner, C.; Glaß, O.; Beikircher, T. Comparing smart metered, residential power demand with standard load profiles. Sustain. Energy Grids Netw. 2019, 20, 100248. [Google Scholar] [CrossRef]
  33. Smajla, I.; Sedlar, D.K.; Vulin, D.; Jukić, L. Influence of smart meters on the accuracy of methods for forecasting natural gas consumption. Energy Rep. 2021, 7, 8287–8297. [Google Scholar] [CrossRef]
  34. Mokhtar, M.; Robu, V.; Flynn, D.; Higgins, C.; Whyte, J.; Loughran, C.; Fulton, F. Prediction of voltage distribution using deep learning and identified key smart meter locations. Energy AI 2021, 6, 100103. [Google Scholar] [CrossRef]
  35. Cano-Ortega, A.; Sánchez-Sutil, F. Monitoring of the Efficiency and Conditions of Induction Motor Operations by Smart Meter Prototype Based on a LoRa Wireless Network. Electronics 2019, 8, 1040. [Google Scholar] [CrossRef] [Green Version]
  36. Morello, R.; De Capua, C.; Fulco, G.; Mukhopadhyay, S.C. A Smart Power Meter to Monitor Energy Flow in Smart Grids: The Role of Advanced Sensing and IoT in the Electric Grid of the Future. IEEE Sens. J. 2017, 17, 7828–7837. [Google Scholar] [CrossRef]
  37. Koutroumpina, C.; Sioutas, S.; Koutroubinas, S.; Tsichlas, K. Evaluation of Features Generated by a High-End Low-Cost Electrical Smart Meter. Algorithms 2021, 14, 311. [Google Scholar] [CrossRef]
  38. Ünal, F.; Almalaq, A.; Ekici, S. A Novel Load Forecasting Approach Based on Smart Meter Data Using Advance Preprocessing and Hybrid Deep Learning. Appl. Sci. 2021, 11, 2742. [Google Scholar] [CrossRef]
  39. Sánchez-Sutil, F.; Cano-Ortega, A. Smart Control and Energy Efficiency in Irrigation Systems Using LoRaWAN. Sensors 2021, 21, 7041. [Google Scholar] [CrossRef] [PubMed]
  40. Alkawsi, G.; Ali, N.; Baashar, Y. The Moderating Role of Personal Innovativeness and Users Experience in Accepting the Smart Meter Technology. Appl. Sci. 2021, 11, 3297. [Google Scholar] [CrossRef]
  41. Yang, L.; Chen, X.; Zhang, J.; Poor, H.V. Cost-Effective and Privacy-Preserving Energy Management for Smart Meters. IEEE Trans. Smart Grid 2015, 6, 486–495. [Google Scholar] [CrossRef] [Green Version]
  42. Nainar, K.; Iov, F. Smart Meter Measurement-Based State Estimation for Monitoring of Low-Voltage Distribution Grids. Energies 2020, 13, 5367. [Google Scholar] [CrossRef]
  43. Bañales, S.; Dormido, R.; Duro, N. Smart Meters Time Series Clustering for Demand Response Applications in the Context of High Penetration of Renewable Energy Resources. Energies 2021, 14, 3458. [Google Scholar] [CrossRef]
  44. Zhao, Q.; Mu, J.; Han, X.; Liang, D.; Wang, X. Evaluation Model of Operation State Based on Deep Learning for Smart Meter. Energies 2021, 14, 4674. [Google Scholar] [CrossRef]
  45. Balwani, M.R.; Thirumala, K.; Mohan, V.; Bu, S.; Thomas, M.S. Development of a Smart Meter for Power Quality-Based Tariff Implementation in a Smart Grid. Energies 2021, 14, 6171. [Google Scholar] [CrossRef]
  46. Shaukat, M.; Shaukat, H.; Qadir, Z.; Munawar, H.; Kouzani, A.; Mahmud, M. Cluster Analysis and Model Comparison Using Smart Meter Data. Sensors 2021, 21, 3157. [Google Scholar] [CrossRef] [PubMed]
  47. Sanchez-Sutil, F.; Cano-Ortega, A.; Hernandez, J.C.; Rus-Casas, C. Development and calibration of an open source, low-cost power smartmeter prototype for PV household-prosumers. Electronics 2019, 8, 878. [Google Scholar] [CrossRef] [Green Version]
  48. Hernandez, J.C.; Sanchez-Sutil, F.; Cano-Ortega, A.; Baier, C.R. Influence of Data Sampling Frequency on Household Consumption Load Profile Features: A Case Study in Spain. Sensors 2020, 20, 6034. [Google Scholar] [CrossRef]
  49. AWS IoT. Available online: https://aws.amazon.com/es/iot (accessed on 6 November 2021).
  50. Akenza.io. Available online: https://akenza.io/features (accessed on 6 November 2021).
  51. DaraCake. Available online: https://datacake.co (accessed on 6 November 2021).
  52. deZem. Available online: https://www.dezem.de/en/data-acquisition/lorawan (accessed on 6 November 2021).
  53. InfluxDB. Available online: https://docs.influxdata.com/influxdb/v2.0/get-started (accessed on 6 November 2021).
  54. Microsoft Azure. Available online: https://azure.microsoft.com/es-es (accessed on 6 November 2021).
  55. Qubitro. Available online: https://www.qubitro.com (accessed on 6 November 2021).
  56. TagoIO. Available online: https://tago.io (accessed on 6 November 2021).
  57. Thethings.io. Available online: https://thethings.io (accessed on 6 November 2021).
  58. Things Board. Available online: https://thingsboard.io (accessed on 6 November 2021).
  59. ThingSpeak. Available online: https://thingspeak.com (accessed on 18 September 2021).
  60. Ubidots. Available online: https://ubidots.com (accessed on 6 November 2021).
  61. UIB. Available online: https://uib.ai (accessed on 6 November 2021).
  62. MQTT. Available online: https://mqtt.org (accessed on 6 November 2021).
  63. LoRa Cloud. Available online: https://www.loracloud.com (accessed on 6 November 2021).
  64. Node-RED: Flow-Based Programming for the Internet of Things. Available online: https://nodered.org (accessed on 30 August 2021).
  65. IFTTT. Available online: https://ifttt.com (accessed on 6 November 2021).
  66. Google Sheets. Available online: https://www.google.es/intl/es/sheets/about (accessed on 6 November 2021).
  67. Firebase. Available online: https://firebase.google.com (accessed on 6 November 2021).
  68. Arduino Nano. Available online: https://store.arduino.cc/arduino-nano (accessed on 6 November 2021).
  69. Arduino Uno. Available online: https://store.arduino.cc/products/arduino-uno-rev3 (accessed on 6 November 2021).
  70. Arduino Mega. Available online: https://store.arduino.cc/products/arduino-mega-2560-rev3 (accessed on 6 November 2021).
  71. Arduino Micro. Available online: https://store.arduino.cc/products/arduino-micro (accessed on 6 November 2021).
  72. Wemos d1 Mini. Available online: https://www.wemos.cc/en/latest/d1/d1_mini.html (accessed on 6 November 2021).
  73. Wemos d1 r1. Available online: https://docs.platformio.org/en/latest/boards/espressif8266/d1.html (accessed on 6 November 2021).
  74. Wemos d1 Mini Lite. Available online: https://www.wemos.cc/en/latest/d1/d1_mini_lite.html (accessed on 6 November 2021).
  75. Wemos d1 Mini Pro. Available online: https://www.wemos.cc/en/latest/d1/d1_mini_pro.html (accessed on 6 November 2021).
  76. NodeMCU. Available online: https://components101.com/development-boards/nodemcu-esp8266-pinout-features-and-datasheet (accessed on 6 November 2021).
  77. Arduino MKR WAN 1300. Available online: https://store.arduino.cc/mkr-wan-1300 (accessed on 6 November 2021).
  78. Monteino. Available online: https://lowpowerlab.com/guide/moteino (accessed on 6 November 2021).
  79. Libelium. Available online: http://www.libelium.com/extreme-range-wireless-sensors-connectivity-throughbuildings-incity-lora-868mhz-915mhz (accessed on 6 November 2021).
  80. Lopy4. Available online: https://docs.pycom.io/gettingstarted/connection/lopy4 (accessed on 6 November 2021).
  81. Dragino LoRa Bee for Arduino. Available online: https://www.dragino.com/products/lora/item/109-lora-bee.html (accessed on 6 November 2021).
  82. Semtech SX1308. Available online: https://www.semtech.com/products/wireless-rf/lora-gateways/sx1308 (accessed on 6 November 2021).
  83. Semtech SX1301. Available online: https://www.semtech.com/products/wireless-rf/lora-gateways/sx1301 (accessed on 6 November 2021).
  84. Semtech SX1276/SX1278 LoRa Chip. Available online: https://www.semtech.com/products/wirelessrf/loratransceivers/sx1276 (accessed on 6 November 2021).
  85. Semtech SX1257. Available online: https://www.semtech.com/products/wireless-rf/lora-gateways/sx1257 (accessed on 6 November 2021).
  86. HOPERF Chip RFM95/96/97/98. Available online: https://cdn.sparkfun.com/assets/learn_tutorials/8/0/4/RFM95_96_97_98W.pdf (accessed on 6 November 2021).
  87. Murata Electronics. Available online: https://wireless.murata.com/pub/RFM/data/type_abz.pdf (accessed on 6 November 2021).
  88. ACS712. Available online: https://www.sparkfun.com/datasheets/BreakoutBoards/0712.pdf (accessed on 6 November 2021).
  89. STC013 Dechang Electronics Co. Ltd. Available online: http://en.yhdc.com/product/SCT013-401.html (accessed on 6 November 2021).
  90. FZ0430 Voltage Sensor. Available online: http://www.ekt2.com/pdf/412_ARDUINO_SENSOR_VOLTAGE_DETECTOR.pdf (accessed on 6 November 2021).
  91. ZMPT101B Voltage Sensor. Available online: https://www.datasheet4u.com/datasheetpdf/ETC/ZMPT101B/pdf.php?id=1031464 (accessed on 6 November 2021).
  92. PZEM-00t. Available online: https://peacefair.en.made-in-china.com/product/iyLxUhvuJzVm/China-Peacefair-AC-Ttl-Modbus-Single-Phase-Electric-Energy-Meter.html (accessed on 6 November 2021).
Figure 1. Proposed network scheme.
Electronics 10 03152 g001
Figure 2. Block diagram of the GREMNL.
Electronics 10 03152 g002
Figure 3. Wiring diagram of the GREMNL.
Electronics 10 03152 g003
Figure 4. Printed circuit board (PCB) of the GREMNL with battery power supply: (a) front side, (b) back side and (c) assembled with real components.
Electronics 10 03152 g004
Figure 5. Block diagram of the EVMDHL.
Electronics 10 03152 g005
Figure 6. Wiring diagram of the EVMDHL.
Electronics 10 03152 g006
Figure 7. PCB of the EVMDHL with battery power supply: (a) front side, (b) back side and (c) assembled with real components.
Electronics 10 03152 g007aElectronics 10 03152 g007b
Figure 8. Flowchart of the main program for the GREMNL.
Electronics 10 03152 g008
Figure 9. Flowchart of the main program for the EVMDHL.
Electronics 10 03152 g009
Figure 10. Weekly consumption profile: (a) Household #1, (b) Household #2, (c) Household #3, (d) Household #4 and (e) Household #5.
Electronics 10 03152 g010
Figure 11. Weekly voltage distribution: (a) Household #1, (b) Household #2, (c) Household #3, (d) Household #4 and (e) Household #5.
Electronics 10 03152 g011aElectronics 10 03152 g011b
Figure 12. Weekly current distribution: (a) Household #1, (b) Household #2, (c) Household #3, (d) Household #4 and (e) Household #5.
Electronics 10 03152 g012
Figure 13. Weekly current distribution: (a) Household #1, (b) Household #2, (c) Household #3, (d) Household #4 and (e) Household #5.
Electronics 10 03152 g013aElectronics 10 03152 g013b
Figure 14. Weekly electrical data for Household #6: (a) power, (b) voltage, (c) current and (d) power factor.
Electronics 10 03152 g014
Figure 15. Weekly electrical data for PV: (a) power, (b) voltage, (c) current and (d) power factor.
Electronics 10 03152 g015
Figure 16. Weekly electrical data for PHEV: (a) power, (b) voltage, (c) current and (d) power factor.
Electronics 10 03152 g016
Figure 17. LoRa network measurements: (a) packets sent and received, (b) packet loss rate (PLR) and (c) RSSI.
Electronics 10 03152 g017
Table 1. Arduino family comparison.
ComponentSurface (mm2)MicrocontrollerCurrent
Consumption
(mA)
Flash Memory (kB)Clock Speed (MHz)Unit Price (€)
Arduino Uno [69]3663.24ATmega328P46321620.00
Arduino Mega [70]5421.17ATmega2560932561635.00
Arduino Nano [68]810.00ATmega32815321620.00
Arduino Micro [71]864.00ATmega32U415321618.00
Table 2. Arduino Wi-Fi family comparison.
ComponentSurface (mm2)MicrocontrollerCurrent
Consumption
(mA)
Flash Memory (MB)Clock Speed (MHz)Unit Price (€)
Wemos D1R1 [73]3663.24ESP-8266EX170480/1603.99
Wemos d1 mini [72]875.52ESP-8266EX170480/1603.91
Wemos d1 mini lite [74]875.52ESP-8285170180/1602.84
Wemos di mini pro [75]1219.20ESP-8266EX1701680/1605.29
NodeMCU [76]1856.00Tensilica 32-bit RISC CPU Xtensa LX1061704802.19
Table 3. LoRa end-devices comparison.
ComponentSurface
(mm2)
Current
Consumption
(A)
RSSI Range (dBm)Sensitivity
(dBm)
Blocking ImmunityUnit Price (€)
Lopy4 [80]1100.00Rx 12 mA—0.2 µA register retention−126−148High33.06
Monteino [78]240.05RX 10.3 mA—200 nA register retention−127−148Excellent22.95
Libelium [79]775.00RX 10.3 mA—200 nA register retention−127−148Excellent32.35
MKR WAN 1310 [77]1693.75Rx 23.5 mA−117.5−133.5High33.00
Dragino LoRa Bee [81]775.00RX 10.3 mA—200 nA register retention−127Down −148Excellent14.50
Table 4. Electrical sensors comparison.
ComponentMeasured VariableReturn ValueSizesPrice
(€)
Long (mm)Wide (mm)Surface (mm2)
Transformer + RectifierVoltageInstantaneous10540420050.76
Transformer + Rectifier + FZ0430 [90]VoltageInstantaneous12040480052.47
ZMPT101b [91]VoltageInstantaneous502010002.76
STC013 [89]CurrentInstantaneous20204003.11
ACS712 [88]CurrentInstantaneous30144201.28
PZEM-004t [92]Voltage, current, PF, active power, apparent powerRMS73.73022117.17
Table 5. Cost of the components for a GREMNL with a battery power supply.
DescriptionNumberUnit Price (€)Total (€)
Microcontroller Arduino Nano120.0020.00
Dragino LoRa Bee114.5014.50
Wemos D1 Mini13.913.91
Level converter11.661.66
Printed circuit board10.400.40
Power supply unit11.781.78
Box container12.542.54
Auxiliary material and wiring----1.051.05
Total cost45.84
Table 6. Cost of the components for an EVMDHL with a battery power supply.
DescriptionNumberUnit Price (€)Total (€)
Microcontroller Arduino Nano220.0040.00
Dragino LoRa Bee114.5014.50
PZEM-004 t v3.017.177.17
Data logger13.313.31
MicroSD 32 GB19.389.38
Battery CR122011.151.15
Printed circuit board10.400.40
Power supply unit11.781.78
Box container12.542.54
Auxiliary material and wiring----1.051.05
Total cost76.32
Table 7. Configuration of the five households monitored.
Household #1Household #2Household #3Household #4Household #5Household #6
Total surface (m2)10092190135230125
Number of family members435233
Electric heatingNoNoYesNoYesNo
Electric air conditioningYesYesYesYesYesYes
Building typeFlatFlatSemi-detached houseTown houseDetached houseDetached house
Contracted power (kW)2.33.455.754.66.93.45
Number of phases1-phase1-phase3-phase1-phase3-phase1-phase
PV generationNoNoNoNoNoYes
Table 8. Descriptive statistics of the consumption load profile throughout the year.
HouseholdData
Granularity
Sample Mean (kW)Minimum Value(kW)Maximum Value(kW)Sample Variance (kW2)Sample skewness (kW3)Sample Kurtosis (kW4)
#10.5 s0.680.075.590.592.017.22
1 min0.680.084.350.592.017.25
15 min0.670.083.550.582.067.38
#20.5 s0.4402.650.223.0215.24
1 min0.4402.630.223.0615.48
15 min0.4401.870.222.8012.32
#30.5 s1.050.236.520.711.466.47
1 min1.050.235.990.711.456.37
15 min1.060.245.920.711.476.71
#40.5 s0.950.197.530.662.138.49
1 min0.950.205.870.672.128.30
15 min0.940.294.870.642.158.51
#50.5 s0.500.136.770.434.5528.73
1 min0.500.136.720.444.6230.04
15 min0.500.146.720.466.2058.75
Table 9. Transmission statistics.
EVMDHL.
Number
PLRRSSI (dBm)
µσµσ
#17.44963.9465−68.81312.4761
#210.99094.0321−85.84043.8015
#35.19075.1865−73.11812.4463
#44.64471.6698−83.98714.0688
Publisher’s Note: MDPI stays neutral with regard to jurisdictional claims in published maps and institutional affiliations.

