Review

Overview of Smart Aquaculture System: Focusing on Applications of Machine Learning and Computer Vision

1
Department of Computer Education, Teachers College, Sara Campus, Jeju National University, 61 Iljudong-ro, Jeju-si 63294, Korea
2
Department of Agriculture, Phu Yen University, Phu Yen 62000, Vietnam
3
Department of Digital Media Design and Applications, Seoul Women’s University, Seoul 01797, Korea
4
Department of Data Science, (National) Korea Maritime and Ocean University, 727 Taejong-ro, Busan 49112, Korea
5
Department of Computer Software Engineering, Silla University, Busan 46958, Korea
*
Authors to whom correspondence should be addressed.
Co-first author, these authors contributed equally to this work.
Electronics 2021, 10(22), 2882; https://doi.org/10.3390/electronics10222882
Submission received: 25 August 2021 / Revised: 2 November 2021 / Accepted: 12 November 2021 / Published: 22 November 2021
(This article belongs to the Special Issue Electronic Solutions for Artificial Intelligence Healthcare Volume II)

Abstract

:
Smart aquaculture is nowadays one of the sustainable development trends for the aquaculture industry in intelligence and automation. Modern intelligent technologies have brought huge benefits to many fields including aquaculture to reduce labor, enhance aquaculture production, and be friendly to the environment. Machine learning is a subdivision of artificial intelligence (AI) by using trained algorithm models to recognize and learn traits from the data it watches. To date, there are several studies about applications of machine learning for smart aquaculture including measuring size, weight, grading, disease detection, and species classification. This review provides and overview of the development of smart aquaculture and intelligent technology. We summarized and collected 100 articles about machine learning in smart aquaculture from nearly 10 years about the methodology, results as well as the recent technology that should be used for development of smart aquaculture. We hope that this review will give readers interested in this field useful information.

1. Introduction

Global aquaculture production has been increasing continuously, reaching more than three times the total live weight [1] with the main species groups including catfish, seaweeds, carps, bivalves and tilapia accounting for 75% of aquaculture production. In addition, marine species such as fish and crustaceans have also grown rapidly during this time [1]. The diversity of species in aquaculture is increasing, and an estimated 40% of the different species belong to fish, shellfish, algae more fish, shellfish, and algae which are cultivated in a various of water environment such as marine water, brackish water and fresh water globally [2]. Traditional aquaculture brings poses many issues for the environment, and has limited production as well as many labor requirements. Therefore, smart aquaculture is a concept aiming to develop aquaculture industry in a sustainable way, enhance production and friendly to the environment.
According to traditional aquaculture, during operation technical steps from water preparation, seed selection, feeding, and care during the rearing process are carried out. Through aquaculture activities, there are many difficulties such as the process of water quality management in the aquaculture system, and usually people will take water samples twice a day in the morning and afternoon. This process takes much time and it is also impossible to treat the water on time in some cases of sudden changes of water quality in ponds/tanks. In another example, such as fish raised in ponds, people cannot detect diseased fish at an early stage, only when they die or come to the surface, and then treat them. In another example regarding the amount of leftover food in the pond, people cannot accurately estimate the amount of food left in the pond, the leftover food affects the water quality. When counting fish before selling, for example seed, people have to count each fish, which takes time and effort etc. All of the above difficulties affect profits in aquaculture. Therefore, smart aquaculture aims to apply smart producuton modes which solves problems in traditional aquaculture.
For a smart aquaculture approach, several smart devices are integrated into an environment specially structured to monitor cultured environmental parameters in real time and then make decisions through the collected data in automatically [3]. Smart aquaculture is a smart production mode. It can be controlled in a distance and automation by applying of IoT, big data, artificial intelligence, 5G, cloud computing, and robotics. On the other hand, smart aquaculture can be controlled by robot which can manage facilities, equipment, machineries to operate whole systems to achieve successful production [4].
There are several aspects related to smart aquaculture including collecting information through variety of temperature, dissolved oxygen, humidity, light, pH sensors for management of the water quality parameters in aquaculture system; transmitting the collected data by communication nodes to the control center; analyzing data and decision-making stored in cloud platforms; feedback of decision to each execution equipment, and the intelligence to operate a system automatically in order to develop aquaculture in a sustainable and efficient way, friendly to the environment [4].
For instance, deploying AI (artificial intelligence) and IoT (Internet of Things) in aquaculture has been increasing to solve the problems which exist in traditional aquaculture [5]. They are applied in various culture system such as cages, pond, hatchery, and breeding, with several goals like water quality monitoring [6,7,8,9]; observation of condition inside cages, pond as well as hatchery; optimizing the amount of feed to supply for cultured species and suitable time for feeding; decreasing the frequency of feed supply to cultured systems; reducing labor by the automation the culture systems [10,11].
Chrispin et al. [12] briefly reported the application of AI in aquaculture such as AI feeding devices, AI drones in aquaculture, prevention of diseases, fish seed screening, routine checkup of stock; AI in shrimp farming; AI smartphone application; AI in fish processing; AI in open sea fisheries; block chain technology in shrimp supply chain; and AI in conservation of endangered fishes. The general concept of smart aquaculture is presented in Figure 1 [12]. The figure shows the deployment of smart devices in aquaculture and all data as well as the management of the whole aquaculture process that are sent through smart phones [5,12].
Machine learning has the main function in solving problems which exist based on the algorithms and learning data to create mathematical models that ameliorate the performance of system in computer [13]. There are several models which have been deployed in aquaculture recently including decision tree (DT) [14], naive Bayes (NB) [15], support vector machine (SVM) [16], artificial neural network (ANN) [17], K-nearest neighbor (KNN) [18], deep learning (DL) [19], and ensemble learning (EL) [20].
Supervised learning, unsupervised learning, semi-supervised learning, and reinforcement learning are four types of machine learning structure, in which supervised learning is one of the most popular. Supervised learning is commonly used for classification and regression, where using data as a sample after trained by machine learning model which have the same target values [21]. From the theory of machine learning as well as its advantages, there are several implements in aquaculture recently such as biomass fish detection [22], size estimates [23,24,25], weight estimates [26,27,28], count [29,30,31,32], fish recognition [33,34,35,36,37,38], age detection [39,40], sex identification [34,41,42,43], fish species classification [44,45,46,47,48,49,50], feeding behavior [51,52], group behavior [53], abnormal behavior [54,55], univariate prediction [38,56,57,58,59], multivariate prediction [60,61,62], with the high accuracy rate.
The goal of this review is to survey the status of machine learning applications for smart aquaculture. The strategy of this review is the following: (1) overview of smart aquaculture; (2) machine learning and (3) applications of machine learning in smart aquaculture. Figure 2 shows overview of smart aquaculture sensors and monitoring systems.

2. Literature Surveys

2.1. Smart Aquaculture

Based on the advanced of artificial intelligent, smart aquaculture can perfect all stages from breeding, nursery to grow out stages of cultured species, as well as other processing like preparation of cultured water resource, manage the water quality, feed preparation, feeding, classification, grading, counting and washing the cultured systems. The final goal for developing the smart aquaculture is to obtain high aquaculture production to match world demand as well as protect environment.

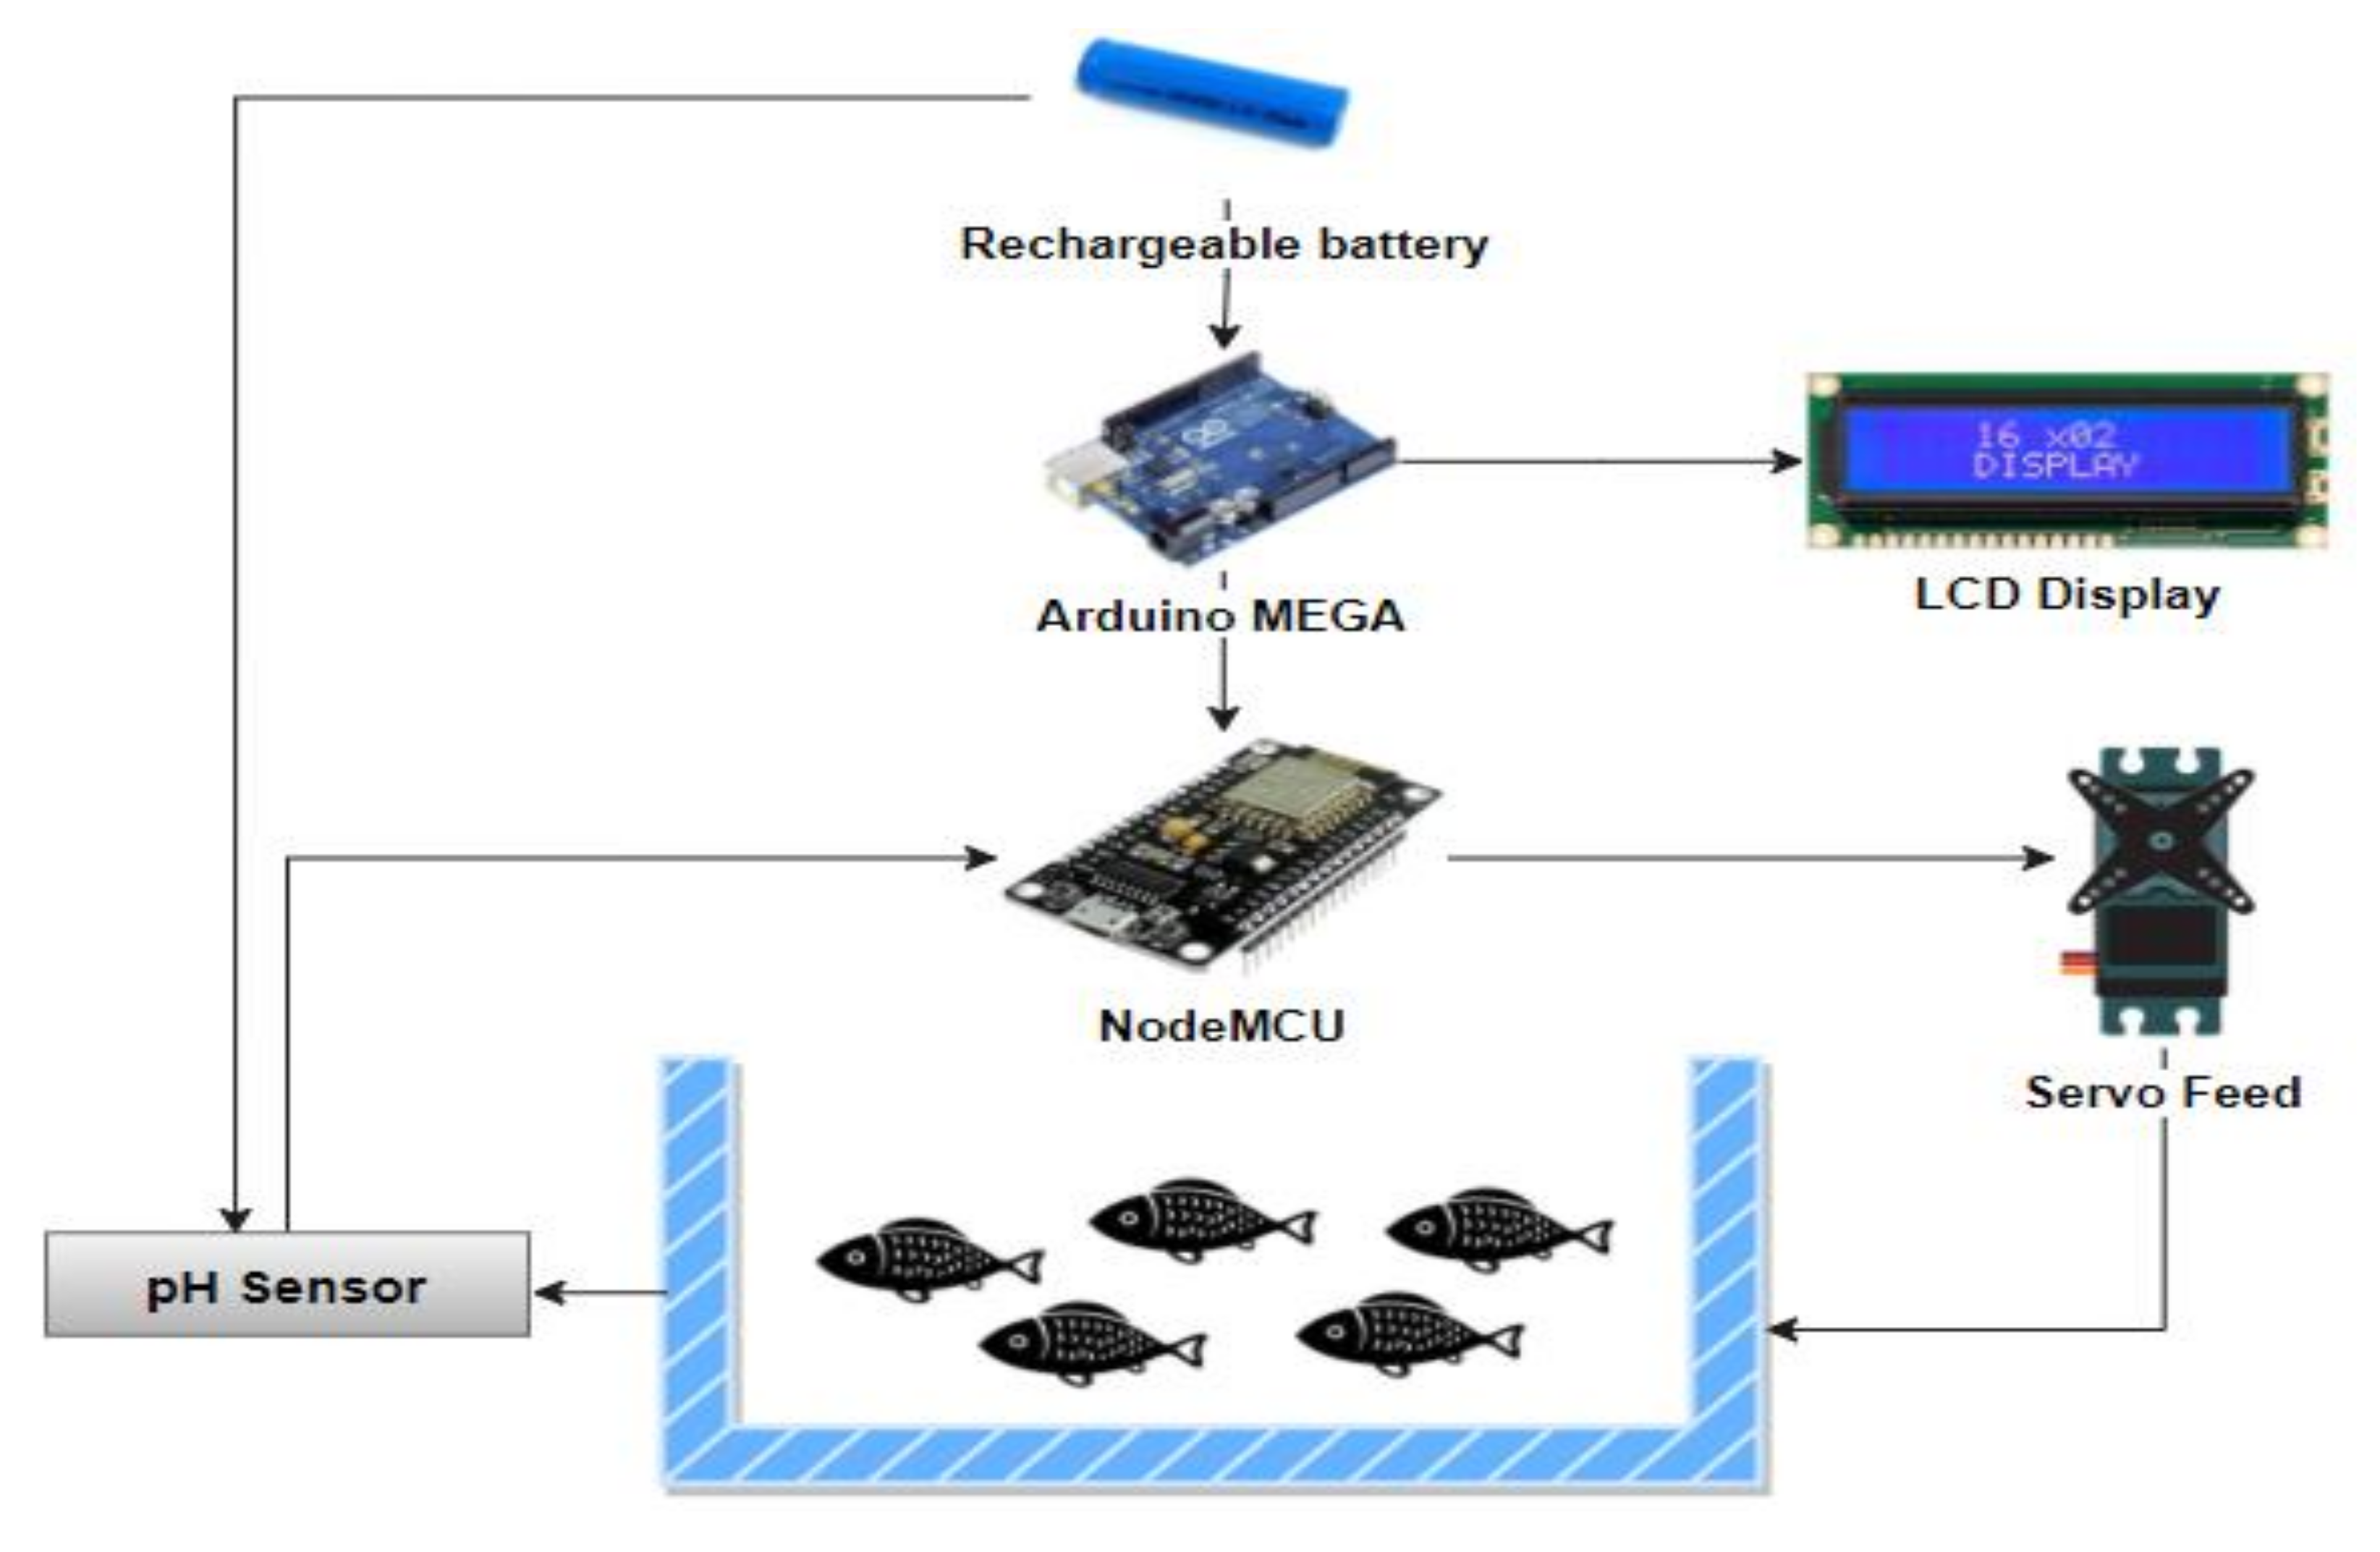
2.1.1. Water Quality Monitoring in Smart Aquaculture

Water quality is the main factor which contributes to success and efficient management in aquaculture. There are several water quality parameters which play a vital role in direct or indirect on the survival and growth of cultured species that have been considered such as temperature, turbidity, carbon dioxide, pH, alkalinity, ammonia, nitrite, and nitrate, etc. Among them, temperature, dissolved oxygen and pH are most robust [63]. During the last few years, IoT has had various applications in different fields including aquaculture. Using IoT in aquaculture has opened a new trend to develop this field in a sustainable way with intelligent devices in real time using connected water monitoring capabilities that help to improve aquaculture famer’s working conditions [63].
There are 4 main layers of an IoT Aquaculture System: Physical Layer, Monitoring Layer, Virtual Layer, and Connection protocol, presented in Figure 2. The smart farm industry/intelligent aquaculture has become the inevitable trend in order to decrease labor costs, to increase operational efficiency, and to lead to higher productivity. The future IoT-based systems could also aim to detect fish diseases and prevent production loss. It is worth noting that although there are several achievements in the application of artificial intelligent devices for aquaculture to build up intelligent, and high-precision fish farming is progressing quickly, there are still many challenges to operate fully automated systems.
Because aquaculture activities and its products are different from others, labor management is high in risk, as there is still a need for a certain amount of observation, information analyzation, and decision making during the fish farming process. However, a lot of intelligent equipment, such as the technologies mentioned above, are responsible for monitoring fish farming environments: robotic devices for production; data and information sorting; and energy-saving processing equipment will continue to greatly automate different stages of fish farming operations [64]. These can be implemented in aquaculture for fish identification, mass estimation, and behavior management. In addition, it is necessary to create new sensors which integrate several functions in a sensor/multifunctional sensor with high reliability, have the wide range applications, and long-life cycle [65]. Figure 3 shows an IoT aquaculture system [64,65].
To date, there have been several studies about intelligent information such as AI and IoT deployed in aquaculture in different areas such as ponds, hatcheries, cages. Chavan et al. [66] used Raspberry Pi, which is utilized for checking real-time monitoring systems in aquaculture with temperature sensor, dissolved oxygen sensor, pH sensor, ammonia sensor. The collected data are stored in a cloud computing system and then transferred to the aqua farmer mobile. In a smart fish farm, Kim et al. [67] setup a recirculating aquaculture system (RAS) with water quality monitoring sensors, MQTT protocol and a MICOM controller. Al-Hussaini et al. [68] also focuses on automatic data acquisition and monitoring systems for RAS using fog computing technology and low-cost systems with Raspberry Pi, to overcome the existing problems.
The data collecting system for RAS (RaspDAQ) is developed by connecting Raspberry Pi 3 to a temperature sensor (LM35DT), using ADC MCP3002, a water level sensor (HC-SR04), and Rpi camera module. Shin et al. [69] proposed a smart fish farm that consists of two tanks: a balancing tank and a recirculating aquaculture system (RAS). Experiments were conducted in the laboratory of the Future Convergence Technology Research Institute at the Busan University of Foreign Studies and at the eel culture farm of Jangsucheon Ltd., located on Gangwhado Island.
In this system, the effluence of water is controlled by a controller-the proportional integral derivative (PID) controller which is connected with a sensor with water-level controlling function, water temperature sensors, dissolved oxygen (DO) sensors, and potential hydrogen (pH) sensors. Remote control and the real-time monitoring are performed by using the Message Queue Telemetry Transport (MQTT) protocol, with the measured big data stored in lab servers. Monirul et al. [70] proposed a real-time, smart-based water monitoring system using IoT devices. The system was built using several devices, such as sensors (temperature, dissolved oxygen, turbidity, pH, Water Level, and CO3 gas), Arduino, and an IoT platform.
For deploying IoT system in ponds, Nocheski et al. [71] presented an upgrade on a functional Internet of Things (IoT) system to automatically monitor the water quality in cultured systems. The IoT system includes some sensors that can measure several important water quality meters in cultured systems (tank, pond, cage, …), like temperature, light intensity, and water level. It also consists of a small computer board whereby the collected data from those sensors and analyzed data as a final result can be sent as a sound/notification to the users. Krishna et al. [72] also set up an IoT system in fish pond to manage fish health as well as the water quality monitoring with an Arduino Uno board, Atmega328 micro controller, Wi-Fi module, Buzzer, LCD (liquid crystal display), and MIT application, providing data that are retrieved from the cloud by the farmer, along with the environmental parameters.
Prabhu [73] proposed an IoT system with the main goal is to manage the water quality parameters in the cultured system (a lake or a pond) by using sensors such as a temperature sensor, pH sensor as well as turbidity sensor. Users can obtain and analyze data as a message (SMS) through their mobile phone with their own language and can give several actions in managing the environmental conditions with an Arduino Nano Board and ESP8266 wi-fi module. Nguyen et al. [74] deployed a monitoring water quality system using IoTs in particularly fish ponds as well as other aquaculture systems, especially to create a model for forecasting quality indicators.
In this system, the author installed several sensors to manage some water quality parameters such as temperature, salinity, pH, DO, and COD indicators in the fish pond. The software is a cloud database provided by the digital ocean, which can be seen in mobile devices or on a PC/laptop. Forecasting techniques use an average, stochastic, gradient descent model. The results on two data sets show that this is a successful system which can be applied in real. Hsu et al. [75] collected water quality parameter’s data through sensors such as oxidation-reduction potential (ORP), pH and temperature. They also employed a monitoring data map in real-time in order to find out the pond conditions. The IoT-based system includes Raspberry PI, Arduino UNO, Bluetooth module, two or more sensor modules (ORP, temperature, pH meter), GCM (Google Cloud Messaging), mobile App device’s REGID, prediction analysis, and Web Page Management Mode (HTML combined with PHP).
Darmalim et al. [76] proposed an IoT system to automatically monitor these environmental parameters. The water quality parameters are collected in real time from the cultured system and collected data are directly update on web and the user can get information from the IoT device. It is developed using a Python framework. To get data which can presented the environmental conditions, by accessing the web application, the users can directly know what happened in the pond and take the right action on time. The electrical components are NodeMcuESP8266, ADC Ads1115, a logic converter, a dissolved oxygen and temperature sensor, a pH sensor, a turbidity sensor, a TDS sensor, a DC-DC converter, and a power supply and web application is used for a Python web development framework, and this is connected to a MySQL database. Darus et al. [77] proposed water quality monitoring from a catfish pond that has been analyzed using simple expectation maximization (EM) clustering.
Parameters, such as total dissolved solids (TDS), water level, turbidity, pH, and temperature, have been collected via sensors connected to a Raspberry Pi 3 Model B. The experiment consists of the following activities: installation of WEKA API in Raspberry Pi3 Model B (Stretch), installation of total dissolved solids, water level, turbidity, pH, and temperature sensors to the Raspberry Pi3 Model B, as well as using a simple expectation maximization clustering technique, as in the equation. Figure 4 shows IoT monitoring water quality system block diagram [76,77].

2.1.2. Feeding Controlling

One of the main problems in aquaculture is feeding. According to the traditional method, farmers will spread food all over the pond, or at a certain location in the pond, depending on the eating characteristics of cultured species. Therefore, it is necessary to apply IoT in the feeding system to control the feeding amount as well as feed automatically which brings many benefits such as saving manpower and controlling the amount of leftovers, reducing water quality pollution in aquaculture. There are some studies which have been conducted.
For instance, Malathi et al. [78] provides an efficient semi-automatic system that facilitates the healthy growth of aquatic organisms in aquaculture. This study is conducted not only for a feeding system but also for water quality parameters in a cultured system through sensors such as a pH sensor and temperature sensor. The GSM module is used to alert the cultivator whenever the quality parameters violate the normal range. The feeding system automatically feeds the fish based upon its requirements. The system mainly consists of an Arduino Uno, a DS18B20 Temperature Sensor, a pH sensor, and a SIM900A-GSM module. Daud et al. [79] proposed water quality system based on IoT devices in a smart aquarium. The goal of this study is to maintain the freshwater in aquarium tank at a suitable level for fish habitats and feeding condition. This system is designed with MEGA and NodeMCU controllers and is controlled by a smartphone in its operation. Arduino are used in the designed system. Wi-Fi communication on the NodeMCU is connected between the smartphone and the controller to control the operation. All collected data of water quality is displayed on LCD. Figure 5 shows the block diagram complete system of the IoT application. In summary, user can control feeding machine automatically through the IoT devices [78,79].

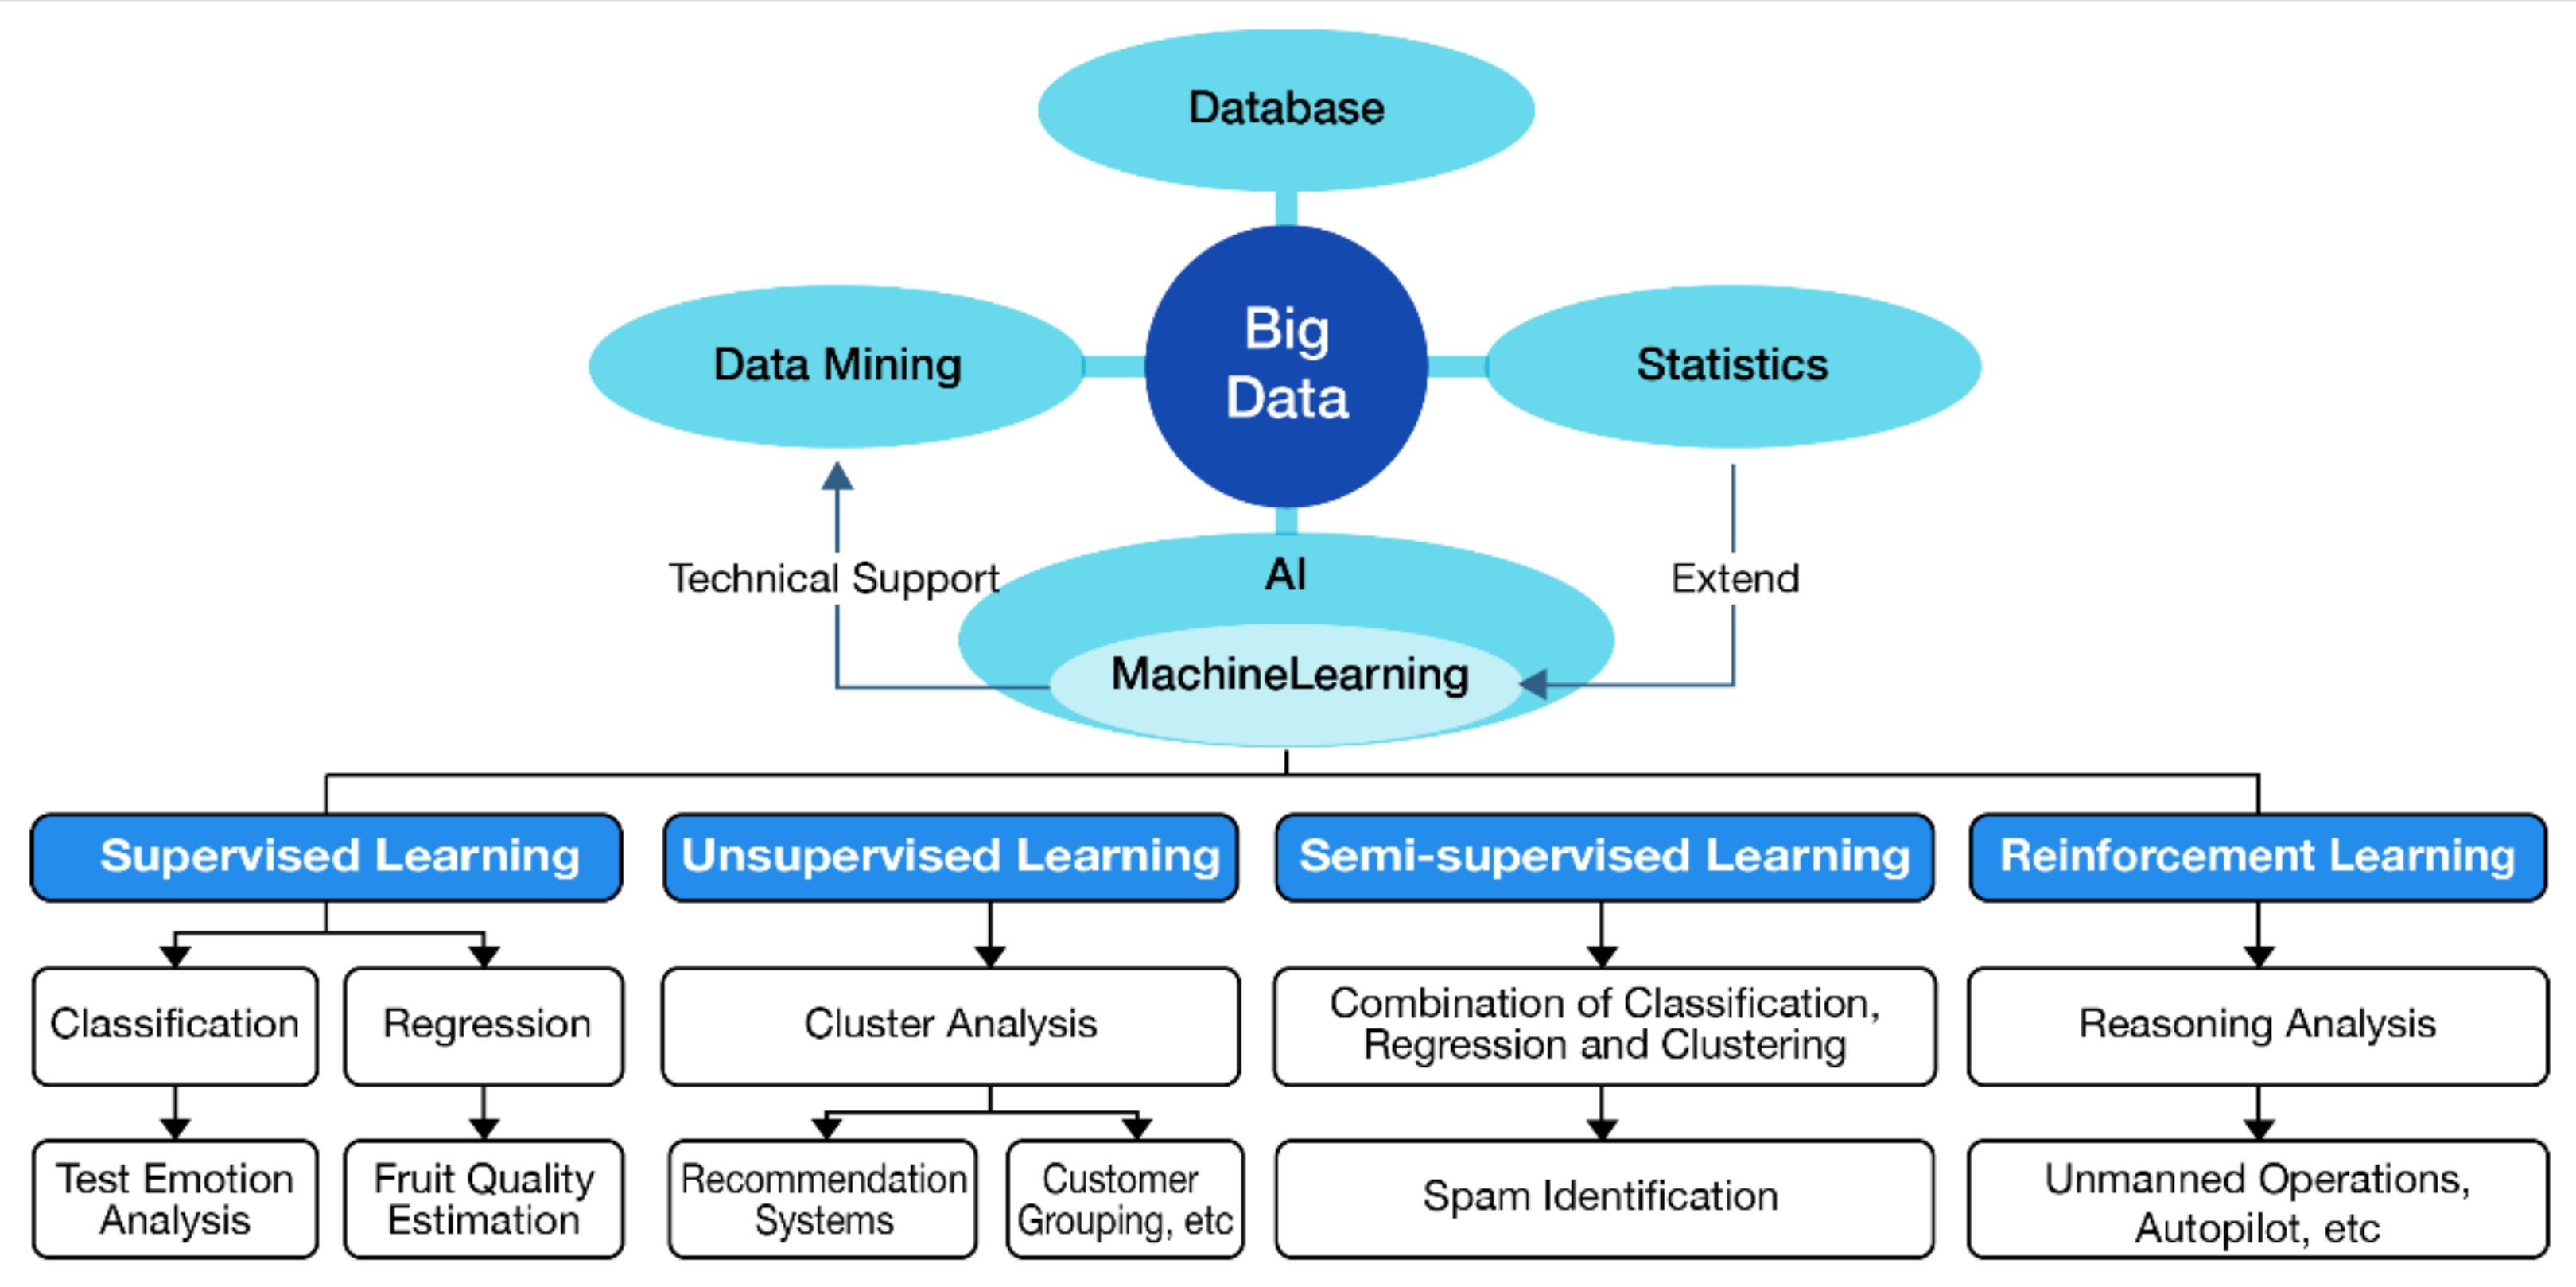
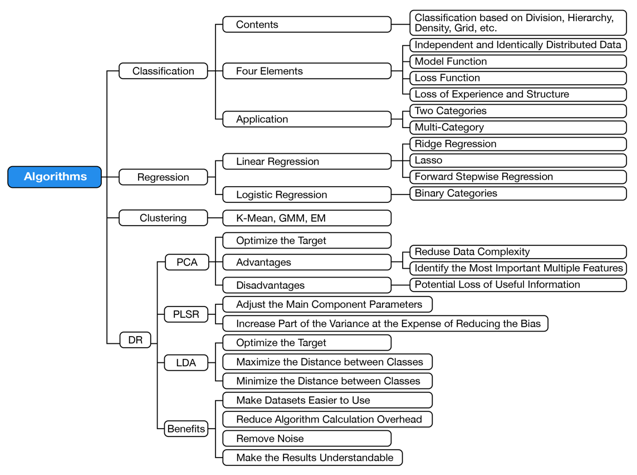
2.2. Machine Learning

It is said that “Machine learning is a subdivision of AI”. Instead of doing by an explicit computer programming expert, algorithmic models are trained to take specific functions by recognizing and learning samples from data which they have automatically, with accuracy and speed. As mentioned above, this process can be categorized as supervised, semi-supervised/unsupervised, and reinforcement learning with the most popular method is supervised (Figure 6) [80].
Supervised learning needs to use an algorithm system to obtain experience through training with a labeled dataset. From these experiences, we can recognize and distinguish novel data that are not similar to the trained ones. After finishing trained stages, these algorithms will do their duties by testing new data resources/images to classify either the target images or not [81]. Unsupervised learning is the output data with no training dataset. It is very similar to supervised learning. The goal of this type of learning is to classify the input resources into different types.
Data not labeled, however, are the input data in unsupervised learning so the goal of this model is to classify the input data due to its own features. That is the robust different point between supervised learning and unsupervised learning [82]. A hybrid method of machine learning which combines two aspects such as supervised and unsupervised learning is known as semi-supervised machine learning. In this side, to reduce the labelled input data by a method, for instance a huge of unlabeled inputs are combined with a small amount of labeled inputs [82].
Machine learning tasks and the main algorithms are shown in Figure 7 [81,82]. Four main tasks in machine learning include classification, regression, clustering, and DR (dimensionality reduction). Of these, supervised learning models have the classification and regression. Clustering belongs to unsupervised while DR belongs to both supervised and unsupervised learning.
There are many machine learning models which have been used including DT, SVM, NB, ANN, DL, EL and KNN. Each machine learning model has its own advantages and disadvantages. According to Zhao et al. [83], although DT and SVM are considered good models to use, they seem very sensitive to missing values. Otherwise, NB, ANN, and KNN are better than DT and SVM with many advantages such as being more efficient, less sensitive for missing values and having a high accuracy rate.

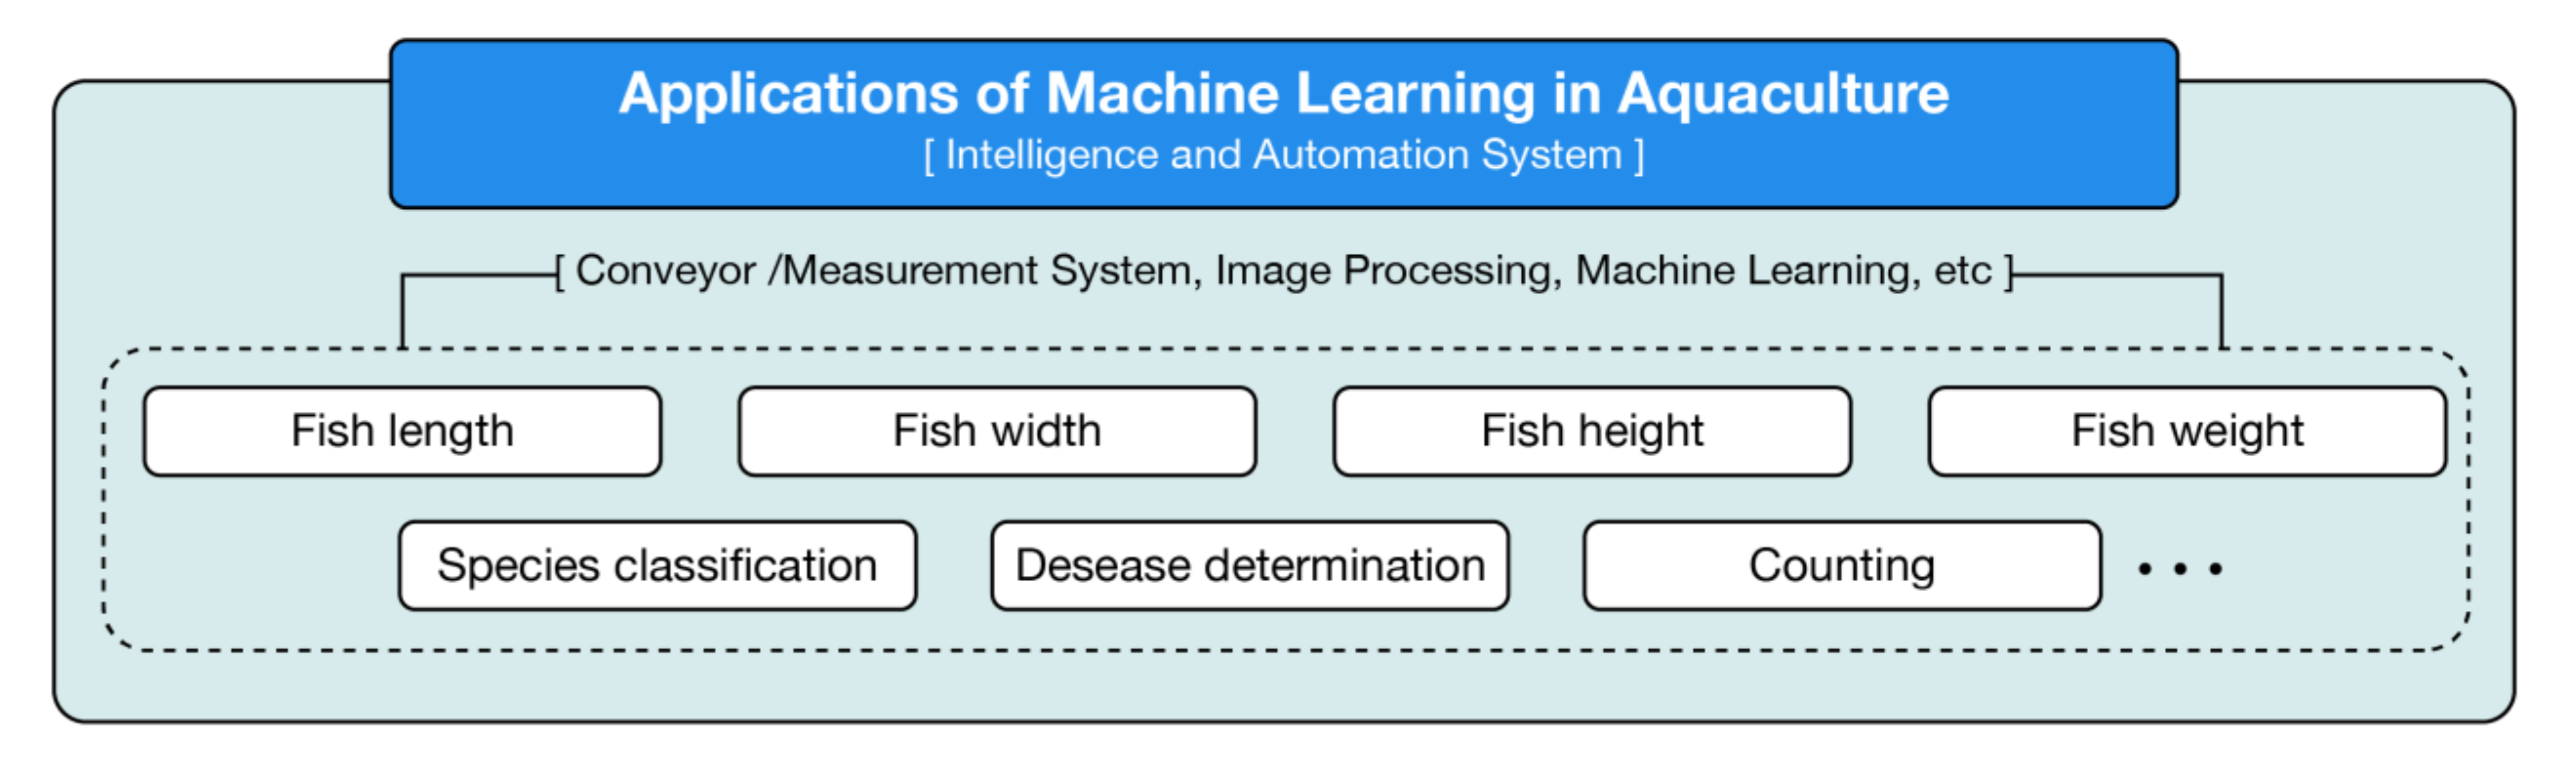
2.3. Applications of Machine Learning and Computer Vision in Aquaculture

Figure 8 shows an overview of applications of machine learning in aquaculture systems. In general, machine vision/computer vision is the main tool to measure the size of fish. Images are taken through a camera that are attached in a fish measurement system and then all collected images are sent to software and are analyzed and then the results compiled [81,82,83,84].

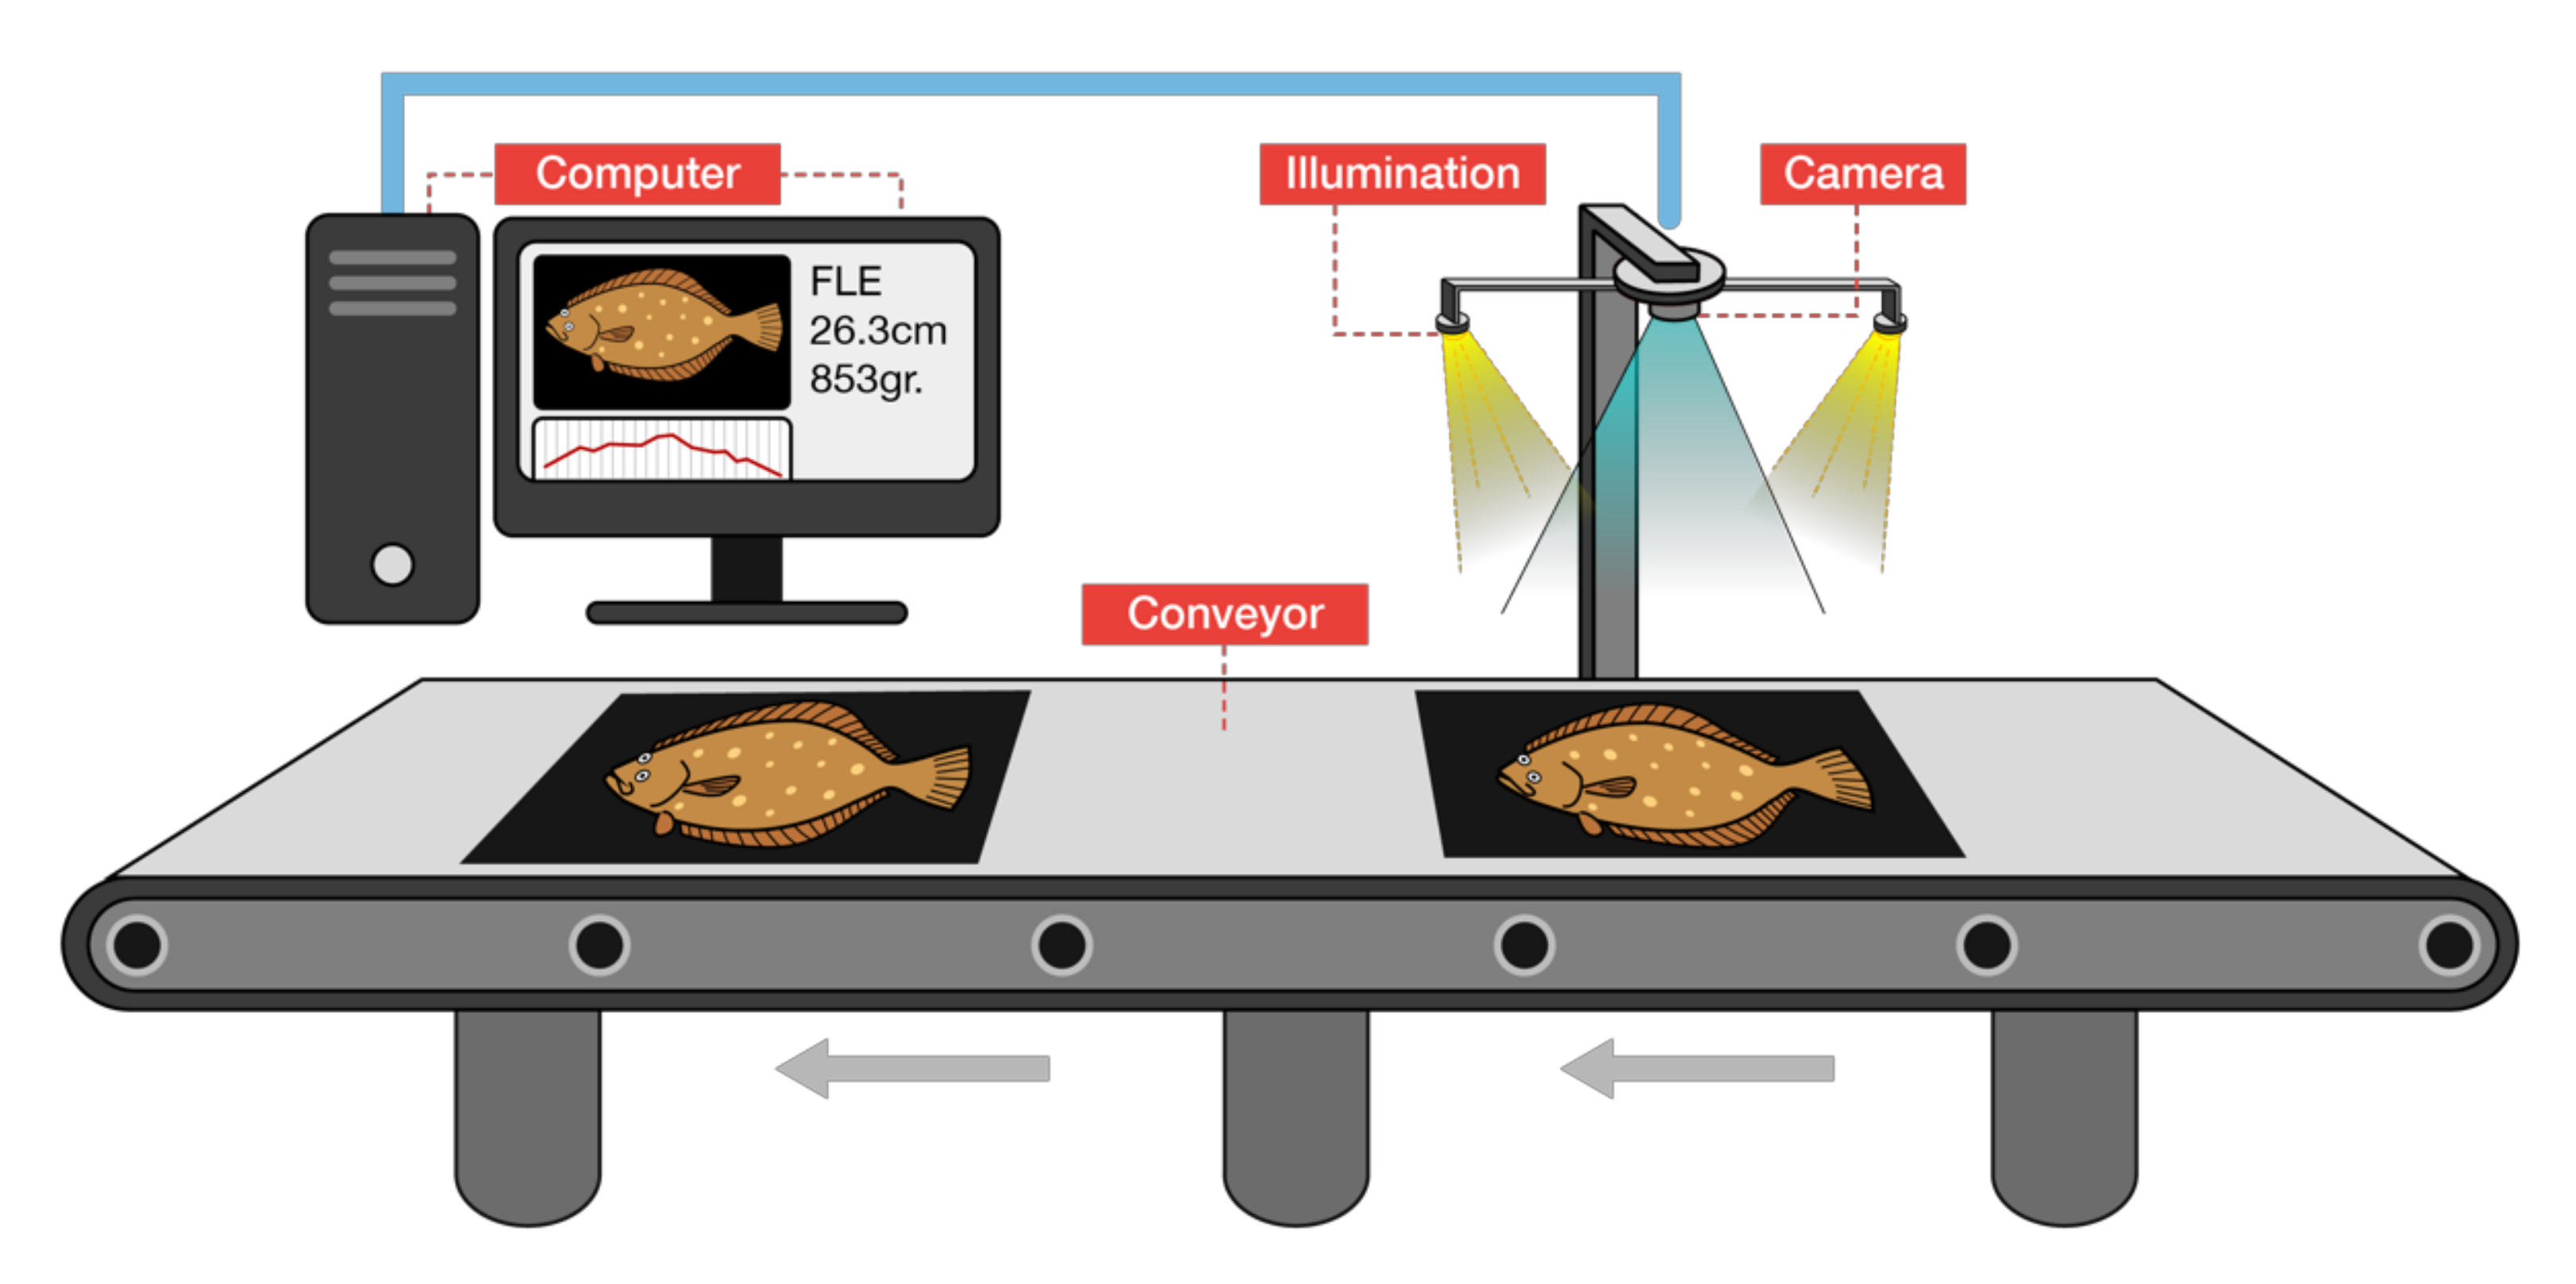
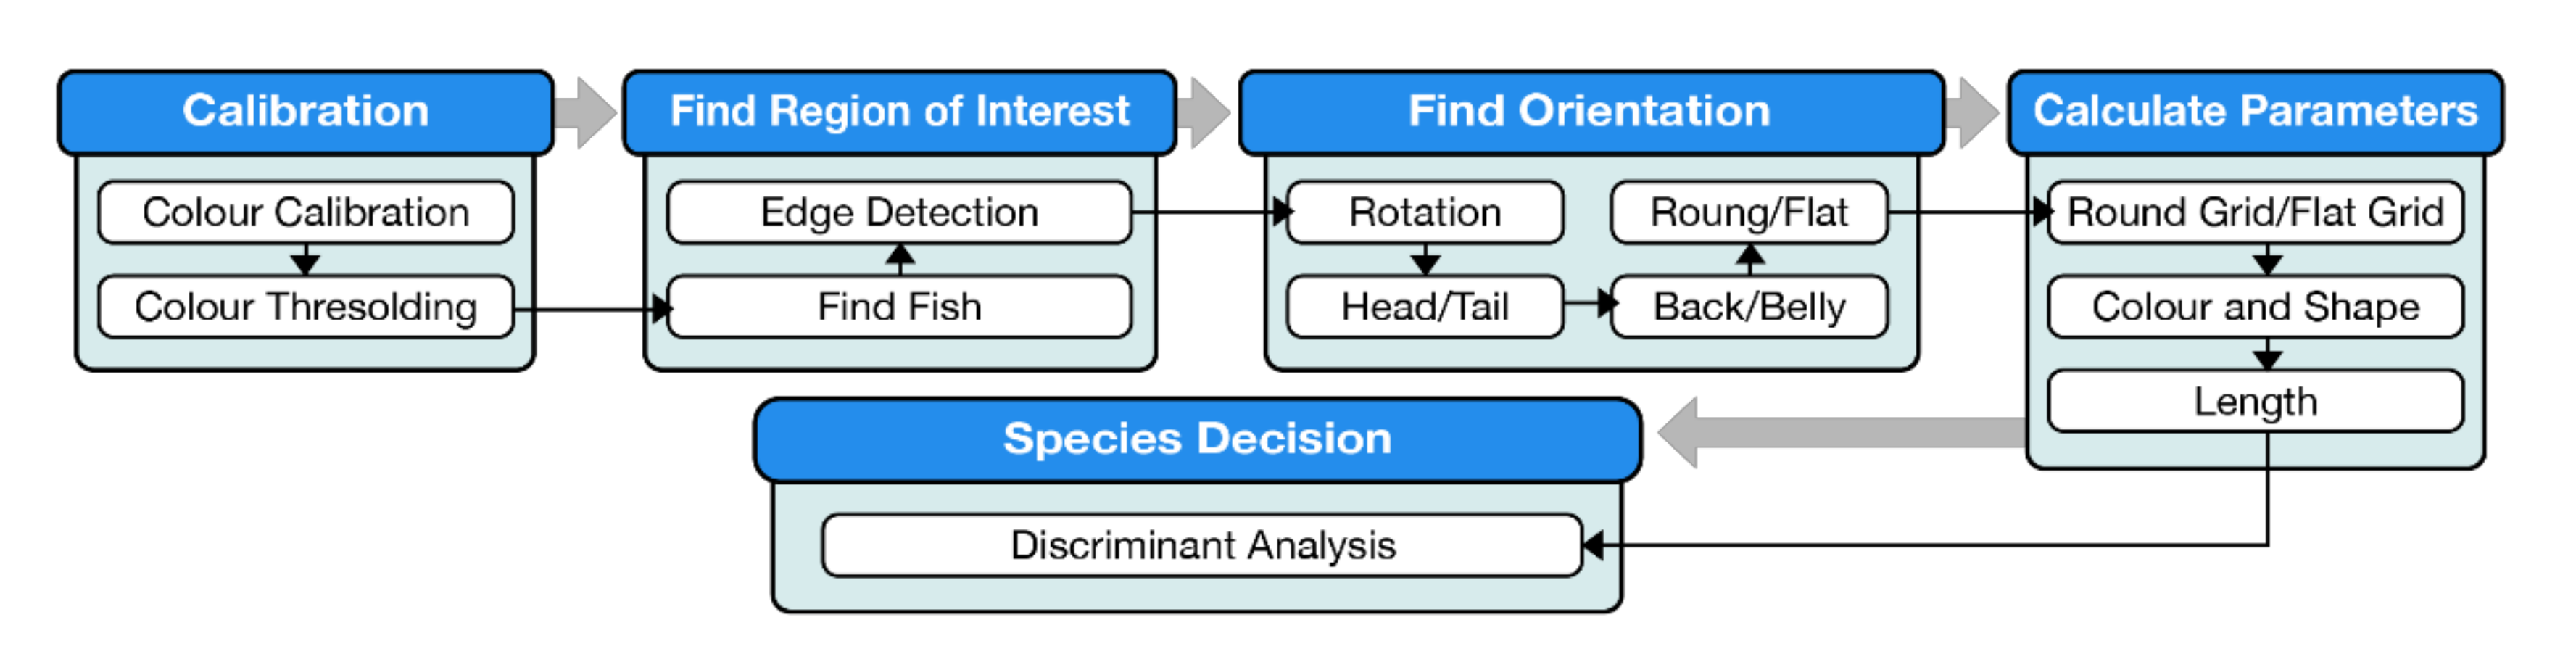
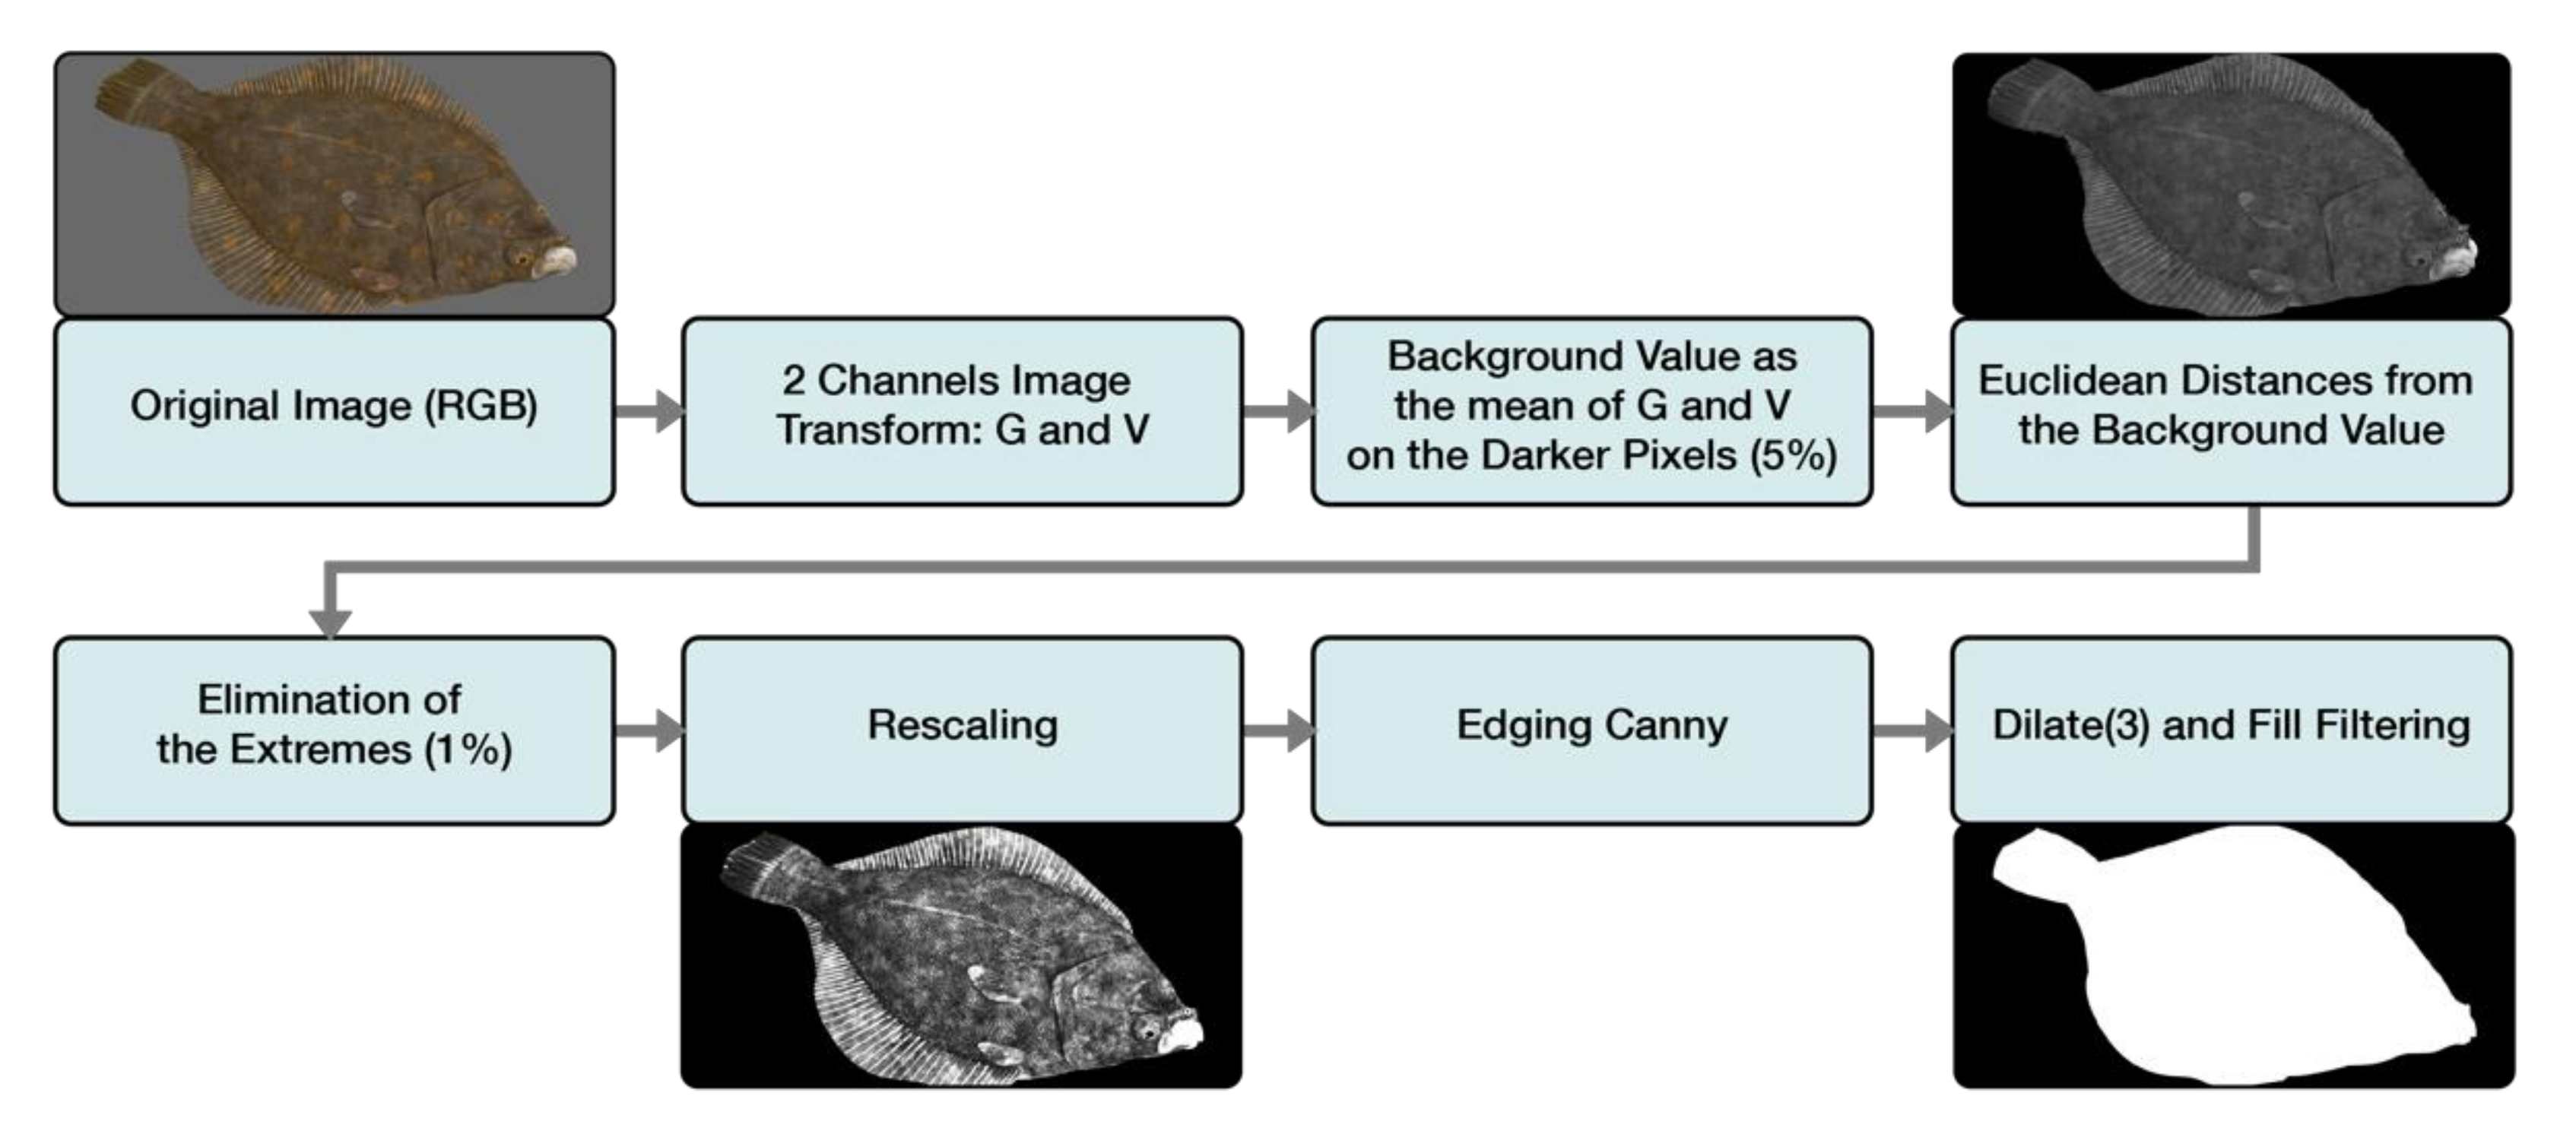
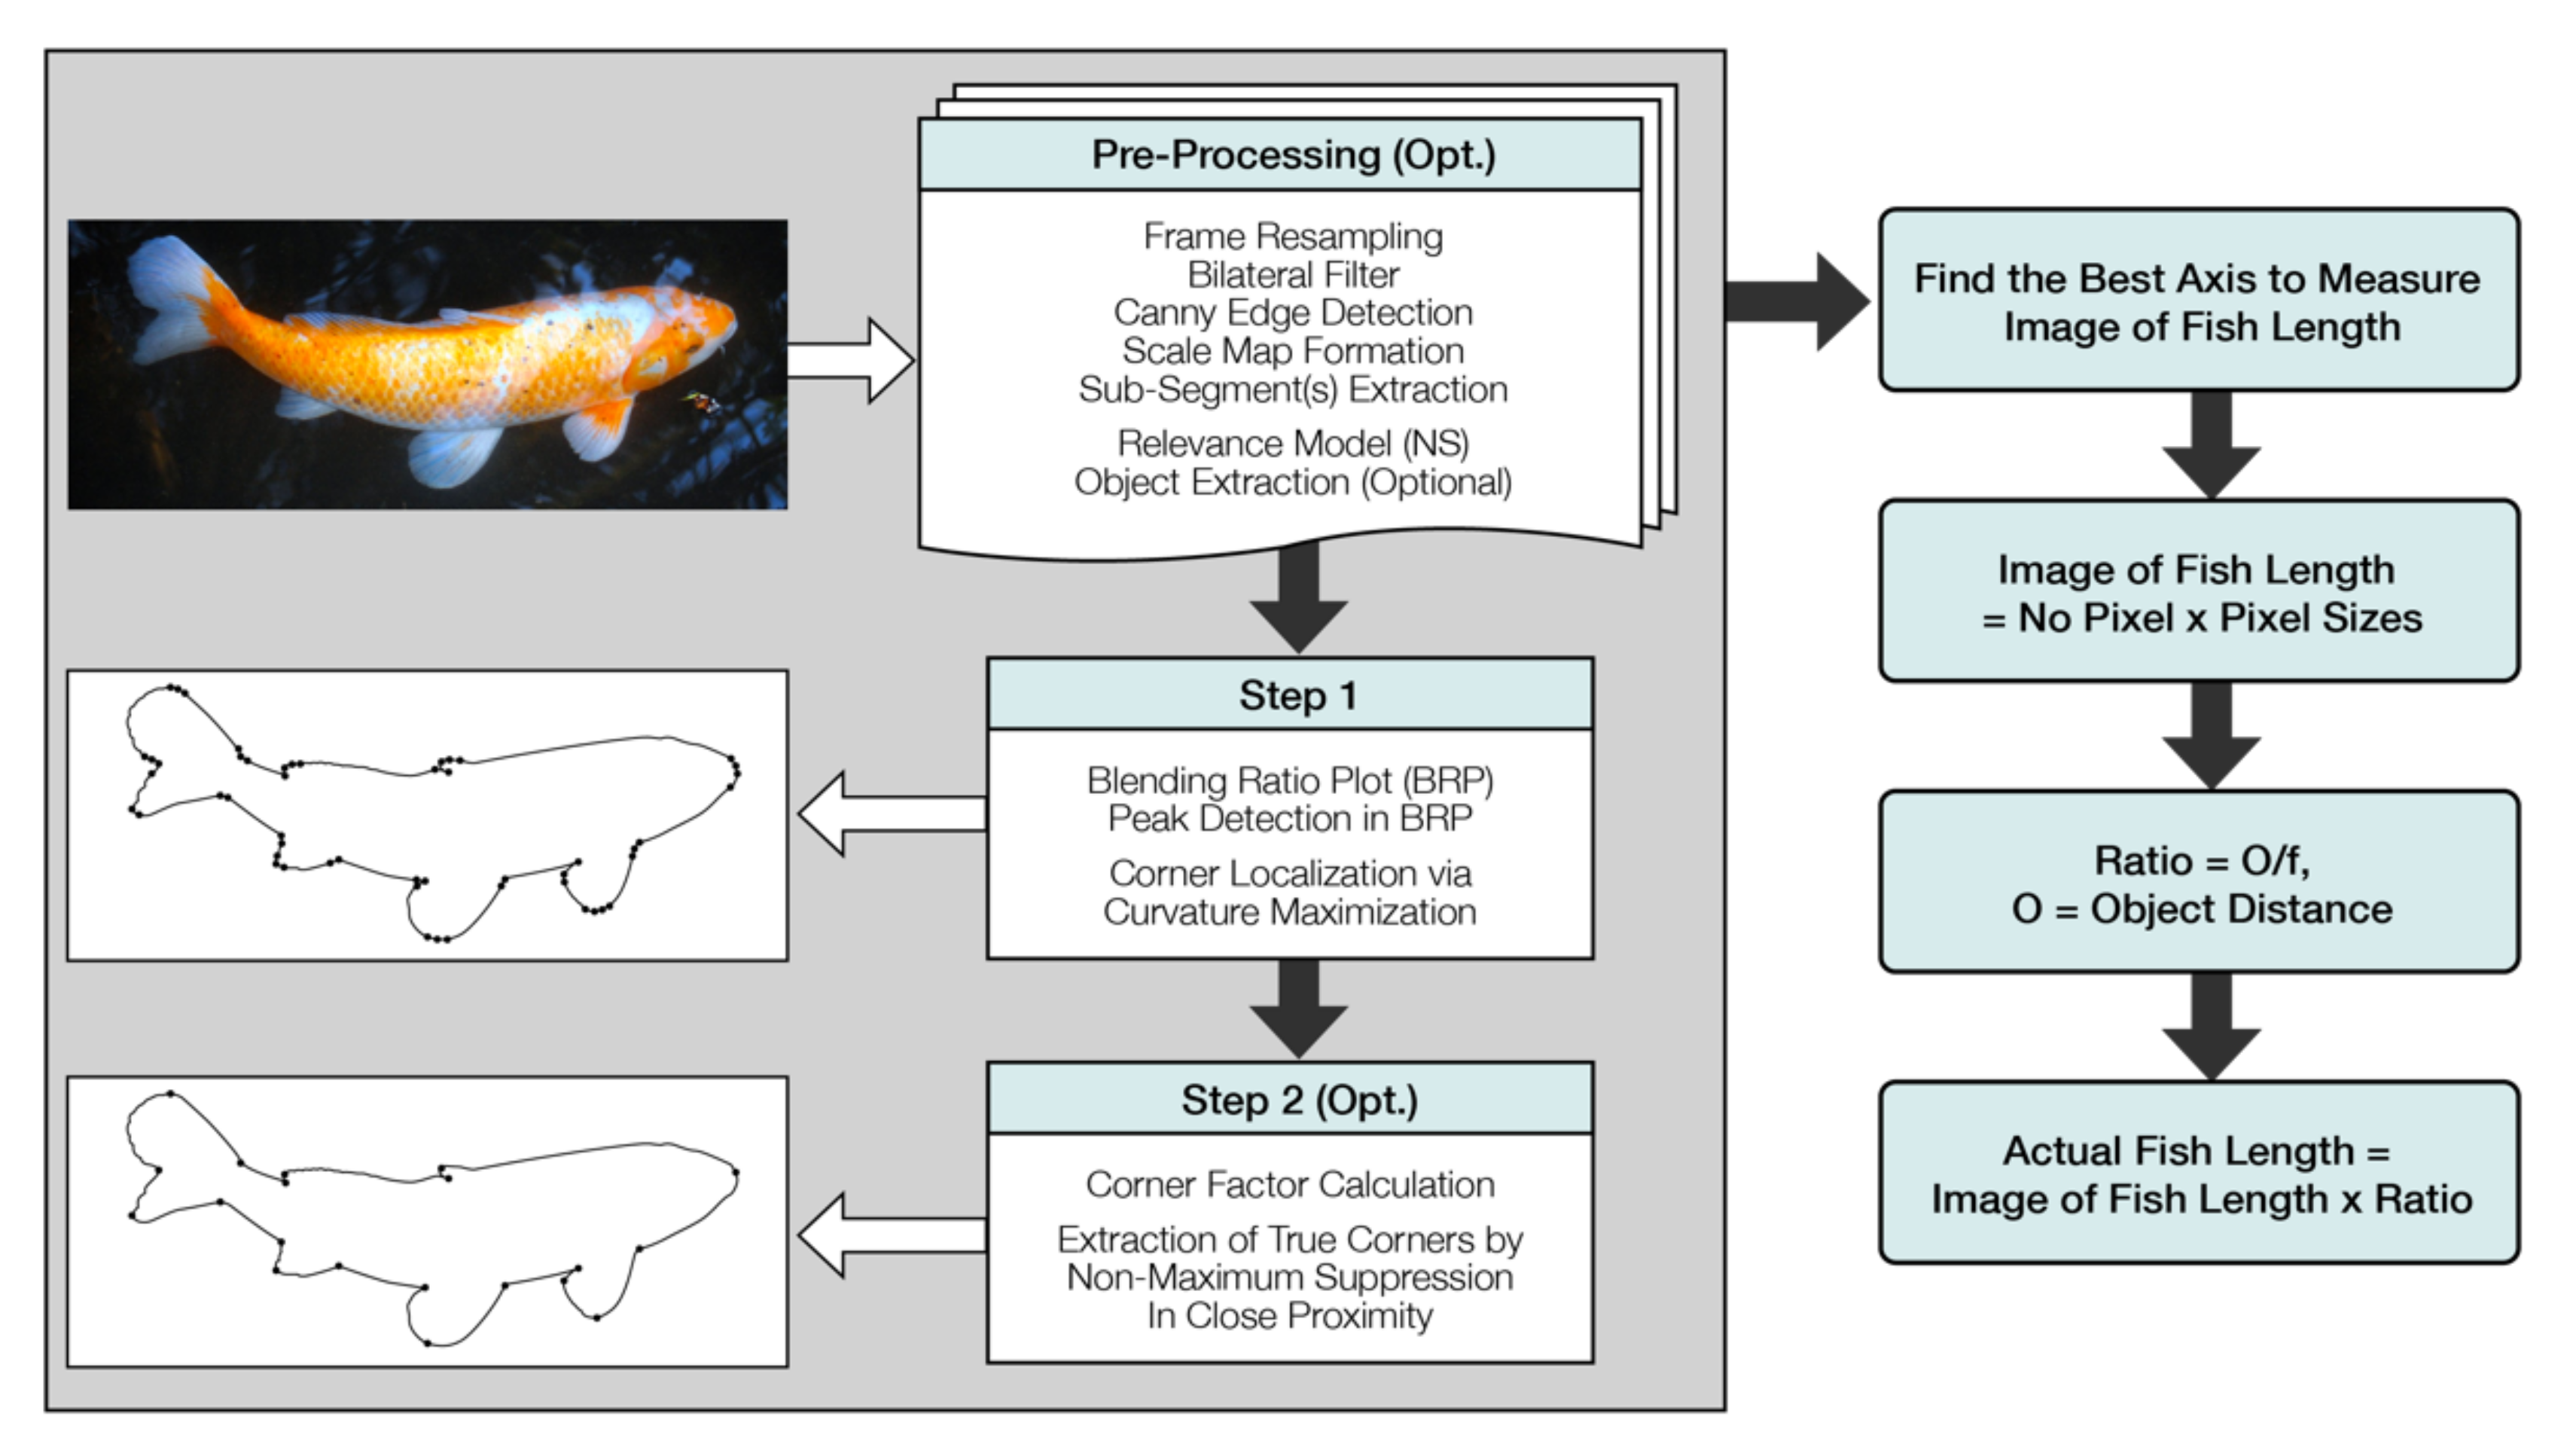
2.3.1. Measure Fish Size

Measuring fish size/fish grading is one of the necessary actions during culturing fish because of fish characteristics as well as the need to obtain the market size of fish. Size grading is known that the most frequent grading which is often operated in the rearing stage. Automation of aquatic species in aquaculture by machine learning can decrease costs for operation and management, as well as enhance profit and quality production. Measuring fish for the market is also very important. This work takes more time and is complicated because it is needed to discharge the abnormal fish. There are several studies which focused on different fish species in aquaculture.
White et al. [84] proposed a system using image processing algorithms to determine and identify the size of different fish species. Images of fish were obtained from several species such as Hippoglossoides platessoides, Solea vulgaris, Microstomus kitt, Pleuronectes platessa, Sebastes marinus, Sebastes mentella and Platichthys flesus. Figure 9 shows the CatchMeter system includes conveyor, light box, and feeder. An Omron PLC (Kyoto, Japan) link to the main computer and software via an ethernet link is a controlled mechanical system. Then, collected images are sent to computer and are analyzed by a software program. The processing is shown in a flow chart in Figure 10 [84].
By using hardware and programing techniques, the authors design and develop fish sorting equipment to determine the fish length as well as classify the fish species in real time condition. That is the main goal of this study. The result shows image processing algorithms for a flatfish/roundfish. Measuring the fish length can be undertaken with 100% accuracy rate, with a standard deviation of 1.2 mm and determine the fish species with up to 99.8% accuracy rate. It is estimated that every 1 h, a single conveyor system can measure up to 30,000 fish.
Related to this approach, Costa et al. [85] conducted an experiment with aim of this study is to develop methodology tools to directly measure size, identify sex and recognize the abnormal performance of seabass (Dicentrarchus labrax L.) in online conditions in an aquaculture farm. The seabass samples are taken from five crossed population from the wild in European. There are 259 fish photographed and weighed individually with minimum weight 0.1 g. Elliptic Fourier analysis (EFA) on the outline coordinates is used to analyze the fish shape. The original images are transformed by two channels such as G (gray scale) and V (value) channel in the HSV color space.
The Euclidean distance of each pixel was calculated from the background. Matlab operator was adopted to binarize the image in Figure 11 [85]. The result showed that this is the efficient method to sort fish online and can be applied widely in many fish farms.
Mustafa et al. [86] proposed this study to measure the length of fish automatically by image processing (FLUDI framework) instead of by measurement tools which are of high cost. Rastrelliger kanagurta and Selar crumenophthalmus species were used for this experiment. The figure shows the final interface of the FLUDI software to measure the actual the length of fish from the digital image. They used two kinds of camera such as Pentax camera (8.0 megapixel) and Sony (5.0 megapixel).
The Pentax camera (8.0 megapixel) and Sony (5.0 megapixel) has shown 0.74% and 0.19% error, respectively in this study. The result of study showed that FLUDI software has a very high potential to measure the actual length of fish from the digital image. However, the software can be applied to other objects without any object reference. The actual fish length from the digital image was tested by comparing the fish length obtained from the traditional measuring board (Figure 12) [86]. The result shows that the difference is very small, ranging from 0.74–2.19%.
Jeong et al. [87] deployed a measure fish system based on a vision-based automatic system (VAMS) to determine total length (TL), body width (BW), height (H), and weight (W) without contact to the for non-contact measurement of morphometric characteristics of flatfish. A laser displacement and a load cell were used to measure H and W, respectively. In addition, an algorithm was proposed to catch and measure TL and BW based on the morphological image processing algorithm. Figure 13 shows an example of the method to measure the fish without contact through proposed VAMS for management of fisheries resources a conceptual diagram of a database management system for fishery resources based on the morphometric characteristics of flatfish [87]. The measured data can be collected from different locations such as a research center/institute, a fish market, or a fisheries resource investigation laboratory. After that, all those collected data are transmitted to the server.
The proposed VAMS includes a vision system (PV-500, Panasonic, Kadoma, Japan), a laser displacement sensor (Omron, ZX-LT030, Kyoto, Japan), a charge-coupled device (CCD) camera (lens: focal length of 25 mm, CCD: size of 2/3 inches), a white 30W LED backlight, a conveyor belt, and a road cell (Figure 11). The result shows that the VAMS system can measure flatfish reach 266.844 mm average of TL and can measure 900 individual fish per hour of capacity with a single conveyor. Furthermore, it can measure the fish with TL reaching 500 mm.
In addition, Gerami et al. [88] assess the weight of salmon fish using machine vision. The fish samples were collected from a fish farm in Iran. There are 75 live specimens of rainbow trout (Oncorhynchus mykiss). A digital Cannon IXUS 960IS (12 mega pixels; 3000 × 4000) in the red, green and blue channels was used to take photo from left side of samples. The camera was located above the sample at a height of 45 cm. All taken fish photos can be transmitted to computer and analyzed by MATLAB (Matrix laboratory) version R2009x (Figure 14) [88].
This obtained a good result with clear images and assessed weight with high accuracy for fish by algorithms. From this result, it is concluded that machine vision should be an efficient tool for measuring weight as well as evaluate the visual features for fish. Therefore, machine vision could be used to evaluate the visual features of fish and estimate fish weight. It is suggested that this method is also used in fisheries processes in further work.
Meanwhile, Sanchez-Torres et al. [89] collected information from many works in the literature related to machine vision and then conducted a new concept for this field based on the existing information. It is a suitable system for measuring fish by using a single camera to take the photo in a controlled setup because it can manage better sample size and good condition images. Furthermore, a combination of homomorphic filtering, contrast limited adaptive histogram equalization (CLAHE) and guided filtering for fish image enhancement was used. The whole procedure to measure fish is shown in Figure 15 [89].
Results shows that it is a simple and efficient method to measure length and weight of fish such as polynomial regression at grade 3 and grade 4. Based on this result, this method is also applied to calculate the feed amount which is supplied for fish due to the length and weight of fish.
Sung et al. [90] conducted a study with the aim is to grader flatfish in automatically based on the size for effective and stable growth using machine vision. The designed grader has three components including a conveyor belt, machine vision and sorter (Figure 16) [90].
Fishes are transferred to the conveyor belt to measure and grade. As fish and their length are detected by image processing, the location of the grader is managed by the length classification (Figure 17) [90].
The machine vision part is composed of a camera, LED lights, and a darkroom with low cost. The figure shows the sort of process is an open-loop control system. Through the conveyor belt the fish is transferred from the hopper to the measure part. Then due to the classification, sorter’s position is controlled. Finising measurement, the conveyor belt is worked again. Finally the fish is graded by the sorter. The result showed that this is an accurate system for grading with high efficiency and low cost.
In general, machine vision is the main tool to measure the size of fish. Images are taken through a camera which is attached to a fish measurement system and then sends all collected images to a software which are analyzed and results are compiled.

2.3.2. Fish Disease and Health Management
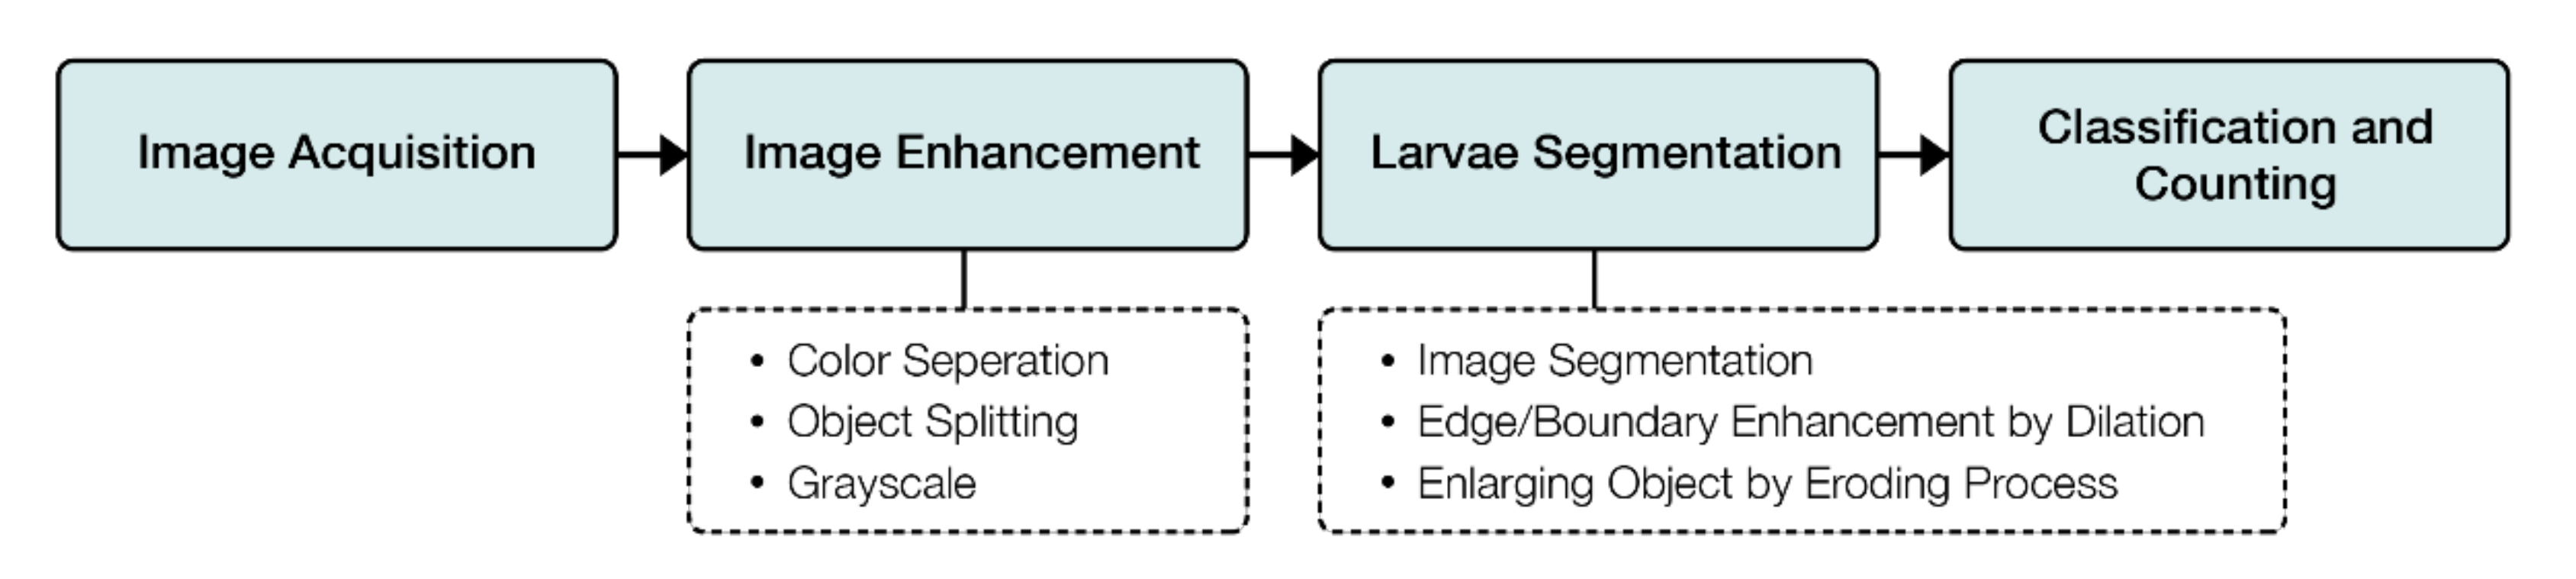
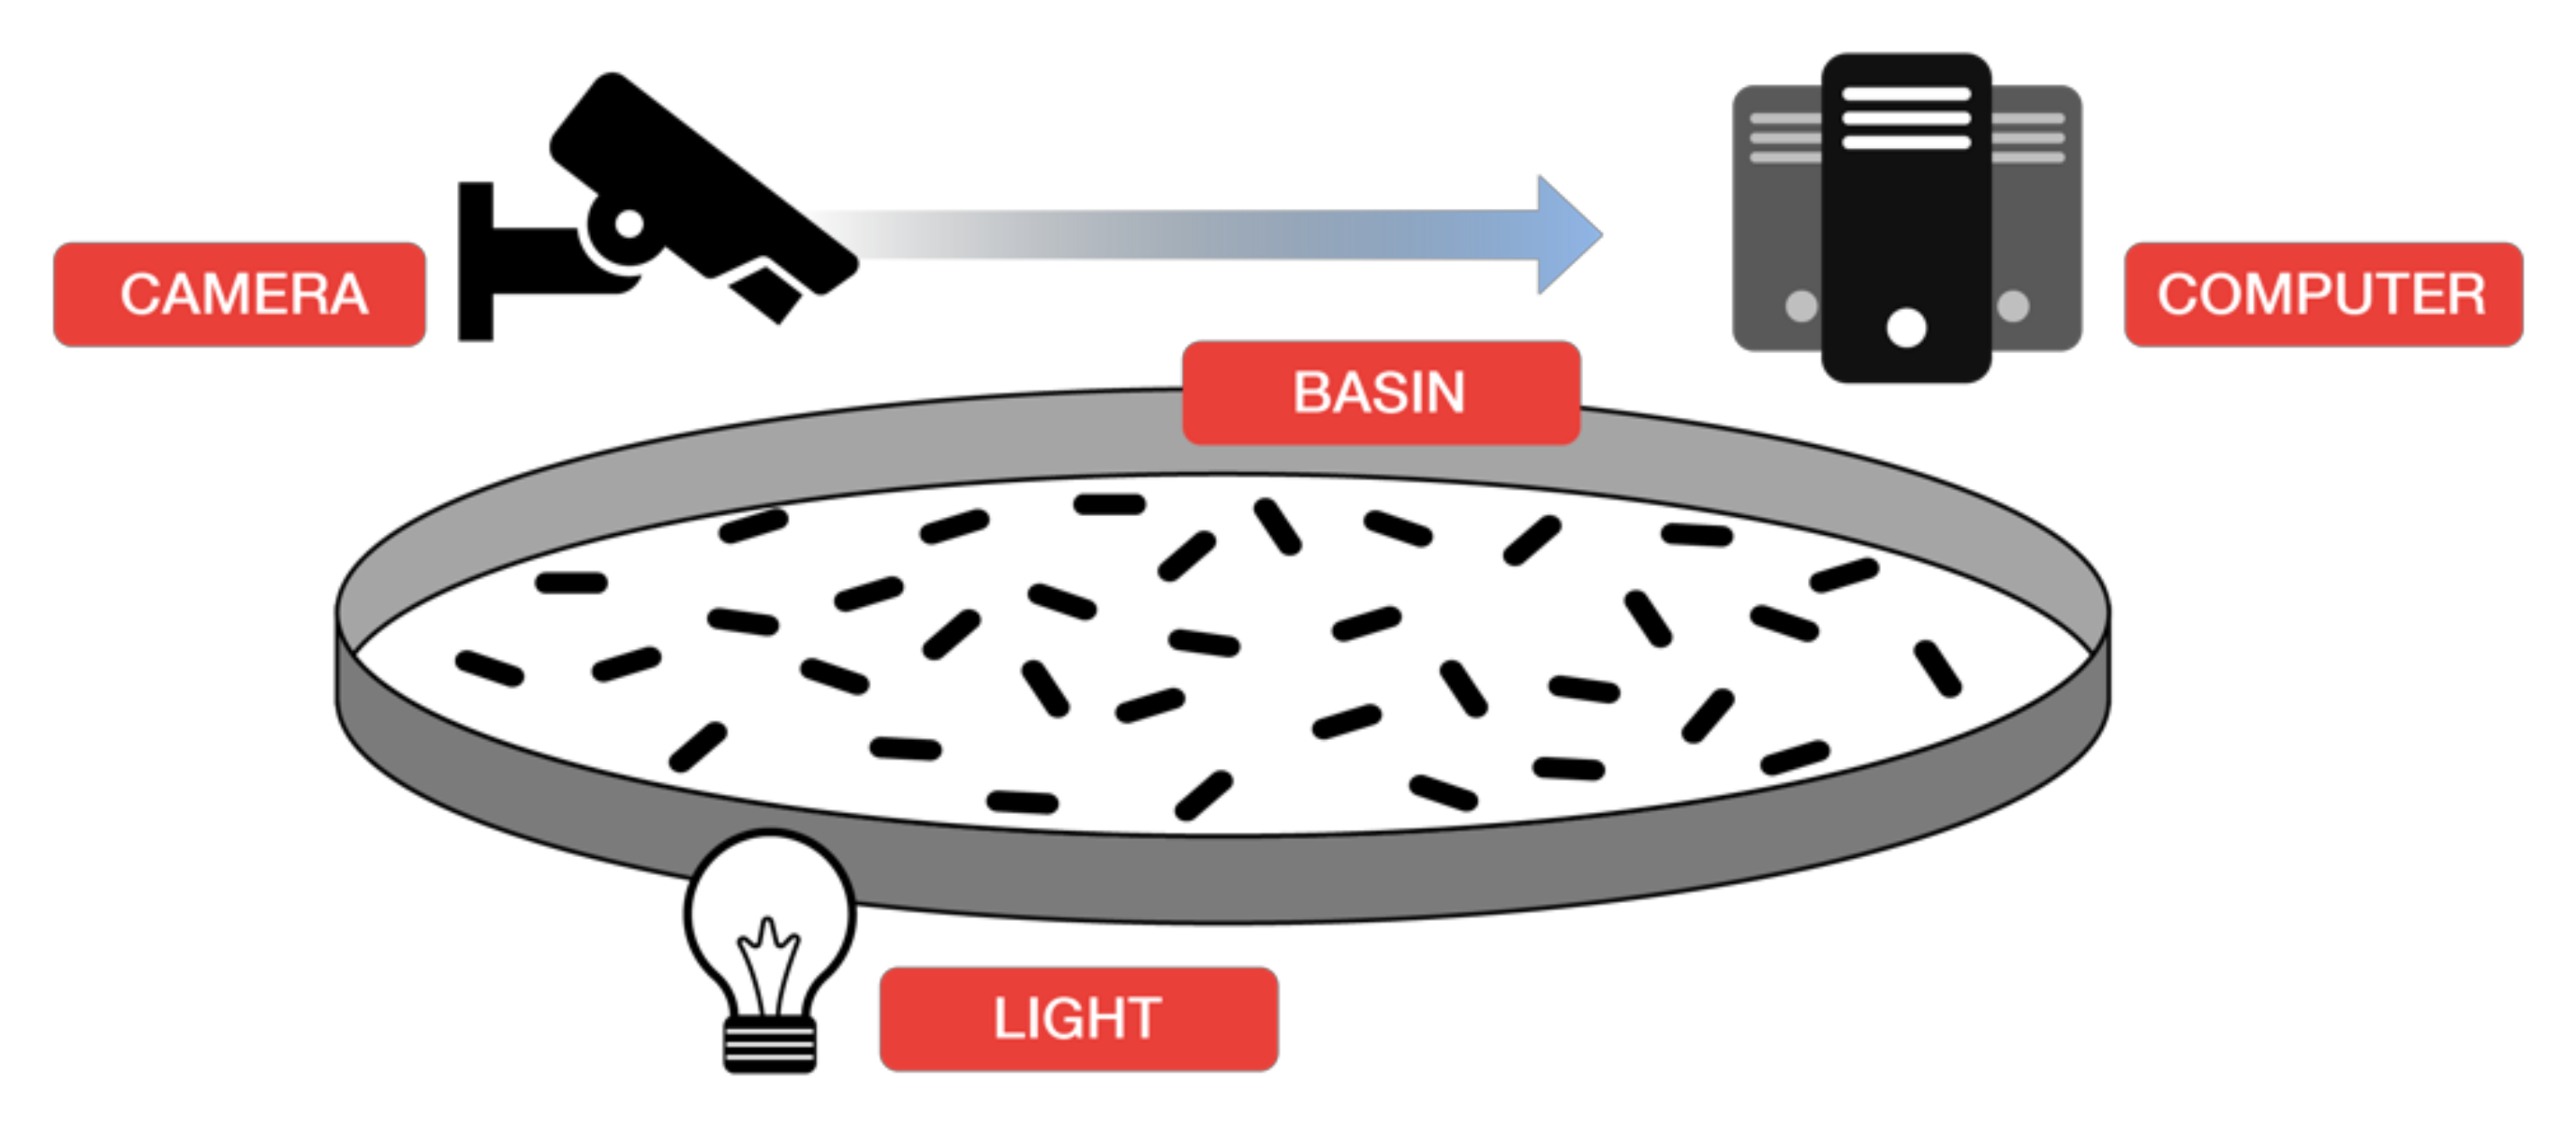
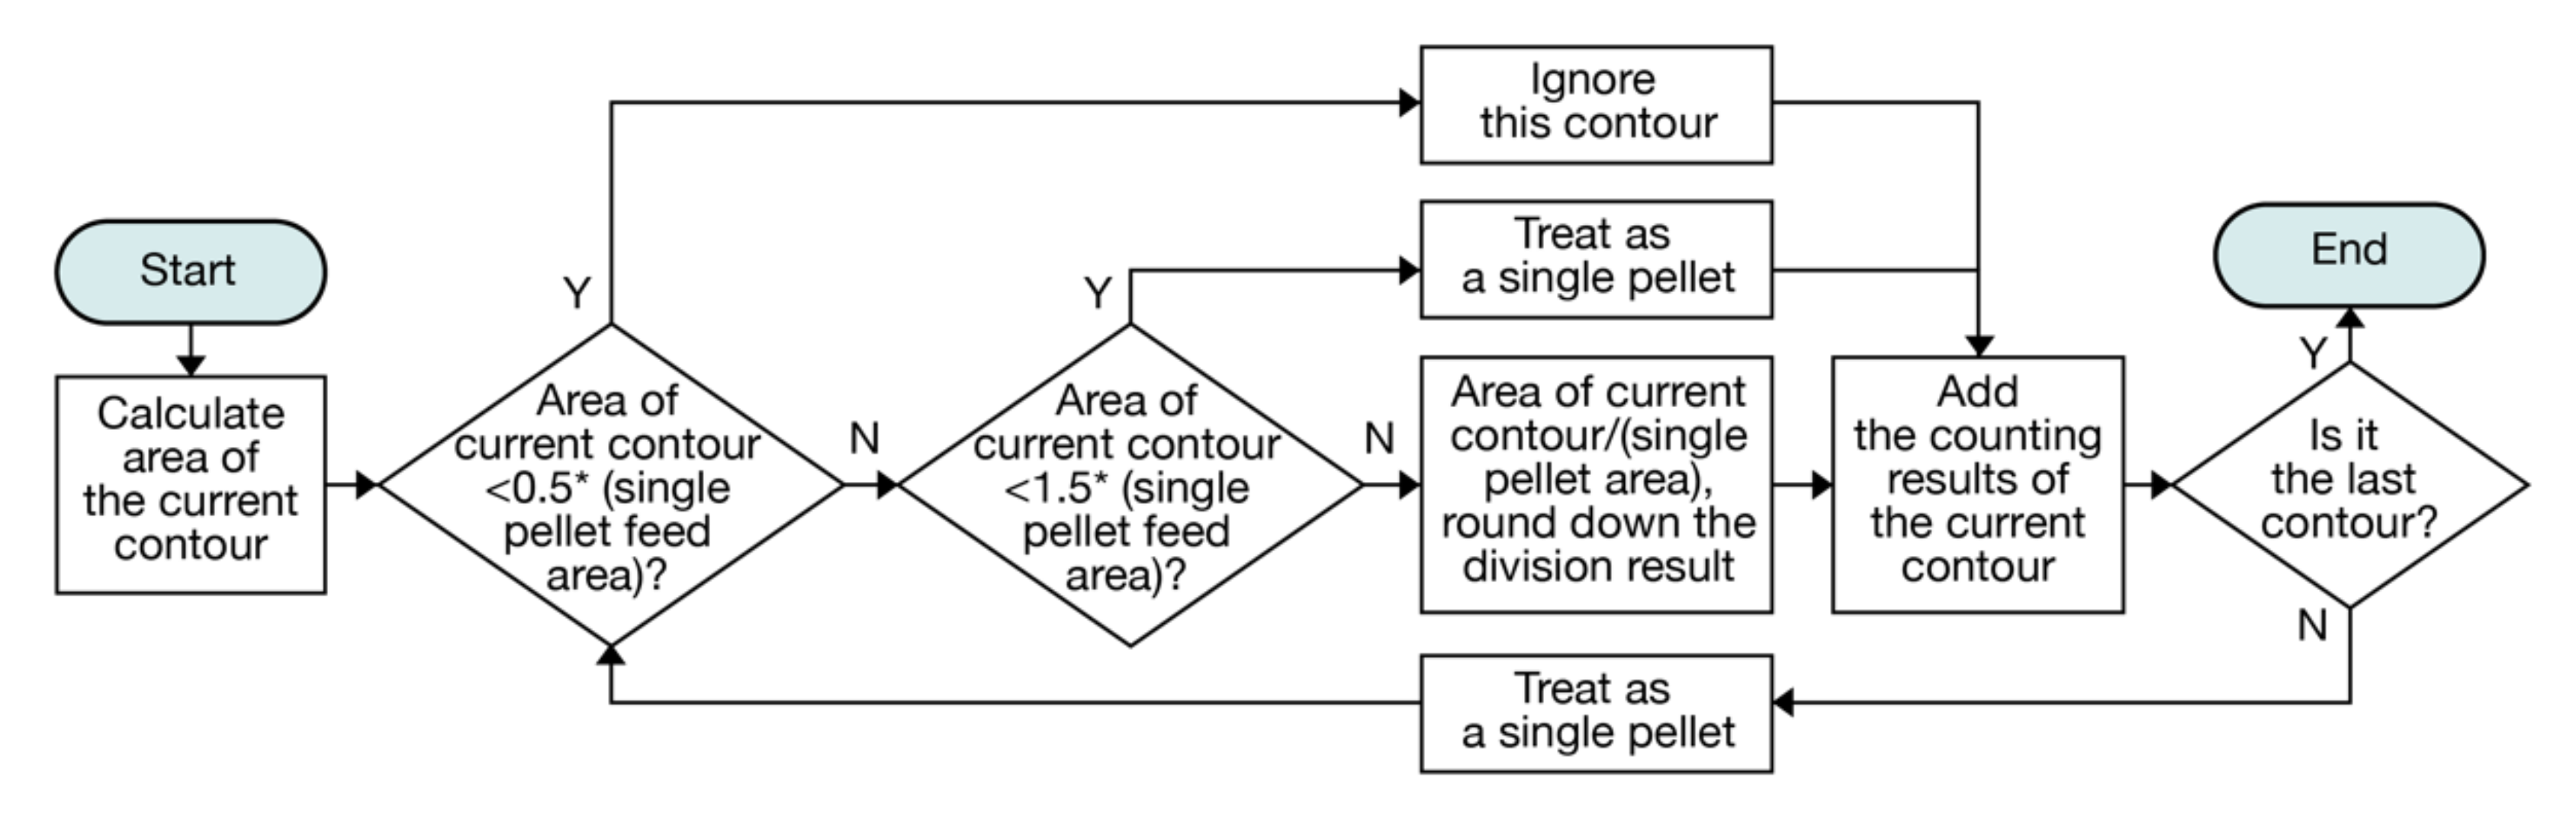
Disease is one of the severe issues which strongly effect on quality as well as aquaculture production. In aquaculture, disease results from the imbalance among many factors which come from host, pathogen and environment. There are different types of disease which is illustrated in two main categories: infectious (parasitic, fungal, bacterial, viral) and non-infectious (environmental, nutritional and genetic) [91]. Farmers cannot give accurate treatment for a sudden fish disease therefore it is hard to take treatment measures timely and effectively. This results are that fish disease spreads widely and fish can die in huge amounts causing a loss to the farmers [92]. Machine learning is a technique which can help detect and alert fish disease to farmer on time.
Epizootic ulcerative syndrome (EUS) is one of the popular diseases which caused a high mortality rate for fish which occurred in many countries such as Australia, India, United Kingdom, Japan, Thailand and Pakistan. It is a fungal disease named Aphanomyces invadans. Malik et al. [93] investigated a method to identify the fish diseases by combination two techniques including Principal Component Analysis (PCA) and classify by an Algorithm Neural Network (ANN).
Figure 18 shows the proposed methodology. The input images (fish disease images) were collected and then morphology operations were applied (converting the image into gray, removal of noise and segmentation) [93]. The result showed that FAST-PCA-ANN has better classification accuracy and efficiency than the existing combine technique HOG-PCA-ANN.
Chakravorty et al. [94] identified four infected EUS species such as Clarias batrachus, Puntius chola, Labeo bata and Labeo gonius from different parts of the Barak Valley, Assam. They used two kinds of machine learning algorithms including Principal Component Analysis (PCA) and K-means clustering with a flow chart for experiments showed in Figure 19 and Figure 20, respectively [94]. The results showed that the algorithm has more than 90% accuracy for PCA. In conclusion, for detecting skin color and extracting texture feature, HSV is a good choice. For detecting fish pathogen and extracting brain tumor, morphological operation should be used.
According to Divinely et al. [92], you can detect fish diseases (EUS ulcers—a fungal disease) timely and effectively using a probabilistic neural network (PNN). The method is shown in Figure 21 following these steps [92]. Input and database images are collected from some sources and various internet resources, respectively. Then images are put through the preprocessing to prevent unwanted distortions or to enhance some image features, which are useful for further processing in which RGB to gray conversion has been applied. Several extraction methods have been applied CWT (Curvelet Wavelet Transform) for efficiency of detection and finally the target fish diseases such as ammonia poisoning, camallanus worm and dropsy are classified. Others not infected are recognized and separated.
Then GLCM (Gray Level Co-Occurrence Matrix) is used to reduce the dimension and preserve useful information. A supervised learning algorithm (PNN) was used in this study. The result shows that the proposed combination of CWT-GLCM-PNN is an efficient and accurate way to detect fish disease.
Ahmeda et al. [95] identified diseases from salmon cultured in a farm. The work is divided into two portions: image preprocessing and segmentation. The image processing is to reduce noise and make image become much clearer. The segmentation extracts features and classifies disease from images with the support of a Support Vector Machine (SVM) algorithm of machine learning with a kernel function. Figure 22 shows a solution framework to classify the salmon disease. Also, Figure 23 shows a system architecture which contains two phases, such as building phase and deployment phase [95]. The results showed that using SVM is an efficient method to identify the fish diseases with high accuracy rate. Meanwhile, Figure 24 shows various appearances of image processing [95,96].
In short, machine learning is popularly used to identify the fish diseases. There are several machine learning algorithms for example ANN, HOG, PCA, SVM. In some cases, they can use to combine with machine learning algorithms such as ANN-HOG-PCA which may show the high accurate percentage to detect the fish diseases, particularly fungal disease.

2.3.3. Counting

It is necessary to count cultured species in aquaculture based on computer vision technology including video analysis and image processing due to counting [96]. Raman et al. [97] deployed a counting system which is used for counting larvae and juveniles in fish hatcheries by an image processing technology. It detects the image of larvaes and juveniles and then sees and counts the number of larvae and juvenile fish from these images by counting the separate single image.
Figure 25 shows the methodology of machine learning classified into four steps: image acquisition, image enhancement, segmentation, and classification [97]. This is to count the number of larvae and juvenile fish through image detection. The basic model of captured images for experiments are shown in Figure 26 [97]. Via camera, larvae and juveniles are captured. These captured images are transferred to a computer and software and finally the results are obtained after analysis. The results show that the installed system has an accuracy rate of 82% for larvae and 87% for juveniles.
For counting feed in aquaculture, Cao et al. [98] used machine vision to count feed for fish to manage the residual feed in aquaculture. A current contour is a single pellet. Based on current contour area, they counted exactly the number of pellets in a heap. Figure 27 shows the flow chart of the counting strategy. Also, Figure 28 shows the underwater images and aquaculture site [98].
The waste of feed causes many problems for aquaculture: decreasing profits; polluting the environment and affecting the health of cultured species. Therefore, the goal of this study is to count the proper amount of feed for culturing fish using an algorithm. They conducted experiments through different water turbidities, feed adhesion rates and others with over 100 pellets. Using algorithms is a useful solution to solve the problems in counting number of feeds from the real production in the aquaculture system. It is also efficient in turbid underwater environmental conditions. It can apply in automatic feeding systems with a high accuracy rate. This system can be deployed in practical production.
Zhang et al. [99] proposed a model to count the number of fish automatically instead of the traditional artificial sampling method. The goal of this system is to counting number of fish in cages cultured in an offshore environment. A hybrid neural network model based on a multi-column CNN and a DCNN is used to observe, realize and count the number of fish in a population cultured offshore in real time, accurately, objectively and without losses. Experiment video data is collected from an adult salmon cage by a submerged camera from the bottom up (Figure 29) [99]. The result showed that the counting accuracy rate is up to 95.06% of the proposed hybrid neural network.

2.3.4. Classification and Identification

It is said that classification as well as identification find it difficult to get accurate results by using traditional methods with the naked eye or costly by using genetic methods. Therefore, machine learning and computer vision are one of the efficient methods to classify and indentify fish in a short time with high accurracy rate.
For instance, Coz-Rakovac et al. [100] identified three aquaculture-affected species such as 120 seabass (Dicentrarchus labrax), 98 sea bream (Sparus aurata L.), and 66 mullets (Mugil spp.) thanks to biochemical data using machine learning methods. The decision tree was used and gave the best results among the machine-learning methods with 210 samples classified (85.71%) correctly and 35 (14.29%) incorrectly. There are 3 species which are identified based on their biochemical traits. The methodology of this study is shown in Figure 30 with decision tree and biochemistry analysis (AST, TP, TRIG, CHOL, and GLU collected from blood) [100].
Allken et al. [101] used Deep Vision camera to take images from the marine stock of marine stock. These images are materials for deploying a deep learning neural network to automate the classification of species. The results show that a classification accuracy of 94% was achieved for blue whiting, Atlantic herring, and Atlantic mackerel, showing that automatic species classification is a viable and efficient approach, and further that using synthetic data can effectively mitigate the all too common lack of training data. Figure 31 presents the procedure to identify the fish [101]. The sample fish images extract from actual ones and attach on the empty background at any position with random size and directions. The goal of this processing is to make images that is similar to deep vision photographs. The number of fish per image varies between one and six.

3. Conclusions

Smart aquaculture has expanded greatly in the aquaculture industry in an efficient, automated and accurate way in recent years. Although applications of artificial intelligent in aquaculture is progressing quickly, there are still many challenges to operate fully automated systems. Due to the nature of its practices and products, the lack of human management is high in risk, as there is still a need for a certain amount of observation, information analysis, and decision making during the fish farming process.
The applications of machine learning and computer vision in aquaculture have been contributing to the development of the aquaculture industry in an automatical trend, and improving farming productivity. The advantage of using algorithms or images is more accurate and faster than manual methods. However, the cost of machine learning and computer vision is high, so it is only recommended to apply it to large-scale farms with species of high economic value.
In this paper, we review the application of artificial intelligence into smart aquaculture, particularly focused on machine learning/vision, and its applications for aquaculture. Researchers and aquaculture famers studied the implementation of machine learning with algorithms or machine vision in smart aquaculture. The most popular applications measure the size and weight of cultured species; fish diseases; fish count; classification and identification, feed controlling; and monitoring water quality.
In the future, machine learning and computer vision applications should be more accessible in smart aquaculture deployed not only in hatcheries, farms on land, but also in aquaculture systems offshore. In particular, we can apply machine learning and computer vision for aquaculture on offshore areas such as cages to detect the fish diseases, manage the safe of cages, weight and size of fish, etc. In fact, the detection of diseased fish or the broken cage net system is really neccessary. Normally, farmers often use manual methods for managing the whole aquaculcture processing. For instance, diseased fish can be recognized as fish that are weak swim on the surface or people must dive into the cage to check. Therefore, using machine learning/vision connected to a submered camera is valuable. This system can recognize fish diseases, and safely manage the cage, weight and size of fish directly and continuously, as a future model system for cage culture in offshore.

Funding

This research was supported by the Basic Science Research Program through the National Research Foundation of Korea (NRF) funded by the Ministry of Science and ICT (NRF-2021R1G1A1006117). Also, this work was supported by a research grant from Seoul Women’s University (2020-0143).

Institutional Review Board Statement

Not applicable.

Informed Consent Statement

Not applicable.

Data Availability Statement

Not applicable.

Conflicts of Interest

The authors declare no conflict of interest.

Abbreviations

CWTCurvelet-Wavelet Transform
GLCMGray Level co-occurrence matrix
PCAPrincipal Component Analysis
ANNArtificial Neural Network
KNNK-nearest neighbor
VAMSVision-based Automatic System
EFAElliptic Fourier Analysis
DLDeep Learning
ELEnsemble Learning
DRDimensionality reduction
LCDLiquid Crystal Display
RASRecirculation Aquaculture System
ORPOxidation Reduction Potential
DODissolved Oxygen
EUSEpizootic Ulcerative Syndrome
TLTotal Length
BWBody weight
HHeight
WWeight

References

  1. Naylor, R.L.; Hardy, R.W.; Buschmann, A.H. A 20-year retrospective review of global aquaculture. Nature 2021, 591, 551–563. [Google Scholar] [CrossRef]
  2. Metian, M.; Troell, M.; Christensen, V.; Steenbeek, J.; Pouil, S. Mapping diversity of species in global aquaculture. Rev. Aquacult. 2020, 12, 1090–1100. [Google Scholar] [CrossRef]
  3. Sharma, D.; Kumar, R. Smart Aquaculture: Integration of Sensors, Biosensors, and Artificial Intelligence. In Biosensors in Agriculture: Recent Trends and Future Perspectives. Concepts and Strategies in Plant Sciences; Pudake, R.N., Jain, U., Kole, C., Eds.; Springer: Cham, Switzerland, 2021. [Google Scholar] [CrossRef]
  4. Kassem, T.; Shahrour, I.; El Khattabi, J.; Raslan, A. Smart and Sustainable Aquaculture Farms. Sustainability 2021, 13, 685. [Google Scholar] [CrossRef]
  5. Imai, T.; Arai, K.; Kobayashi, T. Smart Aquaculture System: A Remote Feeding System with Smartphones. In Proceedings of the 2019 IEEE 23rd International Symposium on Consumer Technologies (ISCT), Ancona, Italy, 19–21 June 2019; pp. 93–96. [Google Scholar]
  6. Hamid, M.S.; Wahab, M.A.A.; Abdullah, R.; Gani, S.F.B.A.; Hamzah, R.A. Development of water quality for smart aquaculture system. J. Eng. Appl. Sci. 2019, 14, 2840–2847. [Google Scholar] [CrossRef]
  7. Dzulqornain, M.I.; Rasyid, M.U.H.A.; Sukaridhoto, S. Design and Development of Smart Aquaculture System Based on IFTTT Model and Cloud Integration. In Proceedings of the 3rd International Conference on Electrical Systems, Technology and Information (ICESTI 2017), Bali, Indonesia, 26–29 September 2017; Volume 164. [Google Scholar]
  8. Sivabalan, K.N.; Anandkumar, V.; Balakrishnan, S. IOT Based Smart Farming for Effective Utilization of Water and Energy. Int. J. Adv. Sci. Technol. 2020, 29, 2496–2500. [Google Scholar]
  9. Shubhaker, B.; Prasad, D.; Manikanta, S.; Ba, P.A. Automated fish farm aquaculture monitoring system using IoT. J. Eng. Sci. 2020, 11, 1170–1172. [Google Scholar]
  10. Rashid, M.; Nayan, A.A.; Simi, S.A.; Saha, J.; Rahman, O.; Kibria, M.G. IoT based Smart Water Quality Prediction for Biofloc Aquaculture. (IJACSA) Int. J. Adv. Comput. Sci. Appl. 2021, 12(6), 56–62. [Google Scholar] [CrossRef]
  11. Wang, C.; Li, Z.; Wang, T.; Xu, X.; Zhang, X.; Li, D. Intelligent fish farm - the future of aquaculture. Aquacult. Int. 2021, 29, 2681–2711. [Google Scholar] [CrossRef]
  12. Lloyd Chrispin, C.; Jothiswaran, V.V.; Velumani, T.; Agnes Daney Angela, S.; Jayaraman, R. Application of Artificial Intelligence in Fisheries and Aquaculture. Biot. Res. Today 2020, 2, 499–502. [Google Scholar]
  13. Jordan, M.; Mitchell, T. Machine learning: Trends, perspectives, and prospects. Science 2015, 349, 255–260. [Google Scholar] [CrossRef] [PubMed]
  14. Zhang, Y.; Fitch, P.; Thorburn, P.J. Predicting the trend of dissolved oxygen based on the kPCA-RNN model. Water 2020, 12, 585. [Google Scholar] [CrossRef] [Green Version]
  15. Xu, F.; Pan, Z.; Xia, R. E-commerce product review sentiment classification based on a naïve Bayes continuous learning framework. Inf. Process. Manag. 2020, 57, 102221. [Google Scholar] [CrossRef]
  16. Tang, Q.; Qiu, W.; Zhou, Y. Classification of complex power quality disturbances using optimized S-transform and kernel SVM. IEEE Trans. Ind. Electron. 2020, 67, 9715–9723. [Google Scholar] [CrossRef]
  17. Zhakov, A.; Zhu, H.; Siegel, A.; Rank, S.; Schmidt, T.; Fienhold, L.; Hummel, S. Application of ANN for fault detection in overhead transport systems for semiconductor fab. IEEE Trans. Semicond. Manuf. 2020, 33, 337–345. [Google Scholar] [CrossRef]
  18. Jia, B.; Zhang, M. Multi-dimensional classification via kNN feature augmentation. Pattern Recognit. 2020, 106, 107423. [Google Scholar] [CrossRef]
  19. LeCun, Y.; Bengio, Y.; Hinton, G. Deep learning. Nature 2015, 521, 436–444. [Google Scholar] [CrossRef]
  20. Ma, Y. Ensemble Machine Learning: Methods and Applications; Springer Science & Business Media: New York, NY, USA, 2012; pp. 1–329. [Google Scholar]
  21. Kotsiantis, S.B. Supervised Machine Learning: A Review of Classification Techniques. Informatica 2007, 31, 249–268. [Google Scholar]
  22. Yang, X.; Zhang, S.; Liu, J.; Gao, Q.; Dong, S.; Zhou, C. Deep learning for smart fish farming: Applications, opportunities and challenges. Rev. Aquacult. 2020. [Google Scholar] [CrossRef]
  23. Monkman, G.G.; Hyder, K.; Kaiser, M.J.; Vidal, F.P. Using machine vision to estimate fish length from images using regional convolutional neural networks. Methods Ecol. Evol. 2019, 10, 2045–2056. [Google Scholar] [CrossRef]
  24. Garcia, R.; Prados, R.; Quintana, J.; Tempelaar, A.; Gracias, N.; Rosen, S.; Vågstøl, H.; Løvall, K. Automatic segmentation of fish using deep learning with application to fish size measurement. ICES J. Mar. Sci. 2019, 77, 1354–1366. [Google Scholar] [CrossRef]
  25. Li, P.; Hua, P.; Gui, D.; Niu, J.; Pei, P.; Zhang, J.; Krebs, P. A comparative analysis of artificial neural networks and wavelet hybrid approaches to long-term toxic heavy metal prediction. Sci. Rep. 2020, 10, 13439. [Google Scholar] [CrossRef]
  26. Fernandes, A.F.A.; Turra, E.M.; de Alvarenga, E.R.; Passafaro, T.L.; Lopes, F.B.; Alves, G.F.O.; Singh, V.; Rosa, G.J.M. Deep learning image segmentation for extraction of fish body measurements and prediction of body weight and carcass traits in Nile tilapia. Comput. Electron. Agric. 2020, 170, 105274. [Google Scholar] [CrossRef]
  27. Zhang, L.; Wang, J.; Duan, Q. Estimation for fish mass using image analysis and neural network. Comput. Electron. Agric. 2020, 173. [Google Scholar] [CrossRef]
  28. Petrellis, N. Measurement of fish morphological features through image processing and deep learning techniques. Appl. Sci. 2021, 11, 4416. [Google Scholar] [CrossRef]
  29. França Albuquerque, P.L.; Garcia, V.; Da Silva Oliveira, A.; Lewandowski, T.; Detweiler, C.; Gonçalves, A.B.; Costa, C.S.; Naka, M.H.; Pistori, H. Automatic live fingerlings counting using computer vision. Comput. Electron. Agric. 2019, 167, 105015. [Google Scholar] [CrossRef]
  30. Le, J.; Xu, L. An automated fish counting algorithm in aquaculture based on image processing. In Proceedings of the 2016 International Forum on Mechanical, Control and Automation (IFMCA 2016); Atlantis Press: Paris, France, 2017; pp. 358–366. [Google Scholar]
  31. Liu, L.; Lu, H.; Cao, Z.; Xiao, Y. Counting Fish in Sonar Images. In Proceedings of the 2018 25th IEEE International Conference on Image Processing (ICIP), Athens, Greece, 7–10 October 2018; pp. 3189–3193. [Google Scholar]
  32. Siddiqui, S.A.; Salman, A.; Malik, M.I.; Shafait, F.; Mian, A.; Shortis, M.R.; Harvey, E.S. Automatic fish species classification in underwater videos: Exploiting pre-trained deep neural network models to compensate for limited labelled data. ICES J. Mar. Sci. 2018, 75(1), 374–389. [Google Scholar] [CrossRef]
  33. Xu, W.; Matzner, S. Underwater fish detection using deep learning for water power applications. In Proceedings of the 2018 International Conference on Computational Science and Computational Intelligence (CSCI), Las Vegas, NV, USA, 12–14 December 2018; pp. 313–318. [Google Scholar] [CrossRef] [Green Version]
  34. Cai, K.; Miao, X.; Wang, W.; Pang, H.; Liu, Y.; Song, J. A modified YOLOv3 model for fish detection based on MobileNetv1 as backbone. Aquacult. Eng. 2020, 91, 102117. [Google Scholar] [CrossRef]
  35. Villon, S.; Mouillot, D.; Chaumont, M.; Darling, E.S.; Subsol, G.; Claverie, T.; Vill´eger, S. A deep learning method for accurate and fast identification of coral reef fishes in underwater images. Ecol. Inform. 2018, 48, 238–244. [Google Scholar] [CrossRef] [Green Version]
  36. Rauf, H.T.; Lali, M.I.U.; Zahoor, S.; Shah, S.Z.H.; Rehman, A.U.; Bukhari, S.A.C. Visual features based automated identification of fish species using deep convolutional neural networks. Comput. Electron. Agric. 2019, 167, 105075. [Google Scholar] [CrossRef]
  37. Hu, W.; Wu, H.; Zhang, Y.; Zhang, S.; Lo, C. Shrimp recognition using ShrimpNet based on convolutional neural network. J. Ambient. J. Ambient. Intell. Humaniz. Comput. 2020, 1–8. [Google Scholar] [CrossRef]
  38. Cao, X.; Liu, Y.; Wang, J.; Liu, C.; Duan, Q. Prediction of dissolved oxygen in pond culture water based on K-means clustering and gated recurrent unit neural network. Aquacult. Eng. 2020, 91, 102122. [Google Scholar] [CrossRef]
  39. Moen, E.; Handegard, N.O.; Allken, V.; Albert, O.T.; Harbitz, A.; Malde, K. Automatic interpretation of otoliths using deep learning. PLoS ONE 2018, 13, e204713. [Google Scholar] [CrossRef] [Green Version]
  40. Ordonez, A.; Eikvil, L.; Salberg, A.; Harbitz, A.; Murray, S.M.; Kampffmeyer, M.C. Explaining decisions of deep neural networks used for fish age prediction. PLoS ONE 2020, 15, e235013. [Google Scholar] [CrossRef]
  41. Webb, M.A.H.; Van Eenennaam, J.P.; Crossman, J.A.; Chapman, F.A. A practical guide for assigning sex and stage of maturity in sturgeons and paddlefish. J. Appl. Ichthyol. 2019, 35, 169–186. [Google Scholar] [CrossRef] [Green Version]
  42. Barulin, N.V. Using machine learning algorithms to analyse the scute structure and sex identification of sterlet Acipenser ruthenus (Acipenseridae). Aquacult. Res. 2019, 50, 2810–2825. [Google Scholar] [CrossRef]
  43. Barulin, N.V. External sex specific signs in the structure of dericatives of sterlet (Acipenser ruthenus, Linnaeus, 1758) corium. Acta Biol. Univ. Daugavp. 2017, 17, 9–17. [Google Scholar]
  44. Yang, L.; Liu, Y.; Yu, H.; Fang, X.; Song, L.; Li, D.; Chen, Y. Computer vision models in intelligent aquaculture with emphasis on fish detection and behavior analysis: A review. Arch. Comput. Methods Eng. 2020, 28, 2785–2816. [Google Scholar] [CrossRef]
  45. Tharwat, A.; Hemedan, A.A.; Hassanien, A.E.; Gabel, T. A biometric-based model for fish species classification. Fish. Res. 2018, 204, 324–336. [Google Scholar] [CrossRef]
  46. Jalal, A.; Salman, A.; Mian, A.; Shortis, M.; Shafait, F. Fish detection and species classification in underwater environments using deep learning with temporal information. Ecol. Inform. 2020, 57, 101088. [Google Scholar] [CrossRef]
  47. Pramunendar, R.A.; Wibirama, S.; Santosa, P.I. Fish Classification Based on Underwater Image Interpolation and Back-Propagation Neural Network. In Proceedings of the 2019 5th International Conference on Science and Technology (ICST), Yogyakarta, Indonesia, 30–31 July 2019; Volume 1, pp. 1–6. [Google Scholar] [CrossRef]
  48. Rum, S.N.M.; Nawawi, F.A.Z. FishDeTec: A fish identification application using image recognition approach. (IJACSA) Int. J. Adv. Comput. Sci. Appl. 2021, 12(3), 102–106. [Google Scholar] [CrossRef]
  49. Deep, B.; Dash, R. Underwater Fish Species Recognition Using Deep Learning Techniques. In Proceedings of the 2019 6th International Conference on Signal Processing and Integrated Networks (SPIN), Noida, India, 7–8 March 2019; pp. 665–669. [Google Scholar]
  50. Chhabra, H.S.; Srivastava, A.K.; Nijhawan, R. A Hybrid Deep Learning Approach for Automatic Fish Classification. In Proceedings of ICETIT 2019; Singh, P., Panigrahi, B., Suryadevara, N., Sharma, S., Singh, A., Eds.; Lecture Notes in Electrical Engineering; Springer: Cham, Switzerland, 2020; Volume 605. [Google Scholar] [CrossRef]
  51. Zhou, C.; Sun, C.; Lin, K.; Xu, D.; Guo, Q.; Chen, L.; Yang, X. Handling water reflections for computer vision in aquaculture. Trans. ASABE 2018, 61, 469–479. [Google Scholar] [CrossRef]
  52. Adegboye, M.A.; Aibinu, A.M.; Kolo, J.G.; Aliyu, I.; Folorunso, T.A.; Lee, S. Incorporating intelligence in fish feeding system for dispensing feed based on fish feeding intensity. IEEE Access 2020, 8, 91948–91960. [Google Scholar] [CrossRef]
  53. Han, F.; Zhu, J.; Liu, B.; Zhang, B.; Xie, F. Fish shoals behavior detection based on convolutional neural network and spatiotemporal information. IEEE Access 2020, 8, 126907–126926. [Google Scholar] [CrossRef]
  54. Zhao, J.; Bao, W.; Zhang, F.; Zhu, S.; Liu, Y.; Lu, H.; Shen, M.; Ye, Z. Modified motion influence map and recurrent neural network-based monitoring of the local unusual behaviors for fish school in intensive aquaculture. Aquaculture 2018, 493, 165–175. [Google Scholar] [CrossRef]
  55. Morimoto, T.; Zin, T.T.; Itami, T. A Study on Abnormal Behavior Detection of Infected Shrimp. In Proceedings of the 2018 IEEE 7th Global Conference on Consumer Electronics (GCCE), Nara, Japan, 9–12 October 2018; pp. 291–292. [Google Scholar]
  56. Keshtegar, B.; Keshtegar, B.; Heddam, S.; Heddam, S. Modeling daily dissolved oxygen concentration using modified response surface method and artificial neural network: A comparative study. Neural Comput. Appl. 2018, 30, 2995–3006. [Google Scholar] [CrossRef]
  57. Ren, Q.; Wang, X.; Li, W.; Wei, Y.; An, D. Research of dissolved oxygen prediction in recirculating aquaculture systems based on deep belief network. Aquacult. Eng. 2020, 90, 102085. [Google Scholar] [CrossRef]
  58. Ta, X.; Wei, Y. Research on a dissolved oxygen prediction method for recirculating aquaculture systems based on a convolution neural network. Comput. Electron. Agric. 2018, 145, 302–310. [Google Scholar] [CrossRef]
  59. Kim, S.; Alizamir, M.; Zounemat-Kermani, M.; Kisi, O.; Singh, V.P. Assessing the biochemical oxygen demand using neural networks and ensemble tree approaches in South Korea. J. Environ. Manag. 2020, 270, 110834. [Google Scholar] [CrossRef] [PubMed]
  60. Lu, H.; Ma, X. Hybrid decision tree-based machine learning models for short-term water quality prediction. Chemosphere 2020, 249, 126–169. [Google Scholar] [CrossRef] [PubMed]
  61. Fijani, E.; Barzegar, R.; Deo, R.; Tziritis, E.; Skordas, K. Design and implementation of a hybrid model based on two-layer decomposition method coupled with extreme learning machines to support real-time environmental monitoring of water quality parameters. Sci. Total Environ. 2019, 648, 839–853. [Google Scholar] [CrossRef]
  62. Barzegar, R.; Aalami, M.T.; Adamowski, J. Short-term water quality variable prediction using a hybrid CNN—LSTM deep learning model. Stoch. Environ. Res. Risk Assess. 2020, 34, 415–433. [Google Scholar] [CrossRef]
  63. Rahman, M.; Bapery, C.; Hossain, M.J.; Hassan, Z.; Hossain, G.M.J.; Islam, M. Internet of Things (IoT) based water quality monitoring system. Int. J. Multidiscip. Curr. Educ. Res. (IJMCER) 2020, 2(4), 168–180. [Google Scholar]
  64. The Digital Aquaculture Revolution, Technology. 2021. Available online: https://blog.techdesign.com/digital-aquaculture-revolution (accessed on 23 February 2021).
  65. Li, D.; Li, C. Intelligent aquaculture. J. World Aquacult. Soc. 2020, 51, 808–814. [Google Scholar] [CrossRef]
  66. Chavan, M.S.; Patil, V.P.; Chavan, S.; Sana, S.; Shinde, C. Design and Implementation of IoT Based Real Time Monitoring System for Aquaculture using Raspberry Pi. Int. J. Recent Innov. Trends Comput. Commun. 2018, 6, 159–161. [Google Scholar]
  67. Kim, B.J.; Shin, K.J. Development of Smart Fish Farming System Based on IoT Using Wasted Warm Water Energy. J. Inst. Control Robot. Syst. 2018, 24, 155–163. [Google Scholar] [CrossRef]
  68. Al-Hussaini, K.; Zainol, S.M.; Ahmed, R.B.; Daud, S. IoT Monitoring and Automation Data Acquisition for Recirculating Aquaculture System Using Fog Computing. J. Comput. Hardw. Eng. 2018, 1. [Google Scholar] [CrossRef]
  69. Shin, K.J. Development of a Mobile Integrated Control App for Smart Fish Farms based on the IoT. IEIE Trans. Smart Process. Comput. 2020, 9, 142–150. [Google Scholar]
  70. Monirul, I.; Mohammod, A.K.; Farzana, I.J. Aqua Fishing Monitoring System Using IoT Devices. IJISET Int. J. Innov. Sci. Eng. Technol. 2019, 6, 108–114. [Google Scholar]
  71. Nocheski, S.; Naumoski, A. Water monitoring iot system for fish farming ponds. Industry 4.0 2018, 3, 77–79. [Google Scholar]
  72. Krishna, P.C.; Rao, M.V.; Reddy, V.R. An IoT based fish health monitoring system in aquaculture farming. Int. J. Innov. Technol. Explor. Eng. (IJITEE) 2019, 8, 1578–1584. [Google Scholar]
  73. Prabhu, T. Automated enhancement of aquaculture species growth by observing the water quality using IoT. Int. Res. J. Multidiscip. Technov. (IRJMT) 2019, 1, 156–164. [Google Scholar]
  74. Nguyen, T.N.; Tran, T.H.; Nguyen, C.N. A Forecasting Model for Monitoring Water Quality in Aquaculture and Fisheries IoT Systems. In Proceedings of the 2020 International Conference on Advanced Computing and Applications (ACOMP), Quy Nhon, Vietnam, 25–27 November 2020; pp. 165–169. [Google Scholar]
  75. Hsu, W.C.; Chao, P.Y.; Wang, C.S.; Hsieh, J.C.; Huang, W. Application of Regression Analysis to Achieve a Smart Monitoring System for Aquaculture. Information 2020, 11, 387. [Google Scholar] [CrossRef]
  76. Darmalim, U.; Darmalim, F.; Darmalim, S.; Ahmad, A.; Budiarto, A.; Mahesworo, B.; Pardamean, B. IoT solution for intelligent pond monitoring. In Proceedings of the 3rd International Conference on Eco Engineering Development, Solo, Indonesia, 13–14 November 2019; Volume 426, pp. 1–10. [Google Scholar] [CrossRef] [Green Version]
  77. Darus, F.; Ayob, M.Z.; Malaysia, G.; Hassan, H.A.; Ridzuan, I.S.; Razak, M.R.A.; Baharuddin, H.; Rahman, A.H.A. Potential of using Internet of Things (IoT) for Water Quality Monitoring in Aquaculture: A Case Study in Freshwater Catfish Culture in Rawang, Selangor, Malaysia. Test Eng. Manag. 2020, 83, 2163–2169. [Google Scholar]
  78. Harish, B.; Manigandan, K.; Harishankar, N.; Ram, T. Smart Aquaculture Fish Feeding and Water Quality Monitoring. In Proceedings of the Conference on Electronics, Information and Communication Systems (CELICS’18), Tamil Nadu, India, 22–23 March 2018. [Google Scholar]
  79. Daud, A.K.P.M.; Sulaiman, N.A.; Yusof, Y.W.M.; Kassim, M. An IoT-Based Smart Aquarium Monitoring System. In Proceedings of the 2020 IEEE 10th Symposium on Computer Applications & Industrial Electronics (ISCAIE), Penang, Malaysia, 18–19 April 2020; pp. 277–282. [Google Scholar]
  80. Erickson, B.J.; Korfiatis, P.; Akkus, Z.; Kline, T.L. Machine learning for medical imaging. Radiographics 2017, 37, 505–515. [Google Scholar] [CrossRef]
  81. Moore, M.M.; Slonimsky, E.; Long, A.D.; Sze, R.W.; Iyer, R.S. Machine learning concepts, concerns and opportunities for a pediatric radiologist. Pediatr. Radiol. 2019, 49, 509–516. [Google Scholar] [CrossRef]
  82. Chartrand, G.; Cheng, P.M.; Vorontsov, E.; Drozdzal, M.; Turcotte, S.; Pal, C.J.; Kadoury, S.; Tang, A. Deep learning: A primer for radiologists. Radiographics 2017, 37, 2113–2131. [Google Scholar] [CrossRef] [PubMed] [Green Version]
  83. Zhao, S.; Zhang, S.; Liu, J.; Wang, H.; Zhu, J.; Li, D.; Zhao, R. Application of machine learning in intelligent fish aquaculture: A review. Aquaculture 2021, 540, 1–19. [Google Scholar] [CrossRef]
  84. White, D.J.; Svellingen, C.; Strachan, N.J.C. Automated measurement of species and length of fish by computer vision. Fish. Res. 2006, 80, 203–210. [Google Scholar] [CrossRef]
  85. Costa, C.; Antonucci, F.; Boglione, C.; Menesatti, P.; Vandeputtec, M.; Chatain, B. Automated sorting for size, sex and skeletal anomalies of cultured seabass using external shape analysis. Aquacult. Eng. 2013, 52, 58–64. [Google Scholar] [CrossRef]
  86. Mustafa, M.; Zaidi, M.Z.; Shafry, M.M.R.; Ismail, M.A.; Norhaida, A. FLUDI: Using digital images for measuring fish length. Galaxea J. Coral Reef Stud. 2013, 15, 101–106. [Google Scholar] [CrossRef] [Green Version]
  87. Jeong, S.J.; Yang, Y.S.; Lee, K.H.; Kang, J.G.; Lee, D.G. Vision-based automatic system for non-contact measurement of morphometric characteristics of flatfish. J. Electr. Eng. Technol. 2018, 8, 1194–1201. [Google Scholar] [CrossRef] [Green Version]
  88. Gerami, M.H.; Safiyari, H.; Jafari, A.; Mousavi-Nasab, M. Application of Machine-vision to assess weight of fish (Case study: Oncorhynchus mykiss). Iran. J. Fish. Sci. 2016, 15, 575–584. [Google Scholar]
  89. Sanchez-Torres, G.; Ceballos-Arroyo, A.; Robles-Serrano, S. Automatic measurement of fish weight and size by processing underwater hatchery images. Eng. Lett. 2018, 26, 461–472. [Google Scholar]
  90. Sung, H.J.; Park, M.K.; Choi, J.W. Automatic grader for flatfishes using machine vision. Int. J. Control Autom. Syst. 2020, 18, 3073–3082. [Google Scholar] [CrossRef]
  91. Rahman, A.; Akter, S.; Khan, M.M.; Rhaman, K. Relation between aquaculture with fish disease and health management: A review note. Bangladesh J. Fish. 2019, 31, 253–260. [Google Scholar]
  92. Divinely, S.J.; Sivakami, K.; Jayaraj, V. Fish diseases identification and classification using Machine Learning. Int. J. Adv. Res. Basic Eng. Sci. Technol. (IJARBEST) 2019, 5, 46–51. [Google Scholar]
  93. Malik, S.; Kumar, T.; Sahoo, A.K. A novel approach to fish disease diagnostic system based on machine learning. Adv. Image Video Process. 2017, 5, 49–57. [Google Scholar] [CrossRef] [Green Version]
  94. Chakravorty, H.; Paul, R.; Das, P. Image processing technique to detect fish disease. Int. J. Comput. Sci. Secur. (IJCSS) 2015, 9, 121–131. [Google Scholar]
  95. Ahmeda, S.; Aurpaa, T.T.; Azada, A.K. Fish disease detection using image based machine learning technique in aquaculture. J. King Saud Univ. Comput. Inf. Sci. 2021, 1–15. [Google Scholar] [CrossRef]
  96. Li, D.; Miao, Z.; Peng, F.; Wang, L.; Hao, Y.; Wang, Z.; Chen, T.; Li, H.; Zheng, Y. Automatic counting methods in aquaculture: A review. J. World Aquacult. Soc. 2021, 52, 269–283. [Google Scholar] [CrossRef]
  97. Raman, V.; Perumal, S.; Navaratnam, S.; Fazilah, S. Computer assisted counter system for larvae and juvenile fish in Malaysian fishing hatcheries by machine learning approach. J. Comput. 2016, 11, 423–431. [Google Scholar] [CrossRef]
  98. Cao, J.; Xu, L. Research on counting algorithm of residual feeds in aquaculture based on machine vision. In Proceedings of the 2018 IEEE 3rd International Conference on Image, Vision and Computing (ICIVC), Chongqing, China, 27–29 June 2018; pp. 498–503. [Google Scholar]
  99. Zhang, S.; Yang, X.; Wang, Y.; Zhao, Z.; Liu, J.; Liu, Y.; Sun, C.; Zhou, C. Automatic fish population counting by machine vision and a hybrid deep neural network model. Animals 2020, 10, 364. [Google Scholar] [CrossRef] [Green Version]
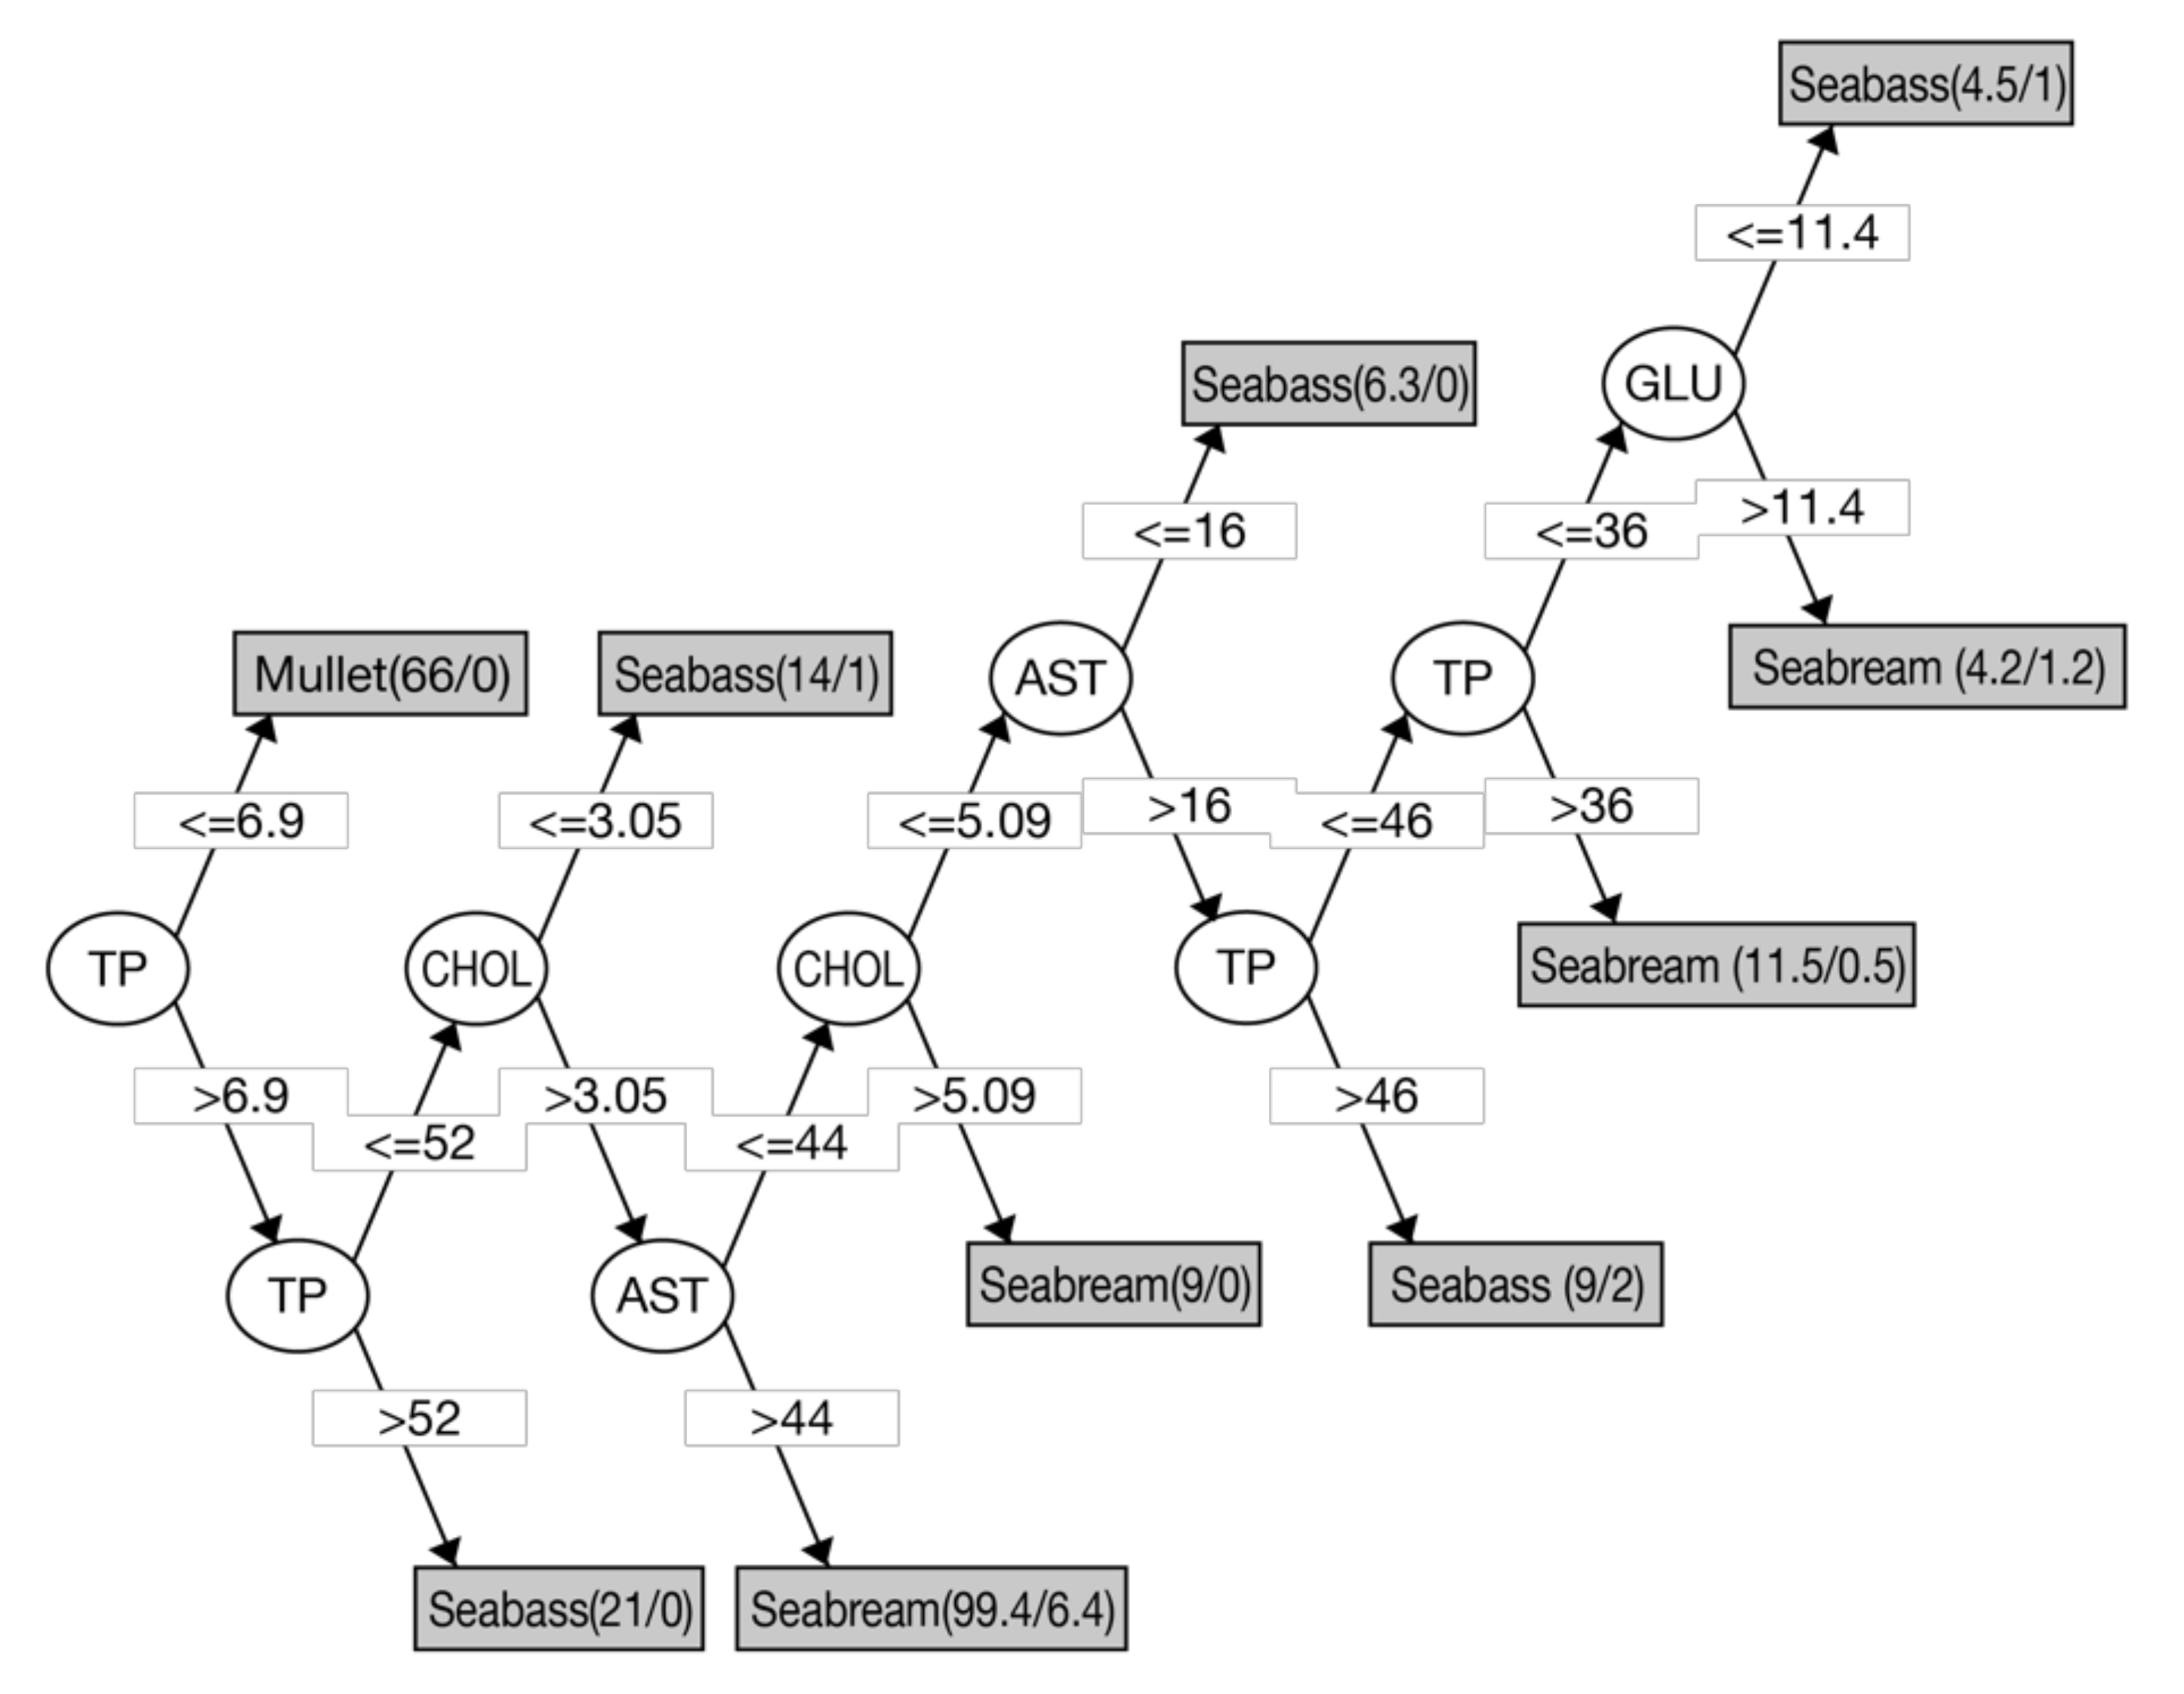
  100. Coz-Rakovac, R.; Topic Popovic, N.; Smuc, T.; Strunjak-Perovic, I.; Jadan, M. Classification accuracy of algorithms for blood chemistry data for three aquaculture-affected marine fish species. Fish Physiol. Biochem. 2009, 35, 641–647. [Google Scholar] [CrossRef] [PubMed]
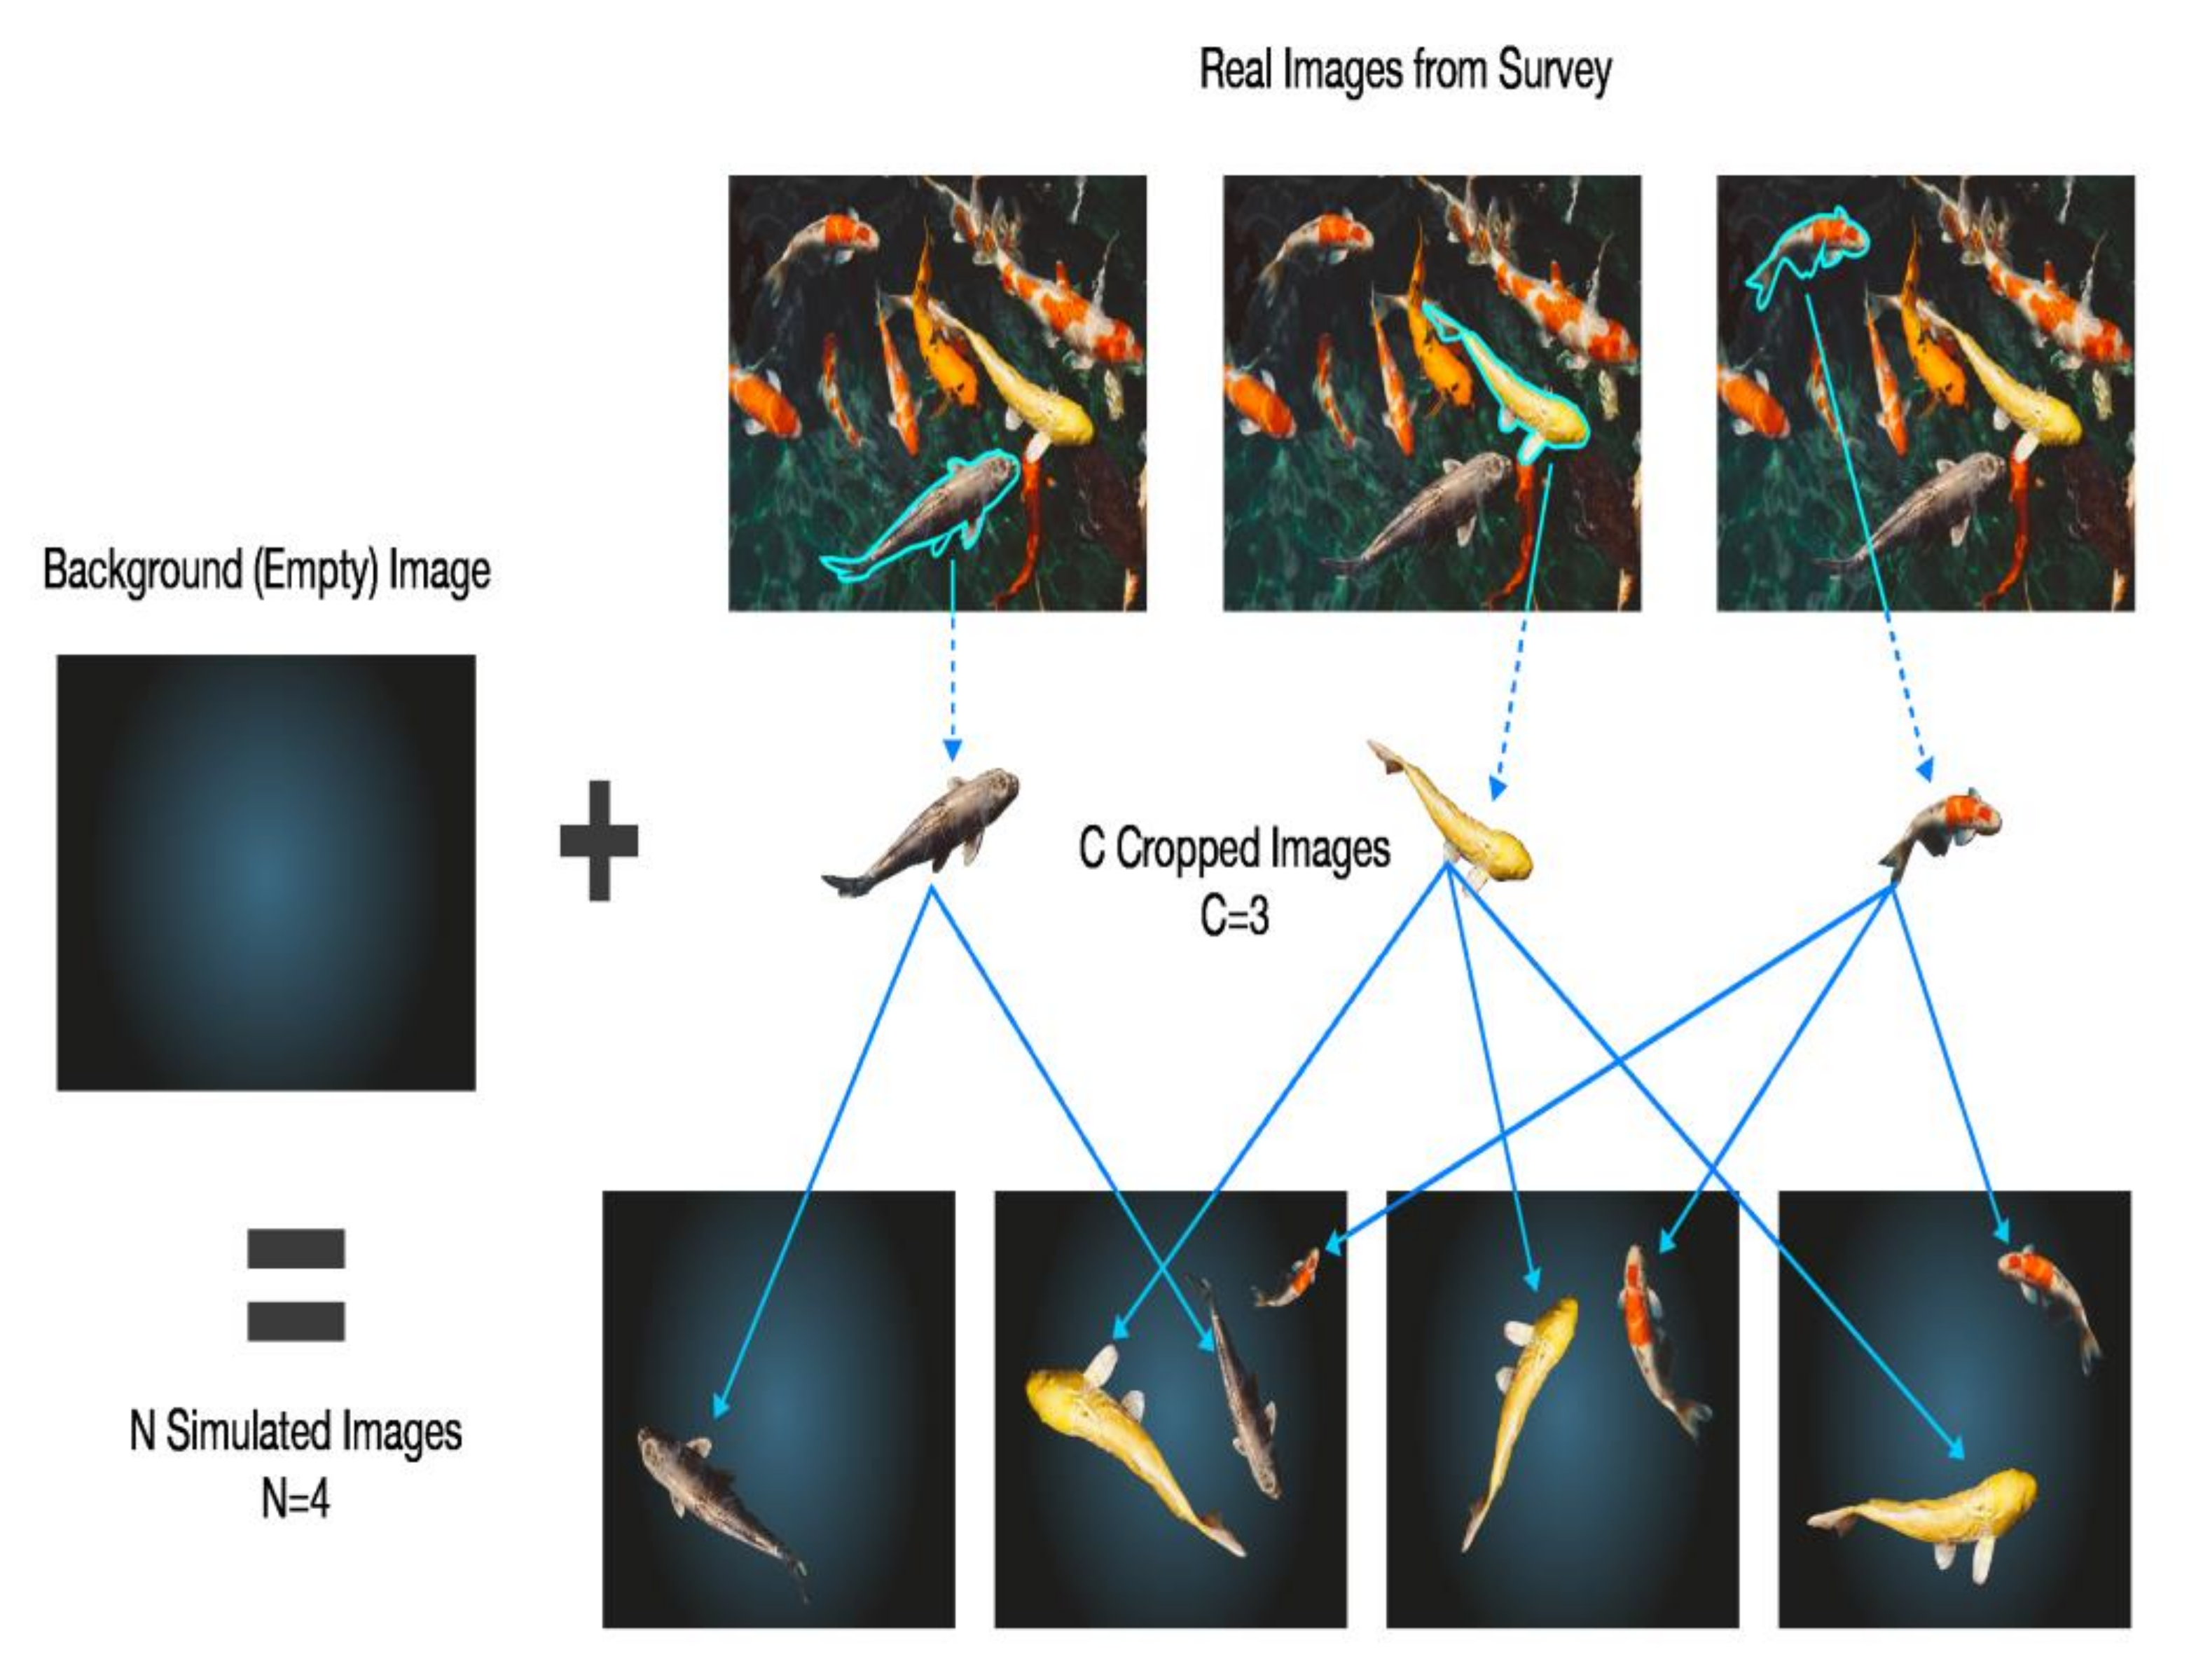
  101. Allken, V.; Handegard, N.O.; Rosen, S.; Schreyeck, T.; Mahiout, T.; Malde, K. Fish species identification using a convolutional neural network trained on synthetic data. ICES J. Mar. Sci. 2019, 76, 342–349. [Google Scholar] [CrossRef]
Figure 1. Concept diagram of smart aquaculture system.
Electronics 10 02882 g001
Figure 2. Overview of smart aquaculture sensors and monitoring systems.
Electronics 10 02882 g002
Figure 3. Internet of Things (IoT) Aquaculture System.
Electronics 10 02882 g003
Figure 4. IoT monitoring water quality system block diagram.
Electronics 10 02882 g004
Figure 5. Block diagram complete system of IoT application.
Electronics 10 02882 g005
Figure 6. The relationship between the four types of machine learning and common applications.
Electronics 10 02882 g006
Figure 7. Machine learning tasks and main algorithms.
Electronics 10 02882 g007
Figure 8. Overview of application of machine learning in aquaculture systems.
Electronics 10 02882 g008
Figure 9. Schematic diagram of the CatchMeter system.
Electronics 10 02882 g009
Figure 10. Flow chart showing basic step in the fish analysis software.
Electronics 10 02882 g010
Figure 11. Flow chart to sort fish in MATLAB environment.
Electronics 10 02882 g011
Figure 12. Flow chart of FLUDI framework.
Electronics 10 02882 g012
Figure 13. Conceptual diagram of a database management system for fishery resources management.
Electronics 10 02882 g013
Figure 14. Sort by: original form, R, G, and B color model, one color channel median filter, Cb image component, Grayscale image, Noise reduction.
Electronics 10 02882 g014
Figure 15. Outline of the procedures employed to segment fish.
Electronics 10 02882 g015
Figure 16. Structure of weight grader.
Electronics 10 02882 g016
Figure 17. Schematic diagram of the fish grader for measurement and control.
Electronics 10 02882 g017
Figure 18. Proposed methodology.
Electronics 10 02882 g018
Figure 19. Complete process of Principal Component Analysis (PCA).
Electronics 10 02882 g019
Figure 20. Complete process of K-means clustering.
Electronics 10 02882 g020
Figure 21. Block diagram of proposed methodology.
Electronics 10 02882 g021
Figure 22. Proposed framework.
Electronics 10 02882 g022
Figure 23. System architecture.
Electronics 10 02882 g023
Figure 24. Various appearances of image processing.
Electronics 10 02882 g024
Figure 25. Illustrates the methodology of machine learning approach.
Electronics 10 02882 g025
Figure 26. Illustrates the image acquisition of capturing the larvae image from hatcheries.
Electronics 10 02882 g026
Figure 27. Flow chart of counting strategy.
Electronics 10 02882 g027
Figure 28. (ae) The underwater imaging platform and the aquaculture site.
Electronics 10 02882 g028
Figure 29. Data acquisition diagram.
Electronics 10 02882 g029
Figure 30. Decision-tree model based on biochemistry data for three fish species.
Electronics 10 02882 g030
Figure 31. To generate images that realistically resemble Deep Vision photographs.
Electronics 10 02882 g031
Publisher’s Note: MDPI stays neutral with regard to jurisdictional claims in published maps and institutional affiliations.

