Article

A Convolutional Neural Network-Based End-to-End Self-Driving Using LiDAR and Camera Fusion: Analysis Perspectives in a Real-World Environment

1
Department of Future Convergence Technology, Soonchunhyang University, Asan 31538, Korea
2
Machine Intelligence Laboratory, Department of Smart Automobile, Soonchunhyang University, Asan 31538, Korea
*
Author to whom correspondence should be addressed.
Electronics 2021, 10(21), 2608; https://doi.org/10.3390/electronics10212608
Submission received: 8 August 2021 / Revised: 20 October 2021 / Accepted: 22 October 2021 / Published: 26 October 2021
(This article belongs to the Special Issue AI-Based Autonomous Driving System)

Abstract

:
In this paper, we develop end-to-end autonomous driving based on a 2D LiDAR sensor and camera sensor that predict the control value of the vehicle from the input data, instead of modeling rule-based autonomous driving. Different from many studies utilizing simulated data, we created an end-to-end autonomous driving algorithm with data obtained from real driving and analyzing the performance of our proposed algorithm. Based on the data obtained from an actual urban driving environment, end-to-end autonomous driving was possible in an informal environment such as a traffic signal by predicting the vehicle control value based on a convolution neural network. In addition, this paper solves the data imbalance problem by eliminating redundant data for each frame during stopping and driving in the driving environment so we can improve the performance of self-driving. Finally, we verified through the activation map how the network predicts the vertical and horizontal control values by recognizing the traffic facilities in the driving environment. Experiments and analysis will be shown to show the validity of the proposed algorithm.

1. Introduction

A self-driving car is a system that recognizes the driving environment, generates the path, and drives the vehicle itself by utilizing environmental awareness sensors such as camera, radar, LiDAR, and GPS. Self-driving cars generally consist of three sub-systems of recognition, decision, and control, such as human driving, and each sub-system serves to replace the driver [1].
Driving environment recognition serves as a driving environment dynamic, static object detection, lane detection, and vehicle location estimation based on sensors that can obtain information about the driving environment, and the decision to determine the vehicle trajectory, such as the creation and avoidance of routes to the destination [2]. Longitudinal and lateral controls are performed to reliably drive the target control values of the vehicle determined by recognition and decision [3]. The general self-driving developed separately for each module can easily debug and troubleshoot in the event of a defect or abnormal situation.
However, in the case of autonomous driving research, there are some development restrictions in the actual complex driving environment [4,5]. Autonomous driving occurs not only in the highway environment but also in complex urban areas, with various variables such as traffic lights, surrounding vehicles, motorcycles, pedestrians, road structures, and unpredictable conditions, and recognizing various objects in these complex road environments is still a difficult problem [6,7,8,9]. In addition, there are many areas that have not yet been resolved to develop an optimal decision algorithm considering all these complex environments. In other words, the conventional planning method, a rule-based approach, recognizes all obstacles affecting safe driving and requires accurate situational decisions that make it difficult to consider all possible situations on the road.
Unlike previous studies, which consist of perception, decision, and control, we proposed a convolutional neural network (CNN) that provides the target longitudinal/transverse speed of the vehicle as output with real-world LiDAR and camera data as inputs. Our proposed method fully utilized a CNN to send out output data directly from input data. Unlike the previous algorithm that was only laterally controlled using an end-to-end algorithm based on camera [10], our proposed algorithm simultaneously performed longitudinal and lateral control using a camera and LiDAR sensor that can provide a depth value. The output of our proposed network was the vehicle longitudinal/lateral speed targets for 250, 500, 750, 1000, and 1250 ms from the present time. Additionally, different from many previous end-to-end self-driving, we proposed end-to-end self-driving that complies with road traffic laws by acquiring real-world data in urban areas in complex environments such as traffic lights. After training the proposed algorithm with the real-road database, E2E autonomous driving was confirmed in complex urban environments, such as traffic lights and intersections, and we used feature maps to check the validity of the proposed algorithm. This paper is structured as follows. Section 2 explains related works, how to build our experimental environments, and the data set and convolutional neural network. The results and analysis of our results are shown in Section 3 and Section 4, respectively, and Section 5 reveals the conclusion and future research.

2. Materials and Methods

2.1. Preliminaries

2.1.1. Convolutional Neural Network

With the invention of Alexnet in 2012, many deep learning-based approaches such as CNN have been applied to computer vision [11]. CNN has two parts, a feature extractor, consisting of the convolution layer and pooling layer, and a fully connected layer that performs classification and regression. Previous machine learning-based computer vision algorithms extracted features within an image using HOG and SIFT, and the results were obtained by performing algorithms such as Support Vector Machines with the extracted features, while CNN extracts the features through learning of the convolution layer and achieves the results through fully connected layers. Therefore, CNN is also called E2E learning technology and it is being used in various computer vision areas such as object detection, tracking, and semantic segmentation [12].

2.1.2. End-to-End Self-Driving

Many studies have been conducted on E2E autonomous driving, which uses CNN’s E2E characteristics fully to calculate the final output speed from input data without detailed algorithms to construct autonomous driving. Mariusz et al. proposed a CNN structure called PilotNet, the start of the CNN-based E2E autonomous driving. PilotNet uses three camera sensors mounted on the front of the vehicle, and it performs lateral control of the vehicle [10]. However, PilotNet implemented only the end-to-end self-driving function of lane keeping using only monocular cameras, and maintaining inter-vehicle distance used a classical control method, not a learning method. Chen et al. proposed a study that can use distance information in autonomous driving to effectively learn drivers’ driving patterns and produce a deep learning model that enables stable longitudinal lateral control [13]. They unveiled a data set that includes a LiDAR sensor, camera sensor, and a label for longitudinal/lateral control. Based on this data set, a DNN + LSTM deep learning model that enables longitudinal control using the distance information from the LiDAR sensor and image information from the camera sensor was constructed. However, to utilize 3D Point Cloud data, a deep learning network using data from a LiDAR sensor called Point Cloud Mapping or PointNet was additionally used, which required a large amount of network parameters [14]. Navarro et al. proposed sensor fusion-based E2E self-driving using real-world acquired data [15], but they did not analyze how to work their algorithm in real-world situations such as an urban traffic signal. Huch et al. suggested V2X-based E2E self-driving for platooning [16]. Prashanth et al. proposed JacintoNet, which was implemented in Texas Instruments (TI) TDA2x System on Chip, for real-time working [17]. However, it utilized simulation data and implemented autonomous driving at only lane keeping. Yu et al. proposed end-to-end self-driving capable of longitudinal/lateral control using a monocular camera [18]. They acquired large-scale data sets and developed end-to-end self-driving in a real-road environment, but had limitations in realizing self-driving in a simple environment such as a highway. Sallab et al. proposed a reinforcement learning-based end-to-end self-driving algorithm using monocamera, but it was applied only in a lane-keeping system [19]. Table 1 shows the comparison of previous end-to-end self-driving approaches.

2.1.3. Explainable End-to-End Self-Driving System

Zhou et al. introduced a class activation map to analyze the region within the image that influenced the results when images were classified [20]. The class activation map interprets the figure for the weight value of the last fully connected layer as important, representing the most influential part of the image with respect to the results of the network.
Mariusz et al. expanded on Zhou’s paper. They proposed an explanation of what part of the end-to-end self-driving model focuses on the input driving image to conduct lateral control judgment, which is similar to the method proposed by Zhou et al., where the end-to-end self-driving model is the focus and responds accordingly. The network concentrates on the road environment, although there was a reliability issue because E2E autonomous driving is not accountable [21].

2.2. Experiemental Setup

In this paper, we generated the data set using information from the environment-aware sensors and in-vehicle sensors mounted on the vehicle and we conducted training on the E2E self-driving network using them.
The hardware development environment used in this paper is shown in Figure 1. We used Hyundai Motor Ionic EV vehicles equipped with one camera and two LiDAR sensors, a VCU that controls information about the vehicle, and a workstation for E2E self-driving algorithms and other data-logging programs.
The SW development environment was set up as below, CUDA 9.1 and cuDNN 7.1 in Ubuntu 16.04 LTS and Python with Keras 2.2.1. The details about the HW setup are shown in Table 2.
Additionally, we used the IBEO’s LUX2010 LiDAR and Point Grey’s Blackfly PoEGigE camera. Table 3 represents the detail specifications of each sensor used.

2.3. Data Set

For this study, we constructed about 150,000 frames of a data set from camera and LiDAR sensors and vehicle information by driving 300 km in Seoul and Gyeonggi-do, Korea. While analyzing the data, we found that the continuity of the frame varied depending on the speed. Namely, as you can see in Figure 2, the characteristics of consecutive images varied with the vehicle’s speed. The constructed database had less variation in images per frame at low speeds, and more variation in images per frame at high-speed intervals.
We summarized the amount of data for each vehicle speed section in Figure 3. We identified the acquired 2D LiDAR and camera data set with the speed of the vehicle, and we found the number of each data as vehicle speed, as shown in Figure 3. These unbalanced data were due to the duplication of the same data acquired at a standstill at low speed and we needed to eliminate these duplication data. Namely, similar image data were acquired in succession when the vehicle was stationary or low-speed driving, and data with significant changes between frames were acquired when high-speed driving.
Thus, in this paper, data imbalances with vehicle speed were adjusted using down-sampling techniques. We did down-sampling with the amount of data in the 1030-kph section with the fewest data. Since it is well known that such random sampling can generally maintain the distribution of original data, we did randomly extract down-sampling at 21,426 frames (amount of data in the 10–30-kph range) from data in each vehicle speed range. However, if we did down-sampling of 0–10-kph data, the image data representing different situations may be less because of multiple overlapping frames. Consequently, that number of real, meaningful data on the network training was insufficient. Therefore, at speeds less than 10 kph, we did not do down-sampling and utilized it for network training as the number of original data. Finally, the composition of the data utilized for the training, validation, and testing of the neural network model is shown in Table 4.

2.4. Convolutional Neural Network for End-to-End Self-Driving

In this paper, instead of the 3D LiDAR used in Chen et al. [13], we proposed an E2E self-driving algorithm based on the CNN that predicts the longitudinal and lateral control values of vehicles by training point cloud data acquired from 2D LiDAR sensors and image data acquired from cameras. Figure 4 represents the flow chart of the proposed algorithm. CNN, which performs E2E self-driving, uses camera and LiDAR data as inputs and result in vehicle speed and angle as outputs, and updates weight/bias of CNN by comparing them with data driven by humans.

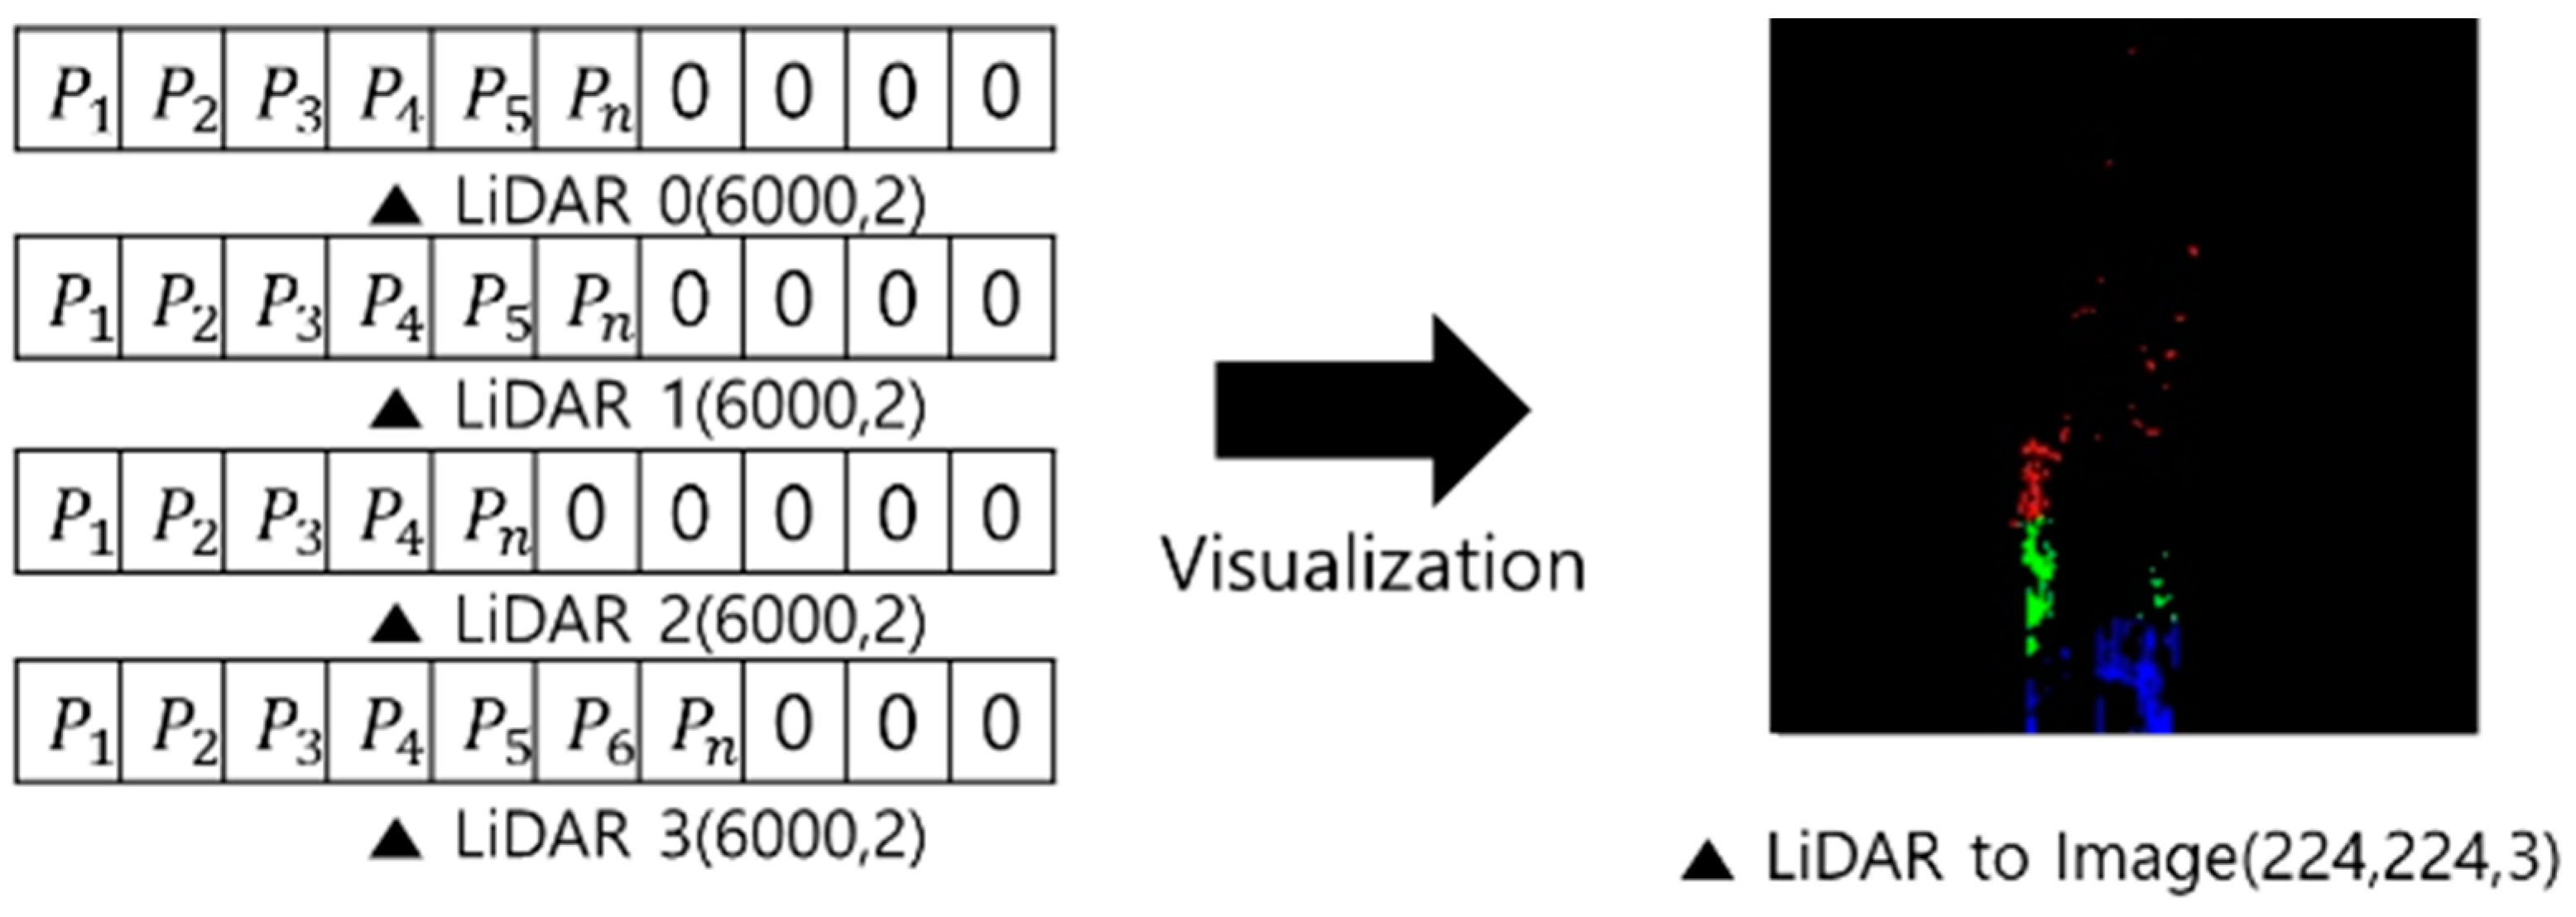
2.4.1. Data Preprocessing

We used a camera and LiDAR sensors to construct an E2E self-driving model. In order to use two-sensor data for our proposed algorithm, we needed to convert original sensor data to suit the proposed network structure. Figure 5 represents the data preprocessing process. Each bit data was pre-processed into an appropriate form for the system using resizing, mapping, and so on.
First, image data from monocular cameras acquired in the driving environment were resized from 640 × 900 to 299 × 299 resolution for use in pre-trained models, Inception v3. In this paper, we utilized a size of 299 × 299, which is larger than the 224 × 224 size used in a general CNN pre-trained model, to ensure that traffic information, such as traffic lights, can be fully reflected in the learning, depending on the resolution.
Then, we encoded point cloud data in the driving environment acquired from the LiDAR sensor into an image form with three channels in two dimensions, utilizing it as training data from CNN. Different from many LiDARs, Lux2010 LiDAR gave us 2D information instead of 3D information, and we used imagenet-based CNN. Equation (1) indicates how point cloud data acquired from 2D LiDAR sensors were transformed into RGB channels by distance.
Here, P x   and   P y represent the lateral and longitude coordinates of the point cloud data from the vehicle, respectively. The distance was calculated using Equation (1), isolated into three RGB channels, and the proportional values according to the distance within the RGB channel were substituted.
Distance = P x 2 + P y 2
if   Distance < 20 : C h a n n e l B l u e [ P x ] [ P y ] = 255 20 × D i s t a n c e otherwise ,   if   Distance < 40 : C h a n n e l G r e e n [ P x ] [ P y ] = 255 40 × D i s t a n c e otherwise : C h a n n e l R e d [ P x ] [ P y ] = m i n ( 255 , 255 60 × D i s t a n c e )
Figure 6 shows the encoding of the point cloud according to the method used in Equation (1). It was resized to 224 × 224 and used as input data for the pre-trained network, ResNet50.
Finally, we constructed a label for training the vehicle’s longitudinal/lateral control values based on data acquired from 2D LiDAR sensors and front camera sensors. To train the vehicle control value, which is the output of E2E self-driving, the label utilized the heading angle and the velocity, which represent the lateral and longitudinal variations of the vehicle’s information, respectively. It also configured the label data in the 1 × 10 vector format for 250-ms to 1250-ms intervals in 250 ms to predict future values and current control values. The label data after the five frames were determined by the actual driving value of the person between the current frame and five frames after.

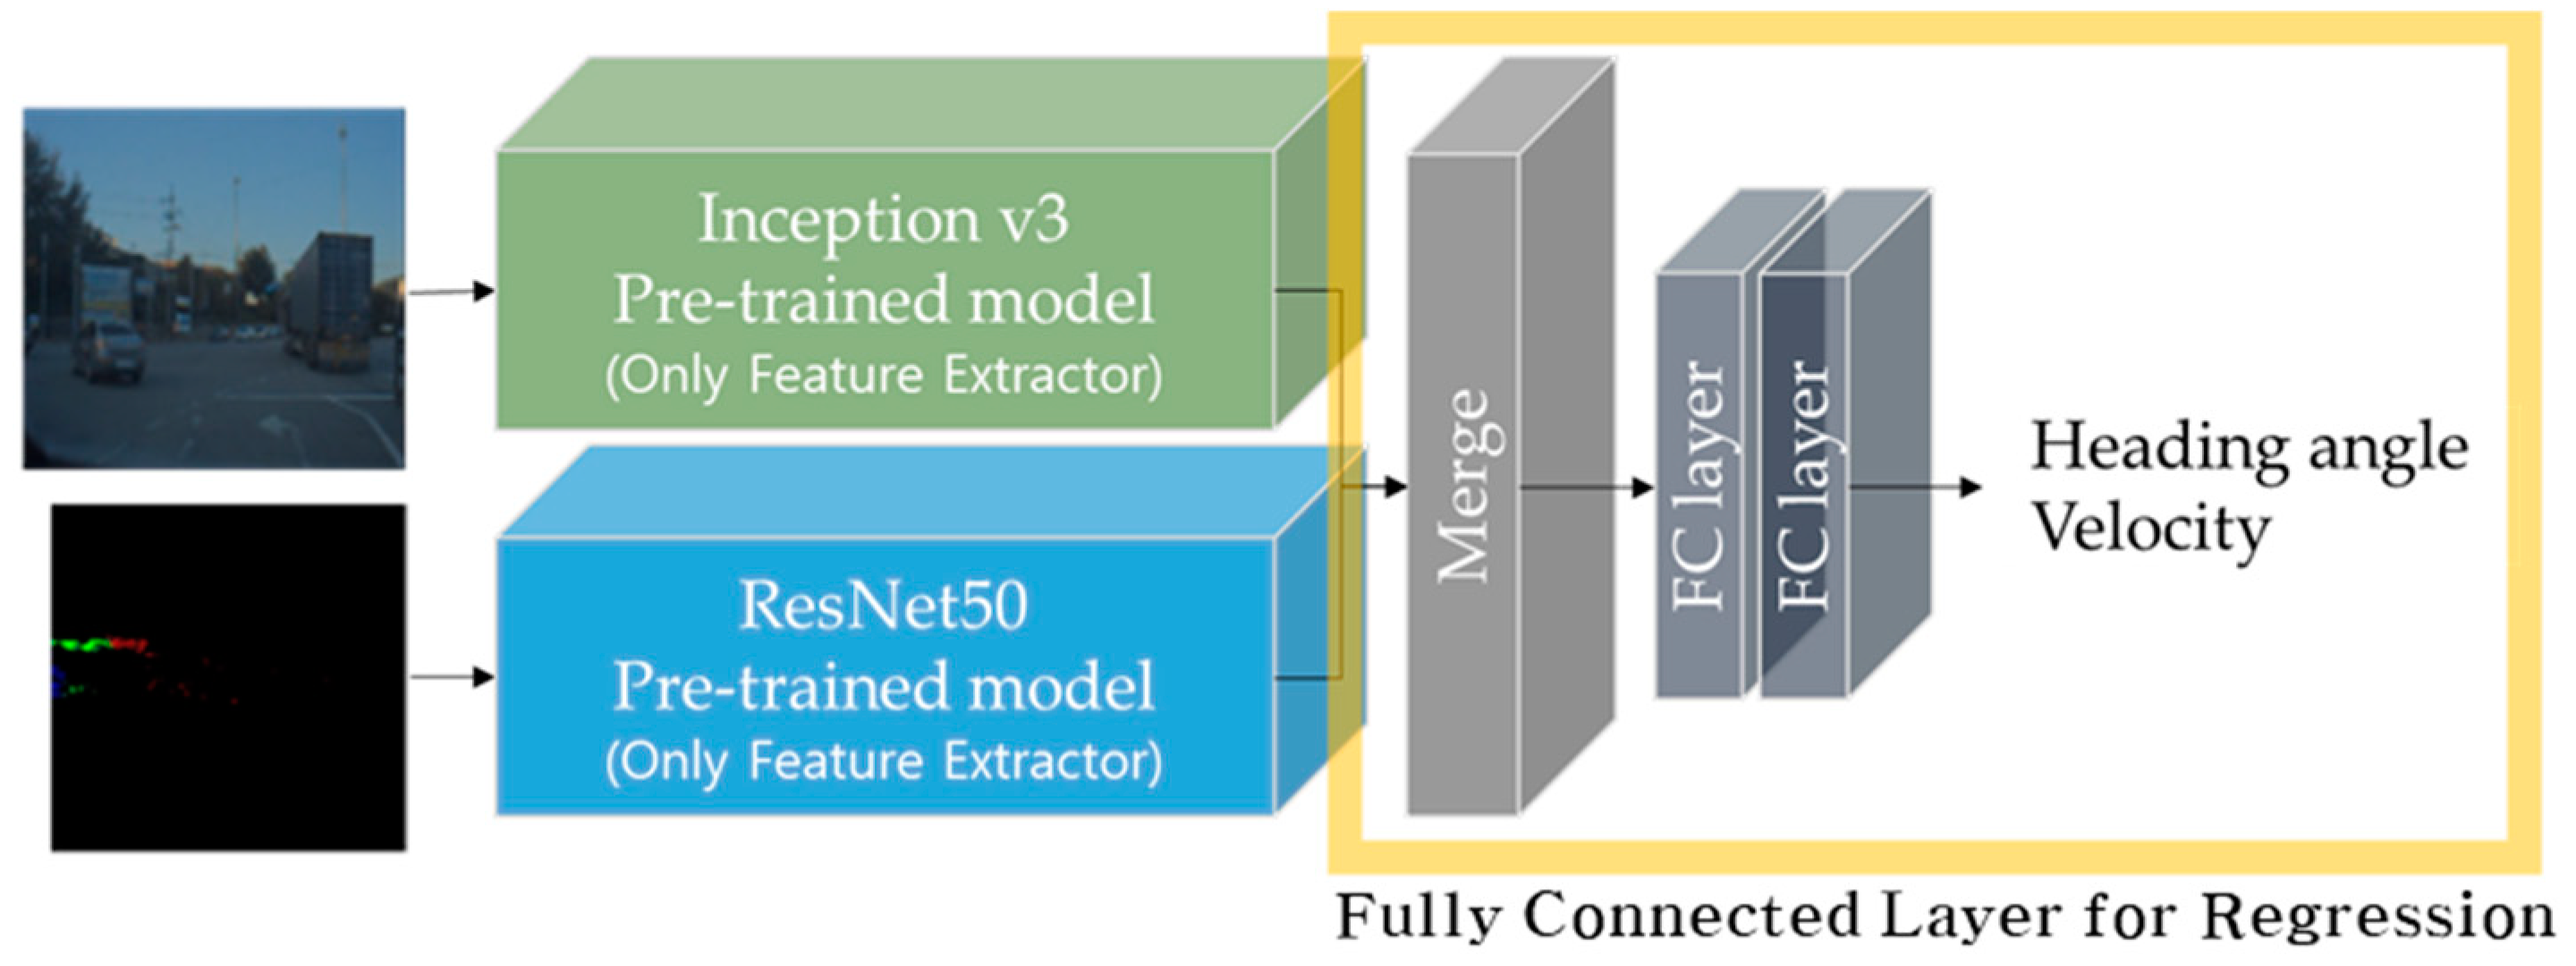
2.4.2. Proposed Network Architecture
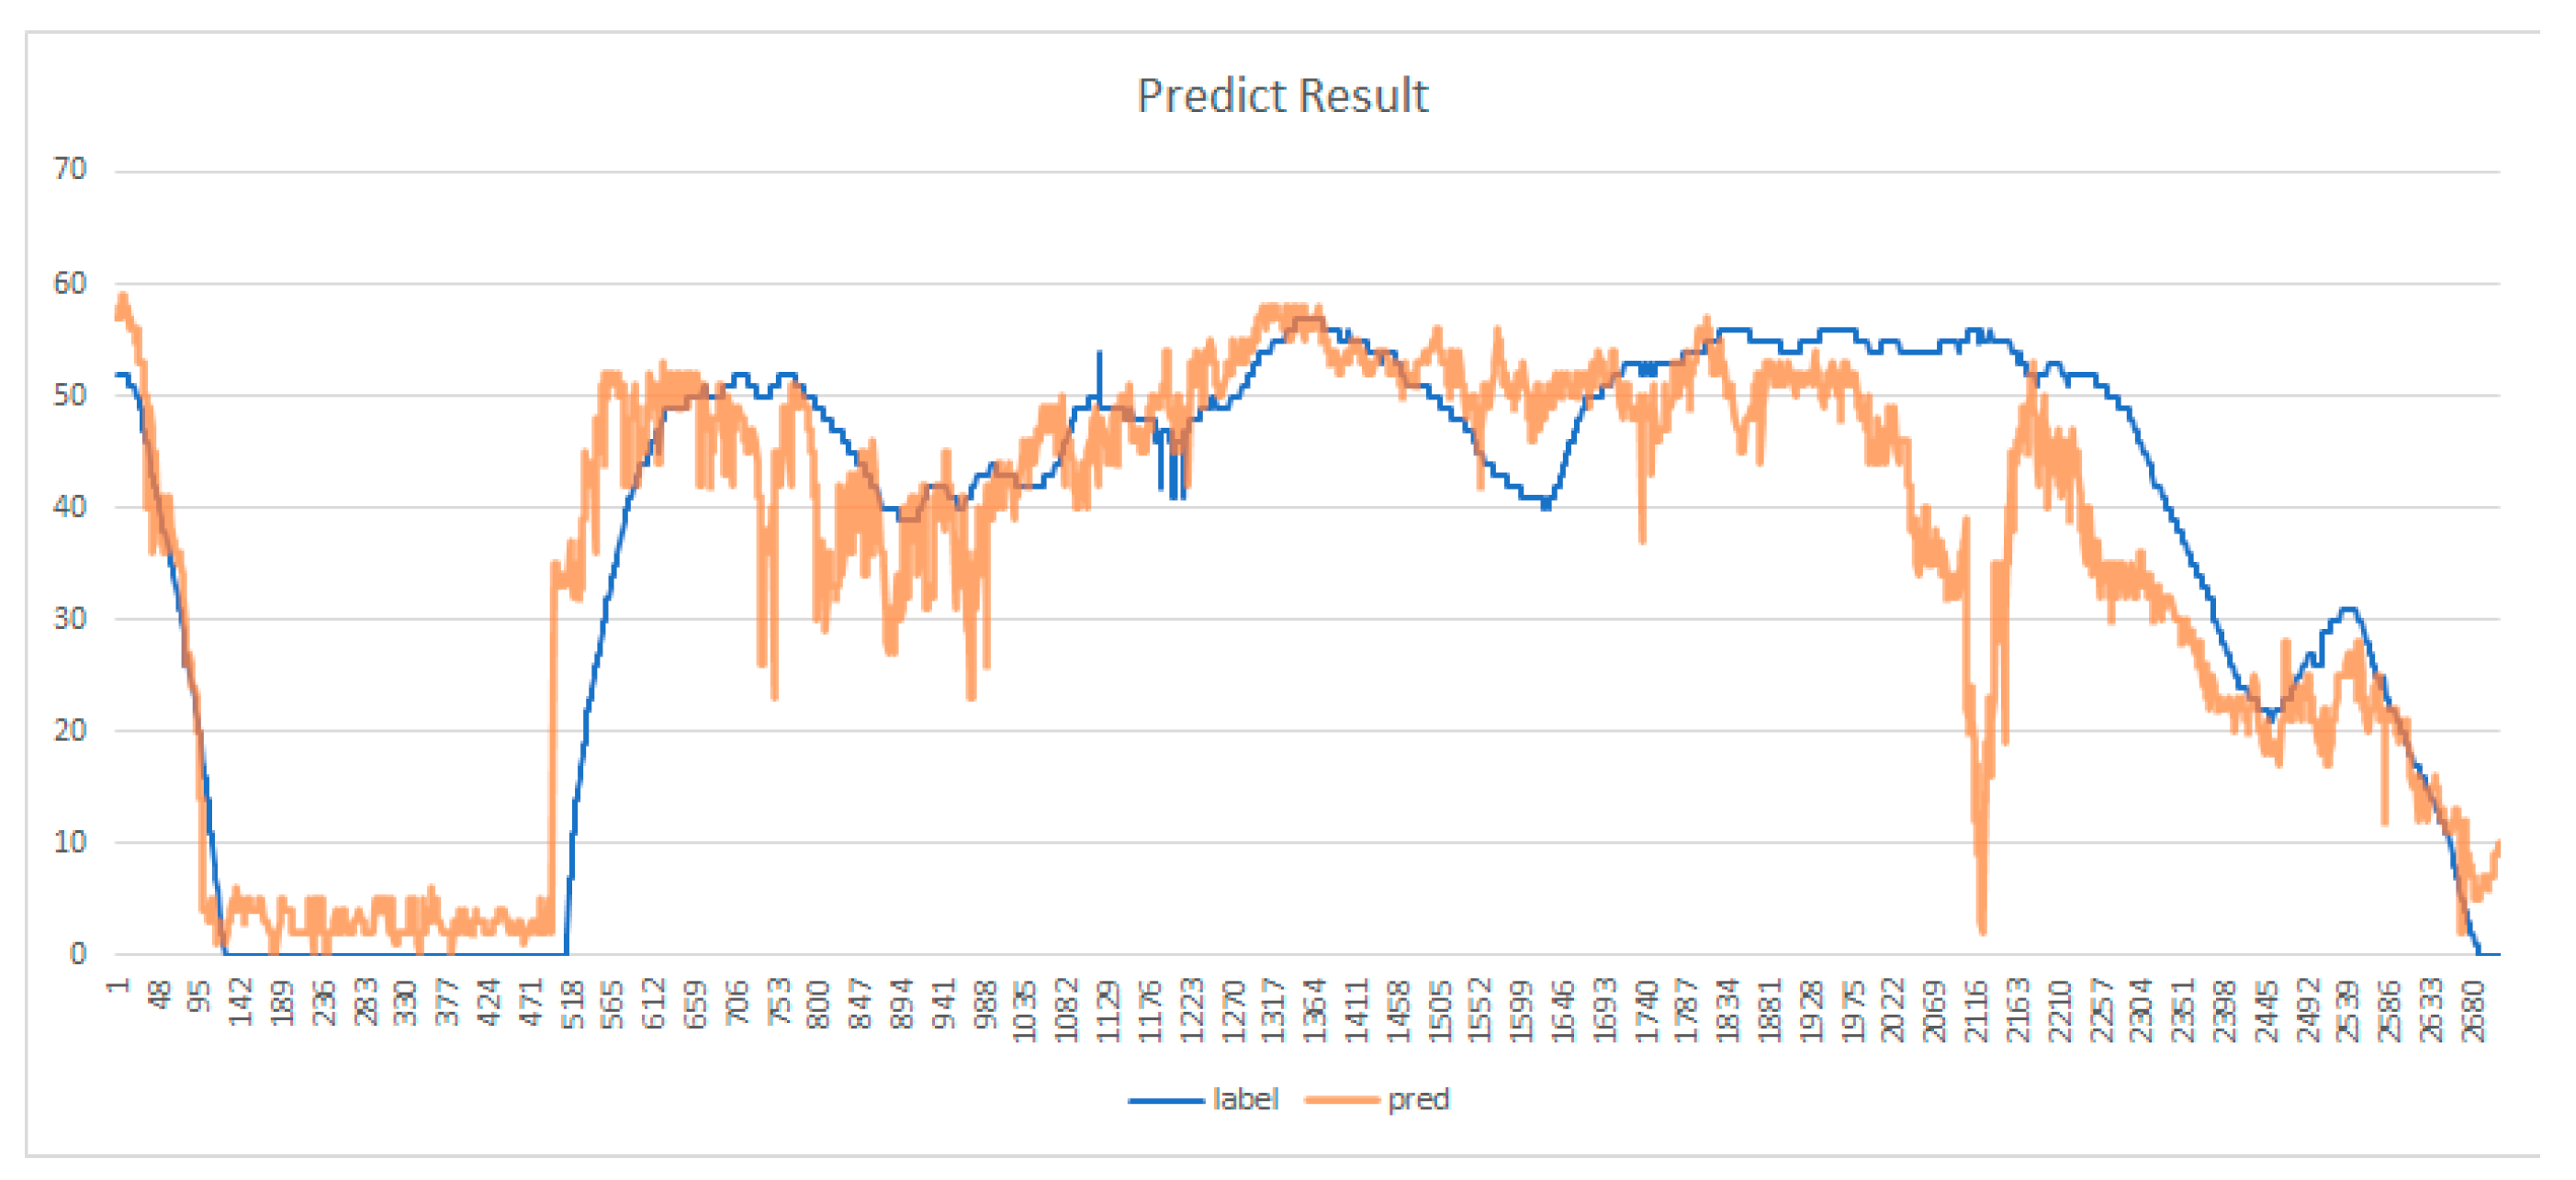
The proposed E2E self-driving network consisted of an input structure consisting of two separate branches: a 299 × 299-size image acquired from a camera sensor and an image of 224 × 224 size encoded by a preprocessing algorithm. The Inception V3 [22] model was used to utilize 299 × 299 images acquired from camera sensors without changing the size in the pre-trained model, and Resnet50 [23] was used for 224 × 224 LiDAR images. Figure 7 represents the Network Architecture used for our proposed algorithm.
Each feature extraction layer was extracted from camera and LiDAR data using the feature extraction layer of each pre-trained model (Inception v3, Resnet50), and then these two kinds of features were concatenated for combining. The combined features consisted of a regression layer that predicted the velocity and angle we wanted through a fully connected layer. The details of the fully connected layers are shown in Table 5.

3. Results

We demonstrated the validity of the proposed method using data sets built in Section 2.2 and Section 2.3 on the E2E network architecture proposed in Section 2.4 of this paper. We proceeded with training on the two sets of data, original and down-sampling data, to demonstrate the effectiveness of down-sampling of unbalanced data. Quantitative performance indicators for the predicted results were derived through Expression (2). The indicator showed the difference between the data driven by a person and the proposed method. Because the criterion of accurate driving was ambiguous, this paper compared the differences between human driving data and the proposed E2E algorithm.
G a p   r a t e = A b s ( H u m a n   d r i v i n g   l a b e l P r e d i c t i o n ) N u m   o f   d a t a
Table 6 and Table 7 are network prediction results learned with the original data set and the down-sampling data set for the same test data. The prediction performance was verified by dividing the situation into low- (<10 kph) and high-speed (≥10 kph) sections according to the vehicle velocity, and the heading angle was verified by dividing the situation into a straight (<5°) and curved road ( 5°).
Table 8 shows the estimation performance differences of the E2E self-driving model in the low-speed section between the original data set and the down-sampling data set. In the low-speed section, each frame’s velocities improved performance as a result of learning with the down-sampling data.
To confirm the stable operation of the proposed algorithm, we compared the speed at which a person drives with the output of the E2E self-driving model for one driving scenario among test data. The comparison results are shown in Figure 8.

4. Discussion

As we mentioned in Section 3, we defined and used the gap rate to represent the quantitative performance; however, a large gap rate does not mean that the E2E self-driving drive was wrong. If the estimation value of the E2E self-driving was within the permitted driving range on the actual road, it was a correct operation, even if it differed from the actual person’s driving. However, the gap rate was used to verify that the actual learning was done well in this paper. Therefore, we further checked the correct behavior of E2E self-driving using the activation map.
The advantage of E2E self-driving is that it performs autonomous driving without intermediate processing, using only input data, unlike recognizing all objects, and generating a driving path in conventional rule-based self-driving. To check the behavior of this E2E self-driving, we visualized the area that was activated by the proposed CNN while driving using the activation map. Figure 9 is an activation map resulting from a prediction result of the learned End-to-End self-driving model. The left side of each figure is the activation map of the image data, and the right side is the activation map of the LiDAR data.
Activation maps are expressed for a total of four situations: straight driving situation, driving situation with high curvature, stopping situation without intersection forward vehicles, and stopping situation with intersection forward vehicles. As shown in Figure 9a,b, in the case of driving in a straight section, we confirmed that the center of the road in the camera image and the forward portion of the LiDAR sensor were active in the network. If there were no forward vehicles in the intersection section and only traffic lights existed, the activation map was concentrated in the area of the traffic lights in Figure 9c,d. As a result of verifying the activation map of the CNN, we checked that the proposed algorithm was effective for self-driving.
In addition, as shown in Figure 10, it was confirmed that the speed of E2E self-driving did not show much difference from the output speed of human driving, and it was confirmed that the proposed algorithm drove safely in general road conditions. While analyzing Figure 8, interestingly the data between 1975 and 2251 frames showed a large difference between the driver and CNN results. The above data are from situations when the traffic light changed from green to orange, as shown in the Figure 10. When the driver met the traffic signal-changing situation, it was confirmed that human drivers drove without slowing down, while the proposed algorithm reduced the speed as it considered traffic lights. This does not mean that CNN is safer, but that the proposed algorithm can confirm that it operates by recognizing traffic lights. In other words, E2E autonomous driving is not only possible to control the longitudinal/lateral direction that maintains the distance and lane from the vehicle, but also to operate in compliance with other traffic laws, such as traffic signal and speed limit.

5. Conclusions

In this paper, we proposed E2E autonomous driving in general urban environments using 2D LiDAR and camera sensors’ data. Our proposed method could drive autonomously using 2D LiDAR sensors to train in-depth information about the driving environment and a camera sensor to train image data to recognize the driving environment information such as a traffic signal. Unlike previous studies, we implemented an algorithm of end-to-end self-driving that can maintain road traffic by acquiring actual road data. Namely, our proposed algorithm could (1) enable longitudinal/lateral self-driving with an E2E method and (2) deal with complex situations such as traffic lights in urban areas.
For the quantitative performance evaluation of the model developed of the proposed method, we developed a gap rate that represented the difference between E2E self-driving data and the human driving data. The gap rate was 14.61 kph for the original data set and 5.07 kph for the down-sampling data set. Furthermore, predictions were made after 1250 ms, as well as the values currently needed, to confirm that predictions were possible for future situations.
The data used in this paper included various driving environment situations, such as intersections, stopping traffic lights, and sharp curves, and we validated them using the activation map to check the behavior of E2E autonomous driving in these various environments. In the traffic light and intersection sections, the largest activation was observed near the traffic lights in the input image under stop-and-go conditions. Nevertheless, due to deep learning’s black box nature, the proposed algorithm had a limitation that mathematical analysis was not performed and was proven experimentally.
In the future, more database construction and model configuration will be performed to enable E2E autonomous driving in a wider variety of environments, including more sensor information, such as around-view monitor cameras and map information, and will improve the self-driving model to ensure safe driving to a destination. Additionally, when we acquire data for E2E self-driving, the frame ratio of the camera/LiDAR will be appropriately adjusted according to the situation so that balanced data can be acquired and training can be constructed through it.

Author Contributions

Conceptualization, M.P., H.K. and S.P.; data curation, M.P., H.K. and S.P.; methodology, M.P., H.K. and S.P.; software, M.P. and H.K.; validation, M.P. and H.K.; formal analysis, M.P., H.K. and S.P.; writing—original draft preparation, M.P., H.K. and S.P.; writing—review and editing, S.P.; visualization, M.P., H.K. and S.P.; supervision, S.P.; project administration, S.P.; funding acquisition, S.P. All authors have read and agreed to the published version of the manuscript.

Funding

This works was supported by the National Research Foundation of Korea (NRF) grant funded by the Korea government (MSIP; Ministry of Science, ICT & Future Planning) (NRF-2017RIC1B5018101), Institute for Information & communications Technology Planning&Evaluation (IITP) grant funded by the Korea government(MSIT) (No.2019-0-01343, Regional strategic industry convergence security core talent training business) and Soonchunhyang university research fund.

Data Availability Statement

Data sharing is not applicable to this article.

Conflicts of Interest

The authors declare no conflict of interest.

References

  1. Cho, S.T.; Park, Y.J.; Jung, S. Experimental Setup for Autonomous Navigation of Robotic Vehicle for University Campus. J. Korean Inst. Intell. Syst. 2016, 26, 105–112. [Google Scholar]
  2. Jo, H.J.; Kwak, S.W.; Yang, J.-M. Vehicle Localization Using Internal Sensors and Low-Cost GPS for Autonomous Driving. J. Korean Inst. Intell. Syst. 2017, 27, 209–214. [Google Scholar]
  3. Lee, Y.; Cho, E.; Choi, H.; Park, S. A Study on the Obstacle Detection and Path Planning of Automobile Using LiDAR. J. Korean Inst. Intell. Syst. 2019, 29, 30–35. [Google Scholar] [CrossRef]
  4. Chu, K.; Han, J.; Lee, M.; Kim, D.; Jo, K.; Oh, D.; Yoon, E.; Gwak, M.; Han, K.; Lee, D.; et al. Development of an Autonomous Vehicle: A1. Trans. Korean Soc. Automot. Eng. 2011, 19, 146–154. [Google Scholar]
  5. Geng, X.; Liang, H.; Yu, B.; Zhao, P.; He, L.; Huang, R. A Scenario-Adaptive Driving Behavior Prediction Approach to Urban Autonomous Driving. Appl. Sci. 2017, 7, 426. [Google Scholar] [CrossRef]
  6. Park, C.; Kee, S.-C. Implementation of Autonomous Driving System in the Intersection Area Equipped with Traffic Lights. Trans. Korean Soc. Automot. Eng. 2019, 27, 379–387. [Google Scholar] [CrossRef]
  7. Kumar, G.A.; Lee, J.H.; Hwang, J.; Park, J.; Youn, S.H.; Kwon, S. LiDAR and Camera Fusion Approach for Object Distance Estimation in Self-Driving Vehicles. Symmetry 2020, 12, 324. [Google Scholar] [CrossRef] [Green Version]
  8. Hoang, T.M.; Baek, N.R.; Cho, S.W.; Kim, K.W.; Park, K.R. Road Lane Detection Robust to Shadows Based on a Fuzzy System Using a Visible Light Camera Sensor. Sensors 2017, 17, 2475. [Google Scholar] [CrossRef] [PubMed] [Green Version]
  9. Yu, J.; Su, Y.; Liao, Y. The Path Planning of Mobile Robot by Neural Networks and Hierarchical Reinforcement Learning. Front. Neurorobot. 2020, 14, 63. [Google Scholar] [CrossRef] [PubMed]
  10. Bojarski, M.; Del Testa, D.; Dworakowski, D.; Firner, B.; Flepp, B.; Goyal, P.; Jackel, L.D.; Monfort, M.; Muller, U.; Zhang, J.; et al. End to End Learning for Self-Driving Cars. arXiv 2016, arXiv:1604.07316. [Google Scholar]
  11. Schmidhuber, J. Deep learning in neural networks: An overview. Neural Netw. 2015, 61, 85–117. [Google Scholar] [CrossRef] [PubMed] [Green Version]
  12. Krizhevsky, A.; Sutskever, I.; Hinton, G.E. ImageNet Classification with Deep Convolutional Neural Networks. In Proceedings of the 25th International Conference on Neural Information Processing Systems, Toronto, ON, Canada, 3–8 December 2012; pp. 1097–1105. [Google Scholar]
  13. Chen, Y.; Wang, J.; Li, J.; Lu, C.; Luo, Z.; Xue, H.; Wang, C. Lidar-video driving dataset: Learning driving policies effectively. In Proceedings of the IEEE Conference on Computer Vision and Pattern Recognition, Salt Lake City, UT, USA, 18–22 June 2018; pp. 5870–5878. [Google Scholar]
  14. Qi, C.R.; Su, H.; Mo, K.; Guibas, L.J. Pointnet: Deep learning on point sets for 3d classification and segmentation. In Proceedings of the IEEE Conference on Computer Vision and Pattern Recognition, Honolulu, HI, USA, 21–26 July 2017; pp. 652–660. [Google Scholar]
  15. Navarro, P.J.; Miller, L.; Rosique, F.; Fernández-Isla, C.; Gila-Navarro, A. End-to-End Deep Neural Network Architectures for Speed and Steering Wheel Angle Prediction in Autonomous Driving. Electronics 2021, 10, 1266. [Google Scholar] [CrossRef]
  16. Huch, S.; Ongel, A.; Betz, J.; Lienkamp, M. Multi-Task End-to-End Self-Driving Architecture for CAV Platoons. Sensors 2021, 21, 1039. [Google Scholar] [CrossRef] [PubMed]
  17. Prashanth, V.; Soyeb, N.; Mihir, M.; Manu, M.; Pramod, K.S. End to End Learning based Self-Driving using JacintoNet. In Proceedings of the IEEE 8th International Conference on Consumer Electronics, Berlin, Germany, 2–5 September 2018; pp. 1–4. [Google Scholar]
  18. Yu, H.; Yang, S.; Gu, W.; Zhang, S. Baidu driving dataset and end-to-end reactive control model. In Proceedings of the IEEE Intelligent Vehicles Symposium (IV), Los Angeles, CA, USA, 11–14 June 2017; pp. 341–345. [Google Scholar]
  19. Sallab, A.E.; Abdou, M.; Perot, E.; Yogamani, S. End-to-end deep reinforcement learning for lane keeping assist. arXiv 2016, arXiv:1612.04340. [Google Scholar]
  20. Zhou, B.; Khosla, A.; Lapedriza, A.; Oliva, A.; Torralba, A. Learning deep features for discriminative localization. In Proceedings of the IEEE Conference on Computer Vision and Pattern Recognition, Las Vegas, NV, USA, 27–30 June 2016; pp. 2921–2929. [Google Scholar]
  21. Bojarski, M.; Yeres, P.; Choromanska, A.; Choromanski, K.; Firner, B.; Jackel, L.; Muller, U. Explaining how a deep neural network trained with end-to-end learning steers a car. arXiv 2017, arXiv:1704.07911. [Google Scholar]
  22. Szegedy, C.; Vanhoucke, V.; Ioffe, S.; Shlens, J.; Wojna, Z. Rethinking the inception architecture for computer vision. In Proceedings of the IEEE Conference on Computer Vision and Pattern Recognition, Las Vegas, NV, USA, 30 June 2016; pp. 2818–2826. [Google Scholar]
  23. He, K.; Zhang, X.; Ren, S.; Sun, J. Deep residual learning for image Recognition. In Proceedings of the IEEE Conference on Computer Vision and Pattern Recognition, Las Vegas, NV, USA, 27–30 June 2016; pp. 770–778. [Google Scholar]
Figure 1. Autonomous driving platform.
Electronics 10 02608 g001
Figure 2. Image data from each frame.
Electronics 10 02608 g002
Figure 3. Data distribution of each vehicle speed.
Electronics 10 02608 g003
Figure 4. Flow chart of the E2E self-driving system.
Electronics 10 02608 g004
Figure 5. Flow chart of data preprocessing (image, point cloud, vehicle target state).
Electronics 10 02608 g005
Figure 6. Encoding point cloud data to three-channel image data.
Electronics 10 02608 g006
Figure 7. End-to-end self-driving network architecture.
Electronics 10 02608 g007
Figure 8. The comparison results.
Electronics 10 02608 g008
Figure 9. Activation map of end-to-end model prediction results: (a) straight road driving situation; (b) curve road driving situation; (c) stop situation with only traffic lights; (d) stop situation with traffic light and vehicle.
Electronics 10 02608 g009
Figure 10. Traffic Signal Change situation over time: (a) near traffic signal, (b) in front of traffic signal.
Electronics 10 02608 g010
Table 1. Comparison of End-to-End self-driving approaches.
Data Set SensorsControl Target
Mariusz et al. [10]Real worldcameraSteering
Chen et al. [13]Real worldLiDAR, cameraSteering, Speed
Navarro et al. [15]Real worldLiDAR, IMU,
RGB camera, Depth camera,
Steering, Speed
Huch et al. [16]Simulationcamera, V2VSteering
Prashanth et al. [17]SimulationcameraSteering
Yu et al. [18]SimulationcameraSteering, Speed
Sallab et al. [19]Real worldcameraSteering
Table 2. Experiment hardware environment for training and data collection.
ComponentTraining EnvironmentEmbedded PC on Vehicle
CPUIntel Xeon E5Intel i7-6820EQ
GPUNVIDIA GTX 1080TI 2eaNvidia Jetson Xavier
SSD/HDDSSD: 512 GB
HDD: 10 TB
SSD: 250 GB
HDD: 4 TB
RAM64 GB32 GB
Table 3. Sensor specifications.
LiDAR Electronics 10 02608 i001
ModelIBEO LUX2010
Range200 m/560 ft
FOV2 layers: 110°
4 layers: 85°
InterfaceEthernet/CAN/RS232
Camera Electronics 10 02608 i002
ModelBFLY-PGE-23S6C
FOV90°
Sensor format1/1.2″
FPS41
InterfaceGiga Ethernet
Table 4. Data set configuration.
Data SetNumber of Data (Frame)Number of Data (Frame)
With No Down SamplingWith Down Sampling
Training134,20810,6251
Validation70637063
Test46564656
Table 5. Fully Connected Layer Architecture for Regression.
TypeFilters/ActivationSizeOutput
Layer 1ConcatenateMerge 1 × 4096
Layer 2DenseReLU10241024
Layer 3DenseReLU256256
Layer 4DenseReLU128128
Layer 5RegressionLinear1010
Table 6. Experimental results for original data.
Frame1020304050
Time (ms)25050075010001250
Angle < 5°3.833.622.992.832.93
Angle 5.145.225.315.545.62
Speed < 10 kph16.0515.5714.6413.7013.10
Speed 10 kph5.675.735.665.896.11
Table 7. Experimental results for down-sampling data.
Frame1020304050
Time (ms)25050075010001250
Angle < 5°4.073.662.962.933.10
Angle 4.825.435.405.425.83
Speed < 10 kph7.756.294.743.672.90
Speed 10 kph5.985.935.966.066.26
Table 8. Performance difference between down-sampling and normal data in the low-speed section.
Frame1020304050
Time (ms)25050075010001250
Down sampling data7.756.294.743.672.90
Original data16.0515.5714.6413.7013.10
Publisher’s Note: MDPI stays neutral with regard to jurisdictional claims in published maps and institutional affiliations.

