
Cricket Match Analytics Using the Big Data Approach

 ,
,  , , and
Abstract
:1. Introduction
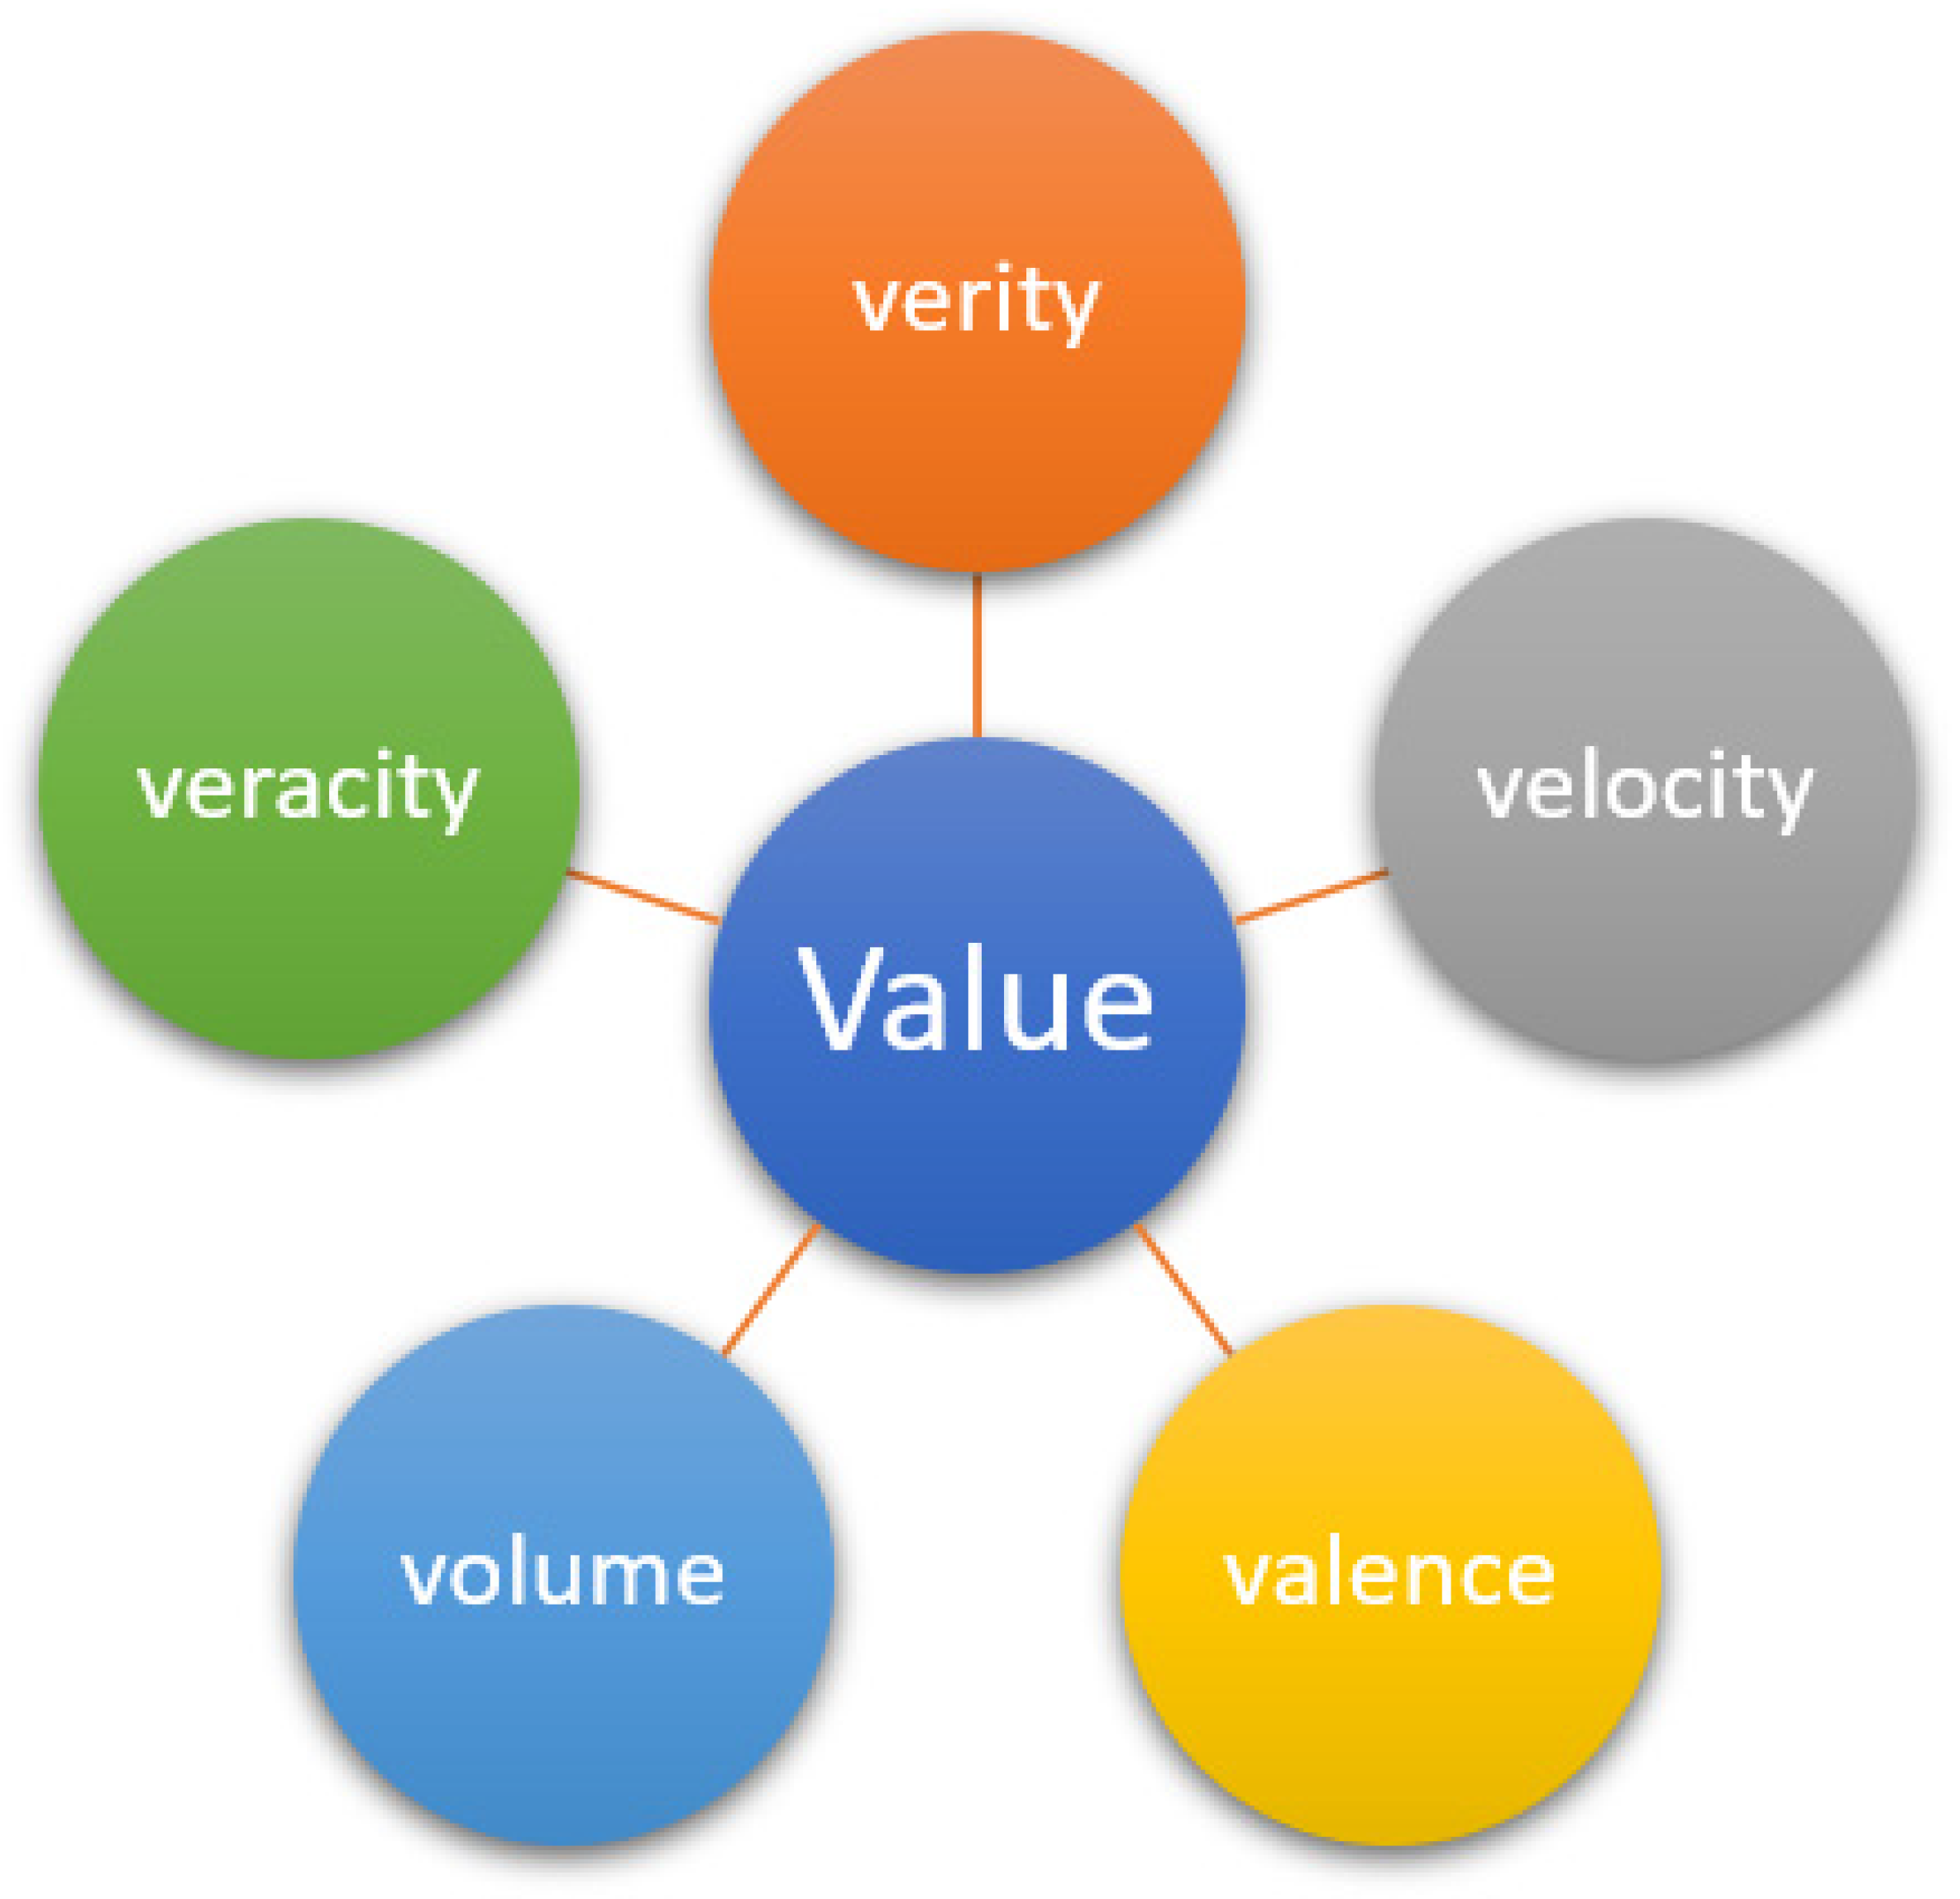
1.1. Big Data
1.2. Machine Learning
1.3. Spark ML
2. Related Work
3. Materials and Methods
3.1. Data Description
3.2. Data Pre-Processing
3.2.1. Removing Unwanted Columns
3.2.2. Assigning Unique Values
3.2.3. One-Hot Encoding
3.2.4. Data Transformation
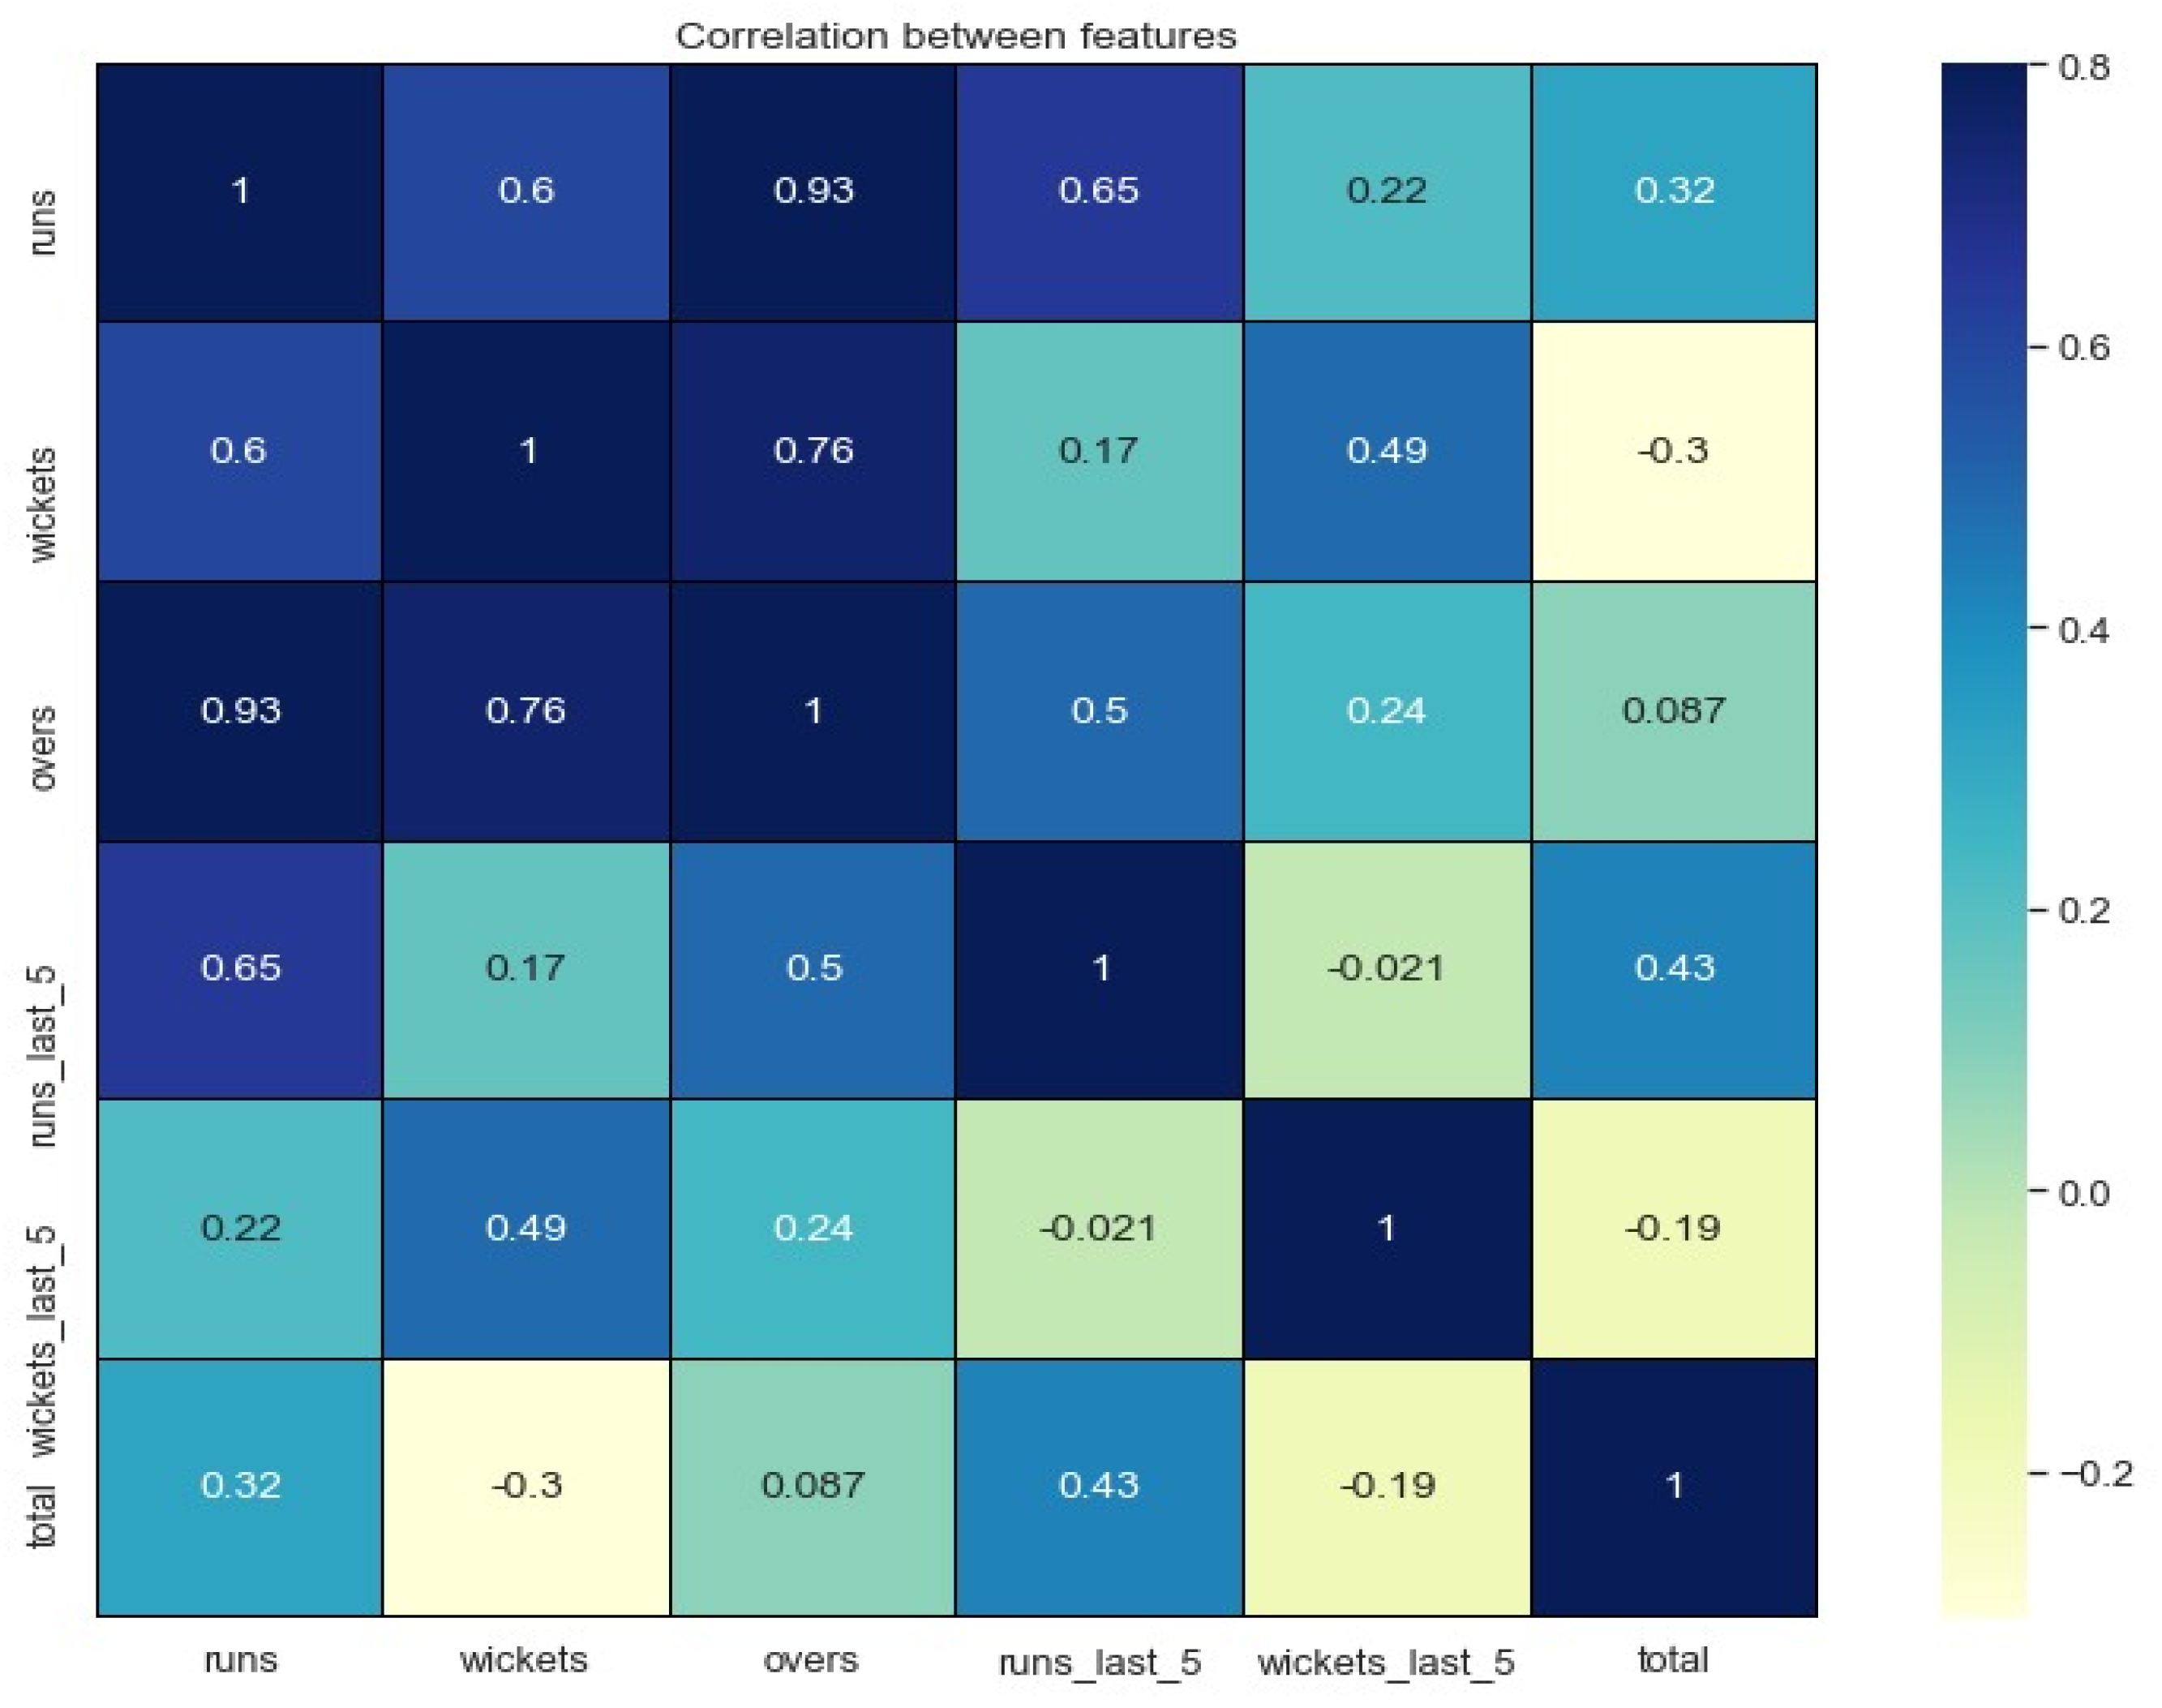
3.3. Data Exploration Analysis
- First, log in to the Databricks community and make a new cluster after the login. This cluster is a data frame where you will perform your required task. This cluster assigns you some storage to use a few resources.
- After creating a cluster, you need to upload or make a table from the design tab. In this tab, you can upload your dataset table to do some visualization. This can be done by applying the techniques and tools needed to make it more relevant to your data requirements.
- After finalizing the data table, you will have to create a worksheet that performs all these tasks to predict and customize the data. This is the significant step in which you will build your model and run it on your respective dataset or table.
3.4. Linear Regression Model
4. Experimental Results
4.1. Train and Test Split Data Sets
4.2. Converting of String into an Object
4.3. Building the Model on Scikit Learn and Spark ML
4.4. Evaluation Result of Linear Regression Using Scikit Learn
4.5. Evaluation Result of Linear Regression Using Spark ML
5. Discussion
6. Conclusions
Author Contributions
Funding
Data Availability Statement
Conflicts of Interest
References
- Williams, J. Cricket and England: A Cultural and Social History of the Inter-War Years; Taylor & Francis: Oxfordshire, UK, 1999. [Google Scholar]
- Bailey, M.; Clarke, S.R. Predicting the match outcome in one day international cricket matches, while the game is in progress. J. Sports Sci. Med. 2006, 5, 480. [Google Scholar]
- Rehma, A.A.; Awan, M.J.; Butt, I. Comparison and Evaluation of Information Retrieval Models. VFAST Trans. Softw. Eng. 2018, 6, 7–14. [Google Scholar]
- Alam, T.M.; Awan, M.J. Domain analysis of information extraction techniques. Int. J. Multidiscip. Sci. Eng. 2018, 9, 1–9. [Google Scholar]
- Kaur, A.; Kaur, R.; Jagdev, G. Analyzing and Exploring the Impact of Big Data Analytics in Sports Sector. SN Comput. Sci. 2021, 2, 1–19. [Google Scholar] [CrossRef]
- Ahmed, H.M.; Awan, M.J.; Khan, N.S.; Yasin, A.; Shehzad, H.M.F. Sentiment Analysis of Online Food Reviews using Big Data Analytics. Elem. Educ. Online 2021, 20, 827–836. [Google Scholar]
- Zhou, L.; Pan, S.; Wang, J.; Vasilakos, A.V.J.N. Machine learning on big data: Opportunities and challenges. Neurocomputing 2017, 237, 350–361. [Google Scholar] [CrossRef] [Green Version]
- Aftab, M.O.; Awan, M.J.; Khalid, S.; Javed, R.; Shabir, H. Executing Spark BigDL for Leukemia Detection from Microscopic Images using Transfer Learning. In Proceedings of the 2021 1st International Conference on Artificial Intelligence and Data Analytics (CAIDA), Riyadh, Saudi Arabia, 6–7 April 2021; pp. 216–220. [Google Scholar]
- Awan, M.J.; Khan, M.A.; Ansari, Z.K.; Yasin, A.; Shehzad, H.M.F. Fake Profile Recognition using Big Data Analytics in Social Media Platforms. Int. J. Comput. Appl. Technol. 2021, in press. [Google Scholar]
- Anam, M.; Ponnusamy, V.; Hussain, M.; Waqas Nadeem, M.; Javed, M.; Guan Goh, H.; Qadeer, S. Osteoporosis Prediction for Trabecular Bone using Machine Learning: A Review. Comput. Mater. Contin. 2021, 67, 89–105. [Google Scholar] [CrossRef]
- Ali, Y.; Farooq, A.; Alam, T.M.; Farooq, M.S.; Awan, M.J.; Baig, T.I. Detection of Schistosomiasis Factors Using Association Rule Mining. IEEE Access 2019, 7, 186108–186114. [Google Scholar] [CrossRef]
- Nagi, A.T.; Awan, M.J.; Javed, R.; Ayesha, N. A Comparison of Two-Stage Classifier Algorithm with Ensemble Techniques On Detection of Diabetic Retinopathy. In Proceedings of the 2021 1st International Conference on Artificial Intelligence and Data Analytics (CAIDA), Riyadh, Saudi Arabia, 6–7 April 2021; pp. 212–215. [Google Scholar]
- Awan, M.J.; Yasin, A.; Nobanee, H.; Ali, A.A.; Shahzad, Z.; Nabeel, M.; Zain, A.M.; Shahzad, H.M.F. Fake News Data Exploration and Analytics. Electronics 2021, 10, 2326. [Google Scholar] [CrossRef]
- Gupta, M.; Jain, R.; Arora, S.; Gupta, A.; Javed Awan, M.; Chaudhary, G.; Nobanee, H. AI-enabled COVID-9 Outbreak Analysis and Prediction: Indian States vs. Union Territories. Comput. Mater. Contin. 2021, 67, 933–950. [Google Scholar] [CrossRef]
- de Souza Junior, A.H.; Corona, F.; Barreto, G.A.; Miche, Y.; Lendasse, A. Minimal learning machine: A novel supervised distance-based approach for regression and classification. Neurocomputing 2015, 164, 34–44. [Google Scholar] [CrossRef]
- Javed, R.; Saba, T.; Humdullah, S.; Jamail, N.S.M.; Awan, M.J. An Efficient Pattern Recognition Based Method for Drug-Drug Interaction Diagnosis. In Proceedings of the 2021 1st International Conference on Artificial Intelligence and Data Analytics (CAIDA), Riyadh, Saudi Arabia, 6–7 April 2021; pp. 221–226. [Google Scholar]
- Salloum, S.; Dautov, R.; Chen, X.; Peng, P.X.; Huang, J.Z. Big data analytics on Apache Spark. Int. J. Data Sci. Anal. 2016, 1, 145–164. [Google Scholar] [CrossRef] [Green Version]
- Khalil, A.; Awan, M.J.; Yasin, A.; Singh, V.P.; Shehzad, H.M.F. Flight Web Searches Analytics through Big Data. Int. J. Comput. Appl. Technol. 2021, in press. [Google Scholar]
- Singh, T.; Singla, V.; Bhatia, P. Score and winning prediction in cricket through data mining. In Proceedings of the 2015 International Conference on Soft Computing Techniques and Implementations (ICSCTI), Faridabad, India, 8–10 October 2015; pp. 60–66. [Google Scholar]
- Kamble, R. Cricket Score Prediction Using Machine Learning. Turk. J. Comput. Math. Educ. 2021, 12, 23–28. [Google Scholar]
- Ahmed, W. A Multivariate Data Mining Approach to Predict Match Outcome in One-Day International Cricket. Master’s Thesis, Karachi Institute of Economics and Technology, Karachi, Pakistan, August 2015. [Google Scholar]
- Yasir, M.; Chen, L.; Shah, S.A.; Akbar, K.; Sarwar, M.U. Ongoing Match Prediction in T20 International. Int. J. Comput. Sci. Netw. Secur. 2017, 17, 176–181. [Google Scholar]
- Vistro, D.M.; Rasheed, F.; David, L.G. The Cricket Winner Prediction With Application Of Machine Learning And Data Analytics. Int. J. Sci. Technol. Res. 2019, 8, 985–990. [Google Scholar]
- Javed Awan, M.; Shafry Mohd Rahim, M.; Nobanee, H.; Munawar, A.; Yasin, A.; Mohd Zain Azlanmz, A. Social Media and Stock Market Prediction: A Big Data Approach. Comput. Mater. Contin. 2021, 67, 2569–2583. [Google Scholar] [CrossRef]
- Javed Awan, M.; Shafry Mohd Rahim, M.; Nobanee, H.; Yasin, A.; Ibrahim Khalaf, O.; Ishfaq, U. A Big Data Approach to Black Friday Sales. Intell. Autom. Soft Comput. 2021, 27, 785–797. [Google Scholar] [CrossRef]
- Awan, M.J.; Khan, R.A.; Nobanee, H.; Yasin, A.; Anwar, S.M.; Naseem, U.; Singh, V.P. A Recommendation Engine for Predicting Movie Ratings Using a Big Data Approach. Electronics 2021, 10, 1215. [Google Scholar] [CrossRef]
- Morgulev, E.; Azar, O.H.; Lidor, R. Sports analytics and the big-data era. Int. J. Data Sci. Anal. 2018, 5, 213–222. [Google Scholar] [CrossRef]
- Samariya, D.; Matariya, A.; Raval, D.; Babu, L.D.; Raj, E.D.; Vekariya, B. A hybrid approach for big data analysis of cricket fan sentiments in twitter. In Proceedings of the International Conference on ICT for Sustainable Development; Springer: Singapore, 2016; pp. 503–512. [Google Scholar]
- Cricsheet ODI Cricket. Available online: https://cricsheet.org/ (accessed on 10 July 2021).
- Ilijason, R. Getting Started with Databricks. In Beginning Apache Spark Using Azure Databricks; Springer: Berlin/Heidelberg, Germany, 2020; pp. 27–38. [Google Scholar]
- Goldberger, A.S. Best linear unbiased prediction in the generalized linear regression model. J. Am. Stat. Assoc. 1962, 57, 369–375. [Google Scholar] [CrossRef]
- Wang, G.C. How to handle multicollinearity in regression modeling. J. Bus. Forecast. 1996, 15, 23. [Google Scholar]
- Awan, M.J. Acceleration of Knee MRI Cancellous bone Classification on Google Colaboratory using Convolutional Neural Network. Int. J. Adv. Trends Comput. Sci. Eng. 2019, 8, 83–88. [Google Scholar] [CrossRef]
- Agarwal, S.; Yadav, L.; Mehta, S. Cricket team prediction with hadoop: Statistical modeling approach. Procedia Comput. Sci. 2017, 122, 525–532. [Google Scholar] [CrossRef]
- Aburas, A.A.; Mehtab, M.; Mehtab, Y. Cricket World Cup Predictions Using KNN Intelligent Bigdata Approach. In Proceedings of the 2018 International Conference on Computing and Big Data, Charleston, SC, USA, 8–10 September 2018; pp. 18–22. [Google Scholar]
- Aburas, A.A.; Mehtab, M.; Mehtab, Y. ICC World Cup Prediction Based Data Analytics and Business Intelligent (BI) Techniques. In Proceedings of the 2018 International Conference on Cyber-Enabled Distributed Computing and Knowledge Discovery (CyberC), Zhengzhou, China, 18–20 October 2018; pp. 273–2736. [Google Scholar]
- Awan, M.J.; Rahim, M.S.M.; Salim, N.; Mohammed, M.A.; Garcia-Zapirain, B.; Abdulkareem, K.H. Efficient Detection of Knee Anterior Cruciate Ligament from Magnetic Resonance Imaging Using Deep Learning Approach. Diagnostics 2021, 11, 105. [Google Scholar] [CrossRef]
- Awan, M.J.; Raza, A.; Yasin, A.; Shehzad, H.M.F.; Butt, I. The Customized Convolutional Neural Network of Face Emotion Expression Classification. Ann. Rom. Soc. Cell Biol. 2021, 25, 5296–5304. [Google Scholar]
- Mujahid, A.; Awan, M.J.; Yasin, A.; Mohammed, M.A.; Damaševičius, R.; Maskeliūnas, R.; Abdulkareem, K.H. Real-Time Hand Gesture Recognition Based on Deep Learning YOLOv3 Model. Appl. Sci. 2021, 11, 4164. [Google Scholar] [CrossRef]
- Mubashar, R.; Javed Awan, M.; Ahsan, M.; Yasin, A.; Partap Singh, V. Efficient Residential Load Forecasting using Deep Learning Approach. Int. J. Comput. Appl. Technol. 2021, in press. [Google Scholar]
- Javed Awan, M.; Shehzad, F.; Muhammad, H.; Ashraf, M. Fake News Classification Bimodal using Convolutional Neural Network and Long Short-Term Memory. Int. J. Emerg. Technol. 2020, 11, 209–212. [Google Scholar]


| Mid | Date | Venue | Bat_Team | Bowl_Team | Batsman | Bowler | Runs | Wickets | Overs | Runs_Last_5 | Wickets_Last_5 | Striker | Non_Striker | Total |
|---|---|---|---|---|---|---|---|---|---|---|---|---|---|---|
| 1 | 13 June 2006 | Civil Service Cricket Club, Stormont | England | Ireland | ME Trescothick | DT Johnston | 0 | 0 | 0.1 | 0 | 0 | 0 | 0 | 301 |
| 2 | 13 June 2006 | Civil Service Cricket Club, Stormont | England | Ireland | ME Trescothick | DT Johnston | 0 | 0 | 0.2 | 0 | 0 | 0 | 0 | 301 |
| 3 | 13 June 2006 | Civil Service Cricket Club, Stormont | England | Ireland | ME Trescothick | DT Johnston | 4 | 0 | 0.3 | 4 | 0 | 0 | 0 | 301 |
| 4 | 13 June 2006 | Civil Service Cricket Club, Stormont | England | Ireland | ME Trescothick | DT Johnston | 6 | 0 | 0.4 | 6 | 0 | 0 | 0 | 301 |
| 5 | 13 June 2006 | Civil Service Cricket Club, Stormont | England | Ireland | ME Trescothick | DT Johnston | 6 | 0 | 0.5 | 6 | 0 | 0 | 0 | 301 |
| Bat_Team | Bowl_Team | Runs | Wickets | Overs | Wickets_Last_5 | Total |
|---|---|---|---|---|---|---|
| England | Ireland | 0 | 0 | 0.1 | 0 | 301 |
| England | Ireland | 0 | 0 | 0.2 | 0 | 301 |
| England | Ireland | 4 | 0 | 0.3 | 0 | 301 |
| England | Ireland | 6 | 0 | 0.4 | 0 | 301 |
| England | Ireland | 6 | 0 | 0.5 | 0 | 301 |
| Mean | Std | Min | Max | |
|---|---|---|---|---|
| runs | 114.801661 | 77.665959 | 0.0 | 444.0 |
| wickets | 2.974970 | 2.298959 | 0.0 | 10.0 |
| overs | 24.052899 | 14.235439 | 0.0 | 49.6 |
| runs_last_5 | 23.548303 | 11.042974 | 0.0 | 101.0 |
| wickets_last_5 | 0.669814 | 0.833895 | 0.0 | 7.0 |
| total | 255.355387 | 62.354412 | 44.0 | 444.0 |
| Result of the Model Using a Scikit Learn | Result of the Model Using Spark ML Framework | ||
|---|---|---|---|
| Mean Absolute Error | 30.7 | Mean Absolute Error | 28.2 |
| Mean Square Error | 1576.29 | Mean Square Error | 1350.34 |
| Rooted Mean Square Error | 39.69 | Rooted Mean Square Error | 30.2 |
| Train Accuracy | 90% | Train Accuracy | 96% |
| Test Accuracy | 88% | Test Accuracy | 95% |
| Studies | Dataset | Model/Framework | Accuracy |
|---|---|---|---|
| Agarwal et al. [34] | Team Prediction | Statistical Modeling Approach Hadoop Framework | 91% |
| Aburas et al. [35] | ICC 2019 World Cup | K Nearest Neighbors and MySQL | 90% |
| Aburas et al. [36] | ICC 2019 World Cup | KNN and Business Intelligence | 93% and 90% |
| Vistro, Rasheed, and David [23] | IPL Prediction | Decision tree classifier | 94.87% |
| Random forest classifier | 80.76% | ||
| XGBoost classifier | 94.23% | ||
| Our Study | ODI Cricsheet Score Prediction | Linear Regression Spark ML | Train Accuracy = 96% Test Accuaracy = 95% |
Publisher’s Note: MDPI stays neutral with regard to jurisdictional claims in published maps and institutional affiliations. |
© 2021 by the authors. Licensee MDPI, Basel, Switzerland. This article is an open access article distributed under the terms and conditions of the Creative Commons Attribution (CC BY) license (https://creativecommons.org/licenses/by/4.0/).
Share and Cite
Awan, M.J.; Gilani, S.A.H.; Ramzan, H.; Nobanee, H.; Yasin, A.; Zain, A.M.; Javed, R. Cricket Match Analytics Using the Big Data Approach. Electronics 2021, 10, 2350. https://doi.org/10.3390/electronics10192350
Awan MJ, Gilani SAH, Ramzan H, Nobanee H, Yasin A, Zain AM, Javed R. Cricket Match Analytics Using the Big Data Approach. Electronics. 2021; 10(19):2350. https://doi.org/10.3390/electronics10192350
Chicago/Turabian StyleAwan, Mazhar Javed, Syed Arbaz Haider Gilani, Hamza Ramzan, Haitham Nobanee, Awais Yasin, Azlan Mohd Zain, and Rabia Javed. 2021. "Cricket Match Analytics Using the Big Data Approach" Electronics 10, no. 19: 2350. https://doi.org/10.3390/electronics10192350