Article

Advancing Logistics 4.0 with the Implementation of a Big Data Warehouse: A Demonstration Case for the Automotive Industry

ALGORITMI Research Centre, University of Minho, 4800-058 Guimarães, Portugal
*
Author to whom correspondence should be addressed.
Electronics 2021, 10(18), 2221; https://doi.org/10.3390/electronics10182221
Submission received: 16 August 2021 / Revised: 4 September 2021 / Accepted: 6 September 2021 / Published: 10 September 2021
(This article belongs to the Special Issue Big Data and Artificial Intelligence for Industry 4.0)

Abstract

:
The constant advancements in Information Technology have been the main driver of the Big Data concept’s success. With it, new concepts such as Industry 4.0 and Logistics 4.0 are arising. Due to the increase in data volume, velocity, and variety, organizations are now looking to their data analytics infrastructures and searching for approaches to improve their decision-making capabilities, in order to enhance their results using new approaches such as Big Data and Machine Learning. The implementation of a Big Data Warehouse can be the first step to improve the organizations’ data analysis infrastructure and start retrieving value from the usage of Big Data technologies. Moving to Big Data technologies can provide several opportunities for organizations, such as the capability of analyzing an enormous quantity of data from different data sources in an efficient way. However, at the same time, different challenges can arise, including data quality, data management, and lack of knowledge within the organization, among others. In this work, we propose an approach that can be adopted in the logistics department of any organization in order to promote the Logistics 4.0 movement, while highlighting the main challenges and opportunities associated with the development and implementation of a Big Data Warehouse in a real demonstration case at a multinational automotive organization.

1. Introduction

The explosion of the Information Technologies area has been the driver that launched new concepts such as Big Data and Industry 4.0 into the spotlight. The concept of Industry 4.0 emerged in 2011 from a project created by the German government to promote computerized manufacturing based on new technologies such as additive manufacturing, artificial intelligence, the Internet of Things, Big Data, and cyber-physical systems among others [1,2,3,4]. Since the creation of the Industry 4.0 concept, several barriers have hindered its implementation in organizations (even with the evolution of diverse technologies that support it). The financial constraints, the lack of management support, the resistance to change, the lack of infrastructure, and the poor-quality data, among others, are some barriers that need to be faced to implement the concept of Industry 4.0 [4]. This concept relies on the digitization of the production systems to provide the capability of producing customized products within a short time and with costs similar to mass production scenarios [5]. This factor has a tremendous impact on the organizations’ logistics due to the need to react to the sudden changes made by the customers.
The concept of Logistics 4.0 emerged as part of Industry 4.0 [6], with a few papers being published in recent years [3,7,8]. Logistics 4.0 can be defined as “... the logistical system that enables the sustainable satisfaction of individualized customer demands without an increase in costs and supports this development in industry and trade using digital technologies” [3]. Such an initiative is needed to improve the link between the manufacturers and the customers, in order to avoid failures in the manufacturing system [3].
Throughout history, the evolution suffered by industry has also been reflected in logistics. In each industrial revolution, a similar evolution occurred in logistics. When the steam power engine was invented and the first industrial revolution appeared, logistics was transformed by using mechanical transport. In the second industrial revolution, powered by electricity and mass production, logistics evolved using automatic handling systems. In the third industrial revolution, with the support of information and communications technologies, new logistics management systems were developed [9].
Now, the connection between the concepts of Industry 4.0 and Logistics 4.0 goes deep into the technologies that are used to enforce Logistics 4.0’s main characteristics. Among its characteristics, we can find constant visibility through all supply chains for all stakeholders, verification of the supply chain coherence, and dynamic optimization. These characteristics are enforced by the use of Information Technologies [10].
Big Data technologies, with their capability of analyzing massive volumes of diverse data flowing at a high velocity, have an important role in the implementation of these new concepts (Industry 4.0 and Logistics 4.0) and in the resolution of their main associated challenges [8].
With the implementation of Big Data technologies, it became possible to perform tasks that involve a massive quantity of data at high speeds such as providing a supply chain control with real-time data, inventory control and management, and improving forecasting models, among others [5].
Along with the influence of concepts such as Industry 4.0 and Logistics 4.0, the investments in Big Data technologies are being stimulated, making them more stable and mature, ready to be implemented inside the organizations and became part of their business.
A vast range of organizations, from diverse types of business, are now trying to evolve their data analyses infrastructures to this new era, advancing their Data Warehouses (DWs) based on a more rigid data model to the new concept of Big Data Warehouses (BDWs) with a more dynamic data model [11,12,13].
This work aims to demonstrate how the implementation of a Big Data Warehouse (BDW) in a logistics context can drive forward the concept of Logistics 4.0 and improve the organization’s performance. The contributions of this work are: (i) proposing a general approach that can be adopted in the logistics departments of several organizations; (ii) proposing a logical and technological architecture that supports the BDW and data analysis; (iii) proposing a data model for a logistics BDW; (iv) demonstrating the challenges and opportunities that emerge throughout the development and implementation of a BDW in the logistics department.
A demonstration case is presented, which was developed inside a multinational automotive organization by taking advantage of its existing data platform. The methodology used in this work was the Design Science Research Methodology, this work being an outcome of the methodology’s adoption.
This work is structured as follow: Section 2 provides the published works related to BDWs and their architectures; Section 3 presents the suggested architecture to solve this problem; Section 4 describes the organization reality and the tasks performed to accomplish the goal; Section 5 presents the results accomplished followed by a discussion where the challenges and opportunities are highlighted; Section 6 shows the final conclusions and future work.

2. Related Work

With the implementation of concepts such as Industry 4.0 and Logistics 4.0, it becomes important to endow the organizations’ data analysis infrastructure with the capability of retrieving, transforming, and analyzing massive amounts of data at a high velocity. Before the establishment of the Big Data concept, organizations had their data analysis infrastructure based on DWs, where the data model was rigid and structured in order to provide the best performance when data were inspected.
Aftab and Siddiqui [14] presented several differences between a traditional DW and a DW in the era of Big Data. Most of the changes are related to how to deal with data due to their characteristics. Between them, we can highlight a few changes such as the change from Extract, Transform, and Load (ETL) to Extract, Load, and Transform (ELT), which happens to enhance with the processing power of distributed systems, such as Hadoop. The change to real-time and interactive analysis, the change from structured to unstructured data, and the change to analytical interfaces, such as dashboards, are based on user requirements.
Nowadays, Big Data technologies, due to their capacity for distributed processing and storage, allow us to have more dynamic data models with less rigid structures, maintaining high performance even with massive volumes of data.
To implement Big Data technologies, we can follow two different approaches: “lift and shift” and “rip and replace”. The “lift and shift” strategy means that we replace or extend parts of the existing infrastructure with Big Data technology to improve its capabilities and to solve specific problems. This may result in a use case approach instead of a data-driven approach, which can lead to uncoordinated data silos. The “rip and replace” approach means that the existing Data Warehouse (DW) is replaced by Big Data technologies [15].
Independent of these two strategies, there are several architectures and technologies that can be used to implement a BDW. The use of different types of Not Only SQL (NoSQL) databases, such as document-oriented and column-oriented [16] or graph models [17], can be used to store the different types of data in the BDW. In the literature, we can find different architectures that can be used in a BDW, such as the Lambda architecture [18] and the NIST Big Data Reference Architecture (NBDRA) [19]. The Lambda architecture has three layers and unifies, in a single software design pattern, the batch and real-time data processing concerns. The three layers presented in the Lambda Architecture are batch processing, real-time computing, and a layer to query the data. This division between batch processing and real-time processing allows differentiating data according to their nature and relevance to the business. In this way, it is possible to immediately process the data that are needed in time, while data that are only needed in the long run can be processed later [18].
The NBDRA was presented by its authors as a common reference that can be implemented using any Big Data technology or service provider. It is divided into the following five components: system orchestrator; Data provider; Big Data application provider; Big Data framework provider; and data consumer. The system orchestrator is the component that establishes the requirements for all the infrastructure, including, among others, architectural design, business requirements, and governance. The data provider is the component that makes data accessible through different interfaces. The Big Data application provider deals with all the necessary tasks to manipulate data through its lifecycle. The Big Data framework provider consists of several services or resources that are used by the Big Data application provider. The data consumer is the entity that will take advantage of all the data processing made by the Big Data system [20]. Using the NBDRA and the Lambda Architecture as a reference, Santos and Costa [20] created an approach to develop BDWs.
Several examples demonstrate the capacity of Big Data technologies to improve the analytical capabilities of organizations. Chou et al. [21] proposed a system architecture based on Hadoop, Sqoop, Spark, Hive, and Impala to analyze data from electrical grids. Sebaa et al. [12] presented an architecture based on the Hadoop ecosystem and a conceptual model to develop a BDW in the healthcare field. Santos et al. [22] presented a demonstration case where a Big Data architecture and a set of rules to evolve from a traditional DW to a BDW were applied. Sebaa et al. [12] developed a BDW based on Hadoop due to its cost-effectiveness, where they presented the architecture and the conceptual data model. Ngo et al. [11] designed and implemented a BDW for agricultural data using Hive, MongoDB, and Cassandra. In the same domain, Wang et al. [23] developed and implemented an end to end system for farm management based on HDFS, Spark, Hive, and Hbase. Doreswamy et al. [24] used a hybrid DW model with an OLTP system and Hadoop to develop a meteorological DW using a star schema. Costa and Santos [25] developed a BDW for smart cities using technologies such as Hive, Cassandra, HDFS, and Presto, among others. Vieira et al. [26] developed a tool using Big Data technologies and a simulation model to assess the impact of disruptions in the performance of the supply chain.
These examples demonstrate how Big Data technologies can be used in collaboration with traditional DWs or even replacing them, both aiming to improve the analytical capabilities of the organizations.
Although several domains are addressed in the literature, the lack of work in the logistics area is notorious. Moreover, few approach the problems faced when the implementation occurs in the real world.

3. Proposed Architecture for a Logistics 4.0 Big Data Warehouse

In this section, we present the logical (Section 3.1) and technological (Section 3.2) architectures that can be used to implement a BDW for the Logistics 4.0 movement.

3.1. Logical Architecture

The main goal of this BDW is to be an analytical repository containing a substantial amount of data, in order to support the daily activities of the logistics decision-makers in the Logistics 4.0 era.
Two of the key factors in Logistics 4.0 are the real-time exchange of information between all the actors in the supply chain and the real-time Big Data analytics of vehicles’, products’, and facilities’ location [8].
The exchange of information between all actors in the supply chain can originate diverse data sources with different types of data that need to be stored and analyzed in one central repository in order to be easily accessible by the practitioners. The same happens with the real-time Big Data analytics of the diverse supply chain components (vehicles’, products’, and facilities’ location). Considering this, the real-time characteristics can be important; nevertheless, it is necessary to adapt to the organizational requirements. Real-time analytics can be a different concept from one organization to other. For example, for one organization, the real-time requirements can be to have access to data in less than ten seconds, but for other organizations, it can be to access the data in less than two minutes. Moreover, some organizations do not need to create an architecture that takes into consideration the real-time requirements.
In our demonstration case, the organization does not have the requirement of real-time analysis, so the architecture presented in Figure 1 does not incorporate that component. Nevertheless, due to the relevance of real-time performance in Logistics 4.0, it may be relevant to implement and validate that component in future work.
As can be seen in Figure 1, the logical architecture has the following components:
  • Sandbox Storage: where the raw data are stored in a distributed file system before any transformation. This component is divided into two layers: Update Layer and Backup Layer. The Update Layer contains the up-to-date data retrieved from the sources, while the Backup Layer contains compressed outdated data to be used in case of necessity;
  • BDW Storage: where data are stored in the distributed file system and accessible using the Metastore after being transformed. This component has two layers with the same functionality as the Sandbox Storage layers: (i) a layer that provides updated data, (ii) another layer to provide a backup in case of problems with the new data;
  • Machine Learning component: uses raw data from the Sandbox Storage or clean data from the BDW to create predictions, in order to enrich the data and store it in the Sandbox Storage or in the BDW to provide predictive capabilities for the organization. This component can increase the organization’s capabilities to understand and predict changes in their supply chain and be capable of adapting quickly;
  • Metastore: provides an interface to access the stored data. This component is divided into two layers: (i) the data layer where the data are modeled using a data-driven approach; (ii) the application layer where we have the necessary materialized objects or views to answer the needs of specific applications. The existence of these two layers provides some advantages. One of these advantages is the capability of creating several abstractions on top of the data layer, providing a simple and fast way to access the data. In this application layer, each application can have its views or tables (materialized objects), increasing the performance when accessing the data. Moreover, if the organization has different teams working on different applications, if necessary, each team can create the necessary tables or views for their application, providing higher business agility;
  • The Coordinator, Resource Management, and Workflows: provide functionalities to manage the Big Data Cluster and the data lifecycle. The Coordinator and Workflow allow the creation of diverse jobs or tasks that can be submitted in the desired order. The Resource Manager distributes the clusters of resources to process the jobs.
Outside the BD Cluster, we can find the data sources that provide the raw data to be used in the BDW and the Visualizations Tools where dashboards are developed to present the results to the users.

3.2. Technological Architecture

Due to the need to analyze big quantities of data in the most efficient way, new technologies that use the power of distributed processing and storage have gained significant attention. Probably the most well-known technology in this context, which can arguably be seen as the originating driver of the Big Data movement, is Apache Hadoop (https://hadoop.apache.org/ (accessed on 8 September 2021)), where data can be stored in the Hadoop Distributed File System (HDFS) [27] and then processed using the Map and Reduce [28] programming model. Several other technologies such as Sqoop (https://sqoop.apache.org/ (accessed on 8 September 2021)), Hive [29], Spark [30], and Impala (https://impala.apache.org/ (accessed on 8 September 2021)) [31], among others, are being constantly developed to tackle specific problems in the Big Data ecosystem. These technologies allow the practitioners to retrieve data from the data sources, store them with appropriate metadata, and then, process them, in order to provide useful knowledge to the end-users.
Currently, in the Big Data world, the amount of Big Data technologies is overwhelming, and it can sometimes be difficult to understand and choose the right technology for the right job. For example, for data collection, technologies such as Flume, Kafka, or Talend can be used. For data preparation and enrichment, we can use Spark or Storm. For data storage, Hive with HDFS, NoSQL databases, or Kudu can be used. For machine learning tasks, we can use Spark, H2O, or TensorFlow [32]. For query engines, Impala, Presto, or Drill can be used. For data visualization, tools such as Tableau, Power BI, or JavaScript can be used [33].
Due to the organizational requirements and due to the technologies available in the organization depicted in this demonstration case, the technological architecture presented in Figure 2 was used to support this demonstration case. Nerveless, this technological architecture can be used inside others organization’s logistics departments, assuming the goals and requirements are similar to the ones depicted in this work. In the case of distinct requirements, some technologies could be adjusted. Regarding data ingestion from the sources, this work used Sqoop. Even though Sqoop can only connect to structured databases [34], since for this demonstration case, the organization’s data sources were only SQL databases, there was no need to use another technology to ingest the data. After the data were retrieved from the sources, the same were stored in the HDFS, using the Parquet format, which is one of the several formats that can be used to store data in the HDFS. Other formats that can be used are, for example, ORC or AVRO [35]. Parquet was chosen not only due to its adequate compatibility with Spark and Impala technology, but also due to its read-oriented format and adequate compression, which would bring advantages when we need to query the data [36]. Moreover, it was necessary to develop a Bash script in order to provide a mechanism to create data backups in the Sandbox Storage and in the BDW.
Spark was the chosen framework due to its data cleansing and transformation capabilities and due to the capability to develop several machine learning models. Spark has the SparkSQL [37] library, which allows the use of SQL functions in conjunction with the Spark programming API and complex libraries such as Spark MlLib [38]. Being able to perform all these tasks in one unique framework is a significant advantage, since, in this way, it is not necessary to spend more time using and learning different technologies. Moreover, Spark is compatible with the Parquet files and Hive, which was used to provide the data and metadata to the end-users.
Hive includes the Hive Metastore (the system catalog) where the metadata (schema and other statistics) are stored, allowing proper data exploration and query optimizations [29]. Hive allows the creation of external tables where data are stored in HDFS directories, and its lifecycle is not managed by Hive [29]. Within Hive, we create two levels of interaction with the data. At the first level, the data are modeled using a data-driven approach where the core entities (such as Needs, Stocks, and Products, among others) and other entities such as Date and Time are stored. This layer allows ad hoc access to the data from these entities to be used by any team or project. In the second layer, the application layer, a new set of objects (materialized tables or views), oriented toward the applications’ needs, are created to provide access to the specific data that each application or project needs. This provides more personalized access to the data that will increase the application performance and business agility; thus, each team can create their tables or views as they need.
Impala provides a Massively Parallel Processing (MPP) SQL engine that combines the flexibility and scalability of Hadoop with the familiarity of SQL and has proven to be generally faster than Spark or Hive according to Qin et al. [39] and to Bittorf et al. [31]. Impala can also be used to query data from HBase and provide a connection to visualization applications, such as Tableau or Power BI, where dashboards can be developed to present to the end-user the knowledge retrieved from the data [31].
This technological architecture supports all the requirements of this project, granting that we can allow the data analysis team to provide knowledge to be used by the end-users, in order to support their decisions and therefore improve the organization’s results. Moreover, it can be used in other Logistics 4.0 projects to create a new centralized repository that aggregates different data sources and requires predictive capabilities.

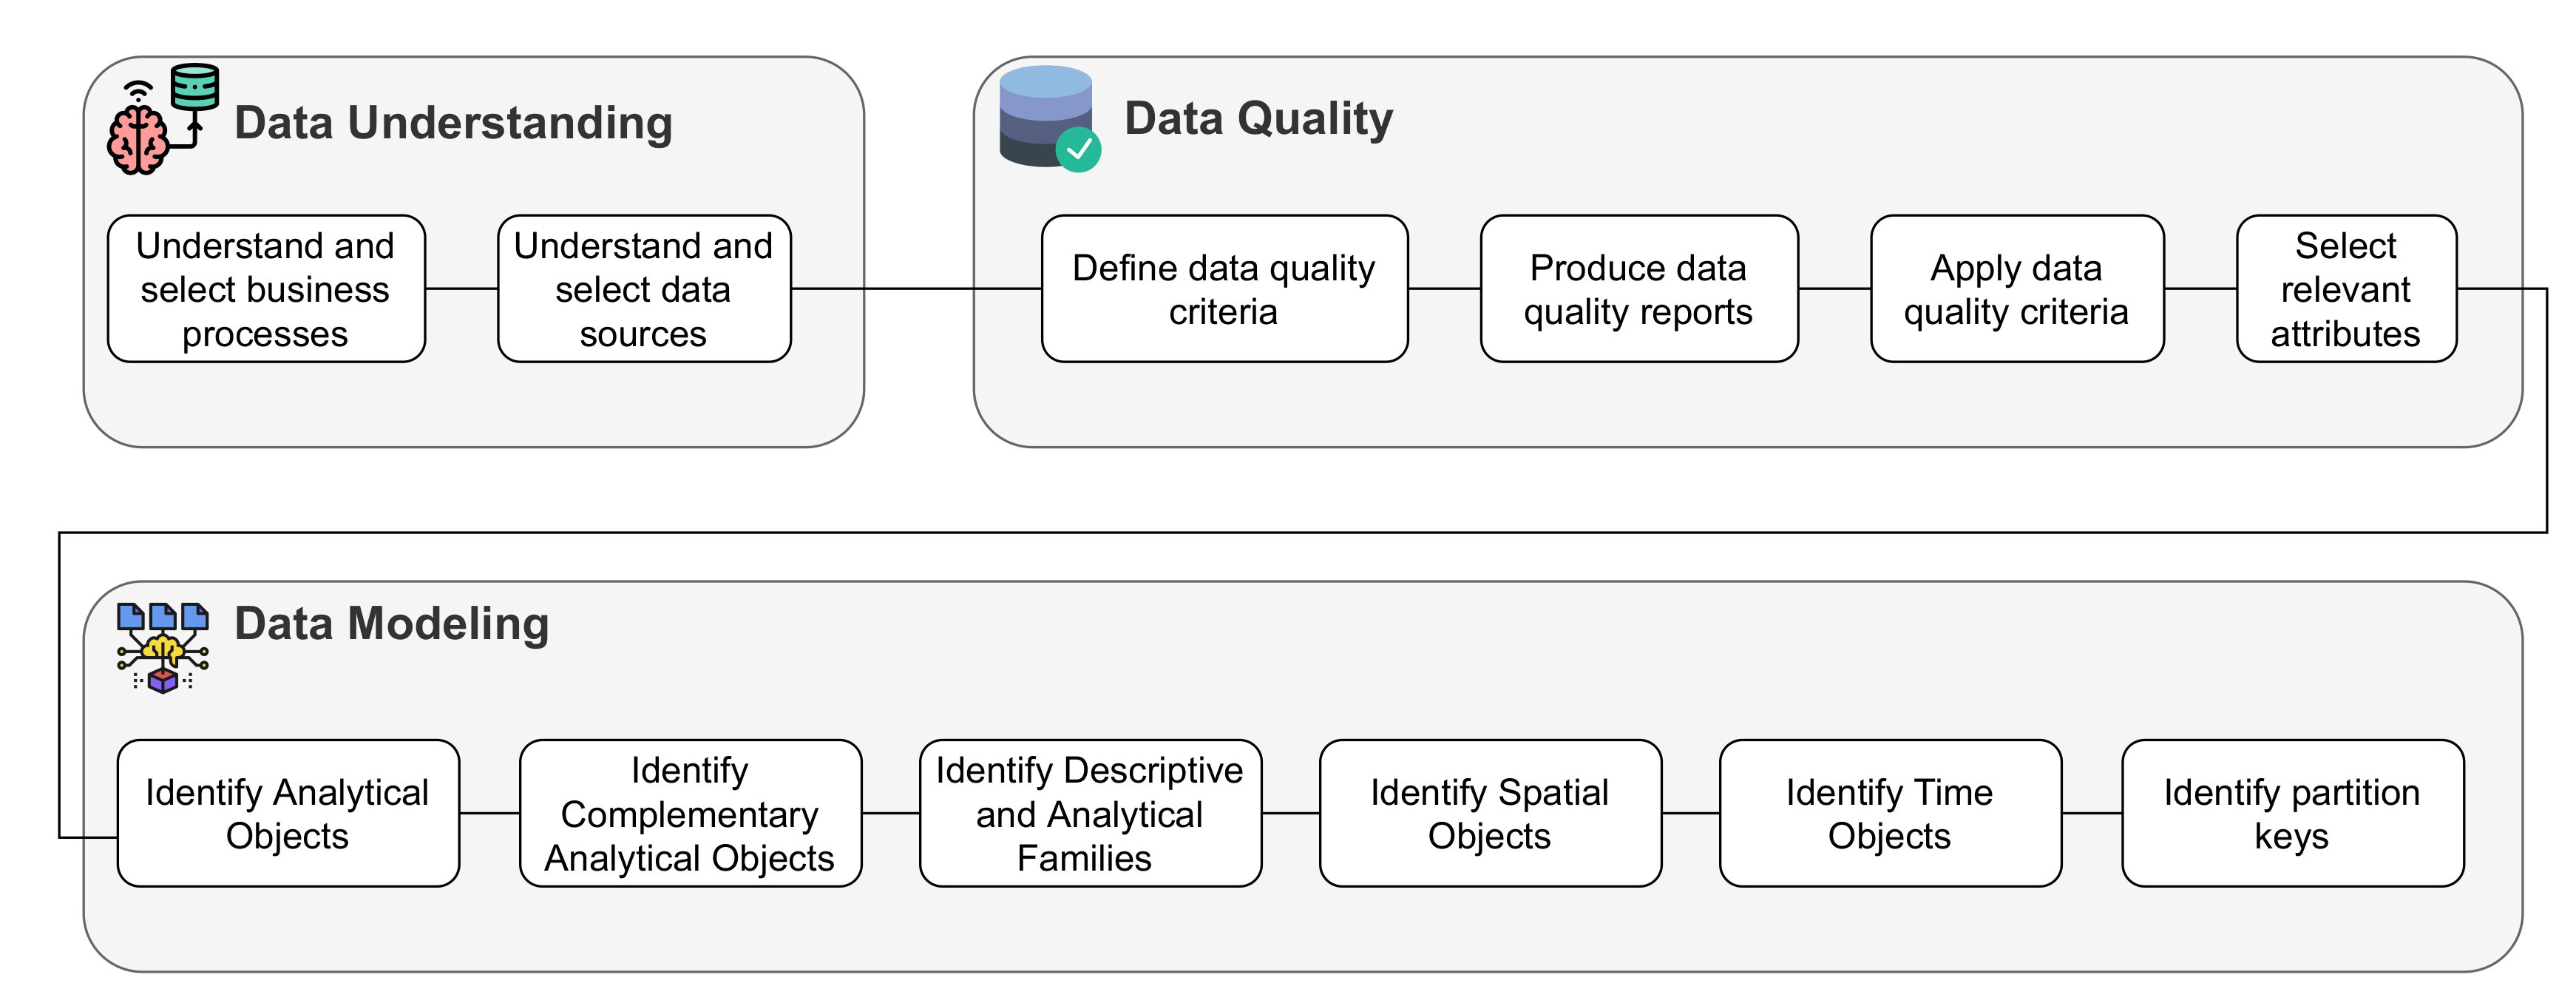
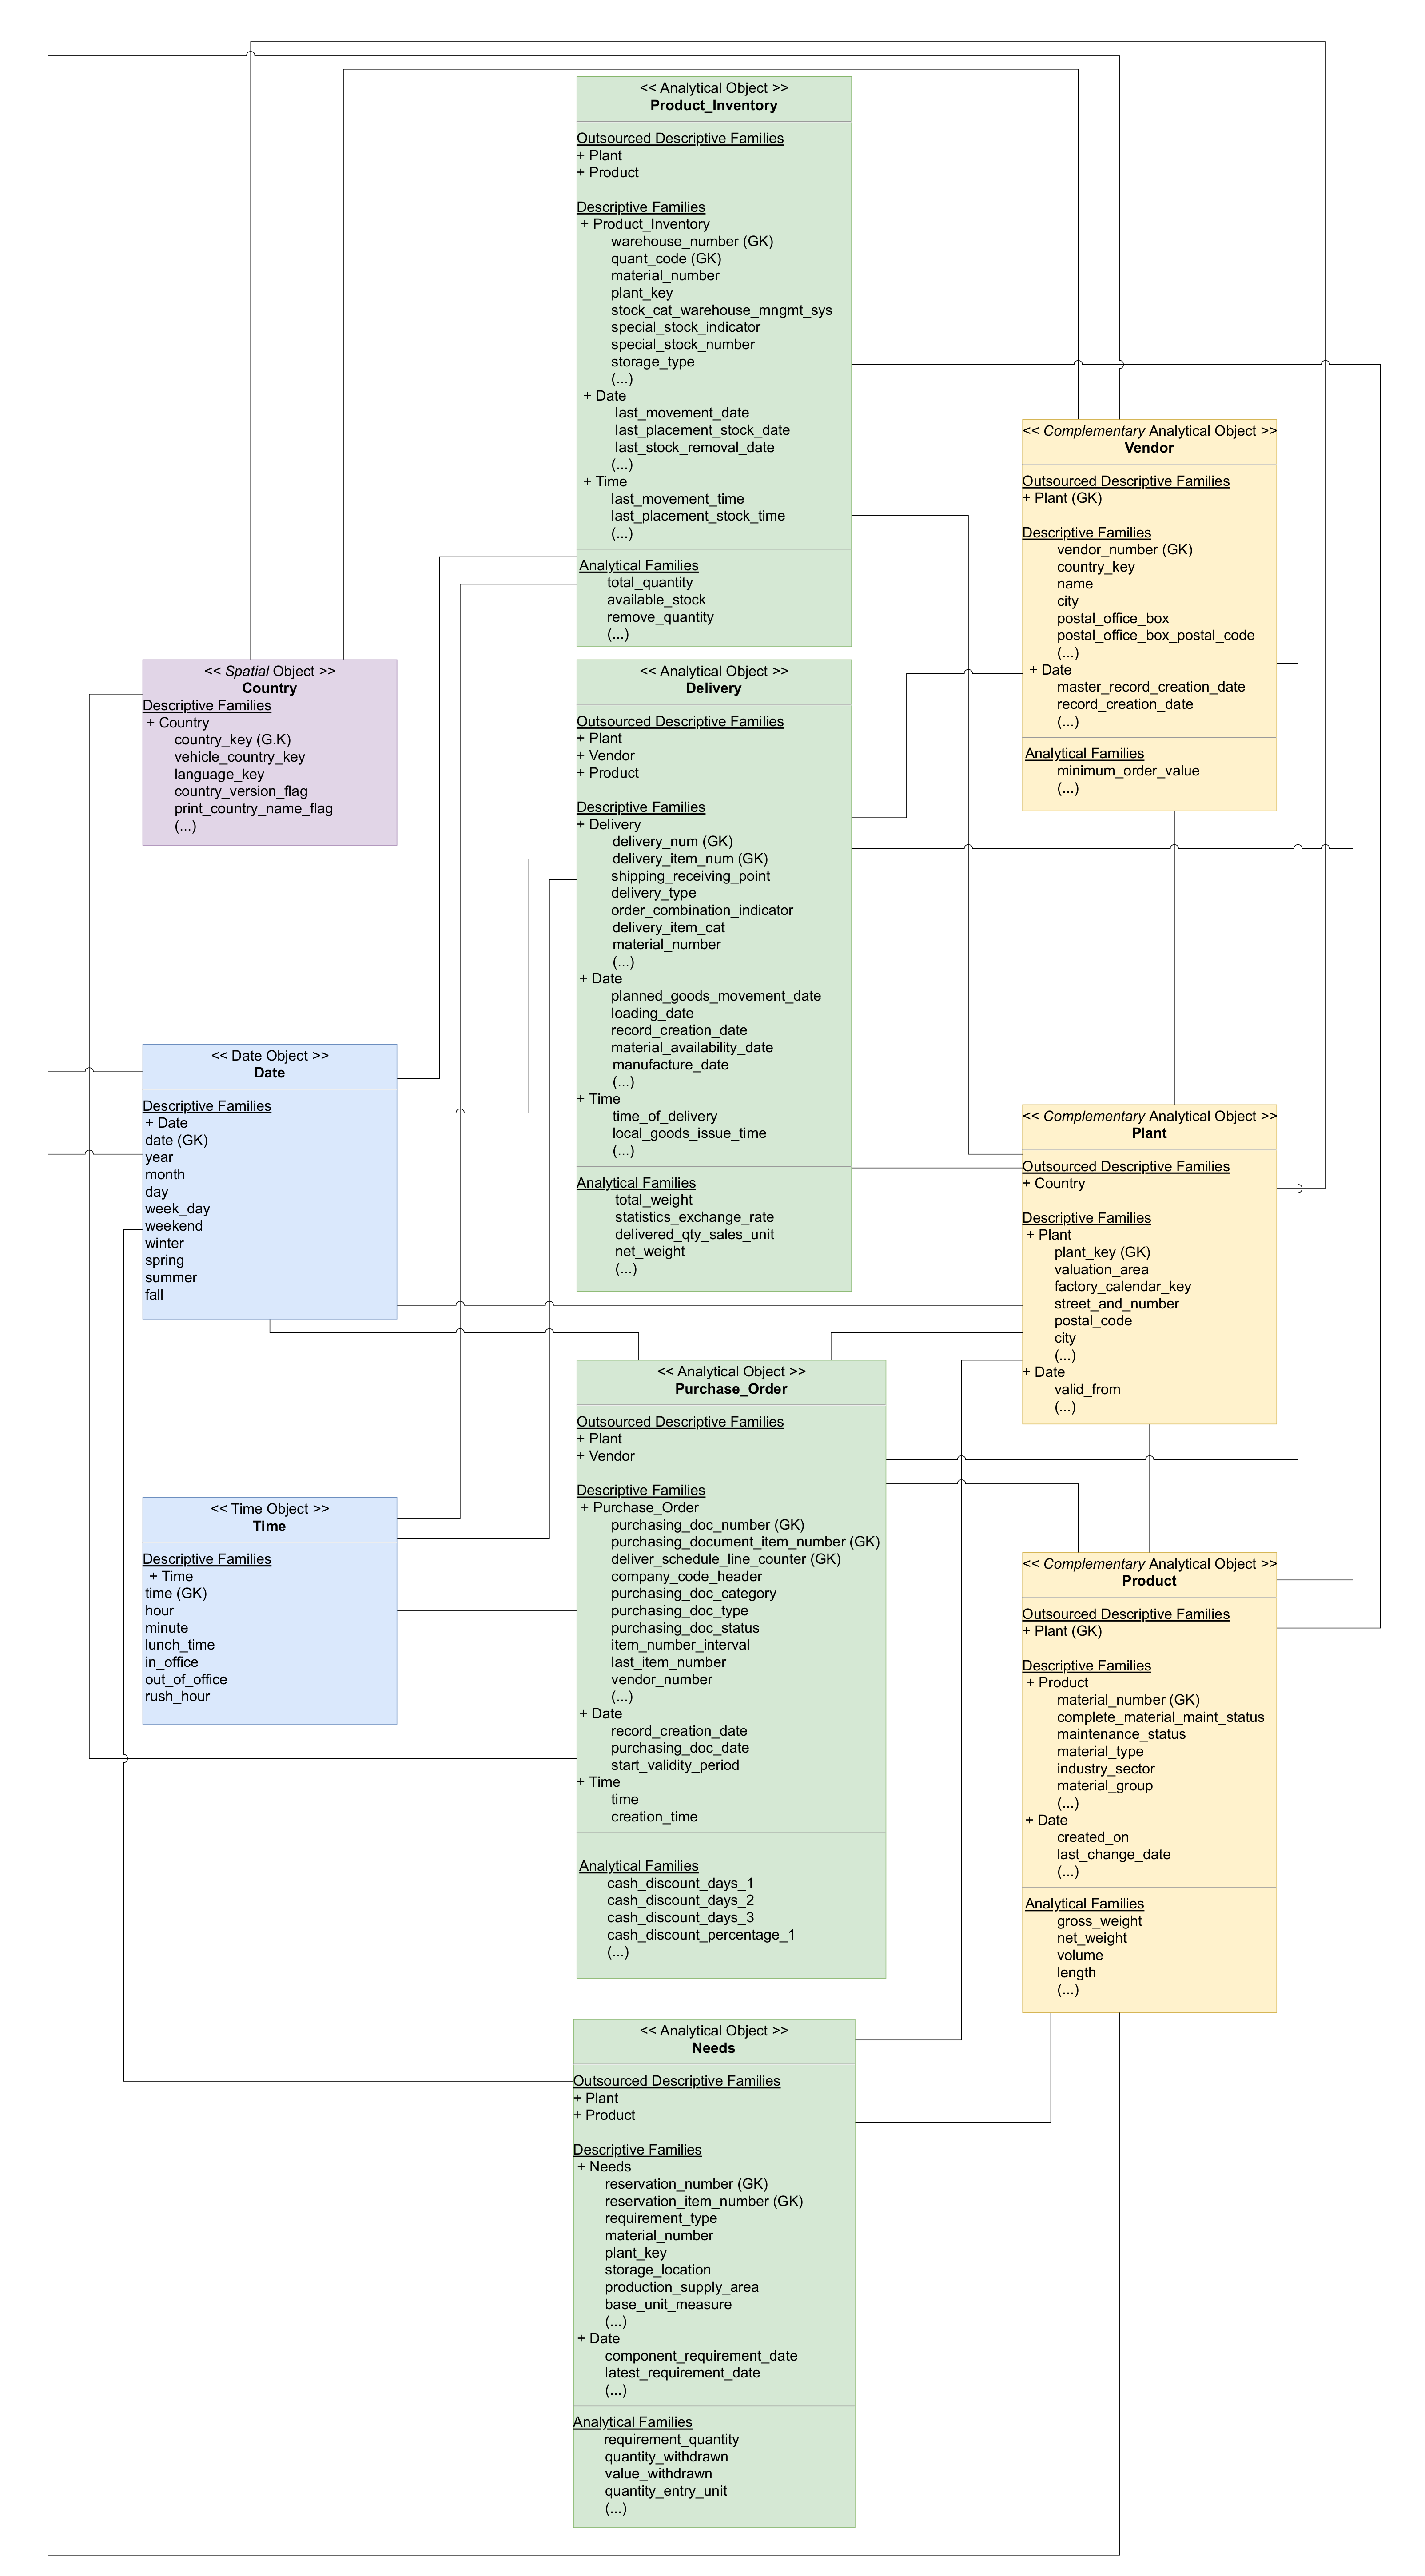
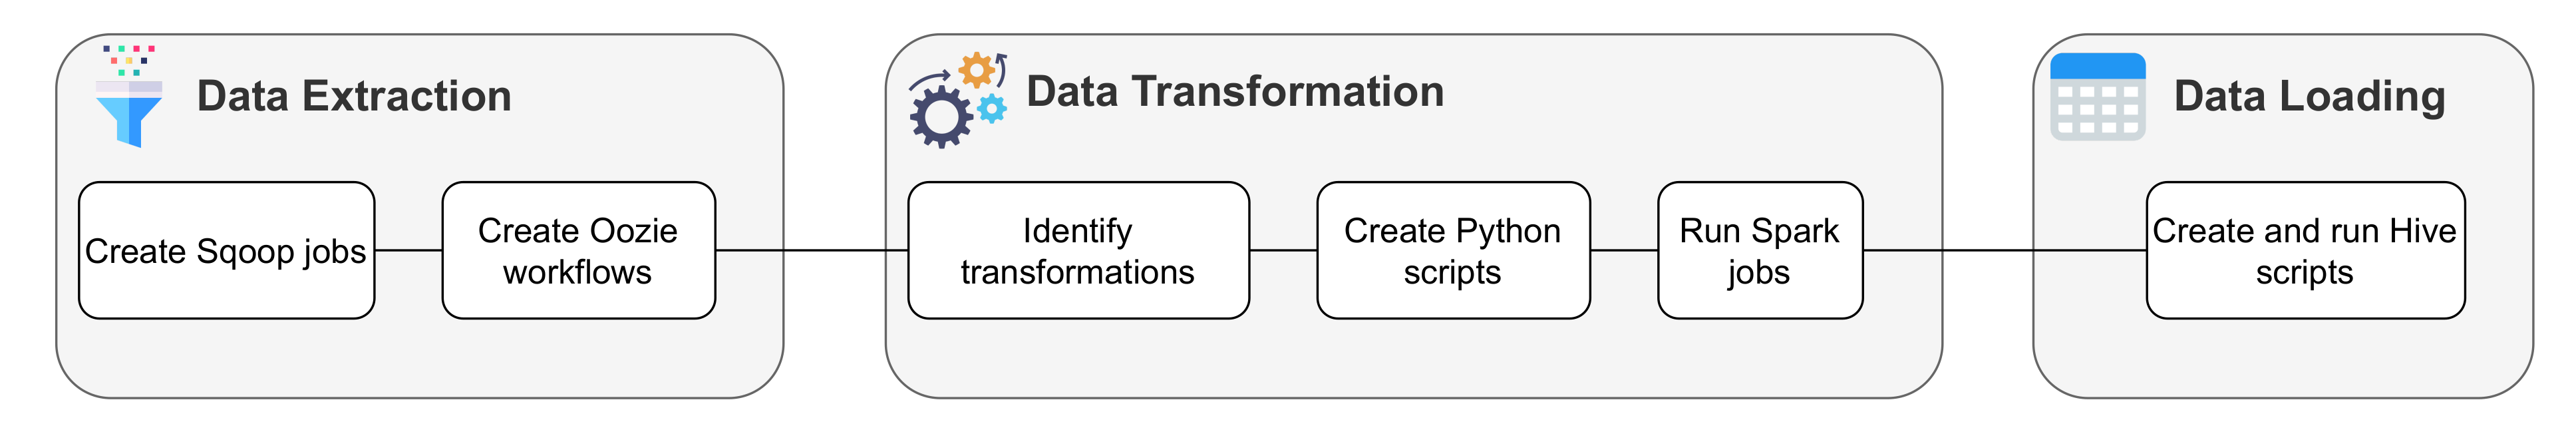
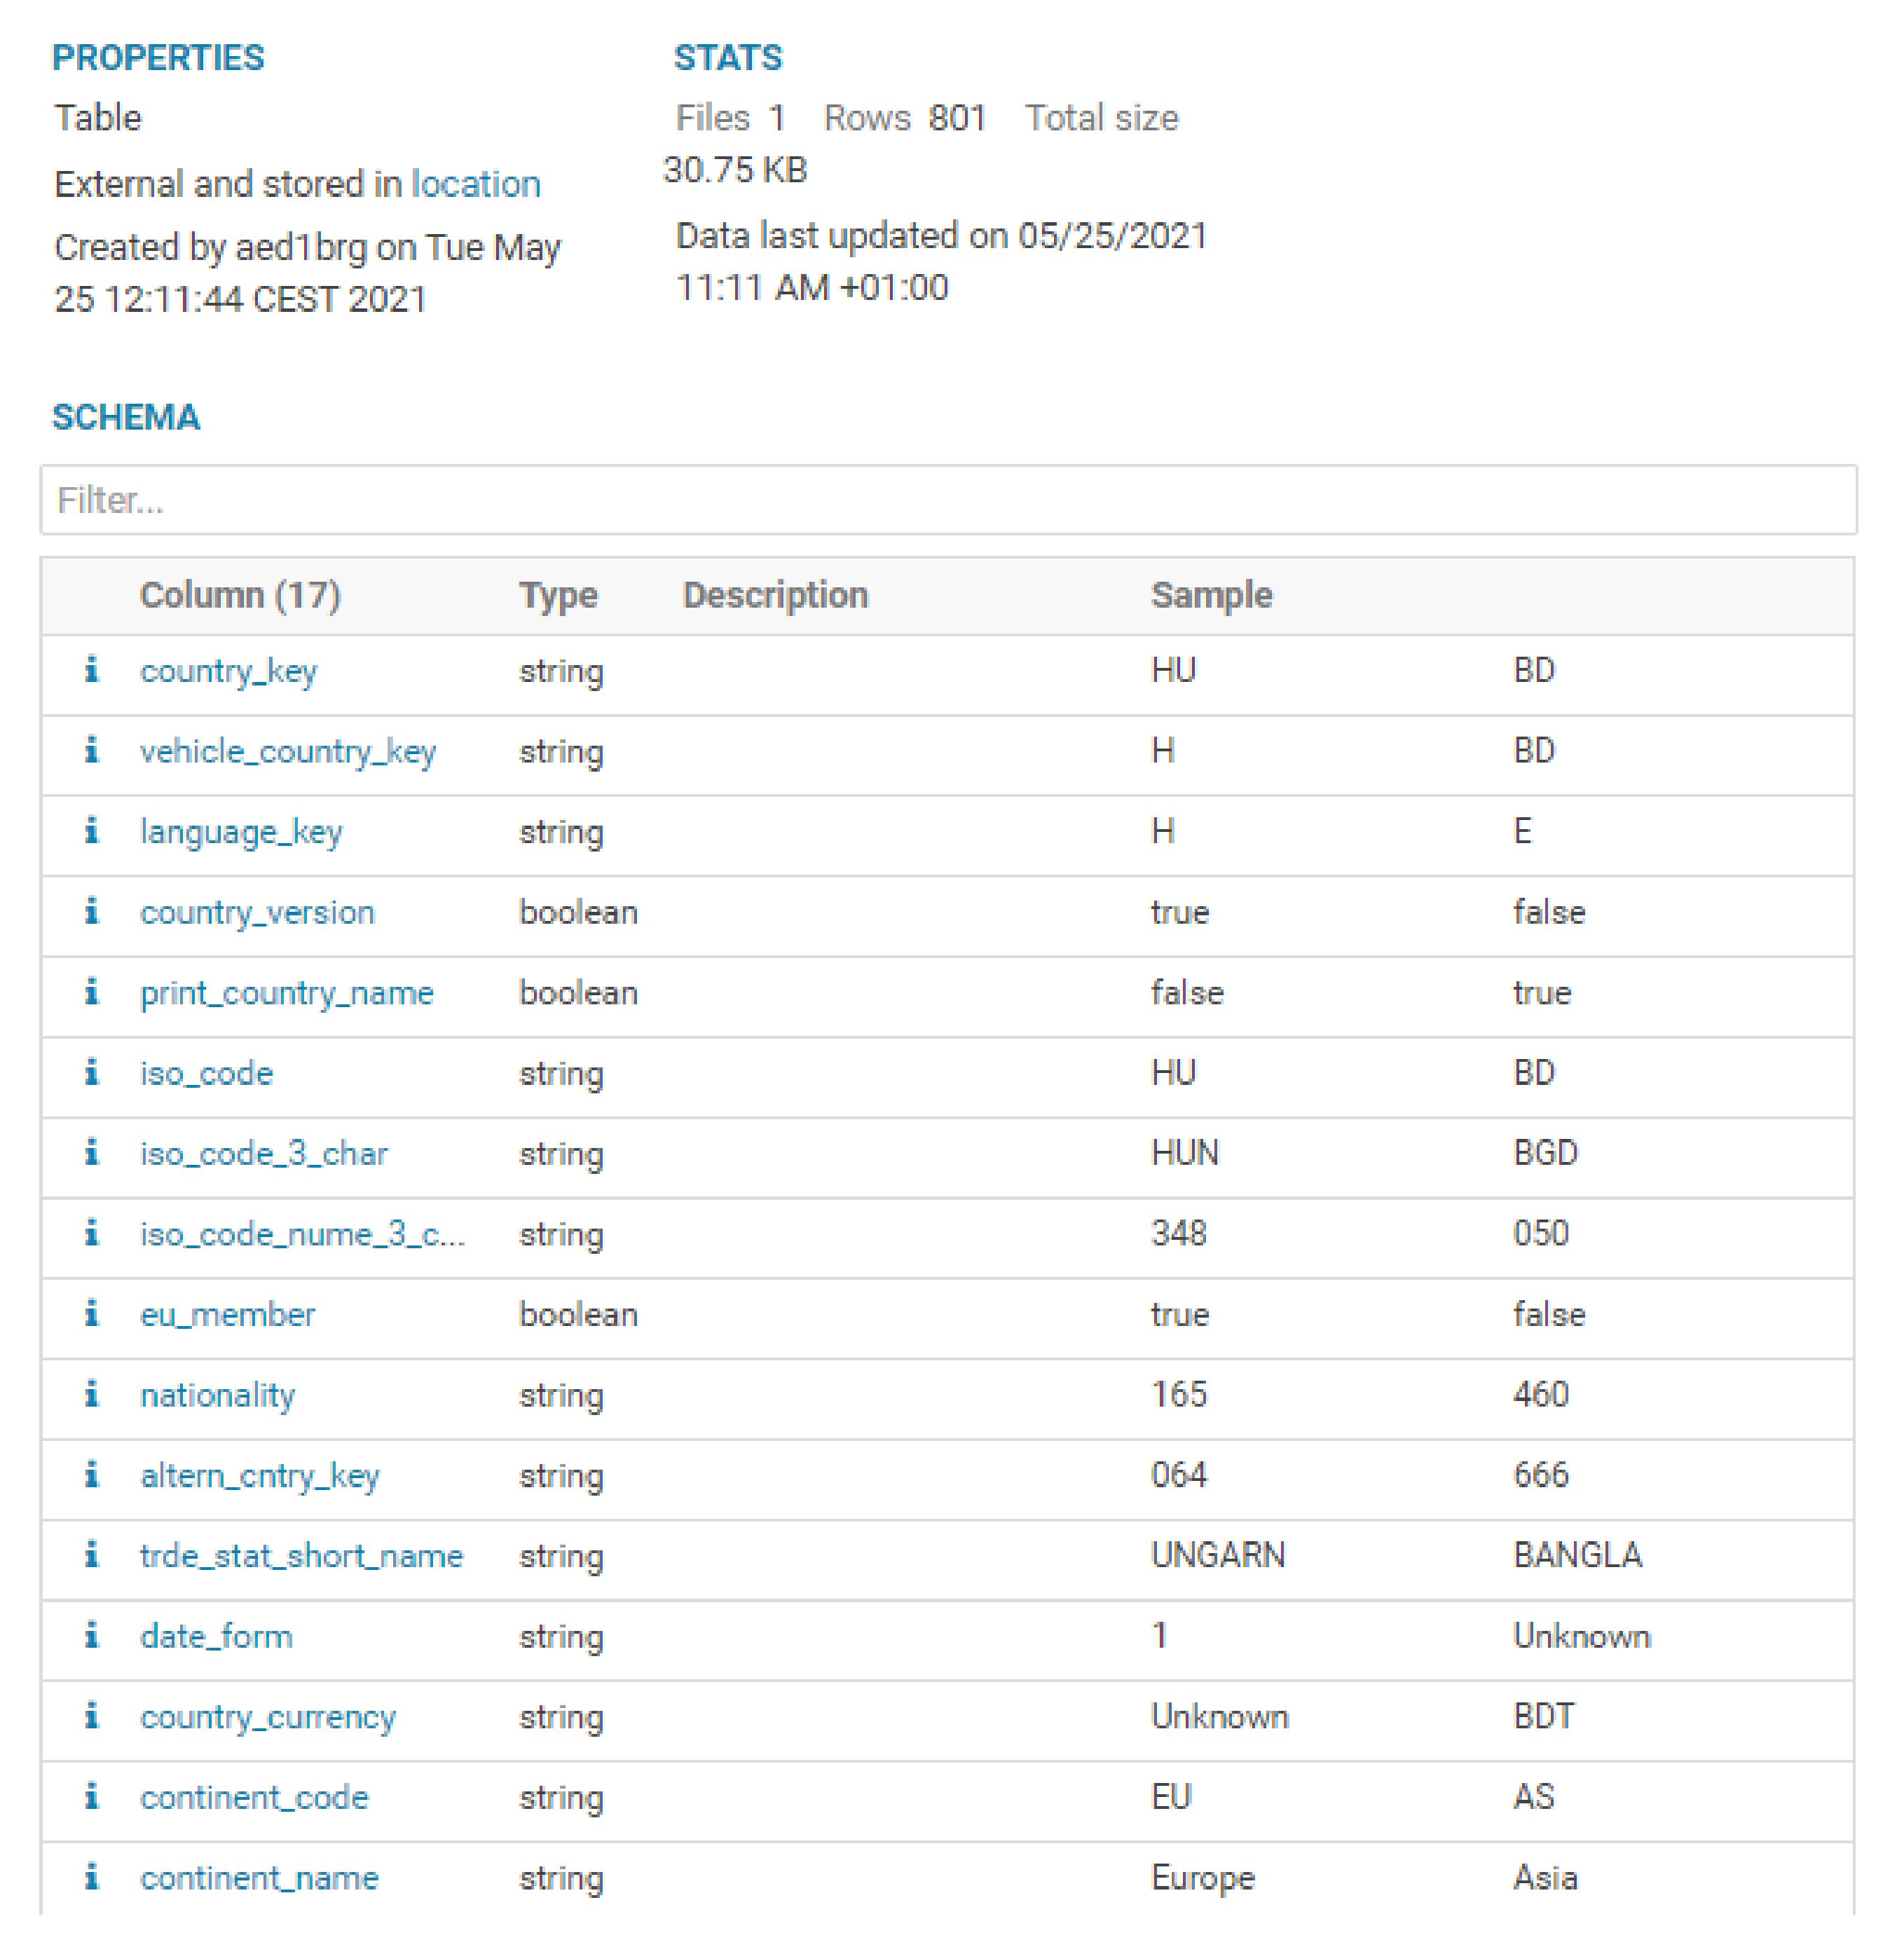
4. Demonstration Case

The application domain addressed in this paper is the Logistics Innovation Department of an automotive factory. In this context, the logistics department handles large volumes of data related to nearly 7000 raw materials from a set of about 400 suppliers spread all over the globe, which impact the production of about 1100 finished products. Concerning internal logistics management, the department is responsible for monitoring and analyzing data and material movements referring to approximately 85 daily scheduled deliveries, in order to ensure the supply of the material necessary for the proper functioning of about 100 production lines associated with various high-service-level customers. In light of the complexity of the organization’s supply chain topology, the organization intends to foster the proposal, development, and evaluation of Big Data Analytics tools capable of integrating and automating a large part of the logistics processes that, until now, have been managed by conventional spreadsheets extracted from classic and parameterizable Material Requirements Planning (MRP) methodologies existing in a given Enterprise Resource Planning (ERP) system.
It is an essential department inside of a production facility and deals on a daily basis with orders, deliveries, delays, production plans, and inventory, among other processes. These business processes are crucial to maintain the production lines and to deliver in time the finished goods to the clients. It is a complex and enormous department with countless business processes.
Due to this complexity, the implementation of a BDW needs to be addressed in an interactive way, choosing one process at a time, looking at the data sources, selecting the appropriate attributes, and modeling the data in a data-driven approach that has as a final goal an integrated BDW supporting Logistics 4.0.
Therefore, in this specific case, to start the BDW proposal, we analyzed the processes that should be considered the core component of this BDW. With the collaboration of key experts in the logistics department, the following processes were selected: Product Inventory, Delivery, Purchase Order, and Needs. This is the first task in the development process presented in Figure 3.
These processes are the main drivers of the analytical objects in the BDW. Besides these objects, other objects will be created, such as a spatial object with information related to countries, Date and Time objects, and complementary analytical objects such as Product, Plant, and Vendor. Each one of these processes is supported by one or more tables in the Enterprise Resource Planning (ERP) used by the organization. These different types of objects are explained later in this section.
The understanding and selection of the business processes, together with the understanding and selection of the data sources, compose the first activity of the development process (Figure 3) called Data Understanding. In this activity, it is necessary to understand the data from the data sources, namely the tables associated with each business process, how they are related, their private and foreign keys, and the meaning and possible values of each attribute, among other steps. The second task is to select what tables will be used to develop the BDW.
The next activity is related to the “Data Quality” activity. Data quality is one of the most important tasks in data-related projects. In this case, this activity has significant importance due to the complexity of the data sources and their high number of attributes. For example, some transactional tables have more than 200 attributes, although many of them are not used. In our demonstration case, data quality criteria were defined to verify if an attribute would be used in the BDW. In this specific case, we established that any attribute with more than 90% of empty or null values would not be used. This rule was essential to limit the number of attributes used, excluding the ones that have low analytical value. Another rule that was used was to manually verify if the attributes with only one or two distinct values were worth using. All these rules were defined considering the organizational and decision-making context. The next step was to produce the data quality reports through the execution of several spark jobs that analyzed the data extracted from the HDFS. The attributes that will be part of the BDW were selected by applying the previously defined data quality criteria.
After the Data Understanding and the Data Quality, it was possible to model the BDW. To do that, the modeling methodology presented by Santos and Costa [20] was applied in order to propose a data model capable of integrating a significant amount of data. The methodology was based on the creation of the following objects: Analytical Objects, Complementary Analytical Objects, Spatial Objects, Time Object, and Date Object.
An Analytical Object is a subject of interest, highly denormalized, and can answer queries by itself avoiding joins with other objects. These objects are directly related to the business processes such as sales or deliveries and should be the firsts to be analyzed and identified in order to verify if it is necessary, or not, to create Complementary Analytical Objects. A Complementary Analytical Object is an object that includes attributes usually used or shared by different Analytical Objects and that can be used to complement the analysis of other objects, such as the Analytical Objects. Each object can be divided into two distinct parts, the descriptive and analytical families. These families provide a logical group for the object attributes depending on their type and purpose. The descriptive family groups all the attributes that can provide different perspectives of analysis of the business indicators, while the analytical family groups the attributes with those business indicators to analyze the business process or part of it. These objects can be integrated with the use of join operations [20]. Figure 4 presents the data model identified with the application of this methodology. Due to privacy concerns, it is only possible to disclose some of the attributes present in the several objects This data model was developed in the logistics context of this specific factory, but can be used as starting point for any logistics department of any organization.
The Analytical Objects used in this work are: Product Inventory, which has all the information about the stocks of each product; Deliveries, which has information about when each order was delivered; Purchase Order, which has information about how many products are ordered; and Needs, which has information about the production lines’ needs.
The Time and Date Objects were created from scratch and populated with information related to each one. For example, in the Date Object, we created Boolean attributes such as week_day, weekend, summer, winter, Monday, Tuesday, and others. In the Time Object, attributes such as lunch-time, in-office, out-of-office, and rush hour, were created. This allowed us to analyze the relevant information and contextualize it in time and by date.
The Complementary Analytical Objects emerged in the data modeling process due to the need to analyze different Analytical Objects using data from the Complementary Analytical Objects. In these objects was stored relevant and specific data that could provide useful information when used together with data from several Analytical Objects. From these objects, we can highlight the following: Plant, Product, and Vendor.
The object Country is a Spatial Object due to the geographical domain, which includes information from the transactional database and from a JSON file (already stored in the HDFS) with more information, such as the continent name.
The implementation process presented in Figure 5 starts with the data extraction performed using the Sqoop and Oozie Workflows, and all the data were stored in a HDFS directory called Sandbox. This Sandbox directory allows the storage of all raw data, and it is divided into subdirectories where each data source has its own directory and is divided into tables or entities. In this demonstration case, two data sources were used, the transactional database and a JSON file.
With all the necessary data stored in HDFS, we can use Spark to perform the data transformation phase, where transformations and partition keys are identified. Moreover, it is in this phase that the data enrichment can be performed with predictions from the machine learning models.
After the data transformation, the data are stored in the BDW, where each table represents one of the objects included in the data model. Moreover, when the size of the object is too large to be used as one unique file, the object is partitioned according to its partition keys in order to improve the performance when querying the data. Furthermore, external Hive tables were created to provide Impala access to data. Impala is the SQL query engine that allows the connection between Power BI and the data stored in the HDFS.

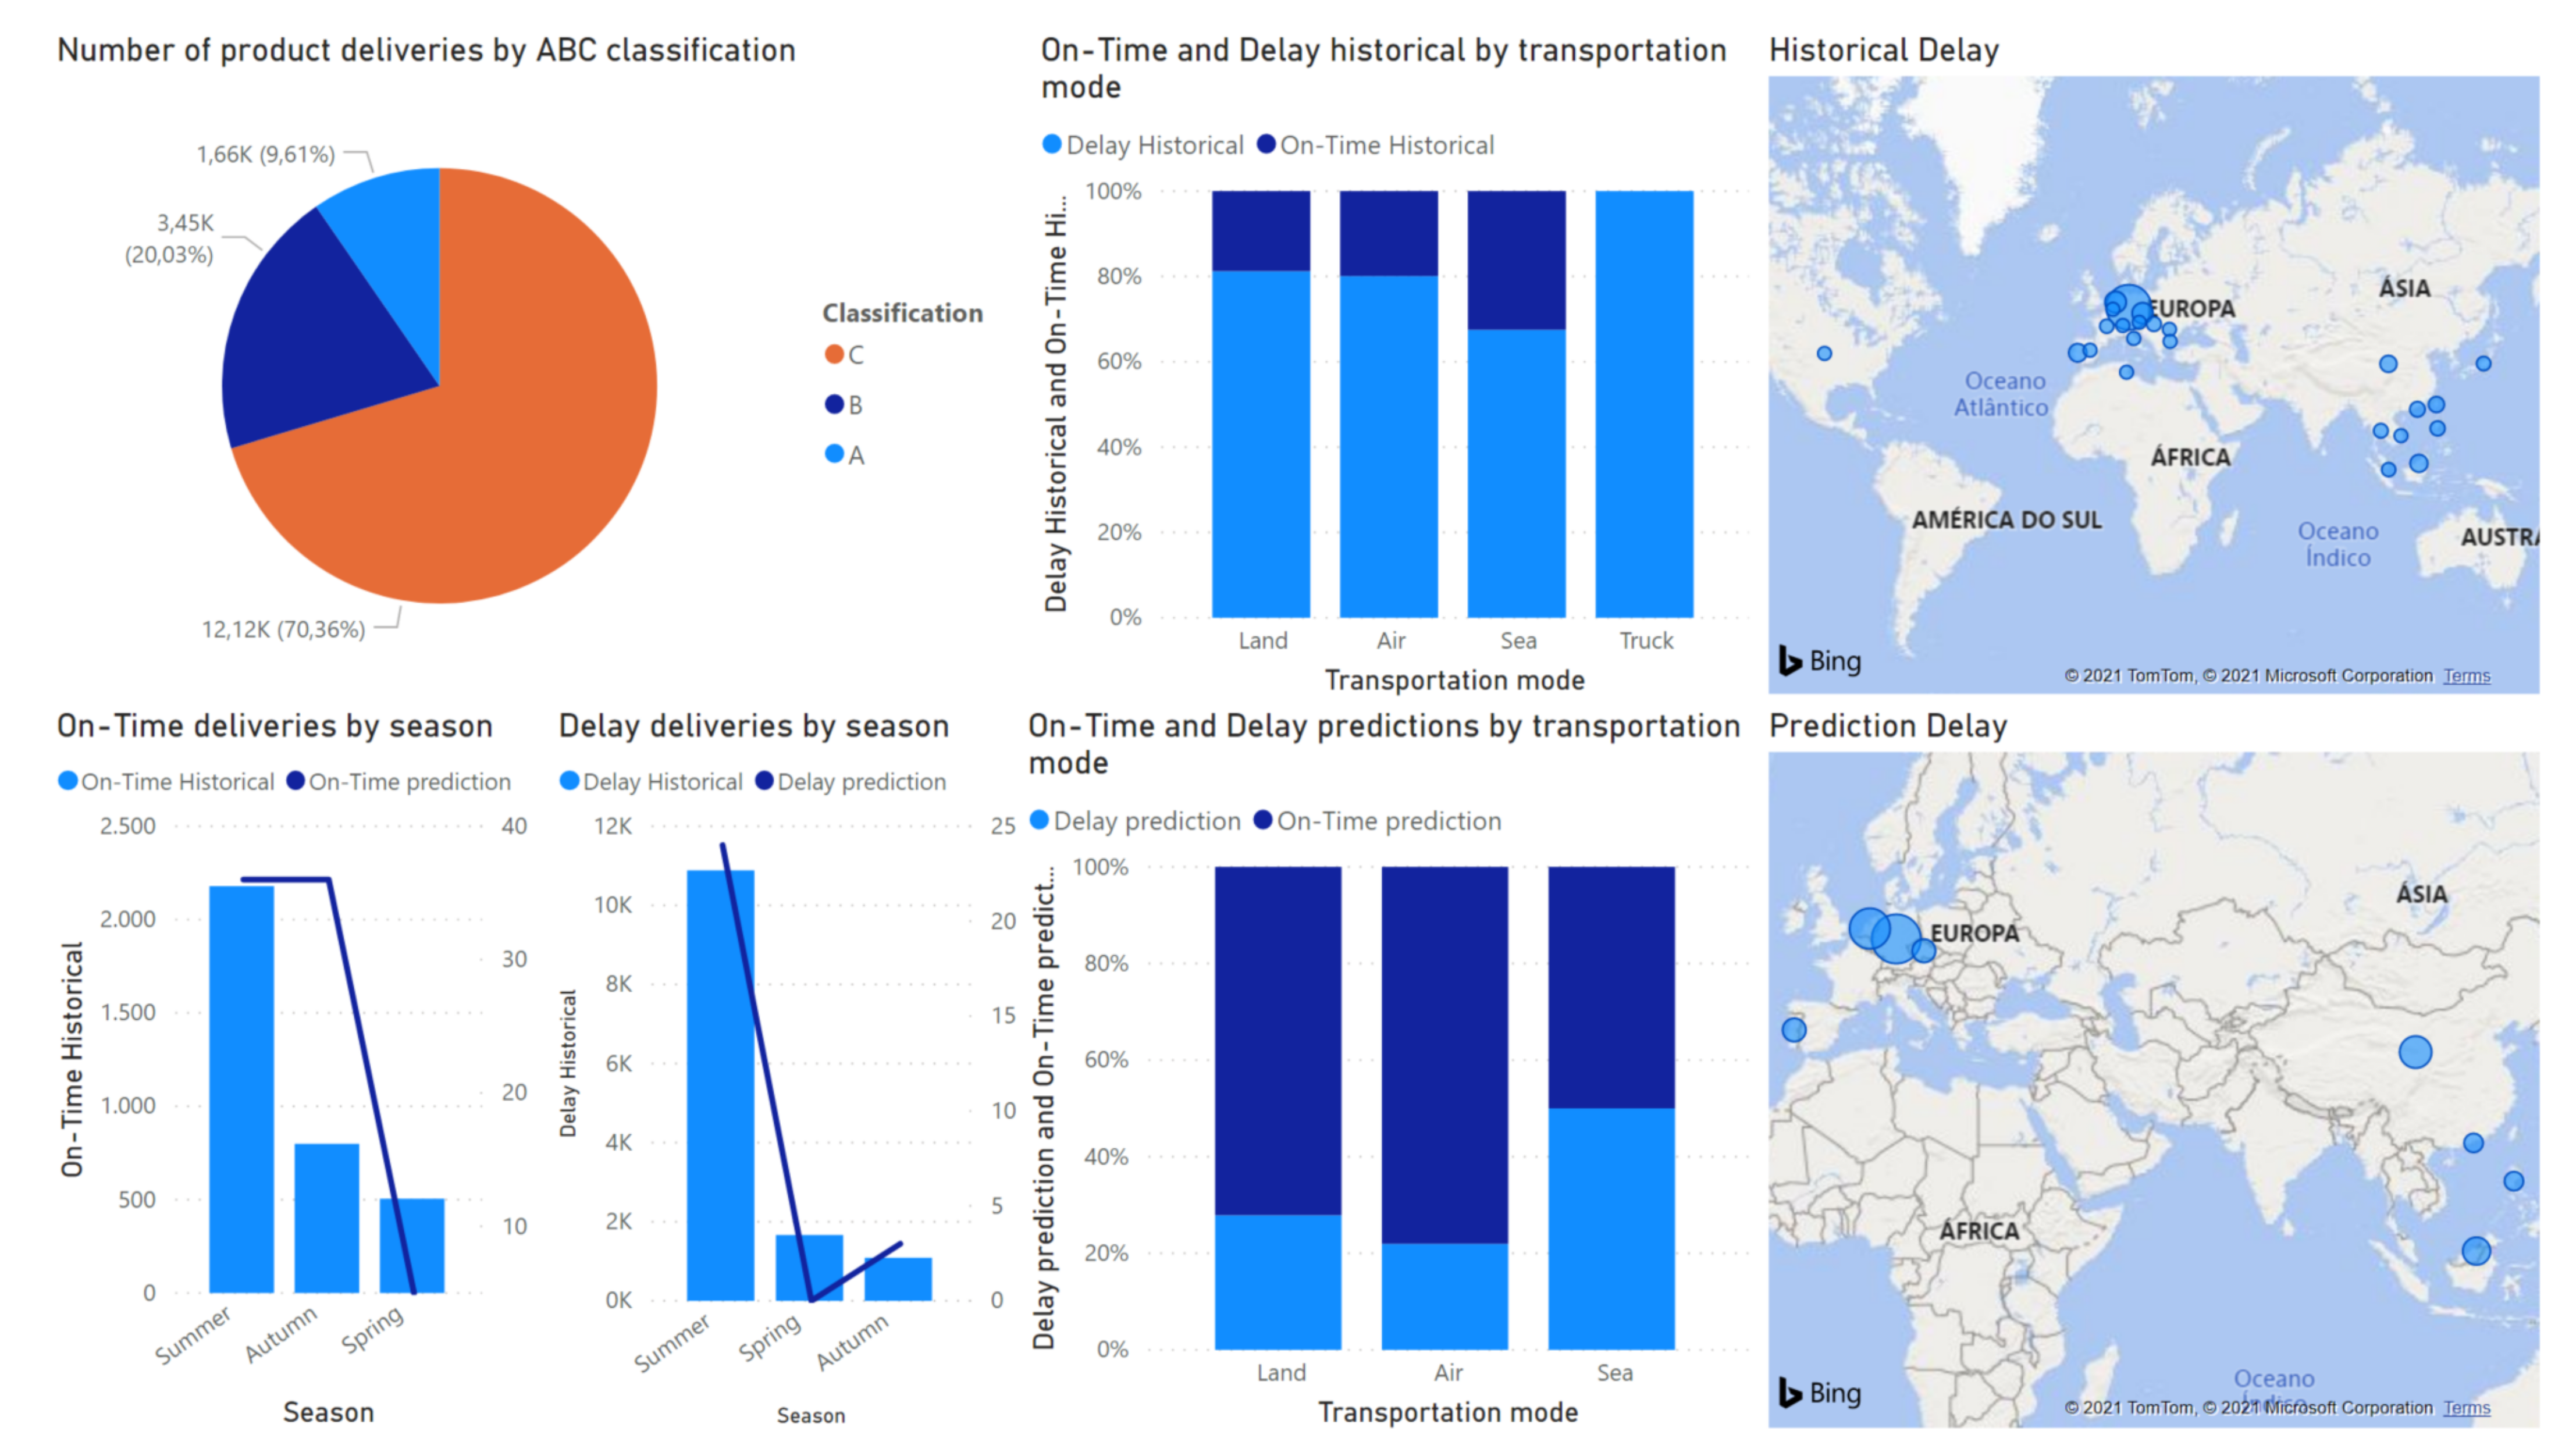
5. Results and Discussion

In this section, we discuss the efficacy and efficiency (Section 5.1) of the BDW implementation. In Section 5.2 and Section 5.3, the challenges and opportunities faced in the development of this work are presented.

5.1. Efficacy and Efficiency

With the BDW implementation, it was possible to create a data repository that includes several businesses processes of the logistics department. Each process contains data from one or more tables from the transactional database used by the organization.
The data model is dynamic and able to change quickly, in order to include more tables, with more information related to any object that already exists in the BDW or to create new ones. The Time and Date objects can be used with other objects to understand the organization’s temporal dynamics, such as understanding if there are any specific moments in the year where more delays are verified or even when the suppliers are usually late with the deliveries. Similar reasoning can be used with the objects Plant and Inventory to analyze which plant has more inventory in its storage facilities.
With this work, it is now possible for the practitioners to use raw data extracted from the data sources (using the Sandbox Layer) or to use data already cleaned and transformed using the BDW layer. This can be achieved using the BDW Hive tables (as an example, Figure 6 shows the Country table view using the HUE interface) or the parquet files stored in the HDFS. They can also create specific materialized objects in the Application Layer in order to decrease the time needed to query the data. This reduces or even avoids the initial development time needed to understand, extract, store, and transform data.
The Machine Learning component can also use data from the different architecture components to provide useful predictions. For example, the available data can be used to predict if some scheduled delivery will be late or not. With this information, the logistics planners can take several actions to reduce the impact of this situation. This can be achieved using data from the Sandbox or from the BDW. Machine learning models can be created with this data using the Spark ML framework. Both the model and the predictions are stored in the HDFS, being available for later use and for possible updates in the future. Furthermore, these data are now accessible to the organization through the Impala connector and can be used to provide different insights about the organization’s status or even in projects that use machine learning to predict or classify data to help in the decision-making. This means that the time and the necessary knowledge to develop useful dashboards for management are smaller. In Figure 7, a dashboard that analyses historical and predicted data is presented, showing information about deliveries. It is an overview where the historical and predicted delayed or on-timedeliveries are analyzed in several dimensions.
The top right component of the dashboard shows the number of products that belong to each category (A, B, or C). This product classification demonstrates how important each product is for the organization. Products classified with A mean that these are expensive products for the organization and normally have more lead time, for example electronic screens. The B category is for less expensive products, and the C category is for inexpensive products such as bolts. The impact on delays for products classified as A is superior to the products classified as B and C. The graph shows that there is a bigger number of deliveries of C classification products, demonstrating that this type of product has more frequent deliveries. Therefore, if for some reason there is a shortage in the stock of this product type, the organization will be able to solve that problem rapidly.
The two graphs in the lower-left corner of the dashboard compare the on-time deliveries and the delayed deliveries analyzed by the season of the year. Each one compares the historical data and the predictions made by the machine learning algorithm. The left one shows that the predictions followed the trend of the historical date. The right one shows that an increase in delays in autumn was predicted. With this information, the organization can prepare mitigation actions to decrease the impact of the delays.
The middle graphs compare the delayed deliveries and on-time deliveries by transportation mode. For example, we can see that the predictions (center lower graph) show a general increase in the percentage of on-time deliveries.
The right-side graphs compare the historical data with delays and the predictions. Bigger circles point out that more deliveries from those countries will arrive with delays. We can see more delays from products shipped by European countries. The same was predicted by the machine learning algorithm.
These results were based on a portion of the historical data provided by the organization. In future work, the accuracy of the predictions will be verified to see if they conform to the organization’s needs. More data will be also used to improve the model quality.

5.2. Challenges

The implementation of a new technology inside an organization’s logistics department can be difficult and raises diverse types of challenges. These challenges can be related to the technology itself, to the lack of knowledge to develop the project, to the organizational culture, and to the time and cost to develop the project, among others. When that technology uses or relies on the provided transactional data to be successful, several new types of challenges related to data emerge.
Moreover, if the organization has a large dimension, it can be extremely difficult to obtain the necessary knowledge to understand the different business processes inside the logistics department and the data generated by them. For example, if we are inside of a multinational organization, with diverse divisions, spread over multiple countries, with a complex transactional database, the data understanding will be one of the most challenging steps in the project.
The following list provides the identification and brief characterization of the most relevant challenges that were faced through the development of this work:
  • Data and technological challenges:
    • Data understanding:
      Understanding the data that are stored in the transactional database is usually a challenge, made even worse when the organization is a multinational with a considerable dimension. Transactional databases are complex systems, with misleading tables and attribute names. The existing documentation about the data source is usually sparse, not given enough insight into the data. Several logistics concepts need to be known, such as safety stock, safety time, delivery time, and procurement, among others, in order to better understand the data and their relationships;
    • Poor or missing raw data:
      When an organization starts a project that will use the raw data generated by the daily business, it is necessary to identify if the necessary data are being generated and stored in the transactional system and their overall quality. Sometimes, the project goals cannot be achieved due to the lack of data or data quality. In complex ERP systems, it is possible to verify that many attributes are not used by the organization. For example, in logistics, knowing where an order is in transit to its destination can be very useful to predict if it will be on time, or not, and to make decisions about how to avoid stops in the production line;
    • Different values in different data sources for the same attribute:
      Due to the large and complex transactional system, it is fairly common to find the same attribute in different tables, related to the same entity, but with different values. Understanding why this happens and understanding the type of situations that motivate this type of behavior can be difficult;
    • Technological infrastructure:
      An adequate technological infrastructure is essential for a stable project development. In an organization, the technological infrastructure can be based on outdated technology or the technological infrastructure can change during the project lifetime. This will lead to the project’s adaptation to the existing technologies or their evolution as the infrastructure changes;
  • Organizational challenges:
    • Access to data and to a technological infrastructure:
      One of the first tasks in projects of this nature is to gain access to data and to the infrastructure that will be used to process and store them. This is a task that needs to be performed at the beginning of the project and where the organizations’ policies can interfere in a negative way. This cannot be an obstacle or take a long time to overcome;
    • Understand the business processes:
      Commonly, large organizations have many and complex business processes, with diverse rules, exceptions, and paths, which can be difficult to understand. Moreover, the documentation about the business processes can be insufficient, creating another obstacle in this type of project. In the logistics area, where daily interactions with the suppliers and their systems exist, where processes are complex in order to achieve better results in the production line, and where concepts such as just-in-time production are being implemented, the documentations has a relevant impact when new projects start to be developed;
  • Project team challenges:
    • Lack of knowledge of the technologies used:
      As Big Data is a recent concept, there is a lack of human resources with experience in the technologies used to support this concept. Building a team without any experience in Big Data can lead to several problems in the project. Moreover, when adding specific requirements of a complex area such as logistics, it is more difficult to find multidisciplinary teams with knowledge in both areas;
    • Lack of sufficient human resources:
      To develop such a complex project, the project team needs an adequate number of human resources. The lack of sufficient human resources can cause delays in project development. Teams with a high number of elements can be prejudicial to the project as well, but very small teams lead to a lack of different backgrounds and points of view, which can hinder the project.
The challenges enumerated in this section are some of the biggest challenges that a team can encounter while developing and implementing a BDW inside of an organization of a considerable size. The challenges can cause delays in the project milestones, and they should be taken into account when the project is planned. Most of them can be mitigated with simple actions such as granting early access to all necessary resources and developing the necessary documentation for all the projects.

5.3. Opportunities

When an organization goes through a technological change such as the creation of a BDW, some opportunities emerge. Indeed, we can say that each challenge can be transformed into one opportunity. Therefore, we take the challenges provided in Section 5.2 and transform them into opportunities:
  • Data and technological opportunities:
    • Improve documentation:
      Very often, documentation is treated as the least important part of the project. The time and effort put into documentation development are lower than required, leading to poor documentation. With the development of a new project, the poor documentation of the previous one becomes evident. The effort that needs to be made to understand the previous project can be reused to improve the documentation and, therefore, decrease the time and effort needed for the next ones;
    • Improve data quality:
      Data quality is essential to the development of these data-based projects. As we need to perform data quality tasks, this can be used to detect and report data problems that can be fixed in the near future. This can be useful not only for this project, but even for past and future projects.
    • Technological infrastructure:
      A new project that requires new technology can be an excellent driver to improve the technological infrastructure existent in the organization. These changes can include, for example, updating the existent technologies or the implementation of new ones;
  • Organizational opportunities:
    • Improve internal processes:
      With the implementation of a new technology, some internal processes will be analyzed and can be improved. Moreover, processes can use the newly available technology to improve their performance;
    • Improve business processes’ documentation:
      Many analytical teams do not know the business processes, and they need to find the right person to ask. Often, if they ask the same question of different persons, they will receive different answers. Properly documenting the business processes can be a key way to improve the business understanding, not only inside the analytical teams, but for the organization in general;
  • Project team opportunities:
    • Creation of a team specialized in Big Data technologies:
      Research projects can have a tremendous impact on organizations, not only by the obtained results, but also by the improved capabilities of human resources. In this specific case, the creation of one team specialized in Big Data technologies can boost more projects, more efficiently, and with more efficacy;
    • Improve workers’ knowledge in logistics processes:
      Human resources with more business knowledge can bring their knowledge to other projects and have a positive impact on them. This can be verified not only in new ones, but also in the maintenance and improvement of other ongoing projects;
    • Improve workers’ knowledge about data sources:
      Data analytics projects always depend on the data source. Knowledge about them is essential for a good start and a proper development of the project. It is crucial to have in the project team, at least, one specialized resource in the data sources, helping the development team understand the data.
Besides the enumerated opportunities, other opportunities can arise with the creation and implementation of a BDW in a logistics department. For example, new projects can be initiated and use the BDW as their data source, providing integrated and consolidated data for their timely development. Other departments can use data in the BDW to improve their predictions and their decision-making needs.

6. Conclusions and Future Work

This paper presented the proposal and implementation of a BDW in a logistics department of an automotive factory. The implementation of the BDW is the starting point to push the concept of Logistics 4.0 in this facility, improving the analytical capabilities and supporting the decision-making process in the logistics department. Moreover, we highlighted several challenges and opportunities that normally are not considered in other works.
Through this work, we presented the logical and technological architectures that support the implementation of the BDW, which includes several logistics processes. Moreover, we presented the proposed BDW data model. The BDW data model is a key element to gain insight into the current state of the organization and to support the logistics planners’ decisions efficiently. The logical and technological architecture, as well as the data model can be used as starting a point to develop and implement a BDW in similar logistics departments.
As we advanced, we faced several challenges and opportunities in the BDW development and implementation. One of the most difficult challenges was to understand the several logistics processes and how the data of these processes were stored in the transactional system. Finding the right data to support the proposed system was a difficult and time-consuming task. Nevertheless, the most important thing is to be aware of the challenges and implement mitigation plans in order to solve them, or at least decrease their impact on the project final results. Other challenges that can be faced in this area are related to the technologies and the available infrastructure used by the organization. Sometimes, the technological infrastructure changes during the project, which can lead to several project changes. Moreover, the available infrastructure can include outdated technologies or be short in resources when used by several teams at the same time.
In the opportunities field, several points that can be addressed to improve the organization, the logistics department, and the next projects. However, these opportunities need to be addressed in new projects with a well-defined goal and scope, due to the new challenges that these projects will present. Organizations need to promote a culture of continuous improvement to face these opportunities.
As future work, the BDW implementation can be improved by automatizing the data extraction, transforming, and enrichment pipelines to increase the performance and decrease the human intervention. Moreover, the data model can be extended by adding new objects (complementary or analytical) in order to enlarge their scope or improve the existent ones by adding new data to the already existing objects. Furthermore, more machine learning models can be created and integrated into the existing BDW to enrich the data and provide predictions to help the logistics planners. Furthermore, the implementation of a real-time layer should be taken into consideration.

Author Contributions

Conceptualization, N.S. and J.B.; investigation, N.S. and J.B.; software, N.S. and J.B.; supervision, M.Y.S., C.C., P.C. and M.S.C.; writing—original draft, N.S. and J.N.C.G.; writing—review and editing, M.Y.S. and C.C. All authors have read and agreed to the published version of the manuscript.

Funding

This work was supported by FCT–Fundação para a Ciência e Tecnologia—within the R&D Units Project Scope: UIDB/00319/2020 and doctoral scholarship grants: PD/BDE/142895/2018 and PD/BDE/142900/2018.

Acknowledgments

This work was designed using resources from: Those Icons, Pixel perfect, DinosoftLabs, Becris, Smashicons, and Freepik from www.flaticon.com (accessed on 5 September 2021).

Conflicts of Interest

The authors declare no conflict of interest.

References

  1. Tang, C.S.; Veelenturf, L.P. The strategic role of logistics in the industry 4.0 era. Transp. Res. Part E Logist. Transp. Rev. 2019, 129, 1–11. [Google Scholar] [CrossRef]
  2. Santos, M.Y.; Oliveira e Sá, J.; Andrade, C.; Vale Lima, F.; Costa, E.; Costa, C.; Martinho, B.; Galvão, J. A Big Data system supporting Bosch Braga Industry 4.0 strategy. Int. J. Inf. Manag. 2017, 37, 750–760. [Google Scholar] [CrossRef]
  3. Winkelhaus, S.; Grosse, E.H. Logistics 4.0: A systematic review towards a new logistics system. Int. J. Prod. Res. 2020, 58, 18–43. [Google Scholar] [CrossRef]
  4. Ghadge, A.; Kara, M.E.; Moradlou, H.; Goswami, M. The impact of Industry 4.0 implementation on supply chains. J. Manuf. Technol. Manag. 2020, 31. [Google Scholar] [CrossRef]
  5. Panetto, H.; Iung, B.; Ivanov, D.; Weichhart, G.; Wang, X. Challenges for the cyber-physical manufacturing enterprises of the future. Annu. Rev. Control 2019, 47, 200–213. [Google Scholar] [CrossRef]
  6. Kostrzewski, M.; Varjan, P.; Gnap, J. Solutions dedicated to internal logistics 4.0. In Sustainable Logistics and Production in Industry 4.0; Springer: Berlin/Heidelberg, Germany, 2020; pp. 243–262. [Google Scholar]
  7. Oleśków-Szłapka, J.; Stachowiak, A. The Framework of Logistics 4.0 Maturity Model. In Proceedings of the Intelligent Systems in Production Engineering and Maintenance, Wroclaw, Poland, 17–18 September 2018; Burduk, A., Chlebus, E., Nowakowski, T., Tubis, A., Eds.; Springer: Cham, Switzerland, 2019; pp. 771–781. [Google Scholar]
  8. Strandhagen, J.O.; Vallandingham, L.R.; Fragapane, G.; Strandhagen, J.W.; Stangeland, A.B.H.; Sharma, N. Logistics 4.0 and emerging sustainable business models. Adv. Manuf. 2017, 5, 359–369. [Google Scholar] [CrossRef]
  9. Yavas, V.; Ozkan-Ozen, Y.D. Logistics centers in the new industrial era: A proposed framework for logistics center 4.0. Transp. Res. Part E Logist. Transp. Rev. 2020, 135, 101864. [Google Scholar] [CrossRef]
  10. Torbacki, W.; Kijewska, K. Identifying Key Performance Indicators to be used in Logistics 4.0 and Industry 4.0 for the needs of sustainable municipal logistics by means of the DEMATEL method. Transp. Res. Procedia 2019, 39, 534–543. [Google Scholar] [CrossRef]
  11. Ngo, V.M.; Le-Khac, N.A.; Kechadi, M.T. Designing and Implementing Data Warehouse for Agricultural Big Data. In Proceedings of the Big Data—BigData 2019, San Diego, CA, USA, 25–30 June 2019; Chen, K., Seshadri, S., Zhang, L.J., Eds.; Springer International Publishing: Cham, Switzerland, 2019; pp. 1–17. [Google Scholar]
  12. Sebaa, A.; Chikh, F.; Nouicer, A.; Tari, A. Medical Big Data Warehouse: Architecture and System Design, a Case Study: Improving Healthcare Resources Distribution. J. Med. Syst. 2018, 42, 59. [Google Scholar] [CrossRef]
  13. Santoso, L.W.; Yulia. Data Warehouse with Big Data Technology for Higher Education. Procedia Comput. Sci. 2017, 124, 93–99. [Google Scholar] [CrossRef]
  14. Aftab, U.; Siddiqui, G.F. Big Data Augmentation with Data Warehouse: A Survey. In Proceedings of the 2018 IEEE International Conference on Big Data (Big Data), Seattle, WA, USA, 10–13 December 2018; pp. 2775–2784. [Google Scholar] [CrossRef]
  15. Costa, C.; Santos, M.Y. Evaluating several design patterns and trends in big data warehousing systems. In Proceedings of the International Conference on Advanced Information Systems Engineering, Tallinn, Estonia, 11–15 June 2018; Springer: Berlin/Heidelberg, Germany, 2018; pp. 459–473. [Google Scholar]
  16. Chevalier, M.; Malki, M.E.; Kopliku, A.; Teste, O.; Tournier, R. Implementing Multidimensional Data Warehouses into NoSQL. In Proceedings of the 17th International Conference on Enterprise Information Systems (ICEIS 2015) Held in Conjunction with ENASE 2015 and GISTAM 2015, Barcelona, Spain, 27–30 April 2015; INSTICC—Institute for Systems and Technologies of Information, Control and Communication: Setubal, Portugal, 2015; pp. 172–183. [Google Scholar]
  17. Gröger, C.; Schwarz, H.; Mitschang, B. The Deep Data Warehouse: Link-Based Integration and Enrichment of Warehouse Data and Unstructured Content. In Proceedings of the 2014 IEEE 18th International Enterprise Distributed Object Computing Conference, Ulm, Germany, 1–5 September 2014; pp. 210–217. [Google Scholar] [CrossRef]
  18. Kiran, M.; Murphy, P.; Monga, I.; Dugan, J.; Baveja, S.S. Lambda architecture for cost-effective batch and speed big data processing. In Proceedings of the 2015 IEEE International Conference on Big Data, IEEE Big Data 2015, Santa Clara, CA, USA, 29 October–1 November 2015; pp. 2785–2792. [Google Scholar] [CrossRef] [Green Version]
  19. NBD-PWG. NIST Big Data Interoperability Framework: Volume 6, Reference Architecture; Technical Report NIST SP 1500-6; National Institute of Standards and Technology: Gaithersburg, MD, USA, 2015. [Google Scholar]
  20. Santos, M.Y.; Costa, C. Big Data: Concepts, Warehousing, and Analytics. In Big Data: Concepts, Warehousing, and Analytics; River Publishers: Aalborg, Denmark, 2020; pp. 1–284. [Google Scholar]
  21. Chou, S.; Yang, C.; Jiang, F.; Chang, C. The Implementation of a Data-Accessing Platform Built from Big Data Warehouse of Electric Loads. In Proceedings of the 2018 IEEE 42nd Annual Computer Software and Applications Conference (COMPSAC), Tokyo, Japan, 23–27 July 2018; Volume 2, pp. 87–92. [Google Scholar] [CrossRef]
  22. Santos, M.Y.; Martinho, B.; Costa, C. Modelling and implementing big data warehouses for decision support. J. Manag. Anal. 2017, 4, 111–129. [Google Scholar] [CrossRef]
  23. Wang, X.; Yang, K.; Liu, T. The Implementation of a Practical Agricultural Big Data System. In Proceedings of the 2019 IEEE 5th International Conference on Computer and Communications (ICCC), Chengdu, China, 6–9 December 2019; pp. 1955–1959. [Google Scholar] [CrossRef]
  24. Doreswamy; Gad, I.; Manjunatha, B.R. Hybrid data warehouse model for climate big data analysis. In Proceedings of the 2017 International Conference on Circuit, Power and Computing Technologies (ICCPCT), Kollam, India, 20–21 April 2017; pp. 1–9. [Google Scholar] [CrossRef]
  25. Costa, C.; Santos, M.Y. The SusCity Big Data Warehousing Approach for Smart Cities. In Proceedings of the 21st International Database Engineering, IDEAS 2017, Bristol, UK, 12–14 July 2017; Applications Symposium. Association for Computing Machinery: New York, NY, USA, 2017; pp. 264–273. [Google Scholar] [CrossRef]
  26. Vieira, A.A.; Dias, L.; Santos, M.Y.; Pereira, G.A.; Oliveira, J. Supply Chain Risk Management: An Interactive Simulation Model in a Big Data Context. Procedia Manuf. 2020, 42, 140–145. [Google Scholar] [CrossRef]
  27. Shvachko, K.; Kuang, H.; Radia, S.; Chansler, R. The Hadoop Distributed File System. In Proceedings of the 2010 IEEE 26th Symposium on Mass Storage Systems and Technologies (MSST), Incline Village, NV, USA, 3–7 May 2010; pp. 1–10. [Google Scholar] [CrossRef]
  28. Dean, J.; Ghemawat, S. MapReduce: Simplified Data Processing on Large Clusters. Commun. ACM 2008, 51, 107–113. [Google Scholar] [CrossRef]
  29. Thusoo, A.; Sarma, J.S.; Jain, N.; Shao, Z.; Chakka, P.; Anthony, S.; Liu, H.; Wyckoff, P.; Murthy, R. Hive: A warehousing solution over a map-reduce framework. Proc. VLDB Endow. 2009, 2, 1626–1629. [Google Scholar] [CrossRef]
  30. Spark, A. Apache spark. Retrieved Jan. 2018, 17, 2018. [Google Scholar]
  31. Bittorf, M.; Bobrovytsky, T.; Erickson, C.; Hecht, M.G.D.; Kuff, M.; Leblang, D.K.A.; Robinson, N.; Rus, D.R.S.; Wanderman, J.; Yoder, M.M. Impala: A modern, open-source sql engine for hadoop. In Proceedings of the 7th Biennial Conference on Innovative Data Systems Research, Asilomar, CA, USA, 4–7 January 2015. [Google Scholar]
  32. L’Heureux, A.; Grolinger, K.; Elyamany, H.F.; Capretz, M.A.M. Machine Learning with Big Data: Challenges and Approaches. IEEE Access 2017, 5, 7776–7797. [Google Scholar] [CrossRef]
  33. Costa, C.; Andrade, C.; Santos, M.Y. Big Data Warehouses for Smart Industries. In Encyclopedia of Big Data Technologies; Springer International Publishing: Cham, Switzerland, 2018; pp. 1–11. [Google Scholar] [CrossRef]
  34. Aravinth, S.; Begam, A.H.; Shanmugapriyaa, S.; Sowmya, S.; Arun, E. An efficient HADOOP frameworks SQOOP and ambari for big data processing. Int. J. Innov. Res. Sci. Technol. 2015, 1, 252–255. [Google Scholar]
  35. Ivanov, T.; Pergolesi, M. The impact of columnar file formats on SQL-on-hadoop engine performance: A study on ORC and Parquet. Concurr. Comput. Pract. Exp. 2020, 32, e5523. [Google Scholar] [CrossRef]
  36. Baranowski, Z.; Grzybek, M.; Canali, L.; Garcia, D.L.; Surdy, K. Scale out databases for CERN use cases. J. Phys. Conf. Ser. 2015, 664, 042002. [Google Scholar] [CrossRef]
  37. Armbrust, M.; Xin, R.S.; Lian, C.; Huai, Y.; Liu, D.; Bradley, J.K.; Meng, X.; Kaftan, T.; Franklin, M.J.; Ghodsi, A.; et al. Spark SQL: Relational Data Processing in Spark. In Proceedings of the 2015 ACM SIGMOD International Conference on Management of Data, SIGMOD’15. Melbourne, VIC, Australia, 31 May–4 June 2015; Association for Computing Machinery: New York, NY, USA, 2015; pp. 1383–1394. [Google Scholar] [CrossRef]
  38. Meng, X.; Bradley, J.; Yavuz, B.; Sparks, E.; Venkataraman, S.; Liu, D.; Freeman, J.; Tsai, D.; Amde, M.; Owen, S.; et al. MLlib: Machine Learning in Apache Spark. J. Mach. Learn. Res. 2016, 17, 1235–1241. [Google Scholar]
  39. Qin, X.; Chen, Y.; Chen, J.; Li, S.; Liu, J.; Zhang, H. The Performance of SQL-on-Hadoop Systems—An Experimental Study. In Proceedings of the 2017 IEEE International Congress on Big Data (BigData Congress), Honolulu, HI, USA, 25–30 June 2017; pp. 464–471. [Google Scholar] [CrossRef]
Figure 1. Logical architecture.
Electronics 10 02221 g001
Figure 2. Technological architecture.
Electronics 10 02221 g002
Figure 3. Development process.
Electronics 10 02221 g003
Figure 4. BDW data model.
Electronics 10 02221 g004
Figure 5. Implementation process.
Electronics 10 02221 g005
Figure 6. Country table in Hive.
Electronics 10 02221 g006
Figure 7. Dashboard with historical and predicted data related to deliveries.
Electronics 10 02221 g007
Publisher’s Note: MDPI stays neutral with regard to jurisdictional claims in published maps and institutional affiliations.

