
A Real-Time Detection Algorithm for Kiwifruit Defects Based on YOLOv5


Abstract
:1. Introduction
2. Related Work
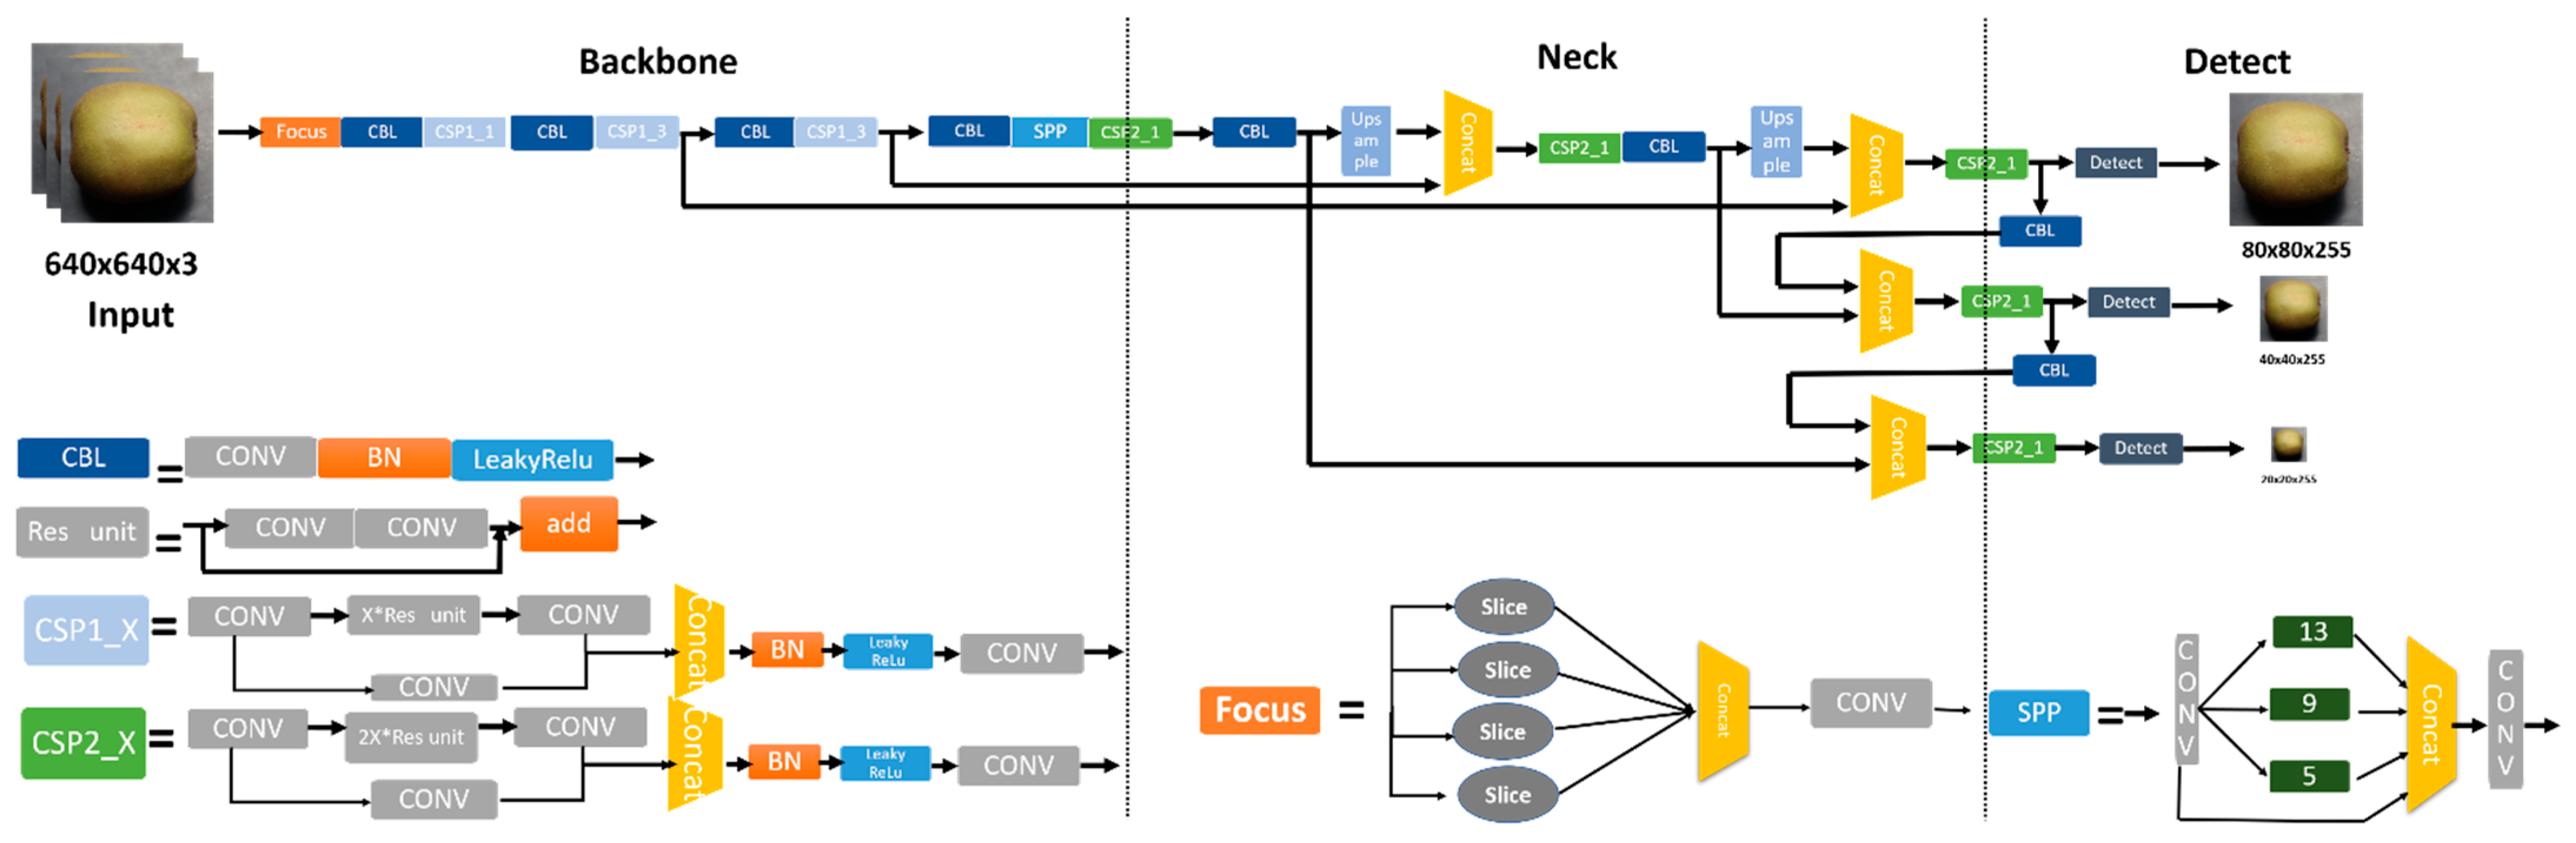
2.1. YOLO Algorithm
- Backbone: A convolutional neural network that aggregates and forms image features on different types of image granularity;
- Neck: A series of network layers that mix and combine image features and pass the image features to the prediction layer;
- Head: It can predict image features, generate bounding boxes, and predict categories. The confidence indicates the accuracy of classification under the specific condition.
2.1.1. Input
2.1.2. Backbone
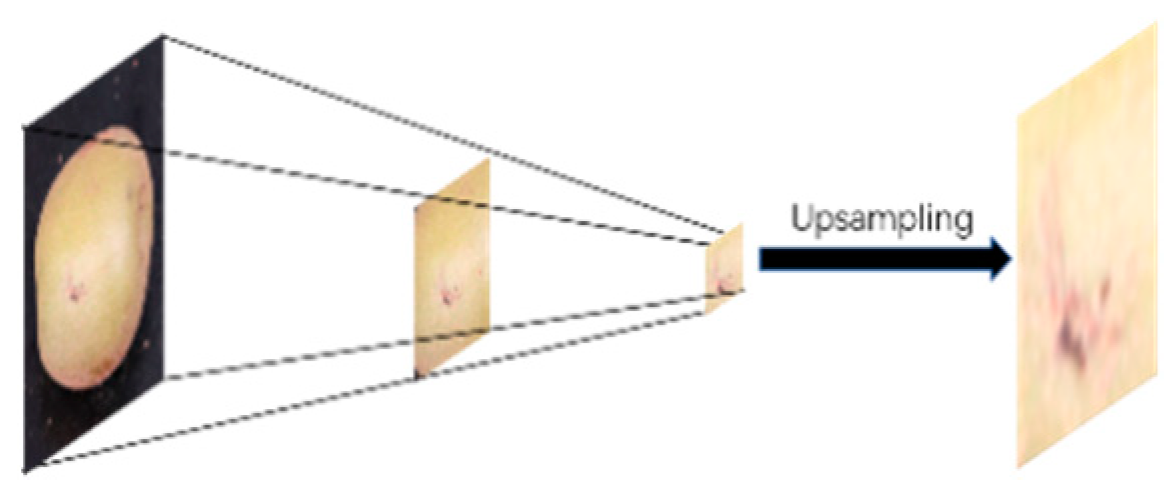
2.1.3. Neck
2.2. Algorithm Optimization
2.2.1. Small Target Recognition Layer
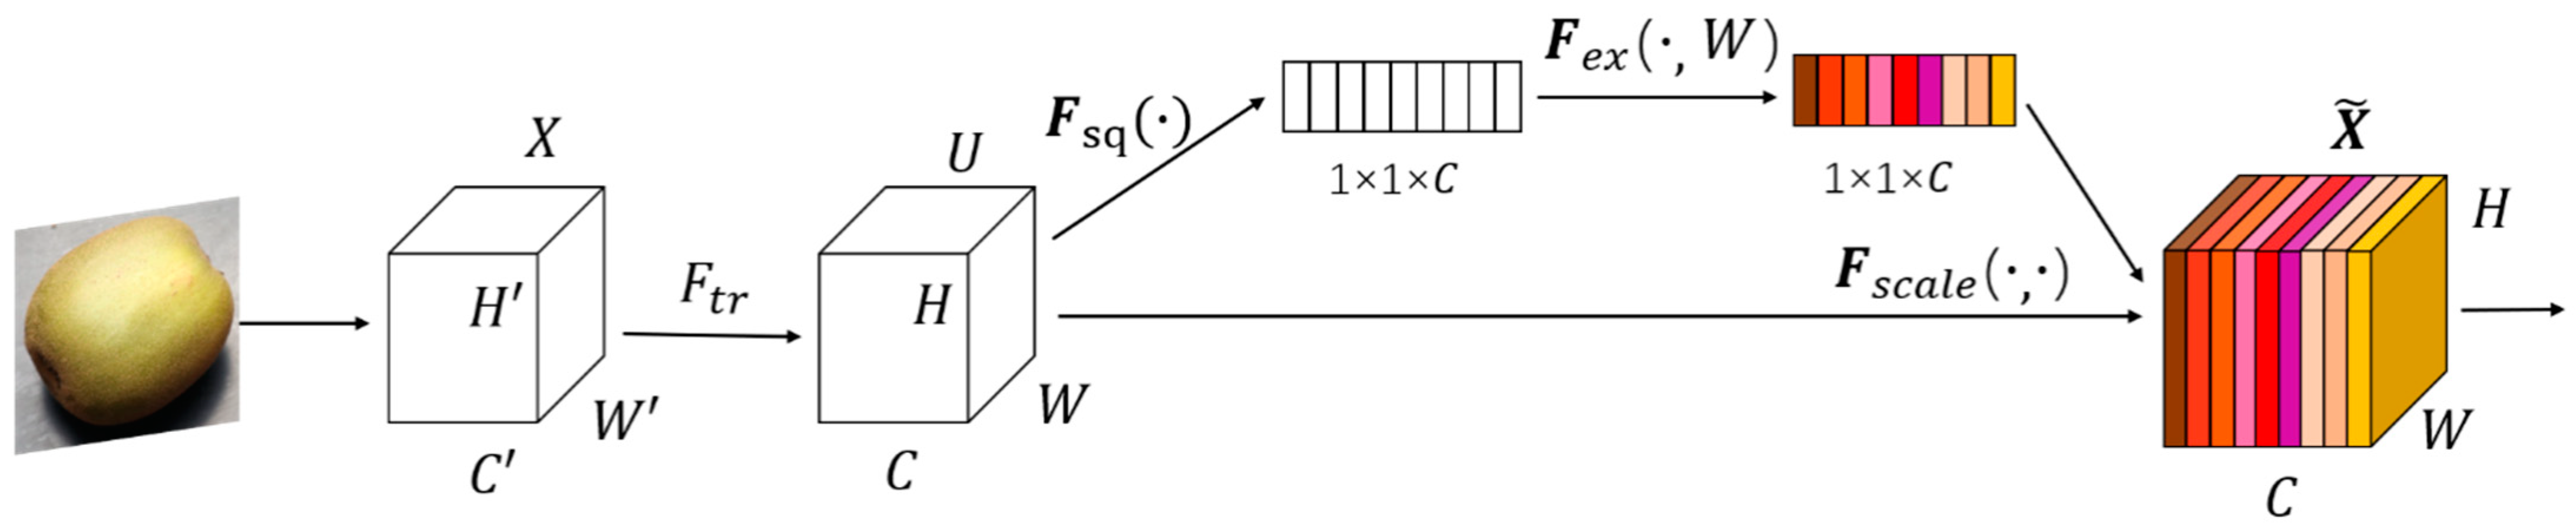
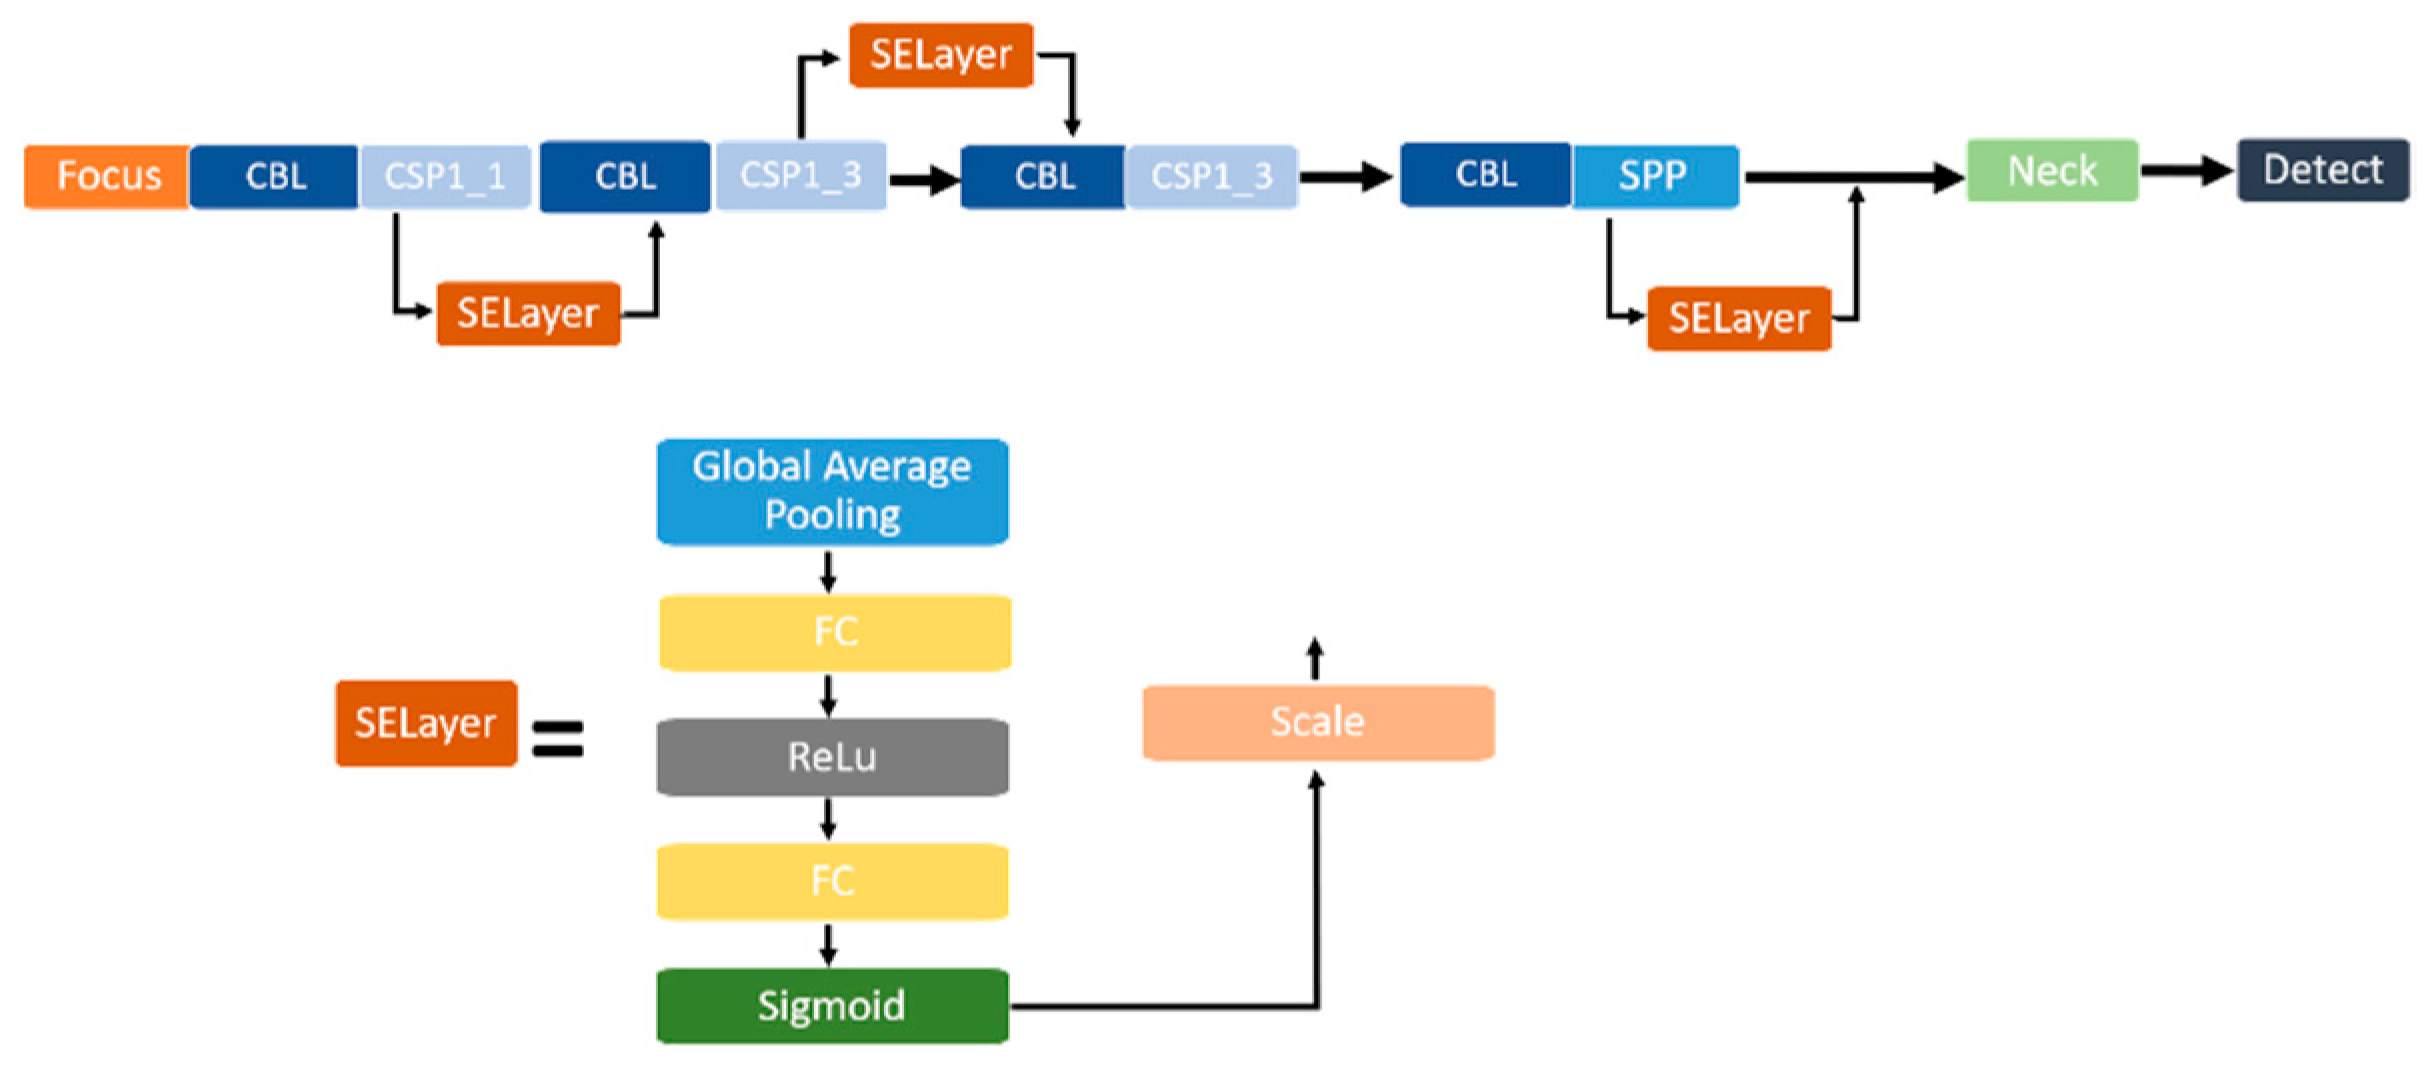
2.2.2. SELayer
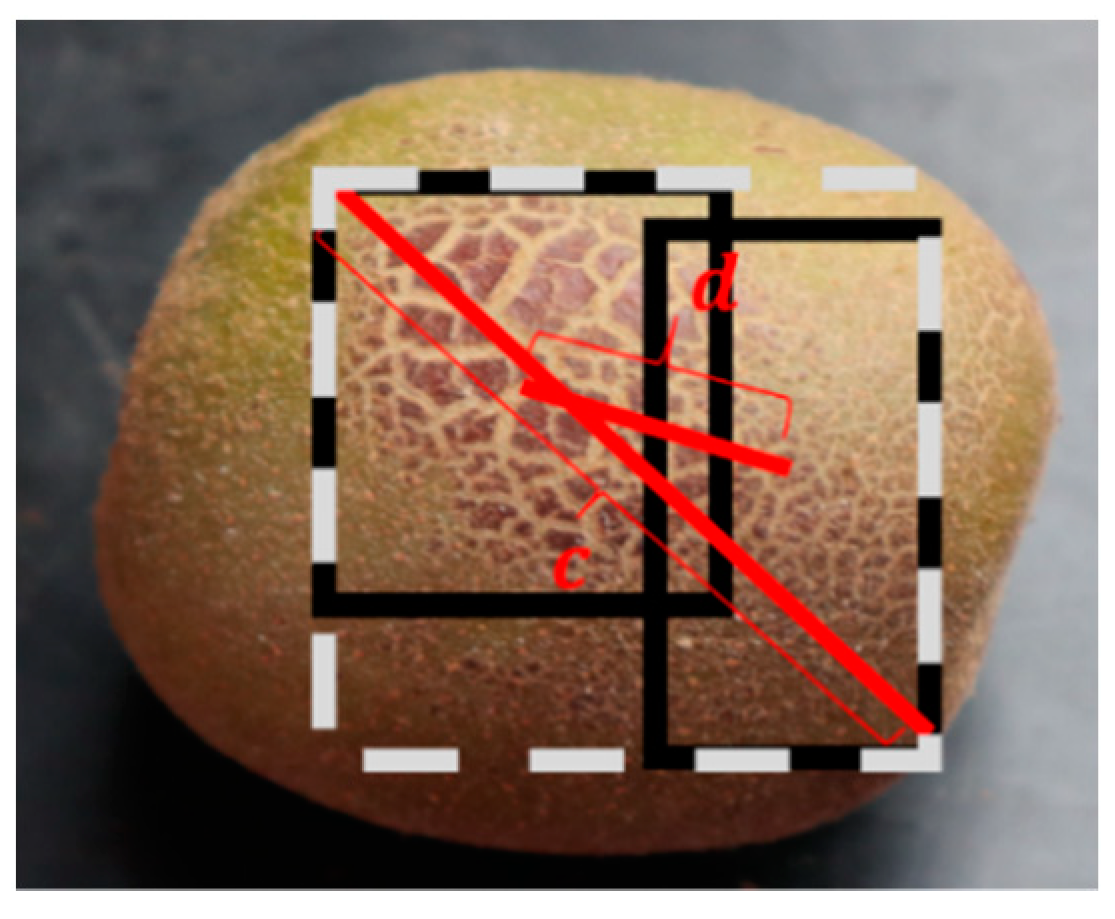
2.2.3. Boundary Loss Function
2.3. Experimental Setup
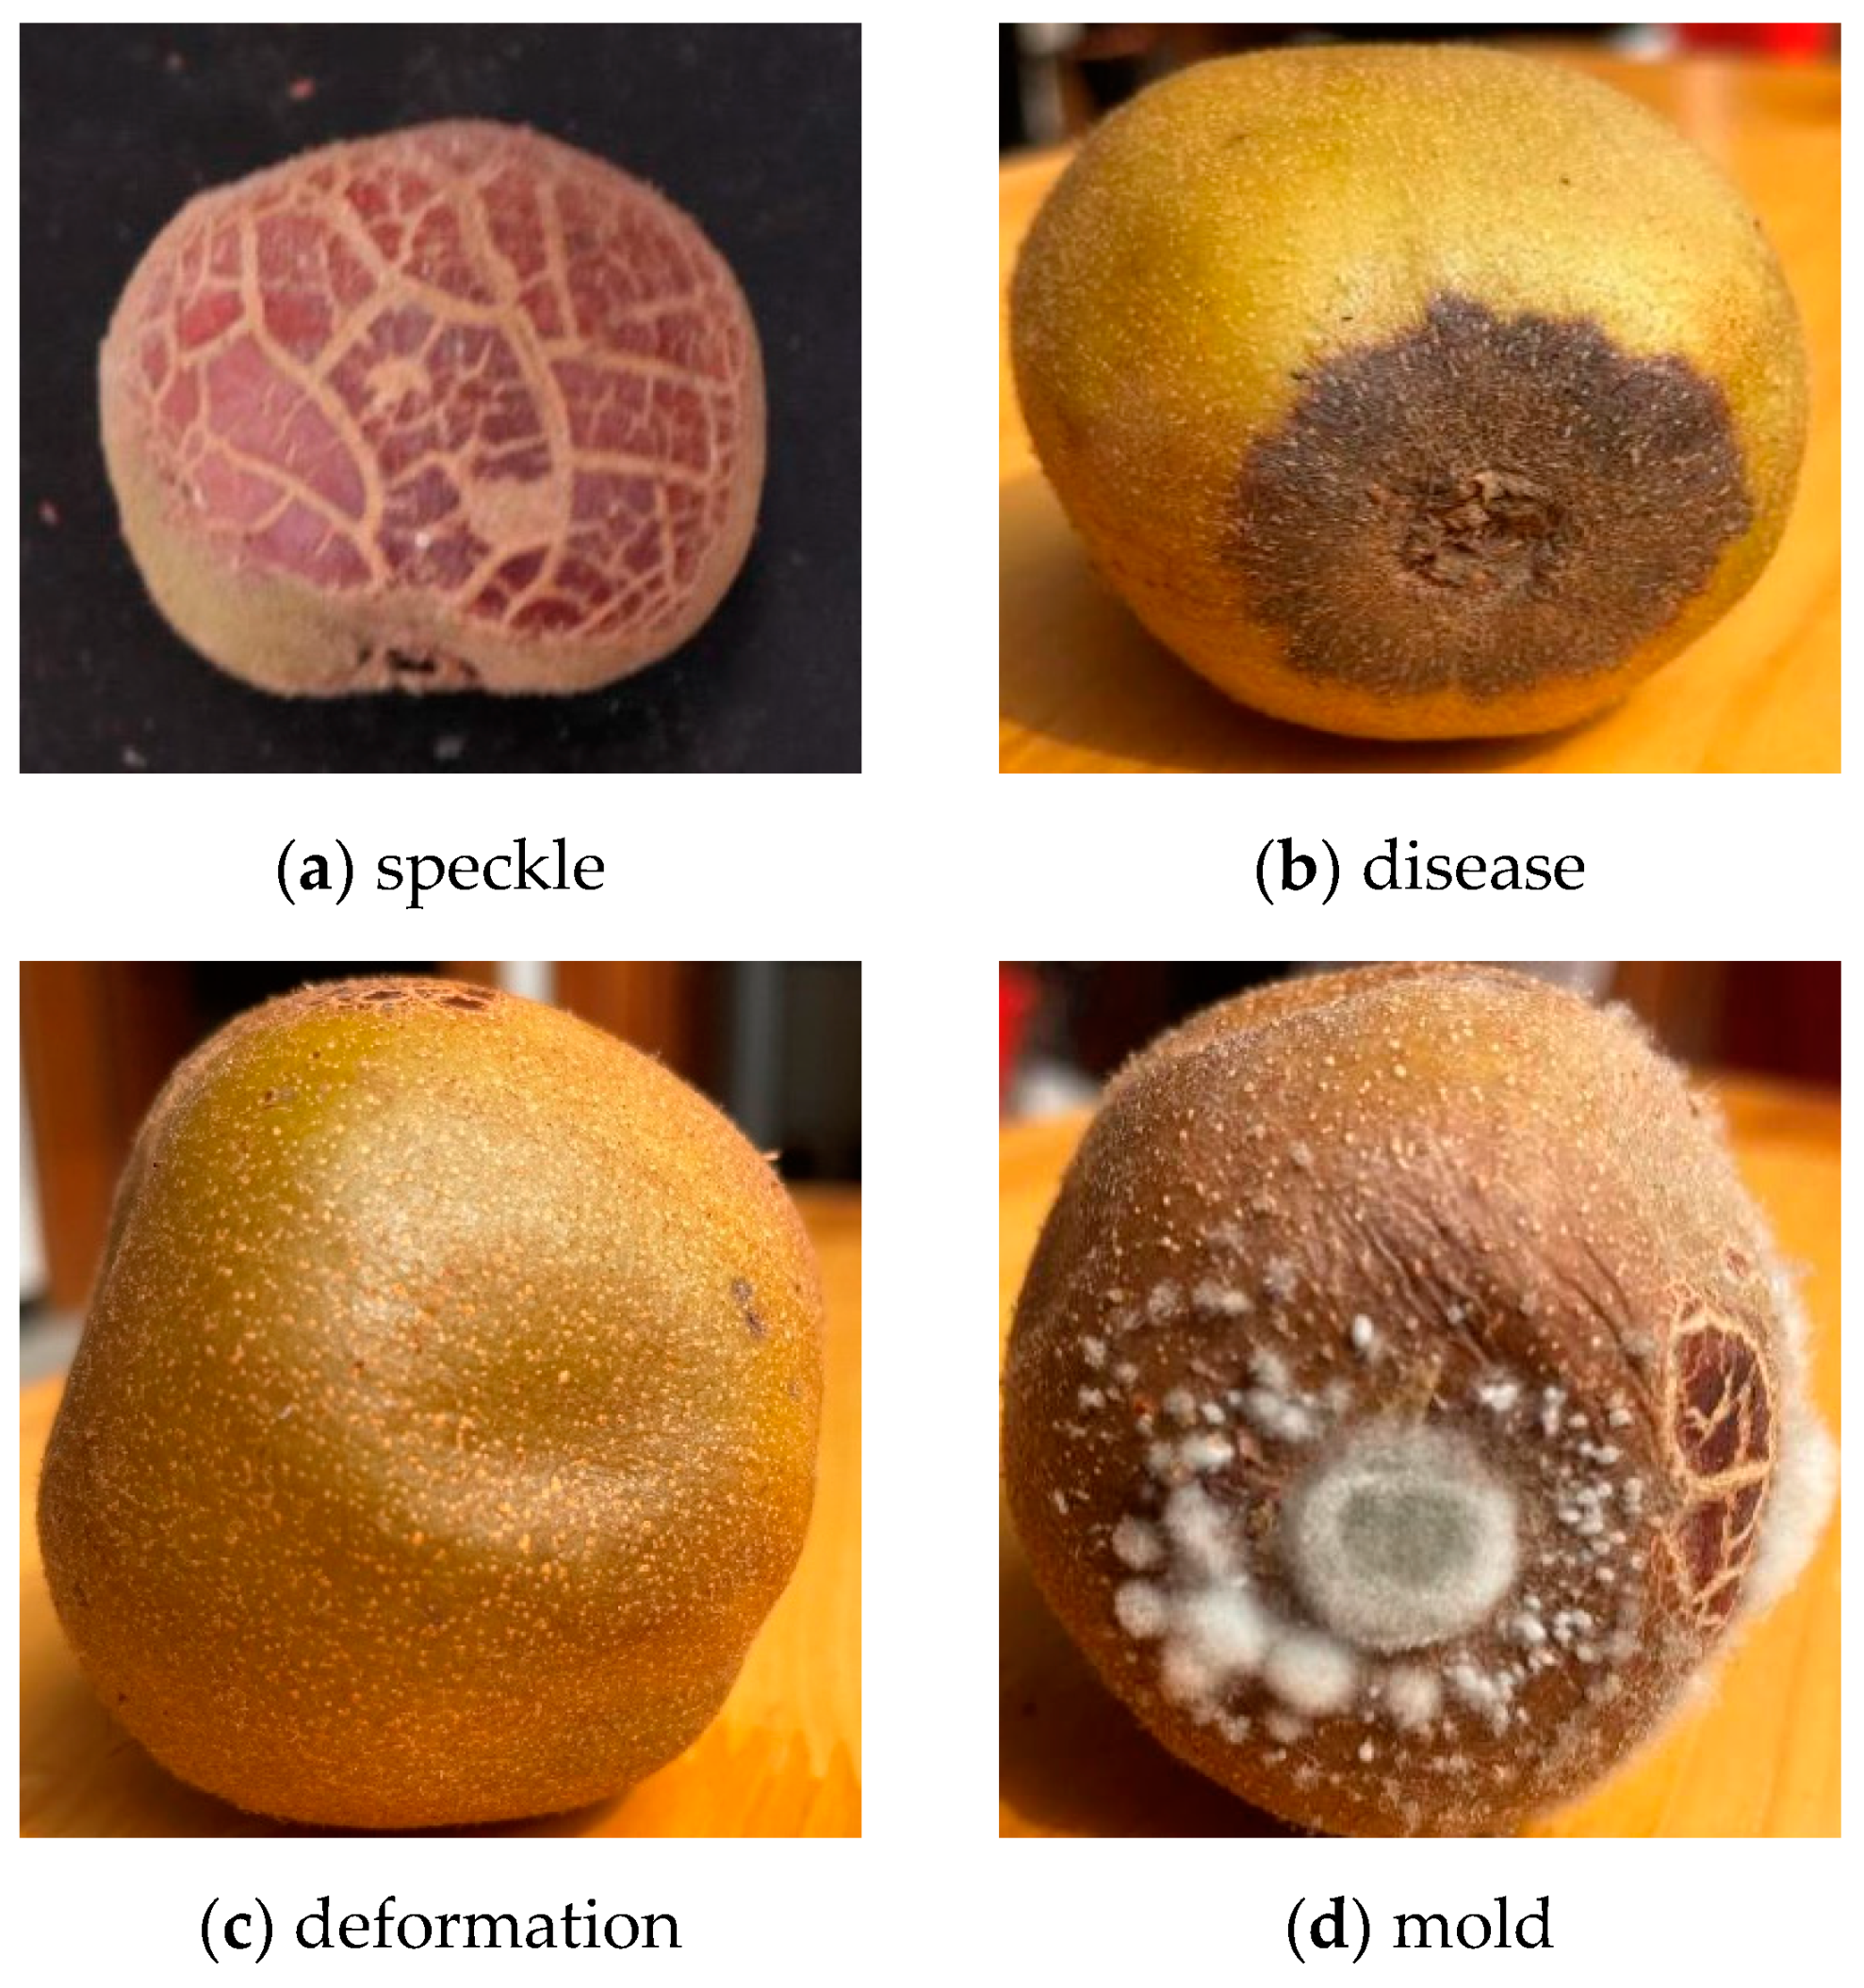
2.3.1. Dataset Production and Preprocessing
2.3.2. Migration Network Initialization
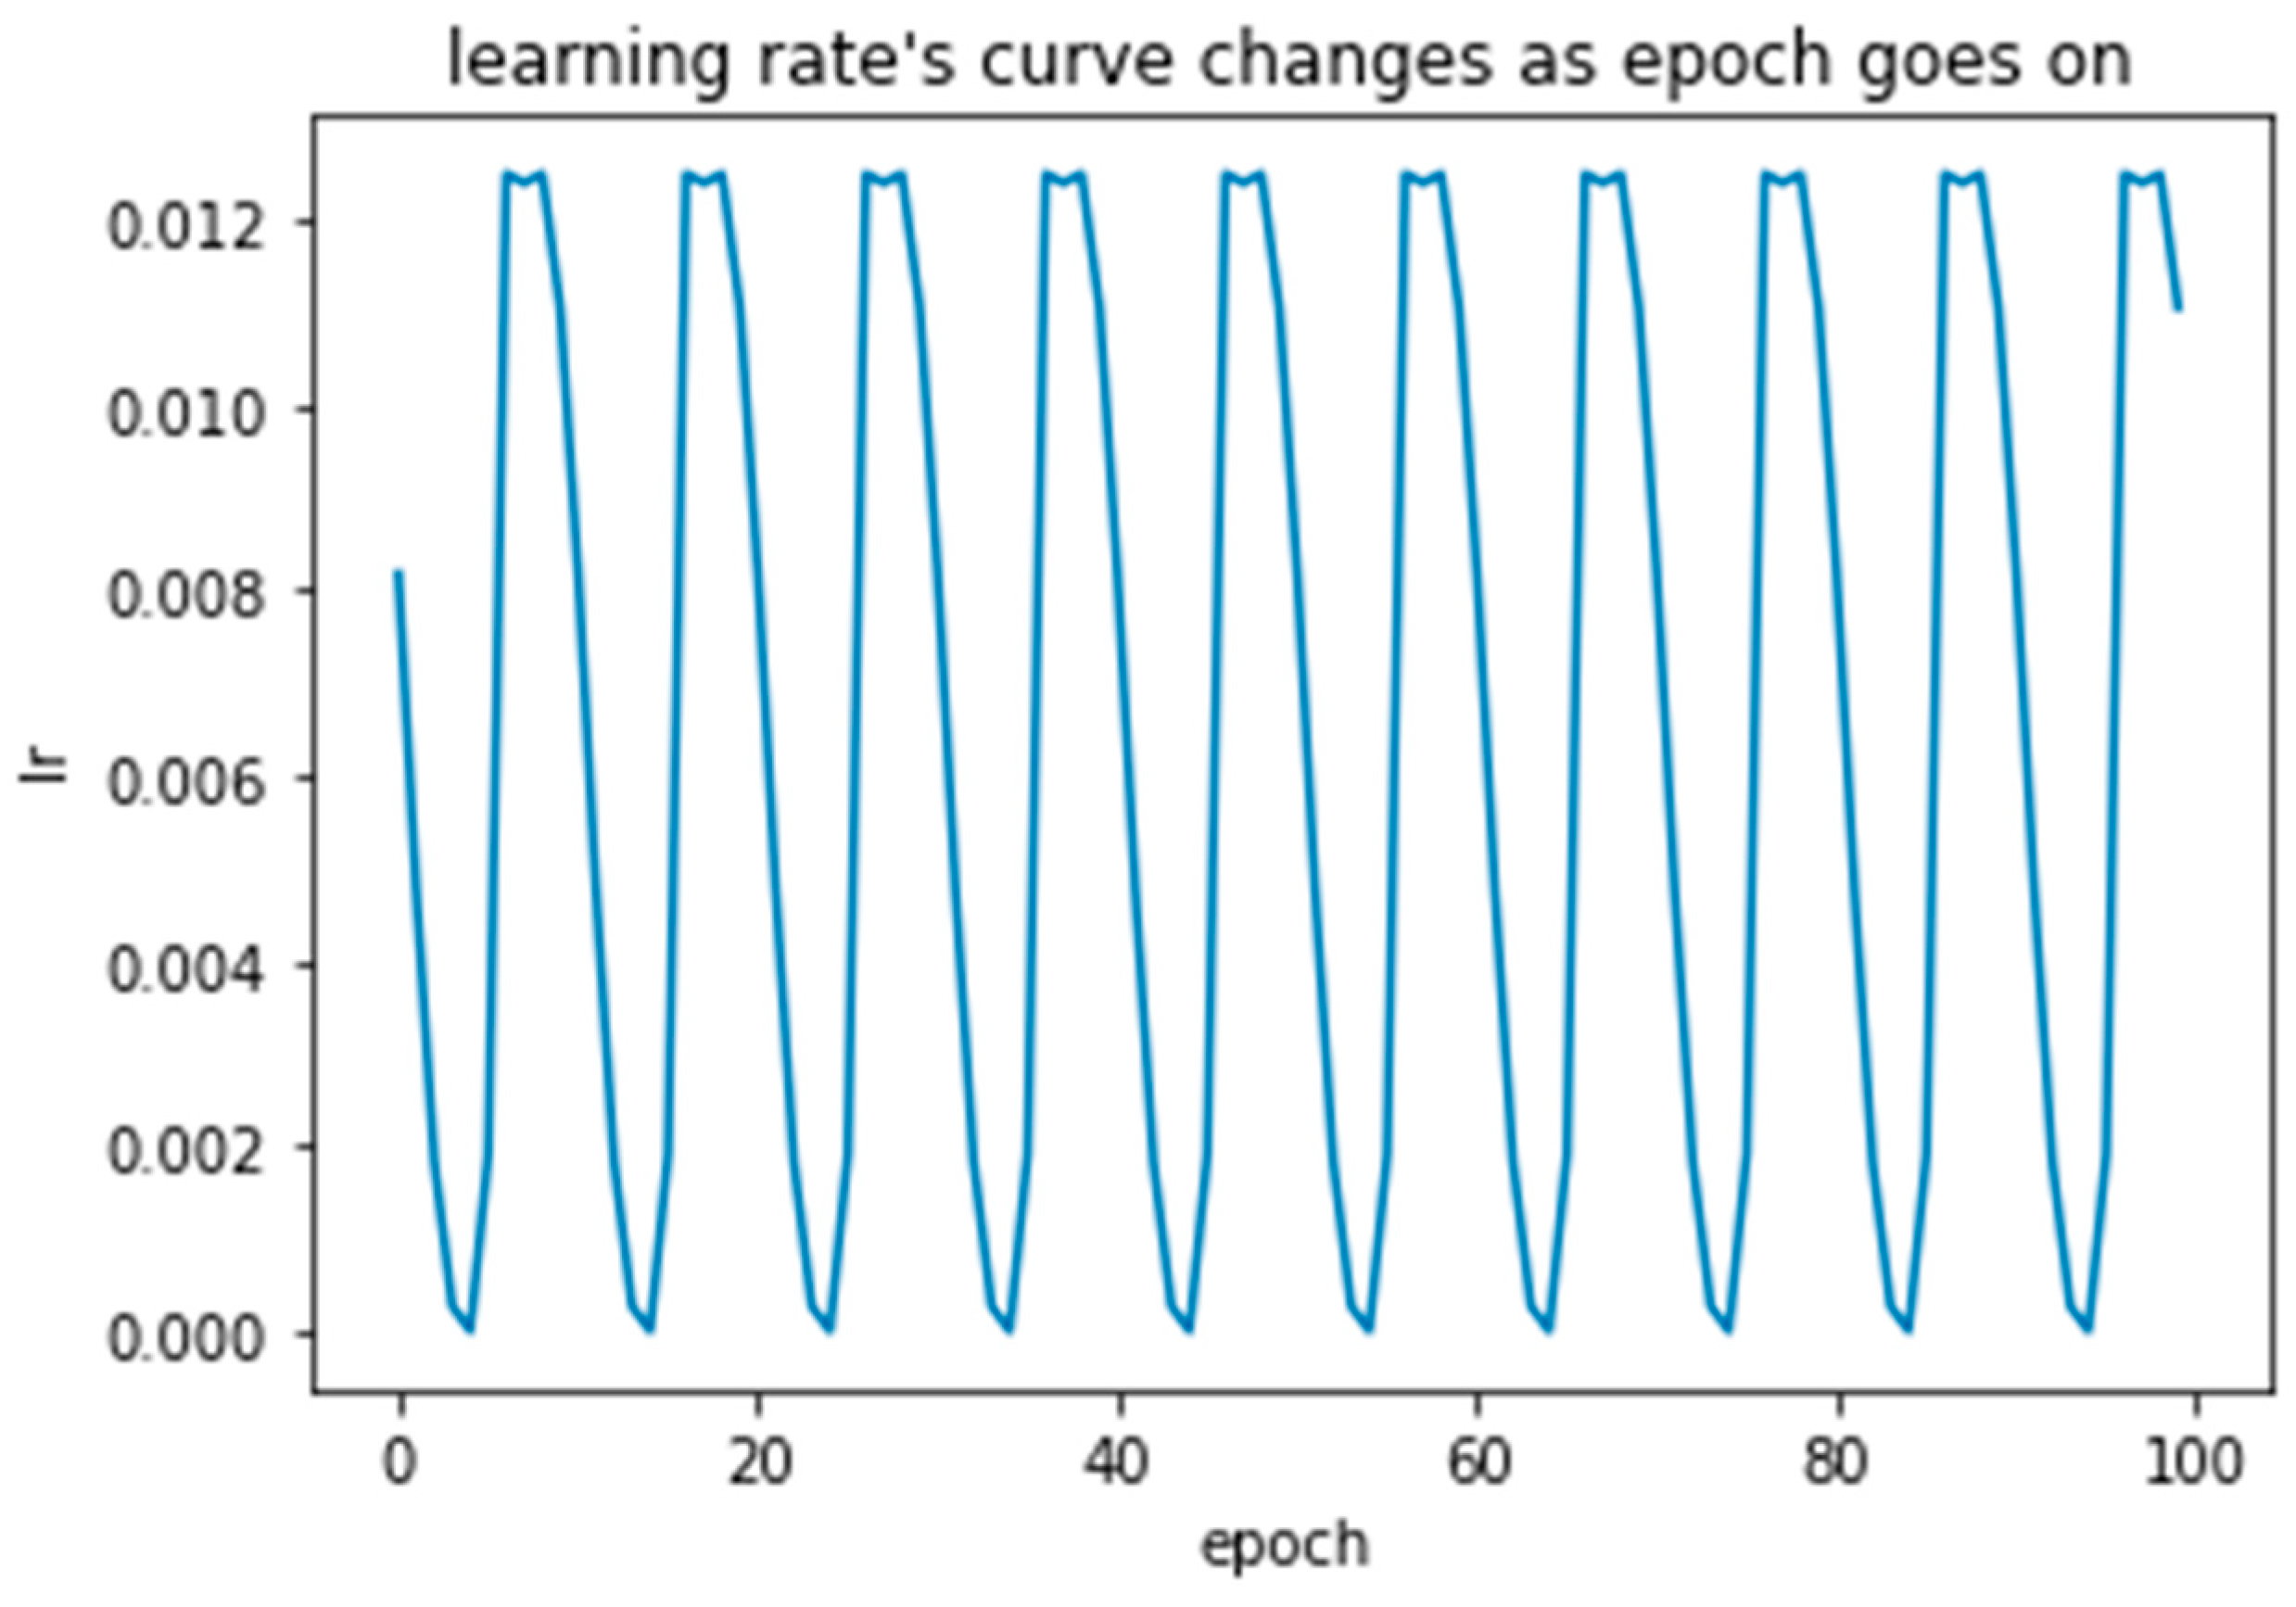
2.3.3. CosineAnnealing
2.3.4. Experimental platform
2.3.5. Model Evaluation Indicators
3. Results
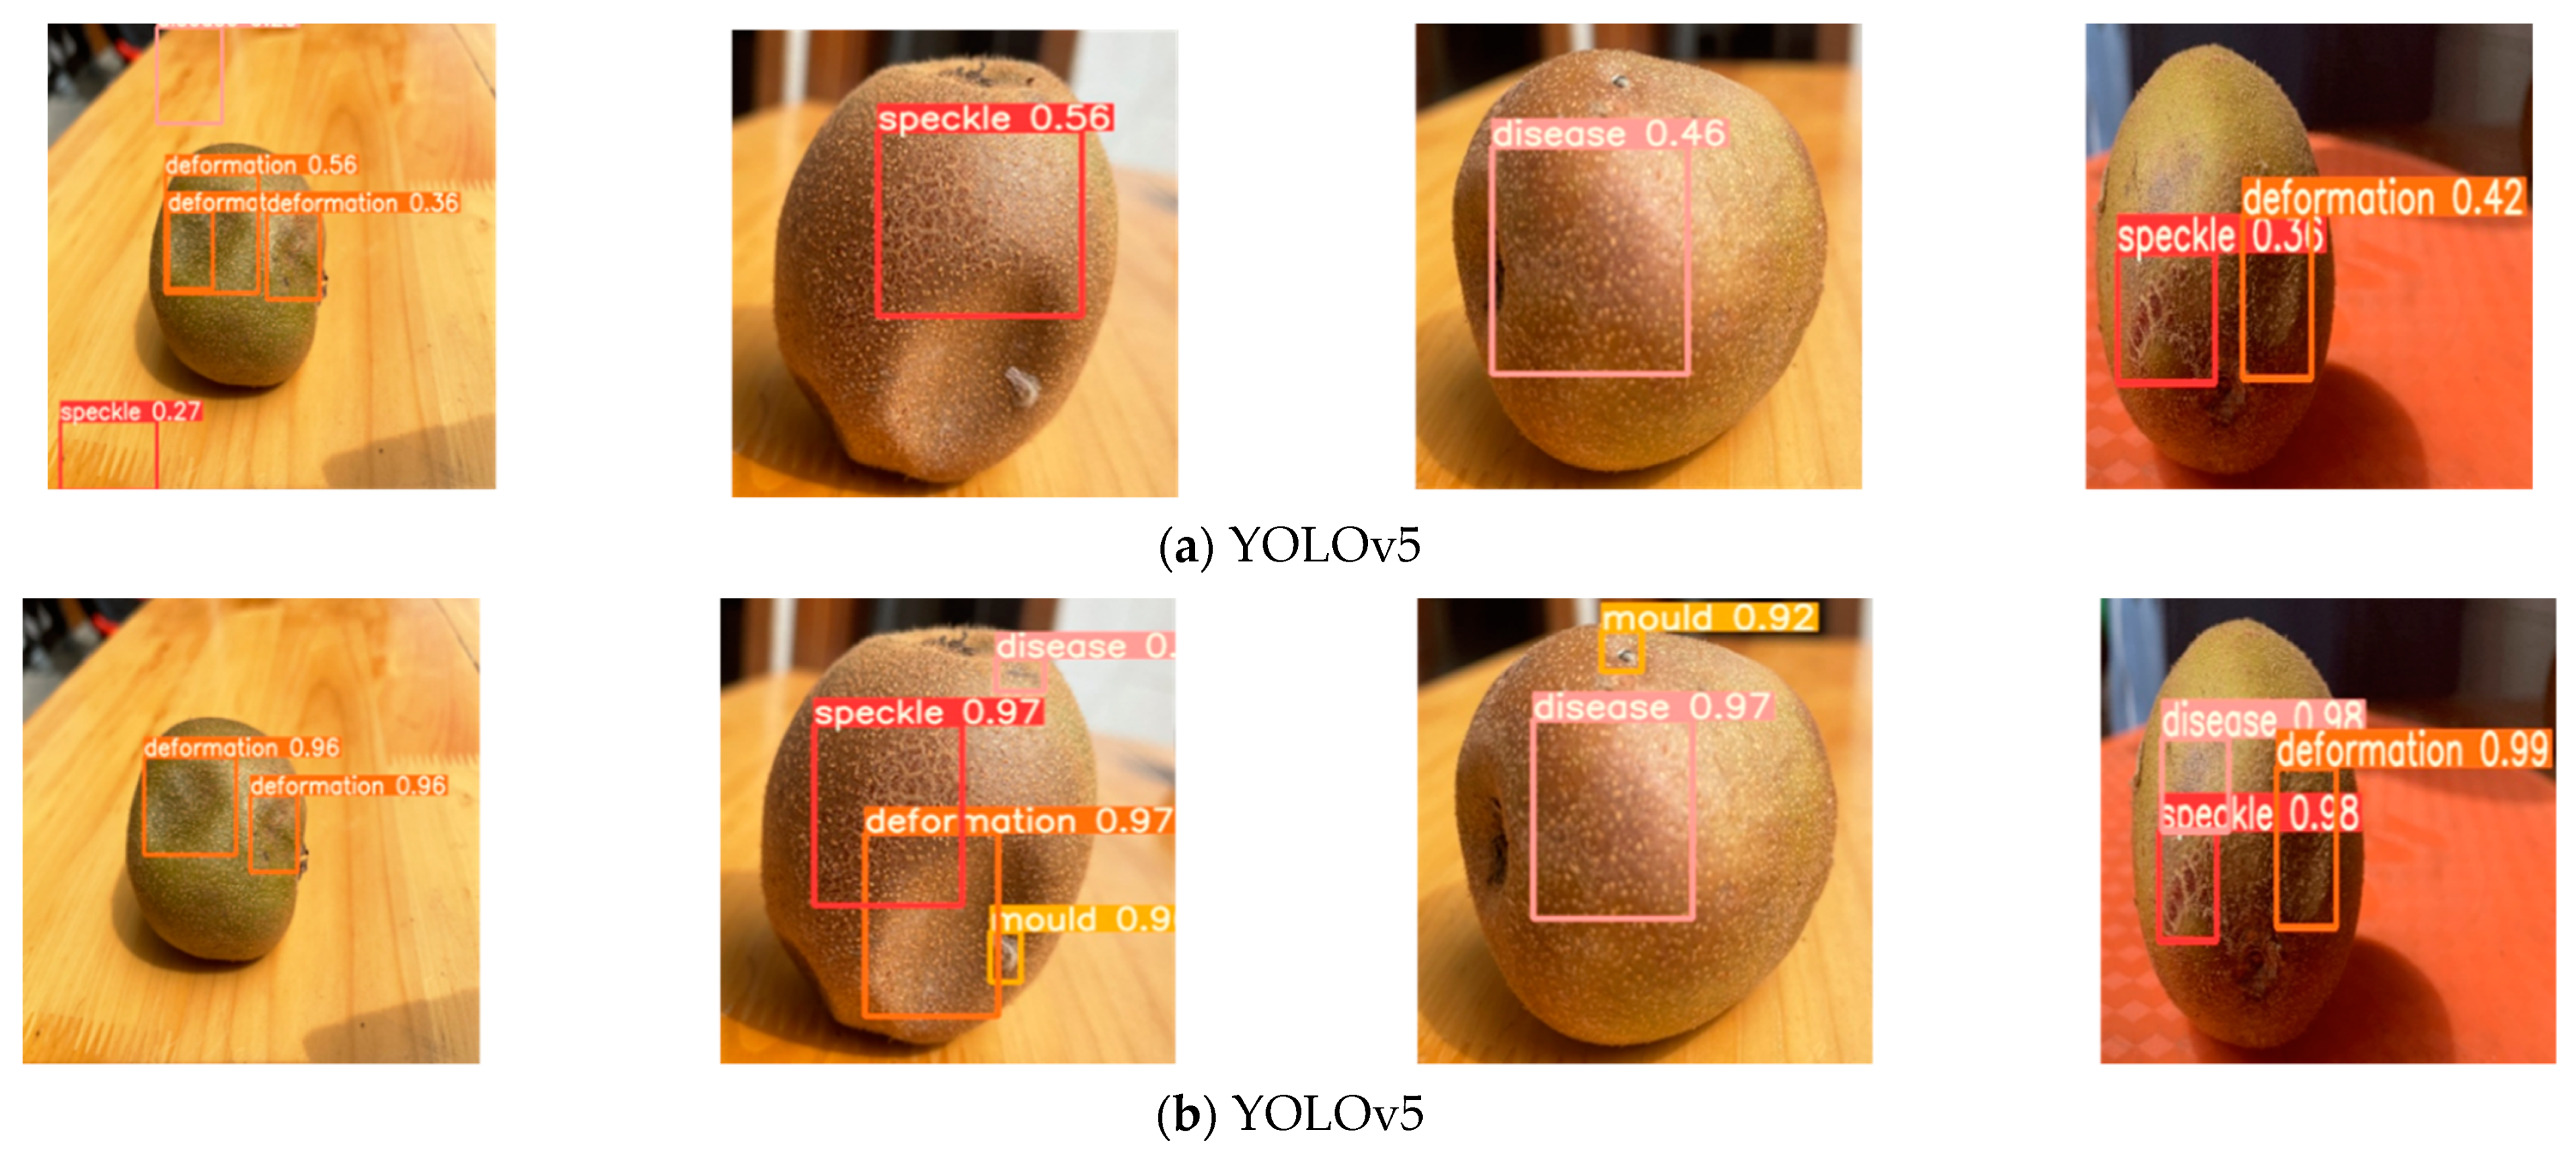
3.1. Experimental Results
3.2. Analysis
4. Discussion
- In terms of processing accuracy, the dataset of this study is manually captured images; hence, the background information is relatively simple. In slightly complex background conditions, the accuracy may be reduced. However, this research is based on unnatural or industrial scenes. Thus, there will be no complex background in practical application.
- In terms of processing speed, in order to meet the real-time needs of farmers, it is necessary to process the images collected by the camera. The initial consideration is using an object detection model to replace models such as, for instance, segmentation or semantic segmentation (the latter two are relatively slow in processing speed). To detect models in multiple objects, the YOLOv5 model for processing is considered, which is a useful model in an advanced single-stage method in the field of object detection. Compared with the two-step method, the former has a higher processing speed based on the same hardware environment. Compared with other one-stage methods (such as YOLOv2), the related reasons have been described in Section 2.1. The optimized YOLOv5 network structure is complex. Compared with the YOLOv5-Ours, the detection speed is reduced, but a single image only takes 0.1 s, which can meet the above requirements.
- In terms of model generalization ability, YOLOv5 uses a mosaic data enhancement strategy to improve the model’s generalization ability and robustness.
5. Conclusions and Future Work
Author Contributions
Funding
Acknowledgments
Conflicts of Interest
References
- Food Industry Network. China’s kiwifruit production ranks first in the world. Food Saf. Guide 2018, 33, 6. [Google Scholar]
- Fayuan, W.; Wenkai, W. Introduction to Frontier Knowledge and Skills of Modern Agricultural Economic Development; Hubei Science and Technology Press: Wuhan, China, 2010. [Google Scholar]
- Li, Q. Research on Non-Destructive Testing and Automatic Grading of Kiwifruit Based on Computer Vision; Anhui Agricultural University: Hefei, China, 2020. [Google Scholar]
- Jiao, L.; Zhang, F.; Liu, F.; Yang, S.; Li, L.; Feng, Z.; Qu, R. A survey of deep learning-based object detection. IEEE Access 2019, 7, 128837–128868. [Google Scholar] [CrossRef]
- Krizhevsky, A.; Sutskever, I.; Hinton, G.E. Imagenet classification with deep convolutional neural networks. Commun. ACM 2017, 60, 84–90. [Google Scholar] [CrossRef]
- Shah, T.M.; Nasika, D.P.B.; Otterpohl, R. Plant and Weed Identifier Robot as an Agroecological Tool Using Artificial Neural Networks for Image Identification. Agriculture 2021, 11, 222. [Google Scholar] [CrossRef]
- Zeze, F.; Qian, L.; Jiewei, C.; Xiaofeng, Y.; Haifang, L. Apple tree fruit detection and grading based on color and fruit diameter characteristics. Comput. Eng. Sci. 2020, 42, 82–90. [Google Scholar]
- Pan, Y.; Wei, J.; Zeng, L. Farmland Bird Target Detection Algorithm Based on YOLOv3. Available online: http://kns.cnki.net/kcms/detail/31.1690.TN.20210409.0942.050.html (accessed on 16 July 2021).
- Qingzhong, L.; Maohua, W. Development and prospect of real-time fruit grading technology based on computer vision. Trans. Chin. Soc. Agric. Mach. 1999, 6, 1–7. [Google Scholar]
- Xu, T. Research on Classification and Recognition of Fruit Surface Grade Based on Machine Vision; Chongqing Jiaotong University: Chongqing, China, 2018. [Google Scholar]
- Jianwei, D.; Yuanyuan, L.; Fei, C.; Tongxuan, W.; Shengsheng, D.; Yankun, P. Surface Defect Detection of Korla Fragrant Pear Based on Multispectral Image. J. Agric. Mech. Res. 2021, 43, 41–46. [Google Scholar]
- Yanni, W.; Li, H. Detection method of pomegranate leaf diseases based on multi-class SVM. Comput. Meas. Control. 2020, 28, 197–201. [Google Scholar]
- Huajian, X. Research on the Application of Computer Vision in Mango Quality Detection. J. Agric. Mech. Res. 2019, 1, 190–193. [Google Scholar]
- Du, Z.; Fang, S.; Zhe, L.; Zheng, J. Tomato Leaf Disease Detection Based on Deep Feature Fusion of Convolutional Neural Network; China Sciencepaper: Beijing, China, 2020. [Google Scholar]
- Liu, X. Research on Tomato Diseased Leaf Recognition Based on Mask R-CNN and Its Application in Smart Agriculture System; Xidian University: Xian, China, 2020. [Google Scholar]
- Liu, W.; Anguelov, D.; Erhan, D.; Szegedy, C.; Reed, S.; Fu, C.-Y.; Berg, A.C. SSD: Single Shot MultiBox Detector. In Proceedings of the Computer Vision—ECCV 2016 14th European Conference, Amsterdam, The Netherlands, 11–14 October 2016. [Google Scholar]
- Redmon, J.; Divvala, S.; Girshick, R.; Farhadi, A. You Only Look Once: Unified, Real-Time Object Detection. IEEE 2016, 1, 779–788. [Google Scholar]
- Shao, H.; Pu, J.; Mu, J. Pig-Posture Recognition Based on Computer Vision: Dataset and Exploration. Animals 2021, 11, 1295. [Google Scholar] [CrossRef] [PubMed]
- Loshchilov, I.; Hutter, F. SGDR: Stochastic Gradient Descent with Warm Restarts. In Proceedings of the ICLR 2017 (5th International Conference on Learning Representations), Toulon, France, 24–26 April 2017. [Google Scholar]
- Ruan, J. Design and Implementation of Target Detection Algorithm Based on YOLO; Beijing University of Posts and Telecommunications: Beijing, China, 2019. [Google Scholar]
- Krizhevsky, A.; Sutskever, I.; Hinton, G.E. Imagenet classification with deep convolutional neural networks. In Proceedings of the 25th International Conference on Neural Information Processing Systems, Lake Tahoe, NV, USA, 3–8 December 2012; 25, pp. 1097–1105. [Google Scholar]
- Redmon, J.; Farhadi, A. YOLO9000: Better, Faster, Stronger. In Proceedings of the IEEE Conference on Computer Vision & Pattern Recognition IEEE, Honolulu, HI, USA, 21–26 July 2017; pp. 6517–6525. [Google Scholar]
- Redmon, J.; Farhadi, A. YOLOv3: An incremental improvement. In Proceedings of the CVPR 2018: IEEE Conference on Computer Vision and Pattern Recognition, Salt Lake, UT, USA, 18–22 June 2018. [Google Scholar]
- He, K.; Zhang, X.; Ren, S.; Sun, J. Deep Residual Learning for Image Recognition. Available online: https://arxiv.org/abs/1512.03385 (accessed on 16 July 2021).
- Lin, T.Y.; Dollar, P.; Girshick, R.; He, K.; Hariharan, B.; Belongie, S. Feature Pyramid Networks for Object Detection. In Proceedings of the 2017 IEEE Conference on Computer Vision and Pattern Recognition, Honolulu, HI, USA, 21–26 July 2017; pp. 2117–2125. [Google Scholar]
- Bochkovskiy, A.; Wang, C.Y.; Liao, H. YOLOv4: Optimal Speed and Accuracy of Object Detection. Available online: https://arxiv.org/abs/2004.10934 (accessed on 16 July 2021).
- Luvizon, D.; Tabia, H.; Picard, D. SSP-Net: Scalable Sequential Pyramid Networks for Real-Time 3D Human Pose Regression. Available online: https://arxiv.org/abs/2009.01998 (accessed on 16 July 2021).
- Liu, S.; Qi, L.; Qin, H.; Shi, J.; Jia, J. Path Aggregation Network for Instance Segmentation. In Proceedings of the 2018 IEEE/CVF Conference on Computer Vision and Pattern Recognition (CVPR) IEEE, Salt Lake City, UT, USA, 18–23 June 2018. [Google Scholar]
- Wang, C.Y.; Liao, H.; Wu, Y.H.; Chen, P.Y.; Hsieh, J.W.; Yeh I, H. CSPNet: A New Backbone that can Enhance Learning Capability of CNN. In Proceedings of the IEEE/CVF conference on computer vision and pattern recognition workshops, Seattle, WA, USA, 14–19 June 2020. [Google Scholar]
- Jie, H.; Li, S.; Gang, S. Squeeze-and-Excitation Networks. IEEE Trans. Pattern Anal. Mach. Intell. 2017, 42, 7132–7141. [Google Scholar]
- Jiang, B.; Luo, R.; Mao, J.; Xiao, T.; Jiang, Y. Acquisition of Localization Confidence for Accurate Object Detection. In Proceedings of the European conference on computer vision (ECCV), Munich, Germany, 8–14 September 2018. [Google Scholar]
- Rezatofighi, H.; Tsoi, N.; Gwak, J.; Sadeghian, A.; Reid, I.; Savarese, S. Generalized Intersection Over Union: A Metric and a Loss for Bounding Box Regression. In Proceedings of the 2019 IEEE/CVF Conference on Computer Vision and Pattern Recognition (CVPR) IEEE, Long Beach, CA, USA, 15–20 June 2019. [Google Scholar]
- Zheng, Z.; Wang, P.; Ren, D.; Liu, W.; Ye, R.; Hu, Q.; Zuo, W. Enhancing Geometric Factors in Model Learning and Inference for Object Detection and Instance Segmentation. Available online: https://arxiv.org/abs/2005.03572 (accessed on 16 July 2021).


| Category | Original YOLOv5 Model | YOLOv5-Ours |
|---|---|---|
| speckle | 0.95 | 0.96 |
| disease | 0.71 | 0.93 |
| deformation | 0.74 | 0.92 |
| mould | 0.84 | 0.95 |
| Total mAP | 0.85 | 0.947 |
| Category | YOLOv5-Ours | SSD300 | YOLOv3 | FAST R-CNN |
|---|---|---|---|---|
| mAP | 0.947 | 0.855 | 0.821 | 0.939 |
Publisher’s Note: MDPI stays neutral with regard to jurisdictional claims in published maps and institutional affiliations. |
© 2021 by the authors. Licensee MDPI, Basel, Switzerland. This article is an open access article distributed under the terms and conditions of the Creative Commons Attribution (CC BY) license (https://creativecommons.org/licenses/by/4.0/).
Share and Cite
Yao, J.; Qi, J.; Zhang, J.; Shao, H.; Yang, J.; Li, X. A Real-Time Detection Algorithm for Kiwifruit Defects Based on YOLOv5. Electronics 2021, 10, 1711. https://doi.org/10.3390/electronics10141711
Yao J, Qi J, Zhang J, Shao H, Yang J, Li X. A Real-Time Detection Algorithm for Kiwifruit Defects Based on YOLOv5. Electronics. 2021; 10(14):1711. https://doi.org/10.3390/electronics10141711
Chicago/Turabian StyleYao, Jia, Jiaming Qi, Jie Zhang, Hongmin Shao, Jia Yang, and Xin Li. 2021. "A Real-Time Detection Algorithm for Kiwifruit Defects Based on YOLOv5" Electronics 10, no. 14: 1711. https://doi.org/10.3390/electronics10141711