
Crowd Counting Using End-to-End Semantic Image Segmentation

 , , and
Abstract
:1. Introduction
2. Related Work
- Detection-based approaches: Initially, most of the work on crowd counting was performed with detection-based approaches [43,44,45,46,47]. These approaches apply the head detector through a sliding window on an image. Recent methods such as R-CNN [48,49,50], You Only Look Once (YOLO) [51], and Single-Shot multibox Detector (SSD) [52] have been proposed and exploited, which attain high accuracy in sparse scenes, but these methods do not perform well in highly dense environments.
- Regression-based approaches: To target issues in detection-based methods, regression-based approaches [22,53,54] are proposed that can learn a mapping from the image patch by extracting the global features [55] or local features [56]. The global features include the texture, edge, and gradient features, and the local features include Scale-Invariant Feature Transform (SIFT) [57], Local Binary Patterns (LBPs) [58], Histograms of Oriented Gradients (HOGs) [59], and Gray-Level Co-occurrence Matrices (GLCMs) [60]. To learn the mapping function for crowd counting, regression techniques [61] and Gaussian regression [62] are exploited. These algorithms solve occlusion and background clutter issues with detection-based approaches, but the spatial information is compromised. The regression-based techniques may overestimate the crowd in the presence of a sparse crowd.
- Density-based approaches: Similarly, the density-based methods make use of features such as pixels or regions. This helps to maintain the location information while avoiding the disadvantages of regression-based approaches. Lemptisky et al. [19] exploited a density-based approach with a linear mapping between local features and density maps. A nonlinear method, namely Random Forest Regression (RFR), was proposed to tackle the linear approach’s issues by introducing the crowdedness before and training two different forests with it [63]. The method outperforms the linear method and also requires small memory for storing the forests. The issue with this approach is that the standard features are used to extract low-level information that cannot accurately be counted with a high-quality density map.
- CNN-based approaches: More research work is currently carried out with CNN algorithms because of their robust feature representation and improved density estimation. The CNN outperformed the traditional models to predict the density of crowds with improved performance in [18,64,65,66]. Recently, improved versions of CNNs, such as the Fully Convolution Network (FCN), have been proposed with an enhanced architecture, density estimation performance, and crowd counting. Besides FCN, many other CNN approaches have been proposed recently in the domain of density estimation and crowd counting [67].Sang et al. [11] developed an improved crowd counting approach based on the Scale-adaptive CNN (SaCNN). The CNN was used to obtain the crowd density map, which was further processed to find the approximate headcount. The proposed approach was tested on the Shanghai Tech dataset and worked well on sparse and dense scenes.More recently, Zhang et al. [68] used the CNN to count people on metro platforms. A dataset consisting of 627 images and 9243 annotated heads was also developed. The images were captured during peak and off-peak times during the weekdays and weekends. The authors used the first 13 layers of VGG-16. The results on standard datasets such as ShanghaiTech and UCF-QNRF showed a smaller MAE and MSE as compared to the state-of-the-art methods.
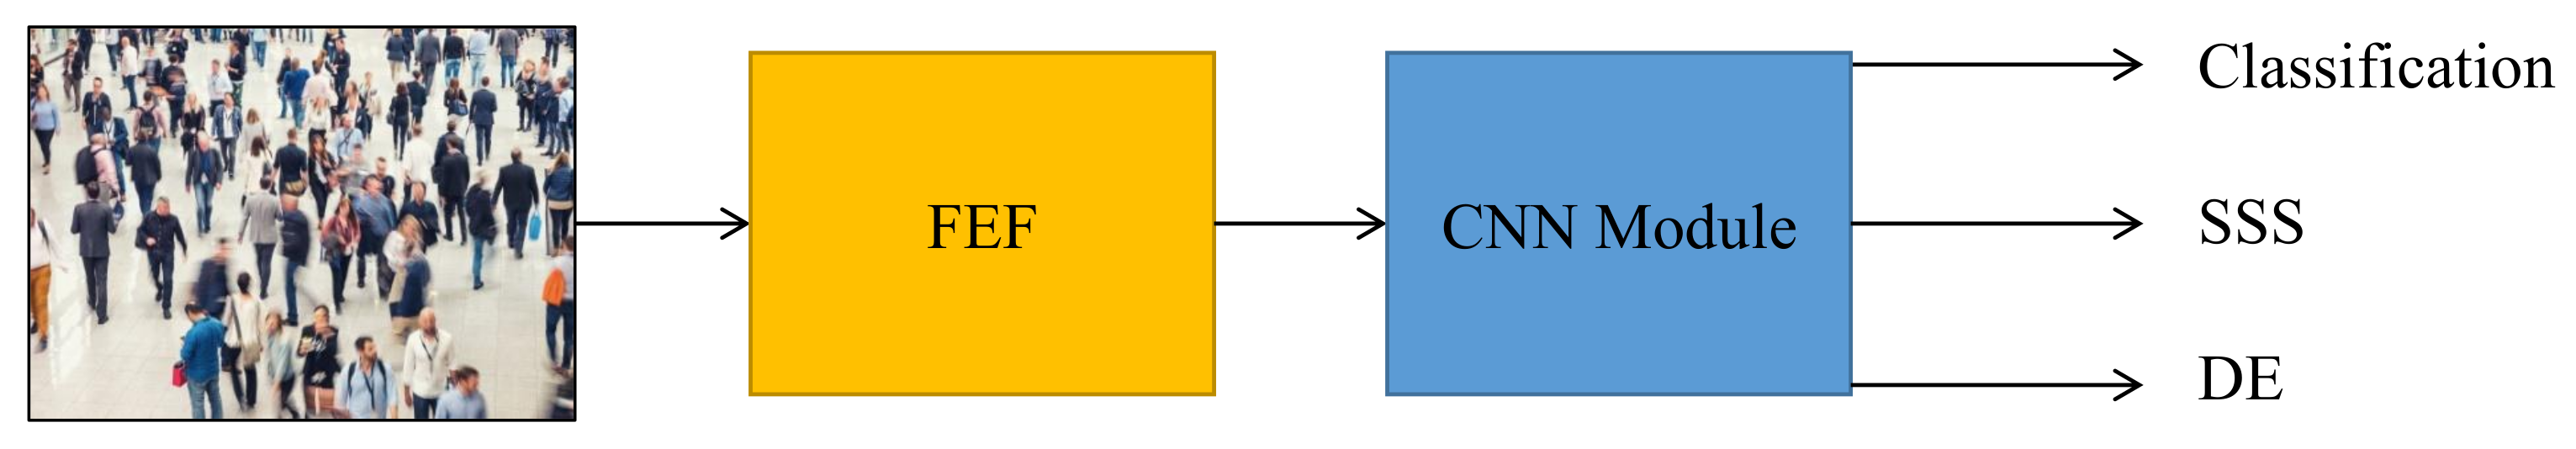
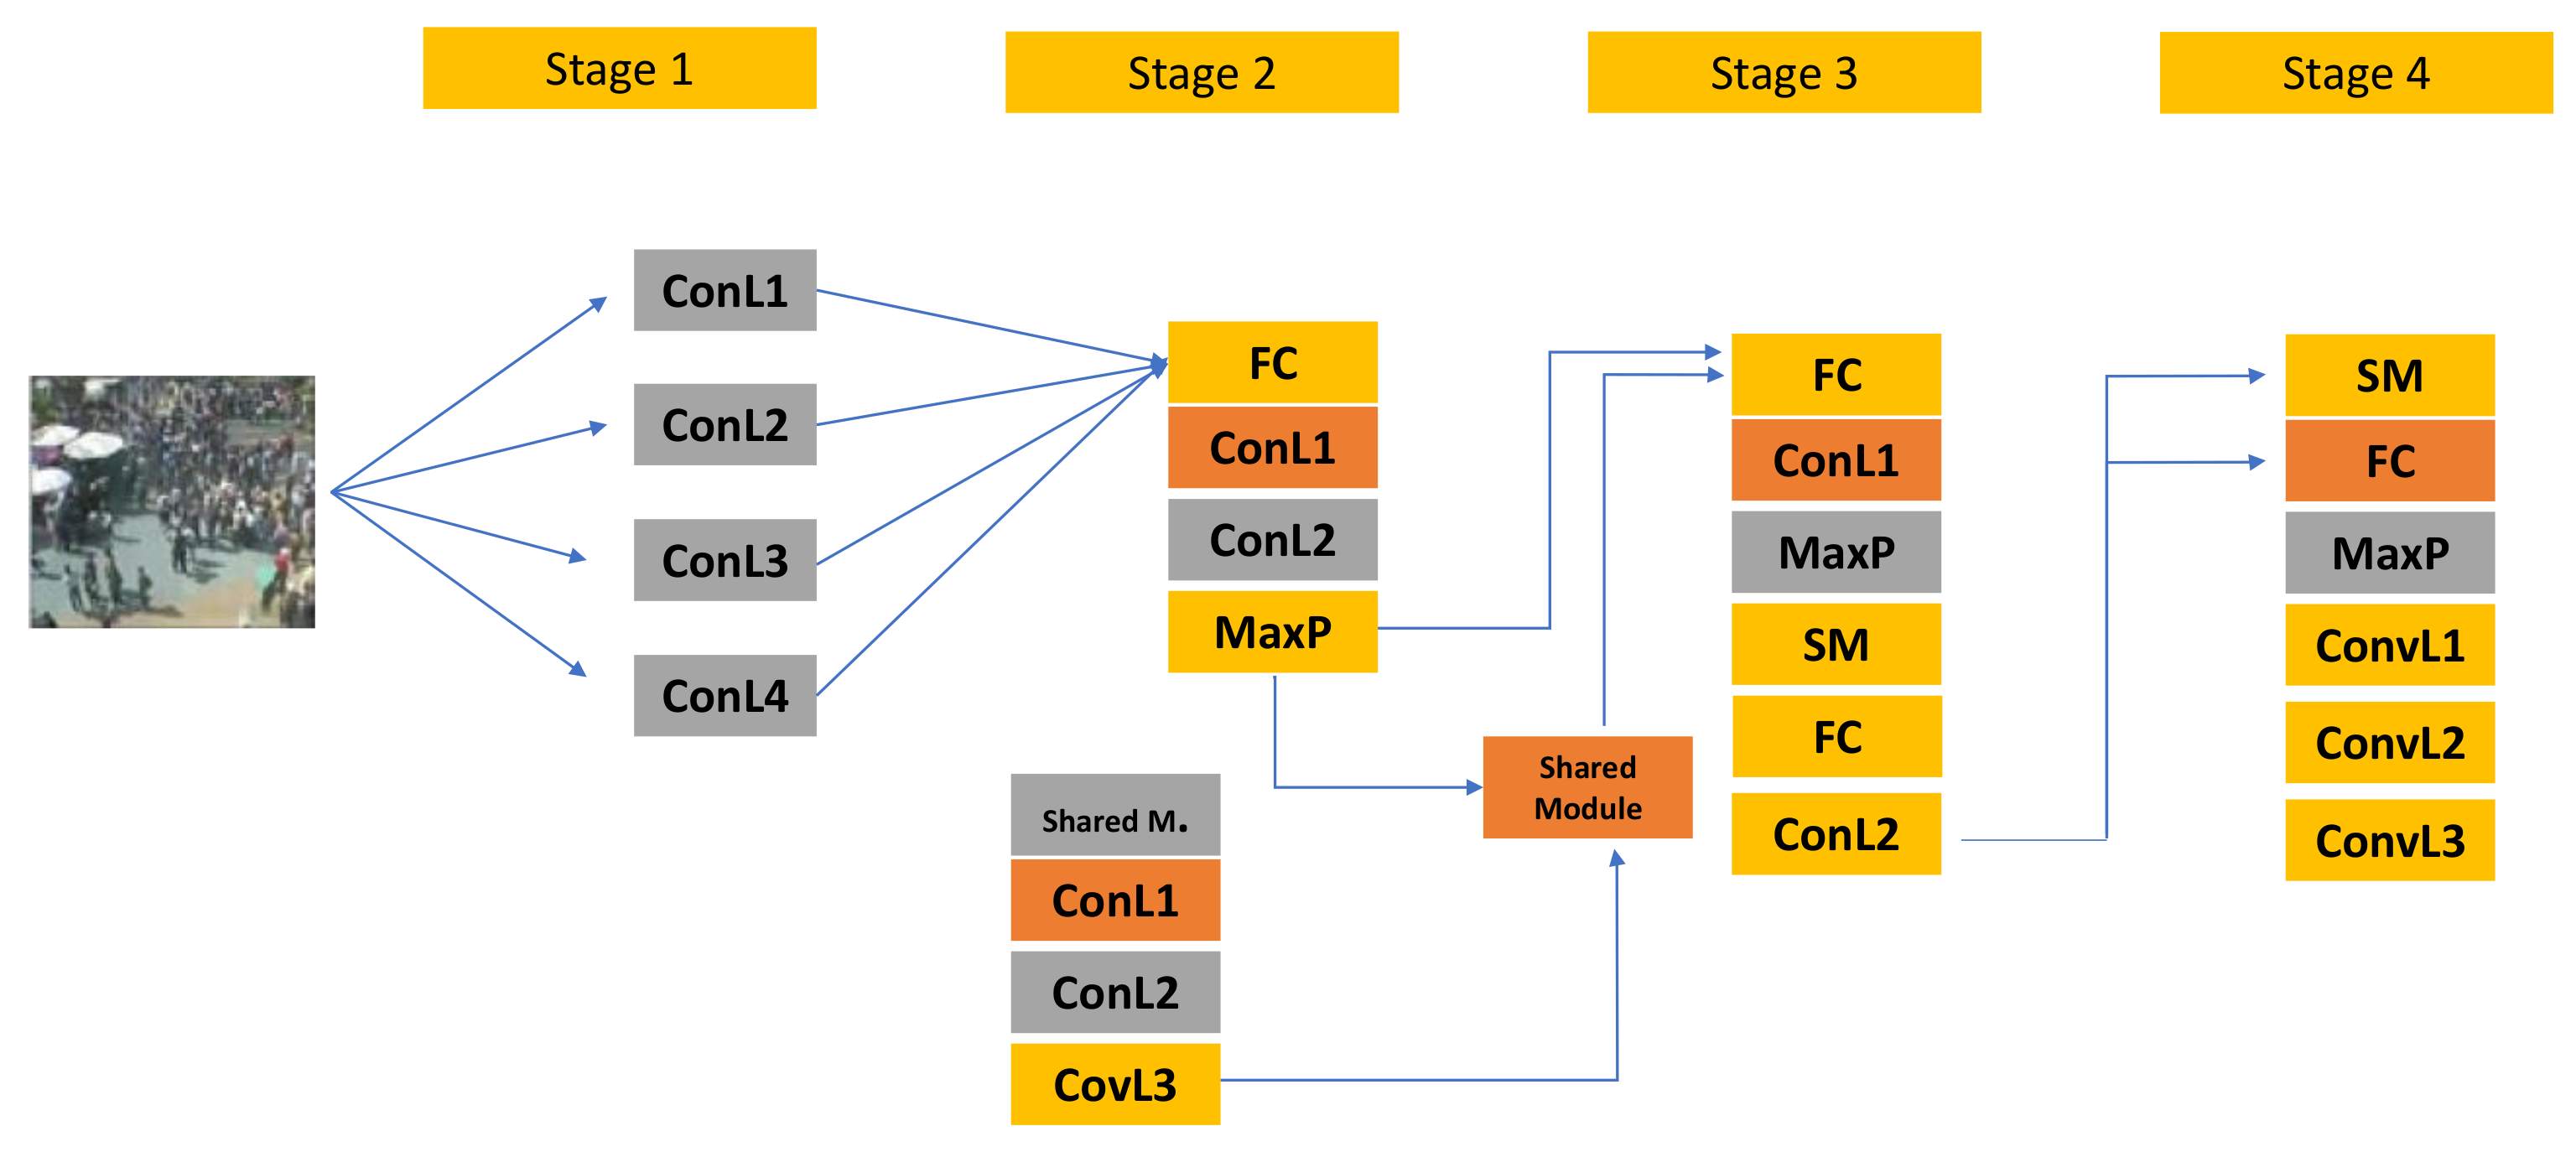
3. Proposed Method
3.1. Model Learning
3.2. CNN Optimization
3.3. Data Annotation
4. Results and Discussion
4.1. Experimental Setup
4.2. Databases
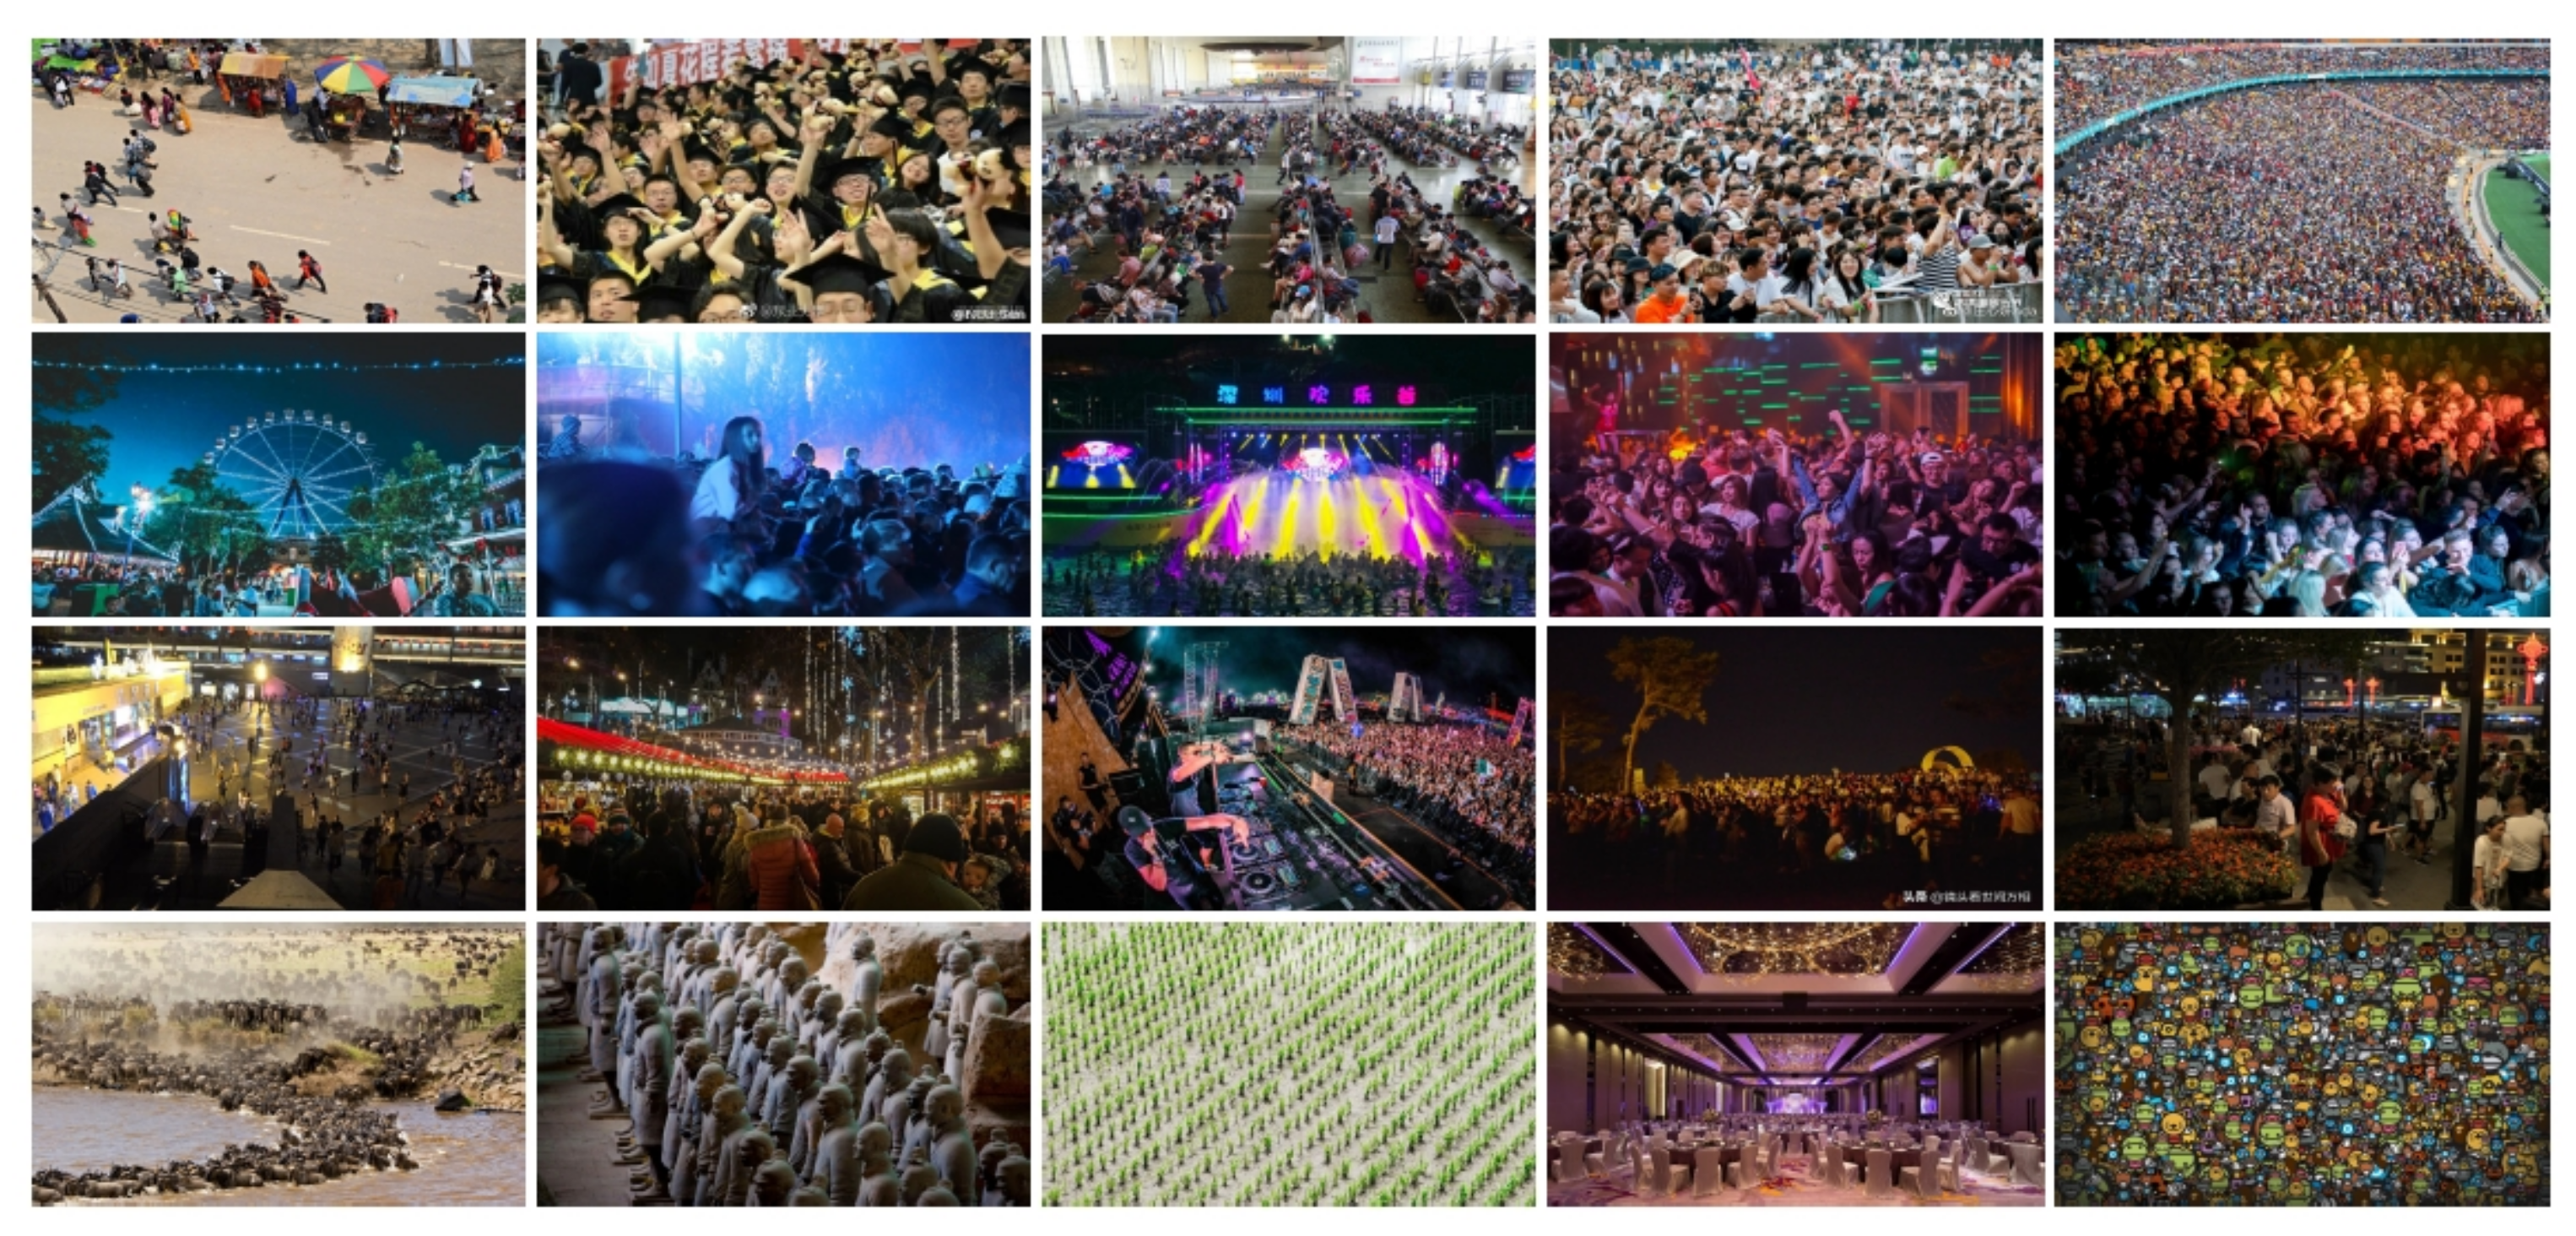
- NWPU-crowd [47]: Deep learning-based models need large-scale data for training and testing phases. Most of the available datasets do not meet the requirements of the deep learning-based methods. NWPU-Crowd is a large-scale dataset that can be utilized for crowd counting. The dataset consists of 5 k images in which almost 2,133,375 heads are annotated. The density range of NWPU-Crowd is large, and diverse illumination conditions were considered. Both Internet and self-shooting data were used for dataset creation. For data collection, a very diverse data collection strategy was adopted; for example, malls, stations, plazas, and resorts were used.
- UCF-QNRF [74]: This is the latest database introduced for various crowd analysis tasks including crowd counting. The dataset has 1535 images with massive variation in density. Images in UCF-QNRF have a higher resolution of × 300 to 9000 × 6000). Images in UCF-QNRF were collected from Hajj footage, web search, and Flicker. Annotation for the data is also provided. Lighting variations, diverse density conditions, and changes in view points are the main characteristics of the dataset. Images were collected from unconstrained conditions with sources such as buildings, roads, sky, and vegetation. Due all the mentioned conditions, the dataset is challenging and fit for deep learning-based models.
- Shanghai Tech [2]: The dataset has the particular feature of large-scale counting. It has 1198 images and 330,165 annotated heads are. The dataset consists of two parts, where Part A has 482 and B 716 images. Part A images were collected from web sources and B images from the streets of Shanghai. The authors defined various combination sets for experiments. Most of the literature uses 300 images for training and the remaining 182 for testing for Part A. Similarly, four-hundred images of Part B are used for training and 316 for the testing phase. Diverse scenes and highly varying density conditions were included in the data collection to make the database challenging.
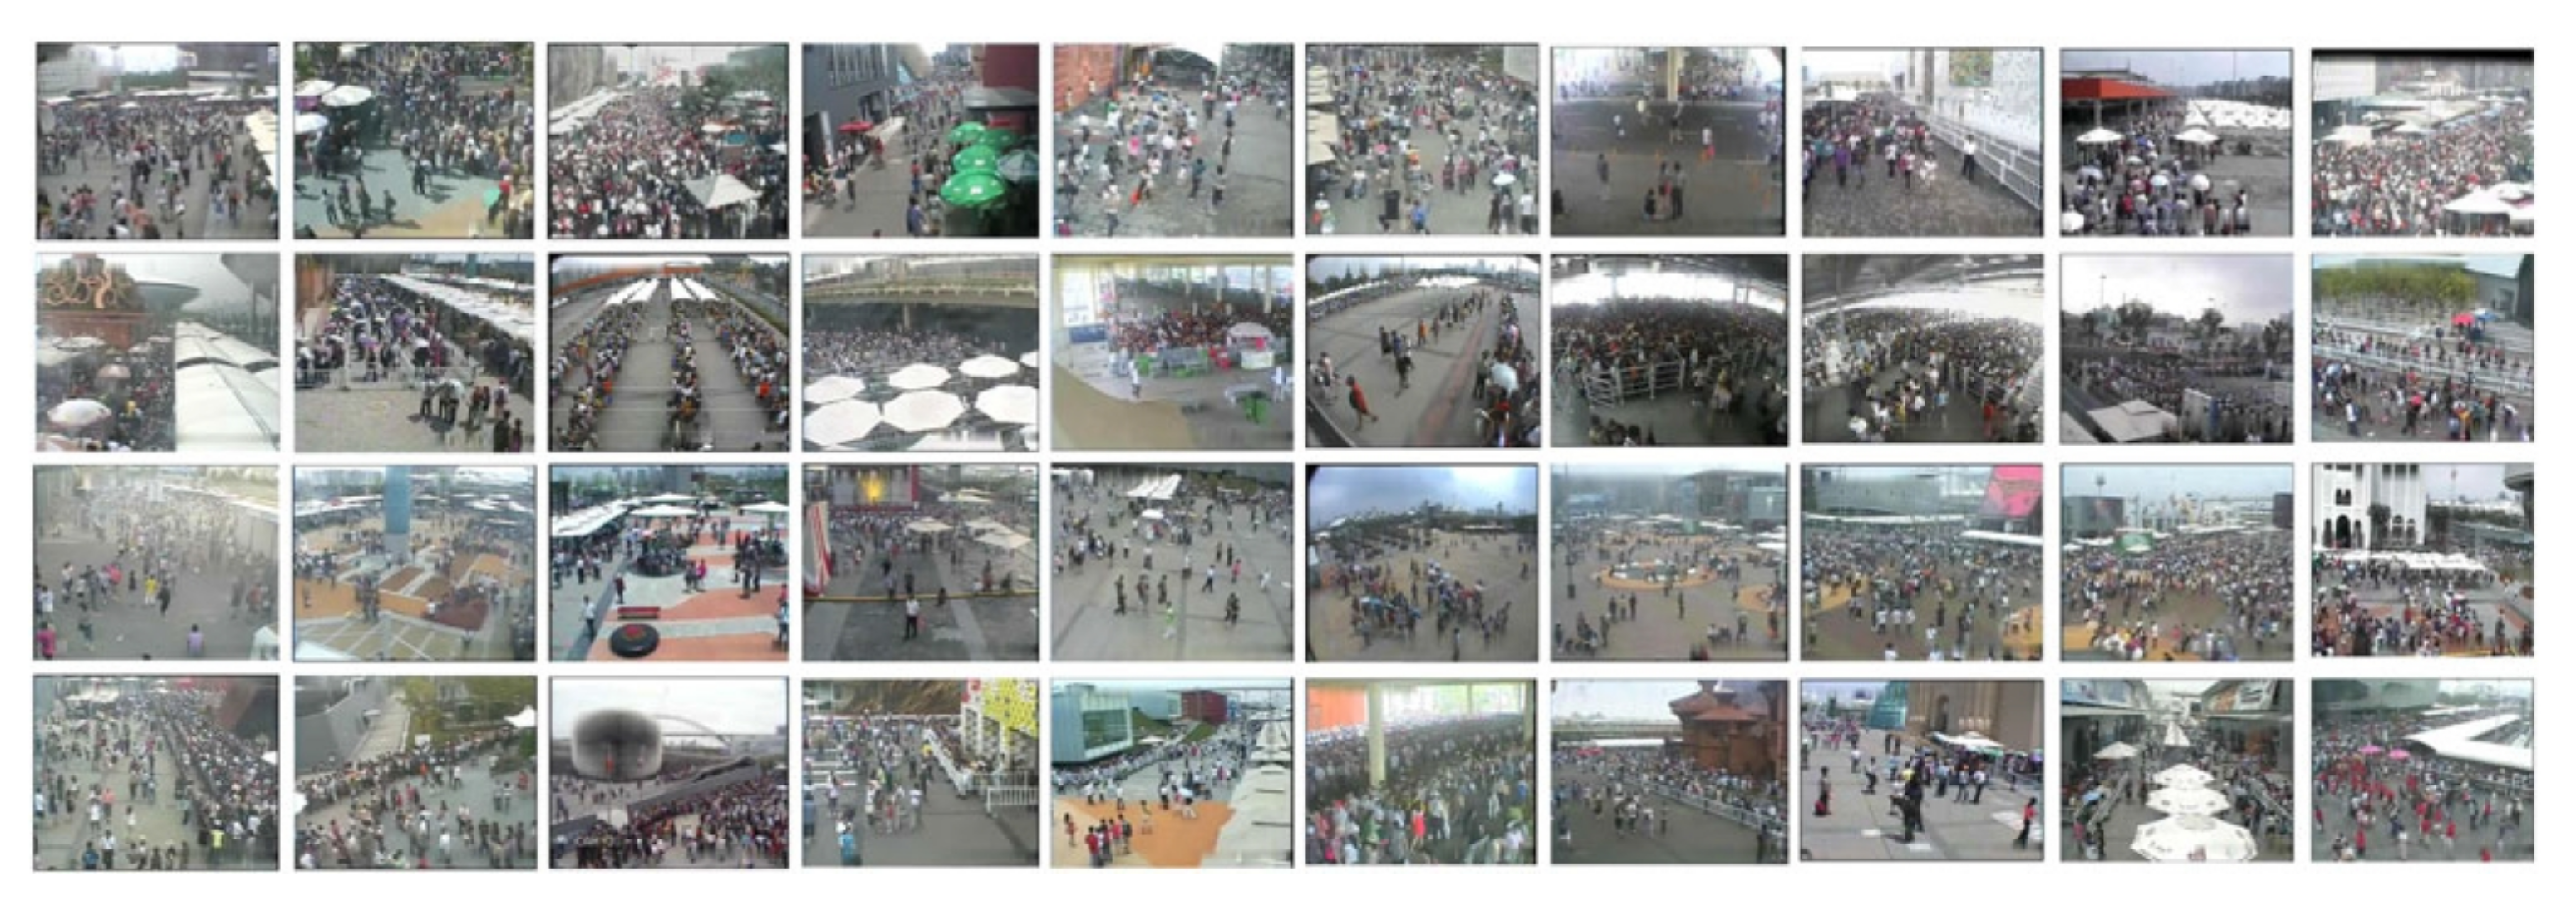
- World Expo [66]: All data for World Expo were collected from 108 surveillance cameras installed at various places. The dataset is suited for cross-scene management scenarios and is efficient. It has 3980 frames, which have a size of each. There are 199,923 labeled pedestrians in the dataset. To ensure diversity in the collected data, disjoint bird views were used by the creators of the dataset. The reported literature divides the training data as one-thousand one-hundred twenty-seven videos with a length of one minute. Due to having fewer data as compared to the State-Of-The-Art (SOTA) dataset, the database is not suitable for performing experiments with deep learning-based models.
4.3. Quantification of Tasks
4.4. Comparative Analysis
- In the last ten years, crowd counting has been explored by researchers significantly. A summary of the results can be seen in Table 4. Researchers have introduced several datasets that address the crowd-counting problem. We noticed that less emphasis has been given to crowd behavior analysis and localization of a crowd. Due to many more applications, crowd counting has been targeted in a better way than other crowd analysis tasks. Due to the diversity of applications, our work also focused on crowd counting.
- The labeling process for creating GT annotation data was performed by a manual process. We observed that this was a time-consuming process, and also, more chances for error existed. Such a labeling process entirely depends on the subjective perception of the person involved in labeling. Compared to this manual labeling, automatic labeling is a comparatively better option, but it is still not a mature case to be used effectively for research. We, in our work, also introduced an automatic labeling process for creating GT data.
- As discussed earlier, crowd counting is an active area of research due to diverse applications. Table 4 shows a detailed summary of the research conducted on SOTA datasets. We reported all the metrics, including the MAE, MSE, precision, recall, and F-measure, from the original research papers. It is very clear from the Table that all these metrics have improved with the passage of time. Much more improvement is brought in particular with the introduction of improved deep learning methods.
- Some research papers reported that TML methods showed better performance as compared to the DLM. Even though through this comparison, it was not claimed that hand-crafted features are better than deep learning-based methods. We argue that a better understanding of the deep learning-based methods is needed for the crowd-counting task. For example, a limited data scenario is a major drawback faced by the deep learning-based methods. We noticed that the performance of the traditional machine learning methods is acceptable with data that are collected in controlled environmental conditions. However, when these TML methods were applied to data collected in-the-wild, a drop in performance by a huge amount was noticed. On the other hand, the DLM extracts a higher level of abstraction from the data. As a result, the DLM outperforms traditional methods. The need for feature engineering is reduced with deep learning-based methods. It is also worth noting that the DLM is facing some concerns from the research community. For instance, the DLM and its applications are complicated procedures that require various inputs from the practitioner’s end. Most of the researchers rely on a trial and error strategy. Hence, these methods are time consuming and more engineered. However, it must be noted that the DLM is the only definitive choice for the crowd-counting task.
- As can be seen from Table 4, most of the DLMs for crowd counting use DCNNs. However, most of these DCNN-based methods employ the pooling layer, which results in comparatively low resolution and some feature loss as well. It is clear that the deeper layers extract some high-level information, whereas comparatively shallower layers somehow extract low-level information and features, which include spatial information. We suggest that both deeper and shallower layer information showed be combined for better results. More reasonable accuracy will be reported with this, and the count error will also be reduced.
- Crowd counting is an active area of research in computer vision. Tremendous progress has been reported in the last couple of years. From the reported results to date, it is evident that most of the metrics such as the MAE, MSE, and F-measure have improved. However, noting the trend of the computer vision developments in various application scenarios with the DLM, it is clear that crowd counting is not a mature research area. As the training phase in the DLM is facing problems due to limited data, an option for researchers to explore is knowledge transfer [76,77].
5. Summary and Concluding Remarks
Author Contributions
Funding
Acknowledgments
Conflicts of Interest
References
- Arteta, C.; Lempitsky, V.; Zisserman, A. Counting in the wild. In European Conference on Computer Vision (ECCV); Springer: Berlin/Heidelberg, Germany, 2016; pp. 483–498. [Google Scholar]
- Zhang, Y.; Zhou, D.; Chen, S.; Gao, S.; Yi, M. Single-image crowd counting via multi-column convolutional neural network. In Proceedings of the IEEE Conference on Computer Vision and Pattern Recognition (CVPR), Las Vegas, NV, USA, 27–30 June 2016; pp. 589–597. [Google Scholar]
- Onoro-Rubio, D.; Lopez-Sastre, R.J. Towards perspective-free object counting with deep learning. In European Conference on Computer Vision (ECCV); Springer: Berlin/Heidelberg, Germany, 2016; pp. 615–629. [Google Scholar]
- Boominathan, L.; Kruthiventi, S.S.; Babu, R.V. Crowdnet: A deep convolutional network for dense crowd counting. In ACM MM; ACM: New York, NY, USA, 2016; pp. 640–644. [Google Scholar]
- Kang, D.; Chan, A. Crowd counting by adaptively fusing predictions from an image pyramid. arXiv 2018, arXiv:1805.06115. [Google Scholar]
- Sam, D.B.; Surya, S.; Babu, R.V. Switching convolutional neural network for crowd counting. In Proceedings of the 2017 IEEE Conference on Computer Vision and Pattern Recognition (CVPR), Honolulu, HI, USA, 21–26 July 2017; pp. 4031–4039. [Google Scholar]
- Sindagi, V.A.; Patel, V.M. Generating high-quality crowd density maps using contextual pyramid CNNs. In Proceedings of the 2017 IEEE International Conference on Computer Vision (ICCV), Venice, Italy, 22–29 October 2017; pp. 1861–1870. [Google Scholar]
- Liu, J.; Gao, C.; Meng, D.; Hauptmann, A.G. Decidenet: Counting varying density crowds through attention guided detection and density estimation. In Proceedings of the 2018 IEEE/CVF Conference on Computer Vision and Pattern Recognition, Salt Lake City, UT, USA, 18–23 June 2018; pp. 5197–5206. [Google Scholar]
- Hossain, M.; Hosseinzadeh, M.; Chanda, O.; Wang, Y. Crowd counting using scale-aware attention networks. In Proceedings of the 2019 IEEE Winter Conference on Applications of Computer Vision (WACV), Waikoloa, HI, USA, 7–11 January 2019; pp. 1280–1288. [Google Scholar]
- Zhang, L.; Shi, M.; Chen, Q. Crowd counting via scale-adaptive convolutional neural network. In Proceedings of the 2018 IEEE Winter Conference on Applications of Computer Vision (WACV), Lake Tahoe, NV, USA, 12–15 March 2018; pp. 1113–1121. [Google Scholar]
- Sang, J.; Wu, W.; Luo, H.; Xiang, H.; Zhang, Q.; Hu, H.; Xia, X. Improved crowd counting method based on scale-adaptive convolutional neural network. IEEE Access 2019, 1, 24411–24419. [Google Scholar] [CrossRef]
- Cao, X.; Wang, Z.; Zhao, Y.; Su, F. Scale aggregation network for accurate and efficient crowd counting. In European Conference on Computer Vision (ECCV); Springer: Berlin/Heidelberg, Germany, 2018; pp. 734–750. [Google Scholar]
- Li, Y.; Zhang, X.; Chen, D. Csrnet: Dilated convolutional neural networks for understanding the highly congested scenes. In Proceedings of the 2018 IEEE/CVF Conference on Computer Vision and Pattern Recognition, Salt Lake City, UT, USA, 18–23 June 2018; pp. 1091–1100. [Google Scholar]
- Varior, R.R.; Shuai, B.; Tighe, J.; Modolo, D. Scale-aware attention network for crowd counting. In Proceedings of the Computer Vision and Pattern Recognition, Long Beach, CA, USA, 16–20 June 2019. [Google Scholar]
- Aich, S.; Stavness, I. Leaf counting with deep convolutional and deconvolutional networks. In Proceedings of the 2017 IEEE International Conference on Computer Vision Workshops (ICCVW), Venice, Italy, 22–29 October 2017; pp. 2080–2089. [Google Scholar]
- Giuffrida, M.V.; Minervini, M.; Tsaftaris, S.A. Learning to count leaves in rosette plants. In Proceedings of the Computer Vision Problems in Plant Phenotyping (CVPPP); BMVC: York, UK, 2015; pp. 1.1–1.13. [Google Scholar]
- Wang, Y.; Zou, Y. Fast visual object counting via example-based density estimation. In Proceedings of the 2016 IEEE International Conference on Image Processing (ICIP), Phoenix, AZ, USA, 25–28 September 2016; pp. 3653–3657. [Google Scholar]
- Walach, E.; Wolf, L. Learning to count with cnn boosting. In European Conference on Computer Vision (ECCV); Springer: Berlin/Heidelberg, Germany, 2016; pp. 660–676. [Google Scholar]
- Lempitsky, V.; Zisserman, A. Learning to count objects in images. In Proceedings of the Neural Information Processing Systems, Hyatt Regency, Vancouver, BC, Canada, 6–11 December 2010; pp. 1324–1332. [Google Scholar]
- Shao, J.; Kang, K.; Change Loy, C.; Wang, X. Deeply learned attributes for crowded scene understanding. In Proceedings of the 2015 IEEE Conference on Computer Vision and Pattern Recognition (CVPR), Boston, MA, USA, 7–12 June 2015; pp. 4657–4666. [Google Scholar]
- Zhou, B.; Wang, X.; Tang, X. Understanding collective crowd behaviors: Learning a mixture model of dynamic pedestrian-agents. In Proceedings of the 2012 IEEE Conference on Computer Vision and Pattern Recognition, Providence, RI, USA, 16–21 June 2012; pp. 2871–2878. [Google Scholar]
- Chan, A.B.; Liang, Z.-S.J.; Vasconcelos, N. Privacy preserving crowd monitoring: Counting people without people models or tracking. In Proceedings of the 2008 IEEE Conference on Computer Vision and Pattern Recognition, Anchorage, AK, USA, 23–28 June 2008; pp. 1–7. [Google Scholar]
- French, G.; Fisher, M.; Mackiewicz, M.; Needle, C. Convolutional neural networks for counting fish in fisheries surveillance video. In Proceedings of the Workshop: Machine Vision of Animals and their Behaviour MVAB, Swansea, UK, 10 September 2015; pp. 1–7. [Google Scholar]
- Zhan, B.; Monekosso, D.N.; Remagnino, P.; Velastin, S.A.; Xu, L.-Q. Crowd analysis: A survey. MVA 2008, 19, 345–357. [Google Scholar] [CrossRef]
- Fiaschi, L.; Köthe, U.; Nair, R.; Hamprecht, F.A. Learning to count with regression forest and structured labels. In Proceedings of the 2012 21st International Conference on Pattern Recognition (ICPR), Tsukuba Science City, Japan, 11–15 November 2012; pp. 2685–2688. [Google Scholar]
- Rabaud, V.; Belongie, S. Counting crowded moving objects. In Proceedings of the 2006 IEEE Computer Society Conference on Computer Vision and Pattern Recognition, New York, NY, USA, 17–22 June 2006; Volume 1, pp. 705–711. [Google Scholar]
- Bharti, Y.; Saharan, R.; Saxena, A. Counting the Number of People in Crowd as a Part of Automatic Crowd Monitoring: A Combined Approach. In Information and Communication Technology for Intelligent Systems; Springer: Singapore, 2019; pp. 545–552. [Google Scholar]
- Boulos, M.N.K.; Resch, B.; Crowley, D.N.; Breslin, J.G.; Sohn, G.; Burtner, R.; Pike, W.A.; Eduardo Jezierski, E.; Chuang, K.-Y.S. Crowdsourcing, citizen sensing and sensor web technologies for public and environmental health surveillance and crisis management: Trends, OGC standards and application examples. Int. J. Health Geogr. 2011, 10, 1–29. [Google Scholar]
- Lv, Y.; Duan, Y.; Kang, W.; Li, Z.; Wang, F.-Y. Traffic flow prediction with big data: A deep learning approach. IEEE Trans. Intell. Transp. Syst. 2014, 16, 865–873. [Google Scholar] [CrossRef]
- Sadeghian, A.; Alahi, A.; Savarese, S. Tracking the untrackable: Learning to track multiple cues with long-term dependencies. In Proceedings of the IEEE International Conference on Computer Vision, Venice, Italy, 22–29 October 2017; pp. 300–311. [Google Scholar]
- Barr, J.R.; Bowyer, K.W.; Flynn, P.J. The effectiveness of face detection algorithms in unconstrained crowd scenes. In Proceedings of the 2014 IEEE Winter Conference on Applications of Computer Vision (WACV), Steamboat Springs, CO, USA, 24–26 March 2014; pp. 1020–1027. [Google Scholar]
- Ng, H.W.; Nguyen, V.D.; Vonikakis, V.; Winkler, S. Deep learning for emotion recognition on small datasets using transfer learning. In Proceedings of the 2015 ACM on International Conference on Multimodal Interaction, Seattle, WA, USA, 9–13 November 2015; pp. 443–449. [Google Scholar]
- Chackravarthy, S.; Schmitt, S.; Yang, L. Intelligent Crime Anomaly Detection in Smart Cities Using Deep Learning. In Proceedings of the 2018 IEEE 4th International Conference on Collaboration and Internet Computing (CIC), Philadelphia, PA, USA, 18–20 October 2018; pp. 399–404. [Google Scholar]
- Zainuddin, Z.; Thinakaran, K.; Shuaib, M. Simulation of the Pedestrian Flow in the Tawaf Area Using the Social Force Model. World Acad. Sci. Eng. Technol. Int. J. Math. Comput. Sci. 2010, 4, 789–794. [Google Scholar]
- Zainuddin, Z.; Thinakaran, K.; Abu-Sulyman, I.M. Simulating the Circumbulation of the Ka’aba using SimWalk. Eur. J. Sci. Res. 2009, 38, 454–464. [Google Scholar]
- Al-Ahmadi, H.M.; Alhalabi, W.S.; Malkawi, R.H.; Reza, I. Statistical analysis of the crowd dynamics in Al-Masjid Al-Nabawi in the city of Medina, Saudi Arabia. Int. J. Crowd Sci. 2018, 2, 64–73. [Google Scholar] [CrossRef] [Green Version]
- Zhou, B.; Tang, X.; Wang, X. Learning collective crowd behaviors with dynamic pedestrian-agents. Int. J. Comput. Vis. 2015, 111, 50–68. [Google Scholar] [CrossRef] [Green Version]
- Perez, H.; Hernandez, B.; Rudomin, I.; Ayguade, E. Task-based crowd simulation for heterogeneous architectures. In Innovative Research and Applications in Next-Generation High Performance Computing; IGI Global: Harrisburg, PA, USA, 2016; pp. 194–219. [Google Scholar]
- Martani, C.; Stent, S.; Acikgoz, S.; Soga, K.; Bain, D.; Jin, Y. Pedestrian monitoring techniques for crowd-flow prediction. Proc. Inst. Civ. Eng.-Smart Infrastruct. Constr. 2017, 2, 17–27. [Google Scholar] [CrossRef] [Green Version]
- Khouj, M.; López, C.; Sarkaria, S.; Marti, J. Disaster management in real time simulation using machine learning. In Proceedings of the 24th Canadian Conference on Electrical and Computer Engineering (CCECE), Niagara Falls, ON, Canada, 8–11 May 2011; pp. 1507–1510. [Google Scholar]
- Khan, K.; Waleed, A.; Rehan, U.K.; Ali Mustafa, Q.; Durre, N. Advances and trends in real time visual crowd analysis. Sensors 2020, 20, 5073. [Google Scholar] [CrossRef]
- Khan, A.; Shah, J.; Kadir, K.; Albattah, W.; Khan, F. Crowd Monitoring and Localization Using Deep Convolutional Neural Network: A Review. Appl. Sci. 2020, 10, 4781. [Google Scholar] [CrossRef]
- Topkaya, I.S.; Erdogan, H.; Porikli, F. Counting people by clustering person detector outputs. In Proceedings of the 2014 11th IEEE International Conference on Advanced Video and Signal Based Surveillance (AVSS), Seoul, Korea, 26–29 August 2014; pp. 313–318. [Google Scholar]
- Li, M.; Zhang, Z.; Huang, K.; Tan, T. Estimating the number of people in crowded scenes by mid based foreground segmentation and head-shoulder detection. In Proceedings of the 2008 19th International Conference on Pattern Recognition, Tampa, FL, USA, 8–11 December 2008; pp. 1–4. [Google Scholar]
- Leibe, B.; Seemann, E.; Schiele, B. Pedestrian detection in crowded scenes. In Proceedings of the 2005 IEEE Computer Society Conference on Computer Vision and Pattern Recognition (CVPR’05), San Diego, CA, USA, 20–25 June 2005; Volume 1, pp. 878–885. [Google Scholar]
- Enzweiler, M.; Gavrila, D.M. Monocular pedestrian detection: Survey and experiments. TPAMI 2009, 31, 2179–2195. [Google Scholar] [CrossRef] [Green Version]
- Wang, Q.; Gao, J.; Lin, W.; Li, X. NWPU-crowd: A large-scale benchmark for crowd counting. arXiv 2020, arXiv:2001.03360. [Google Scholar]
- Girshick, R. Fast r-cnn. In Proceedings of the 2015 IEEE International Conference on Computer Vision (ICCV), Santiago, Chile, 7–13 December 2015; pp. 1440–1448. [Google Scholar]
- Ren, S.; He, K.; Girshick, R.; Sun, J. Faster r-cnn: Towards realtime object detection with region proposal networks. IEEE Trans. Pattern Anal. Mach. Intell. 2015, 39, 91–99. [Google Scholar] [CrossRef] [PubMed] [Green Version]
- He, K.; Gkioxari, G.; Dollar, P.; Girshick, R. Mask R-CNN. In Proceedings of the 2017 IEEE International Conference on Computer Vision (ICCV), Venice, Italy, 22–29 October 2017; pp. 2961–2969. [Google Scholar]
- Redmon, J.; Divvala, S.; Girshick, R.; Farhadi, A. You only look once: Unified, real-time object detection. In Proceedings of the 2016 IEEE Conference on Computer Vision and Pattern Recognition (CVPR), Las Vegas, NV, USA, 27–30 June 2016; pp. 779–788. [Google Scholar]
- Liu, W.; Anguelov, D.; Erhan, D.; Szegedy, C.; Reed, S.; Fu, C.-Y.; Berg, A.C. Ssd: Single shot multibox detector. In European Conference on Computer Vision (ECCV); Springer: Berlin/Heidelberg, Germany, 2016; pp. 21–37. [Google Scholar]
- Chan, A.B.; Vasconcelos, N. Bayesian poisson regression for crowd counting. In Proceedings of the 2009 IEEE 12th International Conference on Computer Vision, Kyoto, Japan, 29 September–2 October 2009; pp. 545–551. [Google Scholar]
- Idrees, H.; Saleemi, I.; Seibert, C.; Shah, M. Multi-source Multi-scale counting in extremely dense crowd images. In Proceedings of the IEEE Conference on Computer Vision and Pattern Recognition, Portland, OR, USA, 23–28 June 2013; pp. 2547–2554. [Google Scholar]
- Chen, K.; Loy, C.C.; Gong, S.; Xiang, T. Feature mining for localised crowd counting. BMVC 2012, 1, 3. [Google Scholar]
- Ryan, D.; Denman, S.; Fookes, C.; Sridharan, S. Crowd counting using multiple local features. In Proceedings of the 2009 Digital Image Computing: Techniques and Applications, Melbourne, VIC, Australia, 1–3 December 2009; pp. 81–88. [Google Scholar]
- Low, D.G. Object recognition from local scale-invariant features. ICCV 1999, 99, 1150–1157. [Google Scholar]
- Ojala, T.; Pietikäinen, M.; Mäenpää, T. Gray Scale and Rotation Invariant Texture Classification with Local Binary Patterns. In Proceedings of the European Conference on Computer Vision (ECCV), Glasgow, UK, 23–28 August 2000; Springer: Berlin/Heidelberg, Germany, 2000; pp. 404–420. [Google Scholar]
- Dalal, N.; Triggs, B. Histograms of oriented gradients for human detection. IEEE Comput. Soc. 2005, 1, 886–893. [Google Scholar]
- Haralick, R.M.; Shanmugam, K. Textural features for image classification. TSMC 1973, 6, 610–621. [Google Scholar] [CrossRef] [Green Version]
- Paragios, N.; Ramesh, V. A MRF-based approach for real-time subway monitoring. In Proceedings of the 2001 IEEE Computer Society Conference on Computer Vision and Pattern Recognition, Kauai, HI, USA, 8–14 December 2001; Volume 1, pp. 1–1034. [Google Scholar]
- Tian, Y.; Sigal, L.; Badino, H.; De la Torre, F.; Liu, Y. Latent gaussian mixture regression for human pose estimation. In ACCV; Springer: Berlin/Heidelberg, Germany, 2010; pp. 679–690. [Google Scholar]
- Pham, V.-Q.; Kozakaya, T.; Yamaguchi, O.; Okada, R. Count forest: Co-voting uncertain number of targets using random forest for crowd density estimation. In Proceedings of the 2015 IEEE International Conference on Computer Vision (ICCV), Santiago, Chile, 7–13 December 2015; pp. 3253–3261. [Google Scholar]
- Wang, C.; Zhang, H.; Yang, L.; Liu, S.; Cao, X. Deep people counting in extremely dense crowds. In ACM MM; ACM: New York, NY, USA, 2015; pp. 1299–1302. [Google Scholar]
- Fu, M.; Xu, P.; Li, X.; Liu, Q.; Ye, M.; Zhu, C. Fast crowd density estimation with convolutional neural networks. EAAI 2015, 43, 81–88. [Google Scholar] [CrossRef]
- Zhang, C.; Li, H.; Wang, X.; Yang, X. Cross-scene crowd counting via deep convolutional neural networks. In Proceedings of the IEEE Conference on Computer Vision and Pattern Recognition, Boston, MA, USA, 7–12 June 2015. [Google Scholar]
- Gao, G.; Gao, J.; Liu, Q.; Wang, Q.; Wang, Y. Cnn-based density estimation and crowd counting: A survey. arXiv 2020, arXiv:2003.12783. [Google Scholar]
- Zhang, J.; Liu, J.; Wang, Z. Convolutional Neural Network for Crowd Counting on Metro Platforms. Symmetry 2021, 13, 703. [Google Scholar] [CrossRef]
- Lei, Y.; Liu, Y.; Zhang, P.; Liu, L. Towards using count-level weak supervision for crowd counting. Pattern Recognit. 2021, 109, 107616. [Google Scholar] [CrossRef]
- Tong, M.; Fan, L.; Nan, H.; Zhao, Y. Smart Camera Aware Crowd Counting via Multiple Task Fractional Stride Deep Learning. Sensors 2019, 19, 1346. [Google Scholar] [CrossRef] [PubMed] [Green Version]
- Songchenchen, G. Real-Time Implementation of Counting People in a Crowd on the Embedded Reconfigurable Architecture on the Unmanned Aerial Vehicle. Image Processing [eess.IV]. Ph.D. Thesis, Université Bourgogne Franche-Comté, Besancon, France, 13 November 2020. [Google Scholar]
- Bhangale, U.; Patil, S.; Vishwanath, V.; Thakker, P.; Bansode, A.; Navandhar, D. Near Real-time Crowd Counting using Deep Learning Approach. Procedia Comput. Sci. 2020, 171, 770–779. [Google Scholar] [CrossRef]
- Collobert, R.; Jason, W. A unified architecture for natural language processing: Deep neural networks with multitask learning. In Proceedings of the 25th International Conference on Machine Learning, Helsinki, Finland, 5–9 July 2008; pp. 160–167. [Google Scholar]
- Idrees, H.; Tayyab, M.; Athrey, K.; Zhang, D.; Al-Maadeed, S.; Rajpoot, N. Composition loss for counting, density map estimation and localization in dense crowds. arXiv 2018, arXiv:1808.01050. [Google Scholar]
- Jacobs, H. To count a crowd. Columbia J. Rev. 1967, 6, 36–40. [Google Scholar]
- Tsai, Y.-H.H.; Yeh, Y.-R.; Wang, Y.-C.F. Learning Cross-Domain Landmarks Heterog. Domain Adaptation. In Proceedings of the 2016 IEEE Conference on Computer Vision and Pattern Recognition (CVPR), Las Vegas, NV, USA, 27–30 June 2016; pp. 5081–5090. [Google Scholar]
- Hoffman, J.; Rodner, E.; Donahue, J.; Kulis, B.; Saenko, K. Asymmetric and category invariant feature transformations for domain adaptation. Int. J. Comput. Vis. 2014, 109, 28–41. [Google Scholar] [CrossRef]
- Liu, C.; Weng, X.; Mu, Y. Recurrent attentive zooming for joint crowd counting and precise localization. In Proceedings of the 2019 IEEE/CVF Conference on Computer Vision and Pattern Recognition (CVPR), Long Beach, CA, USA, 15–20 June 2019; pp. 1217–1226. [Google Scholar]
- Gao, J.; Han, T.; Wang, Q.; Yuan, Y. Domain-adaptive crowd counting via inter-domain features segregation and gaussian-prior reconstruction. arXiv 2019, arXiv:1912.03677. [Google Scholar]
- Hu, Y.; Chang, H.; Nian, F.; Wang, Y.; Li, T. Dense crowd counting from still images with convolutional neural networks. J. Vis. Commun. Image Represent. 2016, 38, 530–539. [Google Scholar] [CrossRef]
- Xue, Y.; Liu, S.; Li, Y.; Qian, X. Crowd Scene Analysis by Output Encoding. arXiv 2020, arXiv:2001.09556. [Google Scholar]
- Liu, L.; Amirgholipour, S.; Jiang, J.; Jia, W.; Zeibots, M.; He, X. Performance-enhancing network pruning for crowd counting. Neurocomputing 2019, 360, 246–253. [Google Scholar] [CrossRef]
- He, K.; Zhang, X.; Ren, S.; Sun, J. Deep residual learning for image recognition. In Proceedings of the IEEE Conference on Computer Vision and Pattern Recognition, Las Vegas, NV, USA, 27–30 June 2016; pp. 770–778. [Google Scholar]
- Huang, G.; Liu, Z.; Maaten, L.V.D.; Weinberger, K.Q. Densely connected convolutional networks. In Proceedings of the 2017 IEEE Conference on Computer Vision and Pattern Recognition (CVPR), Honolulu, HI, USA, 21–26 July 2017. [Google Scholar]
- Badrinarayanan, V.; Kendall, A.; Cipolla, R. SegNet: A deep convolutional encoder-decoder architecture for image segmentation. IEEE Trans. Pattern Anal. Mach. Intell. 2017, 39, 2481–2495. [Google Scholar] [CrossRef]
- Shahira, A.; Minh, H.; Dimitris, S.; Chao, C. Localization in the crowd with topological constraints. arXiv 2021, arXiv:2012.12482. [Google Scholar]
- Liang, D.; Wei, X.; Zhu, Y.; Zhou, Y. Focal Inverse Distance Transform Maps for Crowd Localization and Counting in Dense Crowd. arXiv 2021, arXiv:2102.07925. [Google Scholar]
- Hu, P.; Deva, R. Finding tiny faces. In Proceedings of the 2017 IEEE Conference on Computer Vision and Pattern Recognition (CVPR), Honolulu, HI, USA, 21–26 July 2017. [Google Scholar]
- Liu, W.; Salzmann, M.; Fua, P. Context-aware crowd counting. In Proceedings of the IEEE Conference on Computer Vision and Pattern Recognition, Long Beach, CA, USA, 15–20 June 2019; pp. 5099–5108. [Google Scholar]
- Jiang, X.; Xiao, Z.; Zhang, B.; Zhen, X.; Cao, X.; Doermann, D.; Shao, L. Crowd counting and density estimation by trellis encoderdecoder networks. In Proceedings of the IEEE Conference on Computer Vision and Pattern Recognition, Long Beach, CA, USA, 15–20 June 2019; pp. 6133–6142. [Google Scholar]
- Wang, Q.; Gao, J.; Lin, W.; Yuan, Y. Learning from synthetic data for crowd counting in the wild. In Proceedings of the IEEE Conference on Computer Vision and Pattern Recognition, Long Beach, CA, USA, 15–20 June 2019; pp. 8198–8207. [Google Scholar]
- Zhang, A.; Shen, J.; Xiao, Z.; Zhu, F.; Zhen, X.; Cao, X.; Shao, L. Relational attention network for crowd counting. In Proceedings of the IEEE International Conference on Computer Vision, Seoul, Korea, 27 October–2 November 2019; pp. 6788–6797. [Google Scholar]
- Guo, D.; Li, K.; Zha, Z.-J.; Meng, W. Dadnet: Dilated-attentiondeformable convnet for crowd counting. In Proceedings of the ACM International Conference on Multimedia, Nice, France, 21–25 October 2019; pp. 1823–1832. [Google Scholar]
- Wan, J.; Chan, A. Adaptive density map generation for crowd counting. In Proceedings of the IEEE Conference on Computer Vision and Pattern Recognition, Long Beach, CA, USA, 15–20 June 2019; pp. 1130–1139. [Google Scholar]
- Gao, J.; Yuan, Y.; Wang, Q. Feature-aware adaptation and density alignment for crowd counting in video surveillance. IEEE Trans. Cybernet. 2020, 1–12. [Google Scholar] [CrossRef]
- Zhu, J.-Y.; Park, T.; Isola, P.; Efros, A.A. Unpaired image-to-image translation using cycle-consistent adversarial networks. arXiv 2017, arXiv:1703.10593. [Google Scholar]


| Layer | Stride | Size of Kernel | Feature Maps | Output Size |
|---|---|---|---|---|
| Input | – | – | – | |
| ConL1 | 2 | 96 | ||
| MaxP1 | 2 | 96 | ||
| ConL2 | 2 | 256 | ||
| MaxP2 | 2 | 256 | ||
| ConL3 | 2 | 316 | ||
| MaxP3 | 2 | 316 | ||
| ConL4 | 2 | 512 | ||
| MaxP4 | 2 | 512 |
| Parameters | Vales |
|---|---|
| Epochs | 30 |
| Batch size | 125 |
| Momentum | 0.9 |
| Base learning rate |
| Database | Year | Task | Number of Images | Source Obtained |
|---|---|---|---|---|
| NWPU-Crowd [47] | 2020 | crowd counting and localization | 5109 | surveillance and Internet |
| UCF-QNRF [74] | 2018 | counting in a crowd | 1525 | surveillance |
| Shanghai Tech [2] | 2016 | cross-scene crowd counting | 482 | surveillance cameras and Internet |
| World Expo’10 [66] | 2015 | counting in a crowd | 3980 | surveillance |
| Database | Year | Method | Precision | Recall | F1-Measure |
|---|---|---|---|---|---|
| 2021 | proposed method | 96.4 | 62.3 | 57.8 | |
| 2019 | Liu et al. [78] | 66.6 | 54.3 | 59.8 | |
| NWPU-crowd | 2019 | Gao et al. [79] | 55.8 | 49.6 | 52.5 |
| 2017 | Hu et al. [80] | 52.9 | 61.1 | 56.7 | |
| 2021 | proposed method | 84.5 | 76.42 | 80.25 | |
| 2020 | Xue et al. [81] | 82.4 | 78.3 | 80.00 | |
| 2019 | Liu et al. [78] | 81.5 | 71.1 | 75.0 | |
| UCF_QNRF | 2018 | Liu et al. [78] | 59.3 | 63.0 | 61.09 |
| 2018 | Shen et al. [82] | 75.6 | 59.7 | 66.71 | |
| 2018 | Idrees et al. [54] | 75.8 | 63.5 | 69.10 | |
| 2016 | Zhang et al. [2] | 71.0 | 72.4 | 71.69 | |
| 2016 | He et al. [83] | 61.6 | 66.9 | 64.14 | |
| 2016 | Huang et al. [84] | 70.1 | 58.1 | 63.53 | |
| 2015 | Badrinarayanan et al. [85] | 71.8 | 62.9 | 67.05 | |
| 2015 | Zhang et al. [66] | 78.1 | 65.1 | 71.17 | |
| 2021 | proposed method | 88.2 | 78.6 | 83.12 | |
| 2020 | Xue et al. [81] | 87.3 | 79.2 | 82.05 | |
| Shanghai Tech. A | 2019 | Liu et al. [78] | 86.5 | 69.7 | 77.12 |
| 2018 | Idrees et al. [54] | 79.0 | 72.3 | 75.51 | |
| 2018 | Liu et al. [78] | 82.2 | 73.3 | 77.49 | |
| 2018 | Shen et al. [82] | 79.2 | 82.2 | 80.67 | |
| 2016 | Zhang et al. [2] | 76.5 | 81.7 | 78.92 | |
| 2015 | Zhang et al. [66] | 81.9 | 77.9 | 79.84 | |
| 2021 | proposed method | 87.7 | 81.1 | 84.27 | |
| 2020 | Xue et al. [81] | 86.7 | 80.5 | 83.80 | |
| 2019 | Liu et al. [78] | 79.1 | 60.1 | 68.30 | |
| 2019 | Zhang et al. [2] | 82.4 | 76.0 | 79.07 | |
| 2019 | Idrees et al. [54] | 76.8 | 78.0 | 77.39 | |
| Shanghai Tech. B | 2019 | Liu et al. [78] | 78.1 | 73.9 | 75.94 |
| 2018 | Liu et al. [78] | 75.4 | 79.3 | 77.30 | |
| 2018 | Shen et al. [82] | 80.2 | 78.8 | 77.34 | |
| 2015 | Zhang et al. [66] | 84.1 | 75.8 | 79.73 | |
| 2021 | proposed method | 83.3 | 84.5 | 83.89 | |
| 2020 | Xue et al. [81] | 82.0 | 81.5 | 81.74 | |
| 2019 | Idrees et al. [54] | 72.4 | 78.3 | 75.23 | |
| 2019 | Liu et al. [78] | 73.7 | 79.6 | 76.52 | |
| 2019 | Liu et al. [78] | 71.6 | 75.4 | 73.45 | |
| World Expo | 2019 | Zhang et al. [2] | 80.9 | 77.5 | 79.16 |
| 2018 | Liu et al. [78] | 73.8 | 78.2 | 75.93 | |
| 2018 | Shen et al. [82] | 68.5 | 81.2 | 74.31 | |
| 2015 | Zhang et al. [66] | 79.5 | 73.1 | 76.16 |
| Database | Year | Method | MAE | MSE |
|---|---|---|---|---|
| 2021 | proposed method | 78.2 | 301.9 | |
| 2021 | Abousamra et al. [86] | 107.8 | 438.5 | |
| 2021 | Liang et al. [87] | 86.0 | 312.5 | |
| NWPU-crowd | 2019 | Gao et al. [79] | 127.3 | 439.9 |
| 2019 | Liu et al. [78] | 151.5 | 634.7 | |
| 2017 | Peiyun et al. [88] | 272.4 | 764.9 | |
| 2015 | Ren et al. [49] | 414.2 | 1063.7 | |
| 2021 | proposed method | 96.4 | 162.2 | |
| UCF_QNRF | 2019 | Liu et al. [89] | 107 | 183 |
| 2019 | Jiang et al. [90] | 113 | 188 | |
| 2019 | Wan et al. [91] | 101 | 176 | |
| 2018 | Li et al. [13] | 113.2 | 189.4 | |
| 2017 | Zhang et al. [92] | 111 | 190 | |
| 2021 | proposed method | 56.7 | 93.1 | |
| Shanghai Tech. A | 2019 | Guo et al. [93] | 64.2 | 99.9 |
| 2019 | Liu et al. [89] | 62.3 | 100.0 | |
| 2019 | Jiang et al. [90] | 64.2 | 109.1 | |
| 2019 | Wan et al. [94] | 64.7 | 97.1 | |
| 2019 | Zhang et al. [92] | 59.4 | 102.0 | |
| 2018 | Li et al. [13] | 68.2 | 115.0 | |
| 2018 | Cao et al. [12] | 67.0 | 104.5 | |
| 2017 | Zhang et al. [2] | 110.2 | 173.2 | |
| 2021 | proposed method | 7.4 | 10.2 | |
| 2019 | Guo et al. [93] | 8.8 | 13.5 | |
| 2019 | Lie et al. [89] | 7.8 | 12.2 | |
| 2019 | Jiang et al. [90] | 8.2 | 12.8 | |
| Shanghai Tech. B | 2019 | Wan et al. [94] | 8.1 | 13.6 |
| 2019 | Zhang et al. [92] | 7.9 | 12.9 | |
| 2017 | Zhang et al. [2] | 26.4 | 41.3 | |
| 2018 | Li et al. [13] | 10.6 | 16.0 | |
| 2018 | Cao et al. [12] | 8.4 | 13.6 | |
| 2021 | proposed method | 8.3 | – | |
| 2020 | Gao et al. [95] | 21.6 | – | |
| World Expo | 2019 | Gao et al. [79] | 17.4 | – |
| 2019 | Gao et al. [79] | 10.8 | – | |
| 2019 | Wang et al. [91] | 26.3 | – | |
| 2017 | Zhu et al. [96] | 32.4 | – |
Publisher’s Note: MDPI stays neutral with regard to jurisdictional claims in published maps and institutional affiliations. |
© 2021 by the authors. Licensee MDPI, Basel, Switzerland. This article is an open access article distributed under the terms and conditions of the Creative Commons Attribution (CC BY) license (https://creativecommons.org/licenses/by/4.0/).
Share and Cite
Khan, K.; Khan, R.U.; Albattah, W.; Nayab, D.; Qamar, A.M.; Habib, S.; Islam, M. Crowd Counting Using End-to-End Semantic Image Segmentation. Electronics 2021, 10, 1293. https://doi.org/10.3390/electronics10111293
Khan K, Khan RU, Albattah W, Nayab D, Qamar AM, Habib S, Islam M. Crowd Counting Using End-to-End Semantic Image Segmentation. Electronics. 2021; 10(11):1293. https://doi.org/10.3390/electronics10111293
Chicago/Turabian StyleKhan, Khalil, Rehan Ullah Khan, Waleed Albattah, Durre Nayab, Ali Mustafa Qamar, Shabana Habib, and Muhammad Islam. 2021. "Crowd Counting Using End-to-End Semantic Image Segmentation" Electronics 10, no. 11: 1293. https://doi.org/10.3390/electronics10111293