Article

Comparison of Analytical Methods for the Detection of Residual Crosslinker in Hyaluronic Acid Hydrogel Films

Faculty of Health Sciences and Wellbeing, University of Sunderland, Sunderland SR1 3SD, UK
*
Author to whom correspondence should be addressed.
Cosmetics 2023, 10(3), 70; https://doi.org/10.3390/cosmetics10030070
Submission received: 29 March 2023 / Revised: 11 April 2023 / Accepted: 24 April 2023 / Published: 26 April 2023
(This article belongs to the Special Issue Analytical Methods for Quality Control in Cosmetics)

Abstract

:
Cosmetic skincare products often consist of residual chemical ingredients which are by-products of the manufacturing process that may cause side effects such as skin irritation or allergic dermatitis; investigating the safety of these products to protect the consumer is an important part in the quality control of formulations intended for skin application. Acrylates are a type of polymer widely used in pharmaceutical and cosmetic applications as copolymers, emulsifiers, and cross-linkers. Due to the acrylates being strong skin irritants and sensitizers, it is essential to quantify the levels of residual acrylate monomers in the formulation; these levels must be within the accepted value to be safe. Our previously reported novel hyaluronic acid (HA) hydrogel films were formulated using pentaerythritol tetraacrylate (PT) as the crosslinker. Therefore, it was crucial to analyze the residual PT in these hydrogel films. Gas chromatography (GC) and nuclear magnetic resonance (NMR) spectroscopy were used as analytical methods to detect the residual PT monomers in the HA hydrogel samples. Scanning electron microscopy (SEM) was conducted to investigate structural changes due to the PT monomers leaching out from the HA hydrogel films. The results from the GC method validation (linearity R² > 0.99, RSD for intra-day precision = 1.78%, inter-day precision = 2.52%, %recovery = 101.73%, %RSD = 1.59% for robustness, LOD, LOQ values 0.000032% m/m, 0.00013% m/m for sensitivity) revealed its suitability for such studies. NMR analysis results agreed with the GC results confirming the correct quantification of the extracted residual acrylate monomer. The maximum safe concentration of PT crosslinker in the formulation was determined to be 2.55% m/m.

1. Introduction

The purpose of cosmetics is to beautify, perfume, or cleanse the human body, and cosmetic rituals have existed since the start of civilization [1]. While the cosmetic sector is growing at a fast rate, great progress has been made in the diversification of cosmetic products and their functions [2]. Due to the rising consumer demand and the expansion of the cosmetic industries, it is required to develop variable and reliable types of formulations [3]. Although the manufacturers of cosmetic products are interested in studies to discover novel formulations, they might face challenges with the stability and safety of these novel formulations [4], as well as adjusting the choice and concentration of active ingredients that would be effective for the target applications [4,5,6]. Even though active ingredients nowadays are more available, delivering them to the targets and maintaining their activity is considered another challenge [2,7].
Cosmetology is a distinct science where the cosmetologist is a human life sciences scientist with a deep understanding of the actives’ efficacy, formulation, stability, safety, and claim substantiation [2]; it is a science focused and based on the combination of numerous expert domains such as: chemistry, physics, biology, bioengineering, dermatology, microbiology, toxicology, statistics, and many others subjects that all cover the skincare and topical formulations [2,4].
Hyaluronic acid (HA) is a natural linear polysaccharide polymer with particularly promising applications in modern cosmetic and nutricosmetic products due to its ability to retain large amounts of water that are essential for skin hydration [8]. It has been introduced in numerous anti-aging cosmetic preparations such as gels, creams, serums, and lotions, and in aesthetic skin rejuvenation treatments such as dermal/intra-dermal filler injections [9]. HA is a non-sulfated linear glycosaminoglycan containing repeated units of a disaccharide of β-1,4-D-glucuronic acid and β-1,3-N-acetyl-D-glucosamine [10]. It has a short half-life of about 12 h because it undergoes rapid degradation by the hyaluronidase enzymes present in body tissues. Therefore, cross-linking of the HA polymer in hydrogel films (Type 1) can overcome undesirable limitations and supply a robust cosmetic platform [9,11,12].
HA has three different functional groups (hydroxyl (-OH), carboxylic (-COOH), and amide (-NHCOCH3), that are available for crosslinking via an ether bond (R-O-R), ester linkage (R-COO-R), and carbodiimide, respectively [8]. Therefore, HA has been successfully cross-linked using 1-ethyl-3-(3-dimethylaminopropyl) carbodiimide (EDC), glutaraldehyde (GTA), poly (ethylene glycol) diglycidyl ether (PEGDE), ethylene glycol diglycidyl ether (EGDE), and divinyl sulfonate (DVS) among others as crosslinkers [12]. To maintain the biocompatibility and safety of cross-linked HA, the effective proportion of a cross-linker should be as low as possible.
Type I hydrogels are cross-linked three-dimensional polymeric materials holding hydrophilic groups in their structure. They can retain water within their structure without dissolving [8,13,14]. Hydrogels may be formulated from one or more polymers; the spaces between the macromolecules of their structure can fill with water leading to swelling. The hydrophilic functional groups of the polymer are responsible for the hydrogels’ ability to absorb water in aqueous media [15]. The cross-links in the polymer network chains prevent the dissolving of the hydrogel in water [16]. Hydrogels can be utilized in numerous technologies such as nanotechnology, iontophoresis, and microneedle arrays in order to achieve skin penetration [17,18,19,20], also in wound healing and anti-scar dressings [21]. Furthermore, hydrogels have gained a key role in cosmetic applications due to their ability to release and deliver actives via the skin [9].
PT (pentaerythritol tetraacrylate) is a tetra-functional acrylate monomer widely used as a crosslinker in polymerization as well as a solvent, a colorant, and a fragrance in pharmaceutical and cosmetic applications [8]. In previous studies, PT has been used as a crosslinker for polyethylene oxide (PEO) via UV radiation [22] and it has been used in alginate hydrogel formulation [23]. In addition, PT can be used to crosslink HA hydrogel via exposure to high temperatures (80 °C) in the oven [8]. Such crosslinked hydrogel films are crucially suitable for the delivery of drugs and cosmetic active ingredients by transdermal and topical (cosmetic) formulations, respectively, via the application of the hydrogel film on the intact skin surface [9].
The crosslinking reaction could result in the synthesized gels containing low molecular weight aromatic impurities [24] of residual crosslinker; the presence of such multifunctional acrylate monomers in topical formulations is a concern [25] because the unreacted acrylate monomers can leach out from the films and diffuse into the skin, causing side effects such as inflammation, dermatitis, and skin sensitization. Therefore, it is important to establish quality control analysis methods for the detection of residual crosslinkers in HA hydrogel films intended for dermatological applications.
The most used quality control analysis methods for the evaluation of residual monomers are gas chromatography (GC) and high-performance liquid chromatography (HPLC) because of the simplicity and rapidity of these techniques [26]. Other spectroscopic techniques that have been conducted to quantify residual acrylate monomers include nuclear magnetic resonance (NMR) spectroscopy [27,28]. NMR provides an alternative method of quantitation that benefits from minimal sample preparation, rapid sample analysis, and structural confirmation, and is a non-destructive technique. Furthermore, as its application has been reported in hydrogel film determination and quantification [10,29], it was included in our study to evaluate the amount of residual PT in the films. The aim of our study was (i) to quantify the residual (uncross-linked) acrylate monomer (PT) in HA hydrogel films using GC and NMR as quality control tests, (ii) to confirm the safety of the films for skin applications, and iii) to compare the results from these two techniques.

2. Materials, Chemicals, and Reagents

Hyaluronic acid (HA) sodium salt with high molecular weight (1800–2200 KDa) was supplied by Infinity Ingredients (Binfield, UK), while PT (pentaerythritol tetracrylate) was purchased from Insight Biotechnology Limited (Wembley, UK). Hexylacrylate (Hex) was purchased from Sigma-Aldrich (Gillingham, UK). These materials were used as received unless otherwise described. Chloroform and dichloromethane were used as extraction solvents for GC, while deuterated chloroform was used as a solvent for NMR analysis. Other chemicals and reagents included NaOH (1.0 M) and HCl (1.0 M), which were used for pH adjustment. Deionized distilled water was available in the laboratory and was used as solvent for the gelation of HA and as a polar swelling agent for the HA hydrogel films.

2.1. Preparation of Hyaluronic Acid Hydrogels

The preparation of hydrogel was carried out according to [8,9] using various PT concentrations. HA-based hydrogels were formulated with 5% w/w concentration of HA and (20%, 25%, 40%, 50%, 75%, 100%) w/w of PT in HA corresponding to (1%, 1.25%, 2%, 2.55%, 3.825%, 5% w/w) of PT in the whole film, respectively (Table 1). The hydrogels were prepared by dispersing HA in deionized distilled water; the mixture was stirred with an IKA stirrer (IKA® Werke GmbH. & Co. KG, Staufen, Germany) for 24 h to obtain homogeneously mixed HA hydrogels. This was followed by adjusting the pH to alkaline (11–12) using a pH meter from Hanna Instruments (a wireless pH tester for cosmetic creams). Then, PT was added, and the mixture was subsequently stirred slowly for 24 h to obtain completely homogenized HA-PT hydrogels. The hydrogel was left to stand for 48 h to release air bubbles before casting in Petri dishes. The cast hydrogel samples in Petri dishes were air-dried at room temperature for 4–5 days to form the films (xerogel films). Crosslinking reaction (oven-assisted thermal crosslinking) of the HA-PT xerogel films was performed using an 80 °C oven (Binder GmbH Bergster, 14 D-78532 Tuttlingen) for 24 h.

2.2. Instruments Used for Analysis

2.2.1. Freeze Dryer

The washed hydrogel films were placed in a freezer where they were freeze-dried using ALPHA 2-4/LSC device (Martin Christ Gefriertrocknungsanlagen GmbH, Osterode am Harz, Germany) under vacuum of 0.1 Pa at −70 °C for 24 h to thoroughly remove the water. The resulting hydrogel films were used for the extraction of residual PT.

2.2.2. Scanning Electron Microscopy (SEM)

To investigate and evaluate the PT leaching out from the hydrogel films and the morphology of hydrogel samples that were used to extract the residual PT, scanning electron microscope (Hitachi, Tokyo, Japan) operated in high-vacuum mode at an accelerating voltage of 5 kV was used. Prior to freeze-drying, the swollen hydrogel samples after extraction were frozen in a −80 °C freezer and subsequently freeze-dried in an ALPHA 2-4/LSC device (Martin Christ Gefriertrocknungsanlagen GmbH, Osterode am Harz, Germany) under a vacuum of 0.1 Pa at −70 °C for 24 h to thoroughly remove the water. Due to HA’s hygroscopicity, the vials were filled with nitrogen gas to keep the films away from moisture. The freeze-dried hydrogel samples were put into liquid nitrogen for few minutes, fractured with a razor blade to expose the internal structures, and stuck onto the sample holder. All samples were sputter-coated with gold and palladium using Agar sputter coater (AGAR-Scientific, Ltd., Stansted, UK) for 60 s before observation.

2.2.3. 1HNMR Spectroscopy

Prior to the NMR analysis, triplicate (n = 3) weighing approximately 0.0100 gm of dry hydrogel films from each batch were washed for 24 h by immersing them in distilled water to wash out the unreacted (uncross-linked) HA, then they were freeze-dried, later the freeze-dried hydrogel films were individually put in glass vials and extracted with 1 mL deuterated chloroform containing 0.05 M (tetramethyl silane), TMS internal standard, for 24 h at room temperature. The vials were tightly closed and left in the shaking water bath (80 rpm, temperature 25 °C) for the 24 h extraction. An amount of 0.6 mL from the resulting solution was placed in NMR tubes for analysis.
The residual PT in the extracted solutions was analyzed using Bruker AVANCE III NMR spectrometer (Bruker, Rheinstetten, Germany), at 500.13 MHz spinning frequency at temperature 300 K by using a 5 mm BBI probe and equipped with a z-gradient coil. The 1HNMR spectra were acquired using either (1) ZG90 pulse program with a calibrated 90° pulse with a 10 s relaxation delay (d1), 128 number of scans (NS), or (2) a ZG30 pulse program (pre-programmed, Bruker), (NS = 1024), (d1 = 1 s). In each case, 65 K data points were recorded within 10,000 Hz spectral window (SWH). For ZG90, the d1 delay was calculated as 7 T1, where T1 was the longest relaxation time. An exponential line broadening of 0.05 Hz was applied to the raw data prior to Fourier transformation.

2.2.4. Gas Chromatography Analysis

PT residual analysis for the extracted film solutions was performed using an Agilent Technologies 7890A Gas Chromatograph (Agilent Technologies, Santa Clara, CA, USA). Chromatographic separation was carried out on a fused-silica capillary column (30 m × 0.32 mm × 0.25 mm) coated with 5% phenyl methyl polysiloxane. The injector was in splitless mode, and its temperature was maintained at 300 °C during the separation, while the column temperature ranged from 50 °C (hold time = 1 min) to 280 °C (hold time = 4 min) at a rate of 30 °C/min. The carrier gas (helium) flow rate was 2 mL/min.
During the study, all the samples were represented in (m/m%) by converting all the concentrations from w/v to m/m% using Equation (1) [30].
%   of   solute   ( m / m % ) = a m o u n t   o f   s o l u t e   ( g m ) a m o u n t   o f   s o l u t i o n   ( g m ) × 100
where amount of solute (PT) is the extracted PT amount from the samples in (gm), while the amount of the solution was the extraction solvent taking in account the density of the solvent, i.e., either chloroform (1.5 gm/mL) or DCM (1.33 gm/mL).

Internal Standard Solution

Hexylacrylate (HexA) was used as an internal standard. The purpose of the internal solution was to recover the analyte loss during sample preparation and instrumental analysis [17]. An amount of 25 mg of HexA was weighed and diluted with 50 mL of chloroform, then 1 mL of the resulting solution was diluted with 10 mL chloroform to final concentration of 50 μg/mL. The internal solution’s peak area of 50 μg/mL was around the middle point of the calibration curve. The HexA internal standard solution was then included in all standards for calibration curve standards with internal solutions and sample solutions.

Standard Solution and Calibration Curve

PT stock solution was prepared by dissolving 25 mg in 50 mL of chloroform to a final concentration of 500 μg/mL. Ten standard solutions with PT concentrations 250, 125, 62.5, 31.25, 7.81, 3.90, 1.95, 0.97, and 0.48 μg/mL were prepared. The respective % concentrations (0.0166%, 0.00833%, 0.00416%, 0.0020%, 0.0010%, 0.00052%, 0.00026%, 0.00013%, 0.000065%, and 0.000032% (m/m)) were prepared by pipetting volumes of stock solution into 2 mL disposable vials, to ensure homogenous mixing, then mixed in the overhead shaker. This was followed by taking 400 μL from each to a GC vial along with 100 μL of (HexA) internal standard solution. Each standard solution was measured in triplicate. From the obtained data, a calibration curve was obtained by plotting the peak area of PT to the peak area of HexA.

Sample Preparation

From each batch, 3 replicates (n = 3) of dry HA hydrogel films approximately weighing 0.01 gm were washed (swollen) by immersing them in distilled water for 24 h at room temperature to remove the uncross-linked polymer. The swollen hydrogel films were then either subjected to the extraction process or were freeze-dried for 24 h before being subjected to the extraction process, in order to investigate the extraction mechanism of residual PT from the films The extraction process was as follows: the hydrogel films were individually put in glass vials and extracted with 1 mL chloroform for 24 h at room temperature. The vials were tightly closed and left in the shaking water bath (80 rpm, temperature 25 °C) for the 24 h extraction. An amount of 75 μL of the internal solution was added to extracted solutions, while the samples that were run without internal solution, were injected directly into the GC after putting them in GC vials. The samples were run 3 times with external calibration curve and 3 times with the internal calibration curve.

3. Results and Discussion
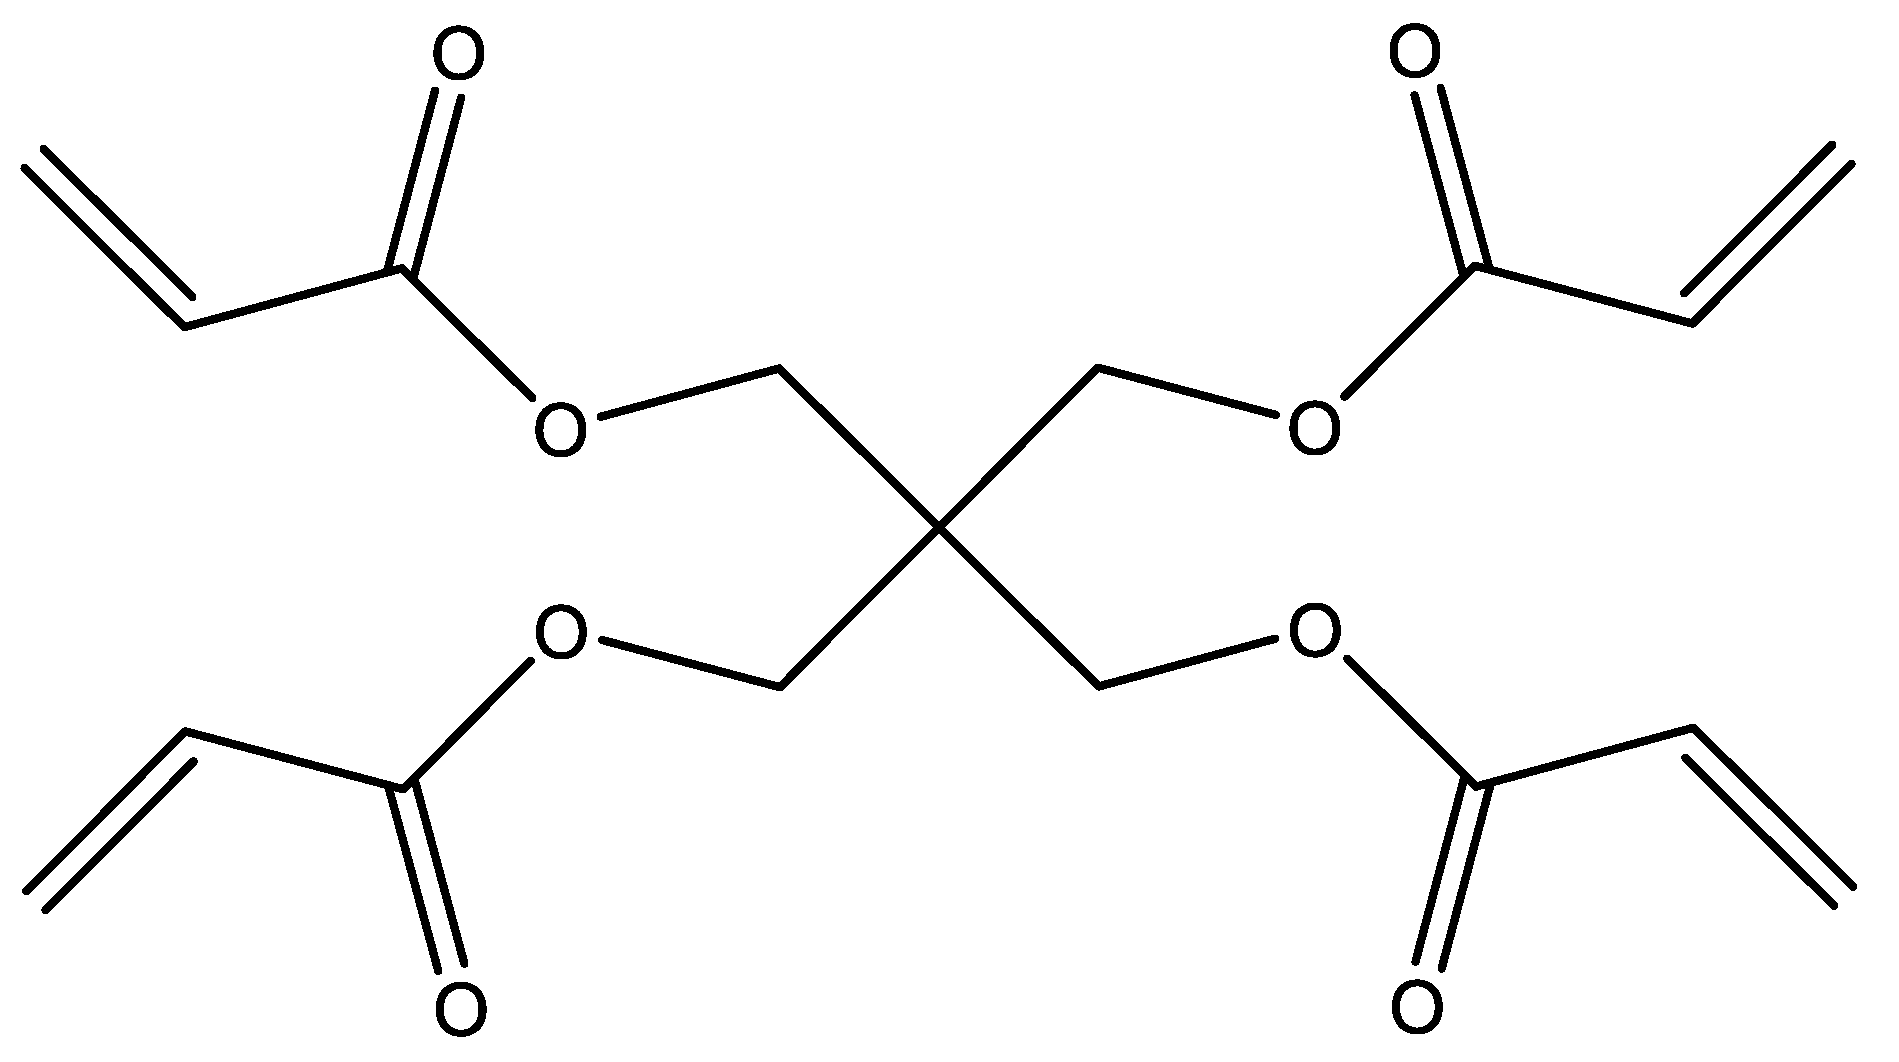
3.1. PT Description

PT (Figure 1) is a tetraacrylate monomer, mainly used as a crosslinker in different formulations requiring polymerization [9]. Its physicochemical properties describe it as a viscous colorless liquid, with a density of 1.19 gm/mL. In addition, it is immiscible with water [31].
PT has been classified as a skin sensitizer by (GHS) [17]. It was found that the patches that were made from Peta (pentaerythritol tri-acrylate) caused serious skin sensitizing in human and guinea pig skin [32]. According to Wong et al., the maximum acceptance of Peta was 0.01% (m/v), however, it was reported that PT is a lesser skin sensitizer than Peta [25].
Wong et al. reported that the maximum acceptable residual PT concentration for their hydrogel film was 0.0126% (m/m) based on the polymer they used to make their hydrogel (polyethylene oxide). Therefore, the maximum acceptable residual PT as crosslinker concentration after recalculating using the density of our polymer (hyaluronic acid; 1.80 g/mL) was found to be 0.008% (m/m).
The mass of PT was identified by using GC-MS spectra and it was similar to the mass spectra in the literature [17,33]. The mass spectra are featured in Figure 2. They demonstrate that the HexA was suitable as an internal standard solution due to its similar mass spectra to PT as it is an acrylate, but its peak does not interfere with PT peaks.

3.2. Freeze-Drying of the Extracted Samples

Because the hyaluronic acid hydrogel films are not swellable in any solvent except water, while the PT dissolves only in organic solvents such as chloroform, acetone, and DCM, we decided to extract in chloroform [34]. For this reason, we also included freeze-drying for the hydrogel films prior to extraction.
Freeze-drying of the extracted hydrogel samples prior to the extraction procedure was included in this study to investigate the effect of freeze-drying on the extracted amount of residual PT from the samples. The extracted hydrogel samples (weighing 100 mg with the same concentration of PT) were divided into two groups, one group of samples was swollen by immersion in distilled water for 24 h and freeze-dried prior to the extraction, while the other group of samples was only swollen for 24 h with distilled water without subsequent freeze-drying. Table 2 presents the samples M25 (1, 2, 3) that were not freeze-dried and the results showed extraction of 0.0003% m/m compared to the freeze-dried samples where the PT amount extracted was 0.0032% m/m. This tenfold difference in extracted PT monomer was attributed to the effect of freeze-drying on the swelled hydrogel films prior to the extraction procedure; a sublimation of water from the films’ pores while retaining its expanded structure, allowed the chloroform to then easily diffuse in the film’s core via the empty pores (even though the film is not swellable in chloroform) resulting in the dissolution and extraction of all residual PT in chloroform. This was also evidenced by the SEM images which show the changes in the hydrogel structure caused by the freeze-drying, and the difference between blank (untreated) and freeze-dried samples prior to the PT extraction process.

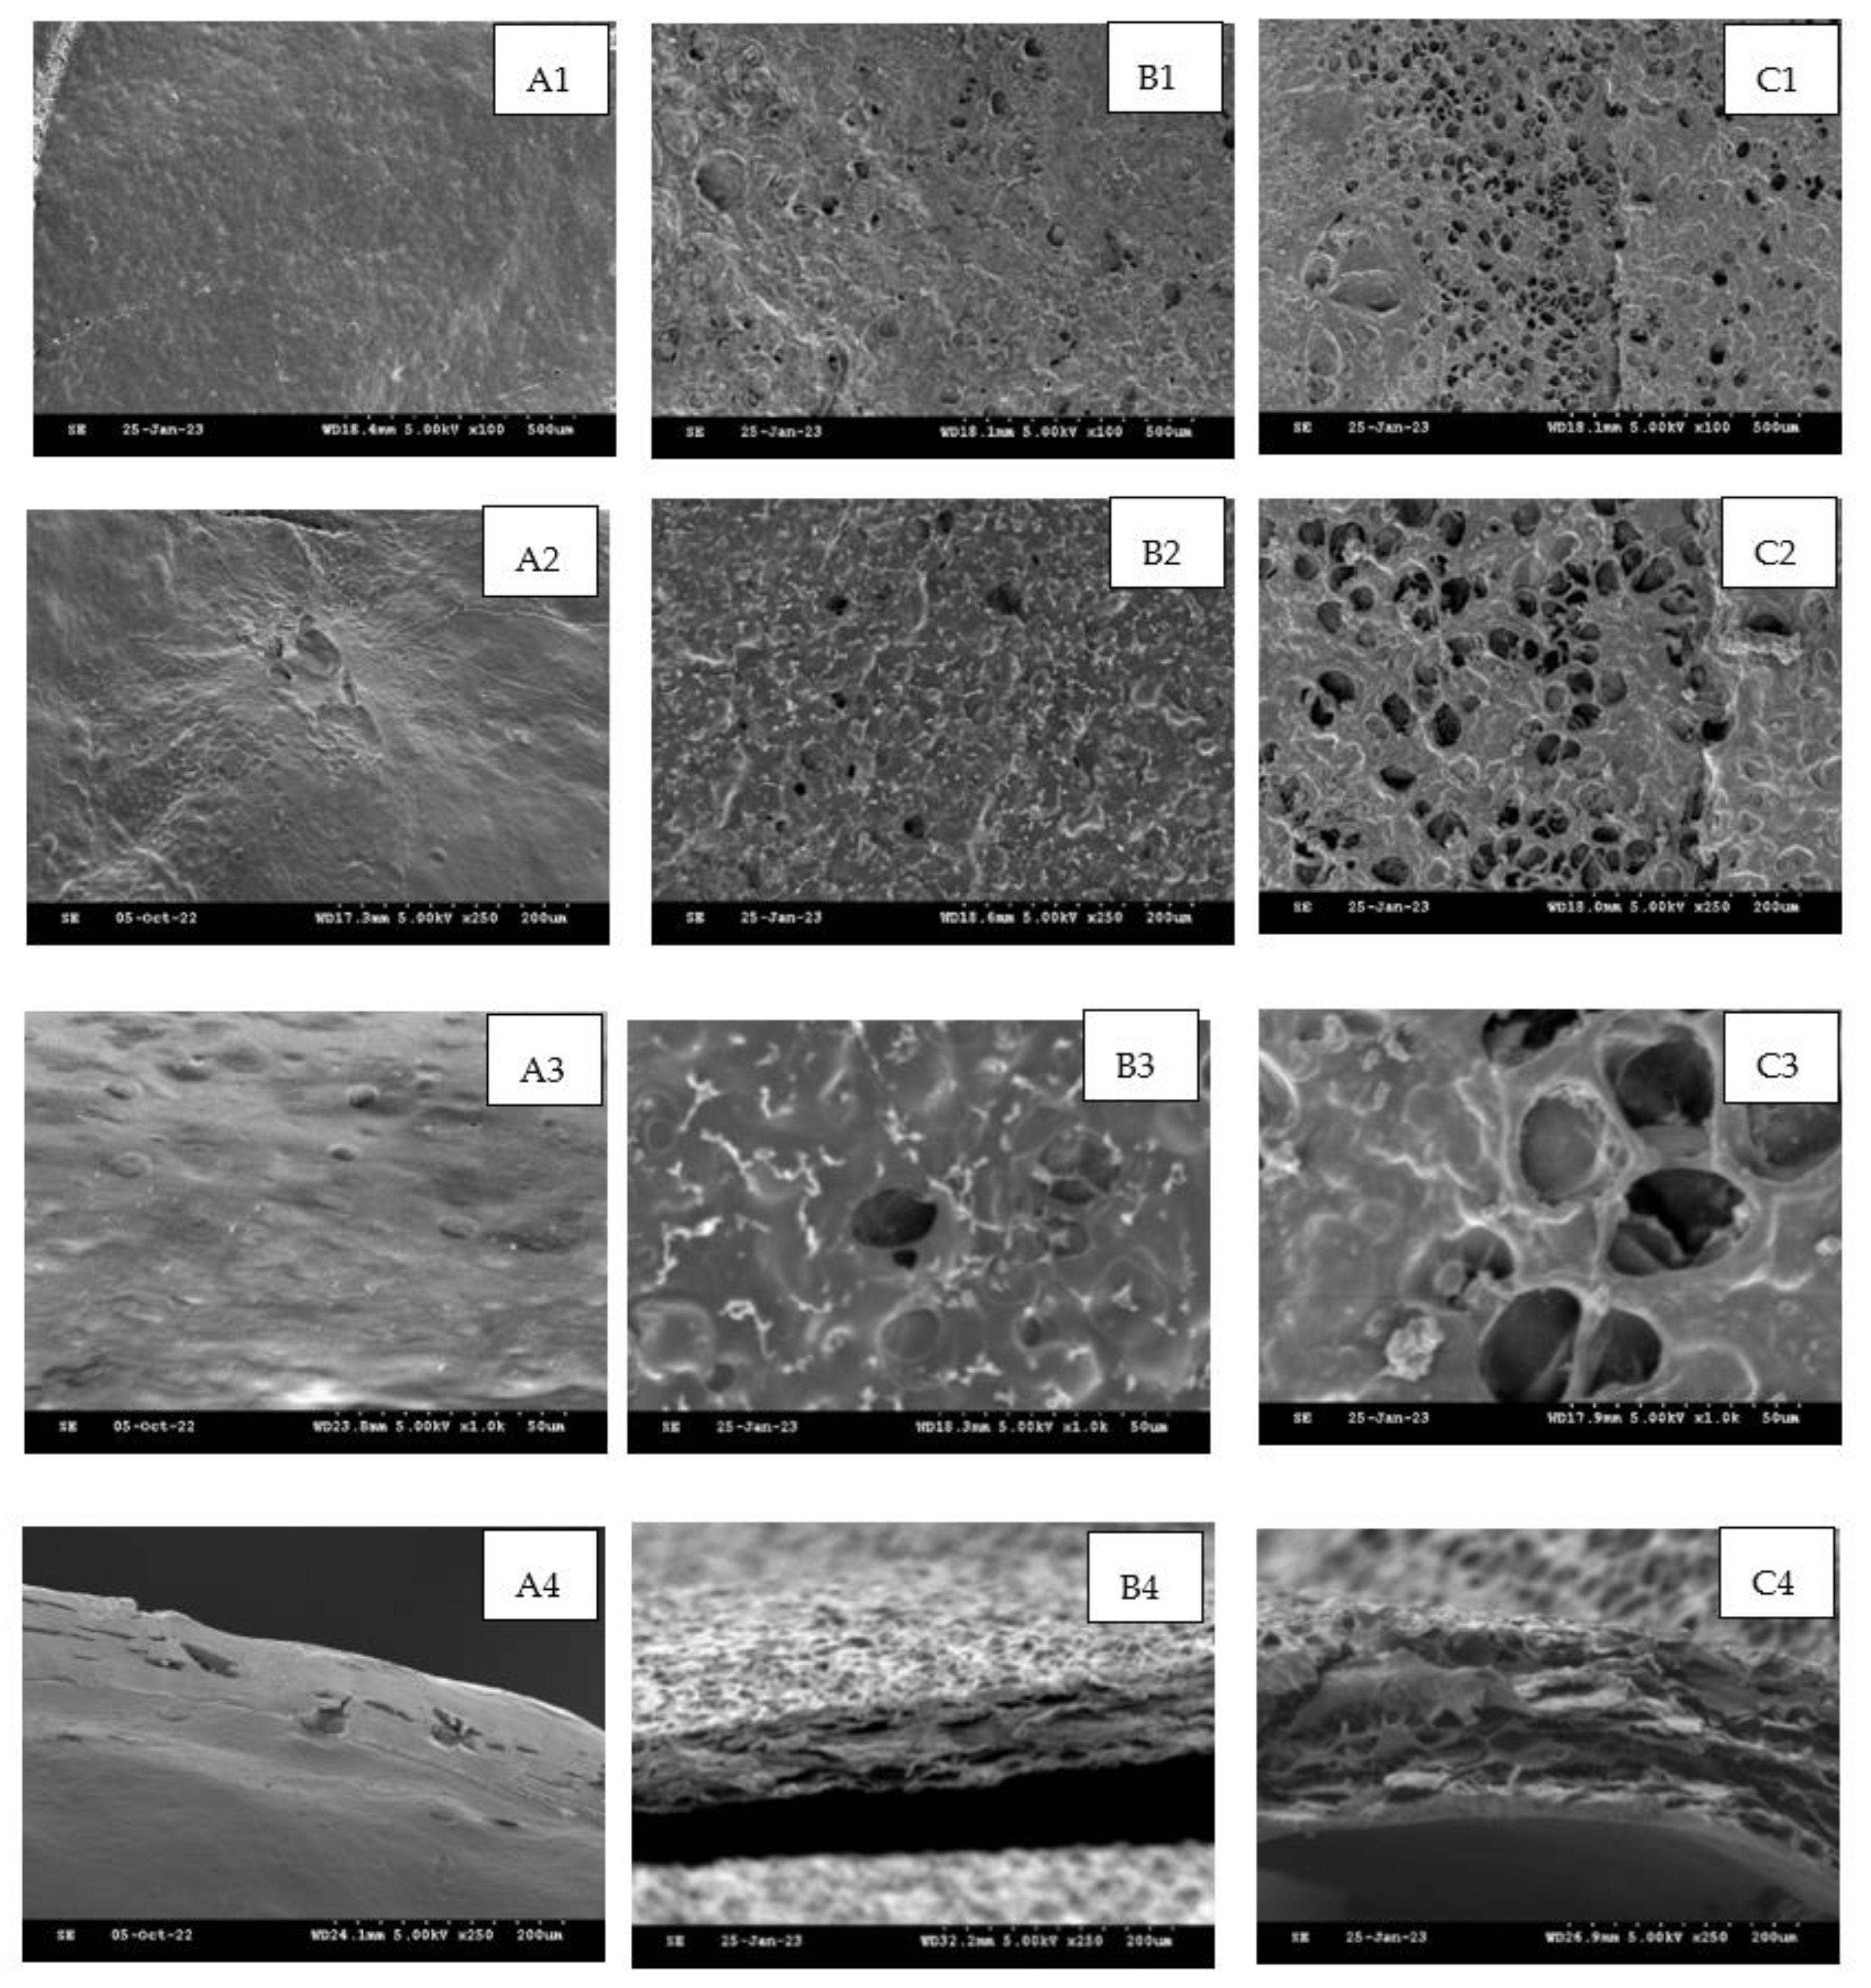
3.3. SEM Scanning Electron Microscope

As we mentioned before, hyaluronic acid hydrogel films are not swellable in any solvent except for water, while the PT dissolves only in organic solvents such as chloroform, acetone, and DCM, we decided to extract in chloroform [34]. However, DCM was also used to extract a few samples in order to evaluate the extraction efficacy in both these organic solvents and to compare the results.
The morphology of the extracted hydrogel films was investigated with SEM [35]. Figure 3 shows the surface of blank untreated hydrogel films. It was obvious that the morphological appearance of the extracted hydrogel films showed holes, which confirmed the hypothesis that the PT leached out from the film.

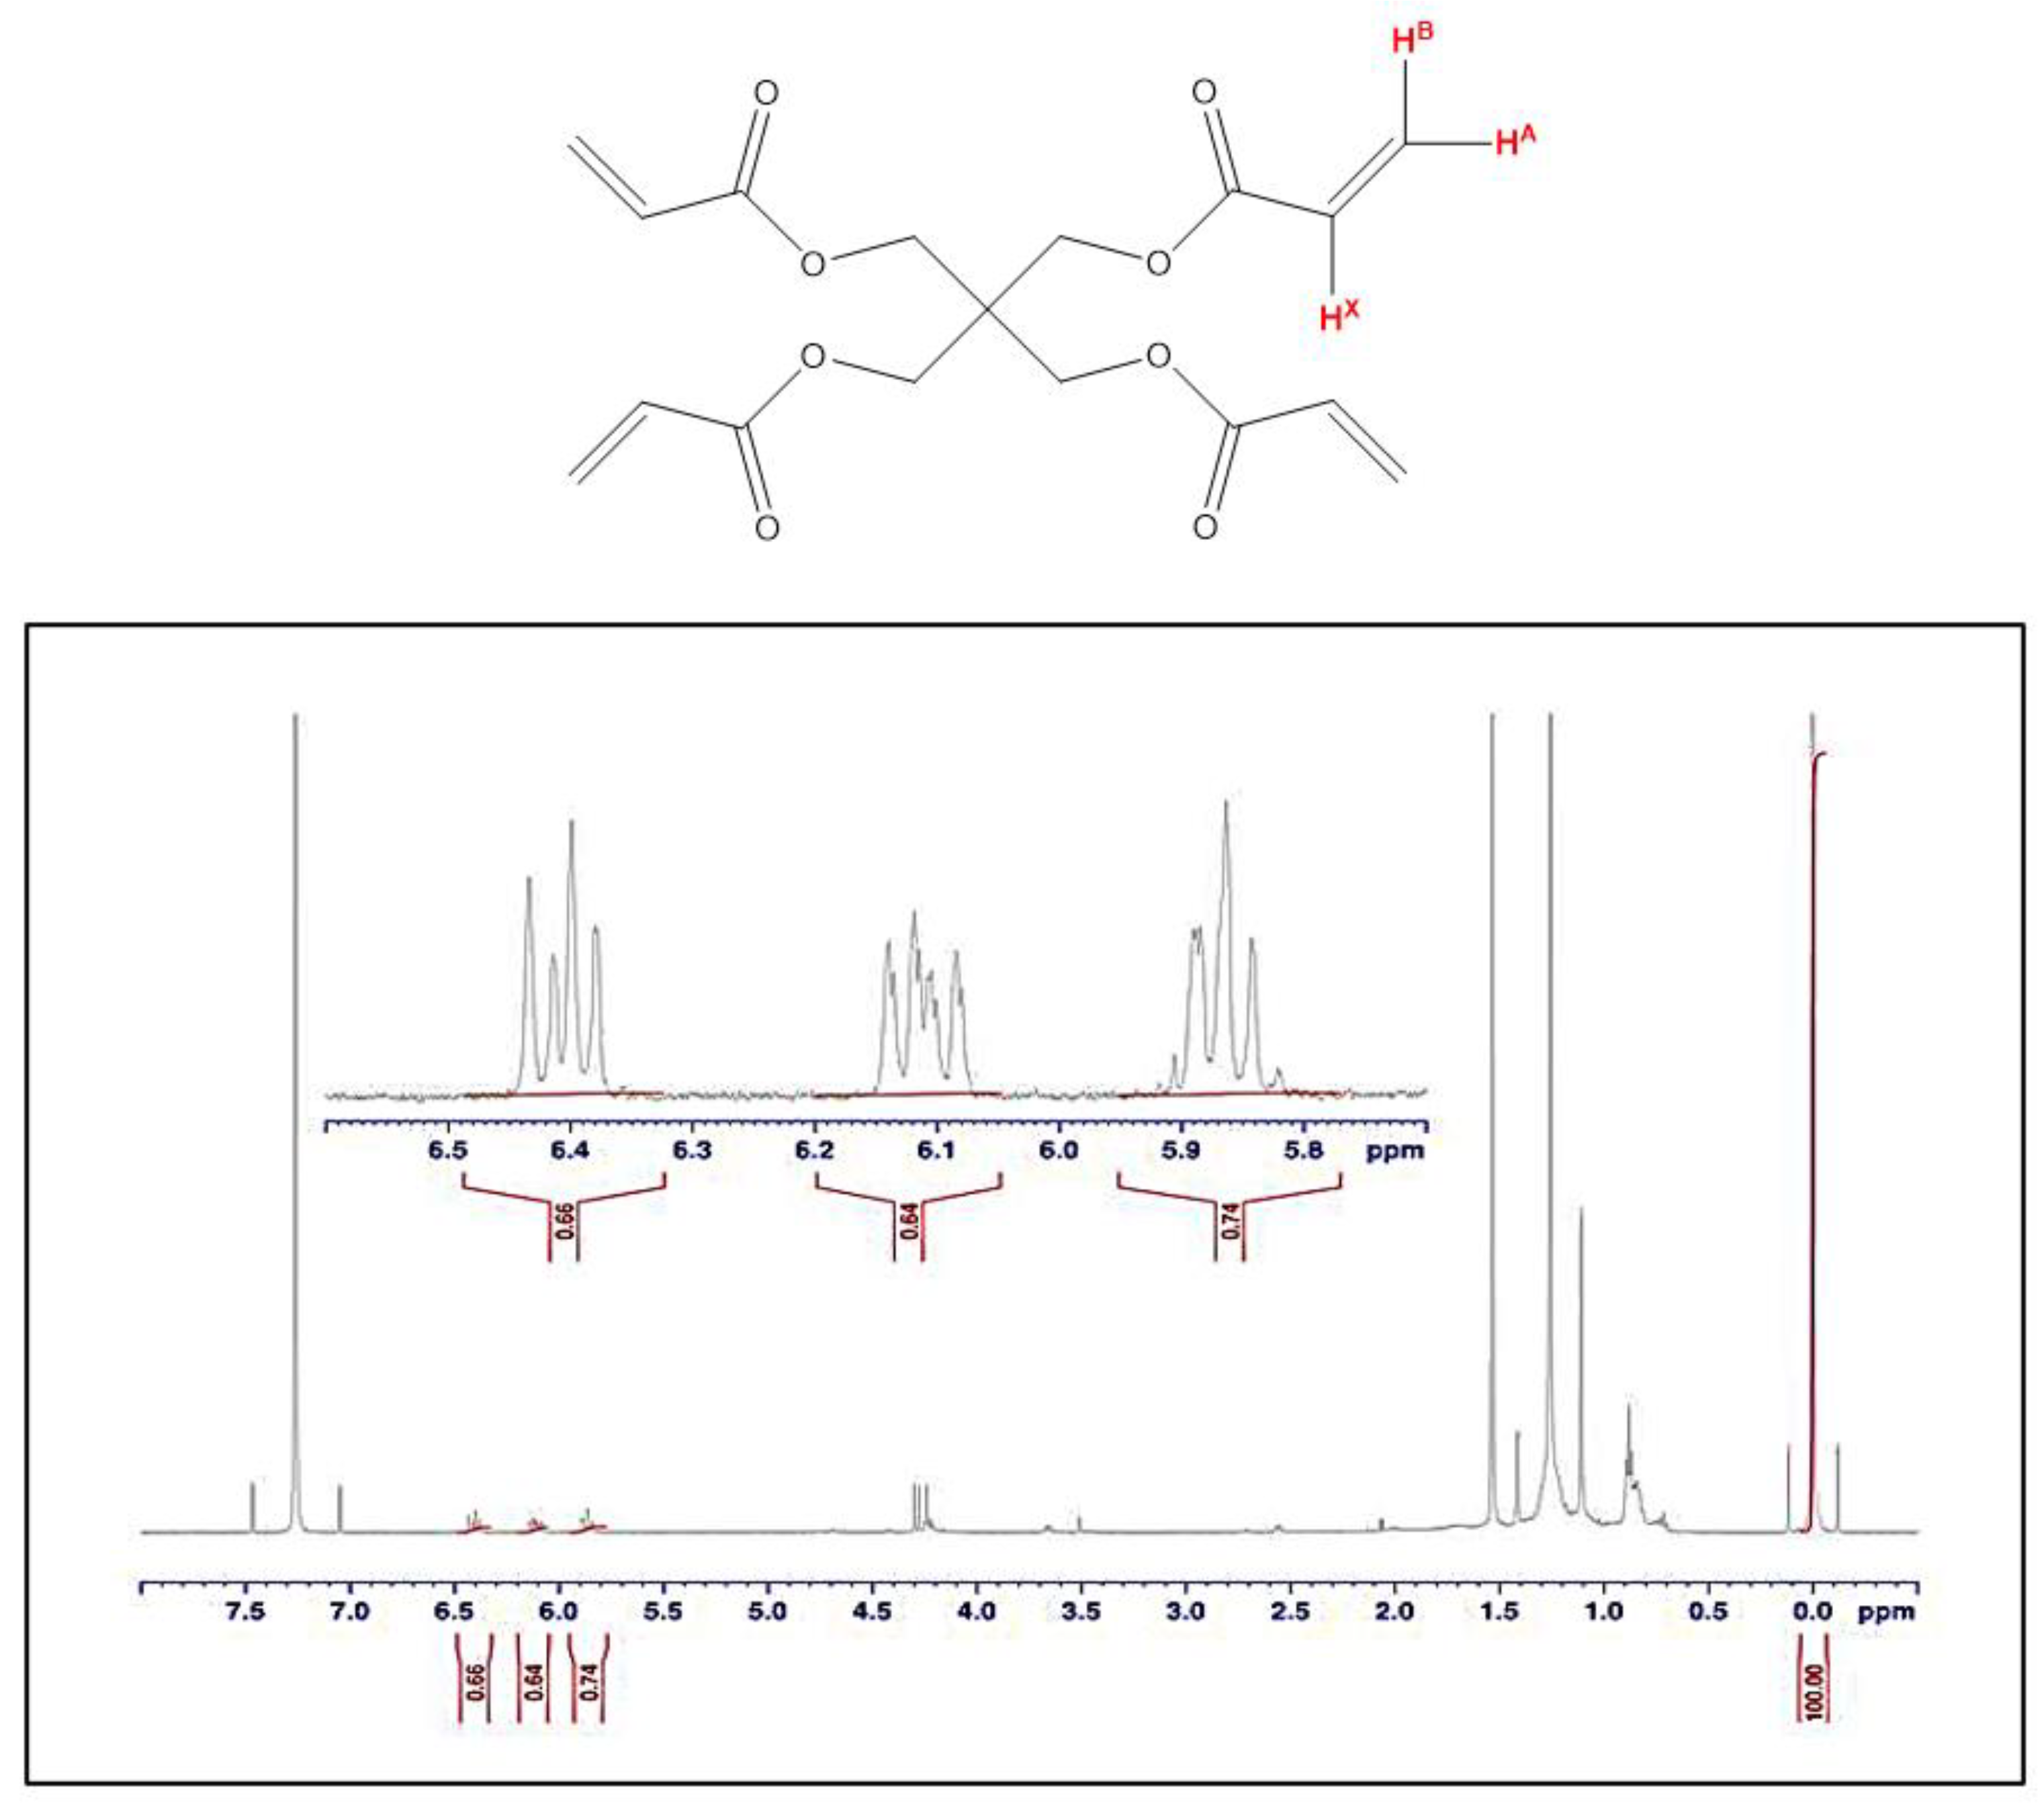
3.4. NMR Method Analysis

The 1HNMR spectra (Figure 4) showed well-resolved signals at 5.85, 6.1, and 6.4 ppm, corresponding to the geminal and vinyl protons of the PETRA molecule, as confirmed by COSY and HMQC experiments. The integrals were manually drawn from the baseline and calibrated to the TMS integral in each sample (TopSpin 3.6, Bruker). The ZG30 pulse with an increased scan number of 1024 showed provided better signal-to-noise over an equivalent experimental time when compared with the ZG90 sequence. The integral ratios and %RSD from the ZG90 and ZG30 were compared, demonstrating that the two methods provided concordant results.
Quantitation was performed by comparing the ratio of the three integrated signals in a standard of PT (1 mg/mL) to those in the extracted samples, and in each case after normalizing on the TMS peak by calibrating that integral to 100.
The obtained results of PT residual analysis were tabulated with the GC results to compare both together.

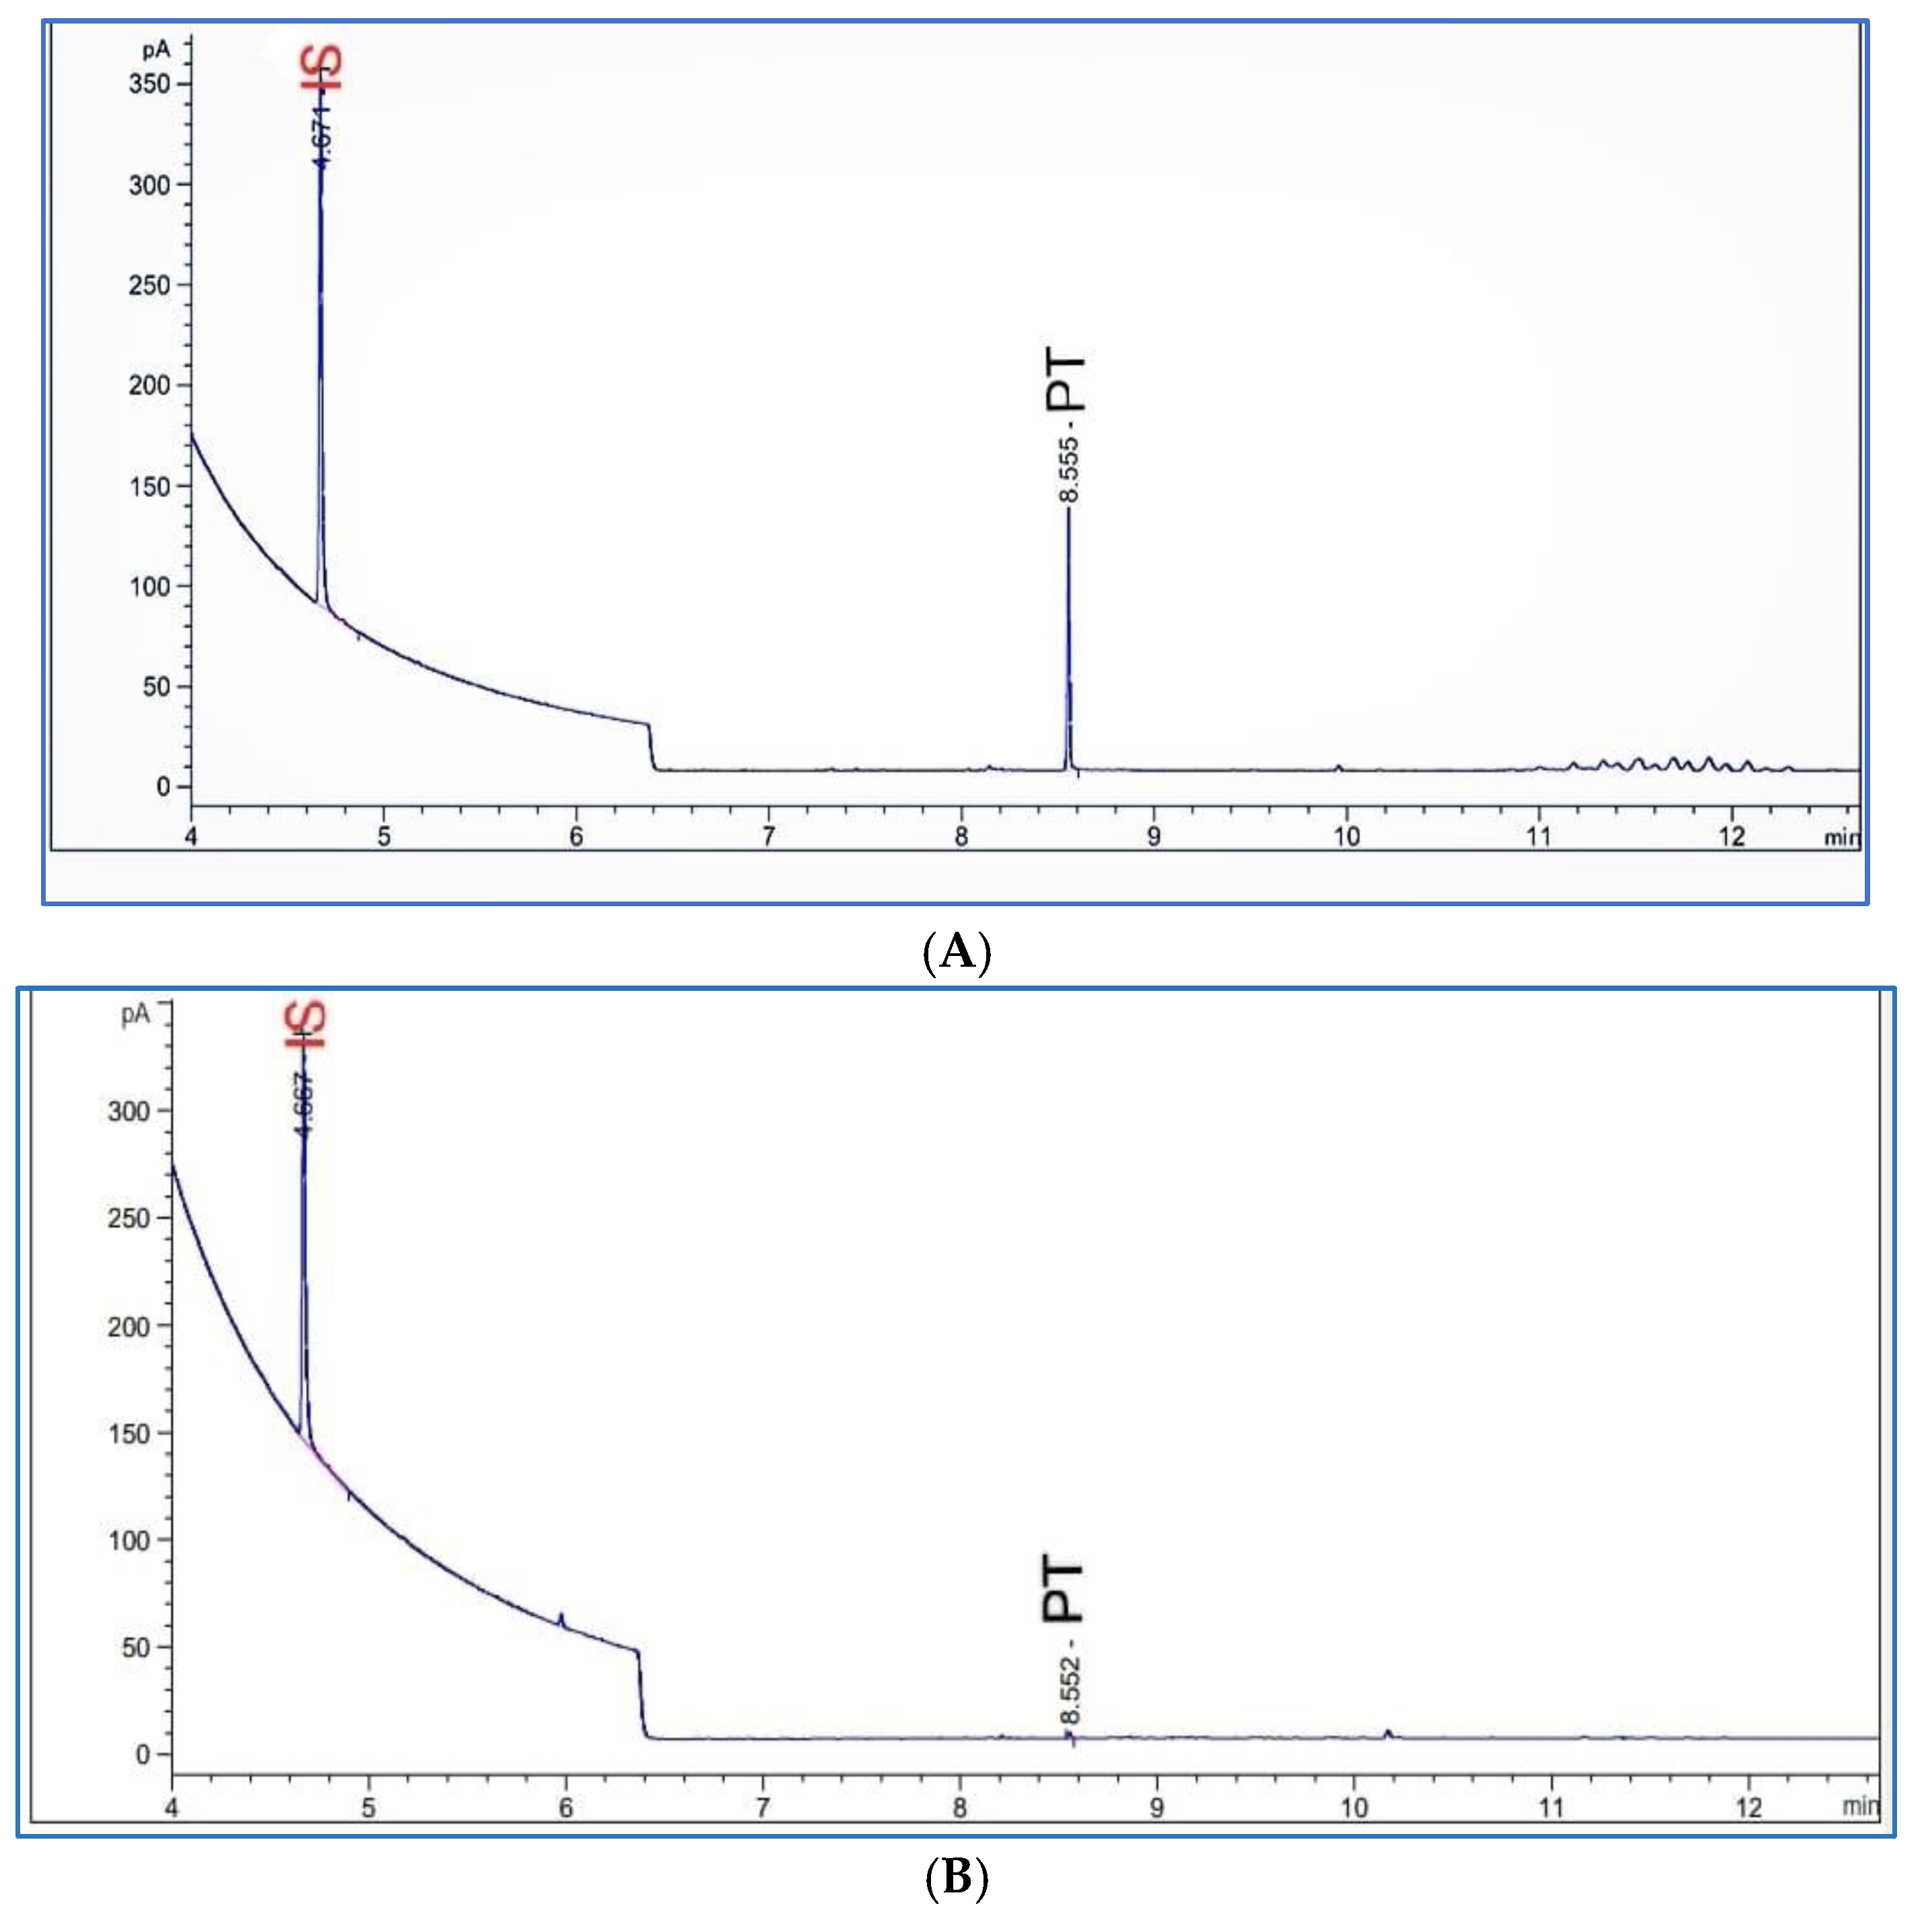
3.5. Gas Chromatography Method

GC analysis for the detection of residual PT in the HA hydrogel films was used and Figure 5 shows our chromatograms. In addition, the validity of the method has been explained in detail. The sample extraction method with the GC method was adapted from [17]. Due to the hyaluronic acid hydrogel does not swell in any solvent except water, while the PT is immiscible with water [31], it was difficult to find a solvent that suit both together, therefore the freeze-drying was introduced to the hydrogel films. It was found that the freeze-drying process to the films before introducing them to the extraction was giving an expansion in the size of the hydrogel films which suggested the solvent could be able to easily diffuse through the film and help to leach out the residual PT in the extracted medium (solvent) even though the hydrogel film does not swell in the solvent. This was also proven with the SEM.
Chloroform was a suitable volatile solvent to dissolve the PT and the internal standard HexA [36]. However, DCM has been used to extract a few samples to evaluate the extraction in both the organic solvents and compare the results obtained from both solvents.

3.5.1. Response Linearity

A good linear relationship between peak area ratio of PT to HexA (IS) vs. the corresponding concentration, was obtained from the ten standards ranging from (0.0166–0.000032%) m/m which was clarified in Section 2.2.4. The calibration curve obtained from the mean of three injections of each extracted sample solution with regression coefficient (R2 > 0.998) was used to calculate LOD and LOQ [37]. In addition, the obtained calibration curve concentration range covered the lowest to the highest limit of residual PT.

3.5.2. Precision

The precision of the applied method was determined by the relative standard deviation (RSD) of the PT peak area ratio in repeated samples. Six injections of the system suitability were employed on the same day as intra-day precision and on three different days as inter-day precision. Table 3 shows the RSD for intra-day precision and inter-day precision were (1.78–2.52%), respectively. The obtained RSD values did not exceed the accepted limit of 15% [38] which proved that the method is precise and reproducible.

3.5.3. Accuracy

The accuracy of the GC method for the detection of extracted residual PT was determined by preparing three spiked samples (n = 3) with the same weight from three different PT concentrations. The amount of PT calculated in the blank samples (0.009%m/m) was used as a reference.
The percentage of the accuracy recoveries was calculated using Equation (2) [17].
%   of   Accuracy   recovery = C r e c o v e r d C s p i k e d + C b l a n k × 100
where the Crecovered is the PT concentration detected in the spiked samples (%m/m), Cspiked was the PT concentration added to the spiked samples (0.004, 0.006, 0.009) %m/m, while the C blank was the PT concentration determined in the blank samples (%m/m).
The accuracy results were presented in Table 4 suggesting a good correlation between the obtained results and the method’s suitability for quantifying PT’s residual concentration in the HA hydrogel films. The %recovery was (101.73)% on average and the relative standard deviation (RSD%) was 1.69%; both these values were within the limit of (80–120)% recovery, and (±15)% RSD, respectively [17].
Therefore, the GC method was confirmed to be a reliable, efficient, and simple method for acrylate analysis. Acrylate analysis is useful also in denture base resins as well as in hydrogels [17,37].

3.5.4. Sensitivity

For method validation, the limit of detection is an important figure of accuracy in analytical chemistry which is defined as the lowest amount of analyte that can be detected but not necessarily quantified under the stated experimental analysis [38]. However, the limit of detection (LOD) and limit of quantitation (LOQ) could be evaluated based on the signal-to-noise ratio (S/N) [17,39]. The accepted LOD from the S/N value is >3 [40]. While the LOQ obtained from the sharp peak confirm the lowest concentration, which resolves >10% of the baseline [41].
The method quantification’s sensitivity has been evaluated with LOD and LOQ values. Table 5 illustrates the PT concentrations corresponding to the LOD value (0.000032%m/m), and the LOQ value (0.00013%m/m). Based on these low LOD and values, it was evident that the method was highly sensitive.

3.5.5. Robustness

To ensure the method’s reliability, it is important to conduct a robustness study of the analytical procedures. Especially, being an essential part of a comprehensive quality assurance system in GC analysis studies [42]. Different parameters were included in the robustness study. They were oven temperature (±5), changes in detector temperature (±5), and flow rate (±10%). Three different PT concentrations samples were measured in triplicate as shown in Table 6.
The results demonstrated that the peak area ratio for all the extracted samples in three PT concentrations was reproducible with %RSD = 1.59. Since the relative standard deviation (RSD) value for cumulative samples concentration should not exceed 15% [17] it is confirmed that the method in our study was suitable and robust.

3.5.6. Sample Extraction in Dichloromethane (DCM)

To evaluate the accuracy of the results based on the type of solvent, a few samples were extracted in DCM, and the results were compared with the results from chloroform extraction. Table 7 proves that chloroform was suitable for the PT extraction in our study.
From the results, it was obvious the M25 samples had less residual PT detected in DCM than in chloroform in two samples, while for M50 samples the PT detected was similar. Overall, both solvents could be usable and effective for residual PT analysis with GC. Additionally, PT dissolves in both solvents (chloroform, dichloromethane) [17,34].
Furthermore, a few samples were extracted for the second time by immersing the extracted films in fresh chloroform to find out if there was further trapped PT leaching from the films. The obtained values were either negative or undetectable suggesting that 24 h was sufficient for the extraction of residual PT crosslinker.
Lastly, Table 8 illustrated that the chosen analytical methods were in agreement and can be used reliably for the detection of residual PT in the crosslinked hyaluronic acid hydrogel films. According to these results, the maximum amount of PT that can be used safely was determined to be 2.55% w/w (films M50).

4. Conclusions

Tetraacrylates are strong skin irritants and sensitizers, therefore it is important to quantify the levels of residual acrylate monomers in the formulation and these levels must be within the accepted value to be safe. Considering our novel hyaluronic acid (HA) hydrogel films were formulated using pentaerythritol tetraacrylate (PT) as the crosslinker, which is a tetraacrylate, we carried out a study to analyze the residual PT in these hydrogel films. The results from both GC and NMR analysis were close and reliable for residual acrylate analysis. The M100 hydrogel films presented unacceptably high levels of residual PT whereas the M75 films were within the acceptable range via GC but with the NMR method analysis they were above the acceptable limit. In addition, SEM was conducted to investigate the morphological and structural changes during the leaching process of residual PT monomer from the films. We discovered that the amount of residual PT monomer detected and extracted from the freeze-dried samples was higher than from the samples that were only washed/swollen with water; indicating that the freeze-drying step was essential to enable the complete extraction of all residual PT from the hydrogel films. Therefore, in this study we elucidated the mechanism of residual PT monomer extraction from the films, and we established an extraction protocol of residual crosslinker monomer from the films, consisting of the following three steps: (i) swelling of the xerogels in water in order to wash off residual uncross-linked HA and other water soluble impurities, and to expand the hydrogel structure; (ii) freeze-drying of the swollen hydrogel film to remove all water whilst retaining the swollen structure; (iii) immersion of the freeze-dried hydrogel in the extraction solvent. Our study concluded that hydrogel films M20–M50 (formulated using 1–2.55% w/w PT) contained residual PT monomers below 0.008% m/m; therefore, they are safe for dermatological and cosmetic applications.

Author Contributions

F.R. was supervised by K.D.; K.D. conceptualized the work; experiments designed by K.D., S.C. and F.R.; F.R. performed the experiments; validation and evaluation by K.D., S.C. and F.R.; writing and drafting F.R.; investigating and plotting, F.R.; final reviewing, K.D. All authors have read and agreed to the published version of the manuscript.

Funding

This research received no external funding.

Institutional Review Board Statement

Not applicable.

Informed Consent Statement

Not applicable.

Data Availability Statement

Data are contained within the article.

Acknowledgments

We would like to thank Infinity Ingredients for their donation of the hyaluronic acid sodium salt.

Conflicts of Interest

The authors declare no conflict of interest.

References

  1. Brandt, F.S.; Cazzaniga, A.; Hann, M. Cosmeceuticals: Current Trends and Market Analysis. Semin. Cutan. Med. Surg. 2011, 30, 141–143. [Google Scholar] [CrossRef] [PubMed]
  2. Barel, A.O.; Paye, M.; Maibach, H.I. Handbook of Cosmetic Science and Technology; CRC Press: Boca Raton, FL, USA, 2014. [Google Scholar] [CrossRef]
  3. Kiki, M.J. Biopigments of Microbial Origin and Their Application in the Cosmetic Industry. Cosmetics 2023, 10, 47. [Google Scholar] [CrossRef]
  4. Rodrigues, R.; Alves, R.C.; Oliveira, M.B.P.P. Exploring Olive Pomace for Skincare Applications: A Review. Cosmetics 2023, 10, 35. [Google Scholar] [CrossRef]
  5. Dayan, N. Skin Aging Handbook: An Integrated Approach to Biochemistry and Product Development, 3rd ed.; William Andrew: Norwich, NY, USA, 2008. [Google Scholar]
  6. Semenzato, A.; Costantini, A.; Meloni, M.; Maramaldi, G.; Meneghin, M.; Baratto, G. Formulating O/W Emulsions with Plant-Based Actives: A Stability Challenge for an Effective Product. Cosmetics 2018, 5, 59. [Google Scholar] [CrossRef] [Green Version]
  7. Chanchal, D.; Swarnlata, S. Novel Approaches in Herbal Cosmetics. J. Cosmet. Dermatol. 2008, 7, 89–95. [Google Scholar] [CrossRef]
  8. Rashid, F.; Albayati, M.; Dodou, K. Studies on Novel Methods for Formulating Novel Cross-Linked Hydrogel Films of Hyaluronic Acid. Cosmetics 2019, 6, 59. [Google Scholar] [CrossRef] [Green Version]
  9. Rashid, F.; Albayati, M.; Dodou, K. Novel Crosslinked HA Hydrogel Films for the Immediate Release of Active Ingredients. Cosmetics 2022, 10, 6. [Google Scholar] [CrossRef]
  10. Wende, F.J.; Gohil, S.; Mojarradi, H.; Gerfaud, T.; Nord, L.I.; Karlsson, A.; Boiteau, J.-G.; Kenne, A.H.; Sandström, C. Determination of Substitution Positions in Hyaluronic Acid Hydrogels Using NMR and MS Based Methods. Carbohydr. Polym. 2016, 136, 1348–1357. [Google Scholar] [CrossRef] [Green Version]
  11. Al-Sibani, M.; Al-Harrasi, A.; Neubert, R.H.H. Characterization of Linear and Chemically Cross-Linked Hyaluronic Acid Using Various Analytical Techniques Including FTIR, ESI-MS, H1 NMR, and SEM. J. Biochem. Anal. Stud. 2018, 3, 1–8. [Google Scholar] [CrossRef]
  12. Ström, A.; Larsson, A.; Okay, O. Preparation and Physical Properties of Hyaluronic Acid-Based Cryogels. J. Appl. Polym. Sci. 2015, 132, 1–11. [Google Scholar] [CrossRef]
  13. Olejnik, A. Significance of Hyaluronic Acid in Cosmetic Industry and Aesthetic Medicine. Chemik 2012, 66, 129–135. [Google Scholar]
  14. Lewandowska, K.; Sionkowska, A.; Grabska, S.; Michalska, M. Characterisation of Chitosan/Hyaluronic Acid Blend Films Modified by Collagen. Prog. Chem. Appl. Chitin Its Deriv. 2017, XXII, 125–134. [Google Scholar] [CrossRef] [Green Version]
  15. Bukhari, S.N.A.; Roswandi, N.L.; Waqas, M.; Habib, H.; Hussain, F.; Khan, S.; Sohail, M.; Ramli, N.A.; Thu, H.E.; Hussain, Z. Hyaluronic Acid, a Promising Skin Rejuvenating Biomedicine: A Review of Recent Updates and Pre-Clinical and Clinical Investigations on Cosmetic and Nutricosmetic Effects. Int. J. Biol. Macromol. 2018, 120, 1682–1695. [Google Scholar] [CrossRef] [PubMed]
  16. Huang, G.; Huang, H. Application of Hyaluronic Acid as Carriers in Drug Delivery. Drug Deliv. 2018, 25, 766–772. [Google Scholar] [CrossRef]
  17. Wong, R.S.H.; Ashton, M.; Dodou, K. Analysis of Residual Crosslinking Agent Content in UV Cross-Linked Poly(Ethylene Oxide) Hydrogels for Dermatological Application by Gas Chromatography. J. Pharm. Anal. 2016, 6, 307–312. [Google Scholar] [CrossRef] [Green Version]
  18. Larrañeta, E.; Henry, M.; Irwin, N.J.; Trotter, J.; Perminova, A.A.; Donnelly, R.F. Synthesis and Characterization of Hyaluronic Acid Hydrogels Crosslinked Using a Solvent-Free Process for Potential Biomedical Applications. Carbohydr. Polym. 2018, 181, 1194–1205. [Google Scholar] [CrossRef] [Green Version]
  19. Zhang, H.; Wu, S.; Chen, W.; Hu, Y.; Geng, Z.; Su, J. Bone/Cartilage Targeted Hydrogel: Strategies and Applications. Bioact. Mater. 2023, 23, 156–169. [Google Scholar] [CrossRef]
  20. Das, P.; Ganguly, S.; Saravanan, A.; Margel, S.; Gedanken, A.; Srinivasan, S.; Rajabzadeh, A.R. Naturally Derived Carbon Dots in Situ Confined Self-Healing and Breathable Hydrogel Monolith for Anomalous Diffusion-Driven Phytomedicine Release. ACS Appl. Bio Mater. 2022, 5, 5617–5633. [Google Scholar] [CrossRef]
  21. Zhang, Q.; Liu, Y.; Yang, G.; Kong, H.; Guo, L.; Wei, G. Recent Advances in Protein Hydrogels: From Design, Structural and Functional Regulations to Healthcare Applications. Chem. Eng. J. 2023, 451, 138494. [Google Scholar] [CrossRef]
  22. Wong, R.; Ashton, M.; Dodou, K. Effect of Crosslinking Agent Concentration on the Properties of Unmedicated Hydrogels. Pharmaceutics 2015, 7, 305–319. [Google Scholar] [CrossRef] [Green Version]
  23. Song, J.; Chen, H. Preparation of Aroma Microcapsules with Sodium Alginate and Tetradecylallyldimethylammonium Bromide (TADAB) and Its Potential Applications in Cosmetics. Flavour Fragr. J. 2017, 33, 160–165. [Google Scholar] [CrossRef]
  24. Doytcheva, M. Ultraviolet-Induced Crosslinking of Solid Poly (Ethylene Oxide). J. Appl. Polym. Sci. 1997, 64, 2299–2307. [Google Scholar] [CrossRef]
  25. Björkner, B. The Sensitizing Capacity of Multifunctional Acrylates in the Guinea Pig. Contact Dermat. 1984, 11, 236–246. [Google Scholar] [CrossRef] [PubMed]
  26. Sadamori, S.; Shigeto, N.; Hamada, T.; Okuda, K. A Method of Determining Residual Monomer in Acrylic Resin Using Methyl Ethyl Ketone. Aust. Dent. J. 1990, 35, 509–513. [Google Scholar] [CrossRef] [PubMed]
  27. Grant, D.H.; McPhee, V.A. Determination of Methacrylic Acid by Coulometric Titration. Anal. Chem. 1976, 48, 1820. [Google Scholar] [CrossRef]
  28. Ayaz, E.A.; Durkan, R.; Koroglu, A.; Bagis, B. Comparative Effect of Different Polymerization Techniques on Residual Monomer and Hardness Properties of PMMA-Based Denture Resins. J. Appl. Biomater. Funct. Mater. 2014, 12, 228–233. [Google Scholar] [CrossRef]
  29. Pouyani, T.; Harbison, G.S.; Prestwich, G.D. Novel Hydrogels of Hyaluronic Acid: Synthesis, Surface Morphology, and Solid-State NMR. J. Am. Chem. Soc. 1994, 116, 7515–7522. [Google Scholar] [CrossRef]
  30. Scott Mackenzie, D. Determining Concentration by Weight and by Volume-Application to Polymer Quenchants; Technical report; Houghton International Inc.: Valley Forge, PA, USA, 2014. [Google Scholar] [CrossRef]
  31. National Center for Biotechnology Information (2023). PubChem Compound Summary for CID 62556, Pentaerythritol Tetraacrylate. Available online: https://pubchem.ncbi.nlm.nih.gov/compound/Pentaerythritol-tetraacrylate (accessed on 25 March 2023).
  32. Nethercott, J.R. Skin Problems Associated with Multifunctional Acrylic Monomers in Ultraviolet Curing Inks. Br. J. Dermatol. 1978, 98, 541–552. [Google Scholar] [CrossRef]
  33. Unwin, J. Development of an Analysis Method to Measure Airborne Acrylate in UV-Cured Motor Vehicle Repair Coatings. Health and Safety Laboratory. 2007; pp. 1–17. Available online: http://www.hsl.gov.uk/ (accessed on 25 March 2023).
  34. Pentaerythritol Tetraacrylate. Toronto Research Chemicals. Available online: https://www.trc-canada.com/product-detail/?P227458 (accessed on 25 March 2023).
  35. Wong, R.S.H.; Dodou, K. Effect of Drug Loading Method and Drug Physicochemical Properties on the Material and Drug Release Properties of Poly (Ethylene Oxide) Hydrogels for Transdermal Delivery. Polymers 2017, 9, 286. [Google Scholar] [CrossRef]
  36. Available online: https://www.sigmaaldrich.com/GB/en/sds/aldrich/408905 (accessed on 25 March 2023).
  37. Abdi, K.; Mandegary, A.; Amini, M.; Bagheri, M.; Gerami-Panah, F. Determination of Residual Methylmethacrylate Monomerin Denture Base Resins by Gas Chromatography. Iran. J. Pharm. Res. 2005, 4, 227–232. [Google Scholar] [CrossRef]
  38. Craig, A.P.; Fields, C.C.; Simpson, J.V. Development of a Gas Chromatography-Mass Spectrometry Method for the Quantification of Glucaric Acid Derivatives in Beverage Substrates. Int. J. Anal. Chem. 2014, 2014, 402938. [Google Scholar] [CrossRef] [PubMed]
  39. Bernal, E.; Guo, X. Limit of Detection and Limit of Quantification Determination in Gas Chromatography. Adv. Gas Chromatogr. 2014, 3, 57–63. [Google Scholar] [CrossRef] [Green Version]
  40. European Medicines Agency. Note for Guidance on Validation of Analytical Procedures: Text and Methodology; CPMP/ICH/381/95; European Medicines Agency: Amsterdam, The Netherlands, 1995.
  41. Armbruster, D.A.; Tillman, M.D.; Hubbs, L.M. Limit of Detection (LQD)/Limit of Quantitation (LOQ): Comparison of the Empirical and the Statistical Methods Exemplified with GC-MS Assays of Abused Drugs. Clin. Chem. 1994, 40, 1233–1238. [Google Scholar] [CrossRef] [PubMed]
  42. Krupčík, J.; Májek, P.; Gorovenko, R.; Blaško, J.; Kubinec, R.; Sandra, P. Considerations on the Determination of the Limit of Detection and the Limit of Quantification in One-Dimensional and Comprehensive Two-Dimensional Gas Chromatography. J. Chromatogr. A 2015, 1396, 117–130. [Google Scholar] [CrossRef] [PubMed]
Figure 1. Chemical structure of PT (drawn using ChemDraw).
Cosmetics 10 00070 g001
Figure 2. (A) Mass spectra of the PT adapted from the literature [17]. (B) Mass spectra of residual PT in our extraction solution. The y-axis of the mass spectra is the signal intensity (in abundance or counts arbitrary units); the x-axis (m/z) is the mass-to-charge ratio of the detected signal.
Cosmetics 10 00070 g002
Figure 3. Hydrogel films after residual PT extraction (B,C) compared to the untreated blank, i.e., xerogel (A). (A) Blank untreated hydrogel films (no swelling, no freeze-drying). (B) Hydrogel films swelled in water for 24 h prior to PT extraction in chloroform. (C) Hydrogel films swelled in water for 24 h and then freeze-dried for 24 h prior to the extraction procedure in chloroform. Each set of horizontal comparisons of (AC) has the same scale bars: 500 μm surface (A1,B1,C1), 200 μm surface (A2,B2,C2), 50 μm surface (A3,B3,C3) and 200 μm cross-section (A4,B4,C4).
Cosmetics 10 00070 g003
Figure 4. 1H NMR spectra for pentaerythritol tetraacrylate (PT) sample with expansion showing integrated signals at 5.85, 6.10, and 6.4 ppm corresponding to labeled protons A, B, and X, respectively, in PT molecule.
Cosmetics 10 00070 g004
Figure 5. (A,B) PT monomer GC chromatogram from our study. (A) PT GC chromatogram from standard solution. PT monomer peak at 8.55 min retention time (RT), IS internal solution (HexA) peak was at 4.67 min retention time (RT). (B) PT GC chromatogram from a sample extraction solution of residual PT in HA hydrogel films. PT monomer peak at 8.55 min retention time (RT), IS internal solution (HexA) peak was at 4.66 min retention time (RT).
Cosmetics 10 00070 g005
Table 1. Hydrogel film names, each having 5% HA, the % w/w ratio of PT in HA, and the % w/w PT in whole films.
Hydrogel Films Names% w/w of
the PT in HA
Ratio of PT to HA (%)The % w/w of
PT in the Film
M2020%(1:5)1.00%
M2525%(1:4)1.25%
M4040%(2:5)2.00%
M5050%(1:2)2.55%
M7575%(3:4)3.83%
M100100%(1:1)5.00%
Table 2. Effect of freeze-drying, prior to extraction, on the PT amount extracted.
Samples PT Concentration in GC Analysis %
m/m ± SD
Sample 1Not freeze-dried0.00028±0.75
Sample 20.00031±0.62
Sample 30.00035±0.59
Mean (0.0003)
Sample 4Freeze-dried0.00275±1.02
Sample 50.00409±2.50
Sample 60.00305±1.02
Mean (0.0033)
Table 3. Precision results from the residual PT intra-day and inter-day analysis.
Selected PT Concentrations
(%m/m)
Peak Area Ratio %
(Mean ±SD)
Intra-Day Precision
RSD%Peak Area Ratio %
(Mean ±SS)
Inter-Day Precision
RSD%
0.0000321.1062 ± (0.006)0.541.193 ± (0.056)4.72
0.0005217.365 ± (0.439)2.5315.278 ± (0.283)1.85
0.00833264.41 ± (6.035)2.28256.15 ± (2.541)0.99
mean (1.78)% (2.52)%
Table 4. The accuracy results of the PT sample extraction at 3 different PT concentrations.
Selected PT Concentrations Added % m/mBlank Sample
Concentration
% m/m
Recovered Concentration
% m/m
% Recovery
(Accuracy)
%RSD
0.0040.0090.0158105.49 ± 1.261.24
0.0060.0090.0184102.38 ± 0.650.64
0.0090.0090.012697.31 ± 3.263.20
mean101.731.69
Table 5. Limit of detection (LOD) and limit of quantitation (LOQ) of PT (n = 3).
Sensitivity
Parameters
PT Concentration
% m/m
Signal of Noise N/S ± (SD)
LOD0.0000324.2 ± 0.15
LOQ0.0001315.7 ± 0.41
Table 6. Results of robustness for PT concentration with different parameters. For each parameter n = 3.
Different ParametersPT Concentration
%m/m
Peak Area Ratio
Mean ± SD
% RSD
No variation applied0.004160.377 ± 0.0020.54
0.00200.215 ± 0.0042.03
0.00100.095 ± 0.0010.96
Detector temperature (+5)0.004160.303 ± 0.0061.93
0.00200.164 ± 0.0031.93
0.00100.075 ± 0.0011.25
Detector temperature
−(5)
0.004160.297 ± 0.0072.36
0.00200.179 ± 0.0040.83
0.00100.084 ± 0.0021.82
Oven temperature
(+5)
0.004160.307 ± 0.0072.13
0.00200.184 ± 0.0041.90
0.00100.082 ± 0.0011.80
Oven temperature
(−5)
0.004160.301 ± 0.0010.43
0.00200.178 ± 0.0010.56
0.00100.075 ± 0.0011.27
Flow rate
(+10)
0.004160.319 ± 0.0051.67
0.00200.596 ± 0.0081.36
0.00100.081 ± 0.0011.41
Flow rate
(−10)
0.004160.300 ± 0.0062.02
0.00200.677 ± 0.0233.39
0.00100.281 ± 0.0051.72
Mean(1.59)
Table 7. Comparison of PT extraction from M25 and M50 films in chloroform and dichloromethane (n = 3).
SamplesPT Concentration
(Chloroform Extraction)
% m/m
PT Concentration
(DCM Extraction)
% m/m
M25 0.0027030.002700
M25 0.0050.00056
M25 0.00130.00045
SD ± (0.001)SD ± (0.001)
M50 0.00110.001
M50 0.001660.00168
M50 0.0020.002
SD ± (0.0005)SD ± (0.0008)
Table 8. Compliance with acceptable residual PT via both analysis techniques (NMR and GC) for hydrogel films with different PT concentrations.
Hydrogel Film SamplesPT Concentration % m/m
with NMR
PT Concentration % m/m
with GC
Acceptance of the PT Concentration ˂ 0.008%m/m
M20 (1)0.00170.0017Accepted
M20 (2)0.00210.0021Accepted
M20 (3)0.00510.0041Accepted
mean0.0030 ± (0.001)0.0026 ± (0.001)
M25 (1)0.00150.0013Accepted
M25 (2)0.00160.0015Accepted
M25 (3)0.00460.004Accepted
mean0.0026 ± (0.001)0.0023 ± (0.001)
M40 (1)0.00260.0002Accepted
M40 (2)0.00180.00015Accepted
M40 (3)0.00080.00053Accepted
Mean0.0017 ± (0.0009)0.0006 ± (0.0004)
M50 (1)0.00180.0019Accepted
M50 (2)0.00190.0015Accepted
M50 (3)0.00140.0015Accepted
Mean0.0017 ± (0.0008)0.0016 ± (0.0002)
M75 (1)0.00690.0058Accepted
M75 (2)0.00850.0049Rejected
M75 (3)0.00830.0073Rejected
Mean0.0079 ± (0.0009)0.006 ± (0.001)
M100 (1)0.05060.0301Rejected
M100 (2)0.06790.0355Rejected
M100 (3)0.0310.0189Rejected
Mean0.0498 ± (0.018)0.028 ± (0.008)
Disclaimer/Publisher’s Note: The statements, opinions and data contained in all publications are solely those of the individual author(s) and contributor(s) and not of MDPI and/or the editor(s). MDPI and/or the editor(s) disclaim responsibility for any injury to people or property resulting from any ideas, methods, instructions or products referred to in the content.

