Article

System Dynamics Modelling: Integrating Empty Fruit Bunch Biomass Logistics to Reduce GHG Emissions

1
Department of Management and Humanities, University Technology PETRONAS, Seri Iskandar 32610, Perak, Malaysia
2
Department of Operation and Supply Chain, University of Management and Technology Lahore, Lahore 54770, Pakistan
*
Author to whom correspondence should be addressed.
Resources 2023, 12(4), 53; https://doi.org/10.3390/resources12040053
Submission received: 5 March 2023 / Revised: 22 March 2023 / Accepted: 27 March 2023 / Published: 18 April 2023
(This article belongs to the Special Issue Women's Special Issue Series: Sustainable Resource Management)

Abstract

:
The world is shifting toward renewable energy sources due to global warming and rising GHG emissions. Malaysia has joined other nations in the conference of parties to develop policies for the reduction of GHG and carbon emissions. Malaysia is switching towards sustainable, eco-friendly and renewable energy sources. EFB biomass, one of the by-products of palm oil, has enormous potential as a sustainable energy source. Malaysia, one of the top exporters of palm oil, is unable to employ EFB-biomass-based power generation due to storage, logistics and supply-chain-related constraints. Therefore, this study integrates EFB biomass supply-chain logistics to overcome the reported challenges. The current study employs the system dynamics (SD) approach to achieve the objectives as it explains the dynamics of interaction and behaviour among the sub-systems. A document-based model-building approach is employed to collect data to develop the base model. The document-based model-building approach and system dynamics modelling facilitates the achievement of two outcomes: integrated EFB biomass logistics and GHG reduction using EFB. These outcomes are crucial to enhancing the base model and realizing the zero-carbon emission goal to contribute to sustainable development goals.

1. Introduction

The world is witnessing an increase in carbon dioxide at a level it has never before seen in history. A study performed by the National Oceanic and Atmospheric Administration (NOAA) in Mauna Loa and Hawaii reported the highest level of CO2 in the past 65,000 years. The rise of the CO2 level has increased the temperature of planet Earth. The CO2 concentration has been rising at a constant rate of 0.07 parts per million (ppm) of CO2 every year since 1880 [1,2,3,4]. Contemplating extreme climatic and global warming effects, in the conference of parties, Malaysia has pledged to reduce its carbon emission intensity by 45 percent until 2030. Additionally, Malaysia has also introduced and implemented the Green Technology Master Plan 2017–2030 (GTMP) to materialize this commitment. The GTMP focuses on six critical sectors [3,4]. These six sectors are energy, manufacturing, transportation, building, waste and water [4].
In the energy sector, the GTMP aims to utilize renewable energy for electricity generation to reduce GHGs. One of the key sources of GHGs is energy generation through conventional fossil fuel combustion. Malaysia is a tropical country, endowed with weather that is conducive to agriculture. Consequently, this country also produces several agricultural products and by-products that are potential renewable energy sources and the best alternative to fossil fuels [4,5,6]. The highest amount of agricultural waste comes from palm production.
Malaysia uses one million hectares of land to produce 47% of the world’s supply of palm oil. Every ton of processed fresh fruit bunches (FFBs) generates approximately 230 kg of empty fruit bunches (EFBs), an essential feedstock for generating electricity. It is a rough estimation that around 1 hectare of palm oil plantation can produce approximately 50 to 70 tons of biomass waste [6,7]. However, the use of palm residue as a biomass-rich energy source is not feasible without an efficient and integrated supply chain for EFBs. The main constraints in the EFB supply chain are an inconsistent biomass supply and demand, storage, cost, logistics, technology, policy and environmental impact [8,9]. Palm oil EFBs comprise four interrelated supply chain activities: harvesting and collection, storage, pre-processing and transportation. There are also many interplaying factors: the quality of the palm biomass residues, the availability of the feedstock, the handling of the materials, the stocking method and the transportation mode affect the efficiency and effectiveness of the palm biomass supply chain and logistics [10]. The efficiency and effectiveness issues motivate many optimization studies in this area. The literature review of biomass by Malladi and Sowlati [11] indicates that most of the studies have covered the transportation and storage operations aspects, while fewer studies have discussed the harvest and pre-processing operations in biomass. Zahree et al. [12] examined the delivery cost and GHG emissions of different transportation modes (train and truck) of palm oil empty fruit bunches (EFBs) biomass supply chains. Few studies are available on storage and logistics planning by integrating supply chain activities.
Motivated by the above gaps, this study intends to combine logistics and storage activity for EFBs to develop a model comprising all factors that influence the optimal biomass supply chain and logistics. Considering the nature of the problem and motivation, the authors have decided to employ a system dynamics model approach to develop the integrated supply chain logistics model for EFBs. System dynamics modelling is a suitable method for capturing the uncertainties in the EFB supply chain dynamics that influence logistics planning. System dynamics modelling is a computer-aided approach to solving complex issues and policy designs. The primary goal of system dynamics modelling in complex scenarios is to aid better decision making. System dynamics modelling also helps gain an understand of the dynamic interaction among different variables in the system. System dynamics modelling also facilitates the understanding and investigation of the impact of variables on policy decisions over a long-term horizon. Additionally, system dynamics modelling also helps researchers to understand the behaviour of the system [13]. The use of system dynamics modelling in biomass use helps researchers to comprehend how the variables in harvesting and collection, storage, pre-processing, transportation, demand and supply interact dynamically. To the best of the researchers’ knowledge, no optimal integrated biomass logistics model is available for EFBs. Hence, the main objectives of the current study are (i) to develop an integrated biomass logistics model to improve the efficiency of the logistic supply chain and (ii) to compare GHG emissions from a conventional fuel source and a renewal EFB source. Furthermore, this paper discusses the palm oil and EFB literature and the methodology employed to achieve the stated objectives. Finally, this study concludes with future directions.

2. Literature Review

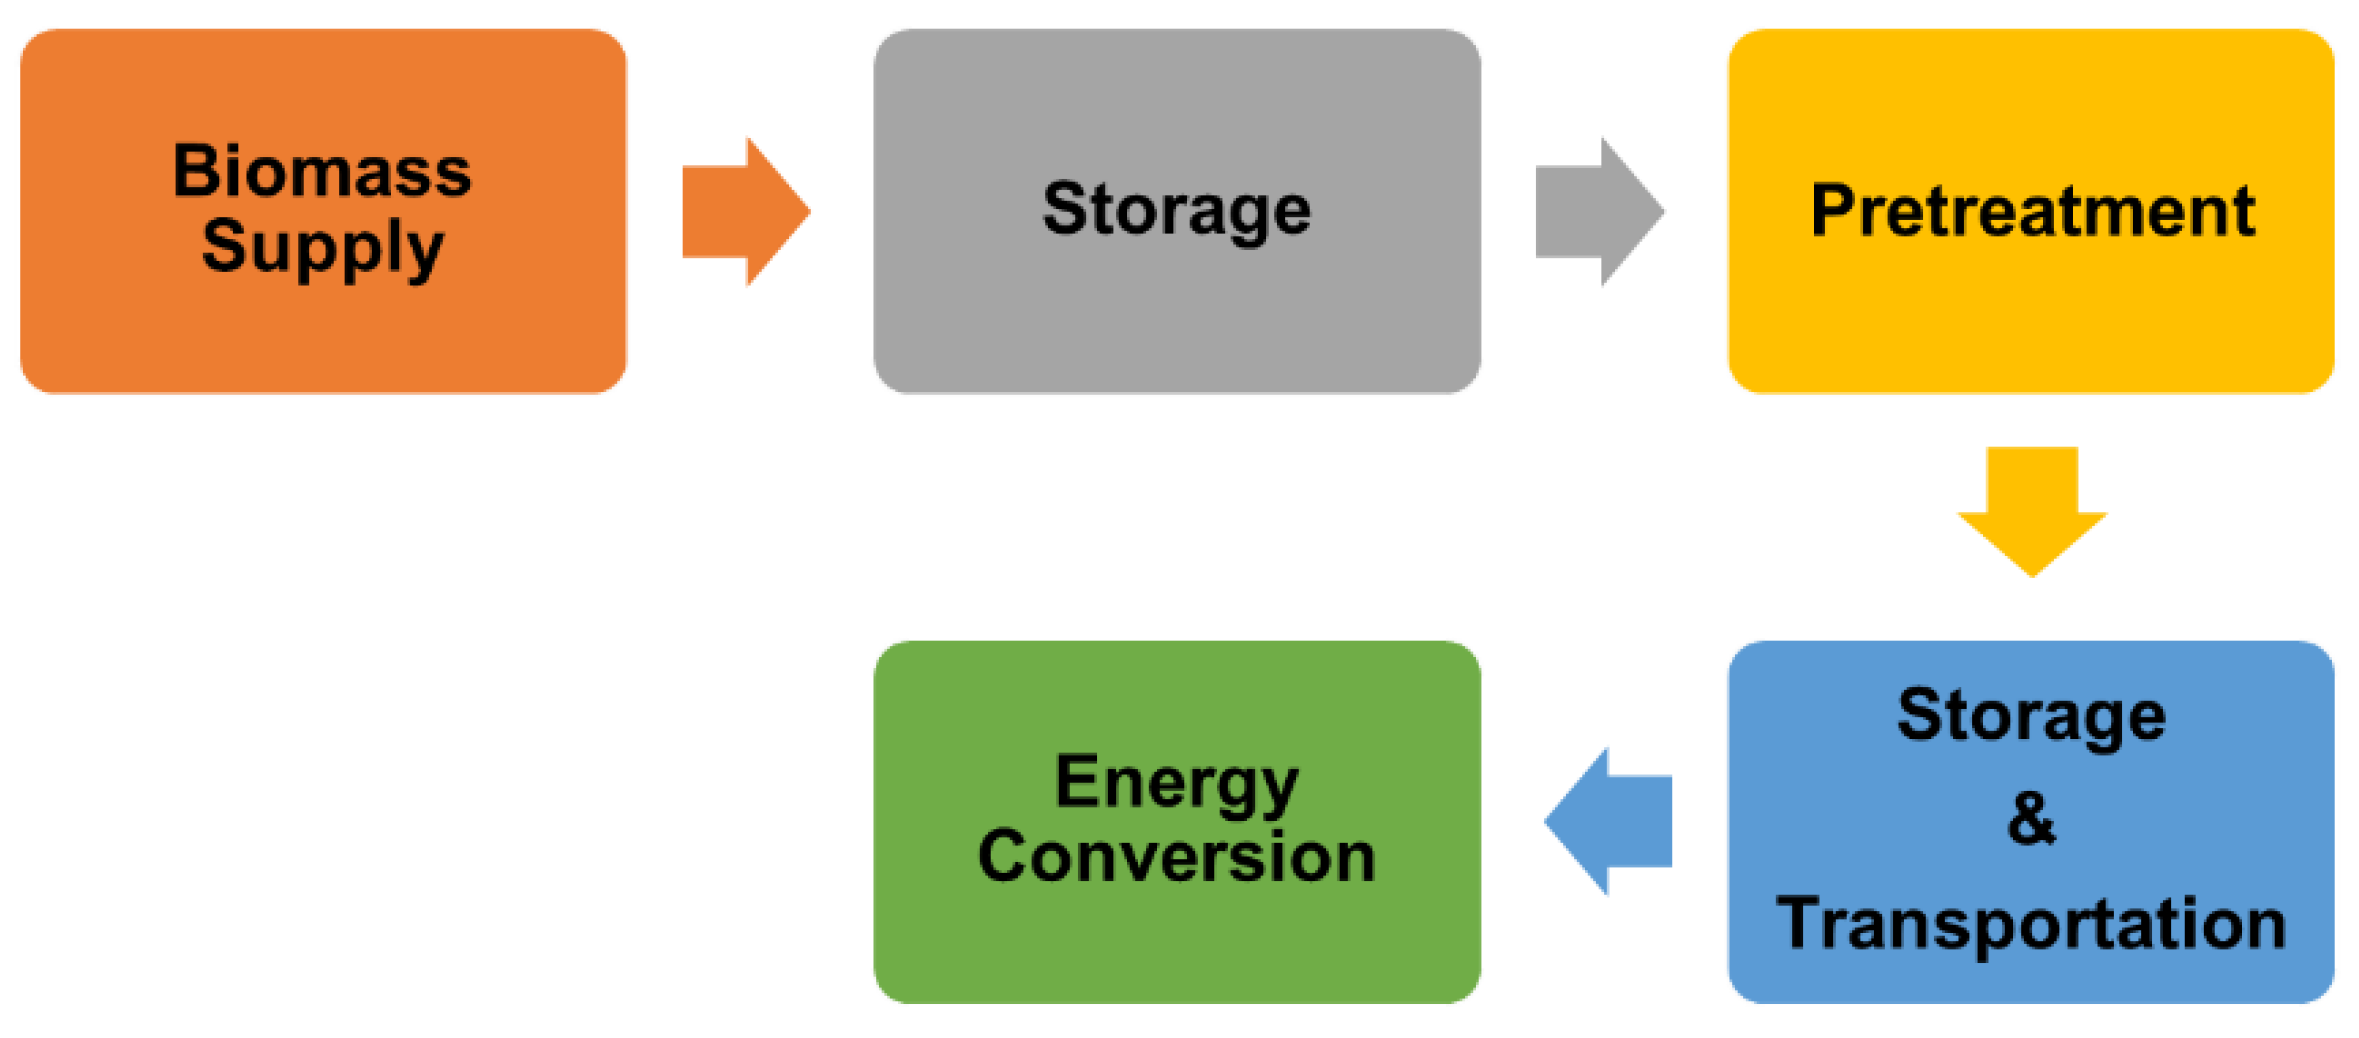
2.1. Biomass Supply Chain

Malaysia has made numerous efforts to effectively shift from conventional energy sources to biomass to improve energy security and reduce air pollution [13,14]. It has significantly enhanced the commercialization of biomass production in recent years. Malaysia has proposed and introduced numerous energy policies and plans to promote biomass utilization for energy generation. Malaysia acquires its biomass supply predominantly from the palm oil industry. The biomass supply chain comprises two parts: the upstream biomass supply chain and the downstream biomass supply chain. The upstream part of the biomass supply chain includes harvesting, transportation and pre-treatment, whereas the downstream biomass involves energy production and heat. Fresh fruit bunch (FFB) feedstocks are harvested for the palm oil plantation [14,15,16,17]. FFB harvesting varies in different agriculture seasons, such as the low, mid and high seasons. FFBs are transferred to sterilization and pressing during crude oil production. The EFBs generated by FFBs as bioproducts of palm oil are treated as biomass [17,18].
Logistic facilities help to transfer POM products to POM products as an intermediary. The pre-treatment process is adopted in the intermediate processing facilities to add value and ensure a better quality of biomass prior to the conversion process. EFBs are taken to the intermediate processing facilities in superstructure form. The intermediate processing facilities separate and dry the EFBs to form a short fibre. These short fibres are transferred either to a briquette or pelletizing process to produce EFB briquettes or pellets. Finally, both products can be used as boiler fuel or sold to the markets for furniture and other industrial products. The downstream portion of the biomass supply chain involves the final conversion of biomass into energy [17,18]. Figure 1 shows the overall EFB biomass supply chain.
As explained above, the supply chain for EFB biomass is not as smooth due to some logistics-related issues. The logistics problem arises while carrying the biomass over long distances. This biomass logistics issue requires transportation planning. All steps of the biomass supply chain involve energy consumption. Therefore, inadequate transportation management from field to end-use can decrease the efficiency and economics. EFBs are converted into briquette and pellet products to manage, transport and store them for a longer period. However, abundant pellet production introduces higher cost factors. Similarly, after harvesting, raw biomass requires transportation to the pre-processing facilities. However, the transportation of biomass without losses and the cost of transportation are some of the biggest obstacles in the EFB biomass supply chain.
During seasonal variations, proper EFB storage is another significant challenge, and plant owners choose the cheapest storage without worrying about the consequence of their poor storage choices. Therefore, the EFB supply chain should consider logistics and handling factors. EFBs have a high moisture content. Transporting the wet biomass residue from the distant harvesting site to the production site increases the transportation cost. Due to its high moisture content, EFBs require drying to prevent biodegradation, which also increases production costs. Furthermore, drying technology, equipment purchase and installation require a high investment. Most small developers and plantation owners cannot implement this biomass technology due to the high costs. Thus, EFB biomass is not fully employed in Malaysia [17,18].
Considering the above-stated challenges, this paper proposes integrated biomass logistics to improve the efficiency of the EFB biomass supply chain. The current study uses simulations to develop integrated EFB biomass logistics.

2.2. Application of Computer Simulation in Biomass Supply Chain

Simulation modelling is one of the most effective methodologies due to its abilities and flexibility in simulating and assessing static systems with respect to variability and uncertainty between systems such as production lines, ports, the marine industry, healthcare systems, supply chains, the construction sector and buildings [19,20,21]. One of the primary methods used in the biomass supply chain is simulation modelling. Discrete event simulation was employed by Ravula et al. [22] to schedule trucks operating in the biomass logistics system for the cotton gin delivery system. Zhang et al. [23] created a simulation model to examine the supply chain for woody residues. The researchers used Arena software to simulate the supply chain of biofuel. Their model included basic supply chain activities, such as biomass harvesting/processing, on-site storage and transportation. Their model also considered some parameters such as feedstock delivery, feedstock cost, GHG emissions, energy consumption and performance measurements. Windisch et al. [24] also suggested mapping business processes to assess two forest biomass supply chains in Germany and Finland and to identify the stakeholders and business activities constituting the supply chains. Additionally, computer simulation modelling was employed to evaluate the employee cost of administrative work across the supply chain.
Additionally, discrete-event simulations were employed to measure the work time cost for administrative tasks. Zahraee et al. [12] used Arena software to develop a computer simulation model of the EFB biomass supply chain in the Perak state of Malaysia. The sixteen potential palm oil locations were analysed with respect to their existing palm oil capacity, distance to the nearest power plant and minimum amount of palm oil produced. Their model also ran two different scenarios by decreasing the number of labourers and increasing the number of trucks. A review of the related modelling literature indicates that simulation modelling is a valuable approach to evaluating the supply chain by examining different scenarios and circumstances. Therefore, the current study aims to use a system dynamics modelling approach to fill the gap in the existing literature on EFB biomass.

3. Materials and Methods

A document-based modelling approach and system dynamics methodology were used to understand the existing EFB supply chain and to develop integrated biomass supply chain logistics.
Problem identification is the first step in system dynamics modelling, as shown in Table 1. Many methods can be employed to resolve the identified problem in system dynamics modelling. The proceeding section of the paper explains the steps employed to develop the model.

3.1. Problem Identification

Problem identification is the initial stage in system dynamics modelling. As acknowledged in the literature review section, EFB biomass has not been fully implemented in Malaysia due to constraints in the EFB supply chain. These constraints include the EFB moisture content, EFB supply, transportation cost, storage facilities, demand and supply. The long distance from harvesting to the pre-processing site increases transportation costs and residue content. The availability of EFB due to seasonal variation is one of the obstacles in the biomass supply chain. The literature related to EFB biomass has reported that the availability of appropriate storage facilities is another challenge in the biomass supply chain. These issues can be understood by integrating EFB biomass logistics operations.

3.2. Data Collection

The authors employed a document-based model-building method to collect data to develop an integrated logistics model for the EFB. The document-based model building approach is among the data-driven research strategies that use documents comprising written and numerical databases. These documents include articles, various reports, books, etc. In DBM, an individual or a model-building team explores relevant sources and documents for further comprehensive analysis. Different methods, including a systematic literature review, content analysis, grounded theory and hermeneutics, are employed to investigate the documents from their systematic perspectives. The data collection approach to developing a model for EFB biomass logistics in this study is partially centred on a systematic literature review [24,25,26,27,28]. This systematic literature review is a well-defined technique based on specific issues or questions. The subjects are assessed for relevance and then summarized for or against the question. Eventually, evidence is extracted for or against the subject in question. This method lowers the biases involved, increases comprehensive information about the phenomenon that is consistent with the literature, identifies factors affecting the phenomenon and develops a model of the phenomenon by using the literature.
There are five steps involved in the document-based model building approach: clarifying the question for investigation; identifying and seeking out sources in the literature; evaluating the resources; reviewing the resources and extracting the intended data from them; and interpreting, composing and presenting the data in a suitable form [29]. Based on the steps discussed above and considering biomass as the central theme, keywords such as biomass optimization, palm oil supply chain, and EFB optimization were searched in two databases, Elsevier and Wiley Online Library, to obtain the most relevant literature. Additionally, the researchers focused on academic papers and conference papers in the English language, and reviewed almost 29 articles to build an integrated biomass logistics supply chain.

3.3. Results

This study identified variables from the available literature and classified them into stocks and flows according to their functions. Stock and flow are crucial components of system dynamics. Stock embodies a component of a system that accumulates over time through inflows and outflows that only changes its value based on flows. In other words, a stock is an accumulation or integration over time, with the outflows subtracting from the stocks, whereas flows cause the change in the stock. Flow represents the rate of change of stock that can either flow into or out of it at any time. Table 2 shows the variables identified for biomass logistics integration.

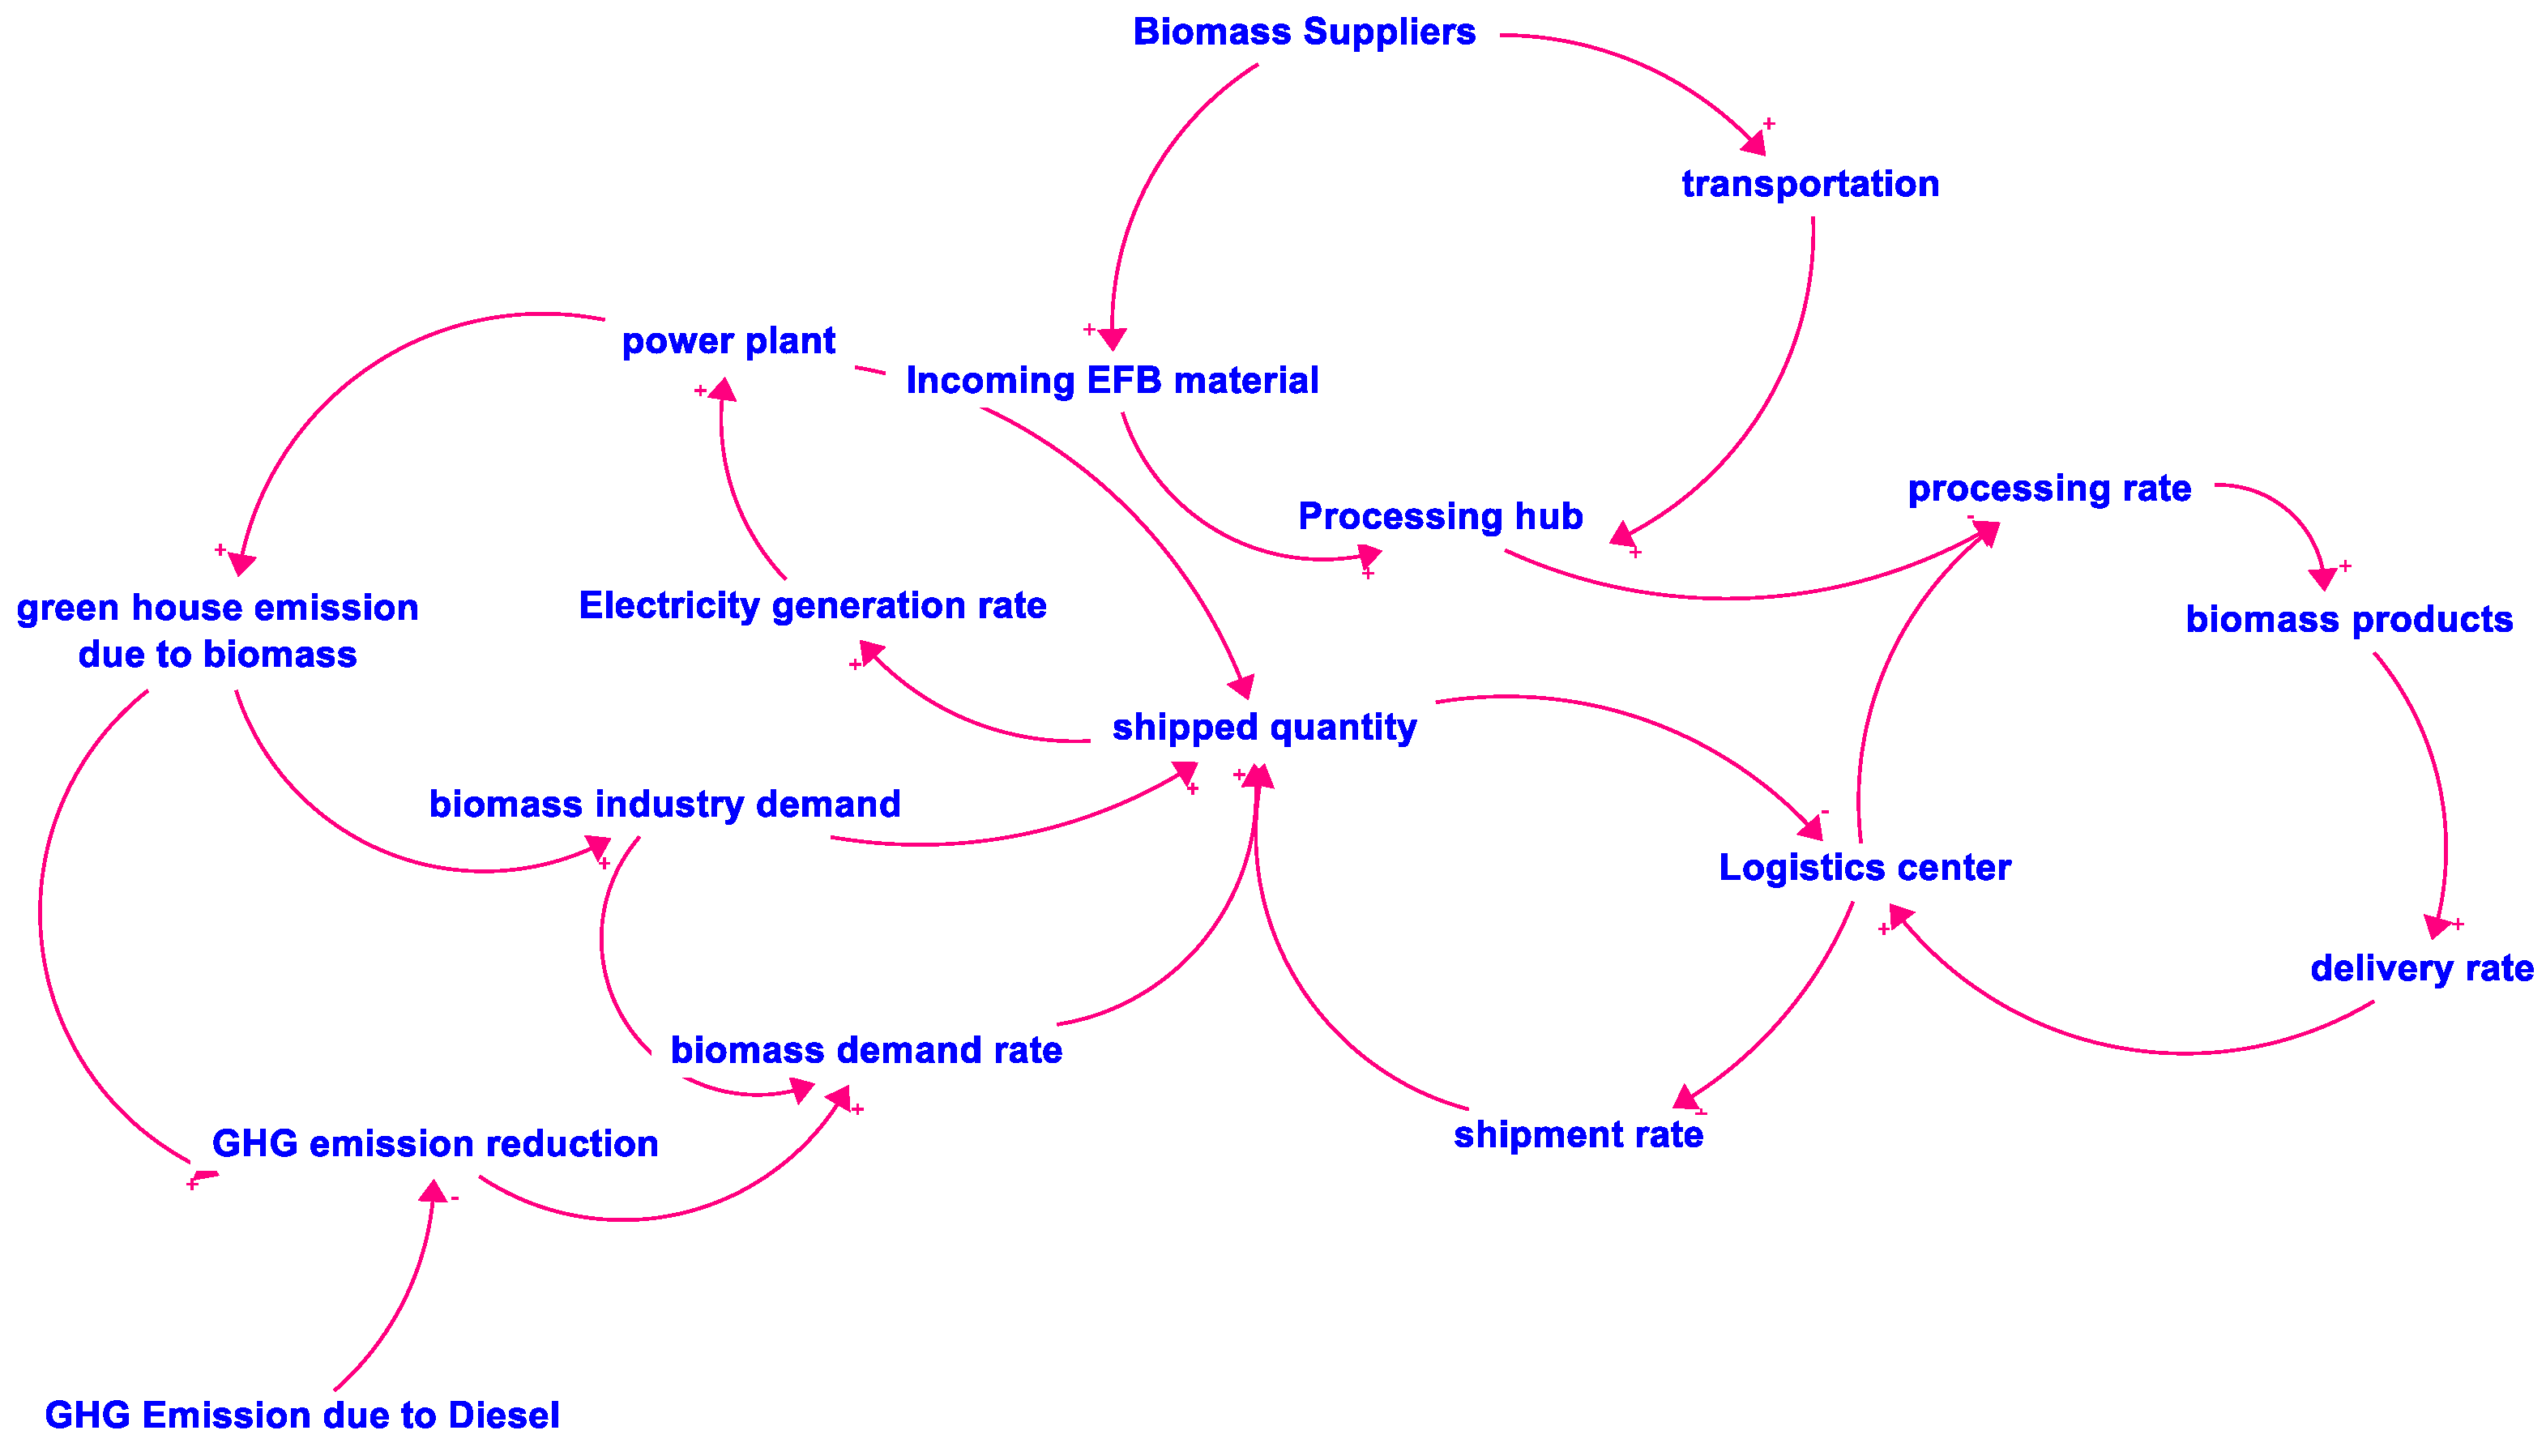
3.3.1. Causal Loop Diagram

A causal loop diagram is an essential part of system dynamics modelling because the positive and negative feedback loops in a causal loop diagram are considered the building blocks of system dynamics modelling. A causal loop diagram in system dynamics indicates the conceptualization of a prospective model. It is possible to see how interdependent variables affect one another using a causal loop diagram [12,29]. The diagram consists of several nodes that show the connections between the variables. Arrows show the link between variables. An increase or decrease in the variable at the end of the arrow is indicated by a positive (+) or negative (−) sign towards the top of the arrow. A causal loop diagram for EFB integrated biomass logistics supply chain was developed using Stella software and is shown in Figure 2.

Negative and Positive Feedback Loop

The example below explains positive and negative feedback loops in the causal loop diagram of the EFB biomass logistics supply chain. An increase (+) in the processed biomass in the logistics centre increases the (positive) shipment rate of the biomass and biomass shipment. The increase (+) in shipment rate will decrease (−) the availability of biomass in the logistics centre. The overall casual loop diagram of EFB biomass supply chain logistics is explained in the following paragraph.
Biomass logistics begin with the supply (incoming) of EFBs from suppliers, as shown in Figure 2. The EFB material supply increases the transportation of biomass material to the processing hub. The processing hub act as a storage hub and pre-treatment plant. Similarly, the availability of biomass material in the processing hub increases the processing rate of biomass materials. Similarly, an increase in the processing rate transforms EFB material into biomass products, and these biomass products are delivered to a biomass logistics centre. Likewise, the availability of biomass products in logistics centres increases shipment of products to the industry for power generation.

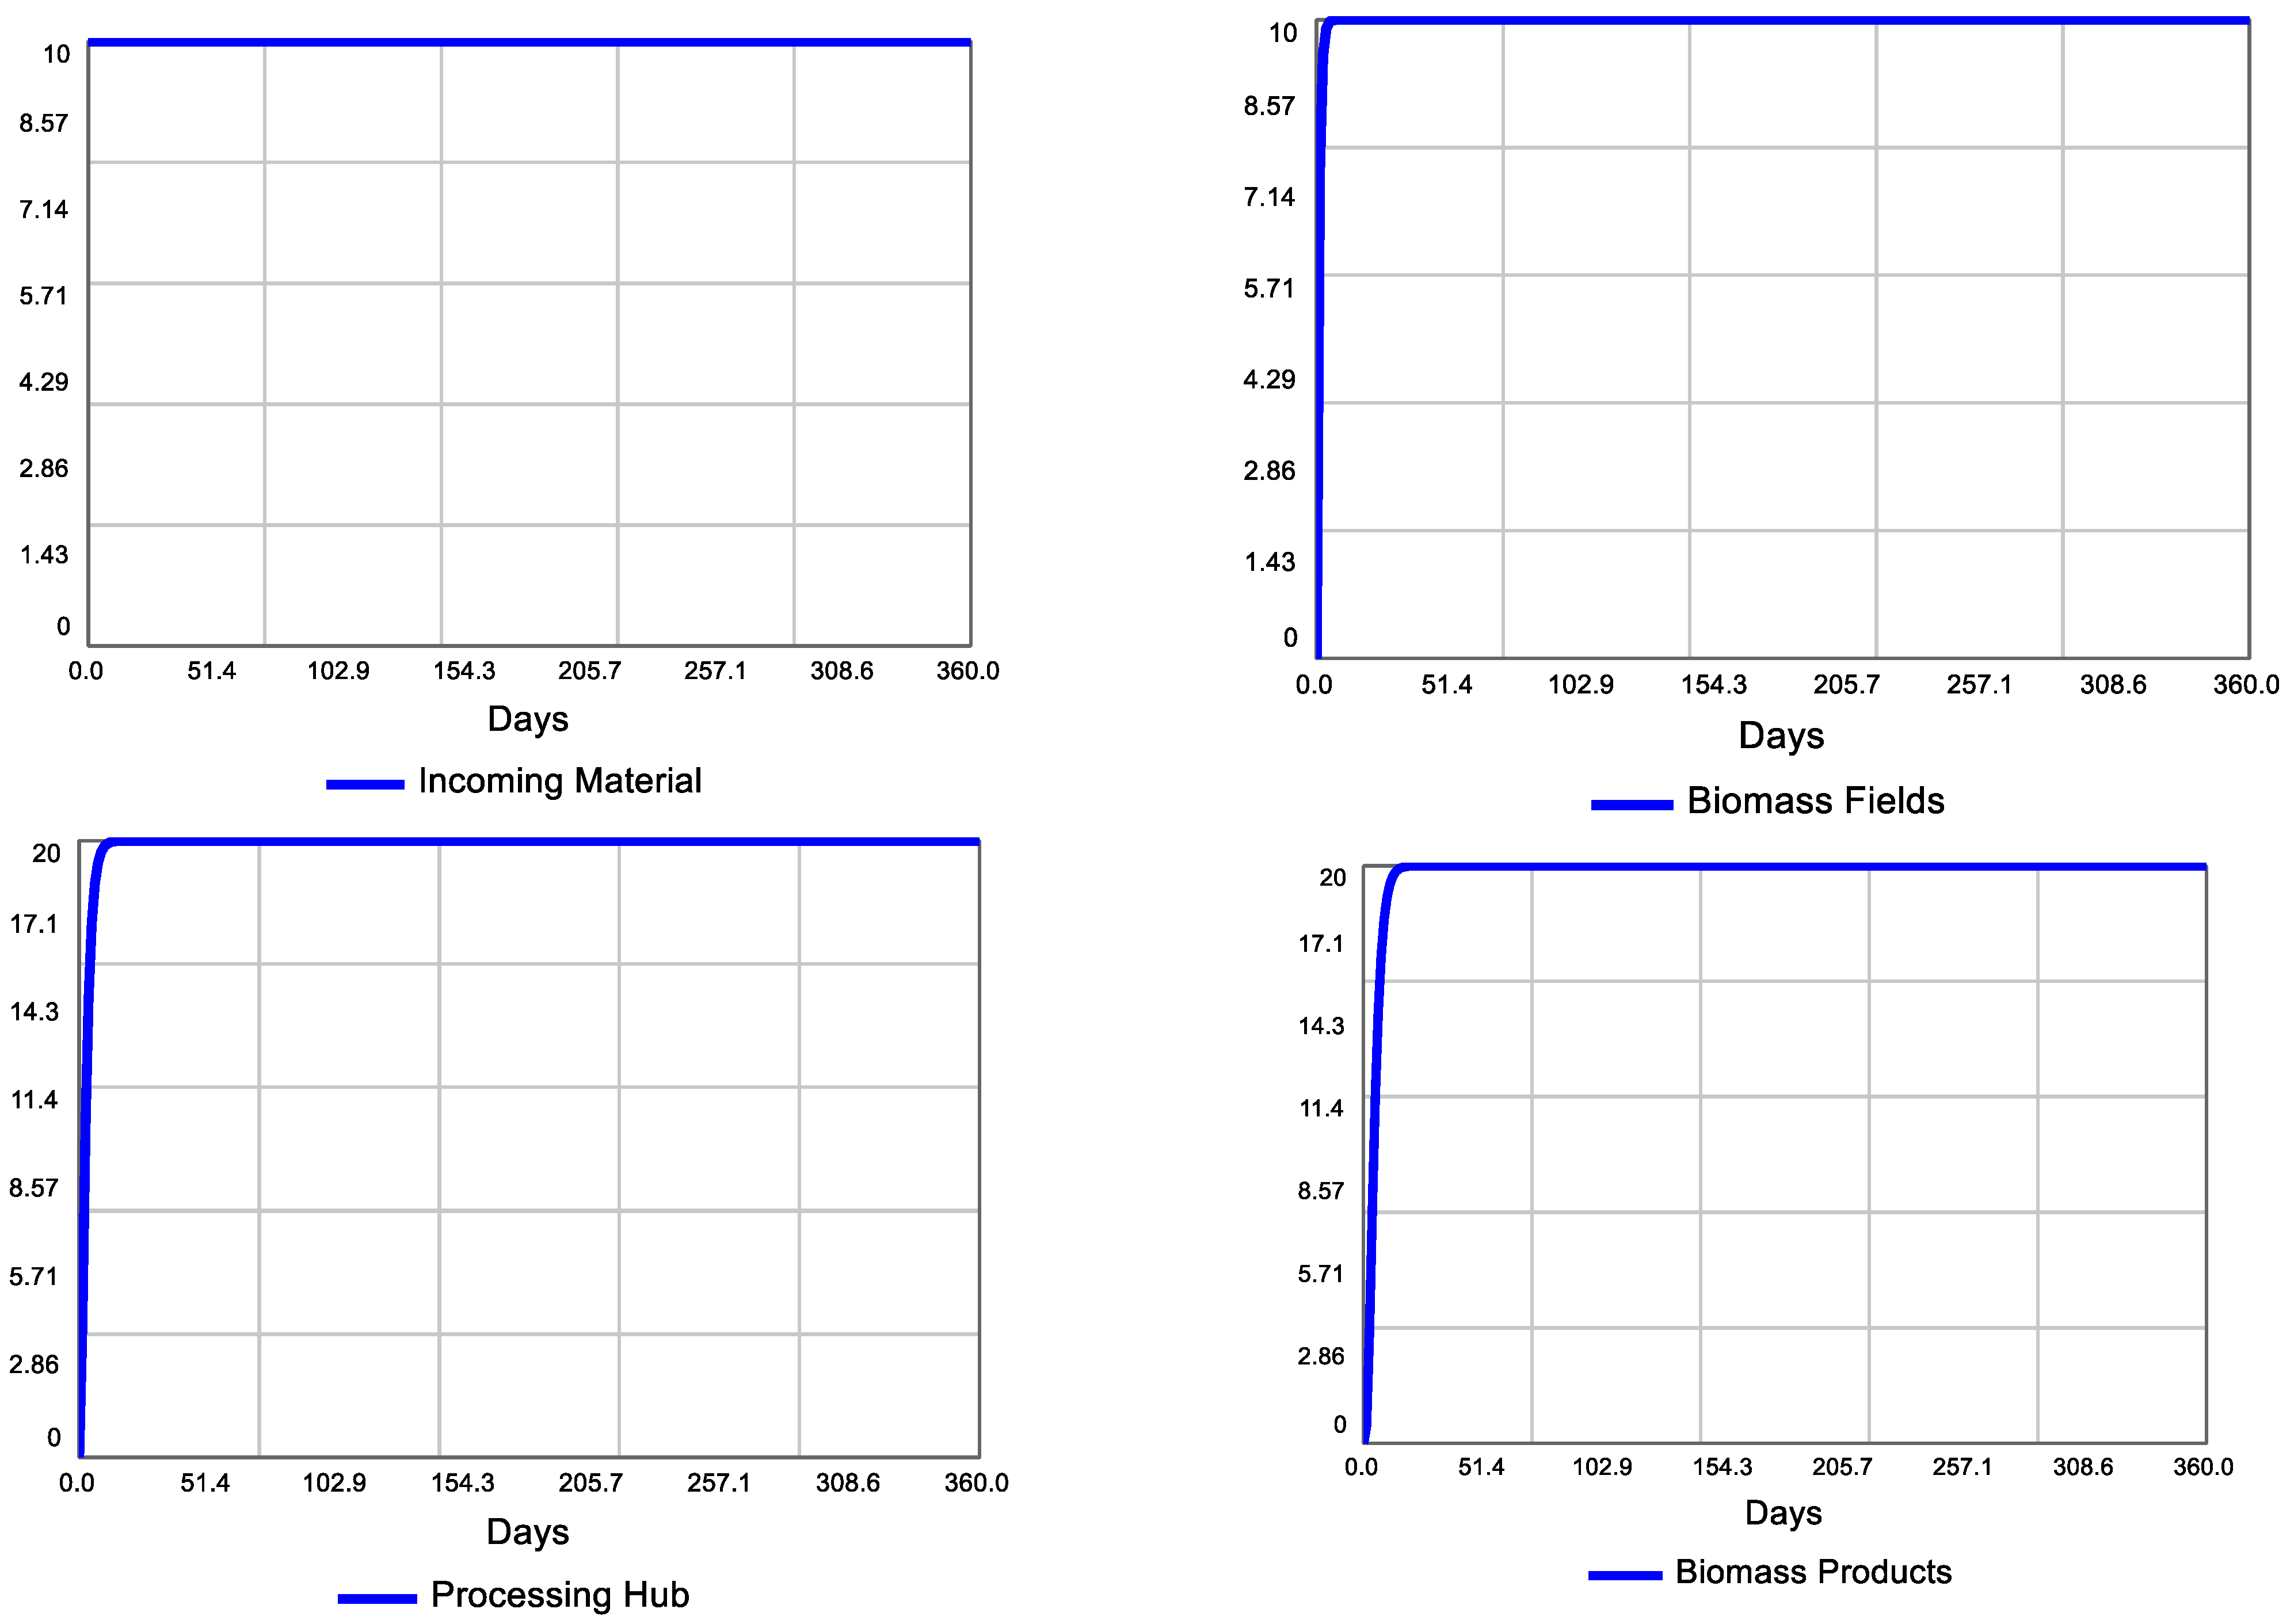
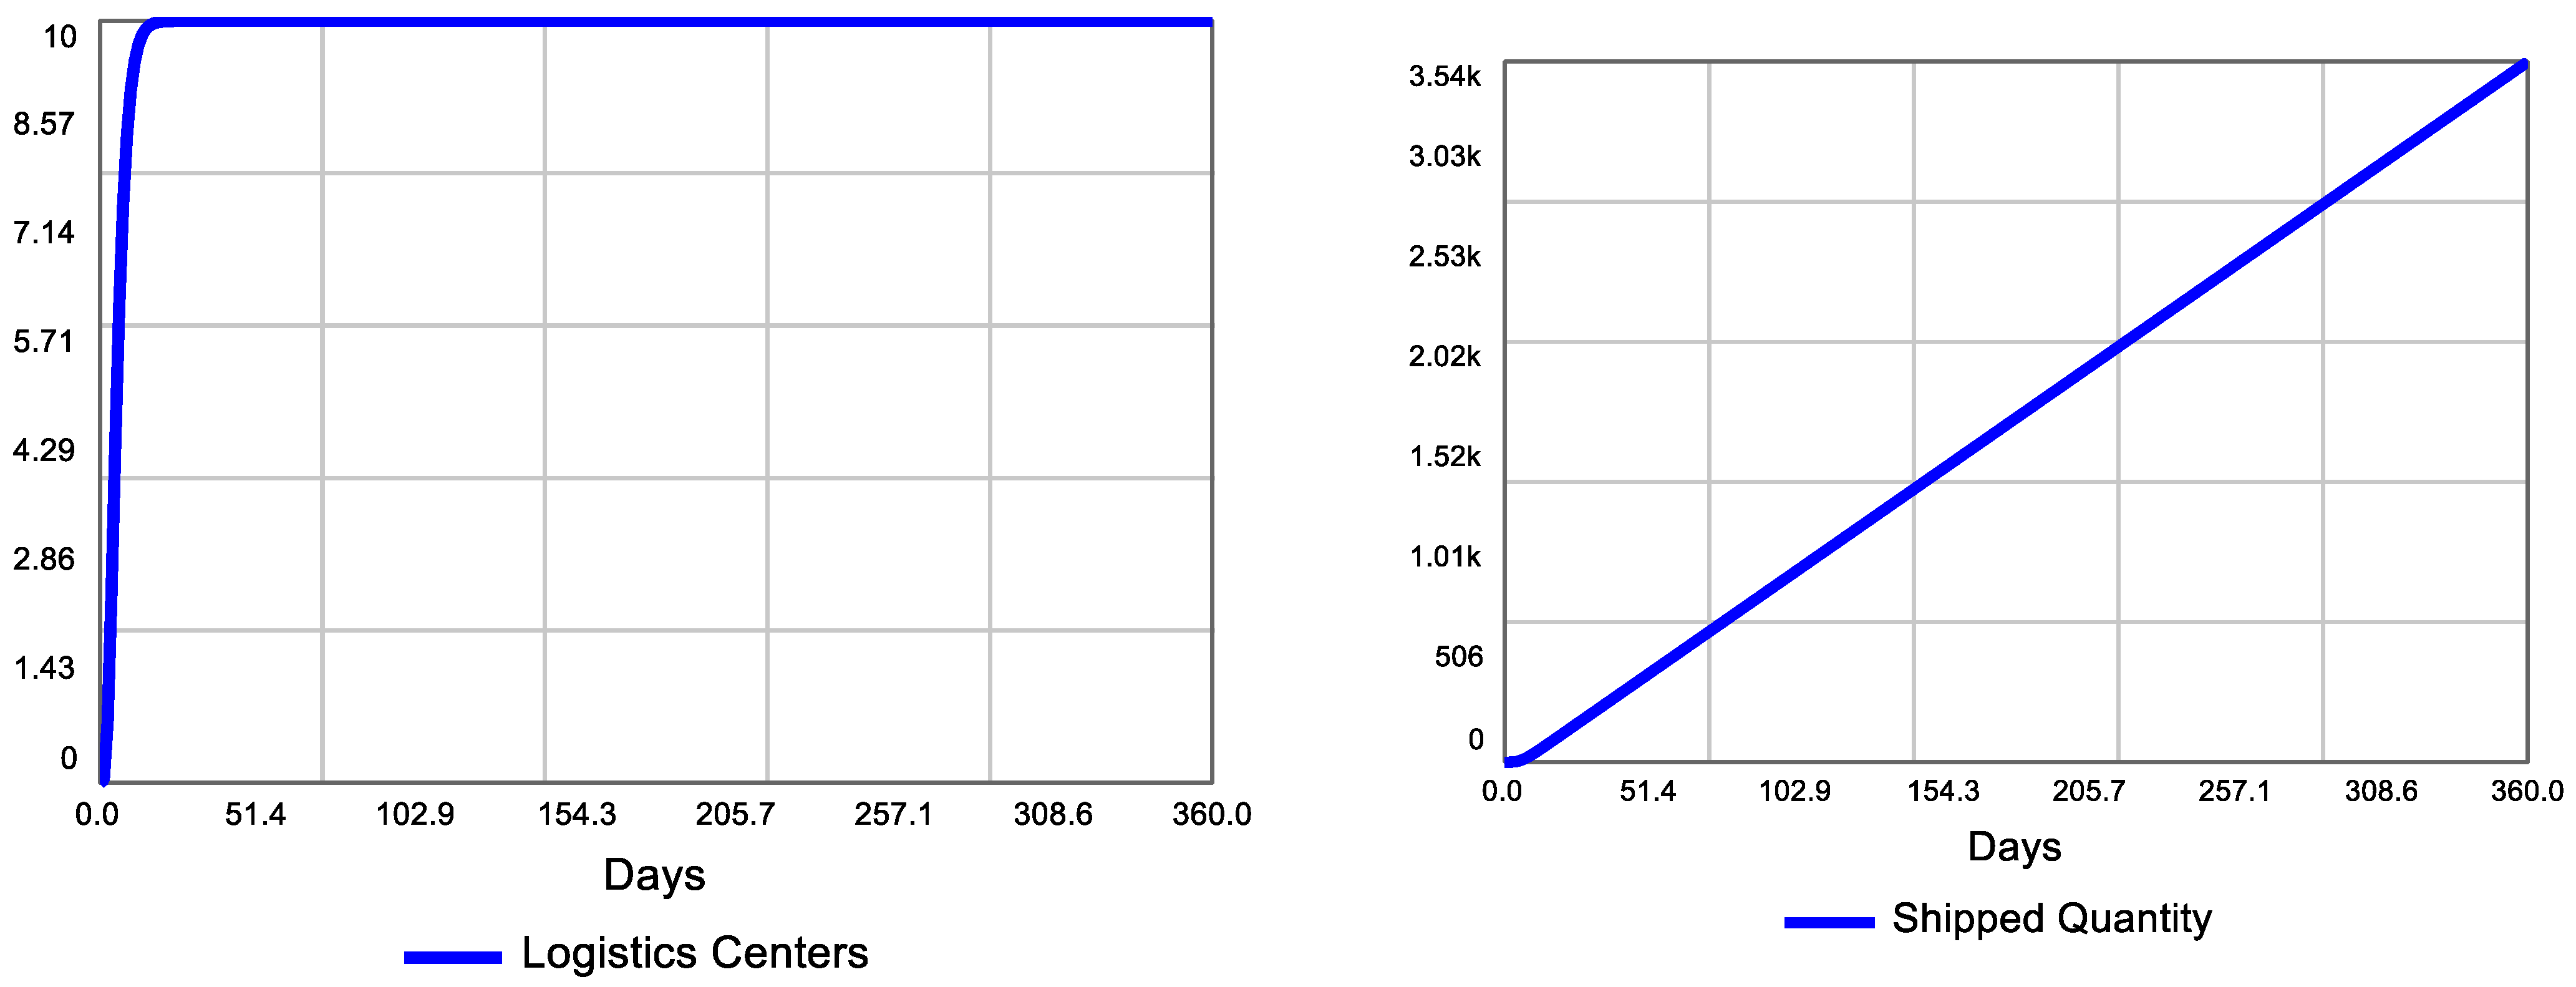
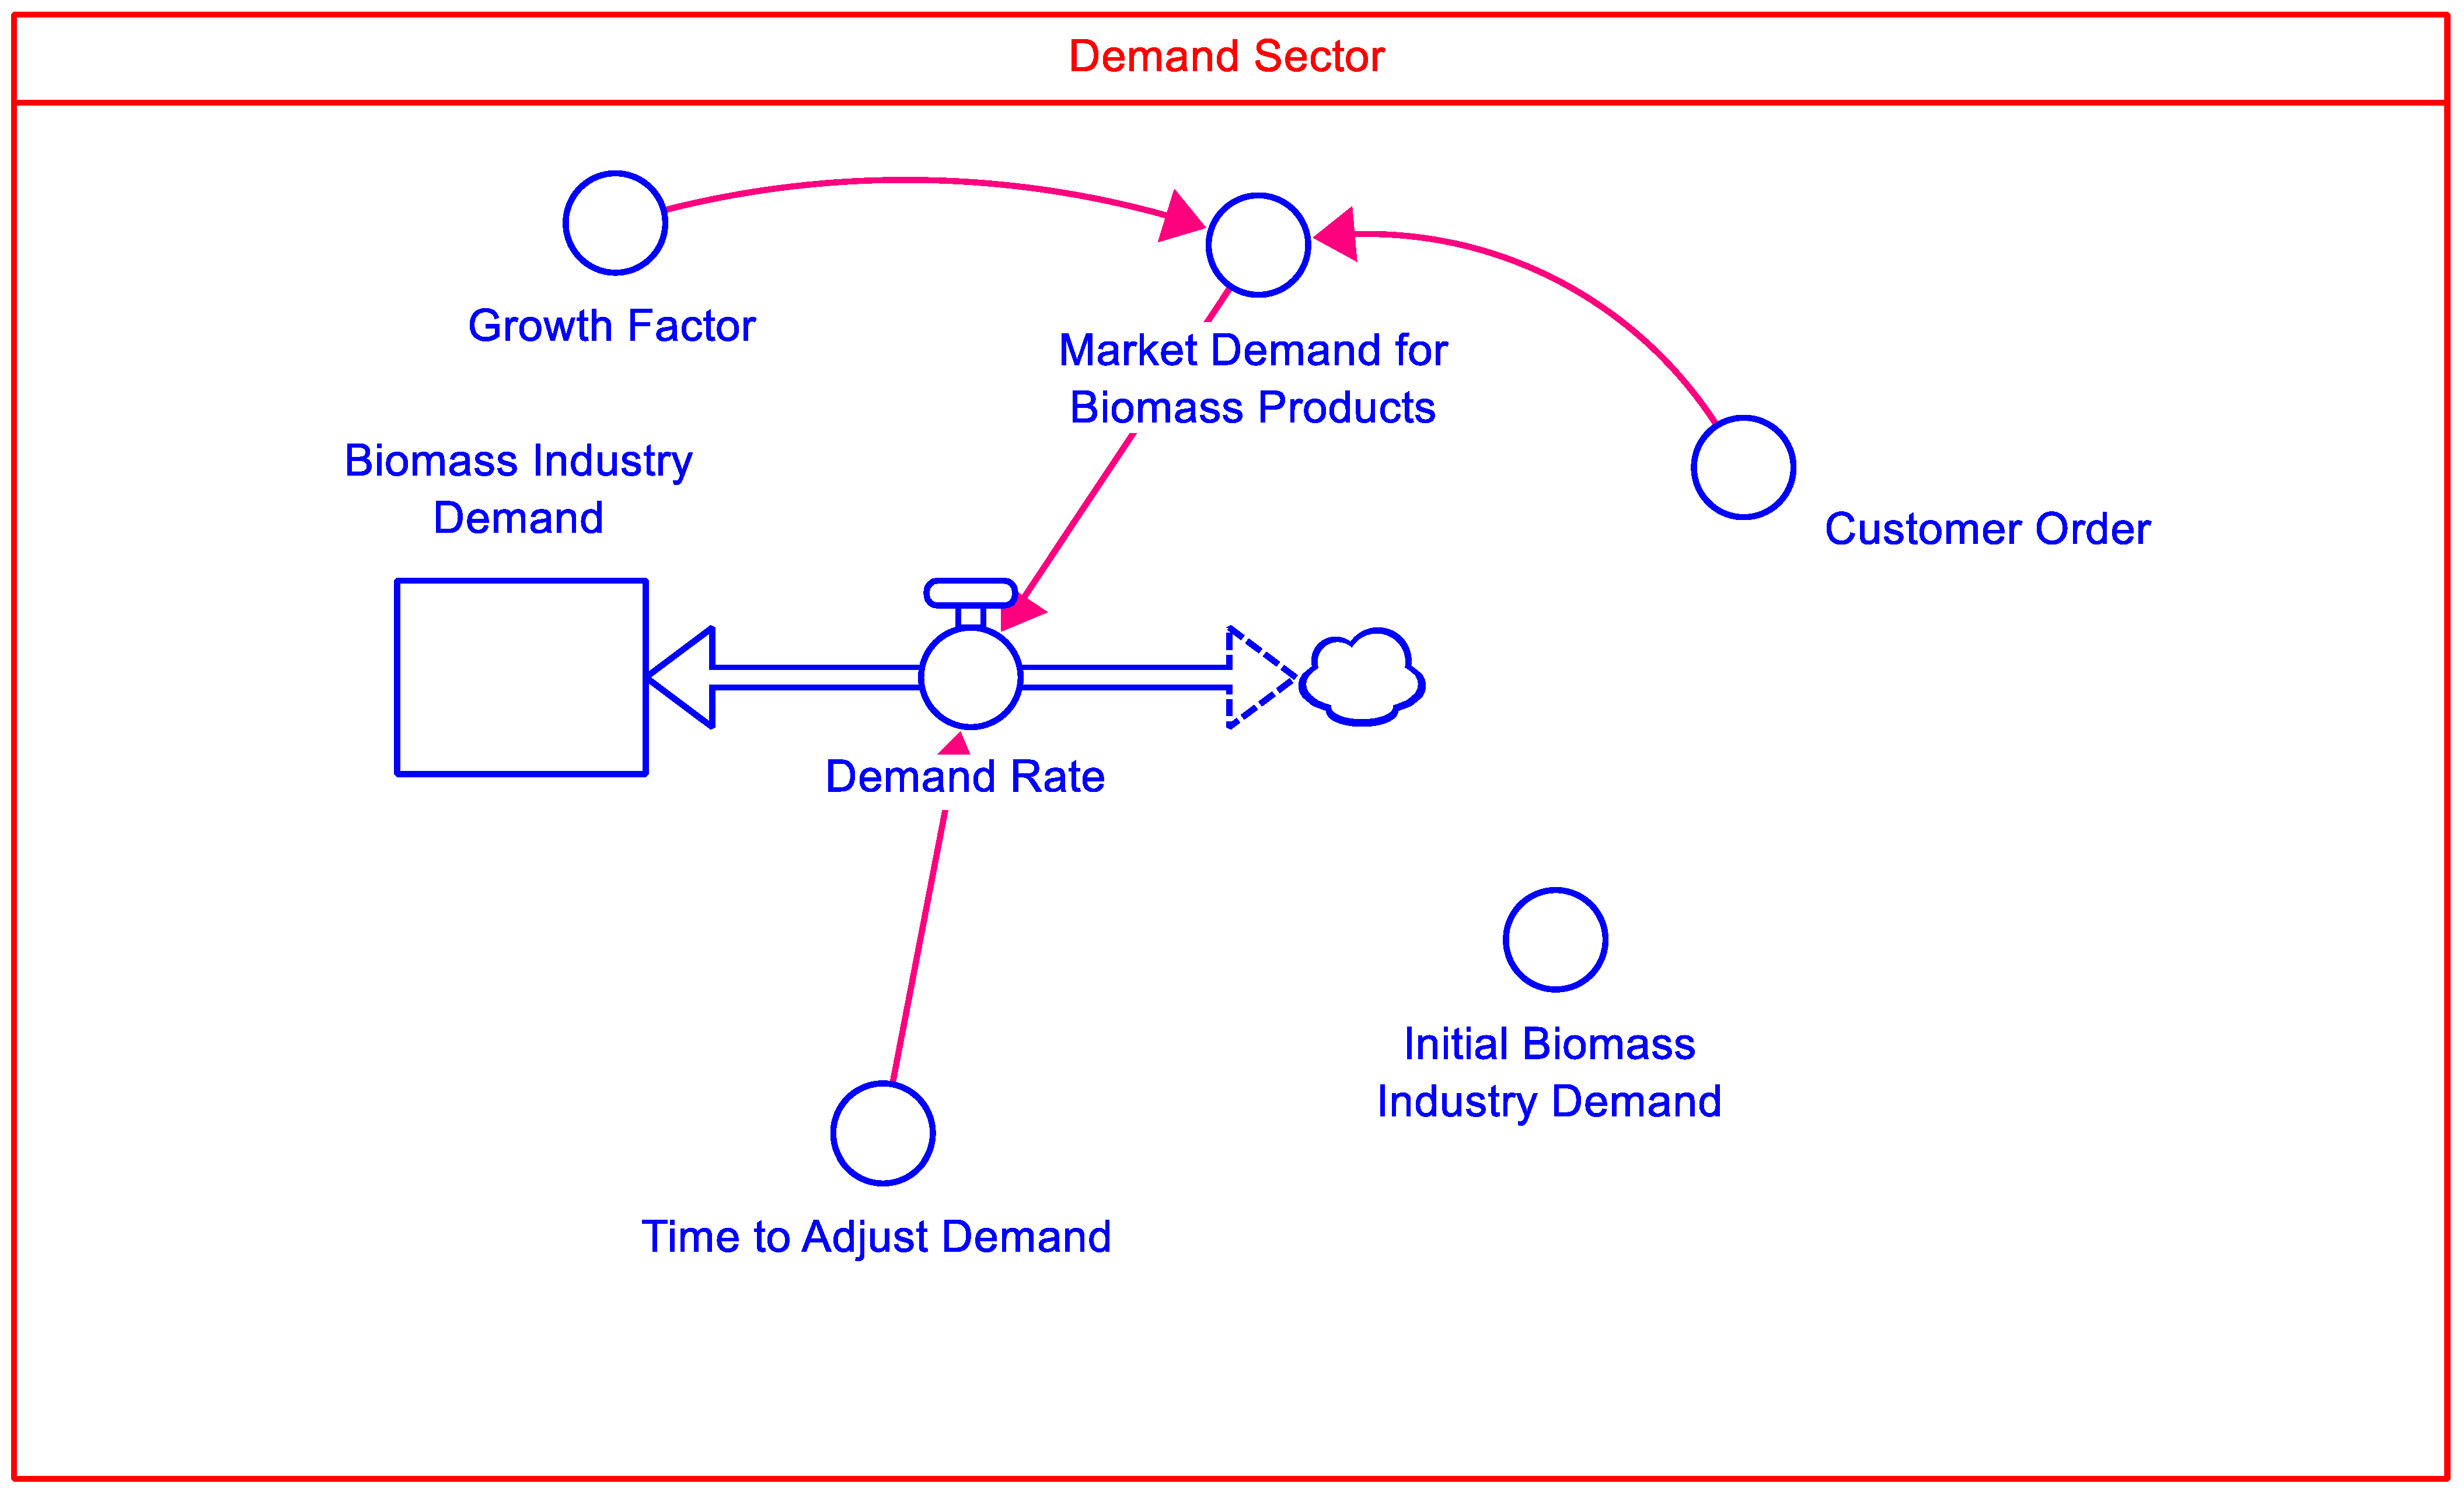
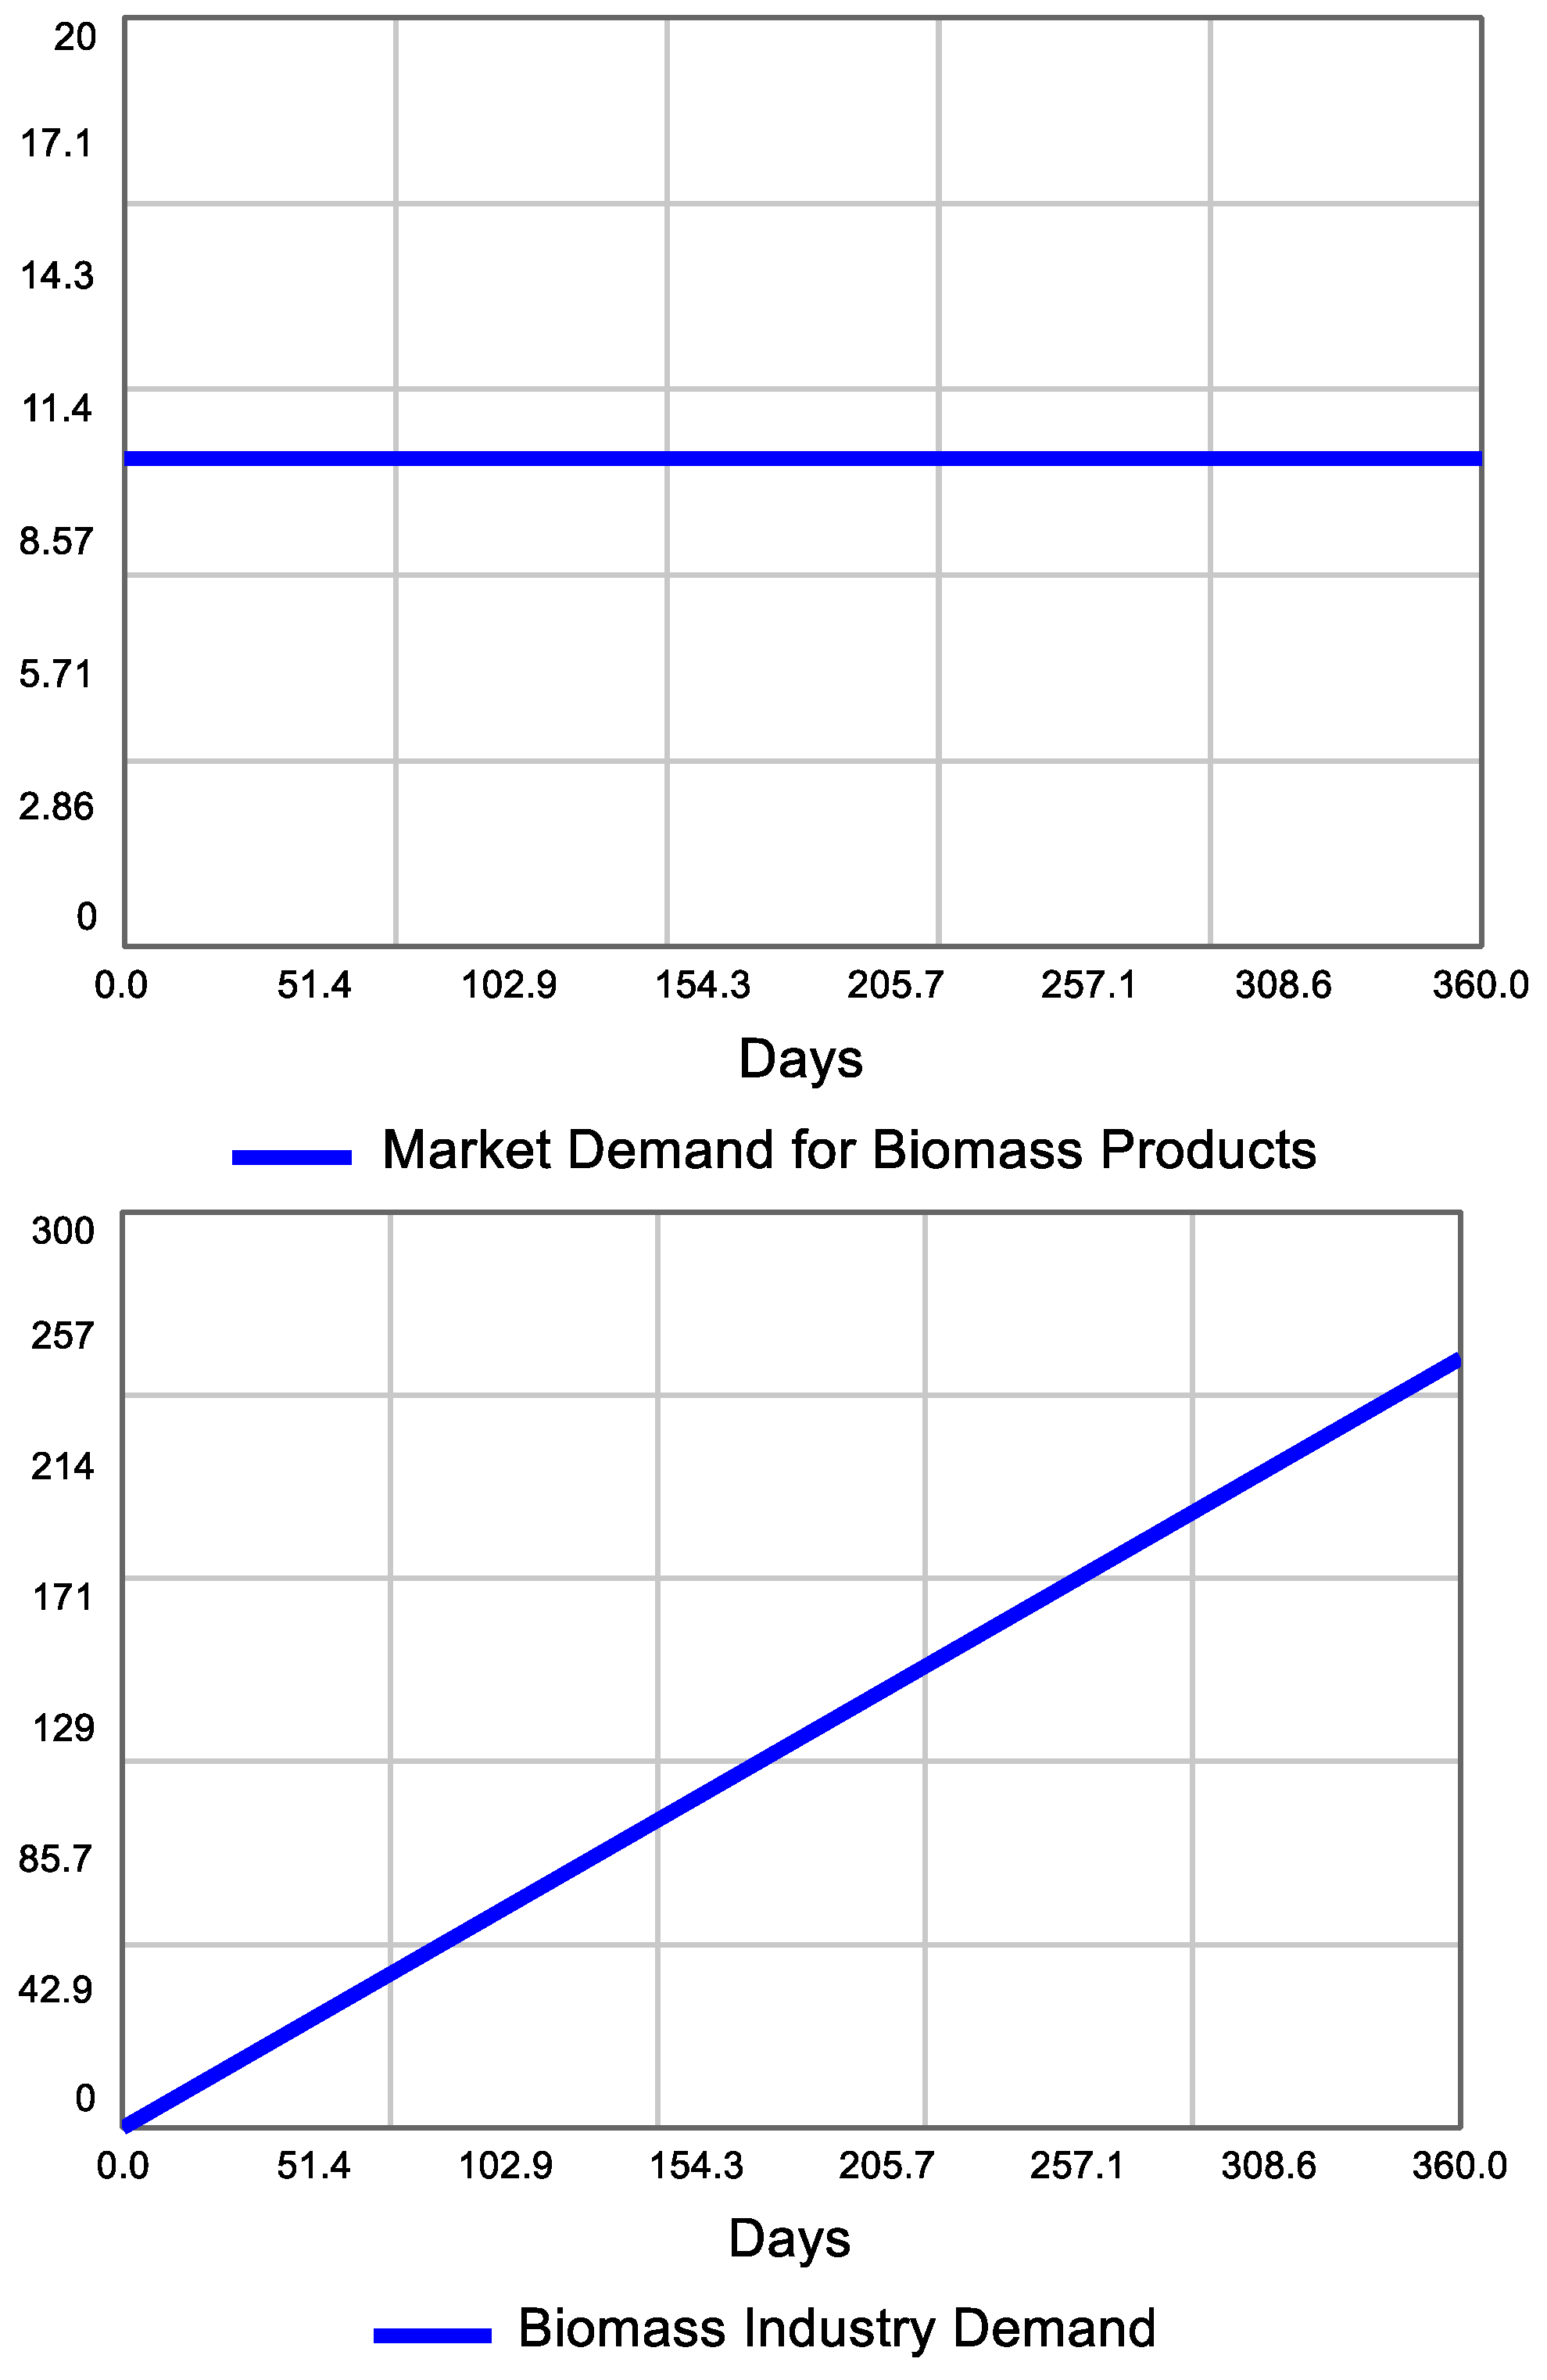
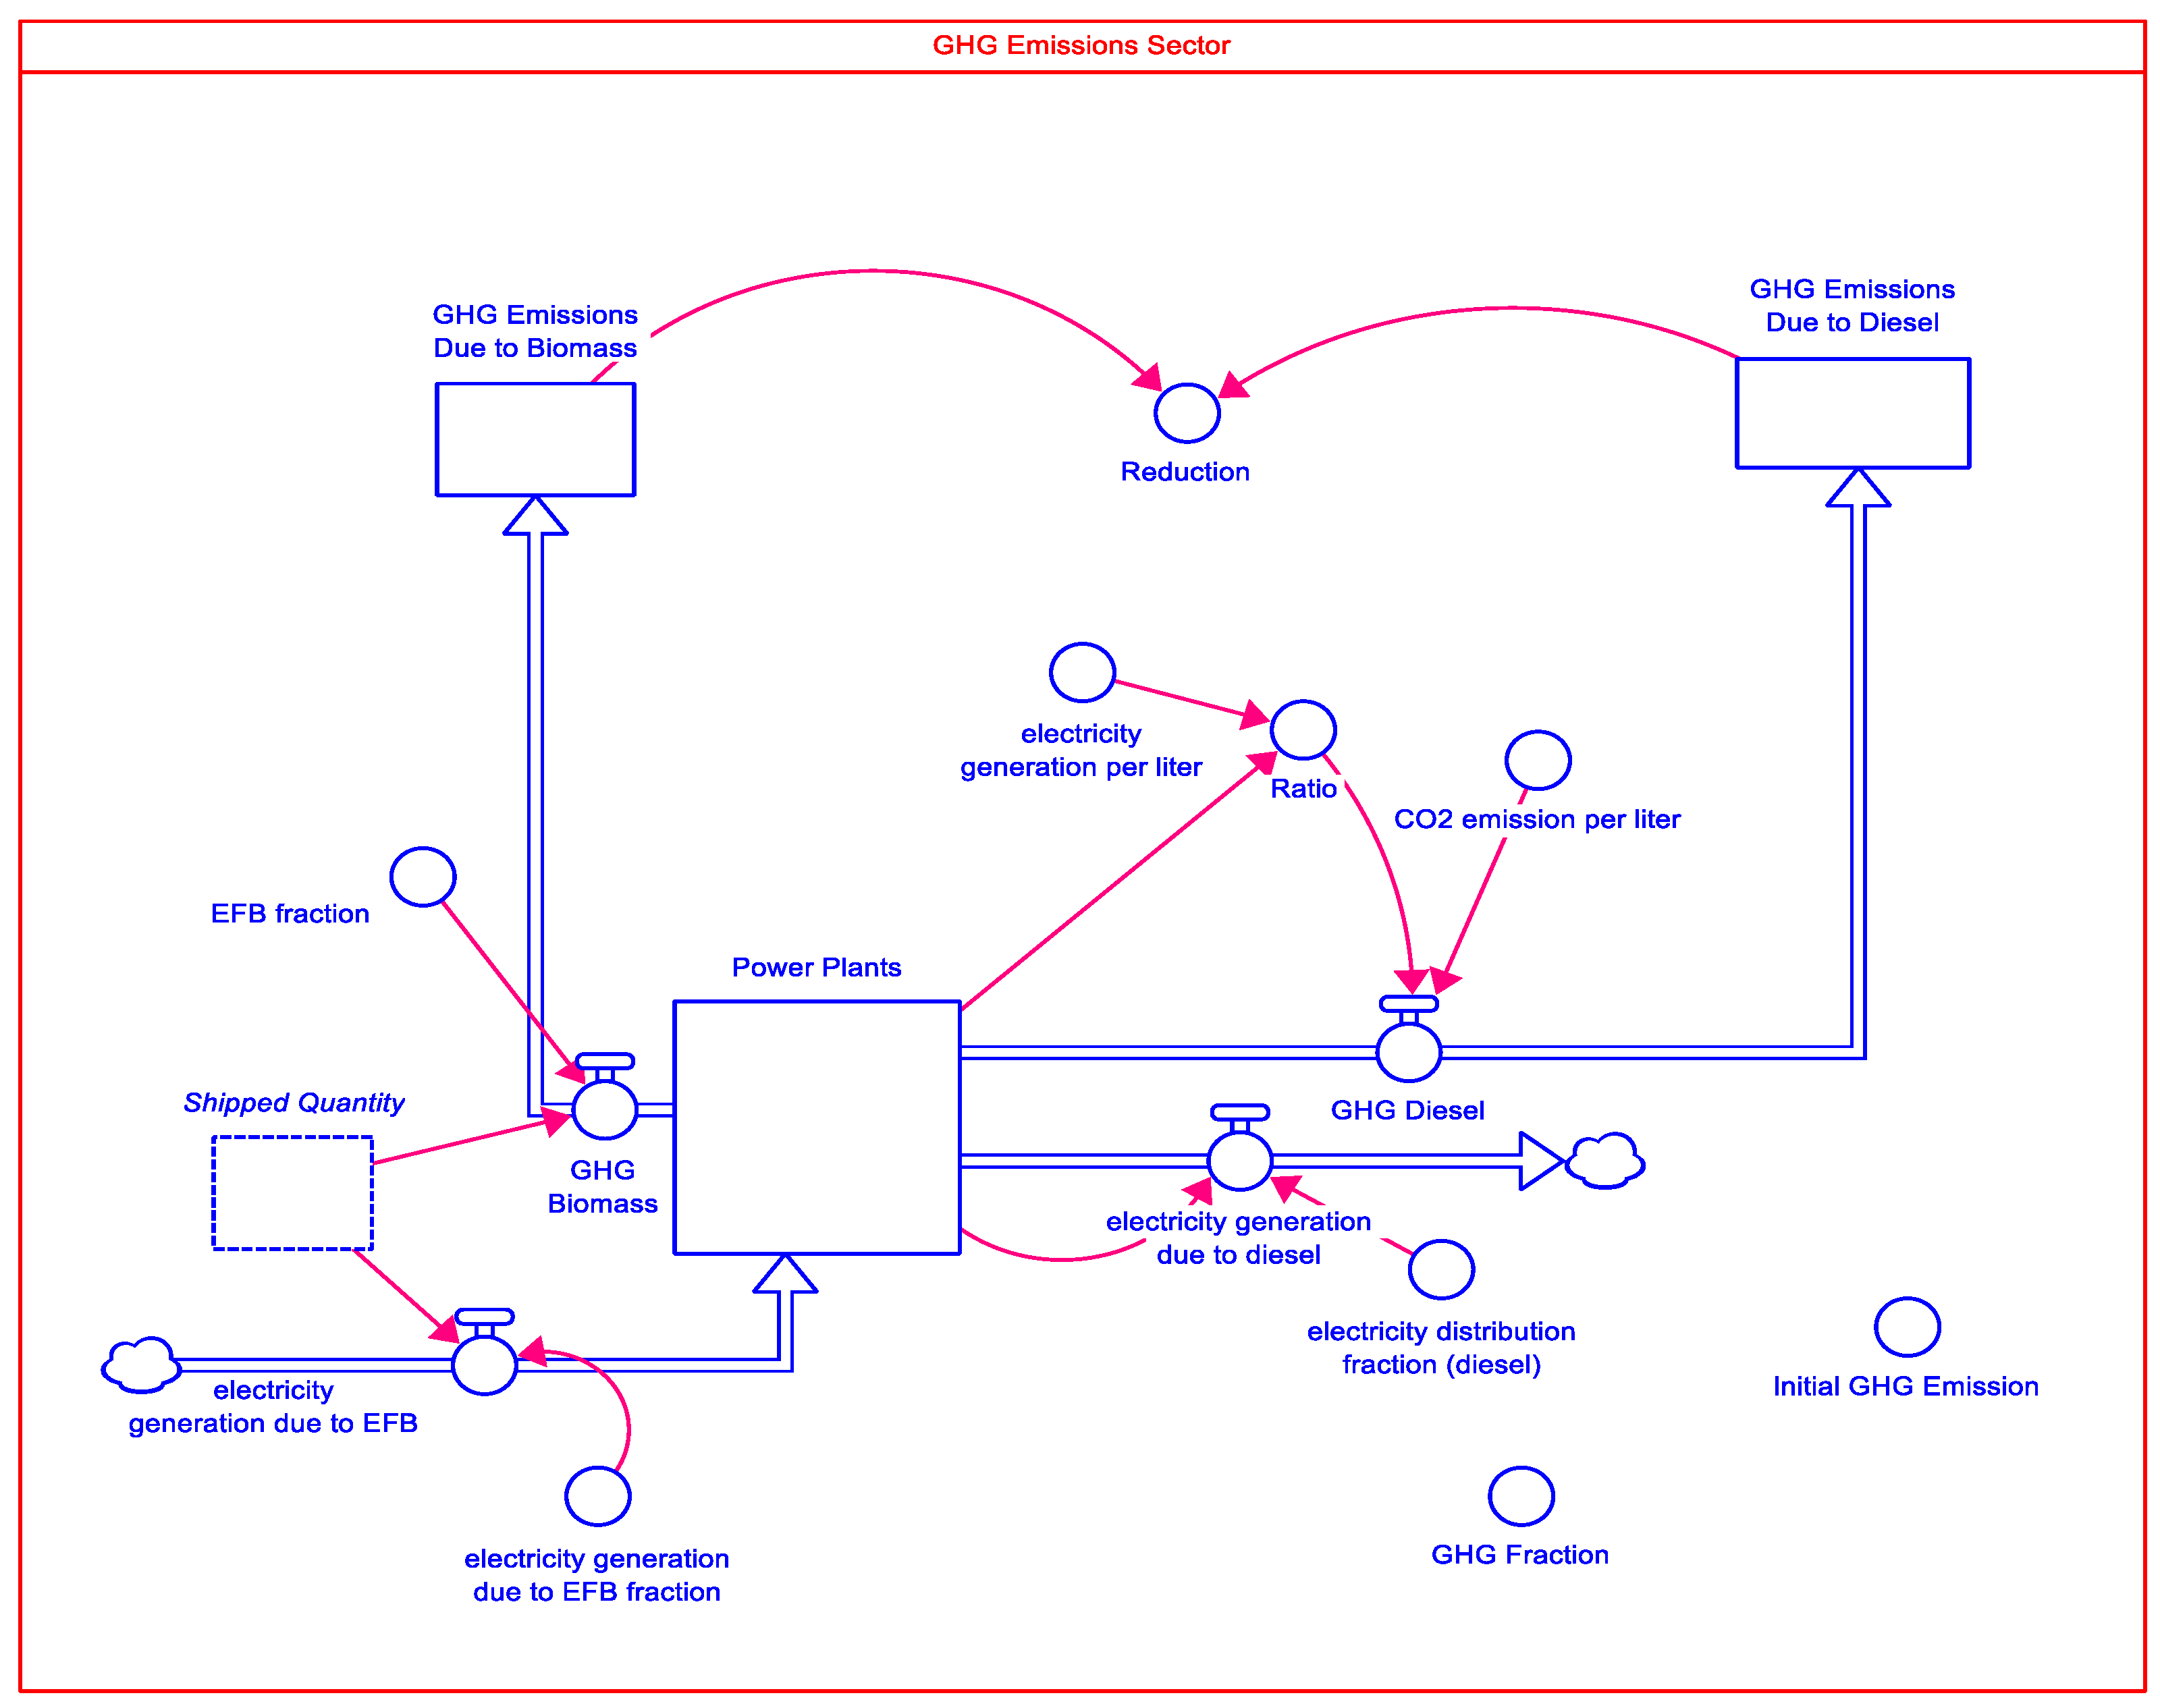
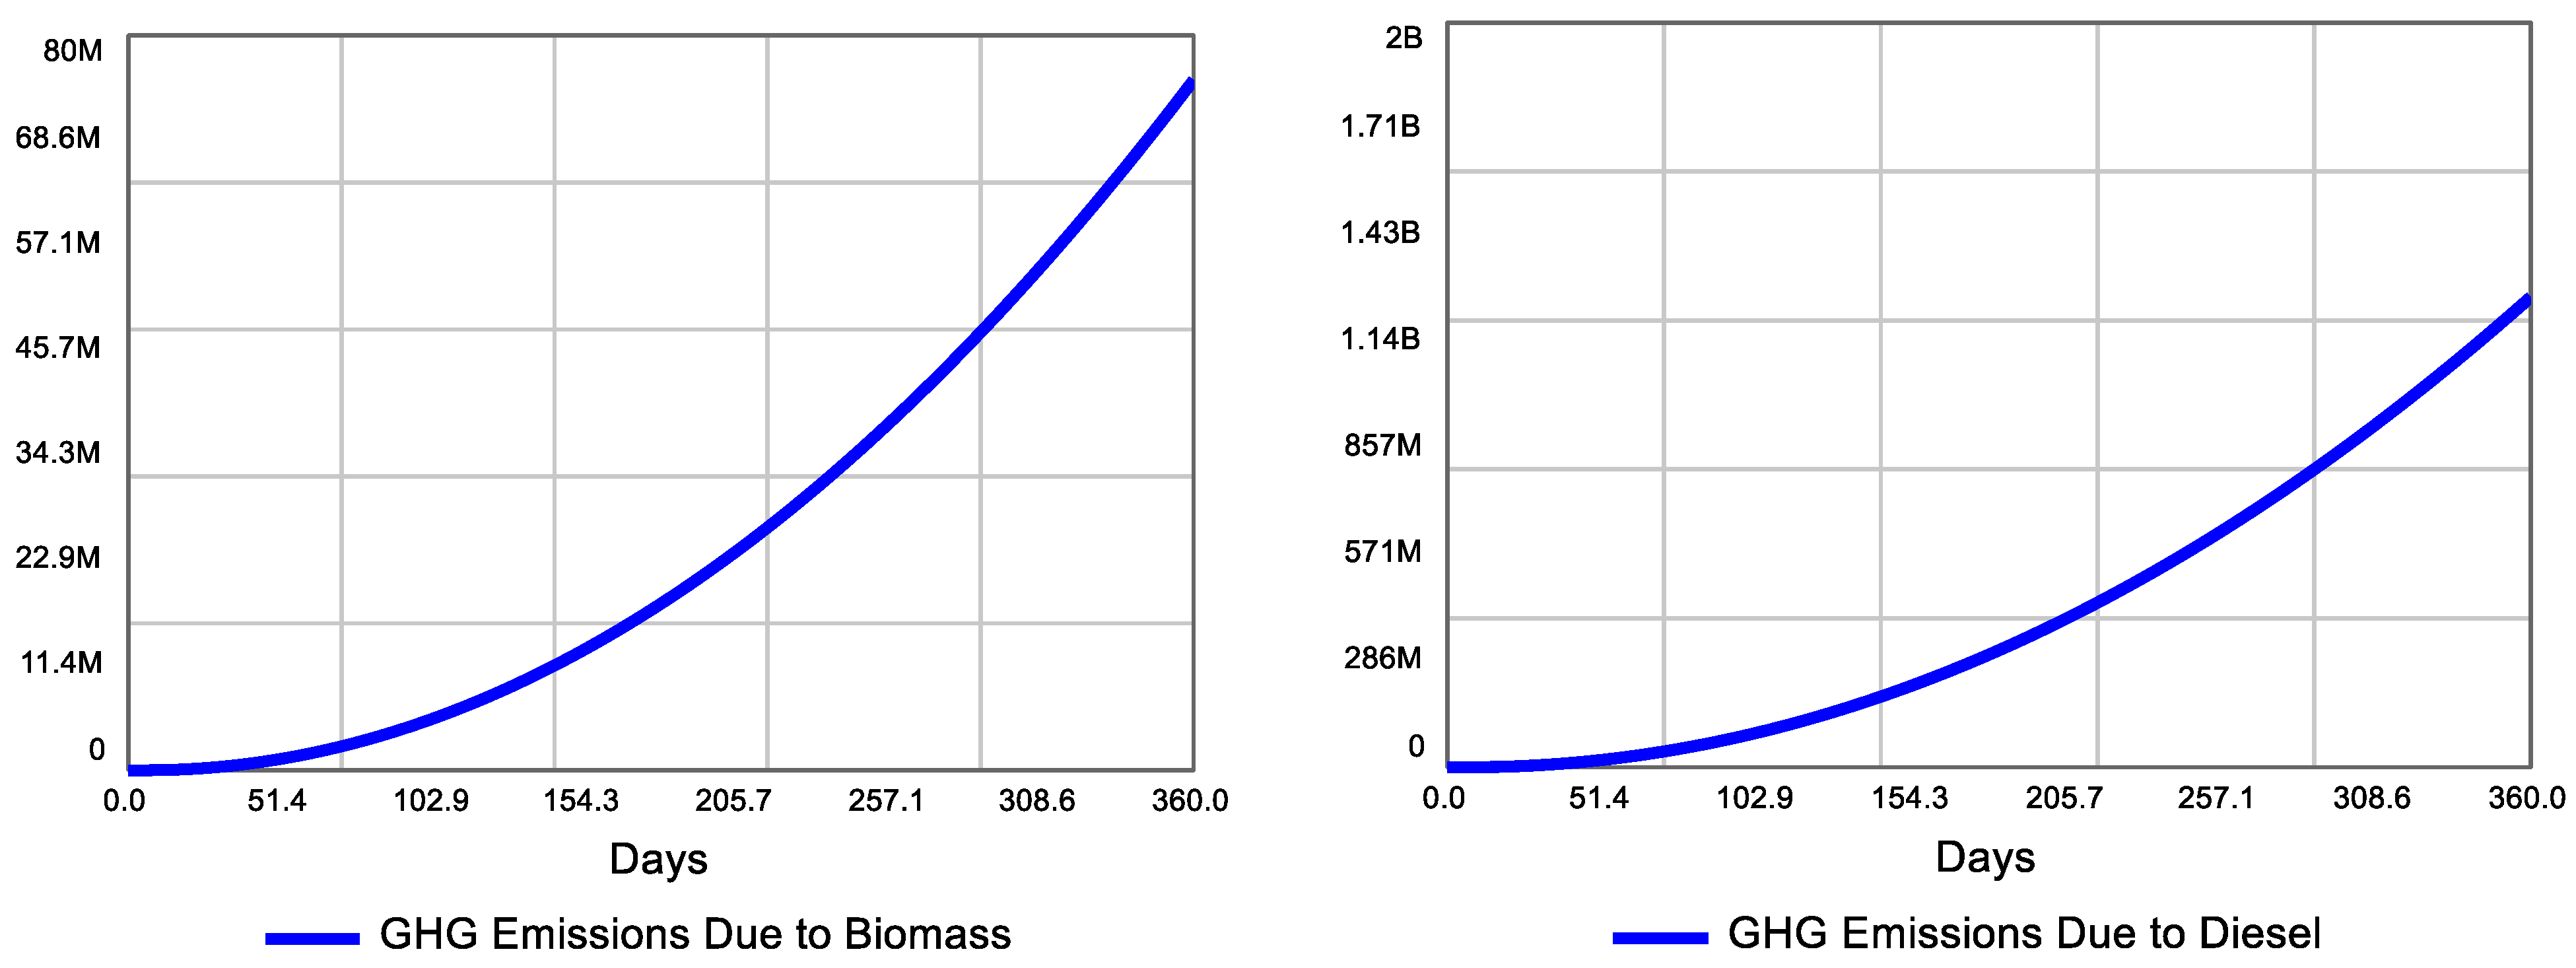
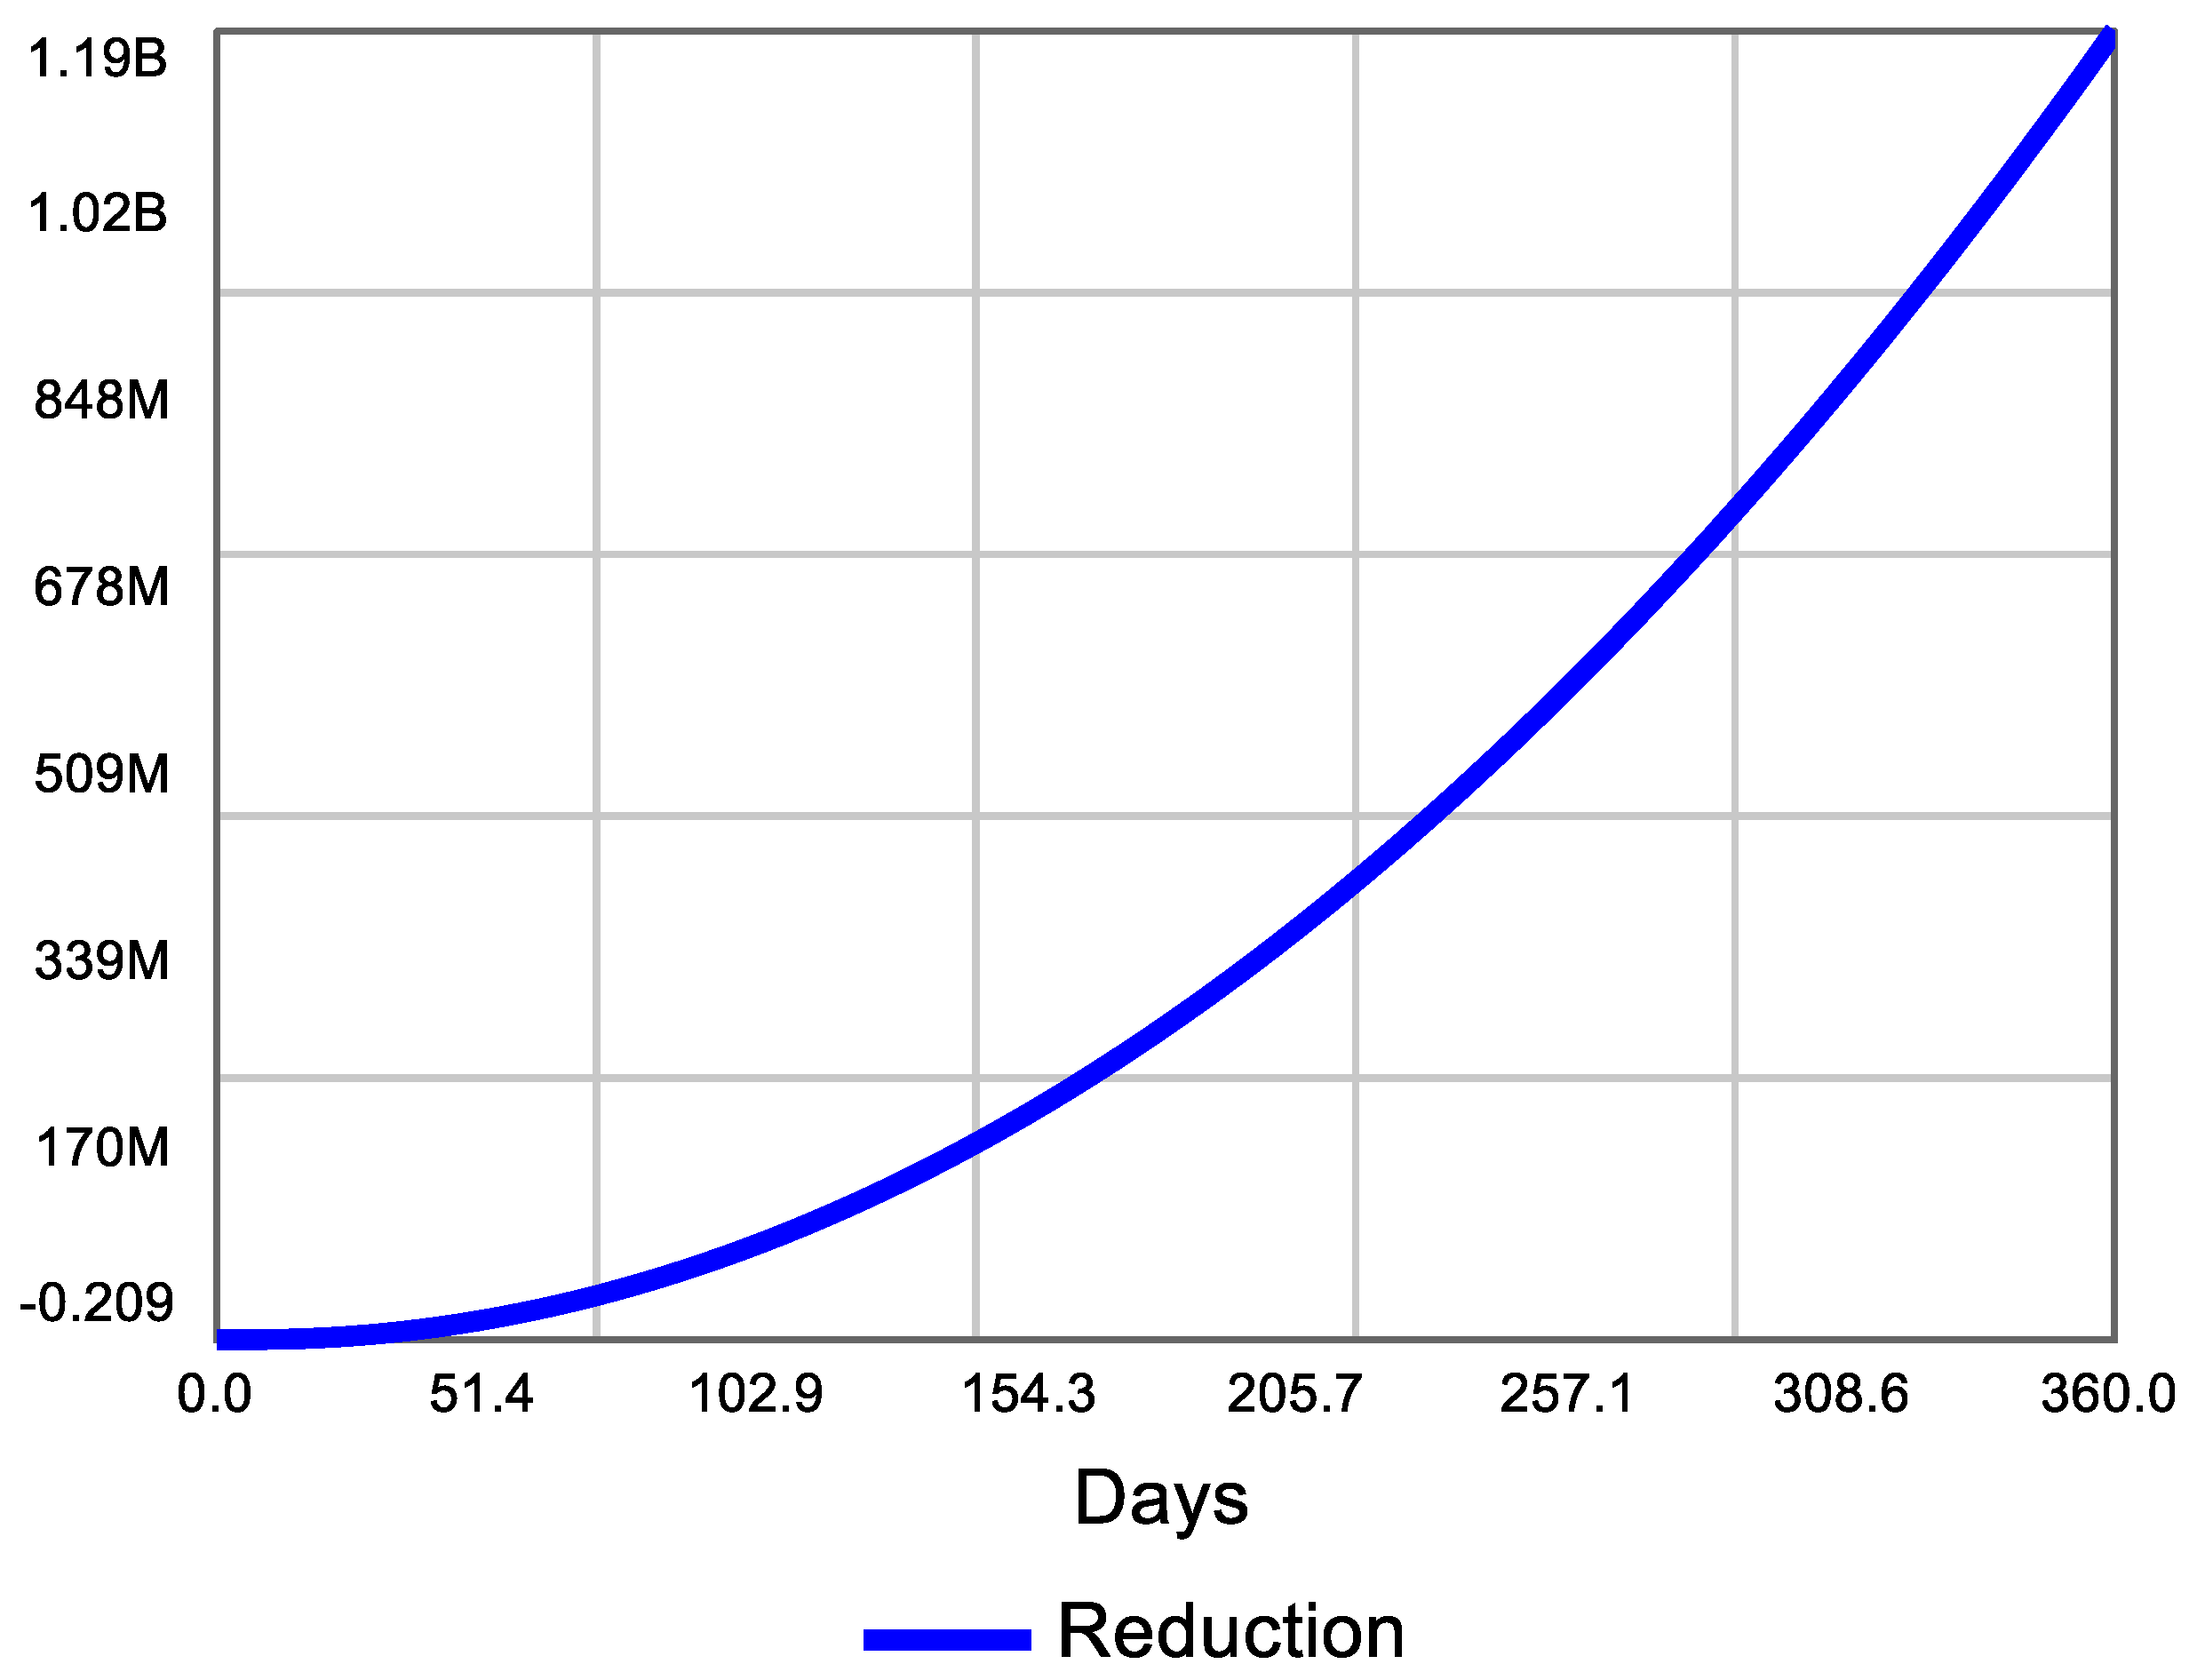
3.3.2. Stock and Flow Model of Integrated Biomass Logistics

The conceptual model of the EFB integrated biomass logistics and supply chain was converted into a stock and flow model. The stock–flow model of the integrated EFB biomass logistics is bifurcated into three sub-sectors: integrated biomass logistics, the demand sector and the greenhouse emission sector. The EFB integrated biomass logistics supply chain begins with the supply of EFB biomass material to the system by the suppliers. Palm oil material from the suppliers is transferred into biomass fields for pre-processing to reduce the moisture content from the EFBs. The biomass field also acts as a pre-processor and storage facility. Furthermore, the processed EFBs are transferred to the processing hub. The processing hubs convert dried EFBs into biomass products. These biomass products are delivered to logistics centres. The EFB biomass products are shipped to market as per customer demand. Figure 3 shows of stock and flow diagram.
The behaviour of the EFB simulation is shown in Figure 4, and the simulation ran for 360 days.
The graph of the incoming material stock shows a total of 10 tons of EFB entering the system. The behaviour of the biomass field stocks shows an increase as EFB materials enter the system. Similarly, the behaviour of the processing hubs and biomass products show a gradual increase due to inflows of the inputs. The biomass field stock, processing hub and biomass products achieve stability with a slight delay due to processing time in the plant. The behaviour of the logistics centre shows an increase in the stock after 13 days, whereas the shipped quantity stock increased gradually after the delay of 13 days. The shipped quantity graph increases in the system. The shipped quantity of EFB biomass products depends on market demand.
The demand sector stock and flow in Figure 5 explain the relationship. The demand rate for biomass depends on the market demand for biomass products. The EFB demand rate will increase the biomass industry demand. The simulation behaviour of the demand sector in Figure 6 shows a 10 ton daily demand for biomass products, whereas the biomass demand gradually increases due to biomass availability in the market. The behaviour of the shipped quantity is similar to the biomass industry demand because shipped quantity increases as the market demand.
The stock and flow model of the greenhouse emission sector (GHG) in Figure 7 shows that the shipped EFB biomass is used for electricity generation with EFB biomass. The GHG emission sector also shows the electricity generation due to diesel sources and EFB biomass. The GHG sector also shows a reduction in GHG due to the usage of EFB biomass.
The behaviour of GHG emissions due to diesel biomass and the GHG reductions are shown in Figure 8.
The greenhouse emission graphs in Figure 8 show that electricity generation using EFB biomass produces lower amounts of GHGs, whereas the use of diesel produces more GHGs. GHG emissions due to the use of diesel fuels are in the billions, while electricity generated using EFB biomass produces GHG emissions in the millions. The GHG reduction due to the use of EFB biomass is shown in the graph below. The behaviour of the emission reduction in Figure 9 shows that the utilization of EFBs as an energy source significantly reduces GHG emissions in the system.

4. Conclusions and Recommendation

This research has developed a dynamic simulation base model of EFB supply chain logistics to investigate the trends of GHG emissions for conventional fuel and EFB biomass fuel. The dynamic relationship of various factors in EFB-based biomass energy logistics was put into perspective to develop the model. The dynamic modelling of an EFB integrated biomass logistics system is imperative for understanding the way various key variables or factors influence each other in affecting the efficiency and effectiveness of the system. This study focuses on the reduction of GHG emissions as a main goal to achieve eco-friendly goals. The findings of this base model are consistent with the study performed by Zahraee et al. [12]. It also indicates the potential of further reducing GHG emissions through system dynamics modelling. The outcomes of this study are consistent with previous studies in various countries around the world that show a similar pattern with different biomass products. Unlike other studies, this base model integrates the storage and logistics activity of the EFB biomass supply chain to resolve storage and logistics-related issues. This base model is developed with the help of secondary data. This base model has shown a carbon emission reduction mechanism by integrating logistics and storage facilities. Currently, the technology conversion part and type of technology are not included in this base model. The findings of the base model provide opportunities for further research in biomass logistics to strive for zero-carbon emission goals. This study could be further enhanced by including conversion technology, types of technology, and the utilization of EFBs by each technology. The researchers could also include a cost analysis of all the inputs.

Author Contributions

Conceptualisation and Writing: I.A.A.; Methdology: I.Y.; Supervision: H.A. All authors have read and agreed to the published version of the manuscript.

Funding

This research was funded by Yayasan Universiti Teknologi Petronas grant no [015LCO-203]; This research is also funded by Universiti Teknologi Petronas international collaboration grant no [015MEO-265]; This research is also funded by Ministry of Higher Education (MOHE) FRGS grant [FRGS-SS01-UTP-02-2].

Data Availability Statement

Data can not provided for several reasons, privacy, initial model and its part of the study needed to complete. I can provide data upon completion of my work.

Conflicts of Interest

The authors declare no conflict of interest.

References

  1. Lüthi, D.; Le Floch, M.; Bereiter, B.; Blunier, T.; Barnola, J.-M.; Siegenthaler, U.; Raynaud, D.; Jouzel, J.; Fischer, H.; Kawamura, K.; et al. High-resolution carbon dioxide concentration record 650,000–800,000 years before present. Nature 2008, 453, 379–382. [Google Scholar] [CrossRef] [PubMed]
  2. Collins, M.; Knutti, R.; Arblaster, J.; Dufresne, J.-L.; Fichefet, T.; Friedlingstein, P.; Gao, X.; Gutowski, W.J.; Johns, T.; Krinner, G.; et al. Long-Term Climate Change: Projections, Commitments and Irreversibility. In Climate Change 2013: The Physical Science Basis. IPCC Working Group I Contribution to AR5; Cambridge University Press: Cambridge, UK, 2013. [Google Scholar]
  3. Rahman, H.A. Climate change scenarios in Malaysia: Engaging the public. Int. J. Malay-Nusant. Stud. 2018, 1, 55–77. [Google Scholar]
  4. Bin Ujang, D.S.I.D.Z. Green Technology Master Plan Malaysia (2017–2030); Ministry of Energy, Green Technology and Water (KeTTHA): Putrajaya, Malaysia, 2017. [Google Scholar]
  5. Farouk, H.; Zahraee, S.M.; Atabani, A.E.; Mohd Jaafar, M.N.; Alhassan, F.H. Optimization of the esterification process of crude jatropha oil (CJO) containing high levels of free fatty acids: A Malaysian case study. Biofuels 2020, 11, 655–662. [Google Scholar] [CrossRef]
  6. Umar, T.; Jennings, M.S.; Urmee, P. Generating renewable energy from oil palm biomass in Malaysia: The Feed-in Tariff policy framework. Biomass Bioenergy 2014, 62, 37–46. [Google Scholar] [CrossRef]
  7. Agensi Inovasi Malaysia. National Biomass Strategy 2020: New Wealth Creation for Malaysia’s Palm Oil Industry; Agensi Inovasi Malaysia: Cyberjaya, Malaysia, 2011. [Google Scholar]
  8. Guo, X.; Voogt, J.; Annevelink, B.; Snels, J.; Kanellopoulos, A. Optimizing Resource Utilization in Biomass Supply Chains by Creating Integrated Biomass Logistics Centers. Energies 2020, 13, 6153. [Google Scholar] [CrossRef]
  9. Zahraee, S.M.; Golroudbary, S.R.; Shiwakoti, N.; Stasinopoulos, P.; Kraslawski, A. Transportation system analysis of empty fruit bunches biomass supply chain based on delivery cost and greenhouse gas emissions. Procedia Manuf. 2020, 51, 1717–1722. [Google Scholar] [CrossRef]
  10. Malladi, K.T.; Sowlati, T. Biomass logistics: A review of important features, optimization modeling and the new trends. Renew. Sustain. Energy Rev. 2018, 94, 587–599. [Google Scholar] [CrossRef]
  11. Zahraee, S.M.; Golroudbary, S.R.; Shiwakoti, N.; Kraslawski, A.; Stasinopoulos, P. An investigation of the environmental sustainability of palm biomass supply chains via dynamic simulation modeling: A case of Malaysia. J. Clean. Prod. 2019, 237, 117740. [Google Scholar] [CrossRef]
  12. Zahraee, S.M.; Assadi, M.K. Applications and challenges of the palm biomass supply chain in Malaysia. ARPN J. Eng. Appl. Sci. 2017, 12, 5789–5793. [Google Scholar]
  13. Hamzah, N.; Tokimatsu, K.; Yoshikawa, K. Solid fuel from oil palm biomass residues and municipal solid waste by hydrothermal treatment for electrical power generation in Malaysia: A review. Sustainability 2019, 11, 1060. [Google Scholar] [CrossRef]
  14. Yue, D.; You, F.; Snyder, S.W. Biomass-to-bioenergy and biofuel supply chain optimization: Overview, key issues and challenges. Comput. Chem. Eng. 2014, 66, 36–56. [Google Scholar] [CrossRef]
  15. Kushairi, A.; Loh, S.K.; Azman, I.; Hishamuddin, E.; Ong-Abdullah, M.; Izuddin, Z.B.M.N.; Razmah, G.; Sundram, S.; Parveez, G.K.A. Oil palm economic performance in Malaysia and R&D progress in 2017. J. Oil Palm. Res. 2018, 30, 163–195. [Google Scholar]
  16. United Nations Industrial Development Organization. Industrial Steam System Optimization (SSO) Experts Training; United Nations Industrial Development Organization: Vienna, Austria, 2012. [Google Scholar]
  17. Zahraee, S.M.; Golroudbary, S.R.; Hashemi, A.; Afshar, J.; Haghighi, M. Simulation of manufacturing production line based on Arena. Adv. Mater. Res. 2014, 933, 744–748. [Google Scholar] [CrossRef]
  18. Shahpanah, A.; Hashemi, A.; Nouredin, G.; Zahraee, S.M.; Helmi, S.A. Reduction of ship waiting time at port container terminal through enhancement of the tug/pilot machine operation. J. Teknol. 2014, 68, 63–66. [Google Scholar] [CrossRef]
  19. Shahpanah, A.; Zahraee, S.M.; Shiwakoti, N. Optimization of ship traffic at berthing areas of maritime container terminals via Simulation Experiment. Logist. Res. 2019, 12, 2. [Google Scholar]
  20. Ravula, P.P.; Grisso, R.D.; Cundiff, J.S. Cotton logistics as a model for a biomass transportation system. Biomass Bioenergy 2008, 32, 314–325. [Google Scholar] [CrossRef]
  21. Zhang, F.; Johnson, D.M.; Johnson, M.A. Development of a simulation model of biomass supply chain for biofuel production. Renew. Energy 2012, 44, 380–391. [Google Scholar] [CrossRef]
  22. Windisch, J.; Röser, D.; Mola-Yudego, B.; Sikanen, L.; Asikainen, A. Business process mapping and discrete-event simulation of two forest biomass supplychains. Biomass Bioenergy 2013, 56, 370–381. [Google Scholar] [CrossRef]
  23. Bleijenbergh, I.; Korzilius, H.; Verschuren, P. The validity and utility of participatory versus databased research strategies. In Proceedings of the 27th International Conference of the System Dynamics Society, Albuquerque, NM, USA, 26–30 July 2009. [Google Scholar]
  24. Forrester, J.W. Information sources for modeling the national economy. J. Am. Stat. Assoc. 1980, 75, 555–574. [Google Scholar] [CrossRef]
  25. Schlüter, M.; Hirsch, D.; Pahl-Wostl, C. Coping with change: Responses of the Uzbek water management regime to socio economic transition and global change. Environ. Sci. Policy 2010, 13, 620–636. [Google Scholar] [CrossRef]
  26. Hovelynck, J.; Dewulf, A.; Francois, G.; Taillieu, T. Interdisciplinary knowledge integration through group model building: Recognizing dualities and triadizing the conversation. Environ. Sci. Policy 2010, 13, 582–591. [Google Scholar] [CrossRef]
  27. Ryan, G. Guidance Notes on Planning a Systematic Review; James Hardiman Library: Galway, Ireland, 2010. [Google Scholar]
  28. Zurynski, Y. Writing a Systematic Literature Review, Resources for Students and Trainees; APSU: Clarksville, TN, USA, 2014. [Google Scholar]
  29. Maani, K.E.; Cavana, R.Y. Systems Thinking, System Dynamics: Managing Change and Complexity; Pearson Education: Auckland, New Zealand, 2007. [Google Scholar]
Figure 1. EFB biomass supply chain operational components.
Resources 12 00053 g001
Figure 2. Causal loop diagram of EFB biomass logistics supply chain.
Resources 12 00053 g002
Figure 3. Stock and flow diagram of EFB biomass logistics supply chain.
Resources 12 00053 g003
Figure 4. The behaviour of EFB integrated biomass logistics.
Resources 12 00053 g004aResources 12 00053 g004b
Figure 5. Stock and flow diagram of EFB biomass demand sector.
Resources 12 00053 g005
Figure 6. The behaviour of EFB biomass demand sector.
Resources 12 00053 g006
Figure 7. Stock and flow diagram of GHG emissions.
Resources 12 00053 g007
Figure 8. The behaviour of GHGs emissions due to EFB biomass and diesel.
Resources 12 00053 g008
Figure 9. The behaviour of electricity generation using EFB biomass and GHG reduction.
Resources 12 00053 g009
Table 1. Steps involved in system dynamics modelling.
StepsMethodObjectives
Resources 12 00053 i001Systematic literature reviewTo identify the problem.
Document-based modelling approachTo determine the key variables.
1. Causal loop through mental modelling
2. Stock and flow model
To develop an integrated logistic supply chain model.
Table 2. The variables identified using DBM.
StockFlow
Biomass fieldsIncoming material
Processing hubTransportation
Biomass productsProcessing rate
Logistics centersDelivery rate
Shipped quantity (Shipped QTY)Shipment rate
Biomass industry demandDemand rate
Power plantsGHG biomass
GHG emissions due to biomassElectricity generation rate due to diesel
GHG emissions due to dieselElectricity generation rate due to biomass
Reduction
Disclaimer/Publisher’s Note: The statements, opinions and data contained in all publications are solely those of the individual author(s) and contributor(s) and not of MDPI and/or the editor(s). MDPI and/or the editor(s) disclaim responsibility for any injury to people or property resulting from any ideas, methods, instructions or products referred to in the content.

