Article

Assessment of Surfactant Removal Capacity and Microbial Community Diversity in a Greywater-Treating Constructed Wetland

by
Robelio Mascoli Junior
1,
Caique Morelo Passoni
1,
Filipe Martins Santos
2,
Fernando Silva Bernardes
1,
Fernando Jorge Correa. Magalhães Filho
3 and
Paula Loureiro Paulo
1,*
1
Faculty of Engineering, Architecture and Urbanism and Geography, Federal University of Mato Grosso do Sul, Campo Grande 79070-900, MS, Brazil
2
Postgraduate Programme in Environmental Sciences and Agricultural Sustainability, Dom Bosco Catholic University, Campo Grande 79117-900, MS, Brazil
3
Institute of Hydraulic Research, Federal University of Rio Grande do Sul, Porto Alegre 91509-900, RS, Brazil
*
Author to whom correspondence should be addressed.
Resources 2023, 12(3), 38; https://doi.org/10.3390/resources12030038
Submission received: 27 January 2023 / Revised: 10 March 2023 / Accepted: 13 March 2023 / Published: 19 March 2023
(This article belongs to the Special Issue Editorial Board Members' Collection Series: Water Resources)

Abstract

:
Surfactants are among the main chemical contaminants in greywater (GW) and can cause severe health issues in humans and aquatic organisms. We assessed the performance of a multistage constructed wetland system (EvaTAC) for GW treatment and capacity of the microbial community in linear alkyl benzene sulfonate (LAS) biodegradation. Physicochemical analyses were performed over 497 d, and biomass samples were collected for high-throughput DNA sequencing. The system was predominated by anaerobic conditions and received an average chemical oxygen demand (COD) and LAS of 374 and 32 mg·L−1, with removal rates of 66% and 43%, respectively. A positive correlation between COD and LAS suggested COD as a design parameter for LAS removal. We identified microbial genera participating in hydrolysis, fermentation, syntrophy, acetogenesis, methanogenesis, surfactant degradation, and sulphate reduction. Among the 15 surfactant-degrading genera, Pseudomonas was predominant. Community richness and diversity indices were comparable between subsystems, with a slight decrease in diversity observed towards the outlet. Among the LAS degraders, Rhodopseudomonas palustris had the highest relative abundance of operational taxonomic unit (OTU)s in all samples and the highest richness in the anaerobic chamber. The patterns in microbial community composition and environmental conditions suggest that LAS biodegradation occurred throughout the EvaTAC system.

1. Introduction

Greywater is household wastewater that excludes urine and faecal-containing fractions. The main compounds in greywater include carbohydrates (derived from food), fats and oils, proteins, glycerides, surfactants (anionic, cationic, and amphoteric from shampoo and detergent), and soap [1]. Given their widespread use, surfactants are among the main chemical contaminants in greywater. According to Ramprasad and Philip [2], even at low concentrations, these pollutants can cause severe health issues in humans and aquatic organisms: in fish, they can cause excess mucus secretion, damage gills, and alter swimming behaviour; in humans, they mostly cause skin irritation and allergic dermatitis, but in chronic conditions they can lead to more severe disorders, such as cancer [2]. Linear alkyl benzene sulfonate (LAS)—the most commonly used surfactant in laundry and dishwashing agents (~80% of all household cleaning agents)—has an annual global production rate of ~4 million tons [3,4]. LAS is mostly detected in soils, sediments, and sludge with concentrations ranging from 0 to 16,000 mg·kg−1 and in treated and surface waters at concentrations of 135 µg·L−1 to 21 mg·L−1 [5]. Different studies on greywater have shown a range of LAS concentrations in different fractions, varying from 0.1 mg·L−1 to 436 mg·L−1 [6,7,8,9,10,11,12,13].
Biodegradation by aquatic microbes is essential for treating LAS in effluents. These microbes can utilise LAS as metabolic substrates or co-metabolise LAS through initial reactions in catabolic pathways. The most important influencing factors are chemical structure and the aerobic/anaerobic conditions. Under aerobic conditions, the co-metabolism of LAS generates shorter homologous chains. LAS can also be mineralised into CO2 and H2O, but this requires the contribution of several bacterial species. Degradation processes in anaerobic systems depend on alternative pathways that utilise sulphate, nitrate, carbonate, hydrogen sulphide (H2S), molecular nitrogen (N2), methane (CH4), and ammonia (NH3) [14].
Considering that LAS is readily biodegradable [15], biological treatment offers a promising approach that benefits human and environmental health at little cost. Among the biological treatment technologies, several configurations of nature-based solutions are being applied to treat greywater, especially constructed wetlands (CWs) [16], nevertheless, there are few publications available in the literature regarding the removal of surfactants by this technology. They deal with different system configurations, environmental conditions, wastewater composition, filter media, plants, and operational parameters. Thomas et al. [17] used mesocosms fed with distilled water with 5 mg·L−1 of LAS to study the role of plants in HSSF-CW on the treatment of LAS. With an HRT of 13.8 days, they reached removal rates over 95% (4.75 mg·L−1). Their results indicate that the presence of vegetation enhances LAS removal, with higher biomass systems associated with higher LAS removal rates. LAS removal increased with time and was attributed to acclimatisation of the microcosm bacterial community to the surfactant. Ramprasad et al. [18] also observed better removal over time when using a green rooftop water-recycling CW to treat GW with average LAS concentration of 25.5 mg·L−1, operating with HRT varying from 0.7 to 1.3 d. The LAS removal varied from 60–80% during the start-up phase and further improved, reaching up to 96% (24.5 mg·L−1). The authors found that the removal of LAS was also affected by solar radiation and water temperature. Gross et al. [19] used a system based on a combination of a vertical-flow constructed wetland with water recycling and trickling filter to treat GW with an influent LAS concentration of 7.9 ± 1.7 mg·L−1, operated at a flow rate of 390 L. h−1. The system was able to remove over 90% (7.1 mg·L−1) of LAS within 8 h of recycling. Masi et al. [20] presented results of a full-scale HSSF-CW combined with sand filter and UV disinfection. The LAS inlet concentration was very low (average 0.3 mg·L−1) with virtually total removal.
Our research group is consolidating 12 years of research on a nature-based wetland system called Evapotranspiration and Treatment of Greywater (EvaTAC)—a multistage system composed of up-flow evapotranspiration and treatment tank (CEvaT) with an inbuilt anaerobic chamber (AnC) and a horizontal subsurface flow CW (HSSF-CW) [21]. Previous studies showed that each of the two subsystems(CEvaT + HSSF-CW) complemented the functioning of the other, and the robustness of the system could be attributed to the inbuilt AnC [22]. Preliminary microbiological studies showed that the community structure in each zone of the EvaTAC was unique and contributed to the development of different biogeochemical cycles inside the system [23]. In the present study, we investigated the performance of the EvaTAC system in surfactant removal, especially the dynamics of the microbial community involved in LAS biodegradation.

2. Material and Methods

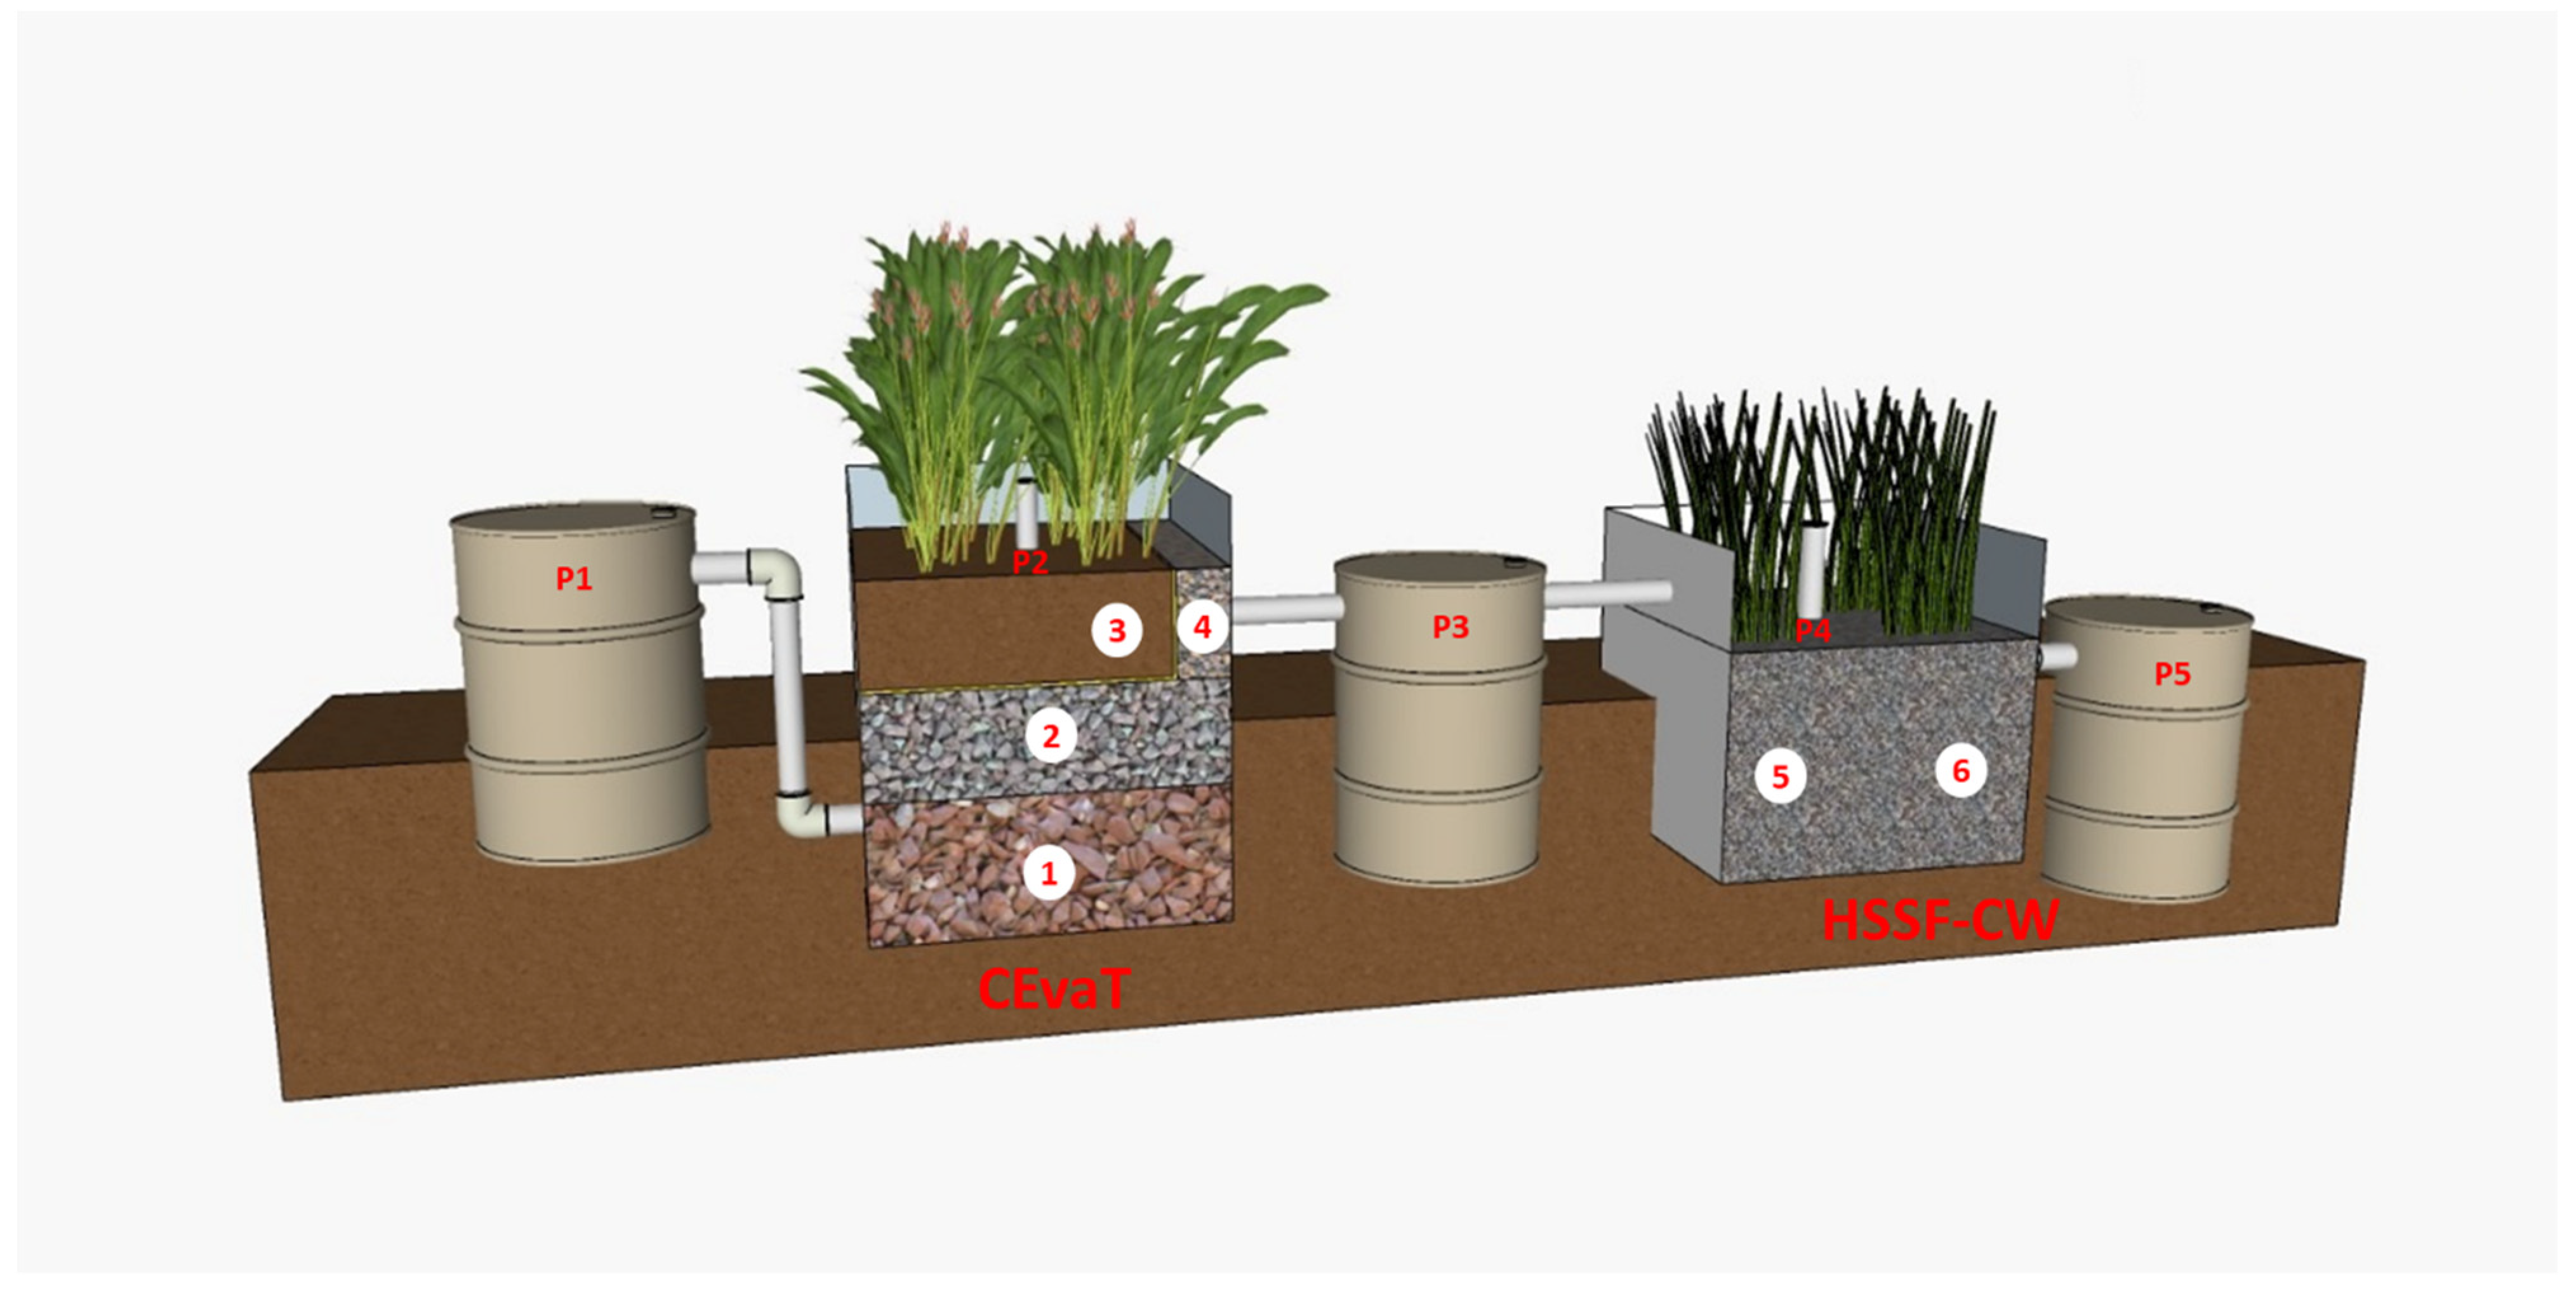
2.1. Experimental Setup and Design

The EvaTAC was built from fibre glass to treat the greywater of an experimental bathroom (BanhEX) at UFMS campus, Brazil (20°31′ S and 54°39′ W). The BanhEX had a mean flow of 0.15 m3·d−1 generated by two showers, two lavatories, two laundry basins, and one washing machine. The dimensions (L × W × D) of the EvaTAC system units (subsystems) were 1.00 m × 1.00 m × 1.20 m for the CEvaT and 1.00 m × 1.00 m × 0.70 m for the HSSF-CW. The CEvaT was layered (from bottom to top) with gravel n° 4 (layer height: 0.40 m), porosity (k) = 0.46, d10 = 60 mm, d60 = 100 mm, and uniformity coefficient (Uc) = 1.67; gravel n° 2 (layer height: 0.30 m), k = 0.50, d10 = 15 mm, d60 = 22 mm, and Uc = 1.47; and 0.30 m of soil on top of a geotextile blanket. The outlet layer (0.25 m × 1.00 m × 0.25 m) was filled with blast furnace slag (particles sieved to 19.1 mm), with k = 0.46, d10 = 8 mm, d60 = 20 mm, and uniformity coefficient = 2.5. The inbuilt anaerobic digestion chamber (AnC) had a triangular shape with 0.8 m2 of base area with 0.90 m height. For the distribution of GW to the substrate along the CEvaT, 20 mm holes spaced every 0.15 m were perforated on the surface of the AnC from a height of 18 cm (bottom to top). The HSSF-CW was filled with fine gravel (layer height: 0.50 m) with k = 0.49, d10 = 5 mm, d60 = 8 mm, and uniformity coefficient = 1.6. We planted 16 seedlings of Canna x generalis in the CEvaT and 16 seedlings of Equisetum giganteum in the HSSF-CW. The plants were distributed in four rows, 0.20 cm apart, with four seedlings per row. The operational volumes were 519.9 L and 197.3 L for the CEvaT and HSSF-CW, respectively.

2.2. Mode of Operation, Monitoring, and Analytical Methods

The system was monitored for 497 d. Samples were collected weekly at different sampling points (Figure 1). The analysed parameters were chemical oxygen demand (COD), redox potential (ORP), temperature, pH, and anionic surfactant (LAS) load. Samples for COD and LAS were collected at three sampling points: the inlet of the CEvaT (P1), outlet of the CevaT (inlet of the HSSF-CW) (P2), and outlet of the HSSF-CW (P3) (Figure 1).
The redox potential, temperature, and pH were measured at four different points: P1, P2 (piezometer inside the CEvaT), P3 (piezometer inside the HSSF-CW), and P4. All parameters were analysed according to standard methods for the examination of water and wastewater, as stipulated by the American Public Health Association [24].
Quantitative parameters, such as peak flow and organic and hydraulic loading rates, were calculated as previously described [25]. Influent flow was recorded using multijet water meters (Actaris®, Campo Grande, Brazil) installed for the bathroom and laundry room.

2.3. Microbial Study

Biofilm samples were collected from different zones in each subsystem (Figure 1), as previously described [23]. Soil samples were not distinguishable between the rhizosphere and rhizoplane. Each sample consisted of three subsamples (250 g each) collected at a horizontal distance of approximately 0.30 m apart. The subsamples were stored in Ziplock plastic bags and immediately placed on ice.
To obtain representative samples of the zones in the subsystems, two procedures were applied: For soil and sludge samples, the subsamples were placed in a bowl and homogenised manually with a spreader, after which 400 g of sample was withdrawn. For the courser material, gravel and slag fragments with a thicker layer of biofilm were selected to comprise the 400 g sample. Samples used for microbial community analysis were frozen at −4 °C until further use.

2.3.1. DNA Extraction, PCR Amplification, and High-Throughput Sequencing

The samples were transferred to a vessel with Milli-Q water and shaken manually every 20 min for 3 h. The cells were removed by centrifugation as previously described [26], with modifications. After centrifugation, 1.0 mL of lysis buffer (500 mM NaCl, 50 mM Tris-HCl, pH 8.0, 50 mM EDTA, and 4% SDS) and 0.4 g sterile zirconia beads (0.3 g of 0.1 mm and 0.1 g of 0.5 mm) were mixed into the samples and incubated for 20 min at 70 °C with gentle agitation every 5 min. The mixture was centrifuged at room temperature for 10 min and 13,600 rpm in an Eppendorf 5804 vessel (Hamburg, Germany). The supernatant was transferred to a new tube, and an equal volume of isopropanol was added. After 20 min at room temperature, the mixture was centrifuged for 10 min at 13,600 rpm and the pellet was resuspended in 750 μL TE. Potassium acetate was added at a final concentration of 0.5 M, and the mixture was incubated on ice for 5 min and centrifuged for 10 min at 13,600 rpm, after which the supernatant was transferred to a new tube. This solution was extracted twice with an equal volume of chloroform:isoamyl alcohol (24:1). The final aqueous supernatant was transferred to a new tube. An equal volume of isopropanol was added to the recovered supernatant after 1 h at room temperature. Finally, total DNA was recovered by centrifugation for 15 min at 13,600 rpm. The pellet was washed with 70% ethanol, dried, and resuspended in 30 μL Milli-Q water.
For bacterial 16S rRNA genes, fragments were amplified using the primers 341F (CCTAYGGGRBGCASCAG) and 806R (GGACTACNNGGGTATCTAAT), flanking the V3 and V4 regions with the barcode described by Yu et al. [26]. For archaeal 16S rRNA genes, fragments were amplified using the primers U519F (CAGYMGCCRCGGKAAHACC) and 806R (GGACTACNNGGGTATCTAAT), flanking the V4 region [27]. Sequencing libraries were generated using a TruSeq DNA PCR-Free Sample Preparation Kit (Illumina, San Diego, CA, USA) following the manufacturer’s instructions, and index codes were added. The library was sequenced on an Illumina HiSeq 2500 platform by Genone (Rio de Janeiro, Brazil), and 250 bp paired-end reads were generated. Sequencing results were deposited at DDBJ/EMBL/GenBank under the accession number PRJNA649819.

2.3.2. Bioinformatics Analysis

Microbial sequence analysis was performed using Uparse v7.0.1001 (http://drive5.com/uparse/ accessed on 20 November 2023). Sequences with >97% similarity were assigned to the same operational taxonomic unit (OTUs). A representative sequence from each OTU was screened for further annotation. For each representative sequence, the Green Gene Database was used (http://greengenes.lbl.gov/cgi-bin/nph-index.cgi accessed on 20 November 2023), based on the RDP classifier (v2.2, http://sourceforge.net/projects/rdp-classifier/ accessed on 20 November 2023) algorithm, to annotate taxonomic information. To determine the phylogenetic relationships of different OTUs and differences in species composition between samples (groups), multiple sequence alignments were conducted using PyNAST v1.2 against the “Core Set” dataset in the Green Gene database. OTU abundance values were normalised using a standard sequence number corresponding to the sample with the least number of sequences.

2.3.3. Alpha Diversity and Cluster Analysis of Microbial Communities

Alpha diversity was calculated for each sample using two indices: Chao1 to determine community richness and Shannon to determine community diversity. To compare microbial communities among samples, the unweighted pair group method was used with arithmetic mean (UPGMA) and nonmetric multidimensional scaling analysis (NMDS). All alpha and beta diversity analyses were performed using Past v4.8.

2.4. Statistical Analysis

All data were analysed using R software v3.6.1. The Shapiro–Wilk test was used to assess the distribution of the data. Analysis of variance (ANOVA) was used to determine the differences between the average concentrations of pollutant output (LAS and COD) between seasons. Tukey’s post hoc tests was used to evaluate the results between ANOVA tests. Pearson’s correlation coefficient was used to assess the association between pertinent variables [28]. Statistical significance was set at p < 0.05.

3. Results and Discussion

3.1. Hydraulic and Organic Loading Rates

A hydraulic loading rate (HLR) of approximately 196 mm·d−1 was applied to the system (98 mm·d−1 on CEvaT) on a daily basis (average greywater load (GWL) was 58 L·person−1·d−1, simulating the production of a residence inhabited by three people; Table 1). Peak flow, based on the ratio of the maximum flow to the mean load flow entering the system [25], was 3.4.
These results are consistent with those of Silva et al. [21], who performed a full-scale study without the control of fractions and recorded a GWL generation rate of 60 L/PE·d−1, but are lower than that of Mandal et al. [29], where the production was 110 L/person·d−1. Our results are also consistent with those of Magalhães Filho et al. [22], who compared greywater generation in different countries. This variation in greywater generation rates depends on the contributions of the different fractions (i.e., kitchen sink, bathroom, and laundry).
Previous studies performed with the EvaTAC system at full, pilot, and bench scales showed that the system can cope with hydraulic loads of 120 mm·d−1 and can receive influent peaks up to 600 mm·d−1 without compromising the quality of the effluent. Organic loads within 30–40 gCOD·m−2·d−1 can be applied to ensure over 80% COD removal [30,31]. These HLR applications are above those recommended by some studies, which suggest a rate of 120 mm·d−1 [31]. Above all, the limiting factor is organic load, i.e., if the greywater has a low organic load, a higher hydraulic load can be applied [32].
In relation to the OLR, 37 gCOD·m−2·d−1 was applied to the system (73 gCOD·m−2·d−1 to the CEvaT). Hoffman et al. [32] suggested an OLR of 16 gCOD·m−2·d−1 for HSSF-CWs in cold climates. In warm climates, Ramprasad and Philip [33] used 25 gCOD m−2·d−1, while Silva et al. [21] used 5–9 gCOD m−2·d−1 (only GWL), both with a removal efficiency of ~80%. In this study, the system operated at higher loads at an average temperature of ~20 °C. Magalhães Filho and Paulo [31] observed that this modular system (with the evapotranspiration and treatment chamber CEvaT) as a pretreatment for horizontal-flow CWs in greywater treatment (without kitchen sink fraction) allows for higher organic loads of COD (above 30 gCOD·m−2·d−1), with removal rates of >80%.

3.2. COD, LAS, pH, Redox Potential, and Temperature

The system had average COD and LAS concentrations at the inlet of 374 and 32 g·m−2·d−1, with average removal rates of 66% and 43%, respectively (Table 2). We observed a high standard deviation (SD) for raw greywater, confirming its high variability. Nevertheless, the system stabilised this variation, as seen from a considerable reduction in the SD. These COD values are consistent with other studies in Brazil on GW without a kitchen sink fraction [21,34]. Considering the area of the system per person, the present study operated with a superficial area of 0.7 m2, which is below the 0.8 to 8 m2·person−1 reported in other studies [35,36,37] of HSSF-CW. Hoffmann et al. [32] recommended that the specific area required should be between 3 and 10 m2·person−1 in warm climates. Nivala et al. [35], using a horizontal-flow wetland with 0.8 m2·person−1, obtained a COD reduction of 60%; however, the system was stimulated with aeration.
The average concentration of surfactants at the inlet of the system was 32 mg·L−1, which is consistent with the average concentration extrapolated from other studies (29 mg·L−1, range: 1–60 mg·L−1) [38,39,40]. The removal efficiency of the system was 43% (Table 2).
Previous studies have shown that vertical flow is more efficient than horizontal flow for surfactant removal in CWs [41]. Fountoulakis et al. [42] reported an LAS removal efficiency of 55% (inlet concentration 7.17 mg·L−1) in a 45 m2 full-scale HSSF-CW. Pérez-López et al. [43] found that the effectiveness of an HSSF-CW for LAS removal from greywater ranged from 6 to 90%, with the higher removal rates related to a longer hydraulic detention time (15 d).
The system operated predominantly under anaerobic conditions (Table S1), with the redox potential (Eh) increasing from inlet to outlet. At the exit, the redox potential increased, owing to the influence of plants and decrease in organic load. The system showed a stable pH and temperature throughout the study period, even with alternating hydraulic and organic loads, with average values around 7.3 ± 0.49 and 24 ± 3.25 °C, respectively (Table S1).

3.3. Correlation between Variables

The correlation analysis (Table 3) showed a positive relationship between COD and LAS load removal. This relationship was stronger in the CEvaT unit and in the system as a whole (EvaTAC) than that in the HSSF-CW alone. García et al. [44], in a review study evaluating the removal of different contaminants in an HSSF-CW, suggested that this occurs because of a reduction in microbial activity, which is responsible for the degradation of LAS [44]. Regarding COD:BOD ratio, Magalhães Filho et al. [22] studied an HSSF-CW using fine gravel as substrate and receiving GW with similar qualitative characteristics of this study. They observed an increase in the COD:BOD ratio throughout the system. Ghaitidak and Yadav [45] compared different GW treatment technologies, including CWs, and found an increase in COD:BOD from raw to treated effluent. A higher COD:BOD ratio indicates that the greywater contains a higher amount of recalcitrant organics [46], which results from an increased input of surfactants and personal care products, as observed in the study conducted by Ramprasad et al. [18] treating GW in a green roof modular system aiming for reuse in hot climate regions. Our findings indicate that the COD can be used as a design parameter for LAS removal.
In the CEvaT unit, temperature had a stronger effect on LAS than COD removal; it affected the system as a whole but had a less significant effect on the CW. There were no significant correlations with hydraulic retention time (data not shown). The correlations for HLR were lower than those for OLR. García et al. [44] only observed a relationship between HLR and LAS removal, which emphasises the effect of microbial activity on LAS removal. It is important to highlight that, for CEvaT, the correlation coefficients increased between 10 and 90 d of anaerobic chamber (AnC) acclimation and biofilm formation.
Therefore, HLR and OLR are important considerations when designing a CW system for LAS removal. In this study, the highest COD and LAS removal rates occurred at approximately 50–60 gCOD·m−2·d−1 and for LAS between 2–8 gLAS·m−2·d−1, respectively (Figure S1).
Although the separate units (CEvaT and HSSF-CW) complement the functioning of the other, each is associated with different hydraulic and removal patterns and should therefore be studied separately to optimise the whole process. Magalhães Filho et al. [30] observed different hydraulic behaviours in each unit, and Bernardes et al. [23] studied the environmental conditions of each unit and identified different groups of microbial communities between zones.

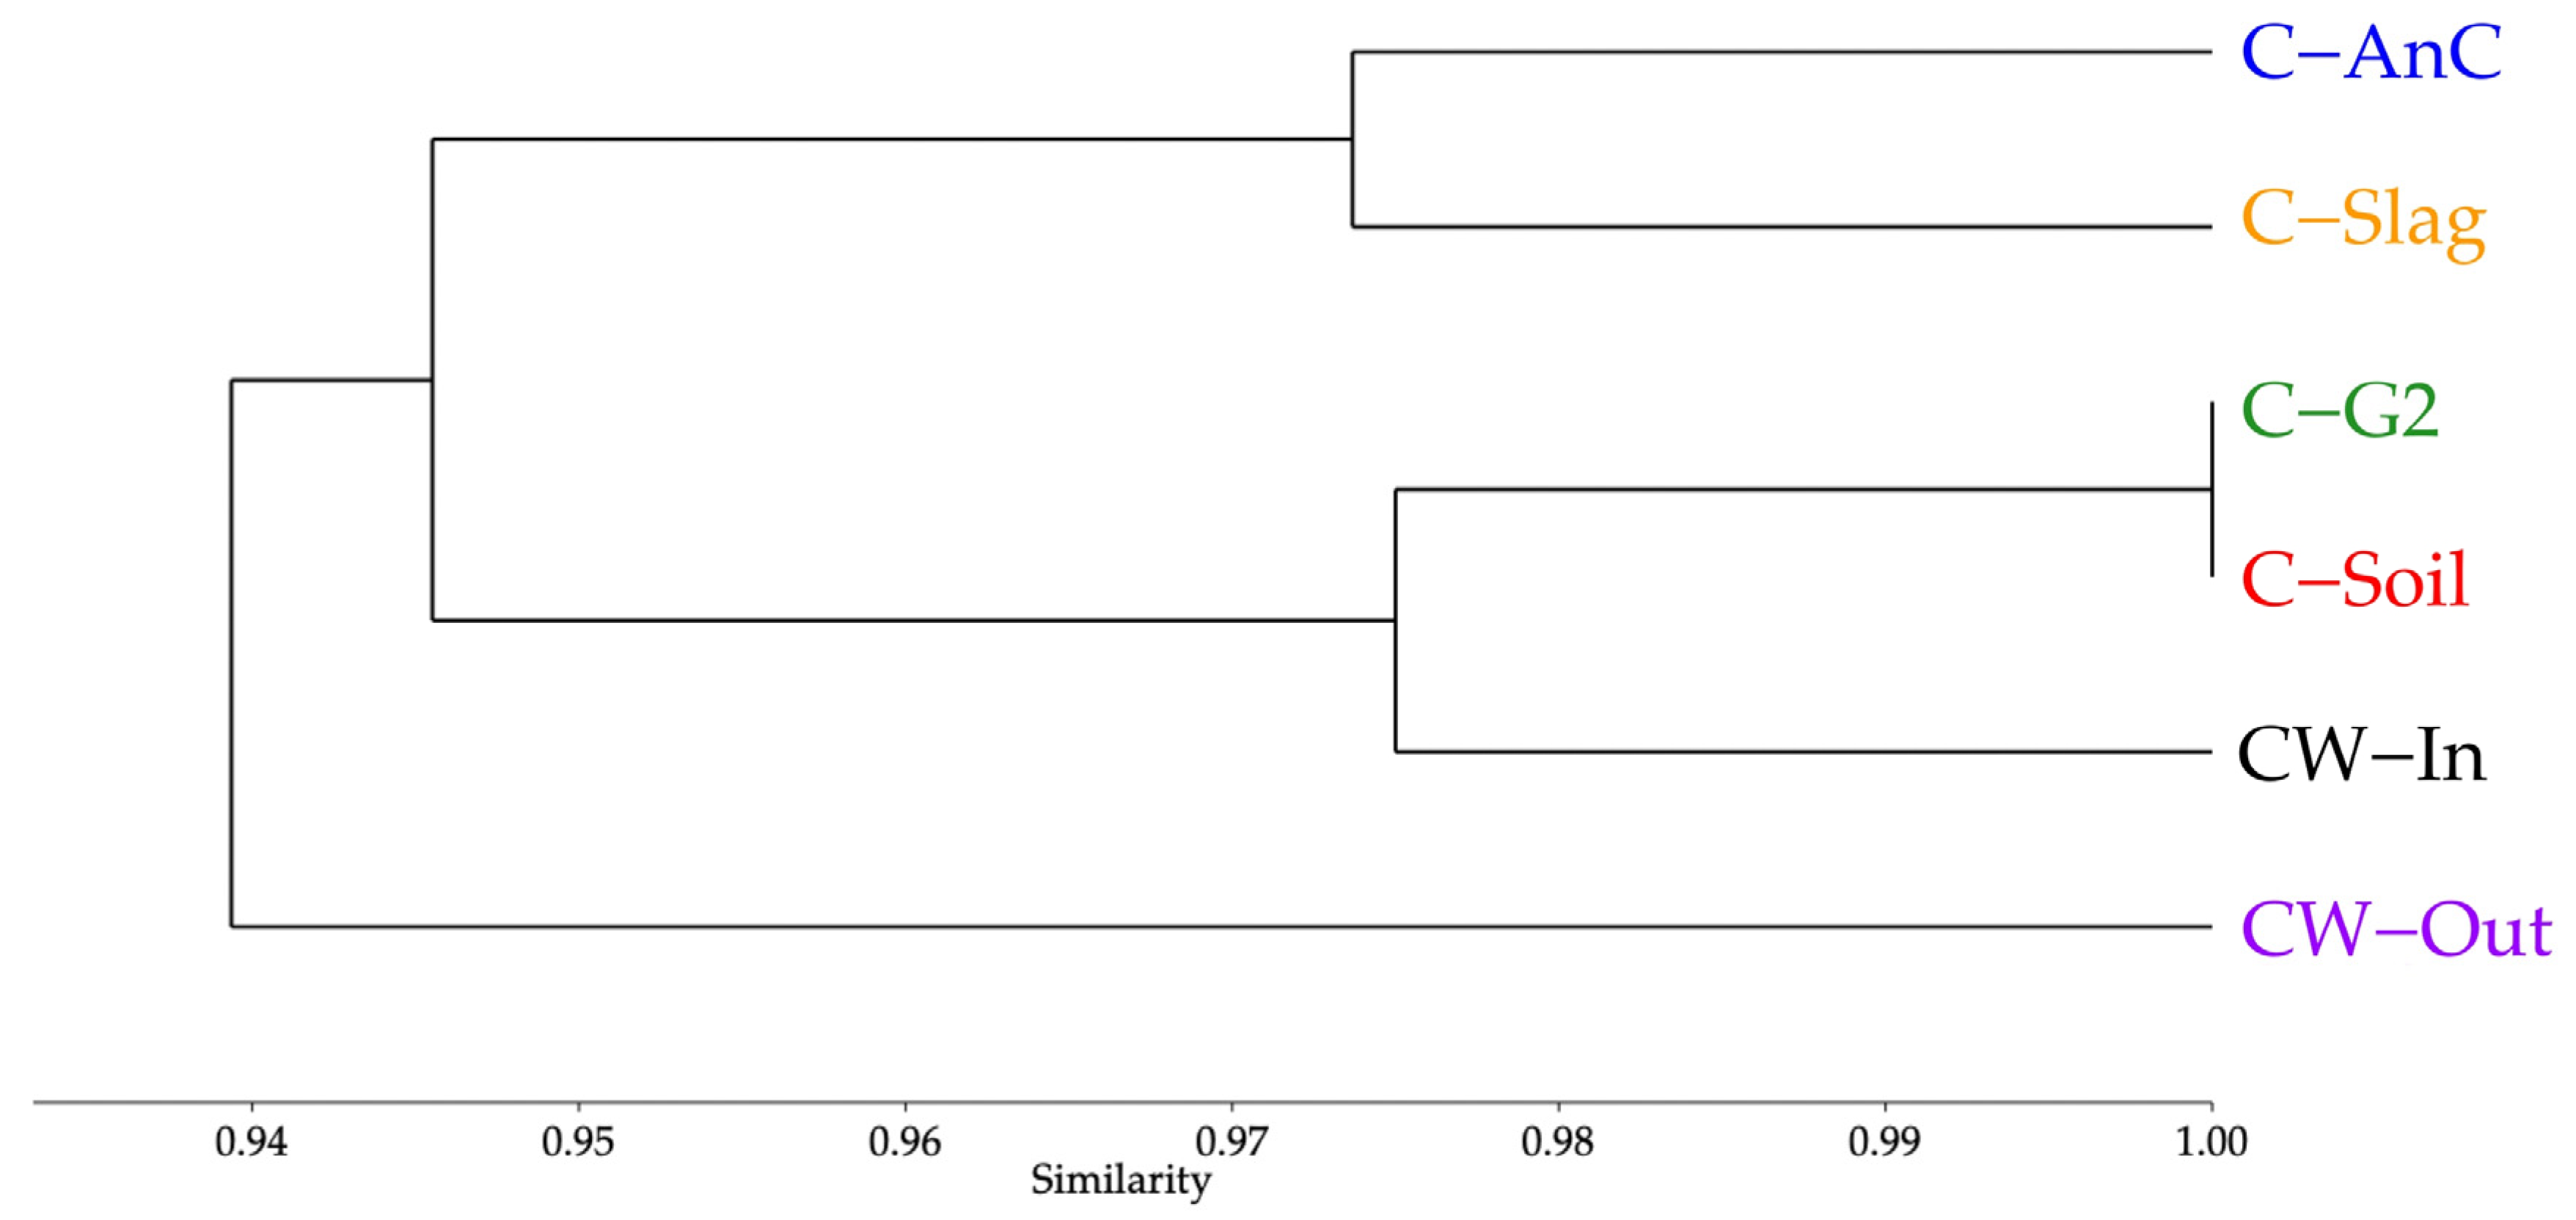
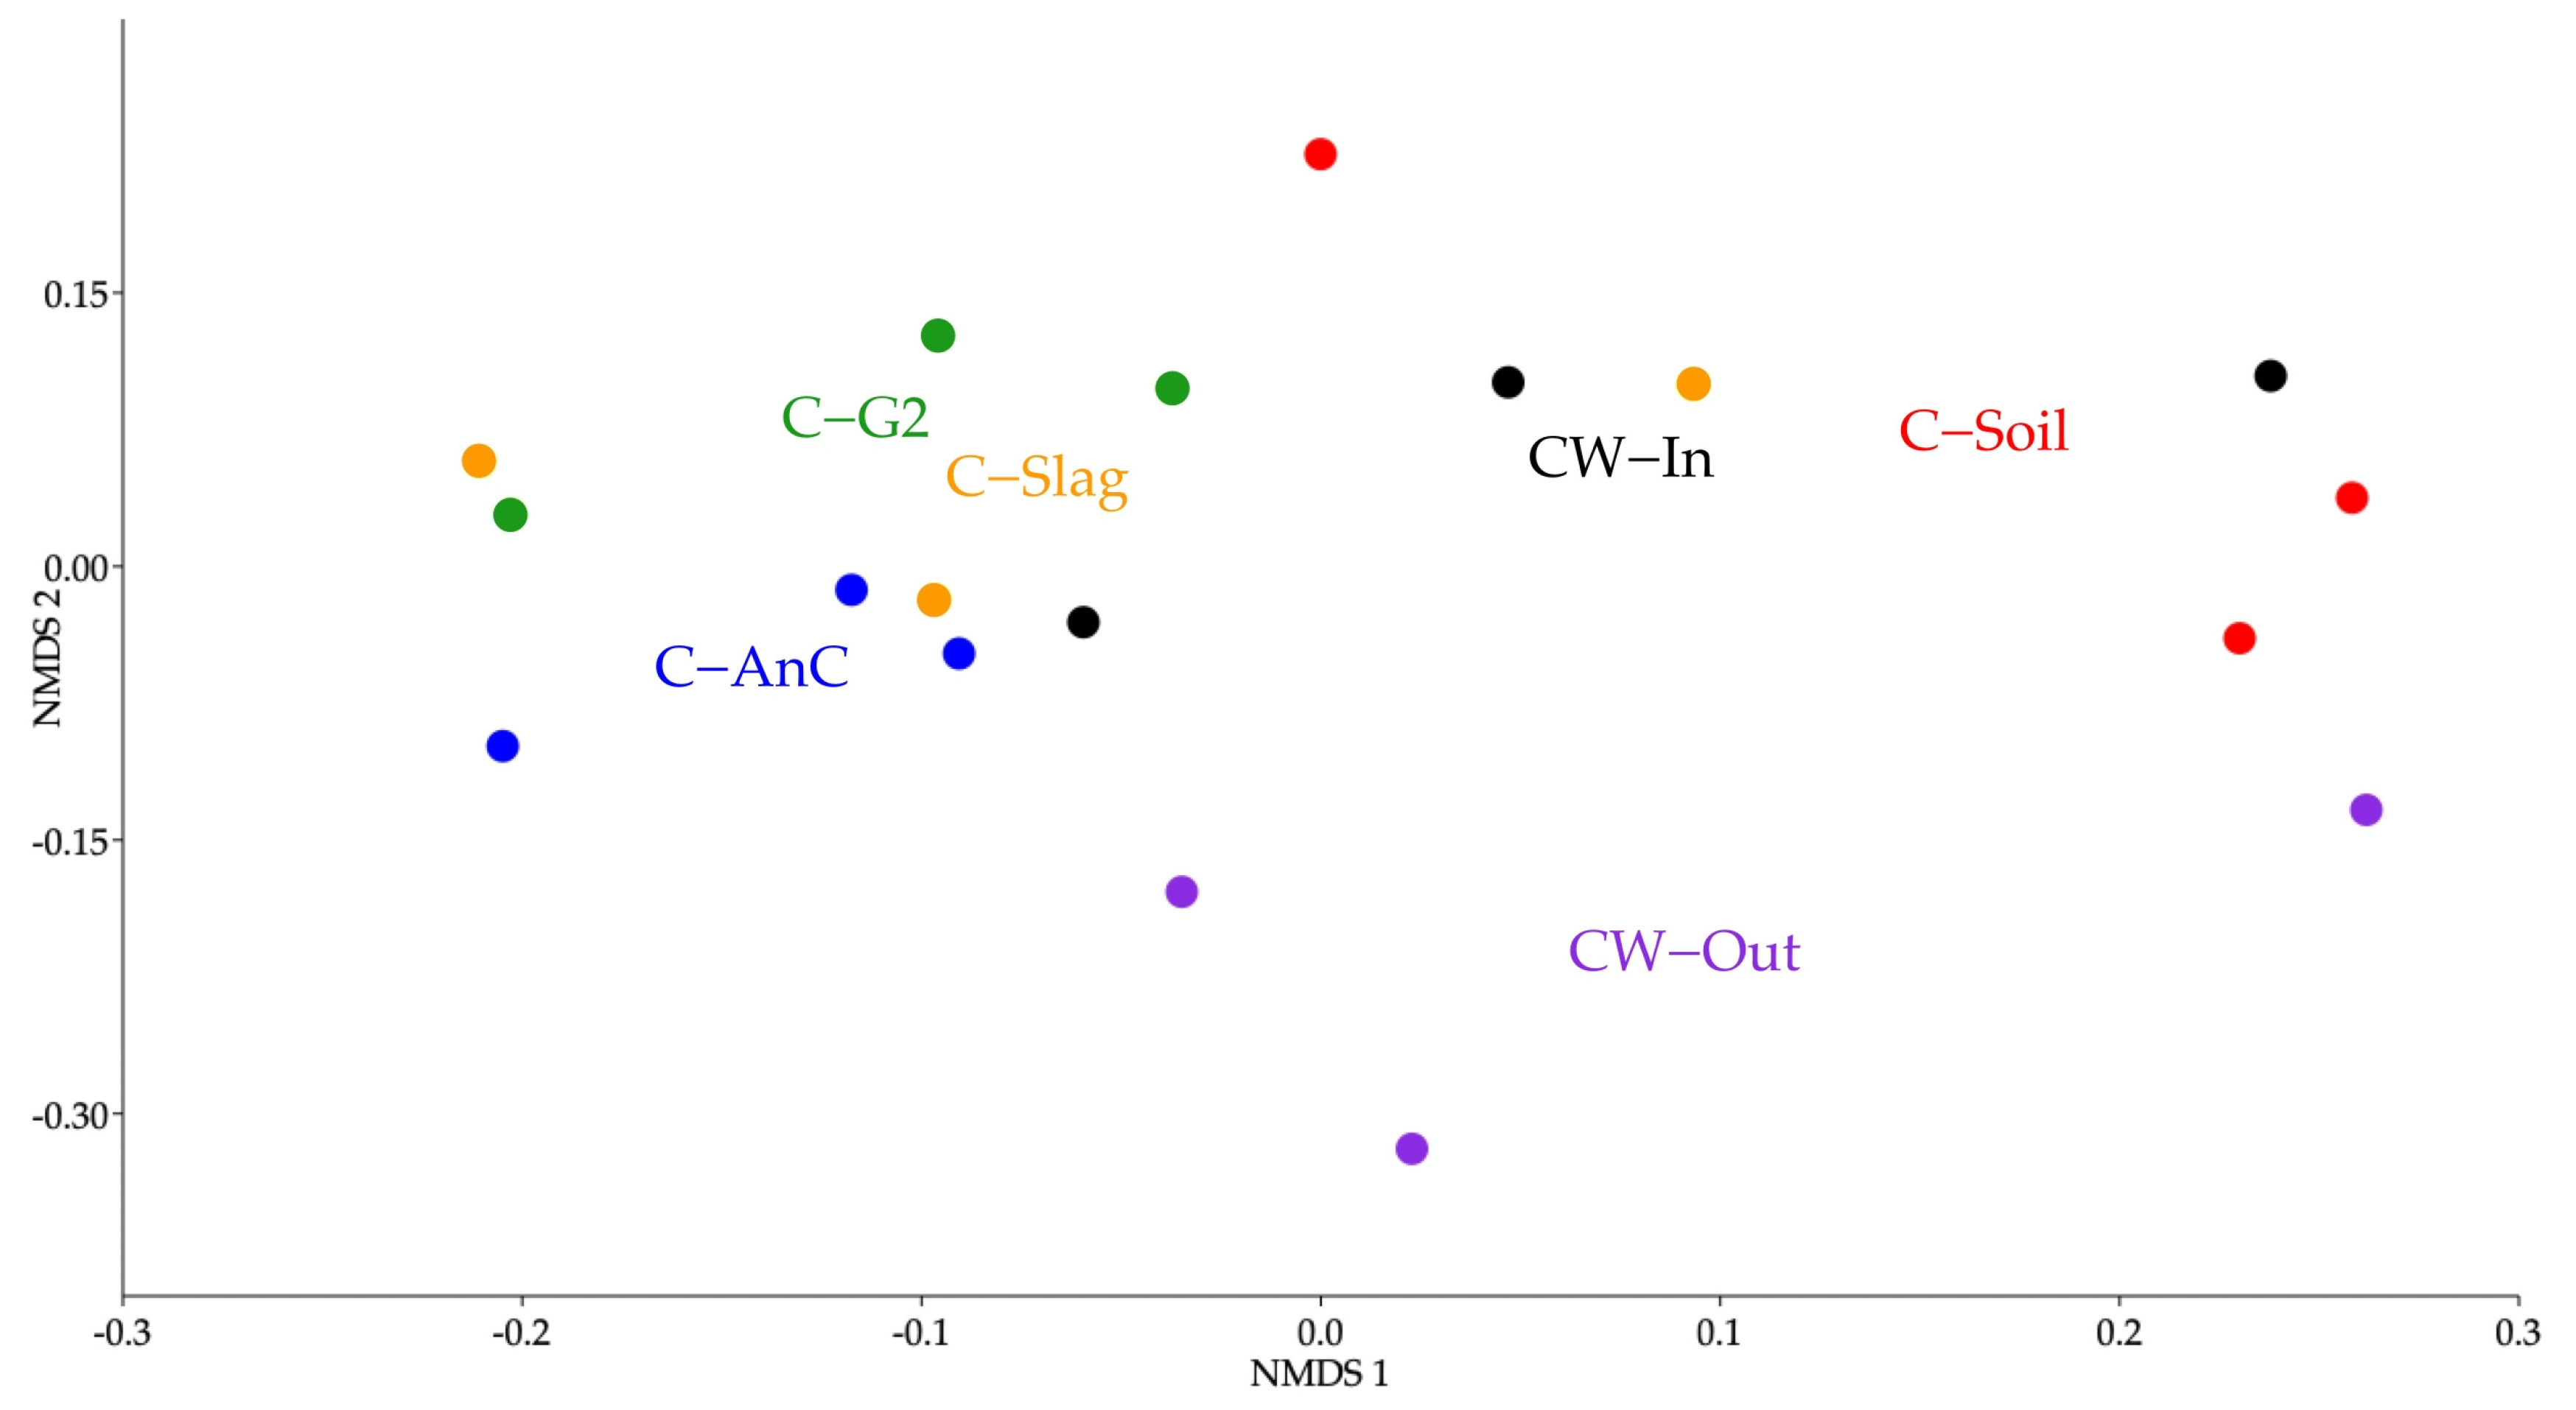
3.4. Alpha Diversity and Cluster Analysis of Microbial Communities

Microbial genera were divided into three groups based on functional pathways: (i) hydrolysis, fermentation, syntrophy, and acetogenesis; (ii) methanogenesis; (iii) surfactant degradation; and (iv) sulphate reduction [23]. The highest number of bacterial OTUs linked to surfactant degradation was observed in C−AnC (36,531), followed by CW−Out (5980), CW−In (5120), C−Slag (3745), C−Soil (3431), and C−G2 (1826). The species that presented the highest relative abundance of OTUs was Rhodopseudomonas palustres, which was predominant in all of the subsystems: C−AnC (98.29%), CW−In (85.29%), CW−Out (86.10%), C−G2 (53.57), and C−Slag (51.62%) (Figure 2). In the C−Soil subsystem, the bacterial species with the highest relative abundance of OTUs was Acinetobacter schindleri (57.97%) (Figure 2, Table S2).
Community richness and diversity were comparable between subsystems, with a slight decrease in community diversity (Shannon index) observed in the CW−Out (Table 4).
The UPGMA tree (Figure 3) indicated that the bacterial community could be divided into three distinct groups: (1) CW−Out; (2) CW−In, C−G2, and C−Soil; and (3) C−AnC and C−Slag. Nevertheless, these groups shared a ~93% similarity in composition. The NMDS showed that the samples from the CW−Out had the greatest variability (stress = 0.15), though this was also the location with the lowest community diversity index (Figure 4).

3.5. Microbial Community Involved in LAS Degradation

The prevailing respiration process depends on the oxidation–reduction conditions of the wetland environment [47]. The redox potential in the EvaTAC system varied from −321 ± 41 mV inside the anaerobic chamber (sampling point 2, C−AnC) to −260 ± 53 mV at the outlet of the HSSF-CW (sampling point 5, CW−Out). This indicates that the system operated under anaerobic conditions, and pollutant conversion and removal was carried out by anaerobic microorganisms, which is reflected in the composition of the microbial community (Table S2).
LAS removal is less efficient in anaerobic environments [48], whereas the conversion is more favourable in aerobic environments, being able to achieve full mineralisation. The Human and Environmental Risk Assessment on Ingredients of Household Cleaning Products [15] reported that LAS does not pass standard tests for anaerobic biodegradation of sludge digester samples, which may be related to its low bioavailability in sludge. Increased anaerobic removal was observed with an increased bioavailable fraction of LAS in a completely stirred tank reactor [49,50]. LAS removal rates of up to 93% have been achieved in different anaerobic reactor configurations, conditions, and influent concentrations ranging from 9.5 to 28.8 mg·L−1 [51,52,53,54]. In their batch experiments, Angelidak et al. [49] found that LAS concentrations higher than 50 mg·L−1 inhibited the activity of most anaerobic microbial groups. In our study, the influent LAS concentration ranged from 4 to 76 mg·L−1. During the 16-month trial, the EvaTAC system achieved a global LAS removal of 43 ± 23%, with a slightly better performance in the CEvaT unit. As the influent greywater is received in the anaerobic chamber and flows upward to the gravel layer, adsorption into the sludge and substrate layers may promote LAS removal from the liquid phase. Considering the relationship between species richness or diversity indices and environmental characteristics, LAS biodegradation could potentially occur in both the CEvaT and HSSF-CW units.
In the biomass samples (Figure 2), we identified 15 genera related to the anaerobic degradation of aromatic compounds, or surfactant degraders, four of which belonged to the Pseudomonas genus, which, according to Brenner et al. [55], plays an important role in LAS degradation, given that microbes of the genus can perform both β- and ω-oxidation, in addition to desulfonation [51]. Among the surfactant-degrading bacteria, Rhodopseudomonas palustris, a versatile nonsulphur bacterium able to use a wide variety of waste-derived substrates [56], had the highest relative abundance of OTUs in all biomass samples, including in the anaerobic chamber (99.2% of OTUs in C−AnC sample), where the first steps of the anaerobic process occur [23,57].
Lara-Martín et al. [48] proposed an anaerobic degradation pathway for LAS in sulphate-reducing marine sediments, in which the initial reaction metabolites were generated via addition of fumarate to the LAS molecules, transformed into sulfophenyl carboxylic acids (SPC), and progressively degraded by successive β-oxidation reactions to ultimately produce 1-sulfophenyl-ethanol. The authors reported several types of sulphate-reducing bacteria capable of conducting these two processes. In the present study, we identified 14 genera of sulphate-reducing bacteria, which showed comparable abundance among the six biomass samples taken along the EvaTAC system. In a previous study of the same pilot system and conditions [23], sulphide concentration was recorded at 0.3 mg·L−1 in influent greywater, 42.3 ± 19.1 mg·L−1 in the anaerobic chamber, and 27.7 mg·L−1 in the effluent, confirming sulphate reduction activity (average sulphate inlet concentration of 46.6 mg·L−1). Although there is evidence that sulphate-reducing bacteria participate in the LAS-degradation pathway, Delforno et al. reported that sulphide concentrations greater than 20 mg·L−1 inhibited LAS degradation [51] in the treatment of commercial laundry greywater in an anaerobic expanded granular sludge blanket reactor. This concentration is much lower than what we reported in nature-based greywater treatments in both mesocosms and pilot-scale systems, ranging from 0.3 to 264 mg·L−1 [23,58,59]. This high range suggests that sulphate and sulphide, variables not usually included in the monitoring of greywater treatment, are important drivers of LAS removal efficiency in CWs operating under anaerobic conditions. In the present study, Rhodoblastus and Thiobacillus were present in all subsystems at a consistent abundance, which supports the sulphur oxidation process in LAS removal.
Our results shed light on the microbial role in LAS degradation in constructed wetlands, with the environmental condition being predominantly anaerobic. Additional research involving the role of plants and microbial interactions using the suggested design loads will allow to improve the system performance to a greater extent.

4. Conclusions

This study investigated the performance of a multistage constructed wetland system in surfactant removal and the dynamics of the microbial community involved in LAS biodegradation. The system was predominated by anaerobic conditions (redox potential range: −321 mV [inlet] to −260 mV (outlet)). The system received an average COD and LAS of 374 and 32 mg·L−1, with removal rates of 66% and 43%, respectively. The highest COD and LAS removal rates occurred at approximately 50–60 gCOD·m−2·d−1 and for LAS between 2–8 gLAS·m−2·d−1, respectively. For CEvaT, the correlation coefficients increased after anaerobic chamber acclimation and biofilm formation. The highest correlation between COD and LAS was regarding OLR, suggesting that the area plays a more important role than the volume of the system. Therefore, dimensioning the appropriate area through the organic load applied will allow better performance of the system in the removal of COD and LAS. The patterns in microbial community composition and environmental conditions suggest that LAS biodegradation occurred throughout the EvaTAC system. Among the 15 surfactant-degrading genera, Pseudomonas was predominant. Community richness and diversity indices were comparable between subsystems, with a slight decrease in diversity observed towards the outlet. Among the LAS degraders, Rhodopseudomonas palustris had the highest relative abundance of OTUs in all samples and the highest richness in the anaerobic chamber.

Supplementary Materials

The following supporting information can be downloaded at: https://www.mdpi.com/article/10.3390/resources12030038/s1, Table S1 and S2 and Figure S1.

Author Contributions

Conceptualisation, F.J.C.M.F., F.S.B. and P.L.P.; methodology, R.M.J., F.M.S., F.J.C.M.F., F.S.B. and P.L.P.; validation, R.M.J., F.J.C.M.F., F.M.S. and P.L.P.; formal analysis, R.M.J., F.M.S. and F.J.C.M.F.; investigation, R.M.J., C.M.P. and F.S.B.; resources, P.L.P.; data curation, R.M.J., C.M.P. and F.M.S.; writing—original draft preparation, R.M.J., F.J.C.M.F., F.M.S. and P.L.P.; writing—review and editing, F.J.C.M.F. and P.L.P.; visualisation, F.J.C.M.F. and P.L.P.; supervision, F.J.C.M.F., F.S.B. and P.L.P.; project administration, P.L.P.; funding acquisition, P.L.P. All authors have read and agreed to the published version of the manuscript.

Funding

This research was funded by Conselho Nacional de Desenvolvimento Científico e Tecnológico—CNPq—Brazil, grant number 456927/2014-0; Fundação de Amparo à Pesquisa do Estado de Minas Gerais—FAPEMIG; Instituto Nacional de Ciência e Tecnologia em Estações Sustentáveis de Tratamento de Esgoto—INCT “ETEs Sustentáveis” (INCT “Sustainable Sewage Treatment Plants”); Coordenação de Aperfeiçoamento de Pessoal de Nível Superior—Capes. APC was funded by Federal University of Mato Grosso do Sul—UFMS/MEC—Brazil.

Informed Consent Statement

Not applicable.

Data Availability Statement

The microorganism database has been deposited at DDBJ/EMBL/GenBank under the accession PRJNA649819.

Conflicts of Interest

The authors declare no conflict of interest.

References

  1. Misra, R.K.; Sivongxay, A. Reuse of laundry greywater as affected by its interaction with saturated soil. J. Hydrol. 2009, 366, 55–61. [Google Scholar] [CrossRef] [Green Version]
  2. Ramprasad, C.; Philip, L. Contributions of various processes to the removal of surfactants and personal care products in constructed wetland. Chem. Eng. J. 2018, 334, 322–333. [Google Scholar] [CrossRef]
  3. Zhu, Y.P.; Rosen, M.J.; Morral, S.W.; Tolls, J. Surface properties of linear alkyl benzene sulfonates in hard river water. J. Surfactants Deterg. 1998, 1, 187–193. [Google Scholar] [CrossRef]
  4. Babaei, F.; Ehrampoush, M.H.; Eslami, H.; Ghaneian, M.T.; Fallahzadeh, H.; Talebi, P.; Fard, R.F.; Ebrahimi, A.A. Removal of linear alkylbenzene sulfonate and turbidity from greywater by a hybrid multi-layer slow sand filter microfiltration ultrafiltration system. J. Clean. Prod. 2019, 211, 922–931. [Google Scholar] [CrossRef]
  5. Venhuis, S.H.; Mehrvar, M. Health effects, environmental impacts and photochemical degradation of selected surfactants in water. Int. J. Photoenergy 2004, 6, 115–125. [Google Scholar] [CrossRef] [Green Version]
  6. Shaikh, I.N.; Ahammed, M.M. Quantity and quality characteristics of greywater: A review. J. Environ. Manag. 2020, 261, 110266. [Google Scholar] [CrossRef]
  7. Noutsopoulos, C.; Andreadakis, A.; Kouris, N.; Charchousi, D.; Mendrinou, P.; Galani, A.; Mantziaras, I.; Koumaki, E. Greywater characterization and loadings–Physicochemical treatment to promote onsite reuse. J. Environ. Manag. 2018, 216, 337–346. [Google Scholar] [CrossRef]
  8. Fountoulakis, M.S.; Markakis, N.; Petousi, I.; Manios, T. Single house on-site grey water treatment using a submerged membrane bioreactor for toilet flushing. Sci. Total Environ. 2016, 551, 706–711. [Google Scholar] [CrossRef]
  9. Bani-Melhem, K.B.; Al-Qodah, Z.; Al-Shannag, M.; Qasaimeh, A.; Qtaishat, M.R.; Alkasrawi, M. On the performance of real grey water treatment using a submerged membrane bioreactor system. J. Membr. Sci. 2015, 476, 40–49. [Google Scholar] [CrossRef]
  10. Santasmasas, C.; Rovira, M.; Clarens, F.; Valderrama, C. Grey water reclamation by decentralized MBR prototype. Resour. Conserv. Recycl. 2013, 72, 102–107. [Google Scholar] [CrossRef]
  11. Leal, L.H.; Temmink, H.; Zeeman, G.; Buisman, C.J.N. Comparison of three systems for biological greywater treatment. Water 2010, 2, 155–169. [Google Scholar] [CrossRef]
  12. Huelgas, A.; Funamizu, N. Flat-plate submerged membrane bioreactor for the treatment of higher-load graywater. Desalination 2010, 250, 162–166. [Google Scholar] [CrossRef]
  13. Liu, R.; Huang, X.; Chen, L.; Wen, X.; Qian, Y. Operational performance of a submerged membrane bioreactor for reclamation of bath wastewater. Process Biochem. 2005, 40, 125–130. [Google Scholar] [CrossRef]
  14. Mungray, A.K.; Kumar, P. Occurrence of anionic surfactants in treated sewage: Risk assessment to aquatic environment. J. Hazard. Mater. 2008, 160, 362–370. [Google Scholar] [CrossRef] [PubMed]
  15. HERA–LAS. Human and Environmental Risk Assessment. Linear Alkylbenzene Sulphonate, LAS. CAS No. 68411-30-3. 2013. Available online: https://www.heraproject.com/files/HERA-LAS%20revised%20April%202013%20Final1.pdf (accessed on 23 December 2022).
  16. Boano, F.; Caruso, A.; Costamagna, E.; Ridolfi, L.; Fiore, S.; Demichelis, F.; Galvão, A.; Pisoeiro, J.; Rizzo, A.; Mais, F. A review of nature-based solutions for greywater treatment: Applications, hydraulic design, and environmental benefits. Sci. Total Environ. 2020, 711, 134731. [Google Scholar] [CrossRef]
  17. Thomas, R.; Gough, R.; Freeman, C. Linear alkylbenzene sulfonate (LAS) removal in constructed wetlands: The role of plants in the treatment of a typical pharmaceutical and personal care product. Ecol. Eng. 2017, 106, 415–422. [Google Scholar] [CrossRef] [Green Version]
  18. Ramprasad, C.; Smith, C.S.; Memon, F.A.; Philip, L. Removal of chemical and microbial contaminants form greywater using a novel constructed wetland: GROW. Ecol. Eng. 2017, 106, 55–65. [Google Scholar] [CrossRef] [Green Version]
  19. Gross, A.; Shmueli, O.; Ronen, Z.; Raveh, E. Recycled vertical flow constructed wetland (RVFCW)—A novel method of recycling greywater for irrigation in small communities and households. Chemosphere 2007, 66, 916–923. [Google Scholar] [CrossRef]
  20. Masi, F.; Hamouri, B.E.; Shafi, H.A.; Baban, A.; Ghrabi, A.; Regelsberger, M. Treatment of segregated black/grey domestic wastewater using constructed wetlands in the Mediterranean basin: The zero-m experience. Water Sci. Technol. 2010, 61, 97–105. [Google Scholar] [CrossRef]
  21. Silva, J.B.; Oliveira, P.J.A.; Boncz, M.A.; Paulo, P.L. A modified constructed wetland system for greywater treatment. Desalin. Water Treat. 2017, 91, 31–39. [Google Scholar] [CrossRef] [Green Version]
  22. Magalhães Filho, F.J.C.; Paulo, P.L. Multistage constructed wetland in the treatment of greywater under tropical conditions: Performance, operation, and maintenance. Recycling 2021, 6, 63. [Google Scholar] [CrossRef]
  23. Bernardes, F.S.; Pereira, M.A.S.; Hassan, I.A.I.; Castro, A.P.; Roche, K.F.; Paulo, P.L. Change in microbial profile and environmental conditions in a constructed wetland system treating greywater. Environ. Sci. Pollut. Res. 2021, 28, 34539–34552. [Google Scholar] [CrossRef] [PubMed]
  24. APHA. Standard Methods for the Examination of Water and Wastewater, 22nd ed.; American Public Health Association: Washington, DC, USA, 2012; p. 953. [Google Scholar]
  25. Von Sperling, M.; Verbyla, M.E.; Oliveira, S.M.A.C. Assessment of Treatment Plant Performance and Water Quality Data: A Guide for Students, Researchers and Practitioners; IWA Publishing: London, UK, 2020. [Google Scholar]
  26. Yu, Y.; Lee, C.; Kim, J.; Hwang, S. Group-specific primer and probe sets to detect methanogenic communities using quantitative real-time polymerase chain reaction. Biotechnol. Bioeng. 2005, 89, 670–679. [Google Scholar] [CrossRef] [PubMed]
  27. Porat, I.; Vishnivetskaya, T.A.; Mosher, J.J.; Brandt, C.C.; Yang, Z.K.; Brooks, S.C.; Liang, L.; Drake, M.M.; Podar, M.; Brown, S.D.; et al. Characterization of archaeal community in contaminated and uncontaminated surface stream sediments. Microb. Ecol. 2010, 60, 784–795. [Google Scholar] [CrossRef] [PubMed] [Green Version]
  28. De Oliveira, M.; Atalla, A.A.; Frihling, B.E.F.; Cavalheri, P.S.; Migliolo, L.; Magalhães Filho, F.J.C. Ibuprofen and caffeine removal in vertical flow and free-floating macrophyte constructed wetlands with Heliconia rostrata and Eichornia crassipes. Chem. Eng. J. 2019, 373, 458–467. [Google Scholar] [CrossRef]
  29. Mandal, D.; Labhasetwar, P.; Dhone, S.; Dubey, A.S.; Shinde, G.; Wate, S. Water conservation due to greywater treatment and reuse in urban setting with specific context to developing countries. Resour. Conserv. Recycl. 2011, 55, 356–361. [Google Scholar] [CrossRef]
  30. Magalhães Filho, F.J.C.; Sobrinho, T.A.; Steffen, J.L.; Arias, C.A.; Paulo, P.L. Hydraulic and hydrological aspects of an evapotranspiration–constructed wetland combined system for household greywater treatment. J. Environ. Sci. Health A 2018, 53, 493–500. [Google Scholar] [CrossRef] [PubMed]
  31. Magalhães Filho, F.J.; Paulo, P. Phytoremediation as a modular approach for greywater treatment. In Modular Treatment Approach for Drinking Water and Wastewater, 1st ed.; Brar, S.K., Kumar, P., Cuprys, A., Eds.; Elsevier Science: Amsterdam, The Netherlands, 2022; Volume 1, pp. 107–128. [Google Scholar]
  32. Hoffmann, H.C.; Platzer, M.; Winker, E.; von Muench, E. Technology Review of Constructed Wetlands; Deutsche Gesellschaft fur Internationale Zusammenarbeit (GIZ) GmbH: Eschborn, Germany, 2011. [Google Scholar]
  33. Ramprasad, C.; Philip, L. Surfactants and personal care products removal in pilot scale horizontal and vertical flow constructed wetlands while treating greywater. Chem. Eng. J. 2016, 15, 458–468. [Google Scholar] [CrossRef]
  34. Paulo, P.L.; Vieira, J.; Takahashi, K.M.; Magalhães Filho, F.J.C.; Silva, J.B.; Boncz, M.A. Technical Note 4-Reuse water: Grey water treated in constructed wetlands. Cad. Técnicos Eng. Sanit. Ambient. 2022, 2, 43–58. [Google Scholar] [CrossRef]
  35. Nivala, J.; Hoos, M.B.; Cross, C.; Wallace, S.; Parkin, G. Treatment of landfill leachate using an aerated, horizontal subsurface flow constructed wetland. Sci. Total Environ. 2007, 380, 19–27. [Google Scholar] [CrossRef]
  36. Zhang, C.X.; Lippard, S.J. New metal complexes as potential therapeutics. Curr. Opin. Chem. Biol. 2003, 7, 481–489. [Google Scholar] [CrossRef] [PubMed]
  37. Fan, J.; Zhang, B.; Zhang, J.; Ngo, H.H.; Guo, W.; Liu, F.; Guo, Y.; Wu, H. Intermittent aeration strategy to enhance organics and nitrogen removal in subsurface flow constructed wetlands. Bioresour. Technol. 2013, 141, 117–122. [Google Scholar] [CrossRef]
  38. Friedler, E. Quality of individual domestic greywater streams and its implication for on–site treatment and reuse possibilities. Environ. Technol. 2004, 25, 997–1008. [Google Scholar] [CrossRef] [PubMed]
  39. Gross, A.; Maimon, A.; Alfiya, Y.; Friedler, E. Greywater Reuse; CRC Press: Boca Raton, FL, USA, 2015. [Google Scholar]
  40. Shafran, A.W.; Gross, A.; Ronen, Z.; Weisbrod, N.; Adar, E. Effects of surfactants originating from reuse of greywater on capillary rise in the soil. Water Sci. Technol. 2005, 52, 157–166. [Google Scholar] [CrossRef] [PubMed]
  41. Tamiazzo, J.; Breschigliaro, S.; Salvato, M.; Borin, M. Performance of a wall cascade constructed wetland treating surfactant-polluted water. Environ. Sci. Pollut. Res. 2015, 22, 12816–12828. [Google Scholar] [CrossRef] [PubMed]
  42. Fountoulakis, M.S.; Terzakis, S.; Kalogerakis, N.; Manios, T. Removal of polycyclic aromatic hydrocarbons and linear alkylbenzene sulfonates from domestic wastewater in pilot constructed wetlands and a gravel filter. Ecol. Eng. 2009, 35, 1702–1709. [Google Scholar] [CrossRef]
  43. Pérez–López, M.E.; Arreola-Ortiz, A.E.; Zamora, P.M. Evaluation of detergent removal in artificial wetlands (biofilters). Ecol. Eng. 2018, 122, 135–142. [Google Scholar] [CrossRef]
  44. García, J.; Rousseau, D.P.L.; Morató, J.; Lesage, E.; Matamoros, V.; Bayona, J.M. Contaminant removal processes in subsurface-flow constructed wetlands: A Review. Crit. Rev. Environ. Sci. Technol. 2010, 40, 561–661. [Google Scholar] [CrossRef]
  45. Ghaitidak, D.M.; Yadav, K.D. Characteristics and treatment of greywater—A review. Environ. Sci. Pollut. Res. 2013, 20, 2795–2809. [Google Scholar] [CrossRef]
  46. Metcalf, L.; Eddy, H.P.; Tchobanoglous, G. Waste Water Engineering Treatment Disposal, and Reuse; McGraw-Hill: Irvine, CA, USA, 2010. [Google Scholar]
  47. Faulwetter, J.L.; Gagnon, V.; Sundberg, C.; Chazarenc, F.; Burr, M.D.; Brisson, J.; Camper, A.K.; Stein, O.R. Microbial processes influencing performance of treatment wetlands: A review. Ecol. Eng. 2009, 35, 987–1004. [Google Scholar] [CrossRef]
  48. Lara–Martín, P.A.; Gómez–Parra, A.; Sanz, J.L.; González–Mazo, E. Anaerobic degradation pathway of linear alkylbenzene sulfonates (LAS) in sulfate-reducing marine sediments. Environ. Sci. Technol. 2010, 44, 1670–1676. [Google Scholar] [CrossRef] [PubMed]
  49. Angelidaki, I.; Torang, L.; Waul, C.M.; Schmidt, J.E. Anaerobic bioprocessing of sewage sludge, focusing on degradation of linear alkylbenzene sulfonates (LAS). Water Sci. Technol. 2004, 49, 115–122. [Google Scholar] [CrossRef] [PubMed]
  50. Haggensen, F.; Mogensen, A.S.; Angelidaki, I.; Ahring, B.K. Anaerobic treatment of sludge: Focusing on reduction of LAS concentration in sludge. Water Sci. Technol. 2002, 46, 159–165. [Google Scholar] [CrossRef] [PubMed]
  51. Delforno, T.P.; Moura, A.G.L.; Okada, D.Y.; Sakamoto, I.K.; Varesche, M.B.A. Microbial diversity and the implications of sulfide levels in an anaerobic reactor used to remove an anionic surfactant from laundry wastewater. Bioresour. Technol. 2015, 192, 37–45. [Google Scholar] [CrossRef]
  52. Delforno, T.P.; Moura, A.G.L.; Okada, D.Y.; Varesche, M.B.A. Effect of biomass adaptation to the degradation of anionic surfactants in laundry wastewater using EGSB reactors. Bioresour. Technol. 2014, 154, 114–121. [Google Scholar] [CrossRef] [PubMed] [Green Version]
  53. Okada, D.Y.; Delforno, T.P.; Esteves, A.S.; Sakamoto, I.K.; Duarte, I.C.S.; Varesche, M.B.A. Optimization of linear alkylbenzene sulfonate (LAS) degradation in UASB reactors by varying bioavailability of LAS, hydraulic retention time and specific organic load rate. Bioresour. Technol. 2013, 128, 125–133. [Google Scholar] [CrossRef] [Green Version]
  54. Braga, J.K.; Varesche, M.B.A. Commercial Laundry Water Characterization for Anaerobic Treatment in Fluidized Bed Reactor; X Oficina e Seminário Latino Americano de Digestão Anaeróbia (DAAL): Ouro Preto, Brazil, 2011. [Google Scholar]
  55. Brenner, D.J.; Krieg, N.R.; Staley, J.T.; Garrity, G.M.; Boone, D.R.; Vos, P.; Goodfellow, M.; Rainey, F.A.; Schleifer, K.H. Bergey’s Manual® of Systematic Bacteriology, 1st ed.; Springer: New York, NY, USA, 2005. [Google Scholar]
  56. Adessi, A.; Spini, G.; Presta, L.; Mengoni, A.; Viti, C.; Giovannetti, L.; Fani, R.; De Philippis, R. Draft genome sequence and overview of the purple non sulfur bacterium Rhodopseudomonas palustris 42OL. Stand. Genomic Sci. 2016, 11, 1–7. [Google Scholar] [CrossRef] [Green Version]
  57. Bernardes, F.S.; Herrera, P.G.; Chiquito, G.M.; Morales, M.F.; Castro, A.P.; Paulo, P.L. Relationship between microbial community and environmental conditions in a constructed wetland system treating greywater. Ecol. Eng. 2019, 139, 105581. [Google Scholar] [CrossRef]
  58. Caputo, L.Z.S.; Siqueira, C.M.; Caputo, B.A.; Bacchi, C.G.V.; Magalhães Filho, F.J.C.; Paulo, P.L. Effects of graywater on the growth and survival of ornamental plants in nature–based systems. J. Environ. Sci. Health A 2019, 54, 1023–1034. [Google Scholar] [CrossRef]
  59. Bernardes, F.S.; Diniz, R.C.O.; Araújo, J.C.; Paulo, P.L. Studies of filter media for zero–discharge systems collecting light greywater. Environ. Technol. 2017, 38, 2173–2184. [Google Scholar] [CrossRef]
Figure 1. EvaTAC system and sampling points. Liquid samples were collected at P1 (system inlet), P2 (piezometer, anaerobic chamber, inside the CEvaT), P3 (CEvaT outlet and HSSF-CW inlet), P4 (piezometer, inside of the HSSF-CW), and P5 (system outlet). The circles filled with white indicate the biomass sampling points: 1—bottom layer of the CEvaT, C−AnC (AnC sludge); 2—middle layer of the CEvaT, C−G2 (gravel no. 2); 3—top layer of the CEvaT, C−Soil (soil); 4—top layer of the CEvaT, C−Slag (blast-furnace slag); 5—initial middle layer of the CW, CW−In (fine gravel); and 6—final middle layer of the CW, CW−Out.
Resources 12 00038 g001
Figure 2. Microbiological composition of the 10 most abundant species detected in each sample collected in the EvaTAC system.
Resources 12 00038 g002
Figure 3. Unweighted pair group method with arithmetic mean (UPGMA) cluster tree based on unweighted UniFrac distance. C−AnC (AnC sludge)—bottom layer of the CEvaT; C−G2 (gravel no. 2)—middle layer of the CEvaT; C−Soil (soil)—top layer of the CEvaT; C−Slag (blast-furnace slag)—top layer of the CEvaT; CW−In (fine gravel)—initial middle layer of the CW; and CW−out (fine gravel)—final middle layer of the CW.
Resources 12 00038 g003
Figure 4. Nonmetric multidimensional scaling (NMDS) analysis. See Figure 2 for the definitions to the abbreviations. Blue dot: C−AnC; green dot: C−G2; red dot: C−Soil; orange dot: C−Slag; black dot: CW−In; and purple dot: CW−out.
Resources 12 00038 g004
Table 1. Hydraulic and organic loading rates, peak flow, and greywater load (GWL) generation (n = 50).
Hydraulic Loading Rate
(L·m−2·d−1/mm·d−1)
Organic Loading Rate
(gCOD·m−2·d−1)
L·Person−1·d−1EvaTACCEvaTEvaTACCEvaT
Maximum2216621324230115
Mean ± SD (50)58 ± 48196 ± 136392 ± 27273 ± 5936 ± 30
Minimum2.43.46.80.61.2
Table 2. COD and LAS concentrations at different sampling points and removal (%) (n = 50).
Parameter
(mg·L−1)
P1P3P5Removal (%)
CEvaTHSSF-CWSystem
(Global)
COD (50)374 ± 210282 ± 100167 ± 7742 ± 2238 ± 1666 ± 23
LAS (50)32 ± 2828 ± 1020 ± 845 ± 2935 ± 2343 ± 23
Table 3. Correlation coefficients between COD organic load removal, LAS organic load removal, HLR, and temperature (°C).
OLR_CODre
CEvaT
OLR_CODre
CW
OLR_CODre
EvaTAC
HLR°C
OLR_LASre CEvaT0.71.00.90.40.8
OLR_LASre CW0.70.50.70.70.3
OLR_LASe EvaTAC0.90.90.90.61.0
HLR0.50.80.61.0-
°C−0.050.10.5-1.0
OLR: organic loading rate; re: removal; HLR: hydraulic loading rate. p-value < 0.05 (if the probability is lower than the conventional 5%, the correlation coefficient is considered statistically significant).
Table 4. Species richness and diversity index.
CW−InCW−OutC−AnCC−G2C−SlagC−Soil
Richness504946535153
Shannon
(Community
Diversity)
3.203.053.103.143.093.12
Chao-1
(Community
Richness)
50.25 (50.00–57.00)50.25 (50.00–57.00)50.25 (50.00–57.00)50.25 (50.00–57.00)50.25 (50.00–57.00)50.25 (50.00–57.00)
C−AnC (AnC sludge)—bottom layer of the CEvaT; C−G2 (gravel no. 2)—middle layer of the CEvaT; C−Soil (soil)—top layer of the CEvaT; C−Slag (blast-furnace slag)—top layer of the CEvaT; CW−In (fine gravel)—initial middle layer of the CW; and CW−Out (fine gravel)—final middle layer of the CW.
Disclaimer/Publisher’s Note: The statements, opinions and data contained in all publications are solely those of the individual author(s) and contributor(s) and not of MDPI and/or the editor(s). MDPI and/or the editor(s) disclaim responsibility for any injury to people or property resulting from any ideas, methods, instructions or products referred to in the content.

