
Grade and Tonnage Comparison of Anthropogenic Raw Materials and Ores for Cu, Zn, and Pb Recovery

Abstract
:1. Introduction
2. Method

3. Results
3.1. Concentrations
3.2. Tonnages
4. Discussion
5. Conclusions
Supplementary Materials
Author Contributions
Funding
Data Availability Statement
Acknowledgments
Conflicts of Interest
References
- Šyc, M.; Simon, F.G.; Hykš, J.; Braga, R.; Biganzoli, L.; Costa, G.; Funari, V.; Grosso, M. Metal Recovery from Incineration Bottom Ash: State-of-the-Art and Recent Developments. J. Hazard. Mater. 2020, 393, 122433. [Google Scholar] [CrossRef]
- Bruno, M.; Abis, M.; Kuchta, K.; Simon, F.-G.; Grönholm, R.; Hoppe, M.; Fiore, S. Material Flow, Economic and Environmental Assessment of Municipal Solid Waste Incineration Bottom Ash Recycling Potential in Europe. J. Clean. Prod. 2021, 317, 128511. [Google Scholar] [CrossRef]
- Cho, B.H.; Nam, B.H.; An, J.; Youn, H. Municipal Solid Waste Incineration (MSWI) Ashes as Construction Materials—A Review. Materials 2020, 13, 3143. [Google Scholar] [CrossRef]
- Quina, M.J.; Bontempi, E.; Bogush, A.; Schlumberger, S.; Weibel, G.; Braga, R.; Funari, V.; Hyks, J.; Rasmussen, E.; Lederer, J. Technologies for the Management of MSW Incineration Ashes from Gas Cleaning: New Perspectives on Recovery of Secondary Raw Materials and Circular Economy. Sci. Total Environ. 2018, 635, 526–542. [Google Scholar] [CrossRef]
- Eurostat. Online Data Code: ENV_WASTRT. Available online: https://ec.europa.eu/eurostat/databrowser/view/ENV_WASTRT/ (accessed on 17 November 2022).
- Weibel, G. Optimized Metal Recovery from Fly Ash from Municipal Solid Waste Incineration. Ph.D. Thesis, University of Berne (CH), Bern, Switzerland, 2017. [Google Scholar]
- Fellner, J.; Lederer, J.; Purgar, A.; Winterstetter, A.; Rechberger, H.; Winter, F.; Laner, D. Evaluation of Resource Recovery from Waste Incineration Residues—The Case of Zinc. Waste Manag. 2015, 37, 95–103. [Google Scholar] [CrossRef]
- Hagelüken, C.; Lee-Shin, J.; Carpentier, A.; Heron, C. The EU Circular Economy and Its Relevance to Metal Recycling. Recycling 2016, 1, 242–253. [Google Scholar] [CrossRef]
- MDO 2017–2022 MDO Data Online Inc. Available online: https://miningdataonline.com/ (accessed on 9 November 2022).
- NOAH AS Langøya Data Set. 2021. Available online: https://ldas.gsfc.nasa.gov/gldas (accessed on 9 November 2022).
- Loginova, E.; Volkov, D.S.; van de Wouw, P.M.F.; Florea, M.V.A.; Brouwers, H.J.H. Detailed Characterization of Particle Size Fractions of Municipal Solid Waste Incineration Bottom Ash. J. Clean. Prod. 2019, 207, 866–874. [Google Scholar] [CrossRef]
- Chimenos, J.M.; Segarra, M.; Fernández, M.A.; Espiell, F. Characterization of the Bottom Ash in Municipal Solid Waste Incinerator. J. Hazard. Mater. 1999, 64, 211–222. [Google Scholar] [CrossRef]
- del Valle-Zermeño, R.; Gómez-Manrique, J.; Giro-Paloma, J.; Formosa, J.; Chimenos, J.M. Material Characterization of the MSWI Bottom Ash as a Function of Particle Size. Effects of Glass Recycling over Time. Sci. Total Environ. 2017, 581–582, 897–905. [Google Scholar] [CrossRef] [Green Version]
- Keber, S.; Elwert, T.; Schirmer, T.; Goldmann, D. Characterization of Fine Fractions from the Processing of Municipal Solid Waste Incinerator Bottom Ashes for the Potential Recovery of Valuable Metals. Minerals 2020, 10, 838. [Google Scholar] [CrossRef]
- Quicker, P. Waste, 7. Thermal Treatment. In ULLMANN’S Encyclopedia of Industrial Chemistry; Wiley-VCH: Weinheim, Germany, 2020. [Google Scholar] [CrossRef]
- Goclawska, J.A. The Mineral Industry of Sweden. In 2017–2018 Minerals Yearbook; USGS National Minerals Information Center: Reston, VA, USA, 2022; Volume 8. [Google Scholar]
- Šyc, M.; Krausová, A.; Kameníková, P.; Šomplák, R.; Pavlas, M.; Zach, B.; Pohořelý, M.; Svoboda, K.; Punčochář, M. Material Analysis of Bottom Ash from Waste-to-Energy Plants. Waste Manag. 2018, 73, 360–366. [Google Scholar] [CrossRef] [PubMed]
- Nedkvitne, E.N.; Borgan, Ø.; Eriksen, D.Ø.; Rui, H. Variation in Chemical Composition of MSWI Fly Ash and Dry Scrubber Residues. Waste Manag. 2021, 126, 623–631. [Google Scholar] [CrossRef]
- Koppelaar, R.H.E.M.; Koppelaar, H. The Ore Grade and Depth Influence on Copper Energy Inputs. Biophys. Econ. Resour. Qual. 2016, 1, 11. [Google Scholar] [CrossRef] [Green Version]
- Calvo, G.; Mudd, G.; Valero, A.; Valero, A. Decreasing Ore Grades in Global Metallic Mining: A Theoretical Issue or a Global Reality? Resources 2016, 5, 36. [Google Scholar] [CrossRef] [Green Version]
- Crowson, P. Mine Size and the Structure of Costs. Resour. Policy 2003, 29, 15–36. [Google Scholar] [CrossRef]
- Napier-Munn, T. Is Progress in Energy-Efficient Comminution Doomed? Miner. Eng. 2015, 73, 1–6. [Google Scholar] [CrossRef]
- Ballantyne, G.R.; Powell, M.S. Benchmarking Comminution Energy Consumption for the Processing of Copper and Gold Ores. Miner. Eng. 2014, 65, 109–114. [Google Scholar] [CrossRef] [Green Version]
- Drobe, M.; Haubrich, F.; Gajardo, M.; Marbler, H. Processing Tests, Adjusted Cost Models and the Economies of Reprocessing Copper Mine Tailings in Chile. Metals 2021, 11, 103. [Google Scholar] [CrossRef]
- Purgar, A.; Winter, F.; Blasenbauer, D.; Hartmann, S.; Fellner, J.; Lederer, J.; Rechberger, H. Main Drivers for Integrating Zinc Recovery from Fly Ashes into the Viennese Waste Incineration Cluster. Fuel Process. Technol. 2016, 141, 243–248. [Google Scholar] [CrossRef]
- World’s First Ash2Salt Plant Opens Soon. Available online: https://www.ragnsells.com/what-we-do/inspired/worlds-first-ash2salt-plant-opens-soon/ (accessed on 2 February 2023).
- Asafu-Adjaye, J.; Mahadevan, R. How Cost Efficient Are Australia’s Mining Industries? Energy Econ. 2003, 25, 315–329. [Google Scholar] [CrossRef]
- Wang, L.; Yin, S.; Wu, A. Ore Agglomeration Behavior and Its Key Controlling Factors in Heap Leaching of Low-Grade Copper Minerals. J. Clean. Prod. 2021, 279, 123705. [Google Scholar] [CrossRef]


| Variable, Symbol, [Unit] | Value | SD | Source |
|---|---|---|---|
| , [wt%] | 0.27 | 0.04 | Langøya data set |
| , [wt%] | 1.09 | 0.04 | Langøya data set |
| , [wt%] | 0.26 | 0.02 | Langøya data set |
| , [%] | 3.00 | 0.2 | [15] |
| , [%] | 27.5 | 2 | [15] |
| , [%] | 20.00 | 3 | [1] |
| , [t] | 350,000 | – | NOAH AS [10] |
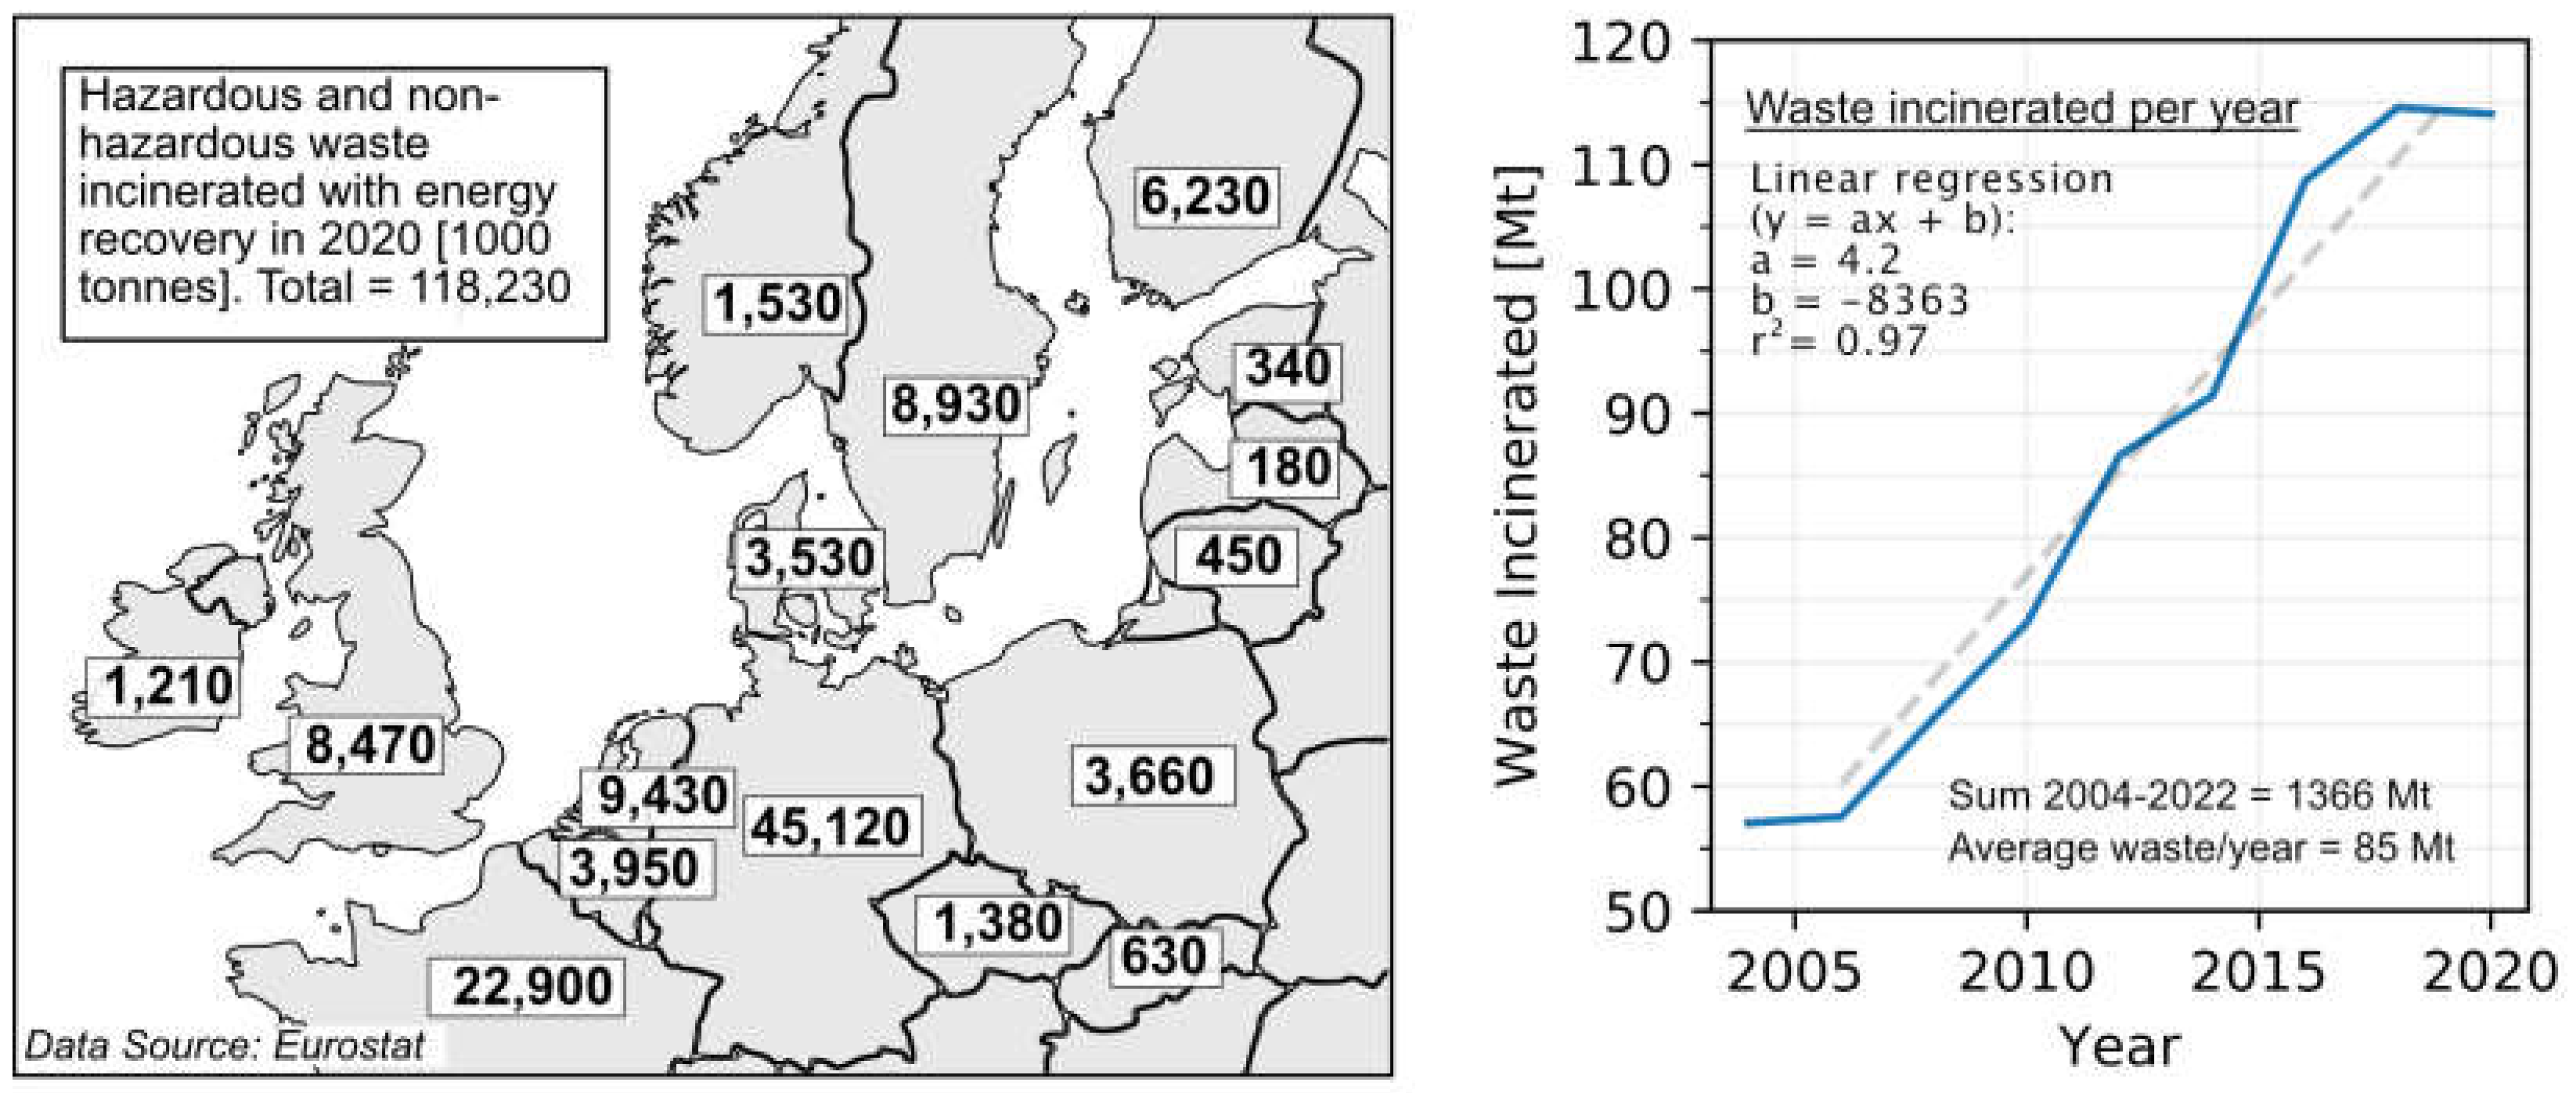
| [t] | 118,200,000 | – | Eurostat [5] |
| Case | Variable | Mass Flow [t/Year] | Percentage of SWE1–3 [%] 1 | Percentage of NOR1–2 [%] 2 |
|---|---|---|---|---|
| Case 1: MSWI fly ash processed at Langøya | Ash | 350,000 | – | – |
| Cu | 900 ± 100 | 0.9 ± 0.1 | 2.4 ± 0.4 | |
| Zn | 3800 ± 100 | 1.5 ± 0.1 | 1.1 ± 0.1 | |
| Pb | 900 ± 100 | 1.3 ± 0.1 | – | |
| Case 2: Case 1 plus related bottom ash fines | Ash | 995,000 ± 116,000 | – | – |
| Cu | 2700 ± 500 | 2.7 ± 0.5 | 6.9 ± 1.3 | |
| Zn | 10,900 ± 1300 | 4.3 ± 0.5 | 3.1 ± 0.4 | |
| Pb | 2500 ± 400 | 3.6 ± 0.5 | – | |
| Case 3: MSWI fly ash from northern Europe | Ash | 3,546,000 ± 535,000 | – | – |
| Cu | 9600 ± 2000 | 9.6 ± 2.0 | 24.6 ± 5.2 | |
| Zn | 38,700 ± 6000 | 15.5 ± 2.5 | 11.1 ± 1.8 | |
| Pb | 9100 ± 1500 | 13.0 ± 2.2 | – | |
| Case 4: Case 3 plus related bottom ash fines | Ash | 10,072,000 ± 1,113,000 | – | – |
| Cu | 27,300 ± 5100 | 27.3 ± 5.2 | 70.0 ± 13.3 | |
| Zn | 110,100 ± 12,800 | 44.0 ± 5.3 | 31.4 ± 3.8 | |
| Pb | 25,800 ± 3500 | 36.8 ± 5.2 | – |
| Mine | Head Grade | Annual Production |
|---|---|---|
| Mount Milligan Mine (CA) | 0.23% Cu, 0.39 g/t Au | 25,800 t Cu (2016) |
| Aitik Mine (SE) | 0.28% Cu, 0.2 g/t Au, 2 g/t Ag | 99,300 t Cu (2018) |
| Sierrita Mine (US) | 0.23% Cu, 0.02% Mo | 68,900 t Cu (2018) |
| Mount Polley Mine (CA) | 0.38% Cu, 0.3 g/t Au, 0.9 g/t Ag | 6791 t Cu (2018) |
| Pinto Valley Mine (US) | 0.35% Cu, 0.007% Mo | 58,513 t Cu (2021) |
| Constancia Mine (PE) | 0.31% Cu, 89 g/t Mo, 0.07 g/t Au, 3.04 g/t Ag | 122,178 t Cu (2018) |
Disclaimer/Publisher’s Note: The statements, opinions and data contained in all publications are solely those of the individual author(s) and contributor(s) and not of MDPI and/or the editor(s). MDPI and/or the editor(s) disclaim responsibility for any injury to people or property resulting from any ideas, methods, instructions or products referred to in the content. |
© 2023 by the authors. Licensee MDPI, Basel, Switzerland. This article is an open access article distributed under the terms and conditions of the Creative Commons Attribution (CC BY) license (https://creativecommons.org/licenses/by/4.0/).
Share and Cite
Nedkvitne, E.N.; Eriksen, D.Ø.; Omtvedt, J.P. Grade and Tonnage Comparison of Anthropogenic Raw Materials and Ores for Cu, Zn, and Pb Recovery. Resources 2023, 12, 33. https://doi.org/10.3390/resources12030033
Nedkvitne EN, Eriksen DØ, Omtvedt JP. Grade and Tonnage Comparison of Anthropogenic Raw Materials and Ores for Cu, Zn, and Pb Recovery. Resources. 2023; 12(3):33. https://doi.org/10.3390/resources12030033
Chicago/Turabian StyleNedkvitne, Eirik Nøst, Dag Øistein Eriksen, and Jon Petter Omtvedt. 2023. "Grade and Tonnage Comparison of Anthropogenic Raw Materials and Ores for Cu, Zn, and Pb Recovery" Resources 12, no. 3: 33. https://doi.org/10.3390/resources12030033