1. Introduction
The amount of municipal solid waste generated worldwide is continuously increasing. According to the World Bank, in 2017, about 2.1 billion tons per year of solid waste was generated, and this is expected to reach 3.4 billion tons by the year 2050 [
1]. Providing a reasonable level of solid waste management services while ensuring the financial sustainability of the system is a serious challenge for many municipalities around the world [
2,
3]. Issuing policies to manage solid waste is an important step; however, this will not be sufficient unless accompanied with budget allocation and well-trained personnel to implement such policies.
Financial viability through cost recovery is an essential requirement for the efficiency and reliability of solid waste management services [
4]. Therefore, the availability of financial resources is a prerequisite for the provision of services with reasonable quality. However, this is not the case in many cities around the world, where municipalities are facing challenges in putting a tariff system in place that is robust and fair to achieve the cost recovery and sustainability of the services. For example, cities in developing countries often face problems that are beyond the ability of the local communities to solve, mainly due to lack of financial resources and system multi-dimensionality [
5]. Applying the 4Rs policy “reduce, reuse, recycle, and recover” could achieve an optimistic solution in financial sustainability, yet such practices are almost non-existent in most developing cities [
6].
There is a scarcity in the literature and studies on charging for municipal solid waste (MSW) services, especially in developing countries [
3,
7,
8,
9]. Lohri et al. (2014) [
2] proposed some alternatives to enhance the sustainability of the solid waste management system in Ethiopia. The recommended alternatives included linking the fees of the solid waste collection to water supply, increasing the value chain of the sale of organic waste products and diversifying revenue streams and financing mechanisms. Welivita et al. (2015) [
7] reviewed various charging methods adopted in different countries, including flat rate, volume-based and weight-based charging methods. The researchers recommended the pre-paid bag-based charging method as a suitable means of fee collection for the solid waste service provision in developing countries. To ensure the sustainability of the solid waste management services, municipalities in developing countries should work towards full cost recovery [
10].
It deserves note that in the waste sector, tariff system structuring is a complex issue, particularly in countries with less incentives to reduce waste [
8,
11], and there is not a universal solid waste management tariff structure that suits all countries. Various countries are adopting various charging systems for solid waste services [
3]. This is basically linked to the socio-cultural characteristics, economic system and level of development in each country. Therefore, when choosing charging alternatives for solid waste services, one should consider that what suits developing countries is different from that in developed ones [
12], which implies that transferring such systems directly to developing countries is not a straightforward task.
Flat rate systems are widespread in the Arab region and other developing cities due to their flexibility in functioning and applicability for various waste sectors as well as the guarantee of achieving a stable and permanent revenue rate. However, it faces several obstacles; many developing cities are suffering from the issue that the amount of waste fees being collected is less than the cost of solid waste service delivery, which results in low cost recovery [
13,
14]. Furthermore, such a system does not encourage waste reduction through reuse and recycling.
Sustainability comprises social, environmental and economic aspects. When considering the solid waste management systems, economic feasibility is the easiest among the three aspects in measuring the sustainability [
15]. Circular economy is an option that will help in moving towards sustainable waste management systems [
16], where it is gaining increased interest by many countries around the world. Moving from the traditional linear economic model into a circular one will keep products, materials and resources in the system as long as possible, which will result in waste minimization [
17].
The development of methods or models that allow the economic evaluation of MSW management systems is essential [
18]. Simulation models such as system dynamic modeling (SDM) lend themselves as an effective tool to simulate complex systems such as solid waste management [
19]. Such models may assist managers in making informed decisions to manage solid waste systems in an optimal manner [
20]. For example, Kollikkathara and Yu (2010) [
21] developed an SDM that divided the solid waste management system into simpler sub-processes. As a result, it was possible to assess the impact of decision options on solid waste generation, the remaining landfill life and the cost and benefits of different waste management options. Another study by Ding et al. (2016) [
22] applied SDM to simulate the environmental benefits of construction waste reduction, while Sukholtman and Sharp (2016) [
19] employed the SDM to investigate the relationships between source separation activities and the effectiveness of waste management in the city of Bangkok. Fan et al. (2018) [
23] adopted SDM in simulating and predicting electronic waste in Taiwan.
Despite the fact that many studies have used SDM in the field of solid waste management, research investigating the multiple policies’ impacts on solid waste management systems using the SDM simulation is still rare [
24,
25]. This is especially true for developing countries, where integrated sustainable waste management needs a deeper system analysis using SDM [
26]. Therefore, there is a pressing need to develop models that can simulate the impact of various policies on the financial sustainability of the solid waste systems, so as to provide the policy makers with useful tools to assess the impact of various policy options [
27].
The recently ratified National Waste Management Strategy (NSWMS, 2015) [
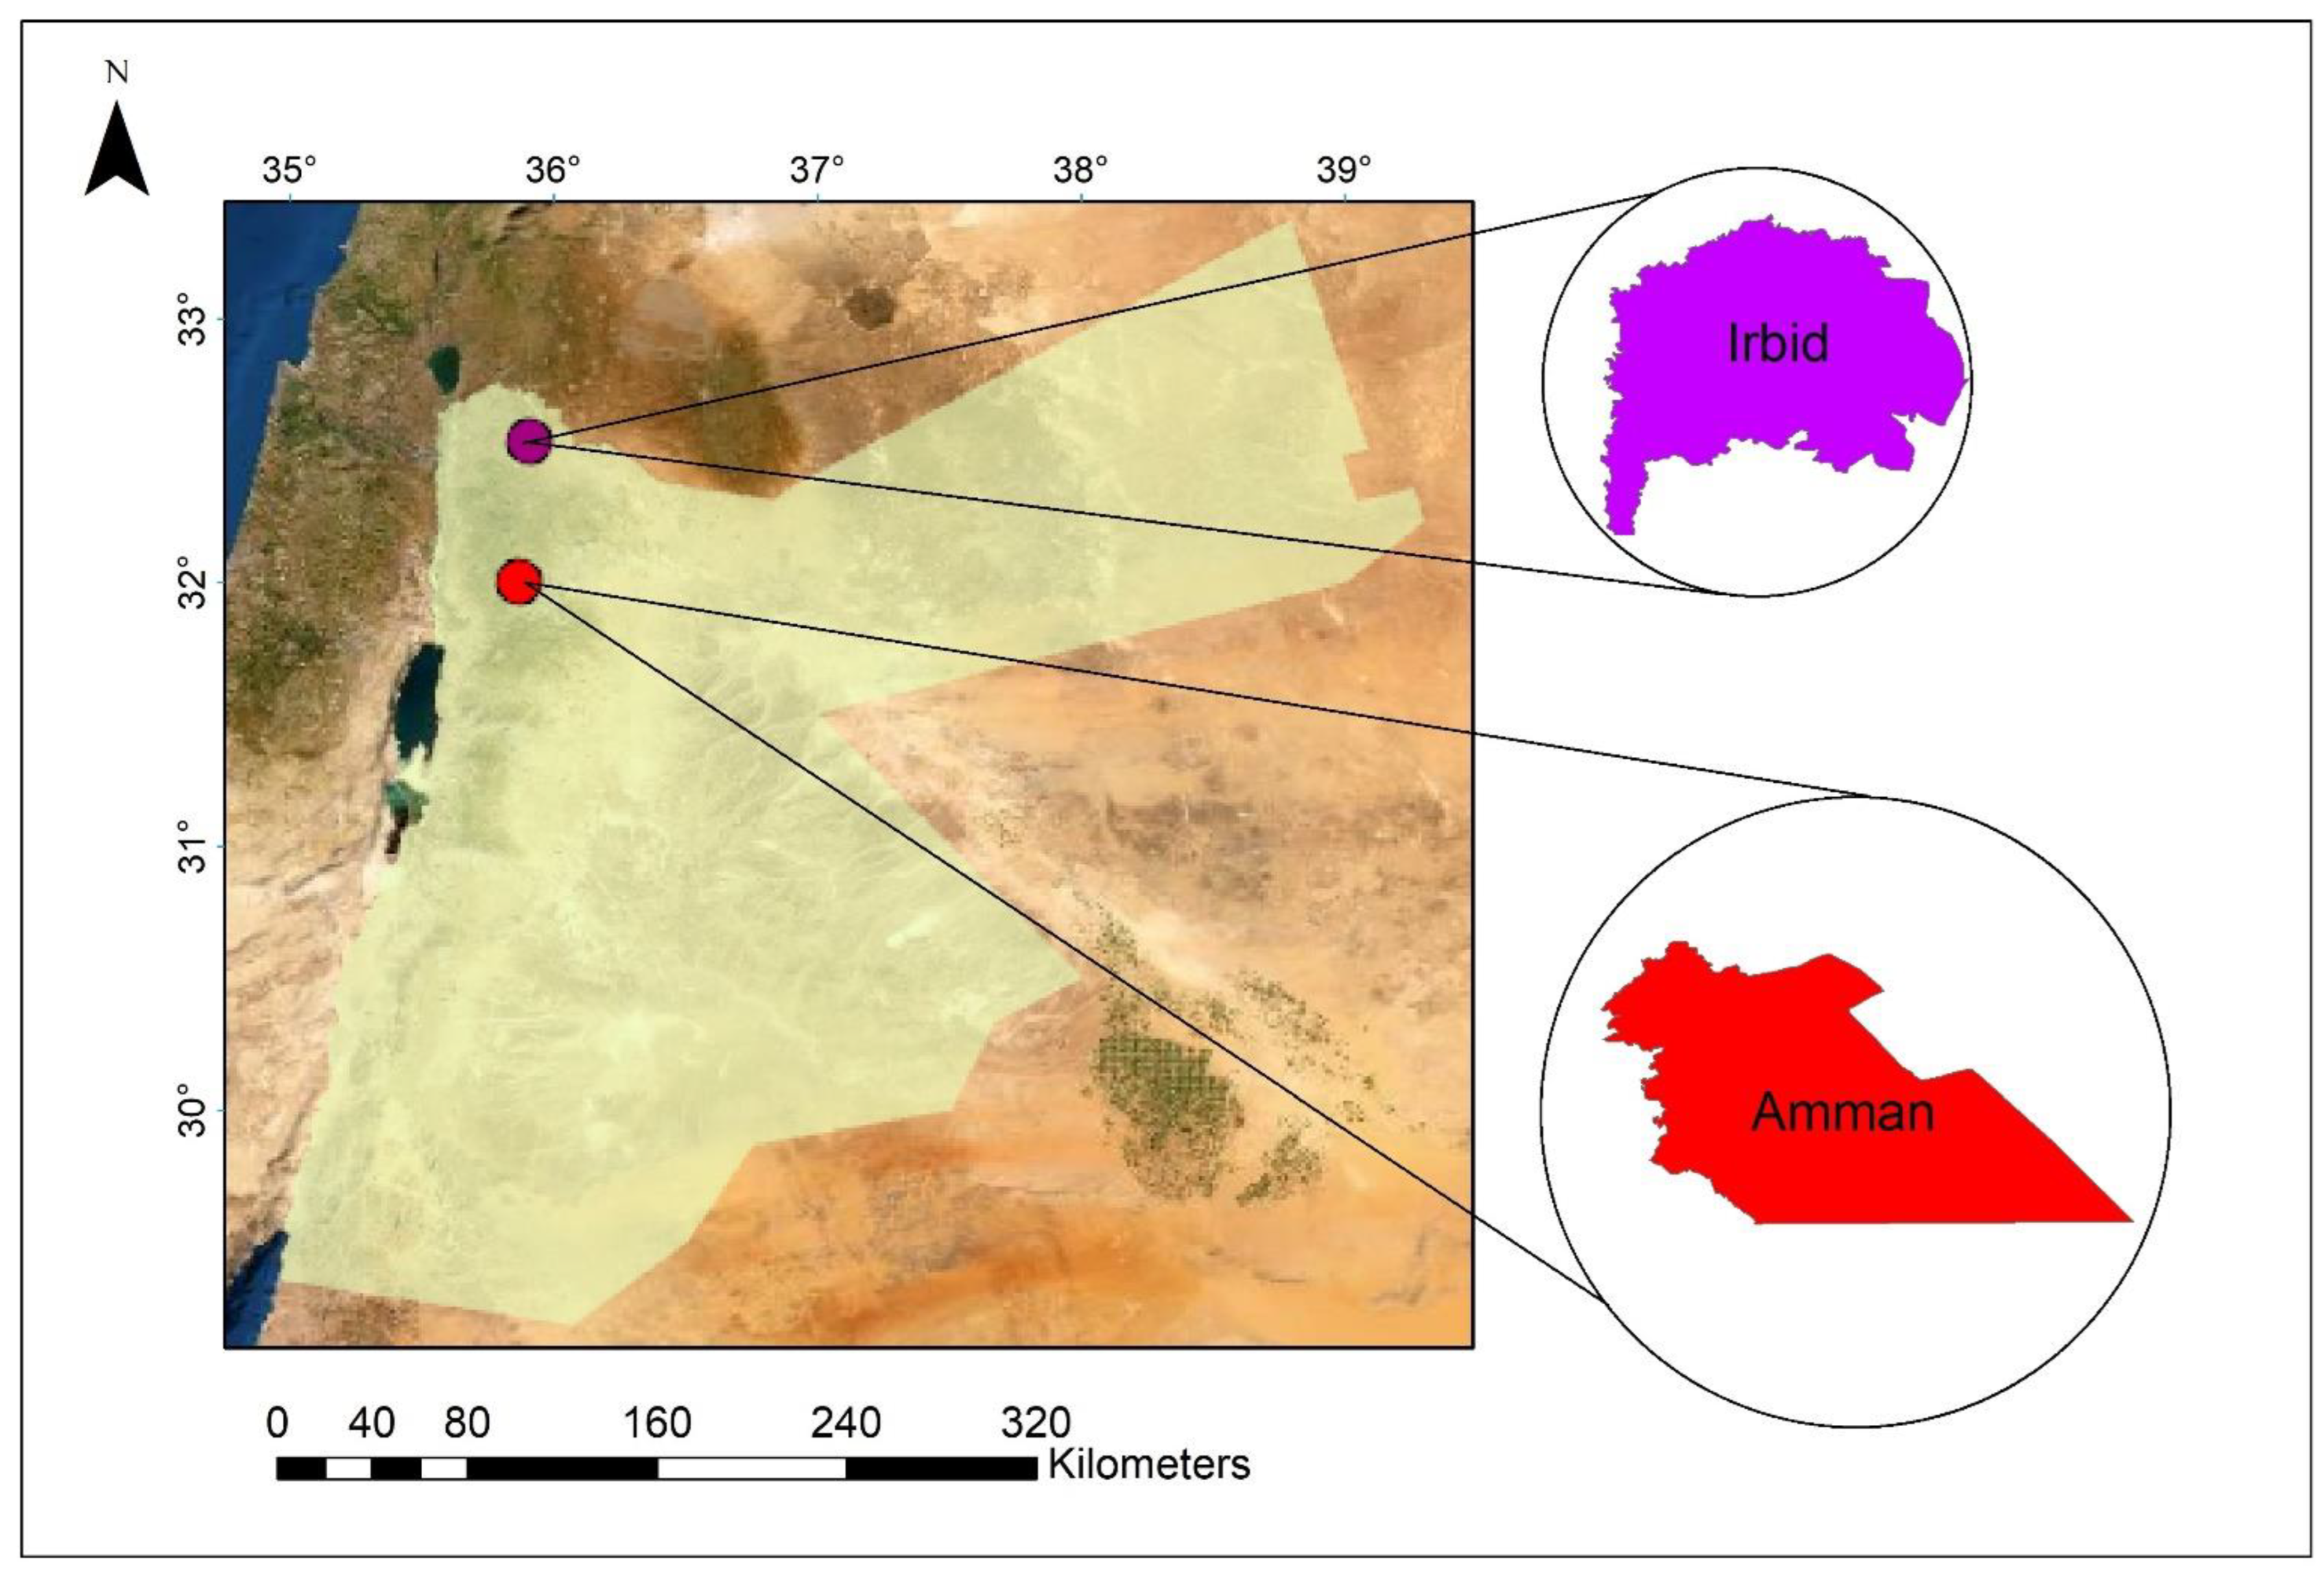
28] of Jordan is calling for the adoption and enhancement of circular economy principles in the solid waste sector. Among the strategic objectives of the strategy is the gradual increase of the fees and enhancing the reuse, recovery and recycling of materials from the solid waste stream. It is planned that 50% of the recyclables (paper, metal, plastic and glass) and 75% of the bio-waste from the landfills will be diverted to recycling and composting facilities by 2034. Therefore, the main objective of the present paper is to analyze the current financial performance of the solid waste management sector in Jordan by reviewing the financial aspects of the two largest municipalities in the country, namely Greater Amman (GAM) and Greater Irbid (GIM) municipalities (
Figure 1). Furthermore, scenarios based on the recent changes in the solid waste management policies to move towards circular economy in Jordan were analyzed and the role of such policies in enhancing the financial efficiency and sustainability was evaluated using system dynamic modeling (SDM).
3. Methodology
A major and important component of any integrated solid waste management plan is the economic feasibility of the selected options. Therefore, one of the strategic objectives of the Jordanian National Solid Waste Management Strategy (NSWMS) of 2015 is to create a financial system that will enable achieving an integrated and sustainable solid waste management system in the country. Developing such a system will be mainly achieved by the adoption of circular economy principles.
3.1. Financial Analysis and Scenarios
Financial analysis of the current solid waste management in the two municipalities (GAM and GIM) was carried out. Data on the amounts of solid waste generated and the cost and revenues of the solid waste management from the two municipalities were collected and assessed. Data of the year 2016 were taken as a baseline for both municipalities as this year represents the situation just before starting the implementation of the strategy actions. Based on the collected data, financial indicators such as cost per ton, cost recovery, capital and operation and maintenance costs were estimated. After conducting the financial analysis of the solid waste management systems for both GAM and GIM, three scenarios were considered as follows:
- a.
Baseline scenario (Business as usual)
The baseline scenario involves continuing with the current solid waste management practices in both municipalities, where 90% of the solid waste is disposed into landfills and 10% is recycled, while the tariff system remains the same as well in both municipalities. Population within the two municipalities will be increased by 2.2%.
- b.
Mid-Term Scenario (Rationalization and gradual increase in the fees)
According to the NSWMS, a mid-term scenario until 2024 is based on improving the cost recovery of the solid waste management services through cost reduction by means of operation rationalization, optimal collection routing and labor redistribution among the service zones. This is expected to decrease the cost by 25% in the next 5 years. Due to the COVID-19 pandemic outbreak, this scenario has been delayed and is expected to start in 2022 and will be extended to the year 2026. It is assumed that starting from the year 2022, the annual cost reduction as a result of the improvement and rationalization of the solid waste management operations will be 5%. In addition, the NSWMS recommends increasing the solid waste service charges during the next 5 years by 25%. Under this scenario, the increase is assumed to be gradual, where each year the charges will be increased by 5% until the year 2026. During the mid-term scenario period (2022–2026), the population is assumed to increase by 2.2%, while the solid waste generated amounts will be increased annually by 3%. Therefore, the interventions under this scenario will increase the revenues annually by 5% and decrease the cost by 5%. However, the amount of landfilled waste will remain 90% as is the case in the first scenario.
- c.
Long-Term Scenario (Circular Economy Options) until the year 2034
According to the NSWMS, starting from the year 2025, several waste treatment facilities will be put into operation. This includes clean material recovery facilities and composting plants for both Amman and Irbid.
Table 1 shows the capacity and estimated cost of such facilities. As is the case in the other scenarios, under this scenario, the population and solid waste generation are assumed to be increased by 2.2% and 3%, respectively.
As it can be seen from
Table 1, the total investment needed under the long-term scenario is USD 139.146 million, while the total annual amount of the solid waste that will be diverted from the landfill is 585,000 tons.
3.2. System Dynamic Simulation
To assess the impacts of implementing the policies recommended by the NSWMS, simulation and analysis of the relationships between different variables were carried out using SDM.
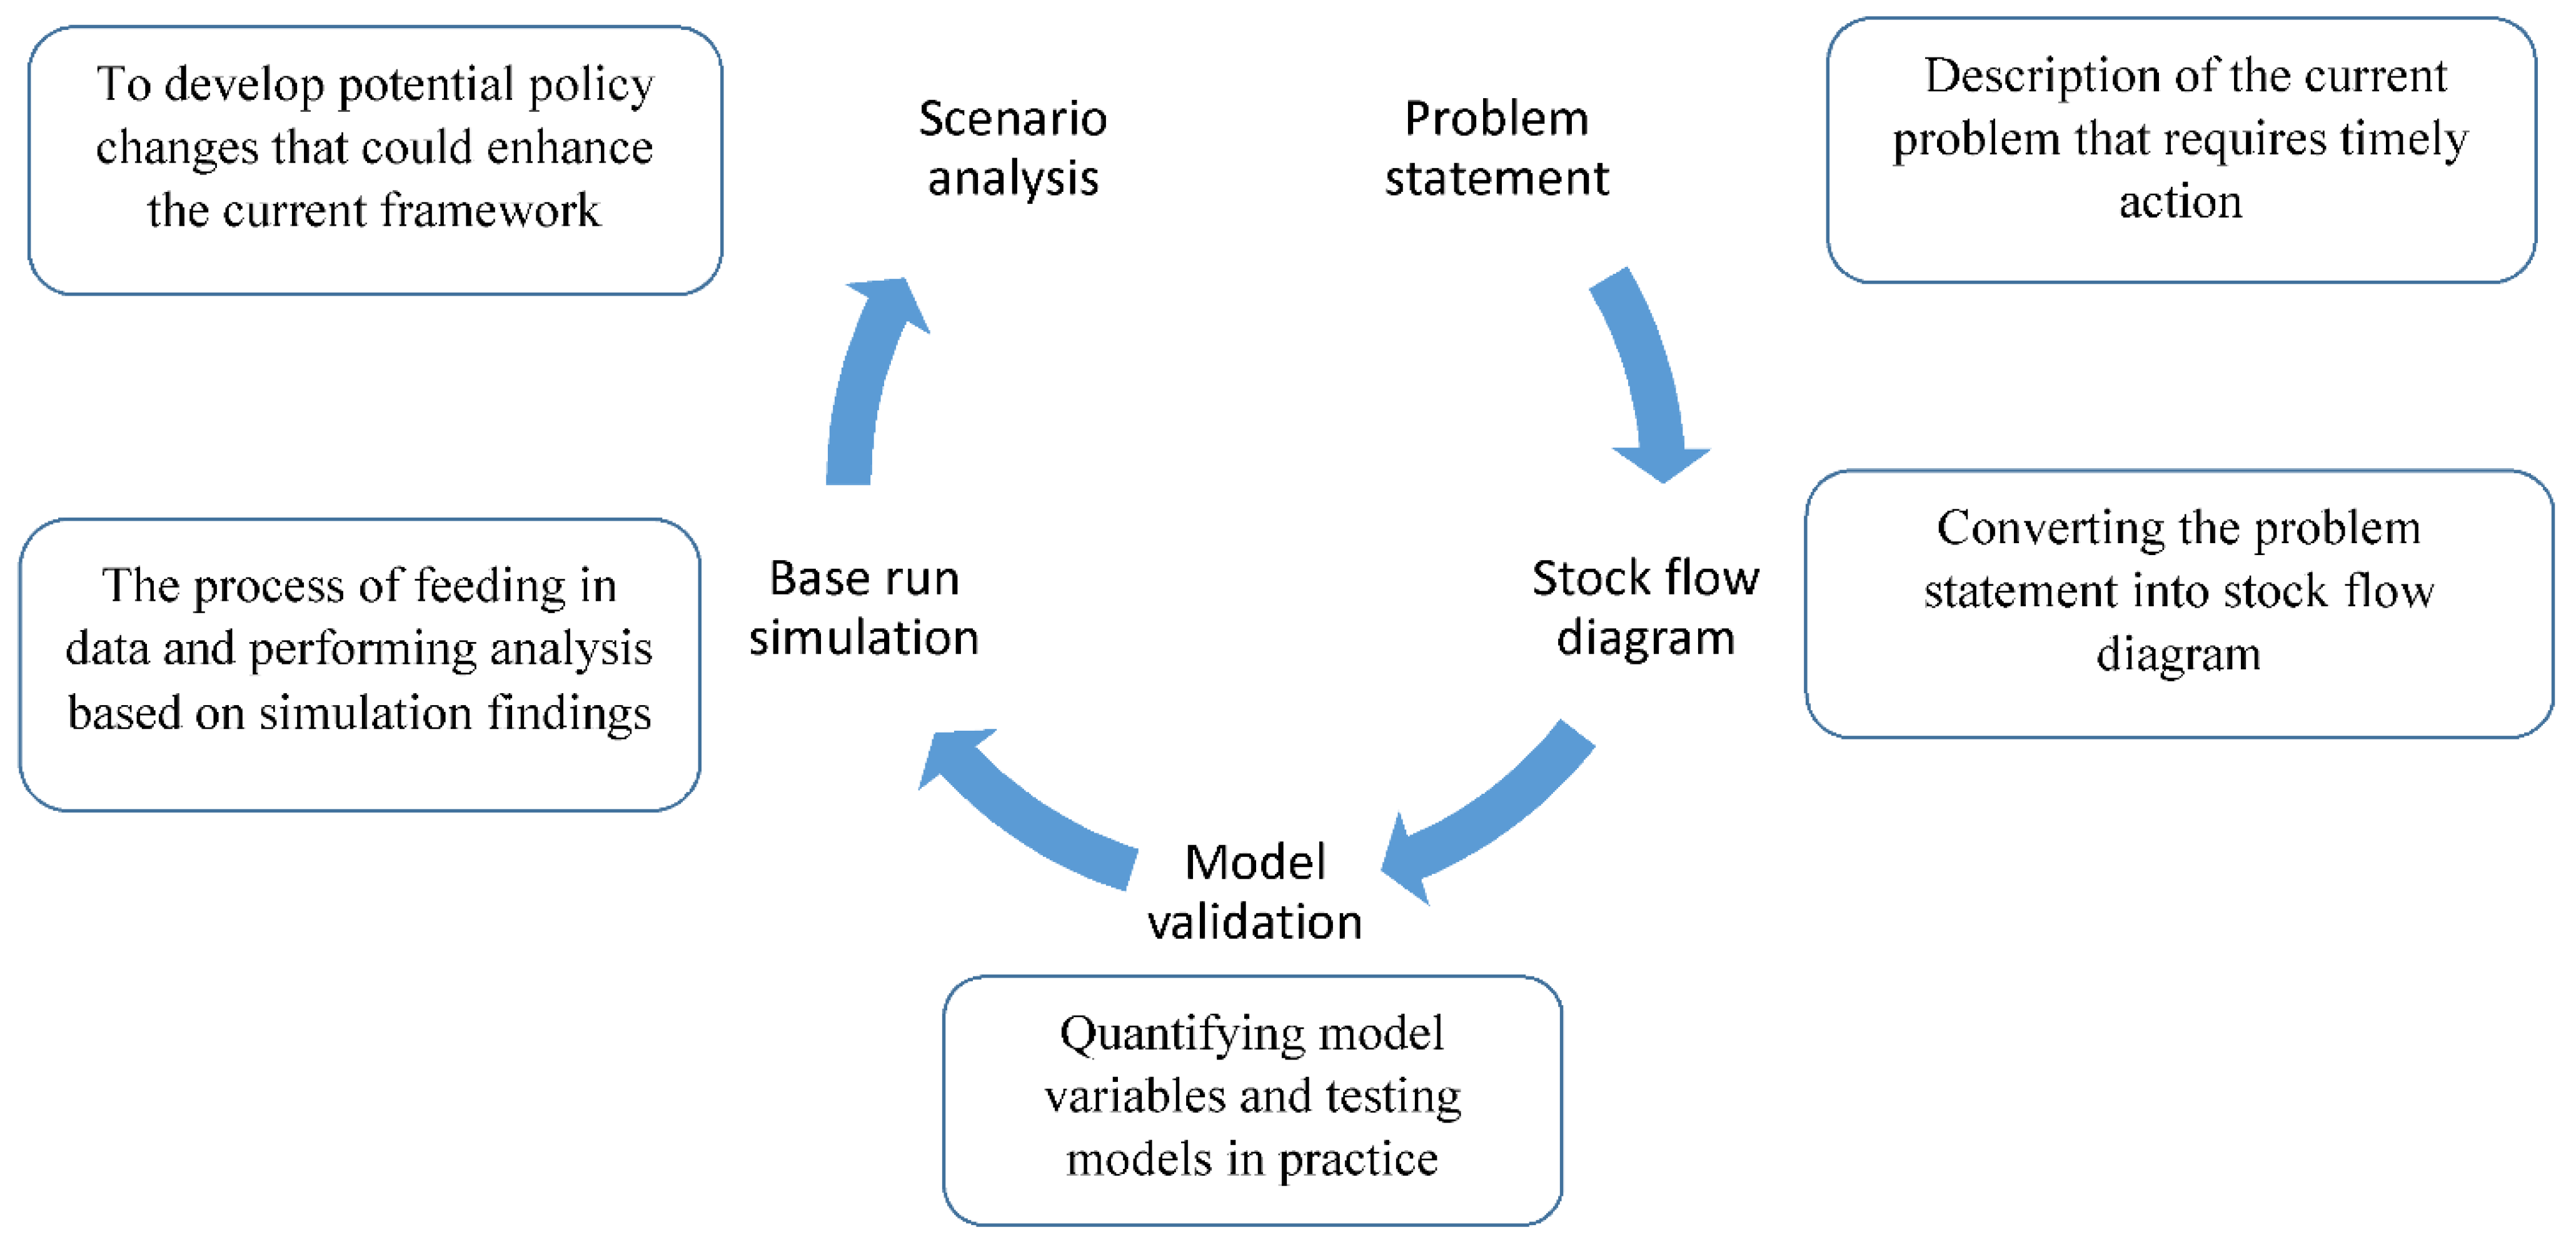
Figure 2 shows the steps that were followed in the SD modeling, which include the problem identification, developing the stock and flow structure of the model, carrying out the simulation and validation process and finally assessing the impacts of the policy options.
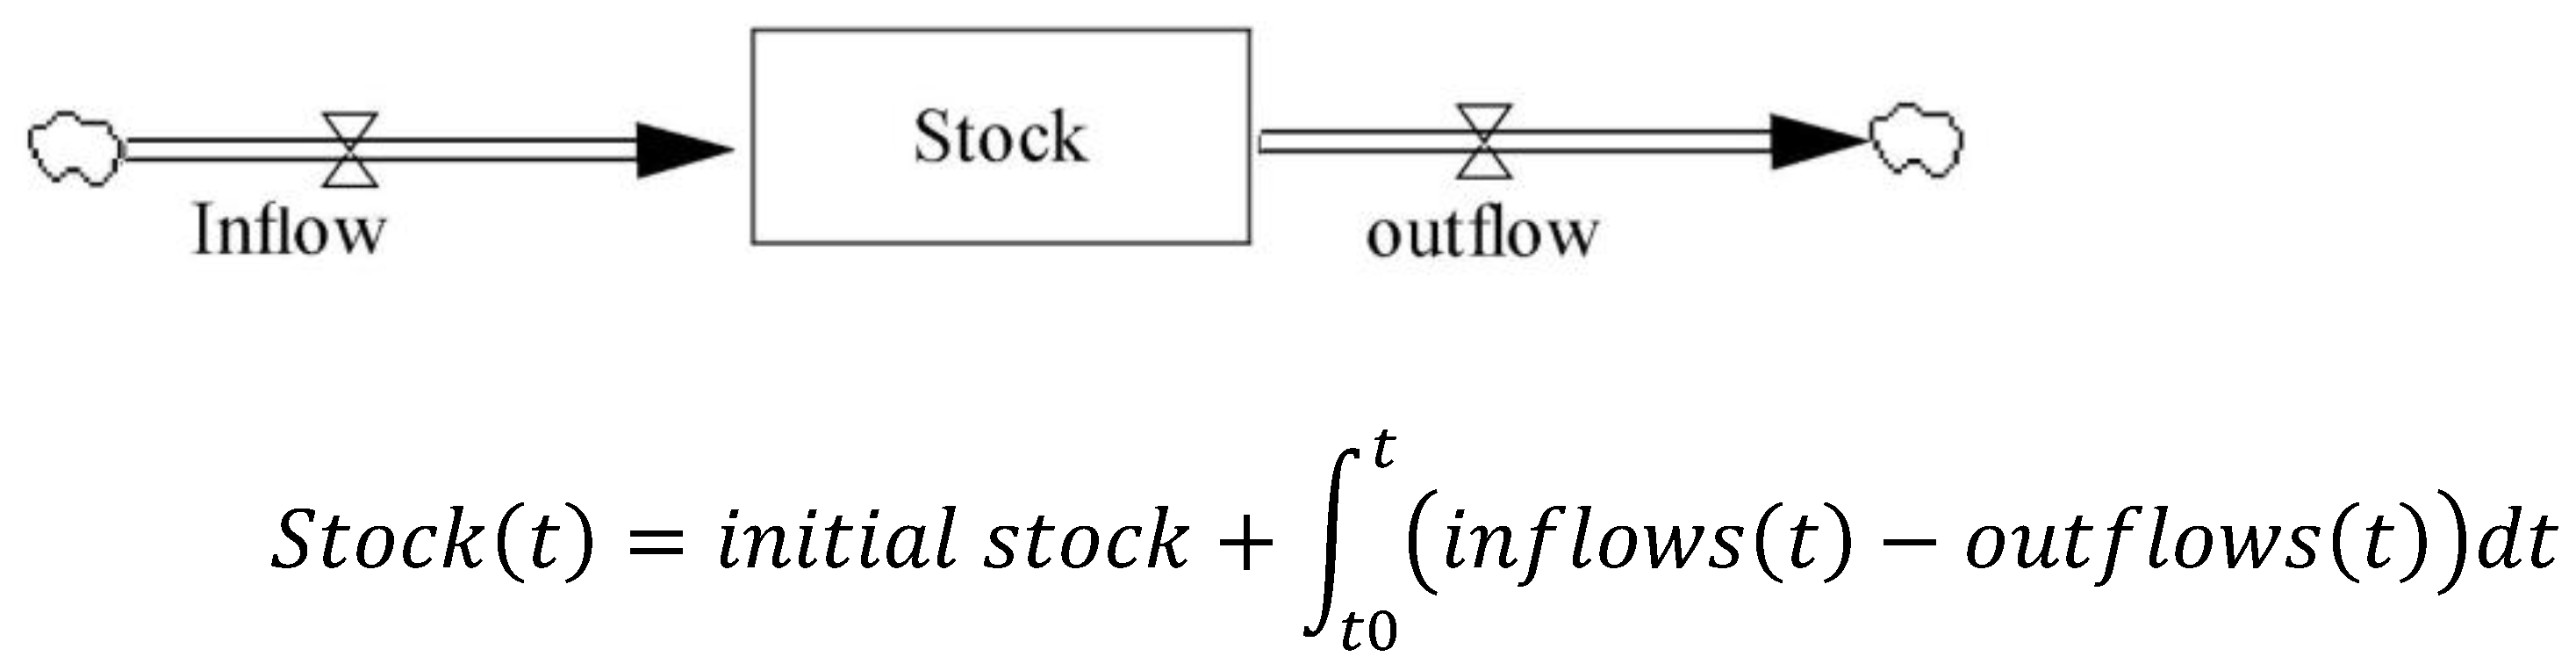
In SDM, stock represents a variable that accumulates slowly over time, while flow represents a variable that changes the stock over time. When a stock is linked with an inflow and an outflow, an initial value of the stock should be added, and the integration between the inflow and outflow at a specified period of time will determine the accumulation value of stock over time (Bala et al., 2017) [
29].
Figure 3 illustrates the mathematical equation of the stock–flow diagram in SDM.
The software that was used in the current study to build the SD model is Vensim, where the numerical solution for the integration (value of the stock) is solved according to the fourth-order Runge-Kutta (RK4) method (Vensim, 2022) [
30]. For the purpose of simulation, the time step selected in the study is one year. The initial values of each stock are given in
Table 2 for both municipalities under the mid-term and long-term scenarios.
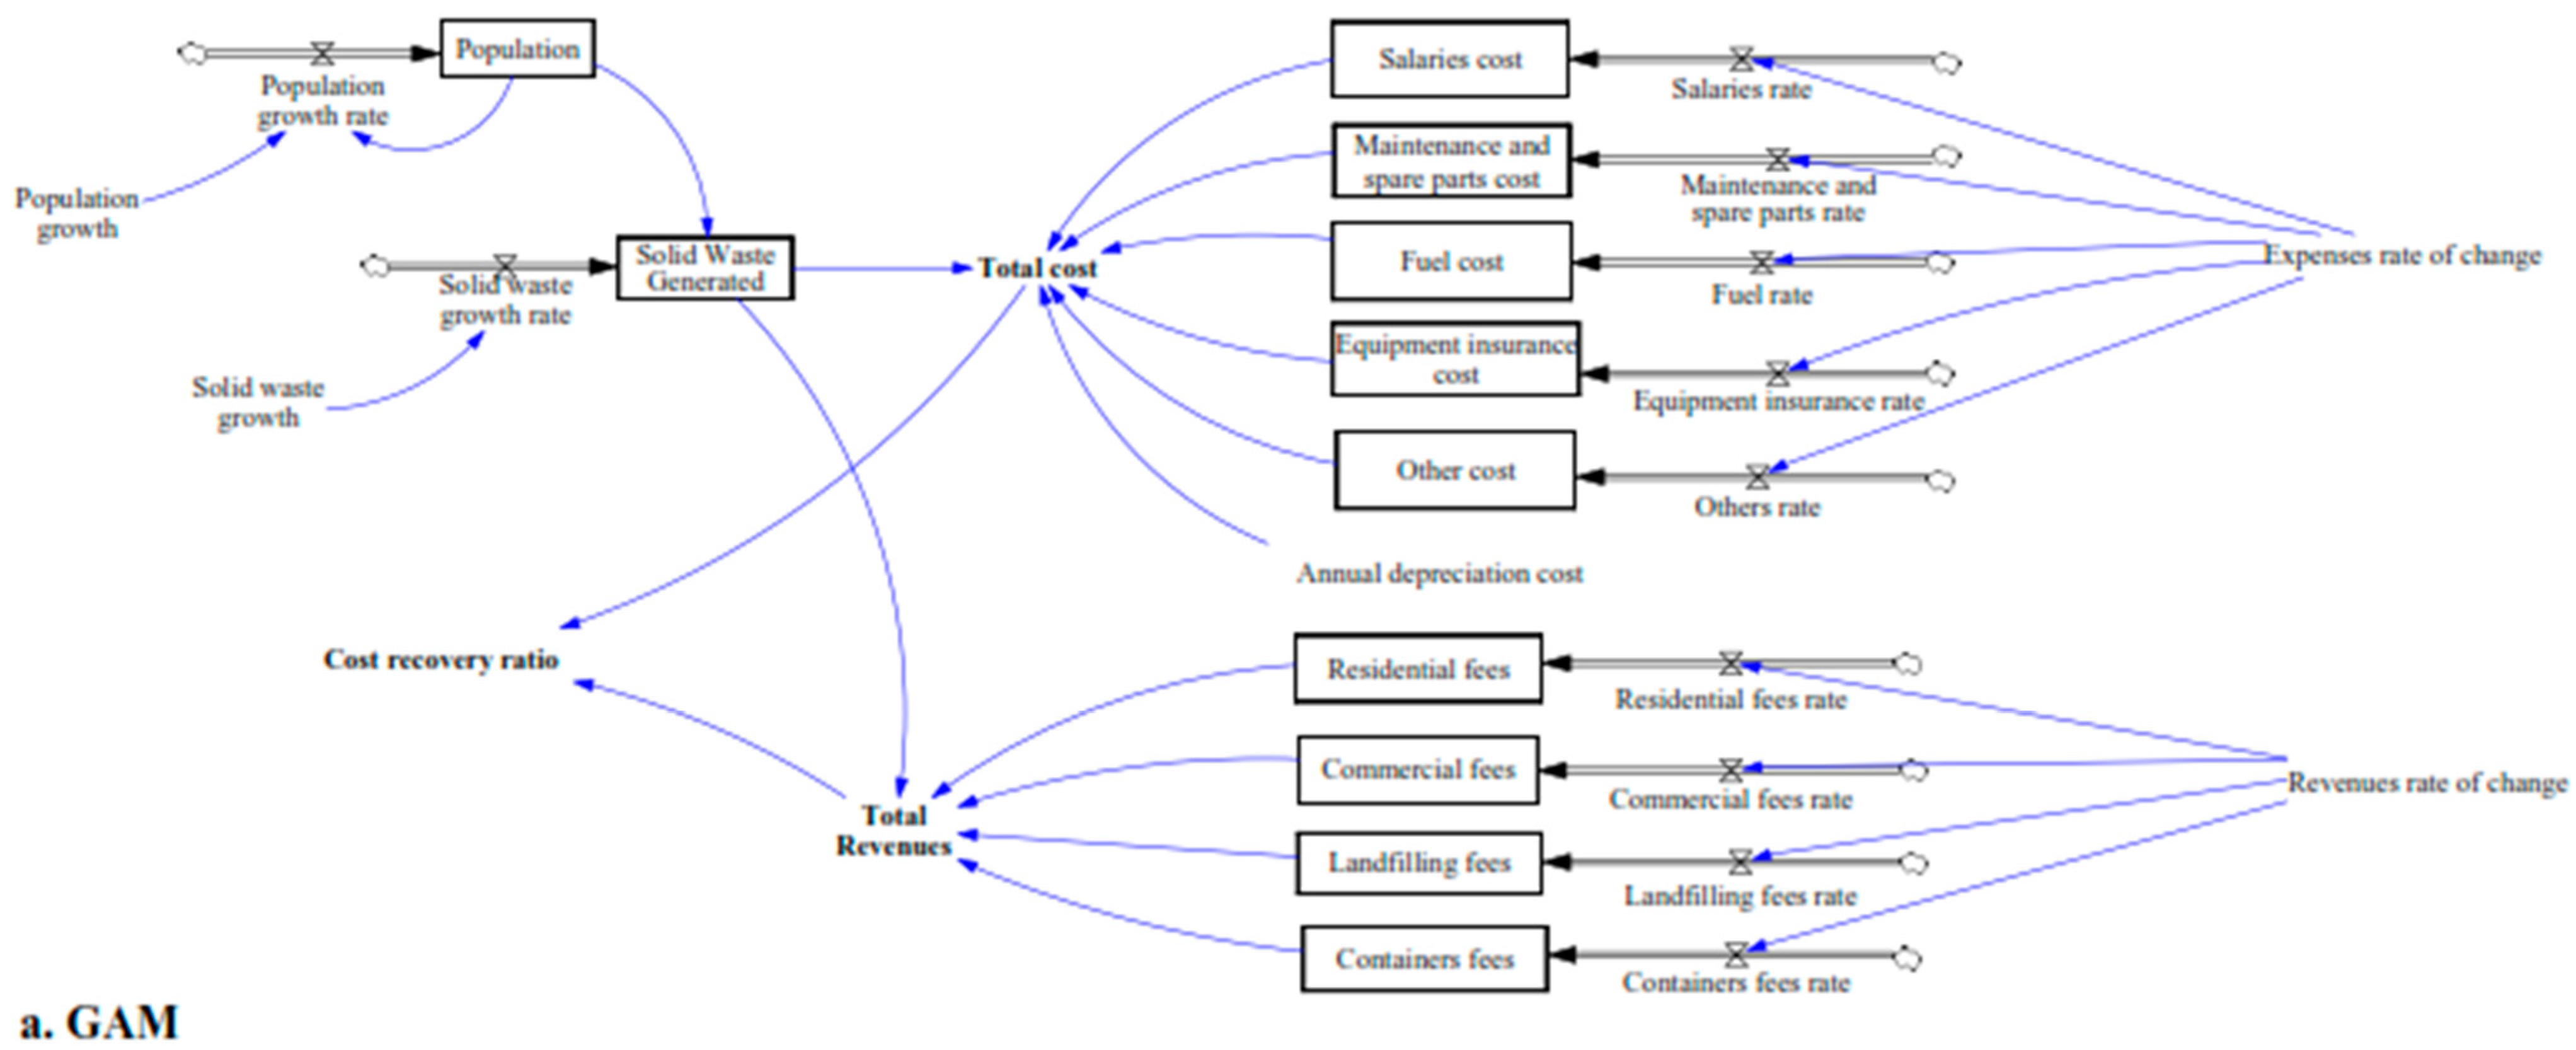
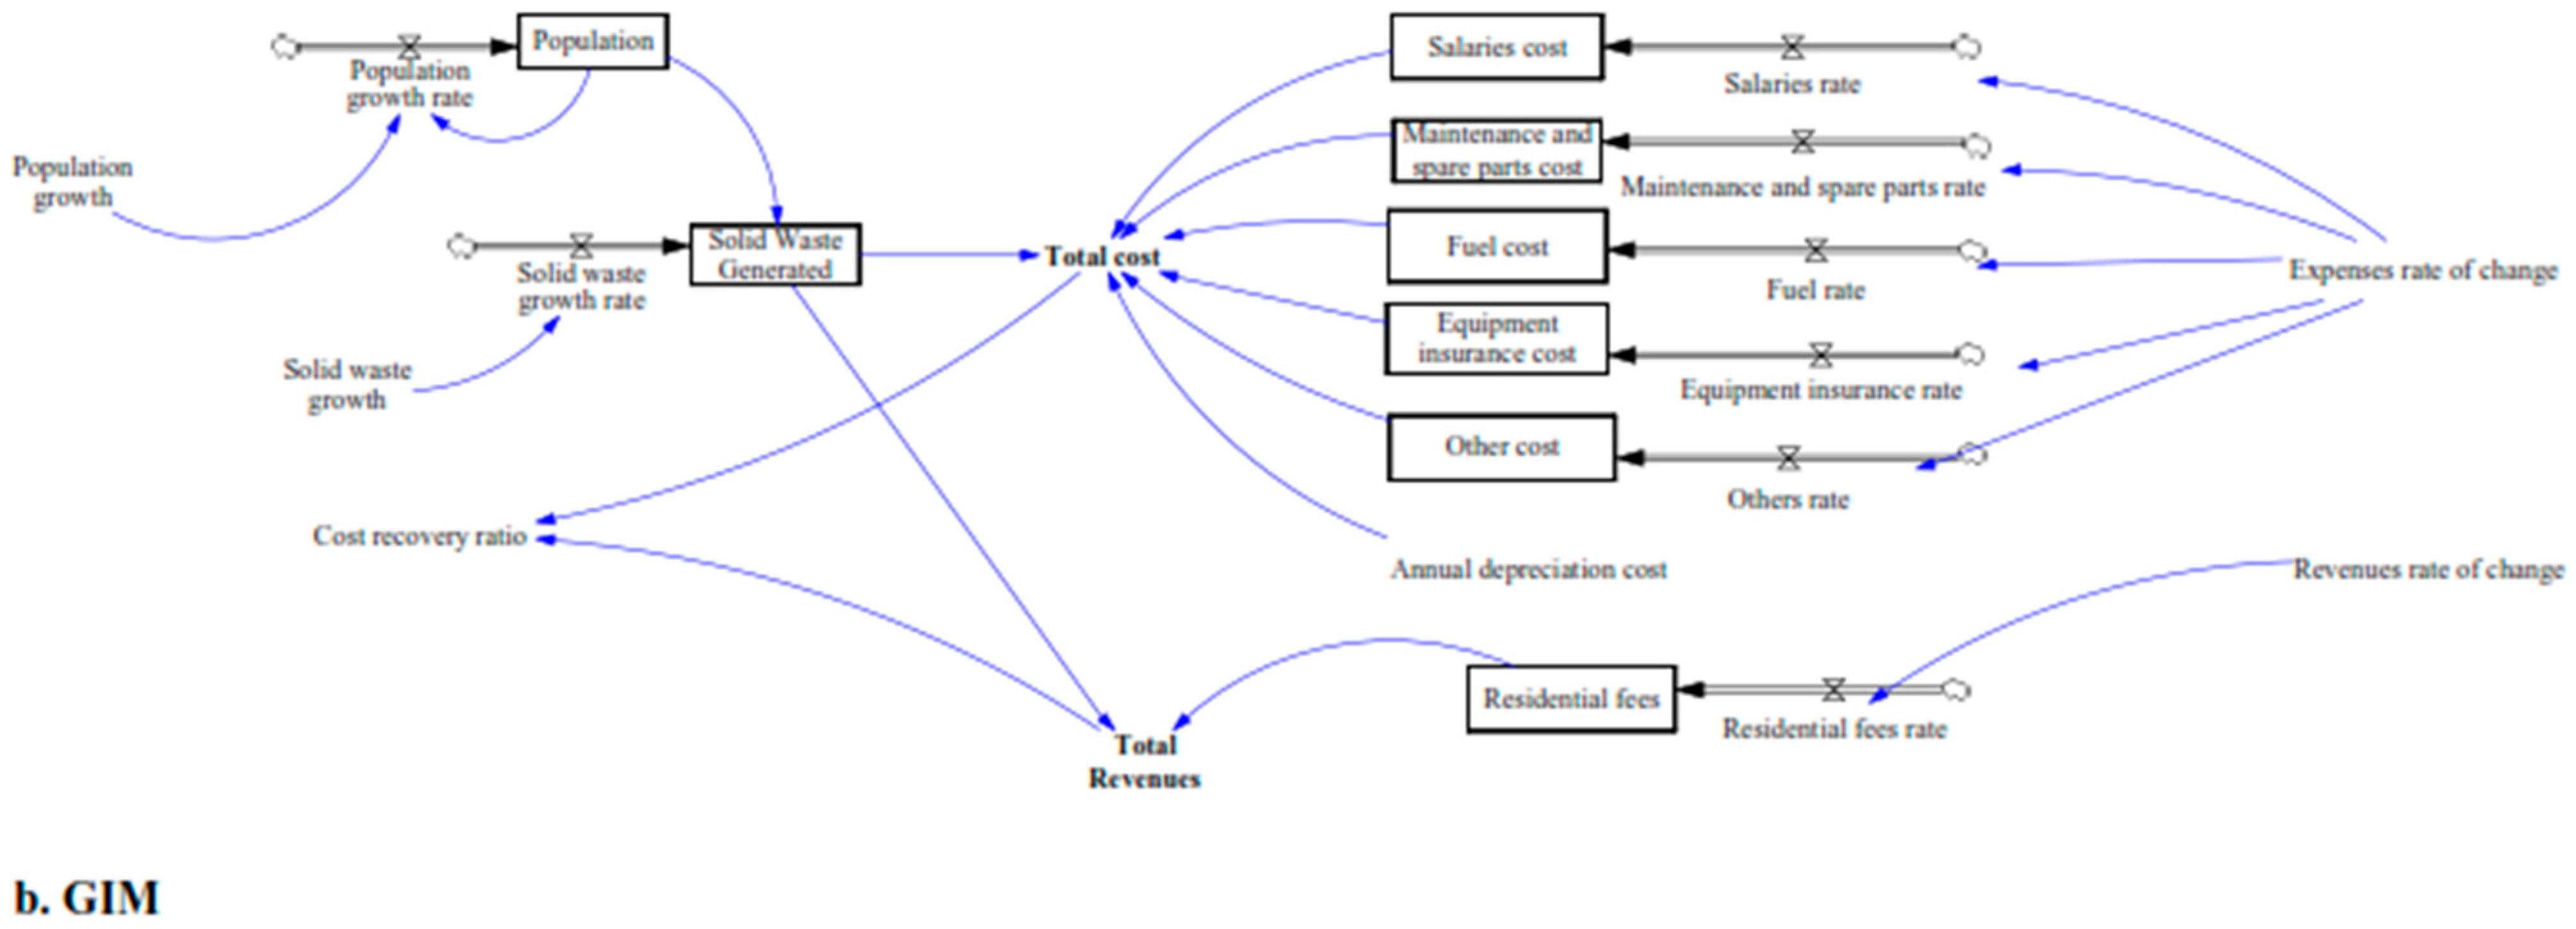
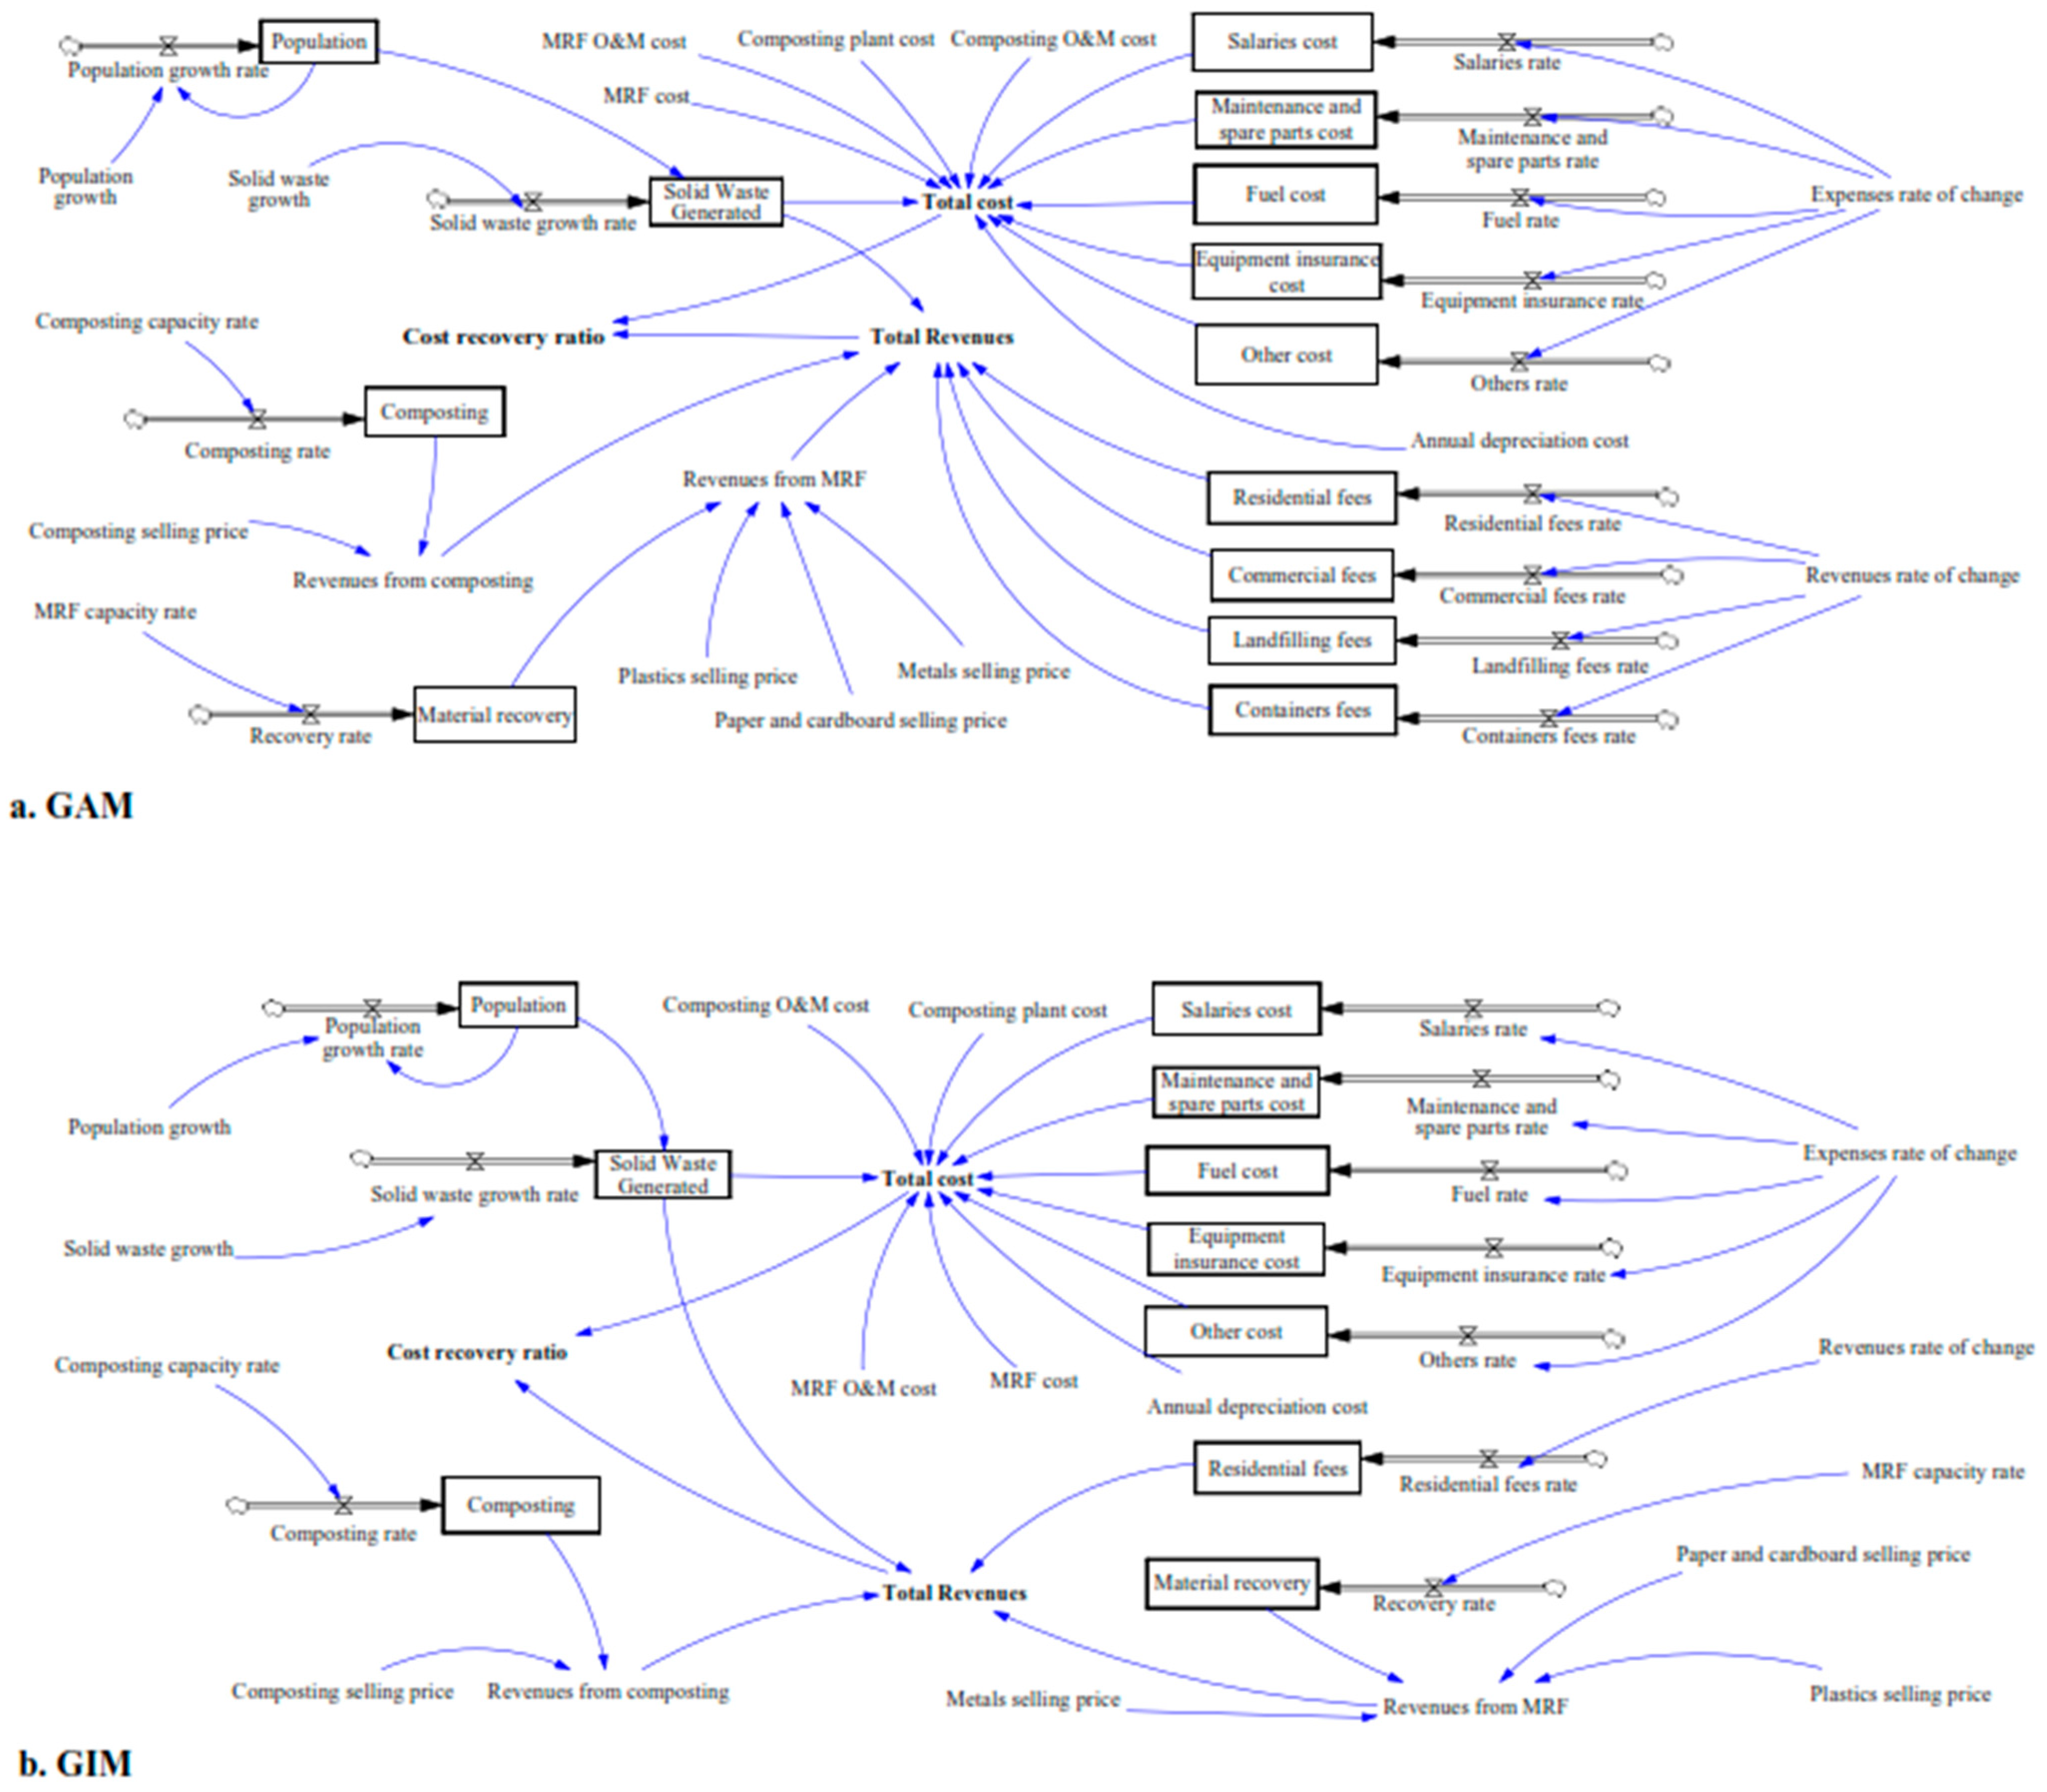
Figure 4a,b show the stock–flow diagrams of the solid waste management system in both municipalities under the rationalization and efficiency in improvement scenario (Scenario 2). On the other hand,
Figure 5a,b illustrate the stock–flow diagrams of the system under the circular economy scenario. It can be observed that costs and revenues are the main flows and outflows of the system, while the population and solid waste quantities that are generated and treated represent the stocks of the system.
4. Results and Discussion
4.1. Solid Waste Management and Tariff System Analysis in Jordan
Jordan was classified in 2017 by the World Bank as an upper-middle-income country [
31]. Solid waste management in Jordan is mainly undertaken by municipalities, where the solid waste generation has been continuously increasing; however, due to the Syrian refugees’ influxes, the country has witnessed a sharp increase in the amounts of the generated solid waste [
32,
33]. The amount of solid waste collected in 2015 (3,365,261 tons) was greater by 24% than that collected in 2013 (DOS, 2017).
The solid waste management tariff applied by Jordanian municipalities (excluding GAM) follows the flat rate model for residential sectors. According to the Regulation of Waste Prevention and Fees No. 68 of 2016, households pay a monthly flat fee via their electricity bill. This fee varies according to the category of the municipality as follows:
Large municipalities (first category) annual fee of USD 51;
Medium municipalities (second category) annual fee of USD 34;
Small municipalities (third category) annual fee of USD 28.
On the other hand, the commercial enterprises’ tariff system follows a combination of flat and pay as much as you throw methods. A total of 20% of the fees for the commercial license is paid for solid waste services. To encourage reduction of the generated solid waste, the regulation allows the deduction of up to 50% of the fees for those generators that are practicing sorting at source.
In GAM, the formula of residential fees is different from other municipalities, where the amount paid by residents is linked directly to the electricity consumption as follows:
Residents that have a monthly consumption less than 200 kwh pay an annual flat rate of USD 28;
Residents that have a monthly consumption greater than 200 kwh pay an annual flat rate of USD 28 plus USD 0.007 for the consumption of each kwh exceeding the 200 value.
Given the fact that such an approach in dealing with the solid waste in the country is neither economical nor sustainable, the Jordanian Government has decided to follow a more sustainable and economically feasible approach by subjecting the solid waste sector to major reforms. The government has embarked on an ambitious package of legislations and policies that are aiming to establish a sustainable solid waste management system. The following polices and regulations were issued/updated [
34]:
National Strategy and Action Plan for Municipal Solid Waste (NSAP) Management 2015–2034;
Revised Regulation of Waste Prevention and Fees No. 68 of 2016;
The Waste Management Framework Law No. 16 of 2020;
Regulation no. 44 of 2022 on Solid Non-Hazardous Waste Management.
Such a package of legislations has paved the way to move into an integrated and sustainable waste management system, where the cost recovery through certain circular economy aspects is one of the major pillars of this system. For example, the Law No. 16 of 2020 indicated that fundamental principles shall be adopted in waste management, and among them is the polluter pays principle (PPP). Another fundamental principle indicated by the law is the extended responsibility principle (EPR).
4.2. Financial Performance of the Solid Waste Management System
Cost calculations are needed for financial planning, investment decisions and improvement in operational performance [
35]. Fees are typically the main source of revenues for waste management organizations. The ratio of revenues to the actual cost of running the solid waste management system determines the financial performance of the sector. Budget support and cross-subsidizing between waste streams and types of waste generators are also quite common. Fee setting should preferably be based on the key principles of [
35]:
- (i)
polluter pays;
- (ii)
affordability;
- (iii)
full cost recovery; and
- (iv)
economic efficiency.
Table 3 presents the capital and operation costs of running the solid waste management in both GAM and GIM for the year 2016. Considering that the total annual budget of GAM in 2016 was USD 654 million, the total annual cost of solid waste management accounts for about 13.3% of the total municipal budget, while this share in GIM reached 24% of the total annual budget, which amounted to USD 58 million in 2016. According to the World Bank figures, the percentage for GAM is almost similar to that in low-income countries, while in GIM it is higher than that [
1]. Other studies, however, reported that municipalities in developing countries spend between 10–40% of their total annual budgets on solid waste management [
36,
37].
In 2016, the amount of solid waste collected in GAM was 1,209,128 tons, which, considering the total annual cost in 2016 was 87,202,197, gives a per ton cost of USD 85. This value is a typical one for an upper-middle-income country such as Jordan [
35]. In the same year, GIM collected 280,800 tons with a total cost of USD 14,020,098, which yields a per ton cost of USD 50. The per ton cost in GAM is greater by almost 41% compared with GIM. This is may be attributed to the fact that GAM is adopting a sanitary landfilling process, where the landfilling cost in 2016 amounted to 10% of the total annual solid waste management cost (USD 8,443,428), which is reflected on the total cost of solid waste management, while in the case of GIM, the landfilling cost contributed to only 1.9% (USD 266,490) of the total annual cost, where the solid waste in 2016 was dumped into the Al-Akeedr landfill which was operating at that time as a closed dumping site that lacked sanitary conditions.
Table 4 presents the revenues that are generated in both municipalities from solid waste services. It can be seen that main share of the revenues comes from the service fees, where they account for 63.34% and 89.5% of the total revenues in GAM and GIM, respectively. Since the Al-Ghabawi landfill is operated and owned by GAM, there are revenues (accounting for 24.4%) coming from disposal of the solid waste from other municipalities and private sector enterprises, which is not the case in GIM. Based on the estimations of expenditures and revenues, the cost recovery in GAM is 50%, while it is 48% in GIM. This implies that the solid waste services are being subsidized in both municipalities by 50% and 52% in GAM and GIM, respectively. Such subsidies are mainly borne from municipal budgets, which raises questions on the efficiency and sustainability of such approaches of financing the solid waste management services. In a diagnostic study to identify the reasons behind the failure of the solid waste systems in developing countries, Breukelman et al. (2022) [
38] reported that the root cause of failure is that the populations are growing faster than their economies, where poor governance is predominant and fails to secure the required budgets for sound solid waste services. This is the case in Jordan, where the average GDP was 2.4% during the period 2010–2019, while the population had doubled during that period due to the influxes of refugees [
39].
Theoretically, the solid waste fees collection mechanism through the electricity bill is an efficient option that guarantees the municipalities obtain the fees on a monthly basis. However, this mechanism has several drawbacks which prevent the fees to be directed to cover the solid waste management services cost. The electricity company deducts 10% from the collected fees as a service charge, which leaves 90% of the fees. Furthermore, from the remaining 90%, the electricity company deducts the street lighting fees, which the municipality should pay to the company from other budget items rather than the solid waste fees. Another factor that contributes to the reduction in the collected solid waste management fees through electricity bills occurs when several apartments and households are connected to one electricity meter. This leads to several households paying the fees of one household. Finally, in Amman where the fees are linked to the electricity consumption, several residences in wealthy areas have erected solar energy systems, where their electricity consumption is low, while they generate high amounts of solid waste with minimal fees being paid. Due to the mentioned reasons, the municipalities should rethink a more efficient mechanism for solid waste fees collection, to make sure of the adoption of the polluter pays principle (PPP) and pay as much you throw (PAYT).
4.3. Simulation Results
In a developing country such as Jordan, decision makers are lacking financial planning tools to adopt an economically feasible and socially acceptable solid waste tariff system. There is a need for diagnostic tools to find the root causes of the poor performance [
26]. Therefore, a scenario analysis to support strategic or tactic decisions must be developed.
Due to the complex nature of the solid waste systems, it is important to select the policy options after in-depth analysis and modeling of the impact of such policies [
40]. Therefore, the SD model used in the current study aimed at assessing the policy options recommended by the NSWMS on the financial sustainability of the solid waste management system of Jordan. The model was set to simulate two scenarios on a mid-term period from 2022 to 2026, as well as on the long-term period from 2027 to 2035. The data used in the simulation process that can influence other associated variables were collected from municipal documents and reports, research articles, national statistics and field observations.
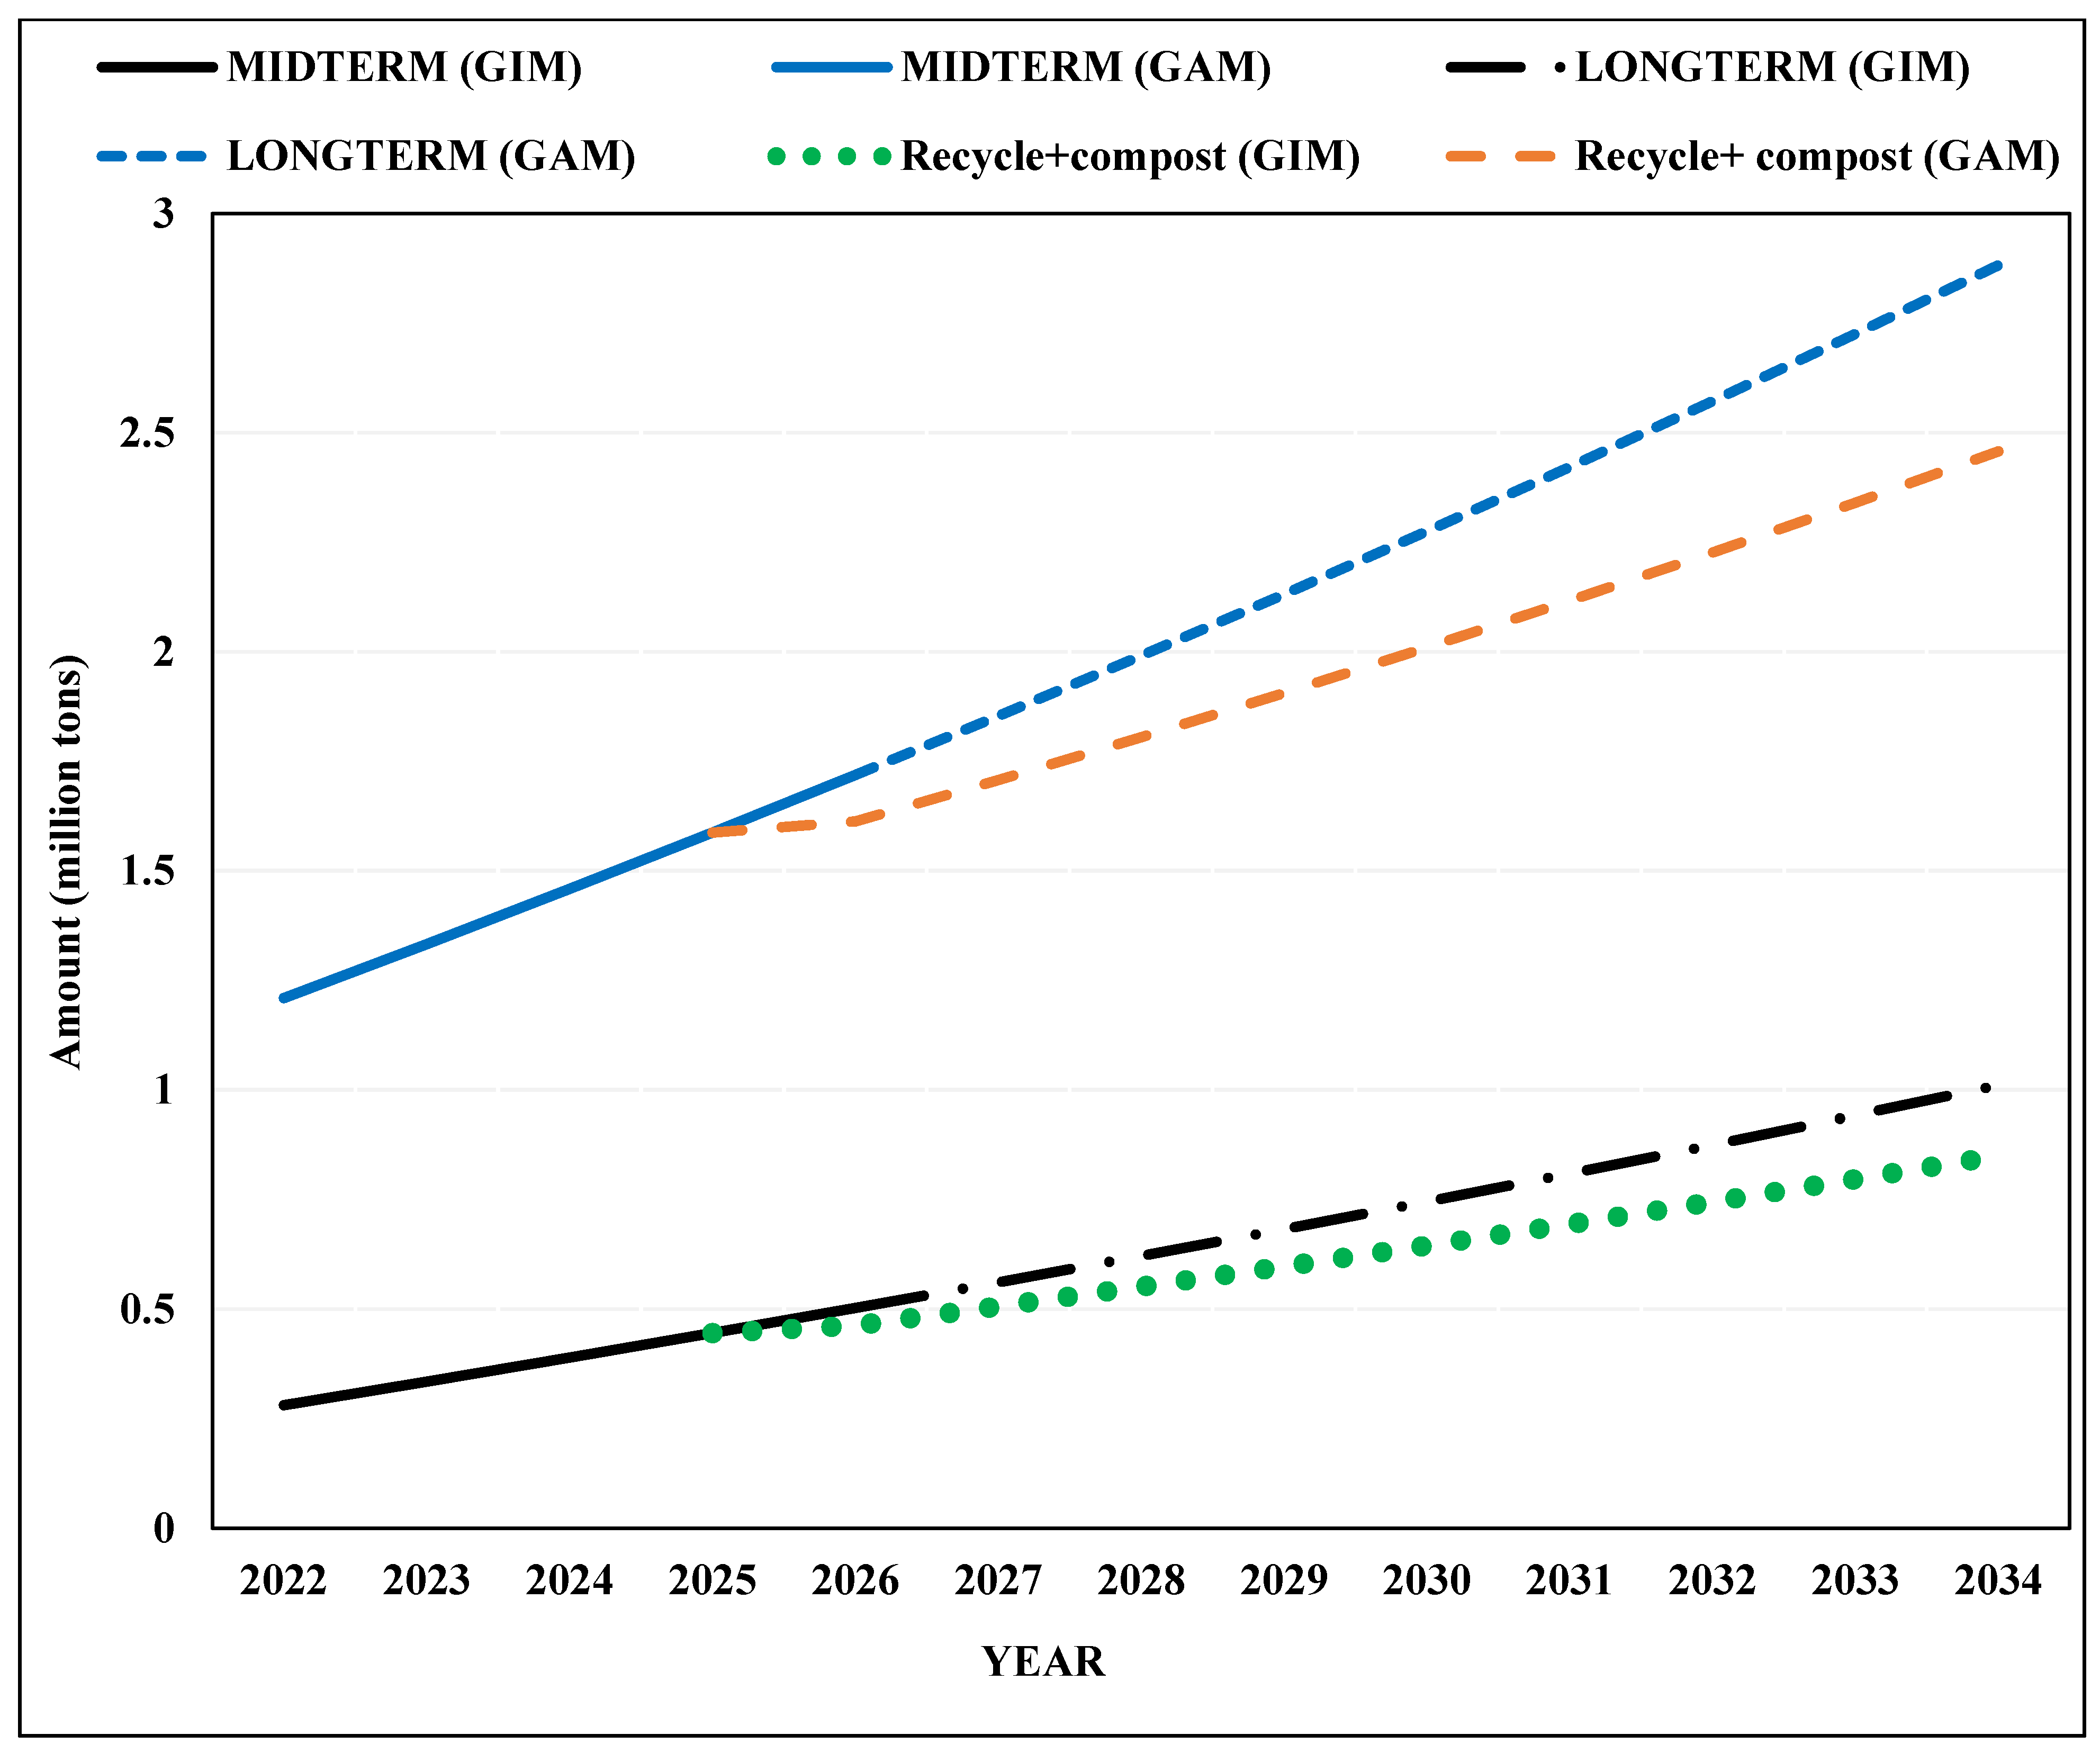
Figure 6 illustrates the projected amounts of the solid waste that will be generated during the mid-term and long-term modeling periods. As it can be observed, by the end of the mid-term scenario in 2026, the forecasted annual amounts of solid waste will be 0.5 and 1.71 million tons in GIM and GAM, respectively. On the other hand, by the end of the long-term period in 2034, the forecasted amounts will reach 1.01 and 2.88 million tons in GIM and GAM, respectively. The increasing trend in the generated solid waste is related to the increase in population and changes in their life style [
32,
33].
Due to the interventions that will be adopted under the long-term scenario by adopting circular economy options (recovery and composing), it is estimated that 585, 000 tons of solid waste will be diverted annually from the landfills through recycling and composting. This will mitigate the greenhouse gases (GHG) emitted from the landfills by 652,275 tons of CO
2eq. This is in line with what was reported by Abu Qdais et al., 2019 [
32], who estimated that composting of 70% of separately collected waste in Jordan will result in an annual mitigation of 2.6 million tons of CO
2eq. In addition to the mitigation of GHGs, introducing separate collection will improve the financial sustainability of the solid waste system [
27].
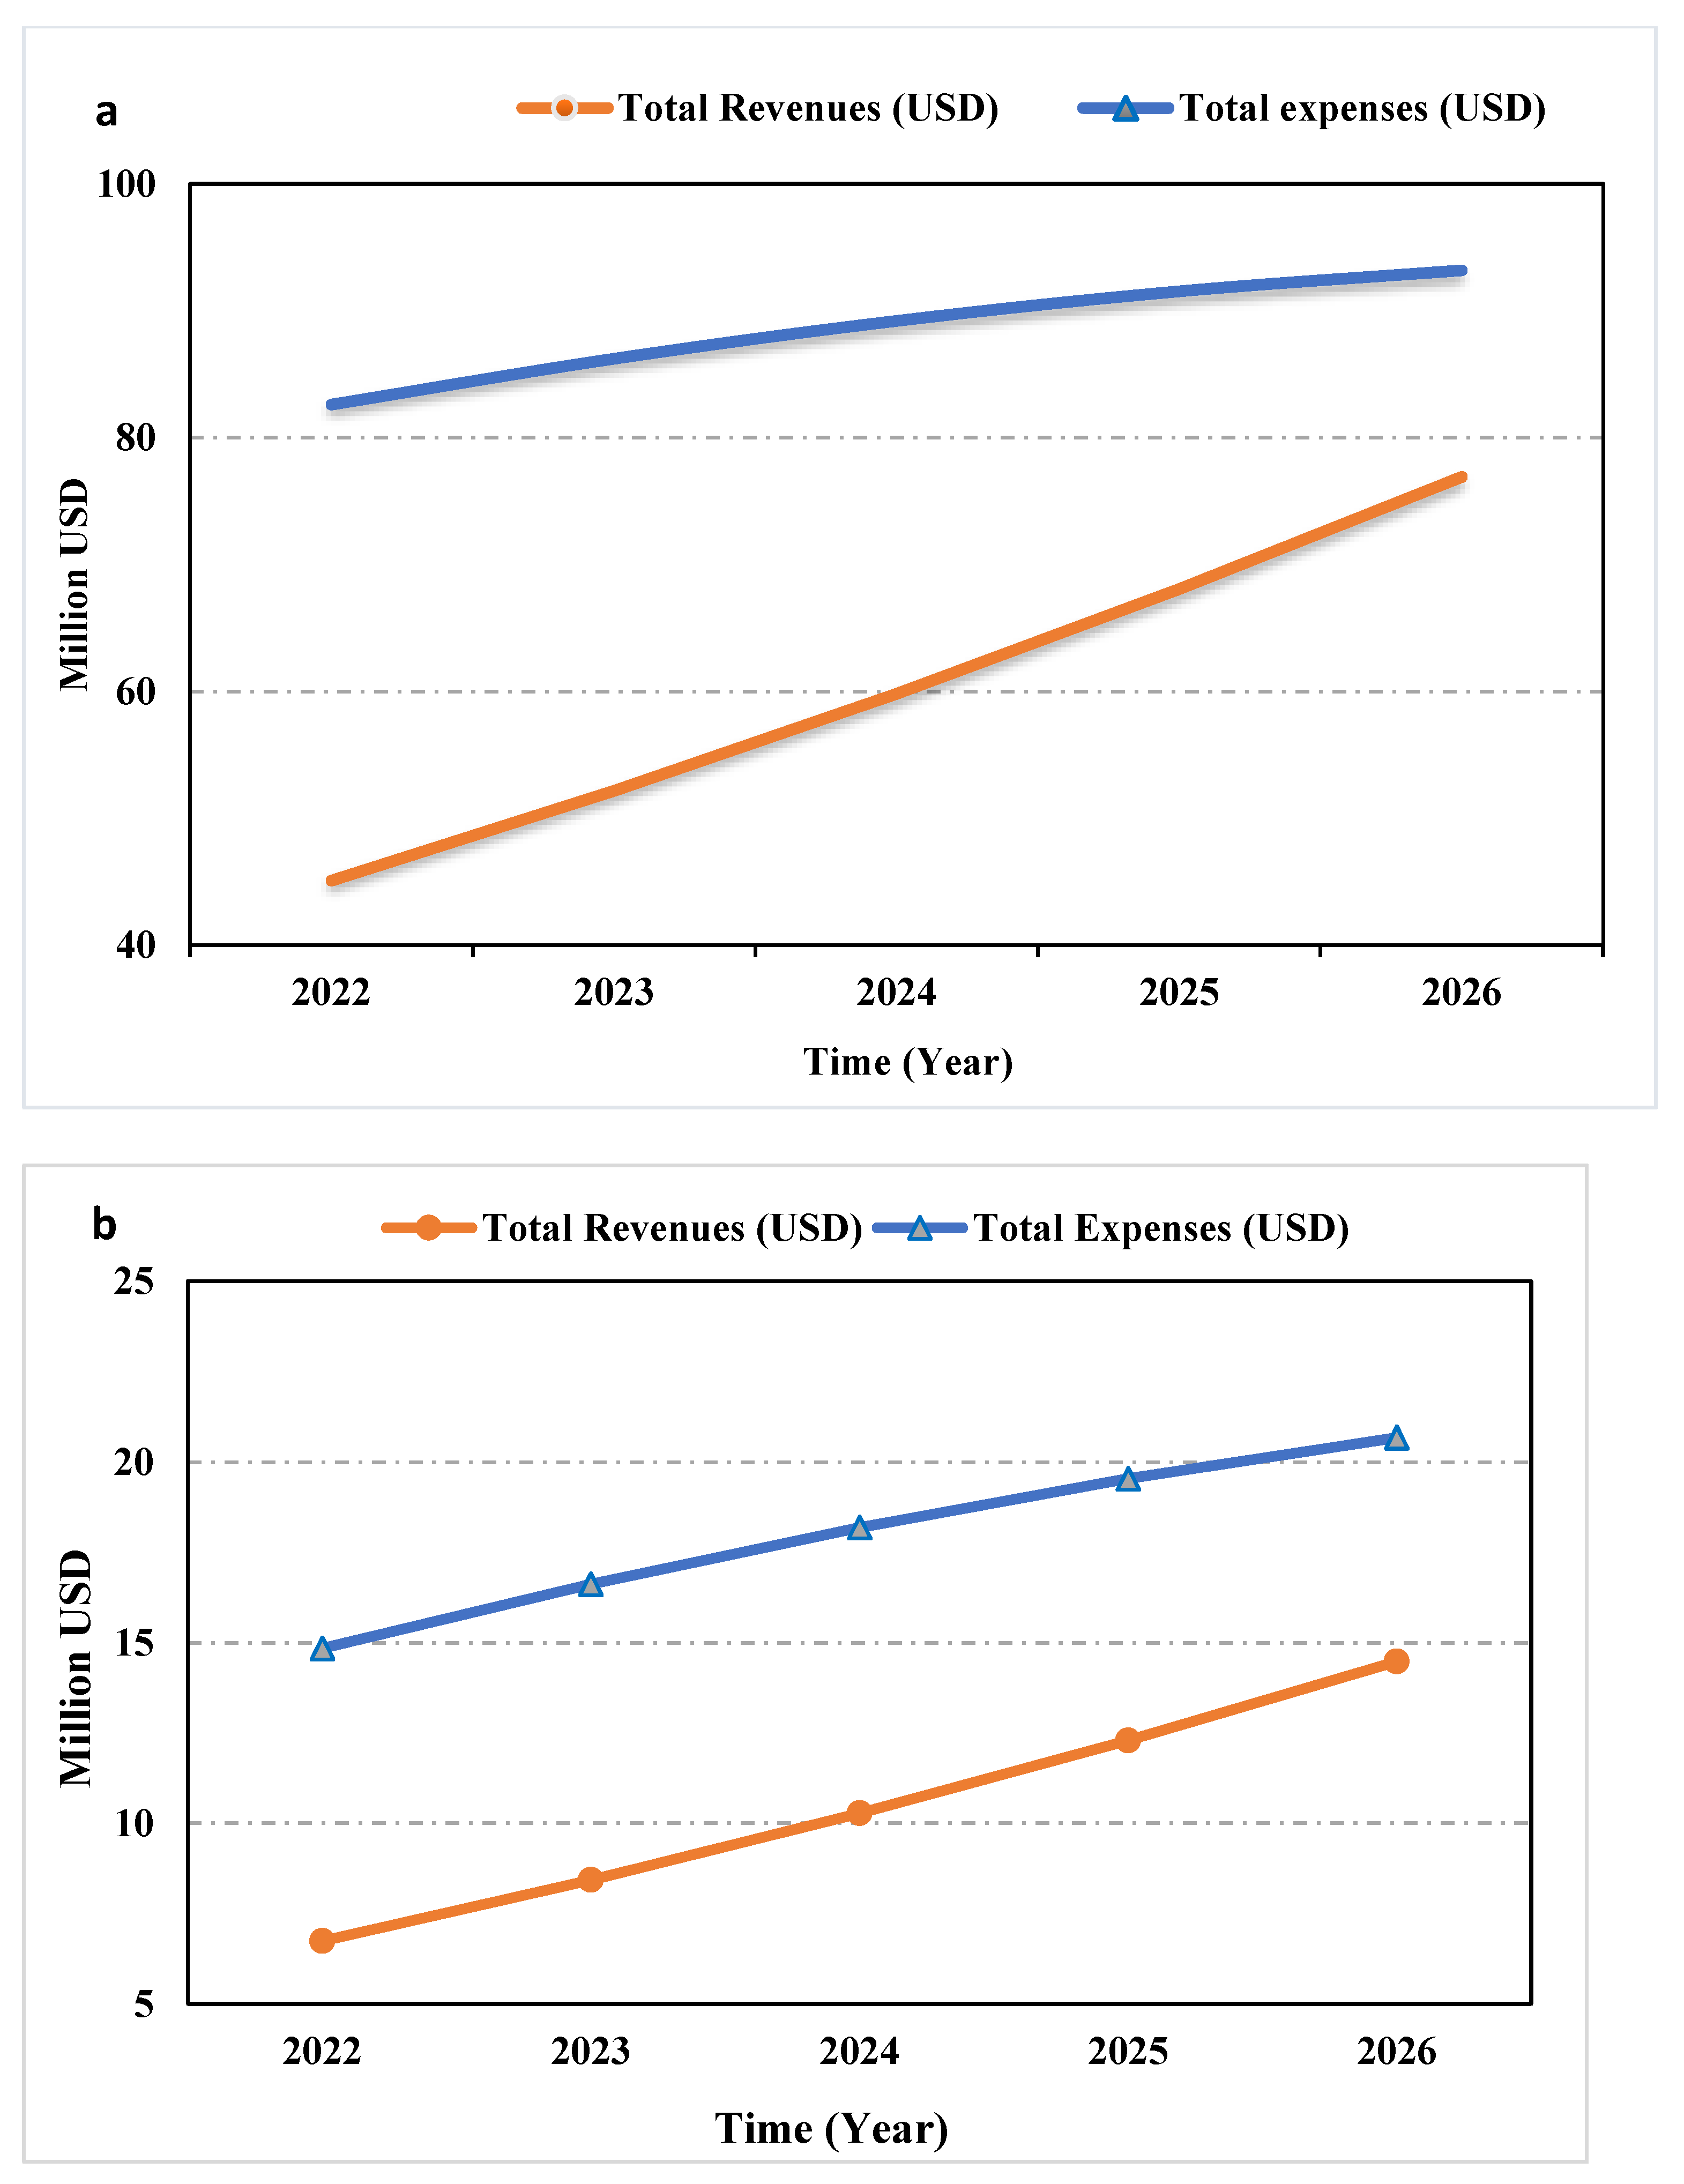
According to the mid-term scenario which will be implemented over the period from 2022 to 2026, the rationalization and gradual annual increase in the fees’ values has been simulated using SD modeling. As shown in
Figure 7a,b, the combination of improvement in the solid waste management efficiency and the gradual increase in the fees has resulted in increasing the revenues in both GAM and GIM municipalities.
Figure 7a illustrates that the revenues in GAM will be increased from USD 45.08 million at the beginning to USD 76.9 at the end of the mid-term scenario (2026). The increase in revenues will be positively reflected on the cost recovery level in GAM, as it will be increased from 54% in the year 2022 to 82.5% in the year 2026. Similarly,
Figure 7b shows the modeling results for the expenses and revenues for GIM during the mid-term scenario period. It can be observed that revenues will be increased from USD 6.73 to 14.48 million. The cost recovery in GIM under the mid-term scenario will jump from 45% to 70% in five years. Despite the improvements in the cost recovery in both municipalities, they will not achieve the full cost recovery of the solid waste management services.
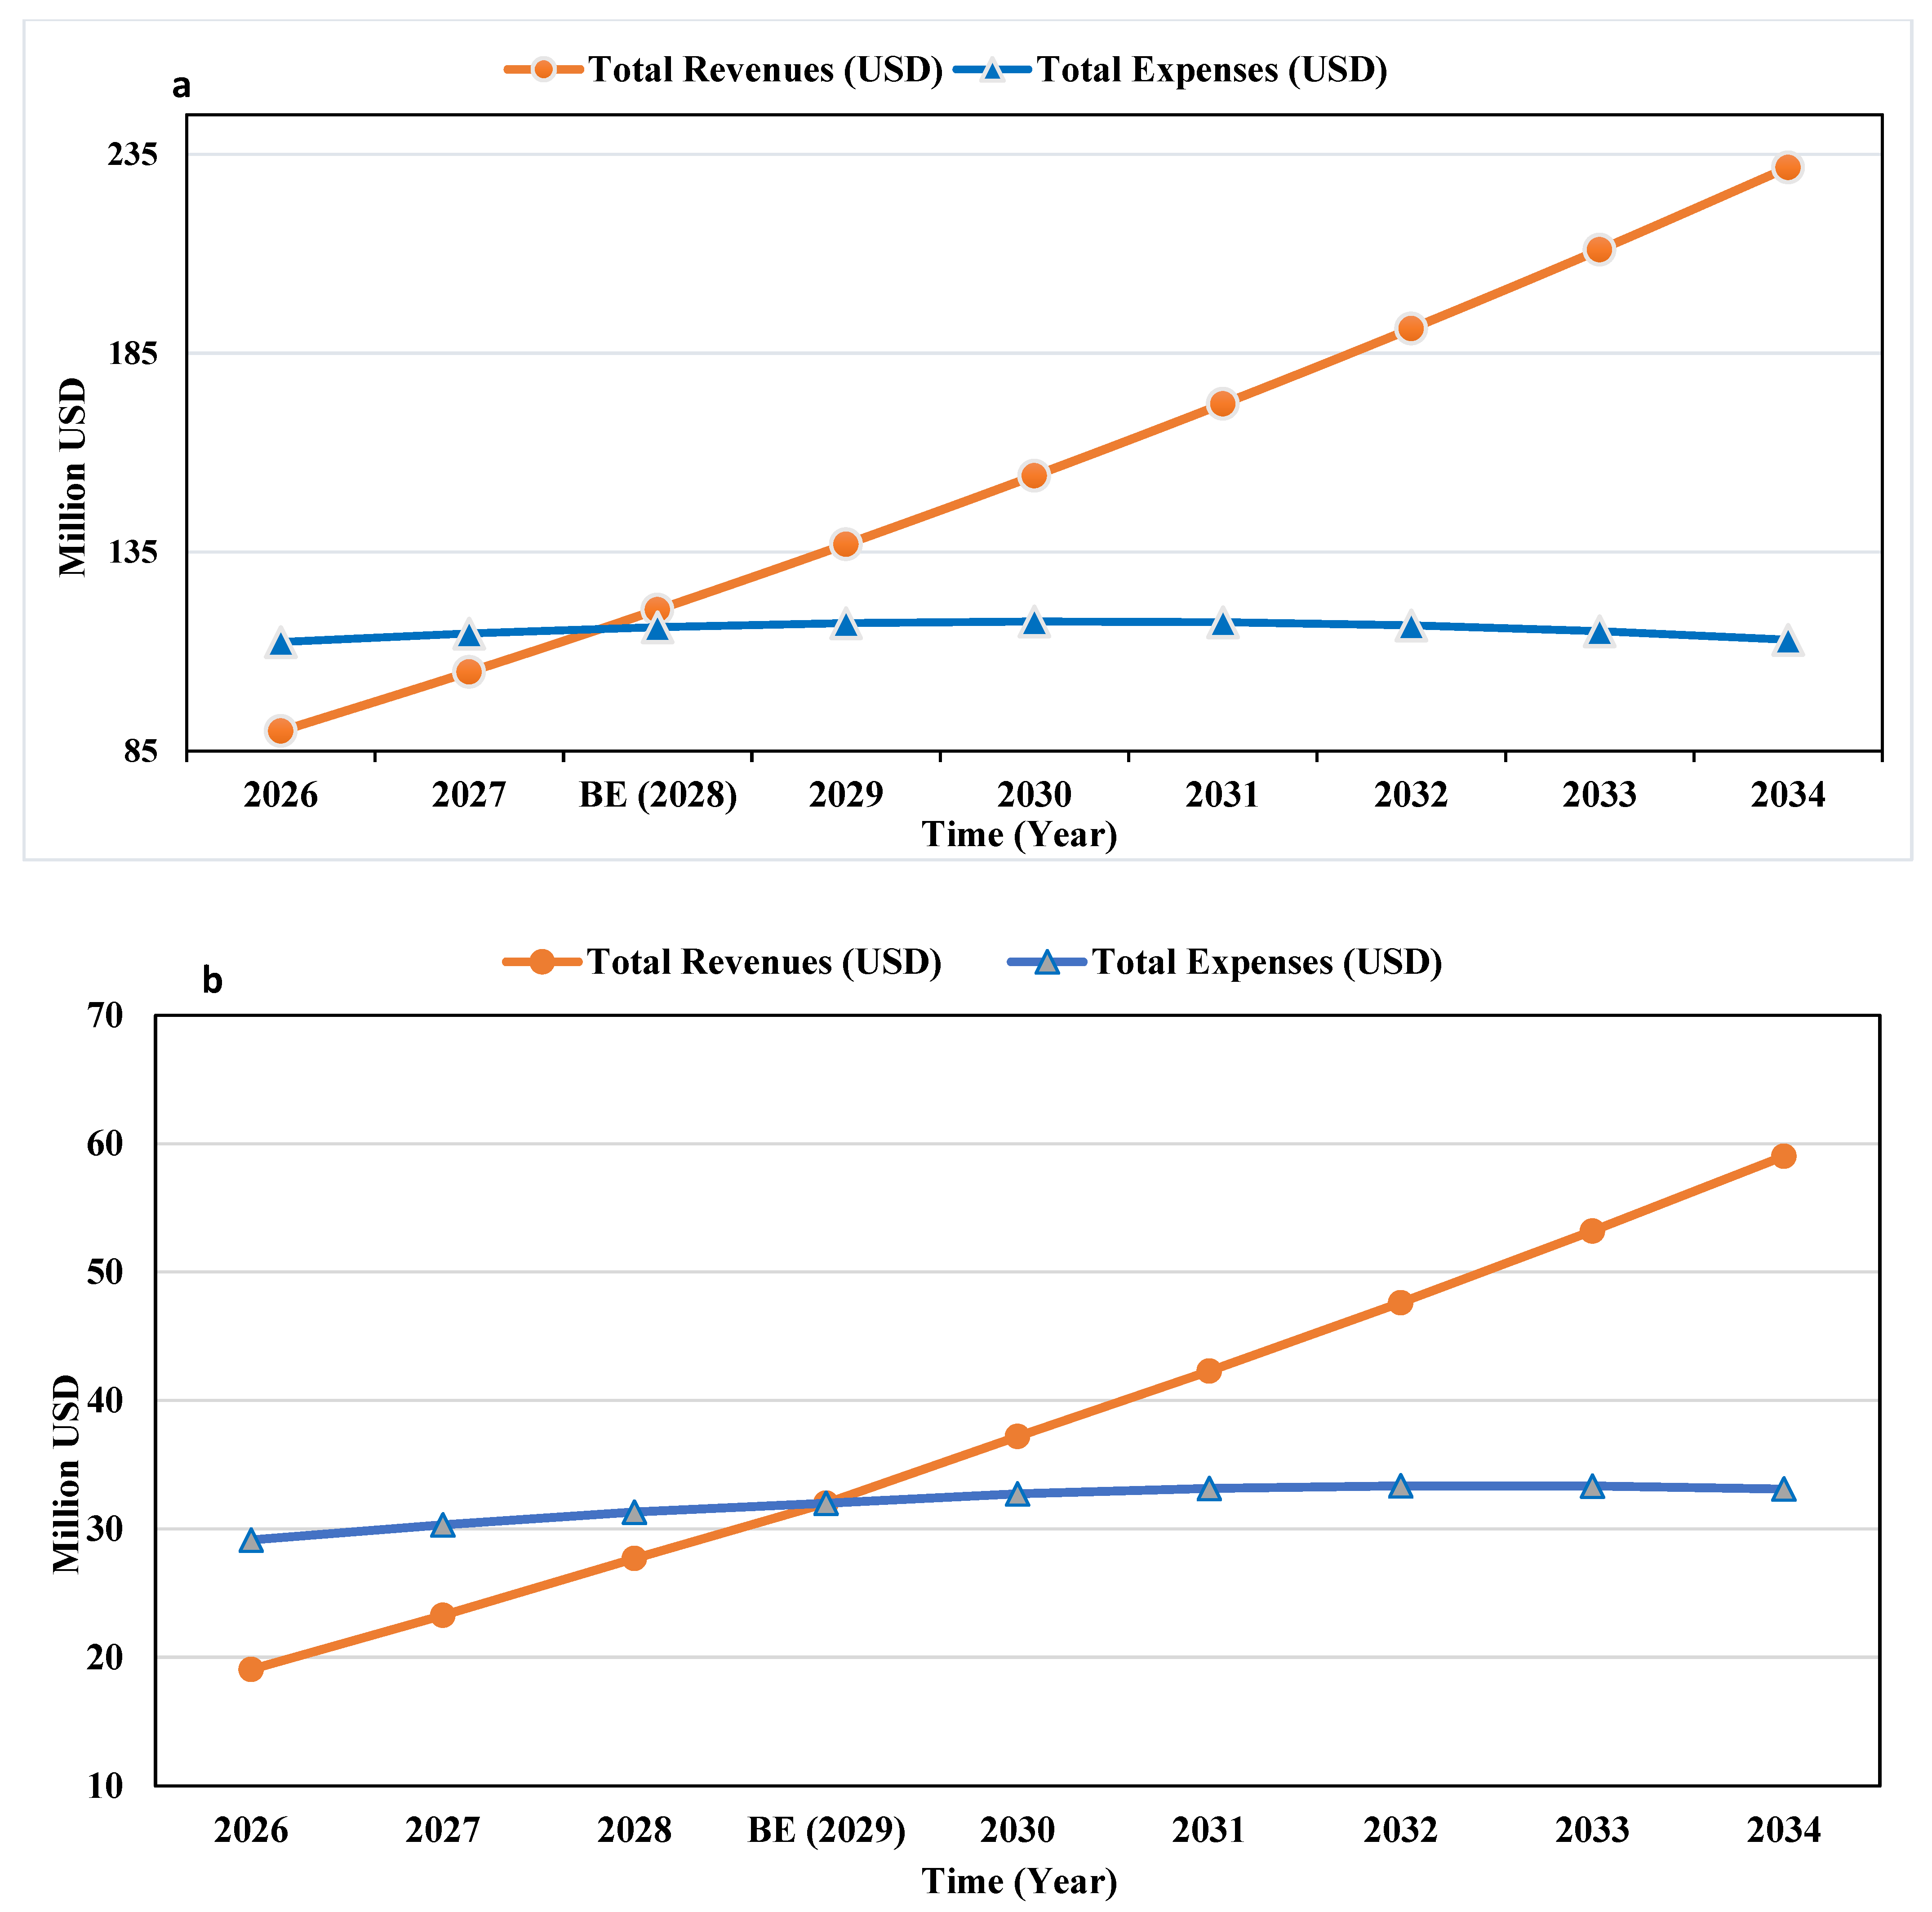
In the long run, the NSWMS targets the adoption of circular economy options through recycling and composting activities. This should be implemented during the period 2026–2034. SD modeling results are presented in
Figure 8.
Figure 8a depicts that as a result of adopting the planned policies, a full cost recovery in GAM will be achieved in the year 2027, one year after adopting the circular economy options. On the other hand, the full cost recovery in GIM will be reached in the year 2029. Reaching the full cost recovery of the solid waste services implies that the financial system of municipalities is being run in a sustainable manner [
35].
Using SDM for modeling the solid waste management in Delhi, Kafeel (2012) [
41] reported similar results, where composting and energy recovery from solid waste will yield revenues greater than cost. Another study conducted by de Slivia (2018) [
42] concluded that circular economy can turn the problems and challenges into opportunities for municipalities by diverting more recyclable materials from the landfills in Brazil.
5. Conclusions and Recommendations
The Jordanian government has realized that the end of pipe approach followed in the country in dealing with solid waste management issues is neither sustainable nor economical. A high share of the municipal budget is directed to solid waste management, while the service provided is relatively unsatisfactory with low cost recovery. Therefore, a package of legislations and policies were recently ratified. Among such policies is the national solid waste management strategy that calls for the rationalizations of the management, gradual increase in the fees and the adoption of circular economy options up to the year 2034.
The present study has examined the financial feasibility of the current solid waste management system in Jordan. Analysis of the financial records of the two largest municipalities in the country has shown that the current level of cost recovery for solid waste services is relatively low (50% in GAM and 48% in GIM). Furthermore, the collection of the fees through electricity bills has several drawbacks, which affects the financial sustainability of the solid waste management system.
SDM has proved to be an effective tool to simulate the dynamic behavior of complex systems such as solid waste management. Applying SD modeling to assess the impact of the new strategic directions in Jordan has revealed that in the mid-term, the cost recovery will be improved, as it will be increased by almost 25% in the studied municipalities, without achieving the full cost recovery. Based on the long-term scenario, when the circular economy options are introduced, full cost recovery will be achieved in the first three years after adopting the recovery of recyclables and composting. Furthermore, the adoption of circular economy aspects will contribute to the mitigation of climate change by reducing the emissions that could have been produced due to the landfilling of the solid waste.
The current study indicates that the circular economy concept and market for recycling needs to be promoted in Jordan to render recycling and composting as contributions to the sustainability of the financial system of solid waste management. The findings of the study provide decision makers with a tool, based on which it is possible to decide which policies to follow. This is the first study of its type, which examined the impact of tariff structure and circular economy policies on the financial sustainability of solid waste management in Jordan. Further studies are recommended to investigate the role of other circular economy options such as waste to energy and extended producer responsibility.


