1. Introduction
Drinking water is a precious resource. Climate change, human activity and population growth will cause water demand to exceed available drinking water by 40% by the year 2030 [
1]. According to current estimates, 30% of drinking water worldwide is “lost” between the source and the user [
2]. Minimising this water loss is essential to conserving resources and ensuring a stable supply of drinking water.
However, resilient management of water and other utility networks (gas, heat, waste and storm water) is challenging and often consumes vast budgets. It is widely accepted that systematic process monitoring is essential for stable and cost-effective operations, for example, to support real-time fault management and predictive maintenance. In practice, however, collecting system status information in branched underground infrastructure systems at adequate temporal and spatial scales does not come without challenges: (i) Network elements are spatially distributed line structures embedded within the built environment. Observing the system status at a particular spot or line does not necessarily reflect the situation at the neighbouring line. (ii) Utility network elements are hidden, i.e., buried underground. Access to underground infrastructure in urbanised areas is severely constrained by aboveground land use, traffic and separate ownership of property. The close proximity of various underground infrastructures, the lack of reliable construction documents and the high cost of excavation make direct access to pipes difficult.
Traditional leak detection methods rely on a manual inspection with acoustic sensors or battery-operated hydrant monitoring where aboveground access is possible. Localising such leaks is a very laborious process [
3]. Conventional monitoring, i.e., involving sensor technology, usually requires connection to a power supply via cables or batteries that have to be regularly replaced. Neither is suitable for widespread use in water supply networks. Installing power supply cables is impractical or even impossible. Batteries require physical access, which is not always possible. In addition, the use of batteries is environmentally not sustainable.
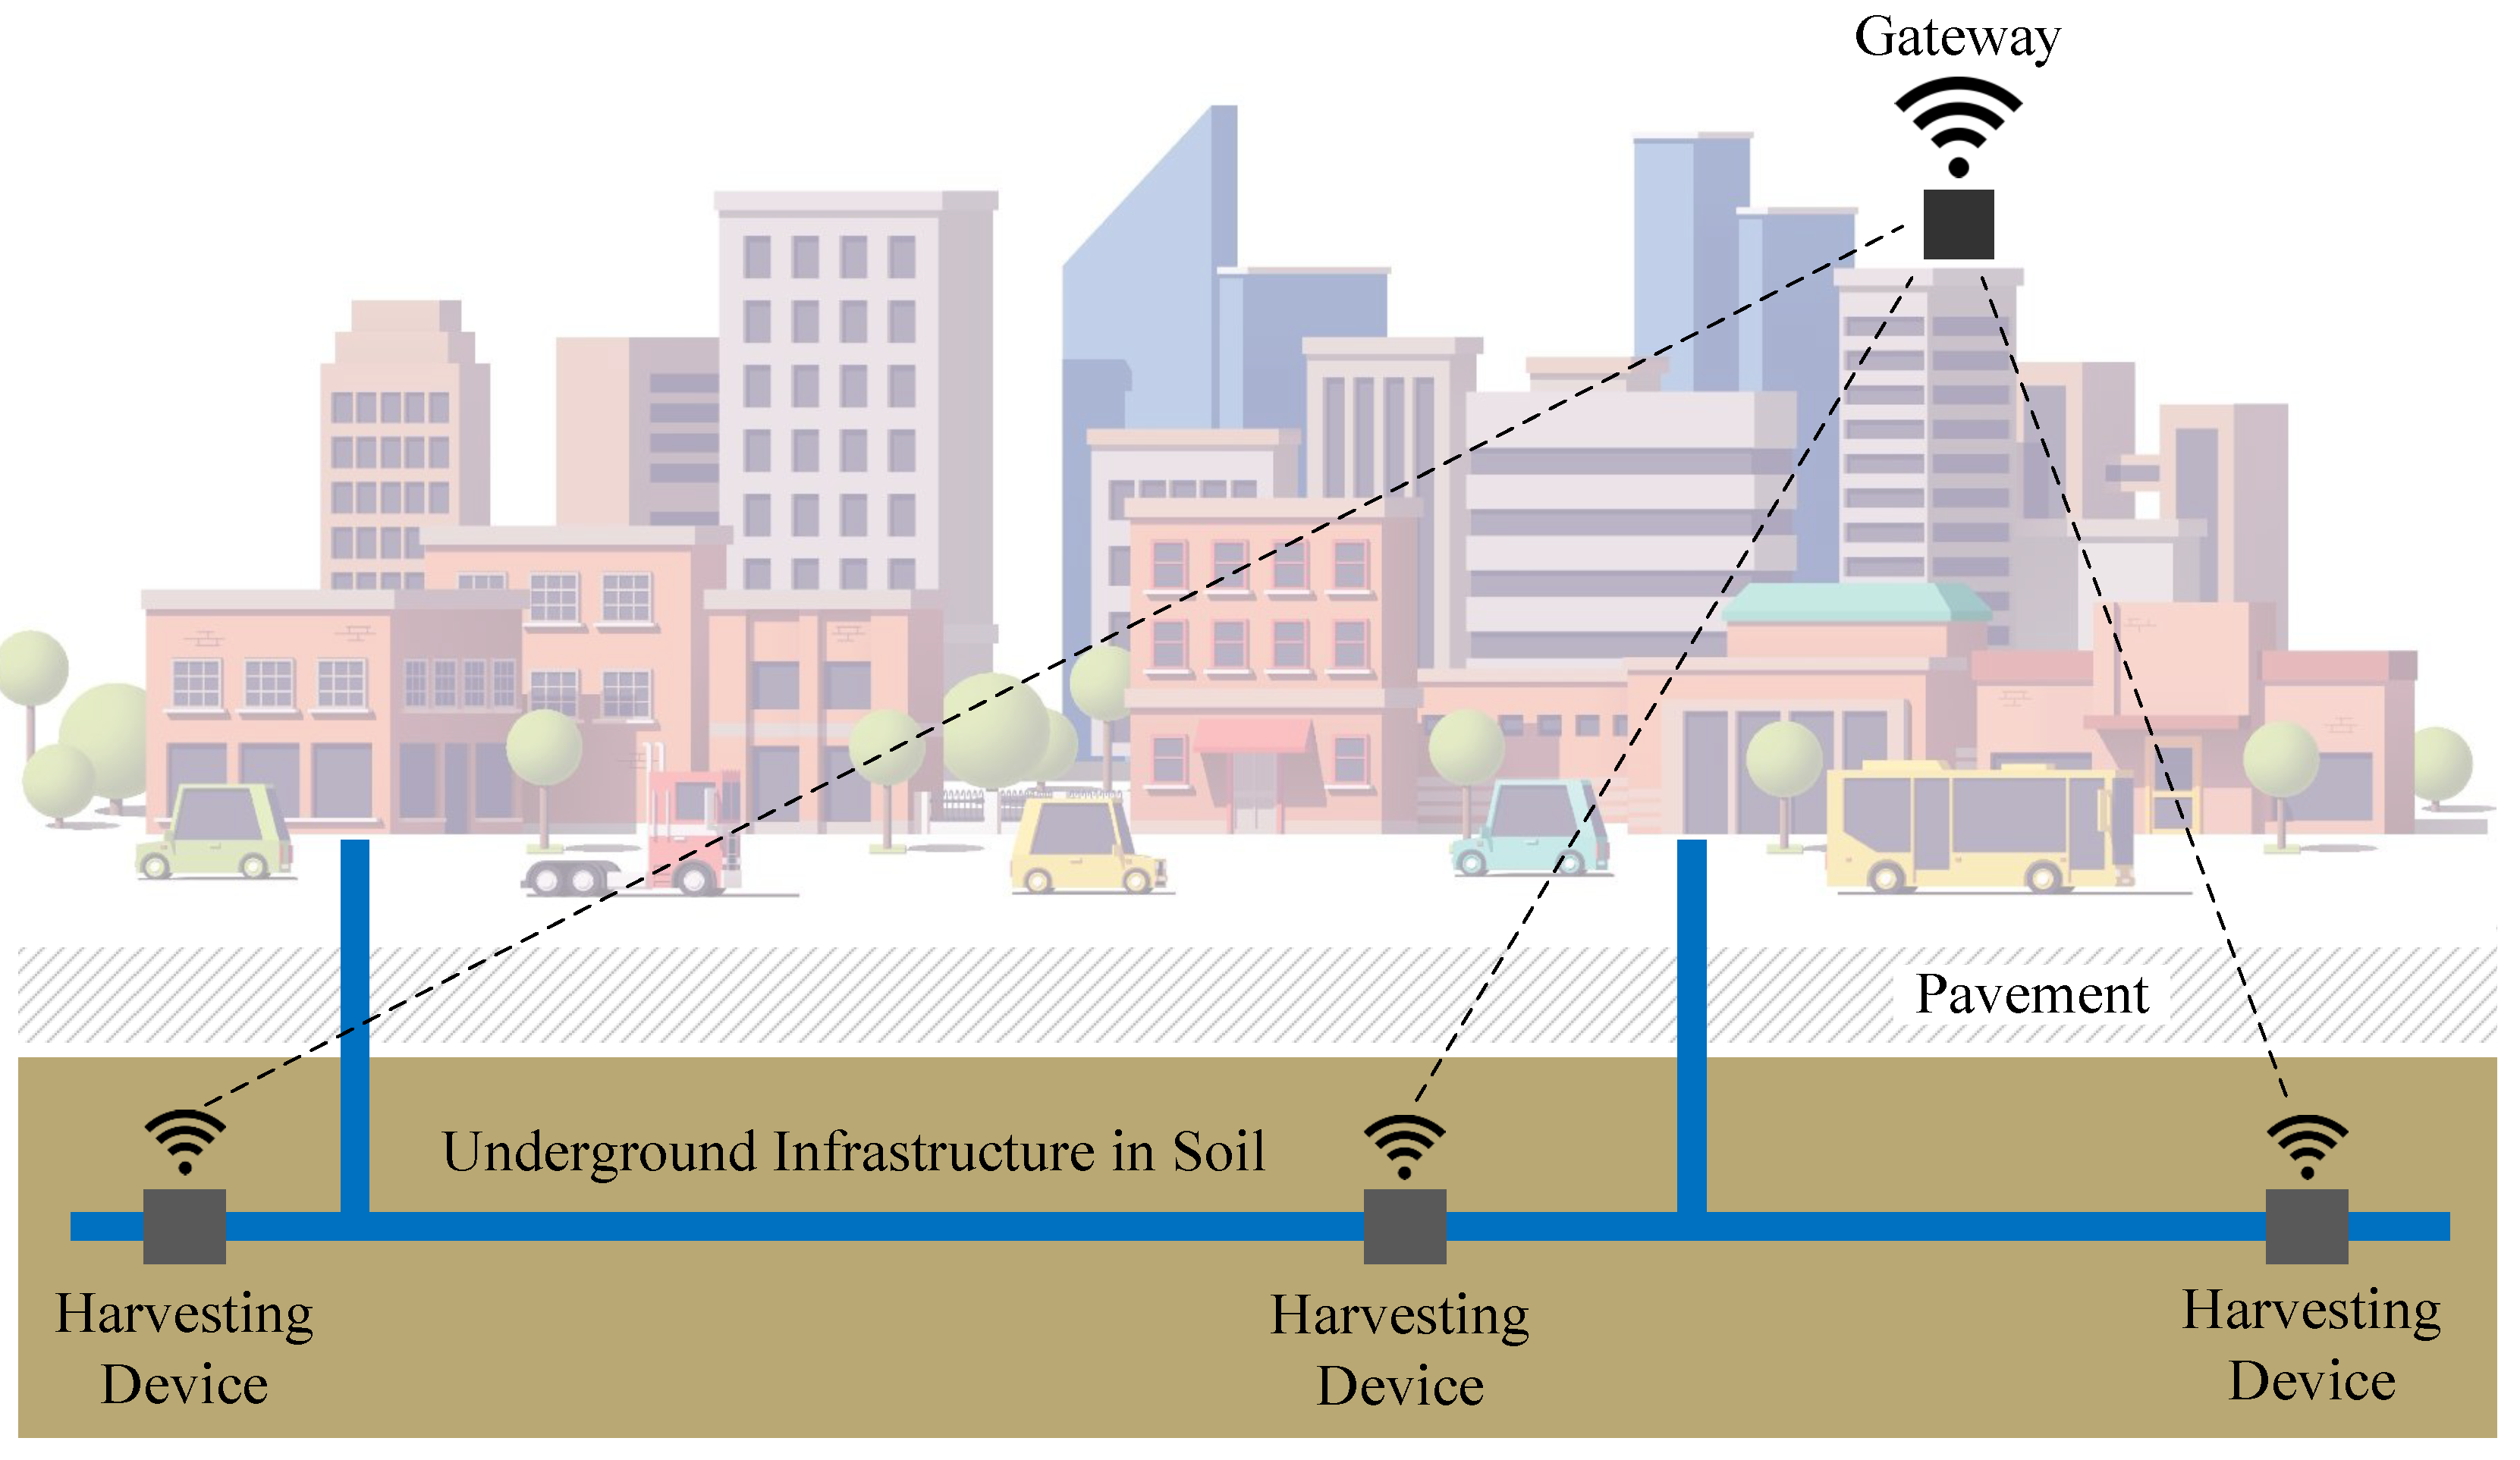
This project envisages maintenance-free measurements at numerous sites within the underground infrastructure, as shown in
Figure 1. This vision is to be made possible by the battery-free operation of sensor technology facilitated by energy harvesting and wireless communication from underground. This eliminates the need for on-site leak detection or battery replacement when using battery-powered measurement methods. This project therefore addresses the following challenges:
1.1. State of the Art
The following projects or products show the current state of the art. Off-the-shelf, battery-operated sensors are available, which have low energy demands and can be installed in harsh water environments (e.g., a low-power flowmeter [
4]). However, there are drawbacks to operating such devices permanently underground. On the one hand, a cable is required to connect the node to a GSM modem placed above the ground. On the other hand, the operation with batteries limits autonomy and increases the environmental footprint.
Energy harvesting offers an emerging alternative to batteries or mains power [
5]. To harvest energy in water infrastructures, devices often use the water flow to activate small electromagnetic harvesters [
6,
7]. Such devices harvest a good amount of electrical energy. However, they reduce the pressure in the pipe and the generator built in the pipe is invasive. Contact between fresh water and energy generators is not always accepted, mainly for hygienic reasons. The moving parts of the generator also make the system more fragile and therefore negatively affect robustness and maintenance costs. In addition, a constant flow of water is required to generate energy. Magnetohydrodynamic (MHD) energy harvesters [
8] have been suggested as a possible alternative. Such devices make use of the conductivity of fluids to generate energy. Unlike electromagnetic harvesters, they have no moving parts. Still, the contact of fresh water and the harvesting device and the requirement for a constant water flow persists. Additionally, the energy harvested is currently in the range of a few nW, which is not enough for meaningful work and to transmit data from underground to aboveground.
While TEGs (thermoelectric generators) would also offer a solution with solid-state parts, the situation in this context is challenging. The amount of energy harvested from small underground temperature differences is small and subject to several parameters, increasing the probability of not having sufficient energy to power the device. However, TEGs have no moving parts, providing a non-invasive and robust solution that can be installed in various places. To the best of our knowledge, our solution is the only one explicitly designed to use TEGs in buried water infrastructures. One research paper suggests using TEGs to harvest energy from the temperature difference between the air and the water pipe [
9]. However, this requires parts of the water pipe to be brought to the surface, meaning that the harvesting device and the pipe are less protected from the environment, and additional effort is required for installation. In similar contexts, TEGs have only been used for other applications. The results of a significant research undertaking show that TEGs harvest energy by exploiting temperature differences between the pavement and soil or the road (asphalt) and soil [
10,
11]. Research also shows the feasibility of harvesting energy from temperature differences between the pavement and the air [
12]. TEGs are good alternatives to solar cells for sensors in agriculture [
13,
14]. In the above cases, the depths at which the TEG is placed in the ground are relatively shallow (less than 50 cm). Another example shows the use of TEGs as an energy harvester in civil infrastructure, taking advantage of the temperature difference between the railway track and the soil. The harvested energy powers rail-side sensors for monitoring the railway tracks [
15]. TEGs have also been used to extract energy from trees, walls and bridges [
16,
17].
Leak detection using pressure sensors that make one measurement every six hours can reduce power consumption to a few µW [
18]. This work therefore provides a feasible solution for a low-power sensor device. Troncossi et al. [
19] developed and evaluated an algorithm to detect leaks in buried plastic water pipes from vibration measurements. MEMS accelerometers were used to measure flow-induced vibration on the pipe surface [
20]. By combining multiple sensors into a wireless sensor network, it is possible to detect leaks in water pipes. This work highlights the strong relationship between the water flow rate and the flow induced vibration, which allows the use of MEMS sensors that are less expensive than other sensors used for leak detection.
1.2. The Novelty of This Work
This project yields a novel harvesting device for underground environments that enables various sensors. It uses TEG technology to convert temperature differences in underground environments into electrical energy. Corresponding mechanics allow optimal thermal flow through the TEG. Electronics use the output of the TEG for measuring and transmitting environmental parameters.
The harvesting device has been running in the field, and its performance at two sites is used to assess the feasibility of this technology for future applications. This paper provides evidence-based findings on temperature conditions in the underground. It shows performance figures and discusses the process of developing and testing the harvesting device, focusing on the following issues:
What is soil temperature influenced by, and how does it impact the temperature differences in underground environments?
How much energy can be harvested from a water pipe?
How can harvested energy be stored?
How can the energy consumption of the electronics be kept as low as possible?
Moreover, this report describes the applied methods, lessons learned and the field test results of the sensor device built during this project. The paper is structured accordingly:
Section 2 describes the fundamentals of energy harvesting and low-power wireless communication, the thermal modelling and the implementation of mechanics and electronics.
Section 3 contains the field test results and the validation of the built model. It also provides an experience report about designing and installing the devices and an analysis of the results.
Section 4 concludes with the results of this study.
2. Materials and Methods
2.1. Fundamentals
2.1.1. The Urban Underground Environment
Water pipes are buried underground. The actual temperature in the subsurface—the key driver for energy harvesting here—is generally influenced by several factors: Above the ground, meteorological conditions determine the surface temperature, namely the air temperature. However, the surface radiation budget, which is influenced by precipitation (wet or dry surfaces), topography (latitude and altitude) and surface cover (vegetation, bare soil, asphalt or snow cover) [
21], also plays a large role here. Below ground, the soil texture and soil moisture content determine the heat exchange between the soil horizons. The moisture content is further related to the groundwater level, root water extraction and evapotranspiration. The actual soil temperature, on the other hand, determines plant growth or, in this case, thermoelectric energy harvesting.
While the degree of planar geospatial correlation of other types of utility infrastructure is high (as much as 80% of the length of underground pipe networks in European cities are expected to be geospatially co-located with the road networks [
22]), the laying depth of pipe infrastructures differs quite significantly. VKR (the Swiss Plastic Pipes and Fitting Association [
23]) regulates the minimum installation depth of (pressurised) drinking water pipes in urban areas in Switzerland, which is typically at a depth of 1.2 to 1.5 m below the surface as confirmed by practitioners. For the purposes of this study, we assume that (i) most drinking water distribution pipes are located under roads, and (ii) the pipes are located at a depth of 1.2 to 1.5 m under a surface layer of asphalt.
The required temperature difference, i.e., the thermal gradient, can indeed be found at different soil horizons. While a few studies have explored the energy harvesting potential from temperature gradients at the natural soil-to-air interface [
24], there is little research on thermal gradients within the soil compartment, i.e., the soil-to-soil interface. To our knowledge, there have been no studies of thermal gradients next to water distribution pipe infrastructures.
2.1.2. Energy Harvesting with Thermoelectric Generators
A TEG converts a temperature difference into a voltage using the Seebeck effect. The Seebeck effect occurs when electricity is generated between a thermocouple upon the ends being exposed to a temperature difference. The existence of a maintained temperature difference is thus essential for the generation of electricity. More information about the basics of TEGs can be found in the work of Jeffrey Snyder et al. [
25].
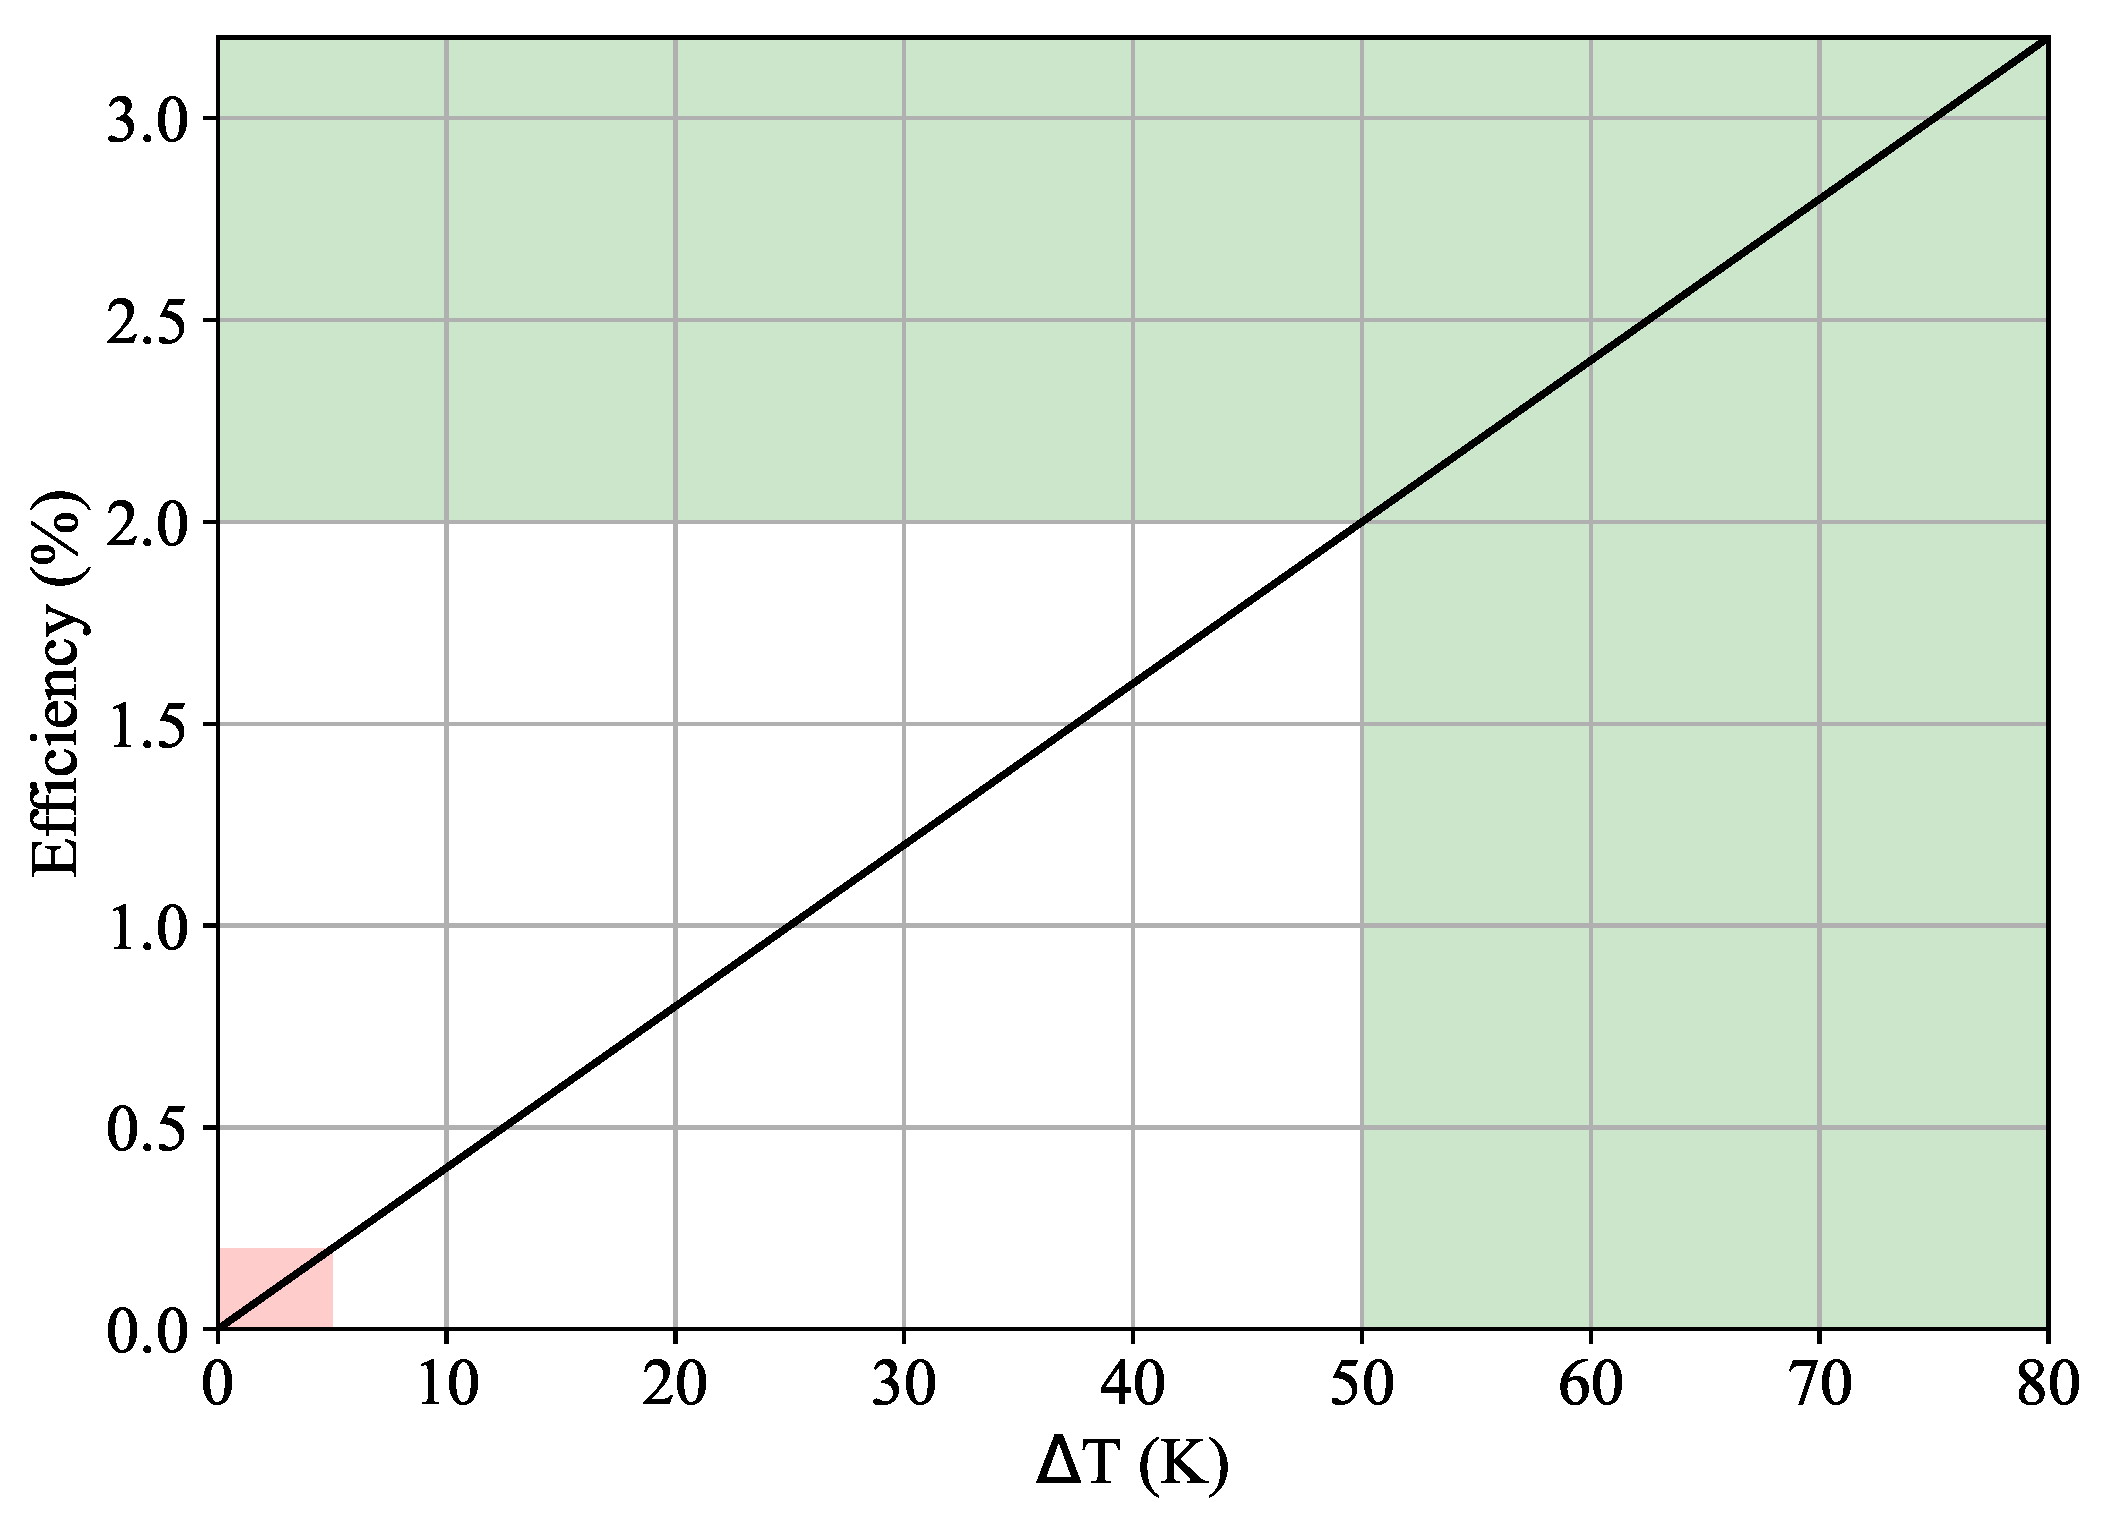
The energy conversion efficiency of a TEG highly depends on the applied temperature difference.
Figure 2 shows the relationship between the temperature difference and the level of efficiency. In this case, the efficiency is approximately 0.04 times the temperature difference in Kelvin [
25]. Most available TEG devices operate at temperature differentials of 50 Kelvin or higher, and TEG data sheets often do not specify the behaviour with lower temperature differentials. Temperature differentials of 50 Kelvin or higher come with increased efficiency (green mark). However, this project operates at low-temperature differentials of up to 5 degrees Celsius, resulting in much lower power and efficiency (red).
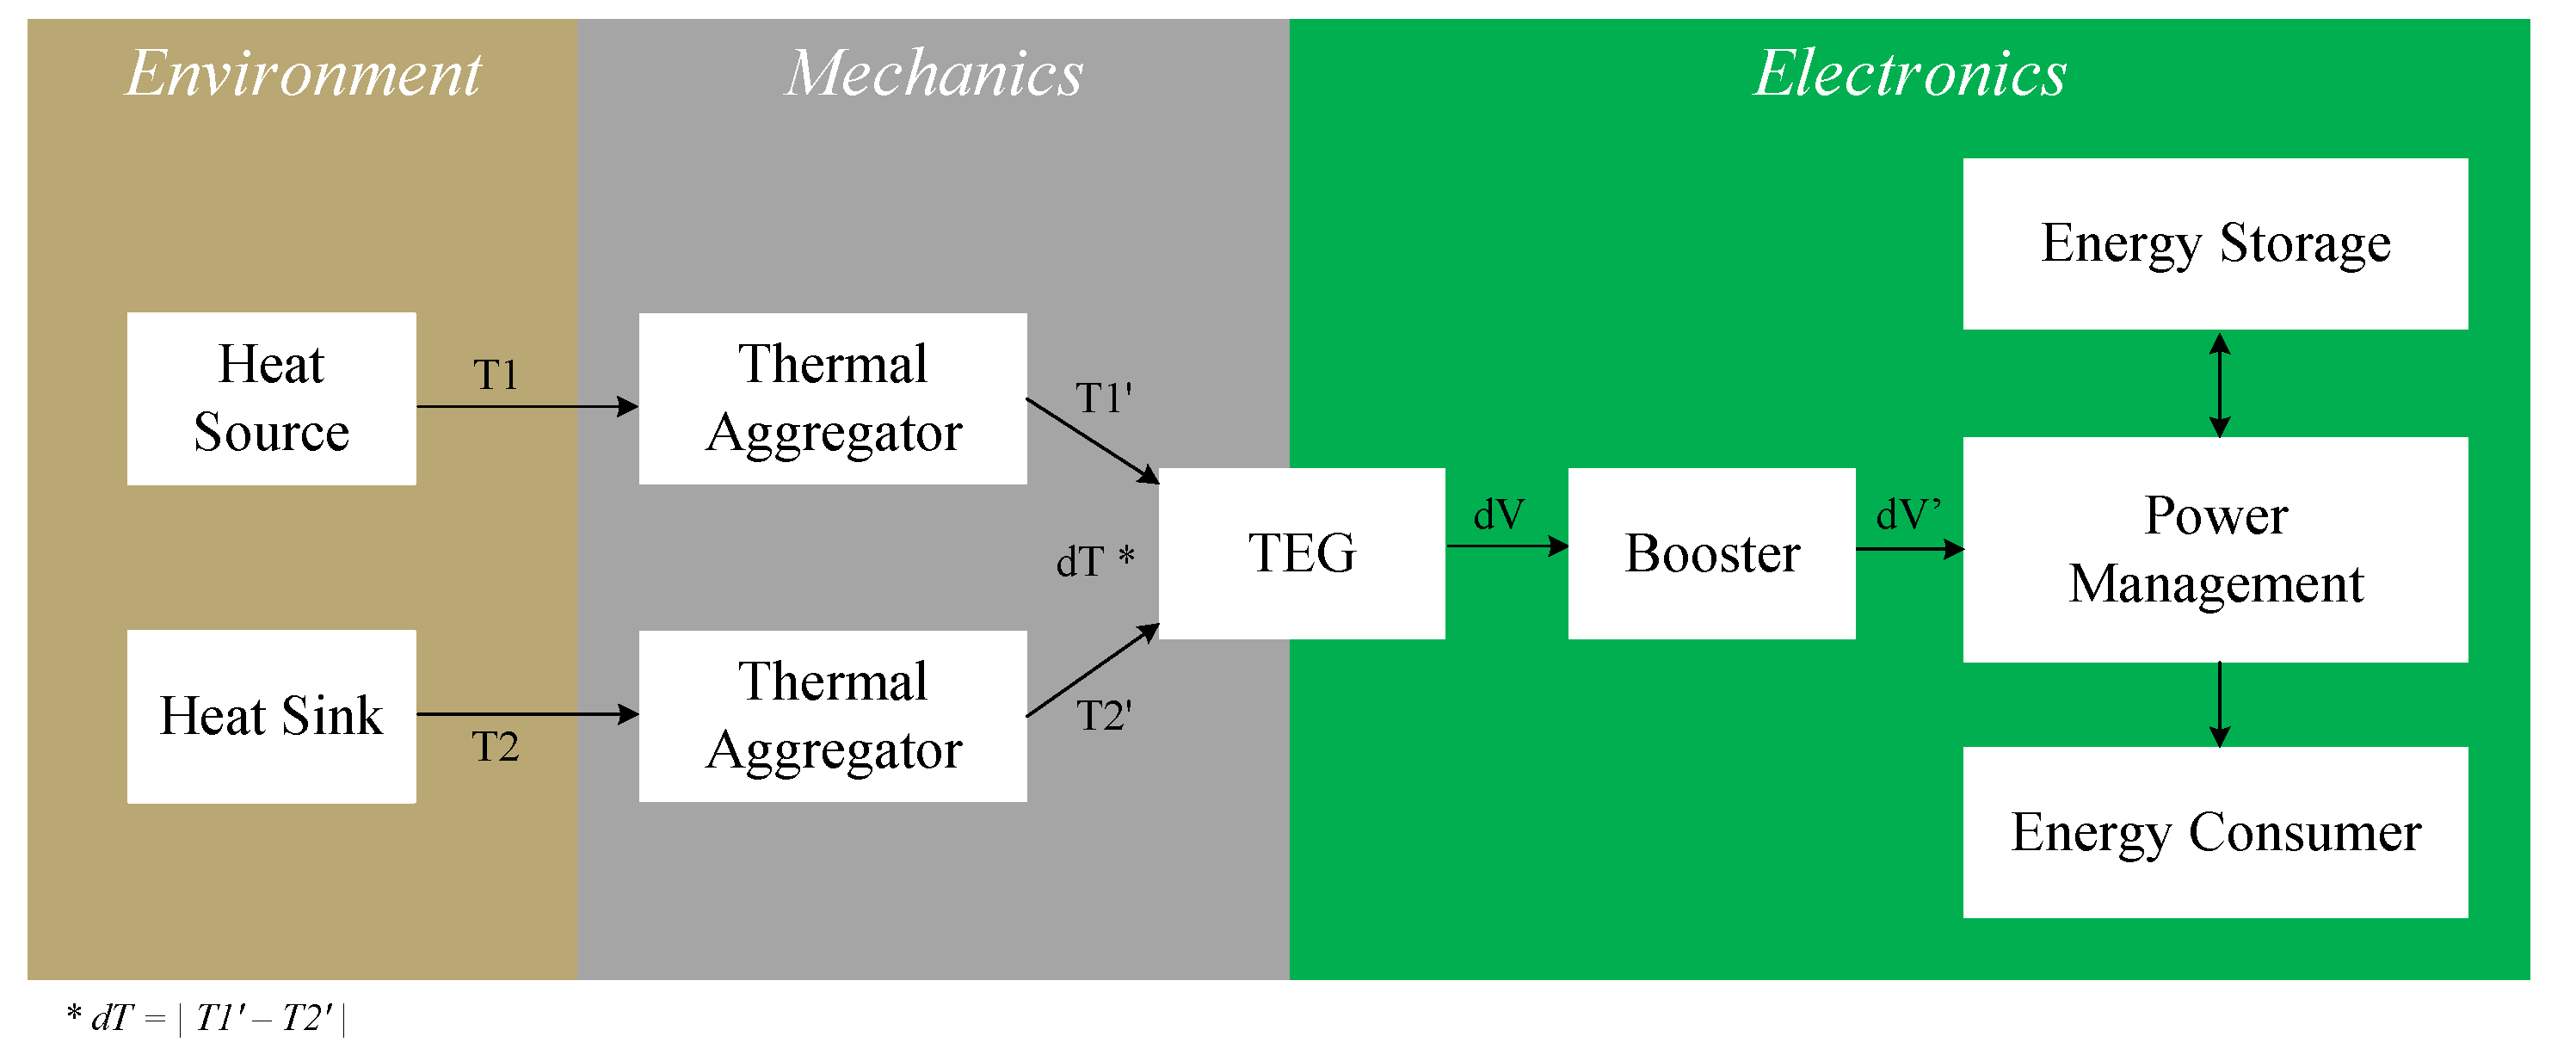
Despite the low efficiency of a TEG, the technology can power highly constrained sensor devices. Powering such devices requires optimised mechanics and electronics around the TEG, as shown in
Figure 3. The mechanics aim to provide the highest possible temperature difference dT and thus the highest possible energy to the TEG. The electronics should use this energy efficiently and effectively.
The mechanics aggregate the temperature T1 from a heat source and the temperature T2 from a heat sink in the environment. The thermal conductivity and insulation of the thermal aggregators determine the temperatures T1’ and T2’ applied to the TEG.
The output voltage dV of a TEG at small temperature differentials of a few Kelvin is typically too low to power any integrated circuit with advanced power management features. A low-voltage booster therefore converts the output voltage of the TEG to a more suitable range dV’. The voltage dV’ allows a configurable power management chip to manage energy storage and consumption.
The energy harvest is continuously stored in the energy storage until it is sufficiently filled for the electronics to perform the required action. In this scenario, the energy consumer performs a sensor measurement and transmits the measurement data via a radio link to a higher-level system.
2.1.3. Wireless Communication
Underground infrastructure is a harsh environment for wireless communications because signal attenuation in the soil can be 20 to 300 times worse than in the air [
26]. The attenuation of the radio signal from a buried device communicating with an aboveground gateway increases with burial depth. The propagation of radio waves also depends on soil type and moisture, as these parameters affect the electrical conductivity of the soil and therefore the attenuation of radio waves [
27]. As a result, a long-range communication system is appropriate for the underground infrastructure used in this context. At the same time, burying the devices means that the communication range is strongly reduced. LoRaWAN is a widely deployed low-power WAN standard that enables data transmission from underground to aboveground environments. LoRaWAN in Europe uses the frequency bands 433 and 868 MHz. Despite the better penetration of the lower frequencies, studies show that operating LoRaWAN at 868 MHz outperforms 433 MHz in underground applications [
28].
2.2. Soil Temperature Model
Harvesting thermal energy requires temperature gradients of about 0.5 °C, which occur during some hours of the day. To assess the potential for energy harvesting at the soil-to-soil interface, we aimed to model the thermal conditions in the soil compartment a priori. Our preliminary analyses showed that simple modelling approaches, such as assuming a sinusoidal annual temperature variation that is further attenuated with soil depth [
29,
30], are too simplistic. A more profound and temporally more differentiated model seems to be more appropriate, as it would reproduce short-term soil temperature dynamics and weather-related peculiarities. The process-based CoupModel [
31] has proven to be more suitable and is therefore used in this study.
The CoupModel couples the heat and mass balance of the soil by using Richard’s equation for water flow and convective and latent heat exchange between the soil layers. The different components of the ecosystem can be activated by switches (e.g., groundwater flow or snow cover). Parameters such as albedo, snowmelt characteristics, and—most importantly—parameters characterising the soil can be defined. In addition, the approach has previously been used to model the thermal conditions of the subgrade soil of an asphalt surface [
32,
33].
The current study uses available data on meteorological variables such as ambient air temperature, precipitation and global radiation as driving model inputs. The soil compartment under the ground cover (roads) was assumed to be homogeneous and of the same type as the undisturbed soil in the region of interest. Water retention curves are based on Van Genuchten parameters and were determined using the Rosetta 3 model proposed in the work of Zhang et al. [
34]. Readily available data such as altitude, latitude, mean air temperature and the amplitude of the air temperature were adapted for each site.
For the scenario analyses, meteorological input data were obtained from the IDAweb [
35] data portal for teaching and research of MeteoSwiss, and soil characteristics were taken from soil grids [
36]. The model was validated in two ways: (i) against soil temperature measurements (1993–2001) for eleven locations across Switzerland with a natural land cover and (ii) as part of a more detailed, site-specific validation for two sites in Winterthur and Fehraltorf, for which own soil temperature measurements at different depths were used (Fehraltorf data are available online [
37]). The latter reference sites are located under roads, i.e., an impermeable asphalt cover.
2.3. Implementation
This section presents the mechanical and electronics implementation and describes the field test setup. Please note that this report covers only one variation of the harvesting devices. There are several device variations with differences in electronic components or mechanical implementation. However, they fall outside the scope of this study.
2.3.1. Electronics
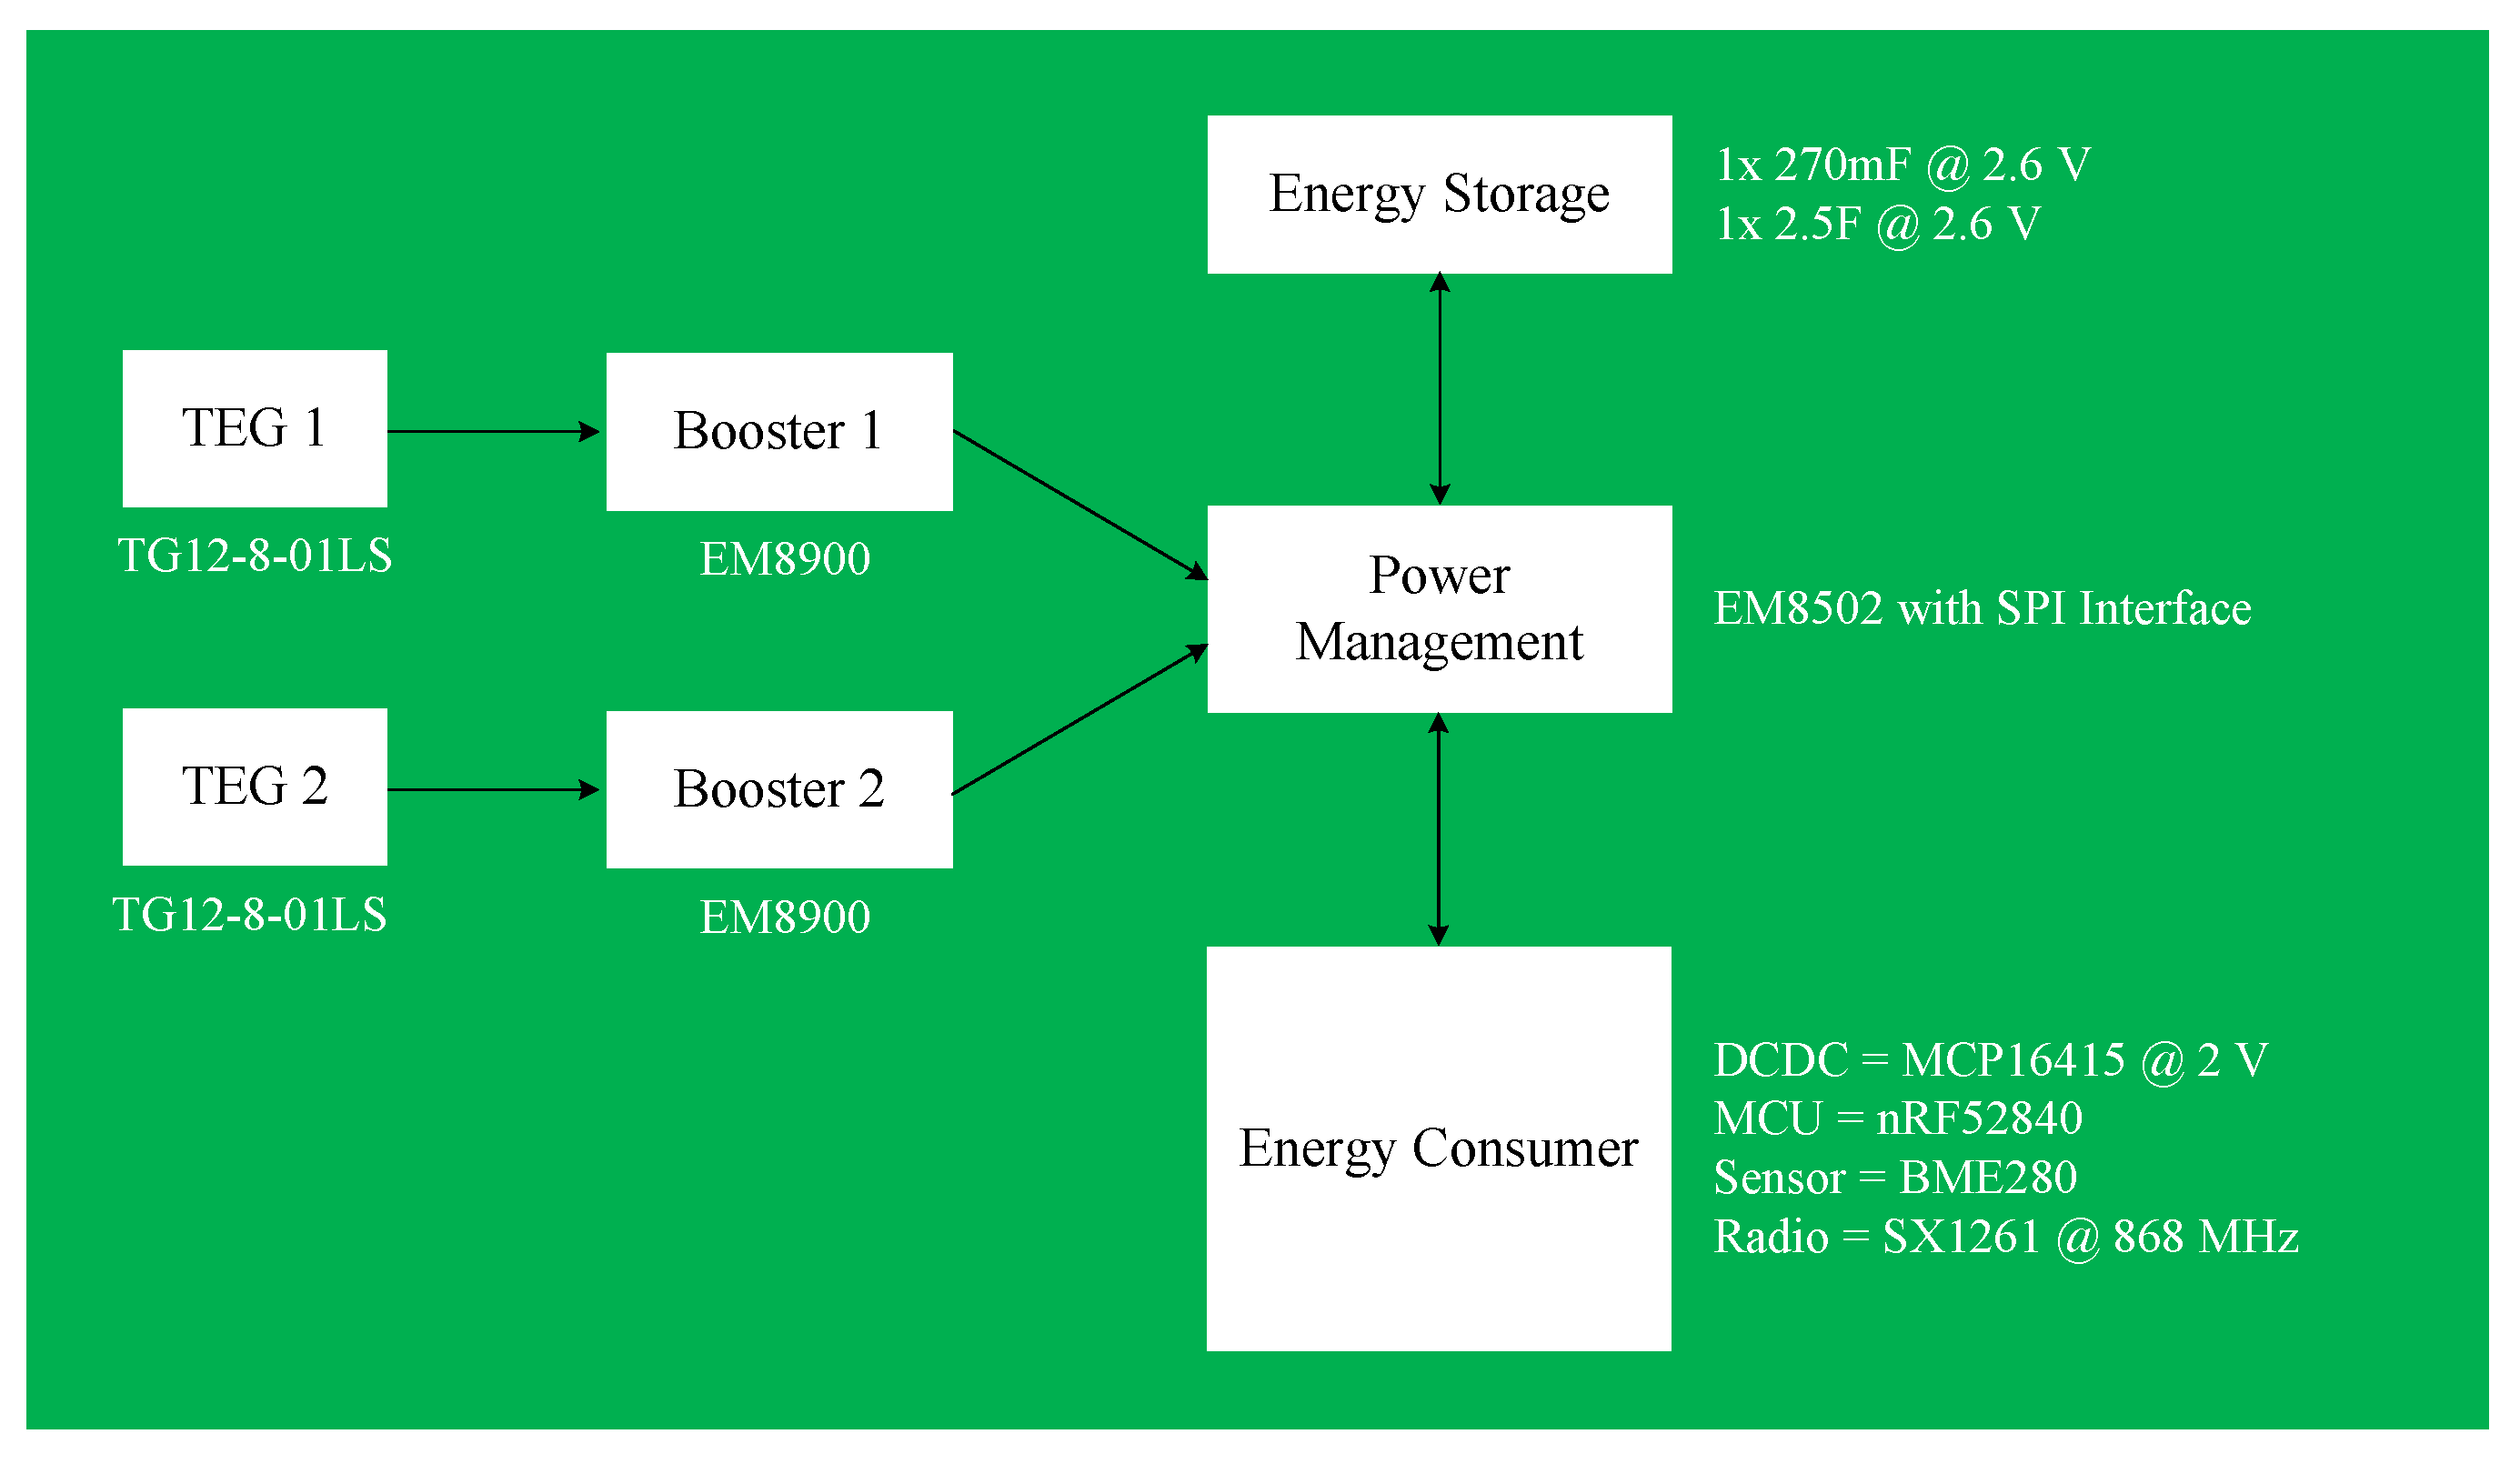
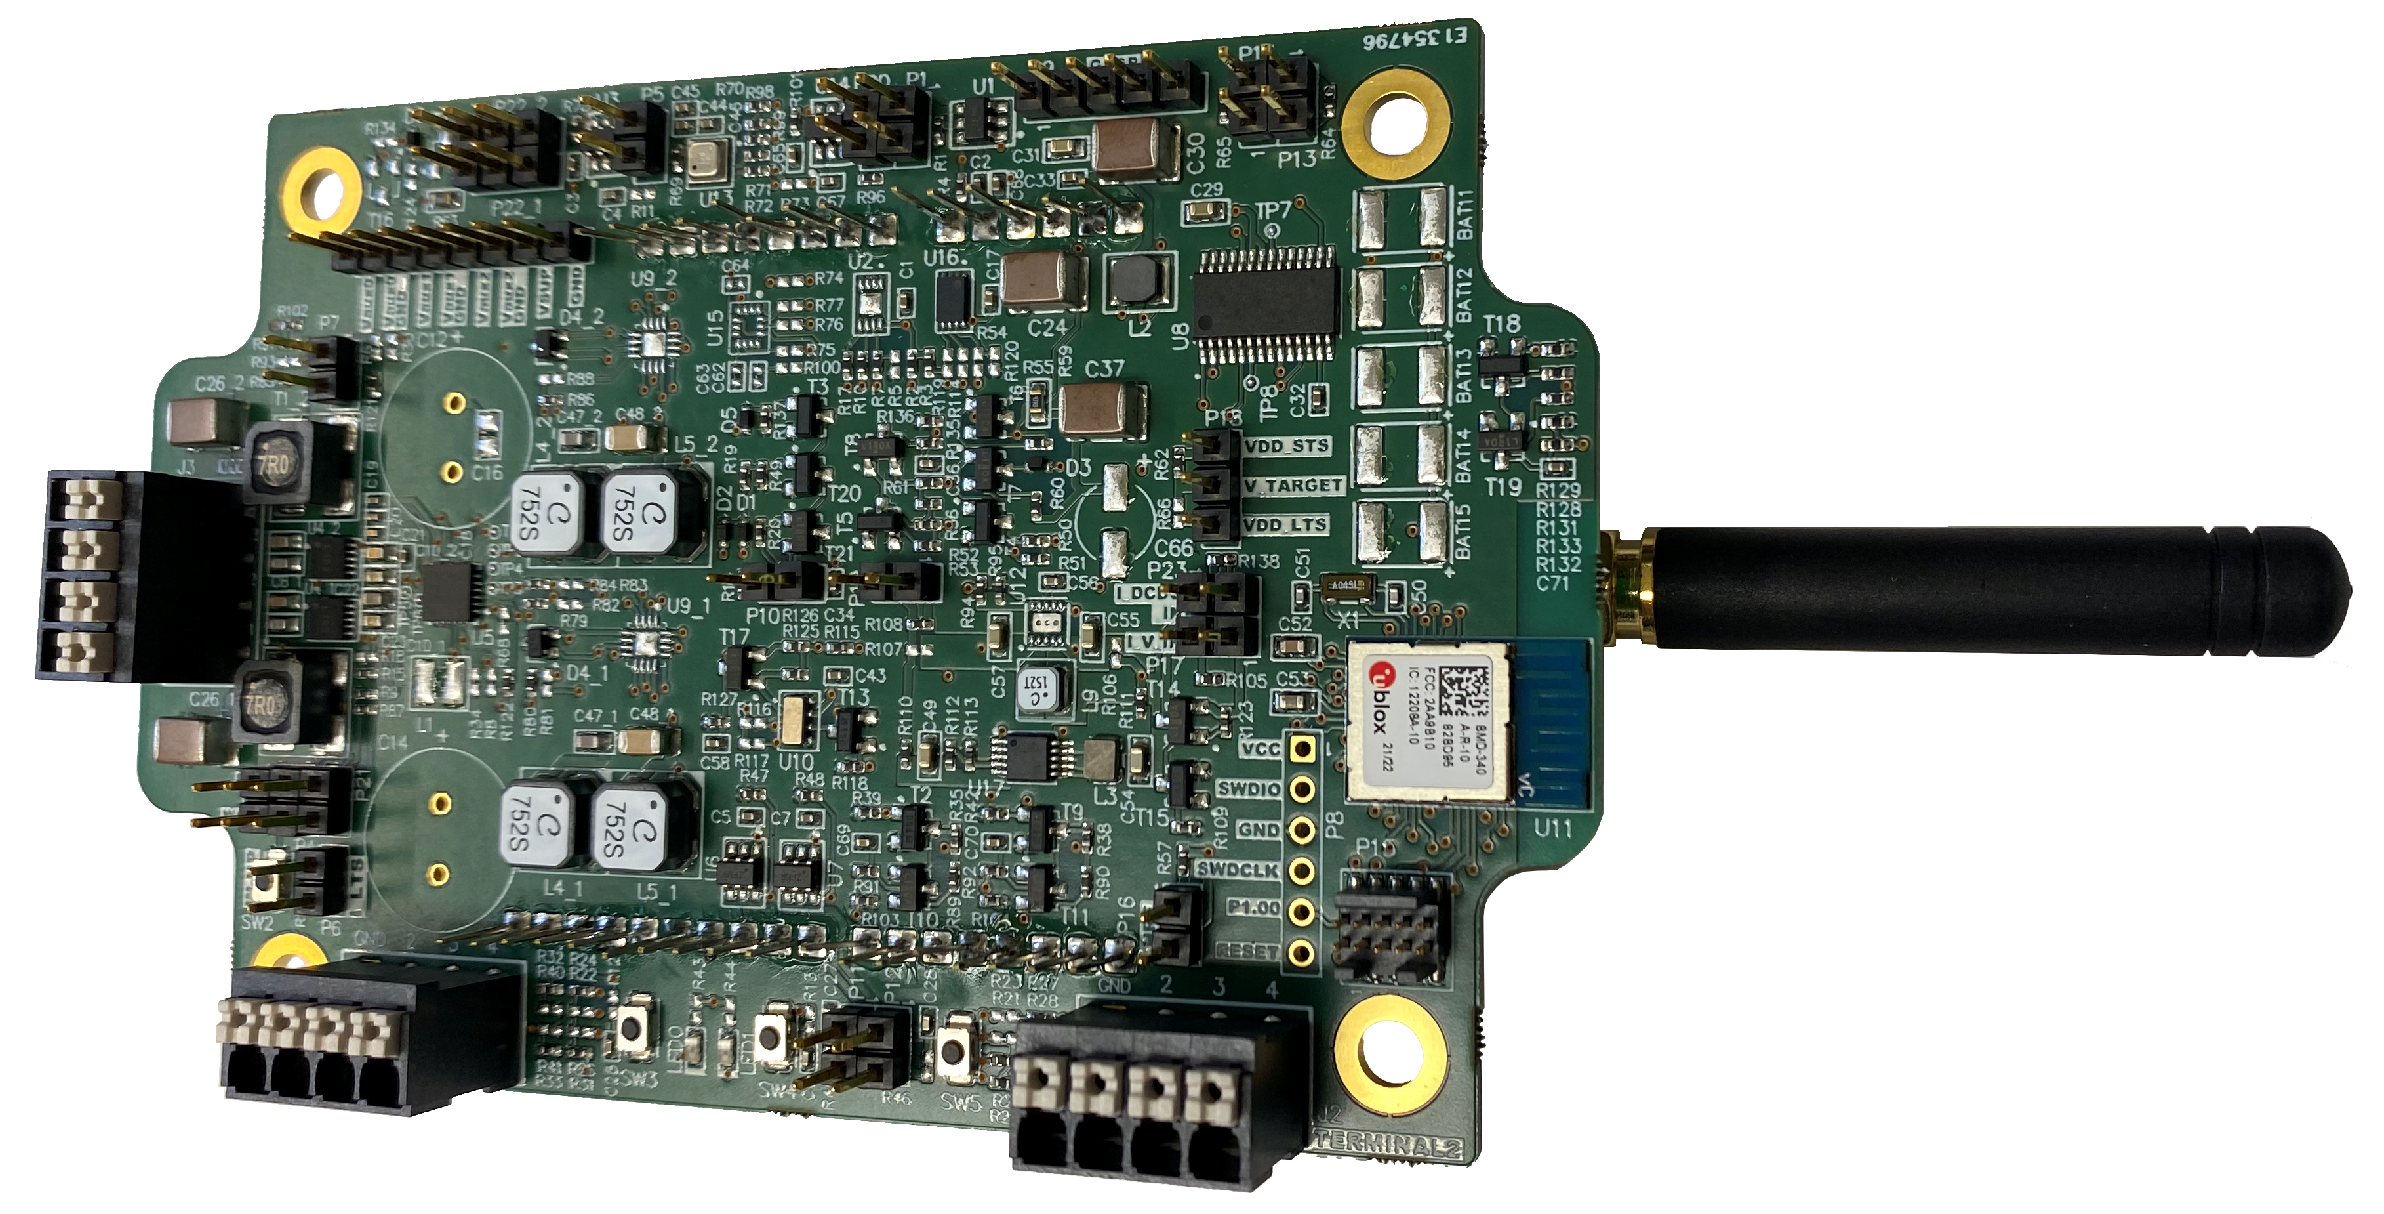
Figure 4 shows the electronic components in more detail.
The booster (EM8900) only supports positive voltages and therefore only positive temperature differences at the TEG. A second TEG and booster operate with reversed polarity to support operation with a negative temperature difference. The power management chip (EM8502) stores incoming energy in the storage up to a configured threshold and then supplies the energy consumer once the storage reaches the threshold. The onboard DCDC converter powers the energy consumer with 2 V. An nRF52840 microcontroller reads out the sensor (BME280) and transmits the data to a higher-level system via LoRaWAN with the SX1261 radio module. After the LoRaWAN communication, the nRF52840 turns off the energy consumer.
Figure 5 shows an image of the resulting printed circuit board (PCB).
The lifetime of the node is related to that of the individual components. The absence of moving parts is a positive factor. A thorough evaluation of lifetime is part of future activities. However, the conclusion from the first approach is that the critical elements on the embedded system side are the TEG and the energy storage elements. The operating and environmental conditions support the longevity of the electronic components: (i) The energy consumer is powered only during measurement and communication time windows. (ii) The circuit operates at low currents. (iii) Because it is buried, the electronics operate in a moderate temperature range throughout the year. Some components, such as storage elements, can be chosen with sufficient capacitance margin to compensate for electrolyte loss over the years.
Table 1 shows energy measurements that are used to evaluate the energy consumption of the electronics. The LoRaWAN communication uses the majority of the total energy with a consumption of 220 mJ for the transmission of a user payload of six bytes at SF12 with BW125 at 14 dBm output power. The energy for the sensor measurement—in this case, a single-shot measurement with a BME280—is insignificant. Various MEMS sensors with comparable energy consumption are available on the market and could be used instead.
2.3.2. Mechanics
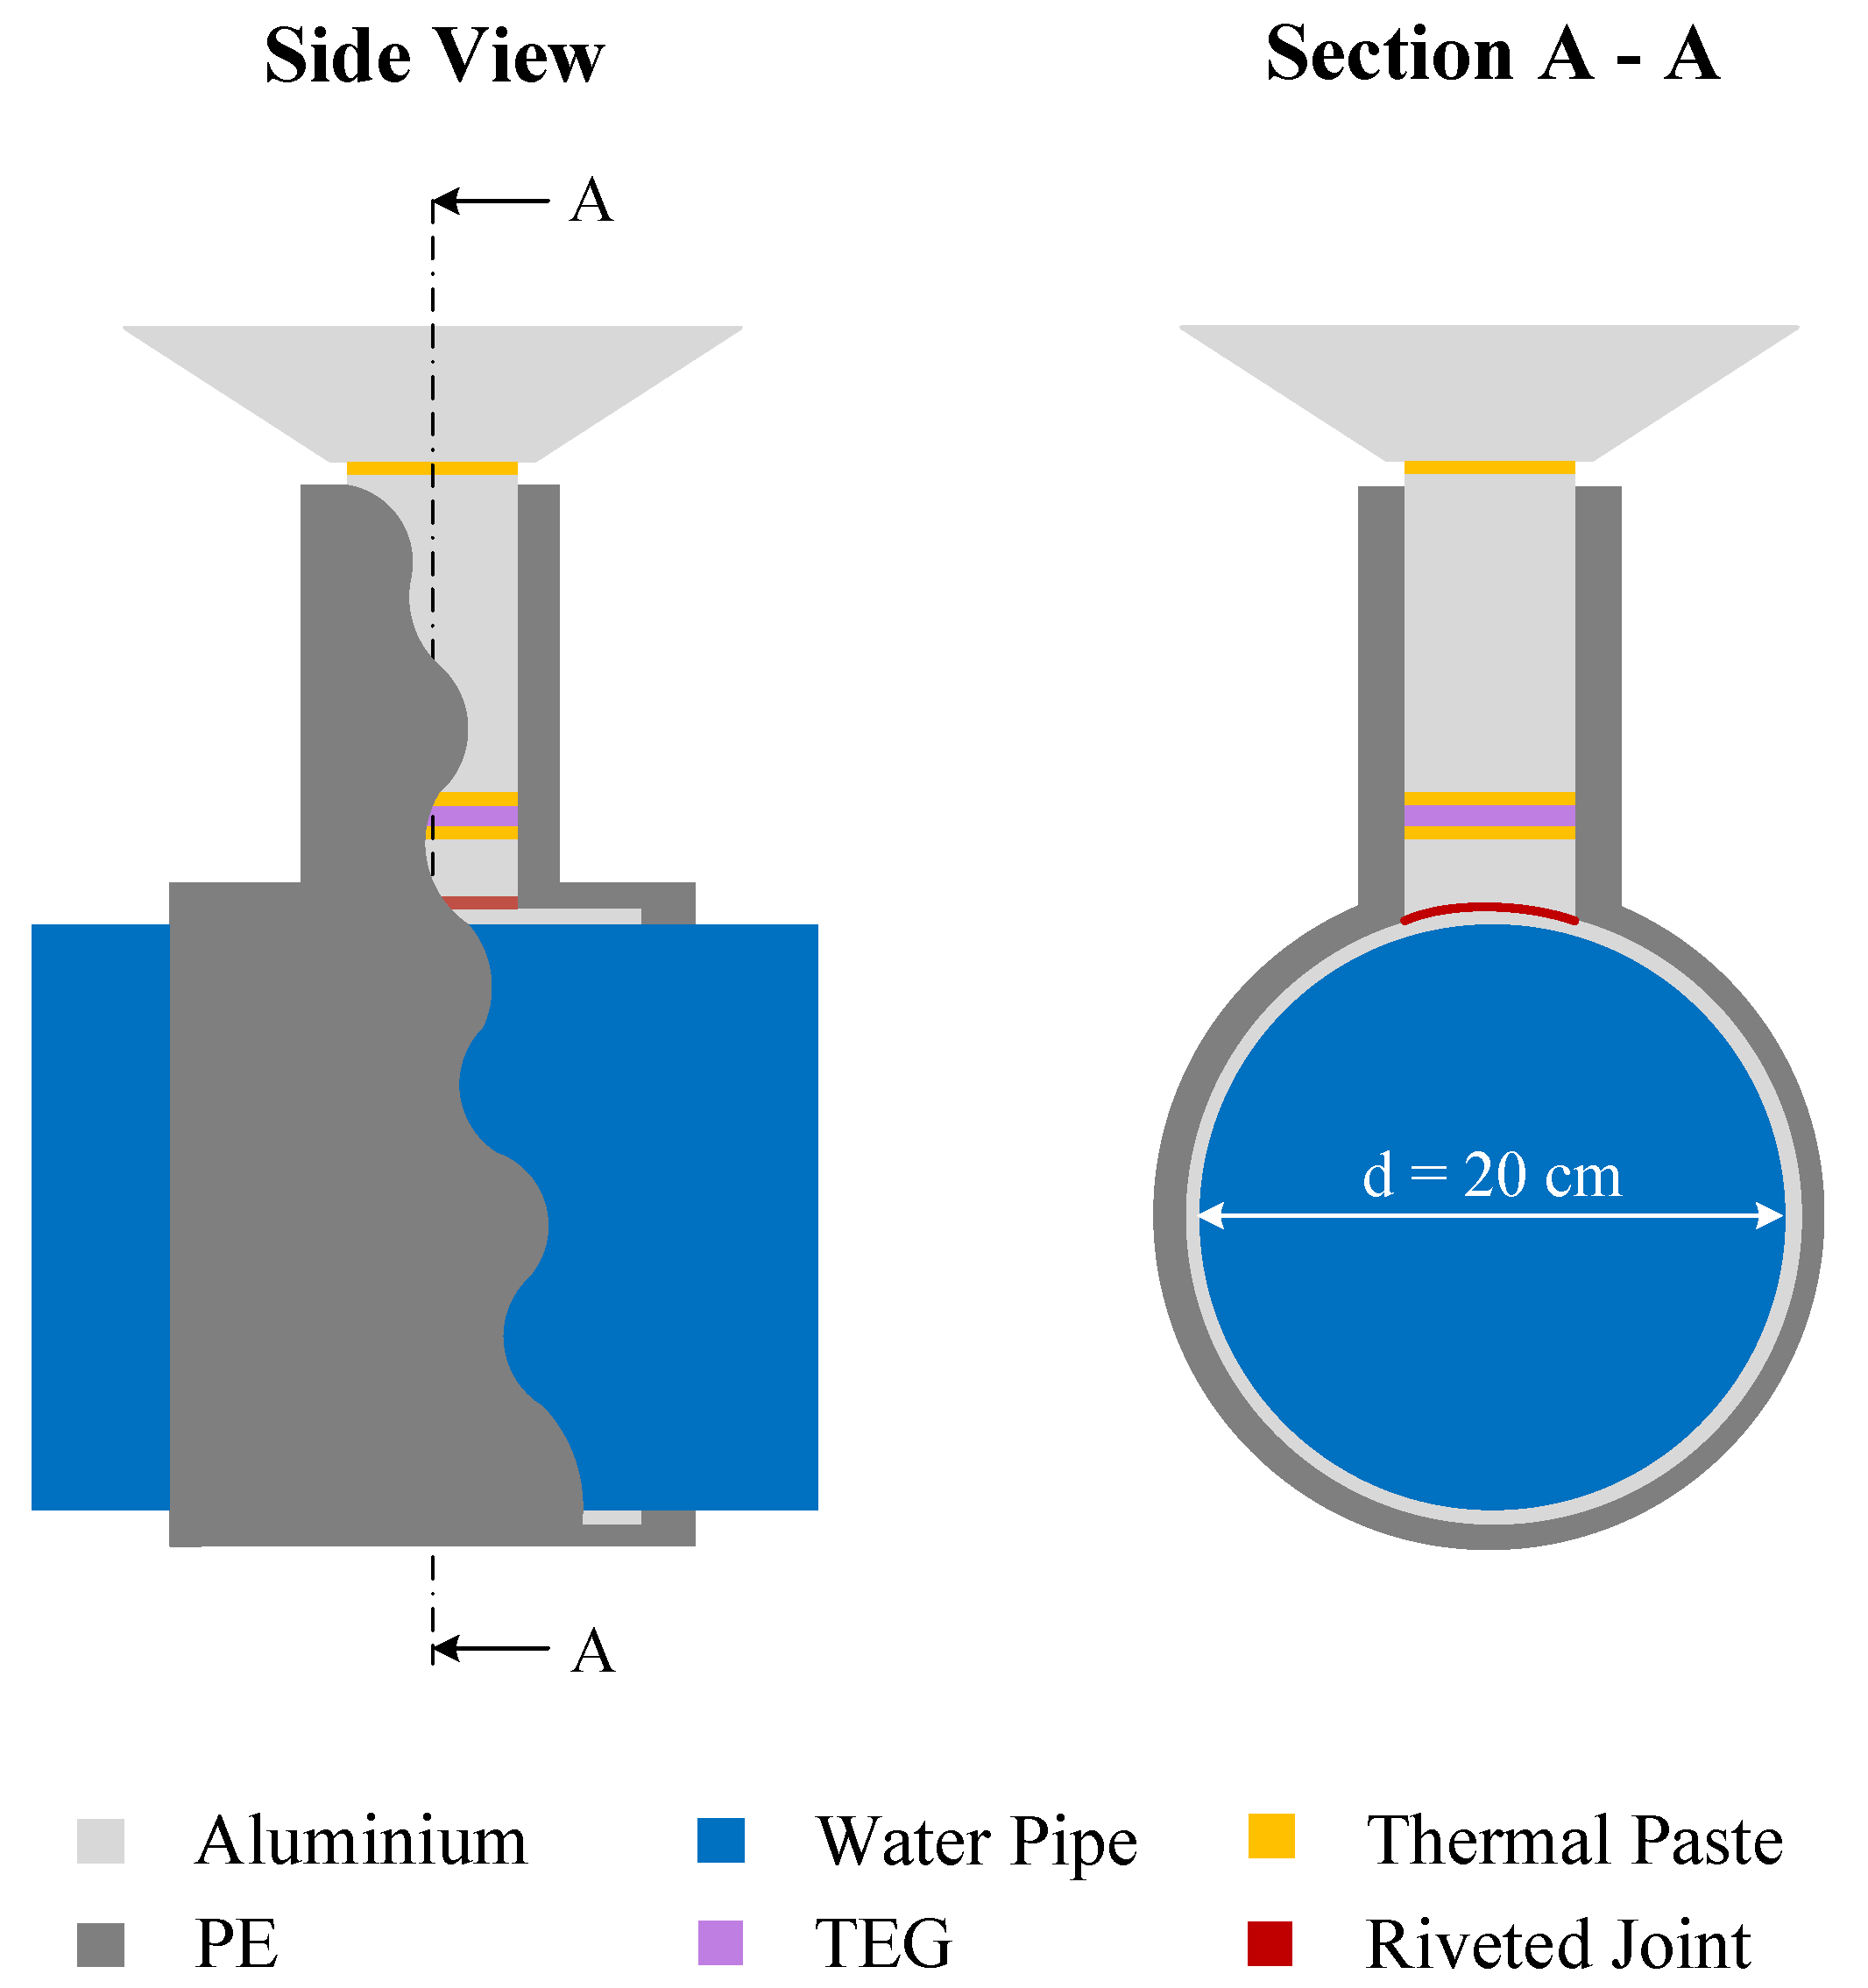
The water pipe serves as a heat sink, while the soil above the pipe serves as a heat source. The PE enclosure covers most of the design for thermal insulation.
Figure 6 shows the mechanical design in two different views: a side view and a sectional view.
An aluminium sleeve around the pipe aggregates the temperature from the water pipe. An aluminium block conducts the temperature from the sleeve to the bottom side of the TEG. On the other side of the TEG, an aluminium block aggregates the temperature from the thermal collector at the very top of the design.
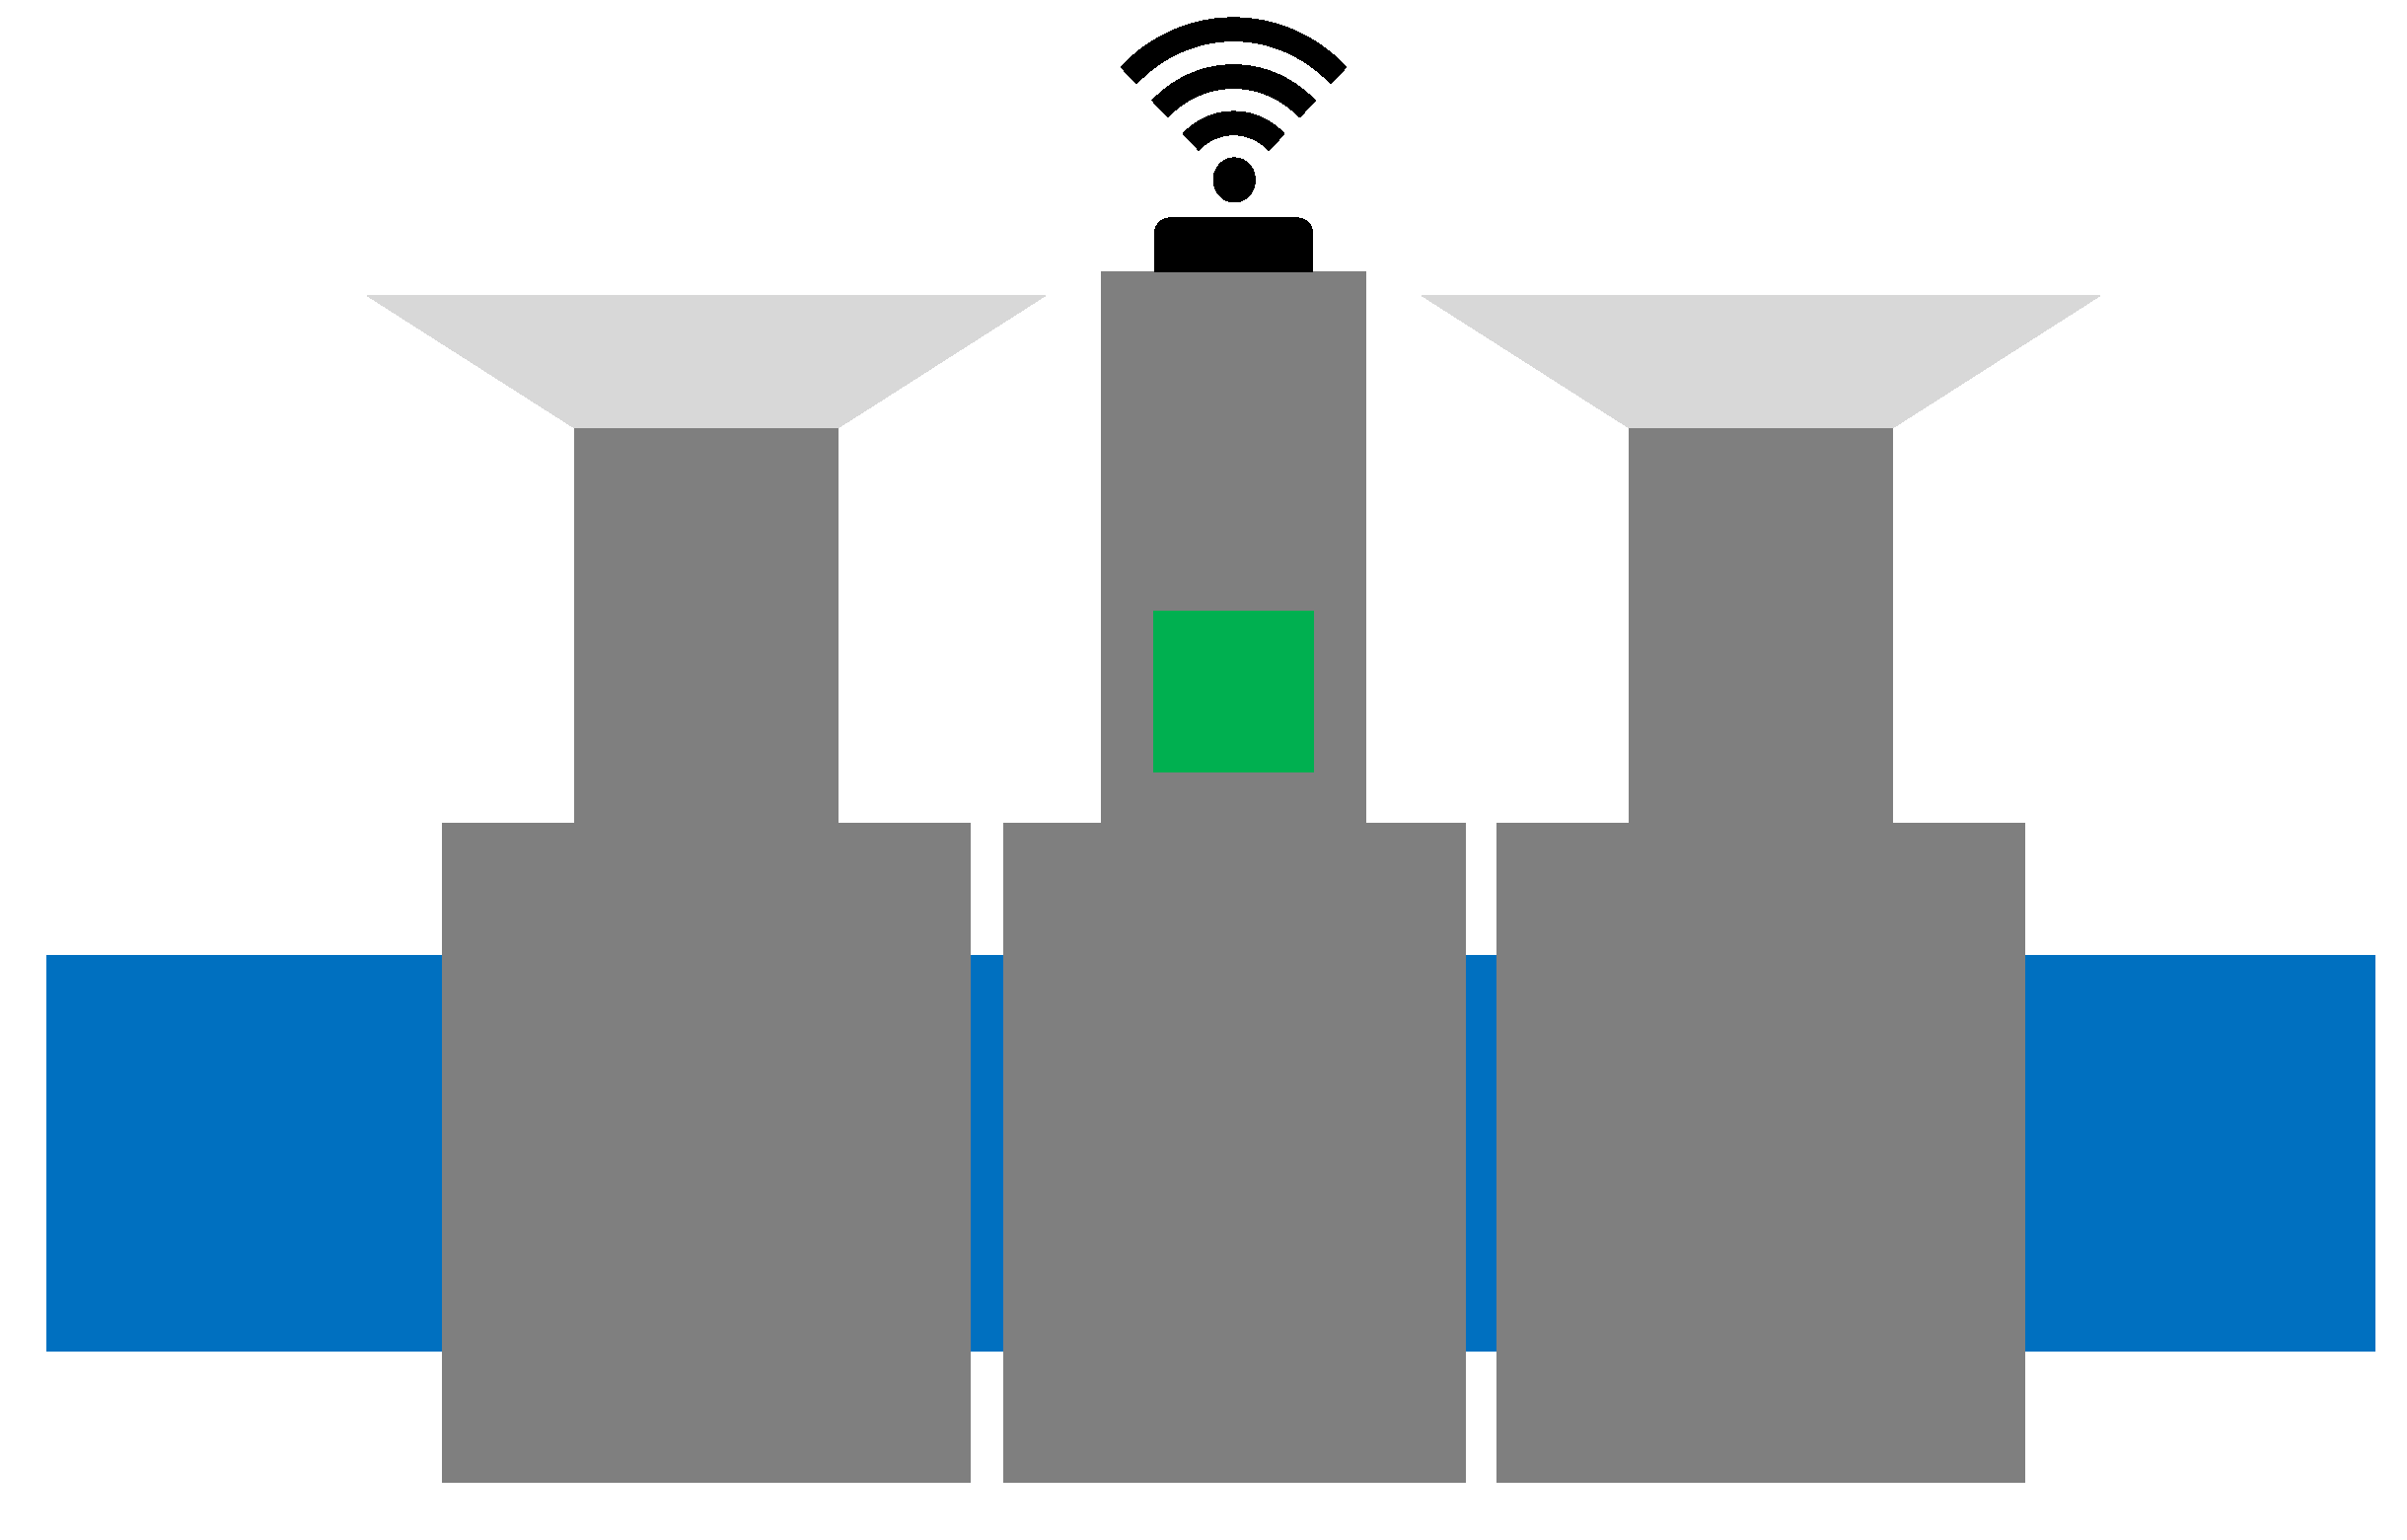
Figure 7 shows the complete design with two aggregators—one for positive and one for negative temperature differences—and the electronics in the middle. A PE enclosure protects the electronics from mechanical damage.
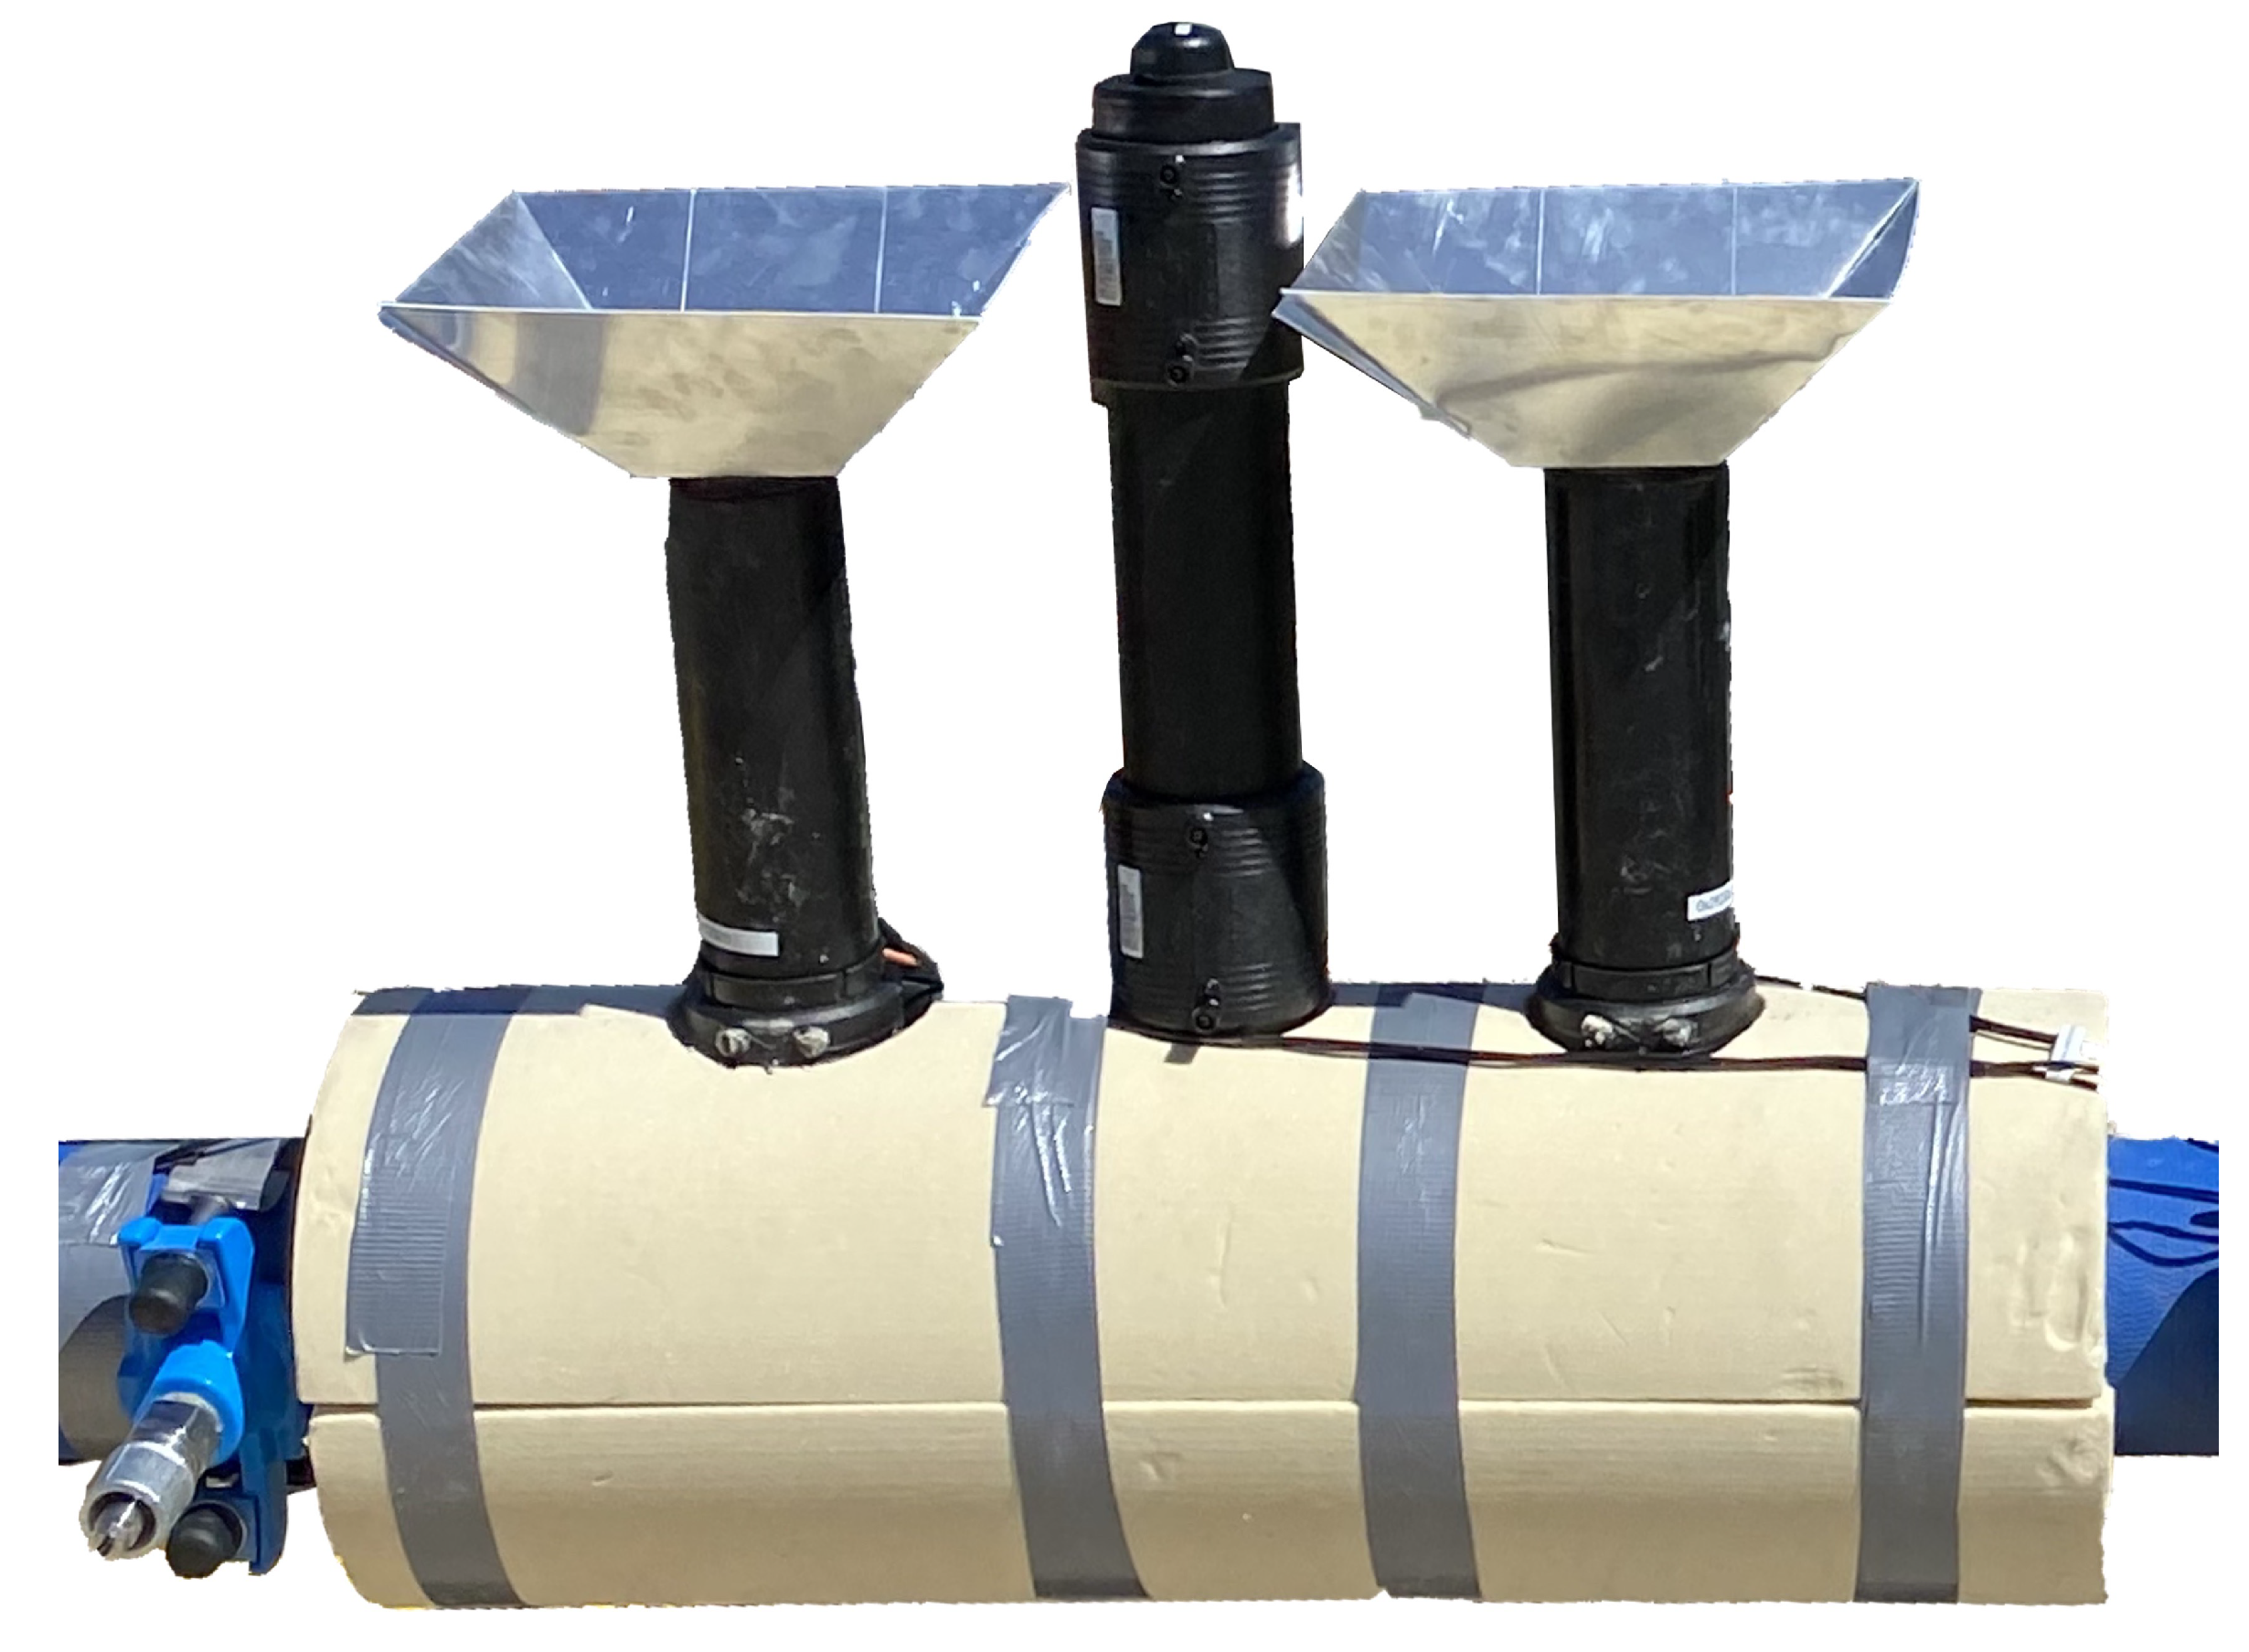
Figure 8 is a picture of the device on a water pipe. The rigid foam insulation reduces thermal loss around the aluminium sleeve.
2.3.3. Laboratory Tests
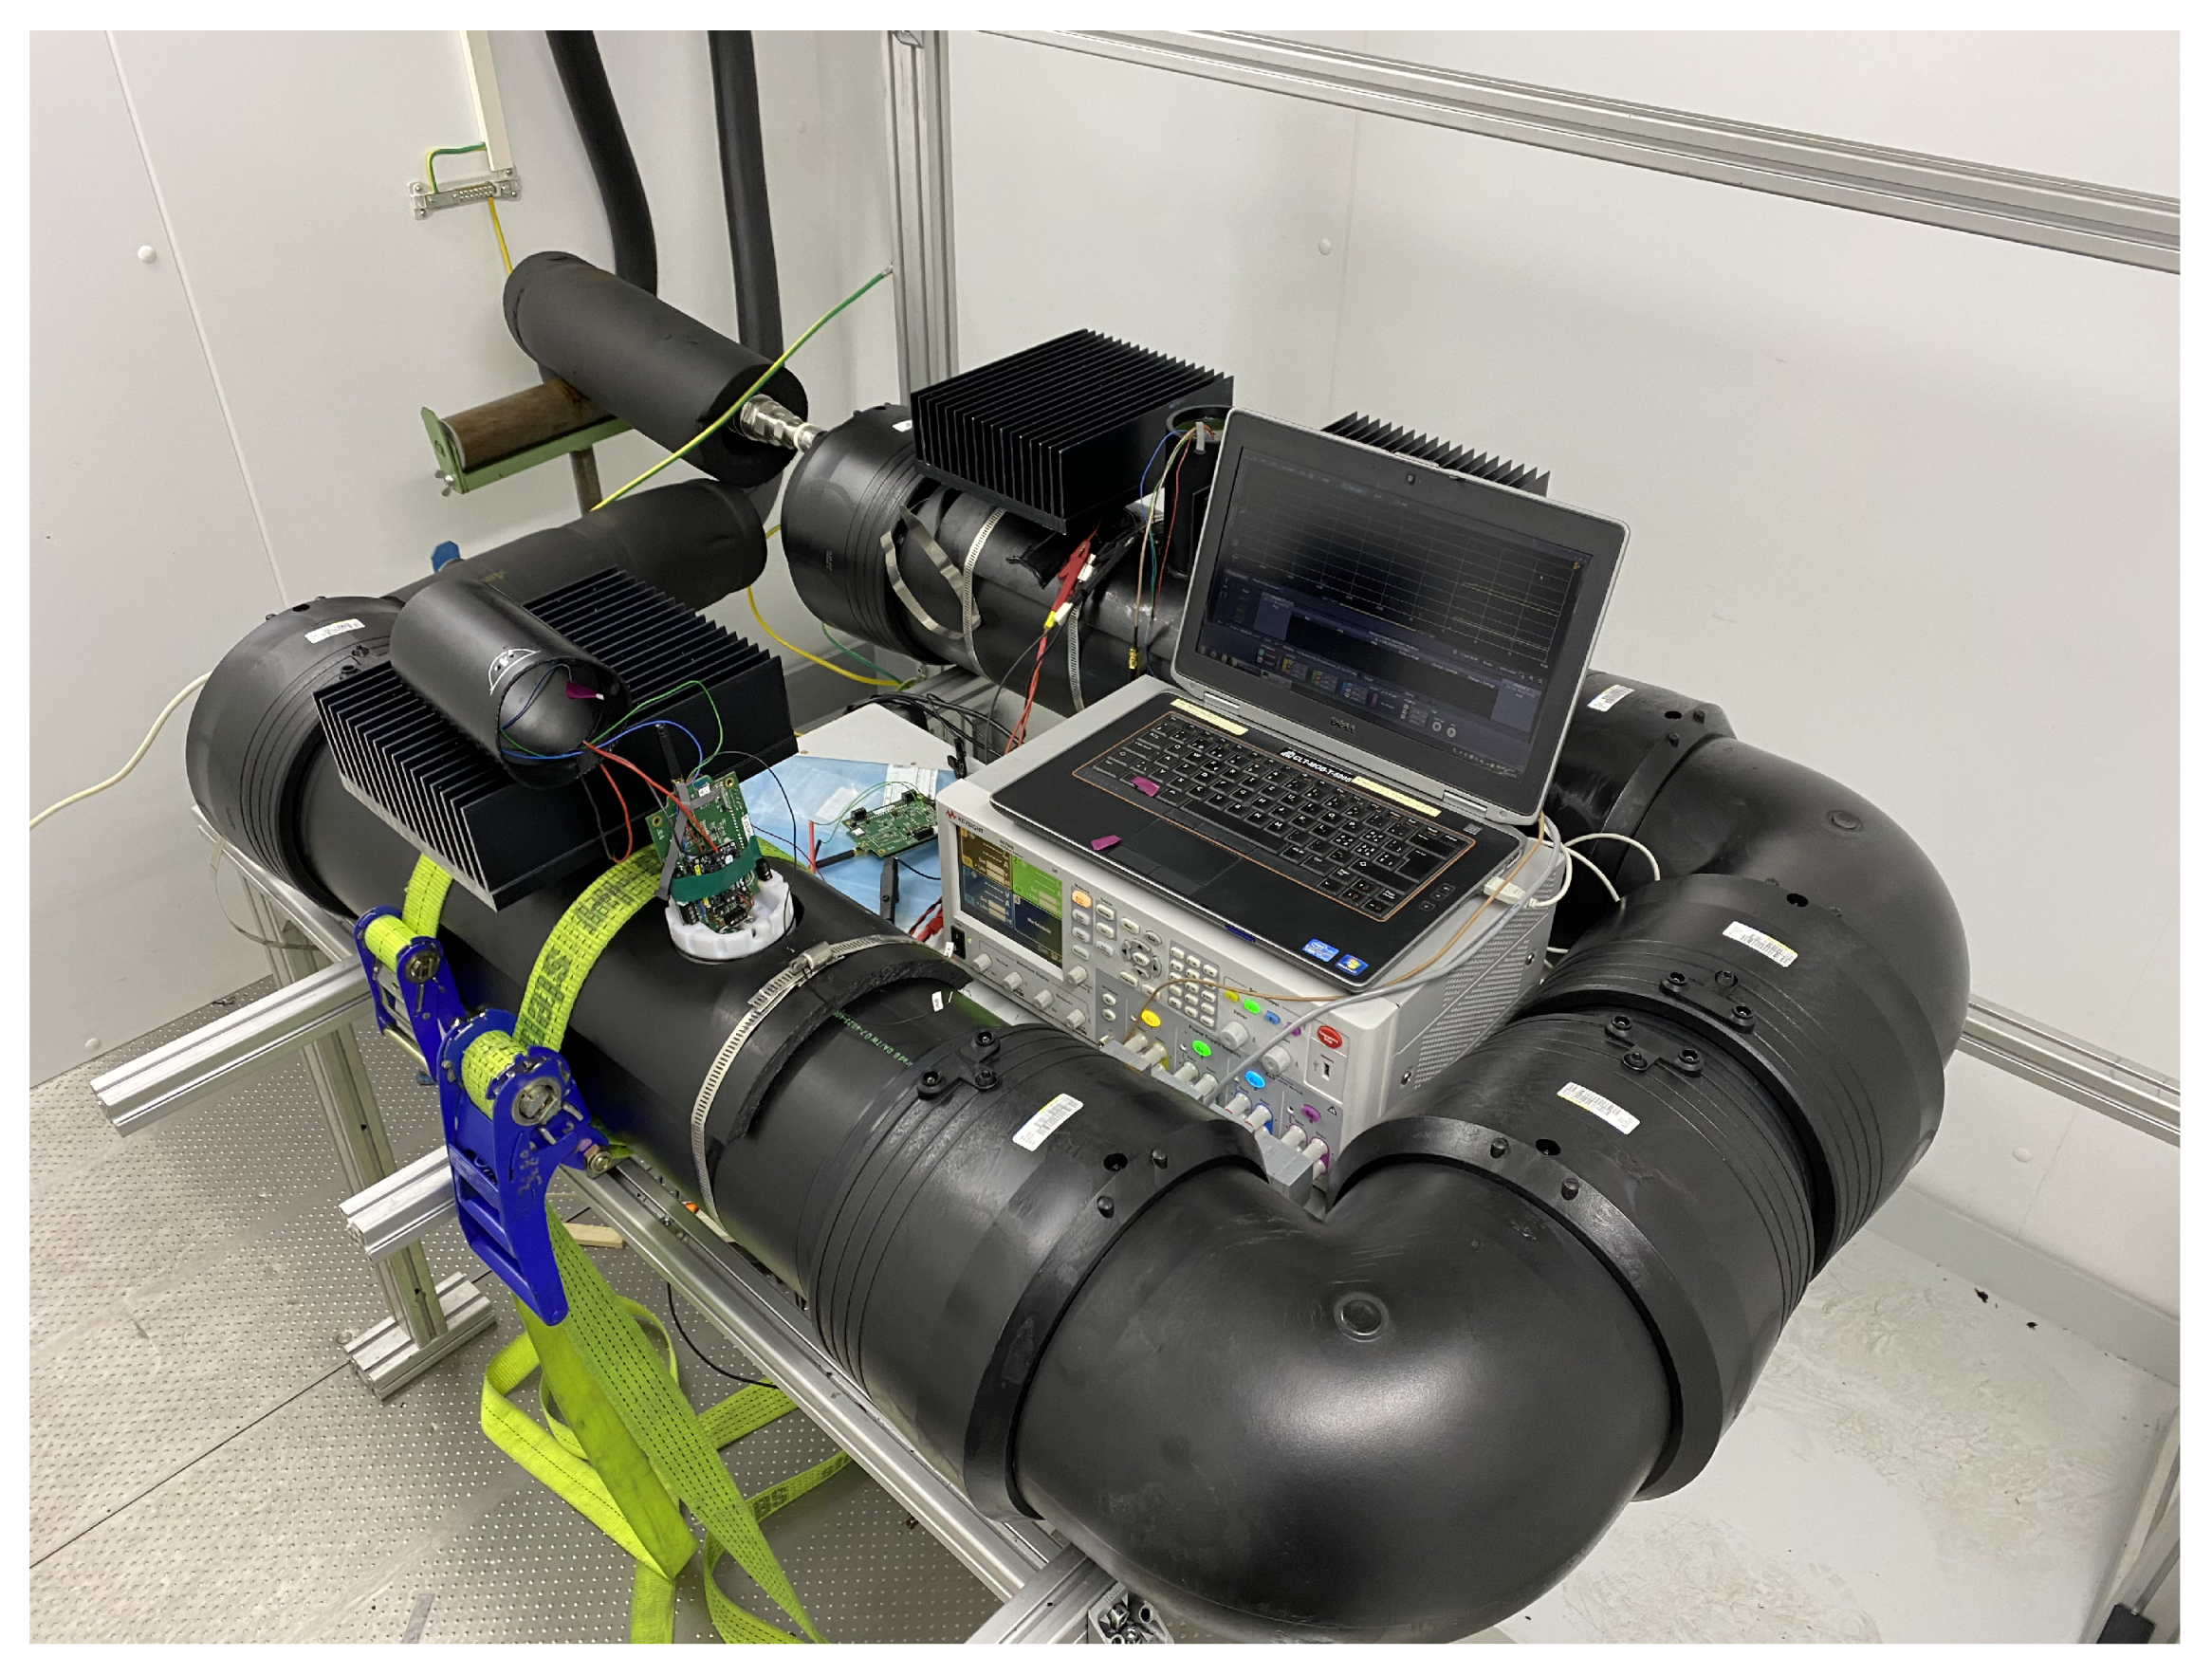
Regular testing has been conducted in a climate chamber to validate the latest design changes.
Figure 9 shows the climate chamber with a first-generation harvesting device installed. The temperature of the liquid inside the pipe and the air temperature inside the chamber are programmable, allowing initial empirical values to be gathered on how much energy is available for certain ambient temperatures. Repeatable tests inside the climate chamber also assess the improvement between different versions of the mechanics and electronics.
2.4. Field Test
The aim of the field test is to evaluate the performance of the harvesting device under real conditions. The test took place in Winterthur and Schaffhausen, two typical Swiss cities with populations of 114,000 and 36,000, respectively. This section describes the installation in the field and the available data sources for the assessment in the next chapter,
Section 3.
2.4.1. Installation
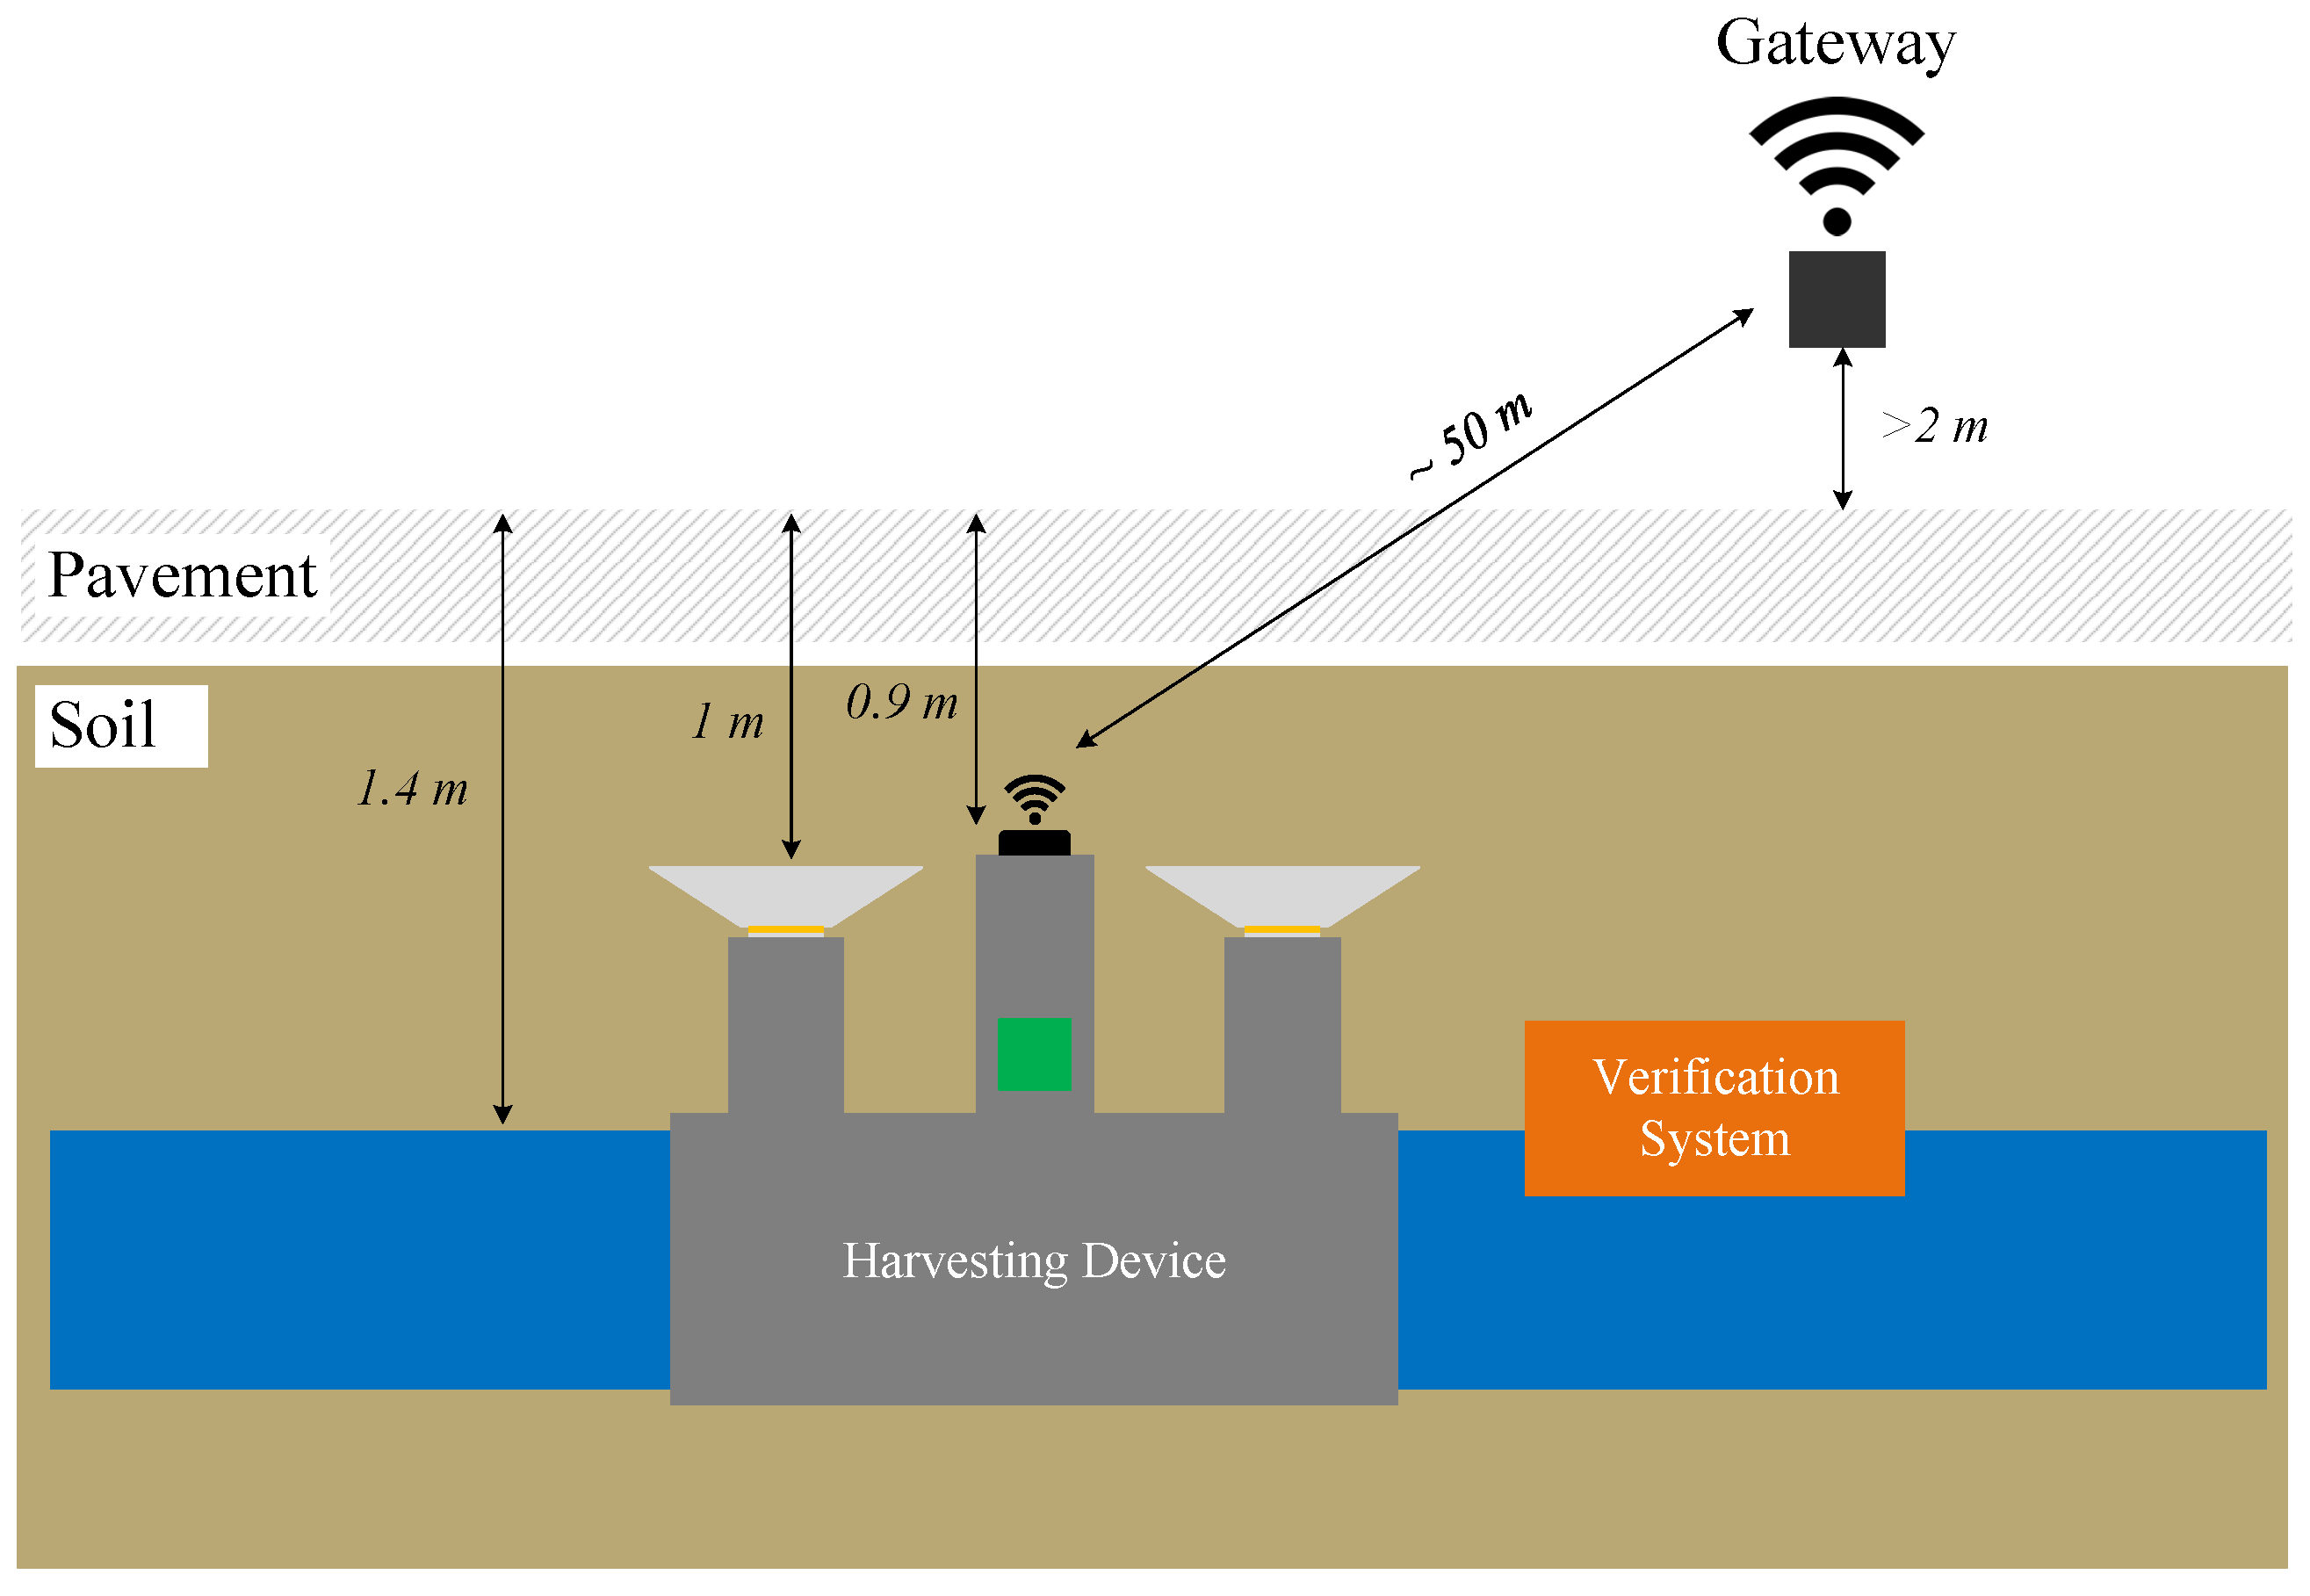
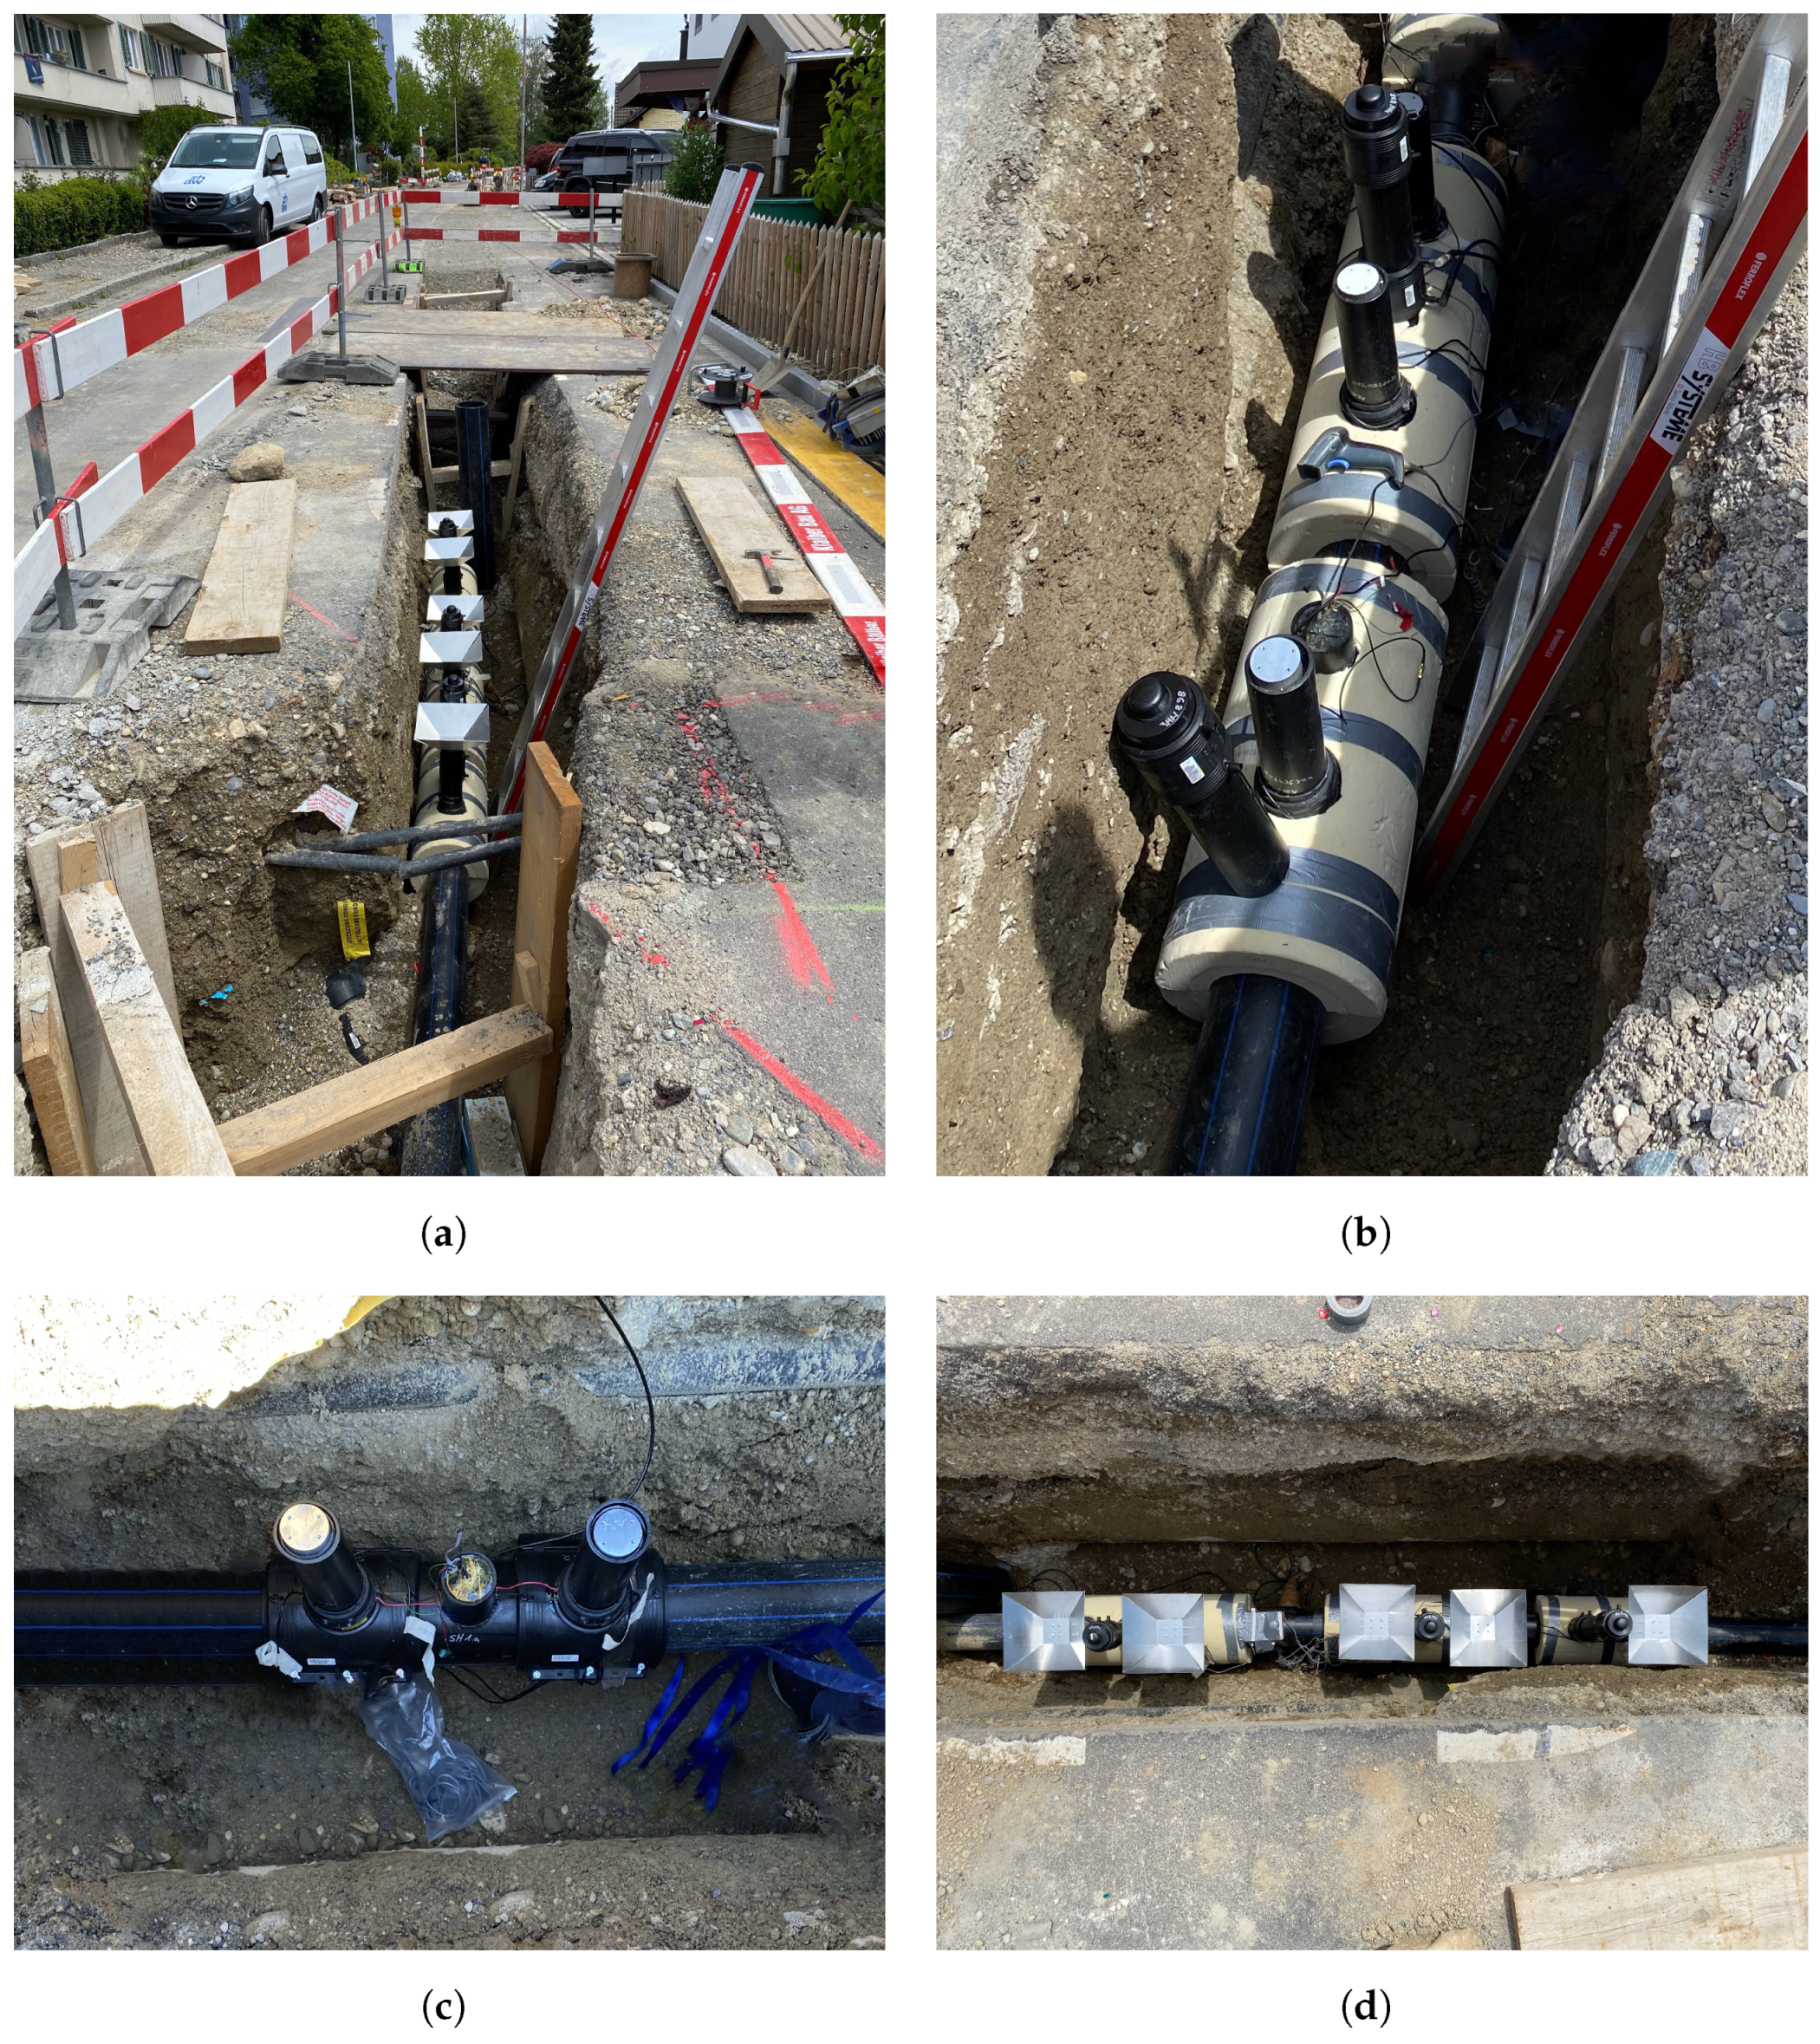
Figure 10 shows a sketch of the installation. Cable ties secure the harvesting device on the water pipe, which lies around 1.4 m below the ground. The thermal aggregators reach about 0.4 m above the pipe. The electronics are housed in a PE enclosure between the two aggregators. The antenna is on top of the housing 0.9 m below the ground.
A so-called verification system measures the temperatures directly above and below the TEGs. It also measures the pressure in the pipe. The verification system provides insight into the environment and the thermal state of the TEG, even when the harvesting device is not operating due to a lack of energy. The verification system is battery-powered. It periodically wakes up and transmits its measurements to a server via LoRaWAN uplinks. A LoRaWAN gateway is installed within a 50 m range to ensure good connectivity.
Figure 11a shows the harvesting device on the exposed pipe from the side.
Figure 11b shows the device on the pipe in the pit from above.
After the installation, the construction work is continued by filling the pit with gravel sand and covering it with granular bases and asphalt, meaning that access to the buried equipment is no longer possible.
2.4.2. Available Data for Field Test Assessment
A considerable number of parameters are available to evaluate the results of the field tests, as listed below:
Number and frequency of uplinks;
Temperatures at the TEGs;
Pressure in the pipe;
Weather data, i.e., air temperature or rain.
The key result of the field test is the number and frequency of uplinks, which represents the performance of the harvesting device. Data from the verification system, including pipe pressure and temperature at the TEGs, provide insight into the underground environment. Additional weather data from government monitoring stations in Winterthur and Schaffhausen allow for the correlation between the weather and the performance of the harvesting device to be analysed. Metadata, including RSSI and SNR, allow for an assessment of the radio link quality, although this is not the focus of this field test.
3. Results and Discussion
The period selected for the results covers a full year—from 1 October 2021 to 30 September 2022. In this chapter, we focus on one device in Schaffhausen. The comparison with an identical harvesting device located in Winterthur shows that the data are almost redundant. The corresponding plots of the device in Winterthur are included in
Appendix A.2.
3.1. Harvesting Performance during Field Test
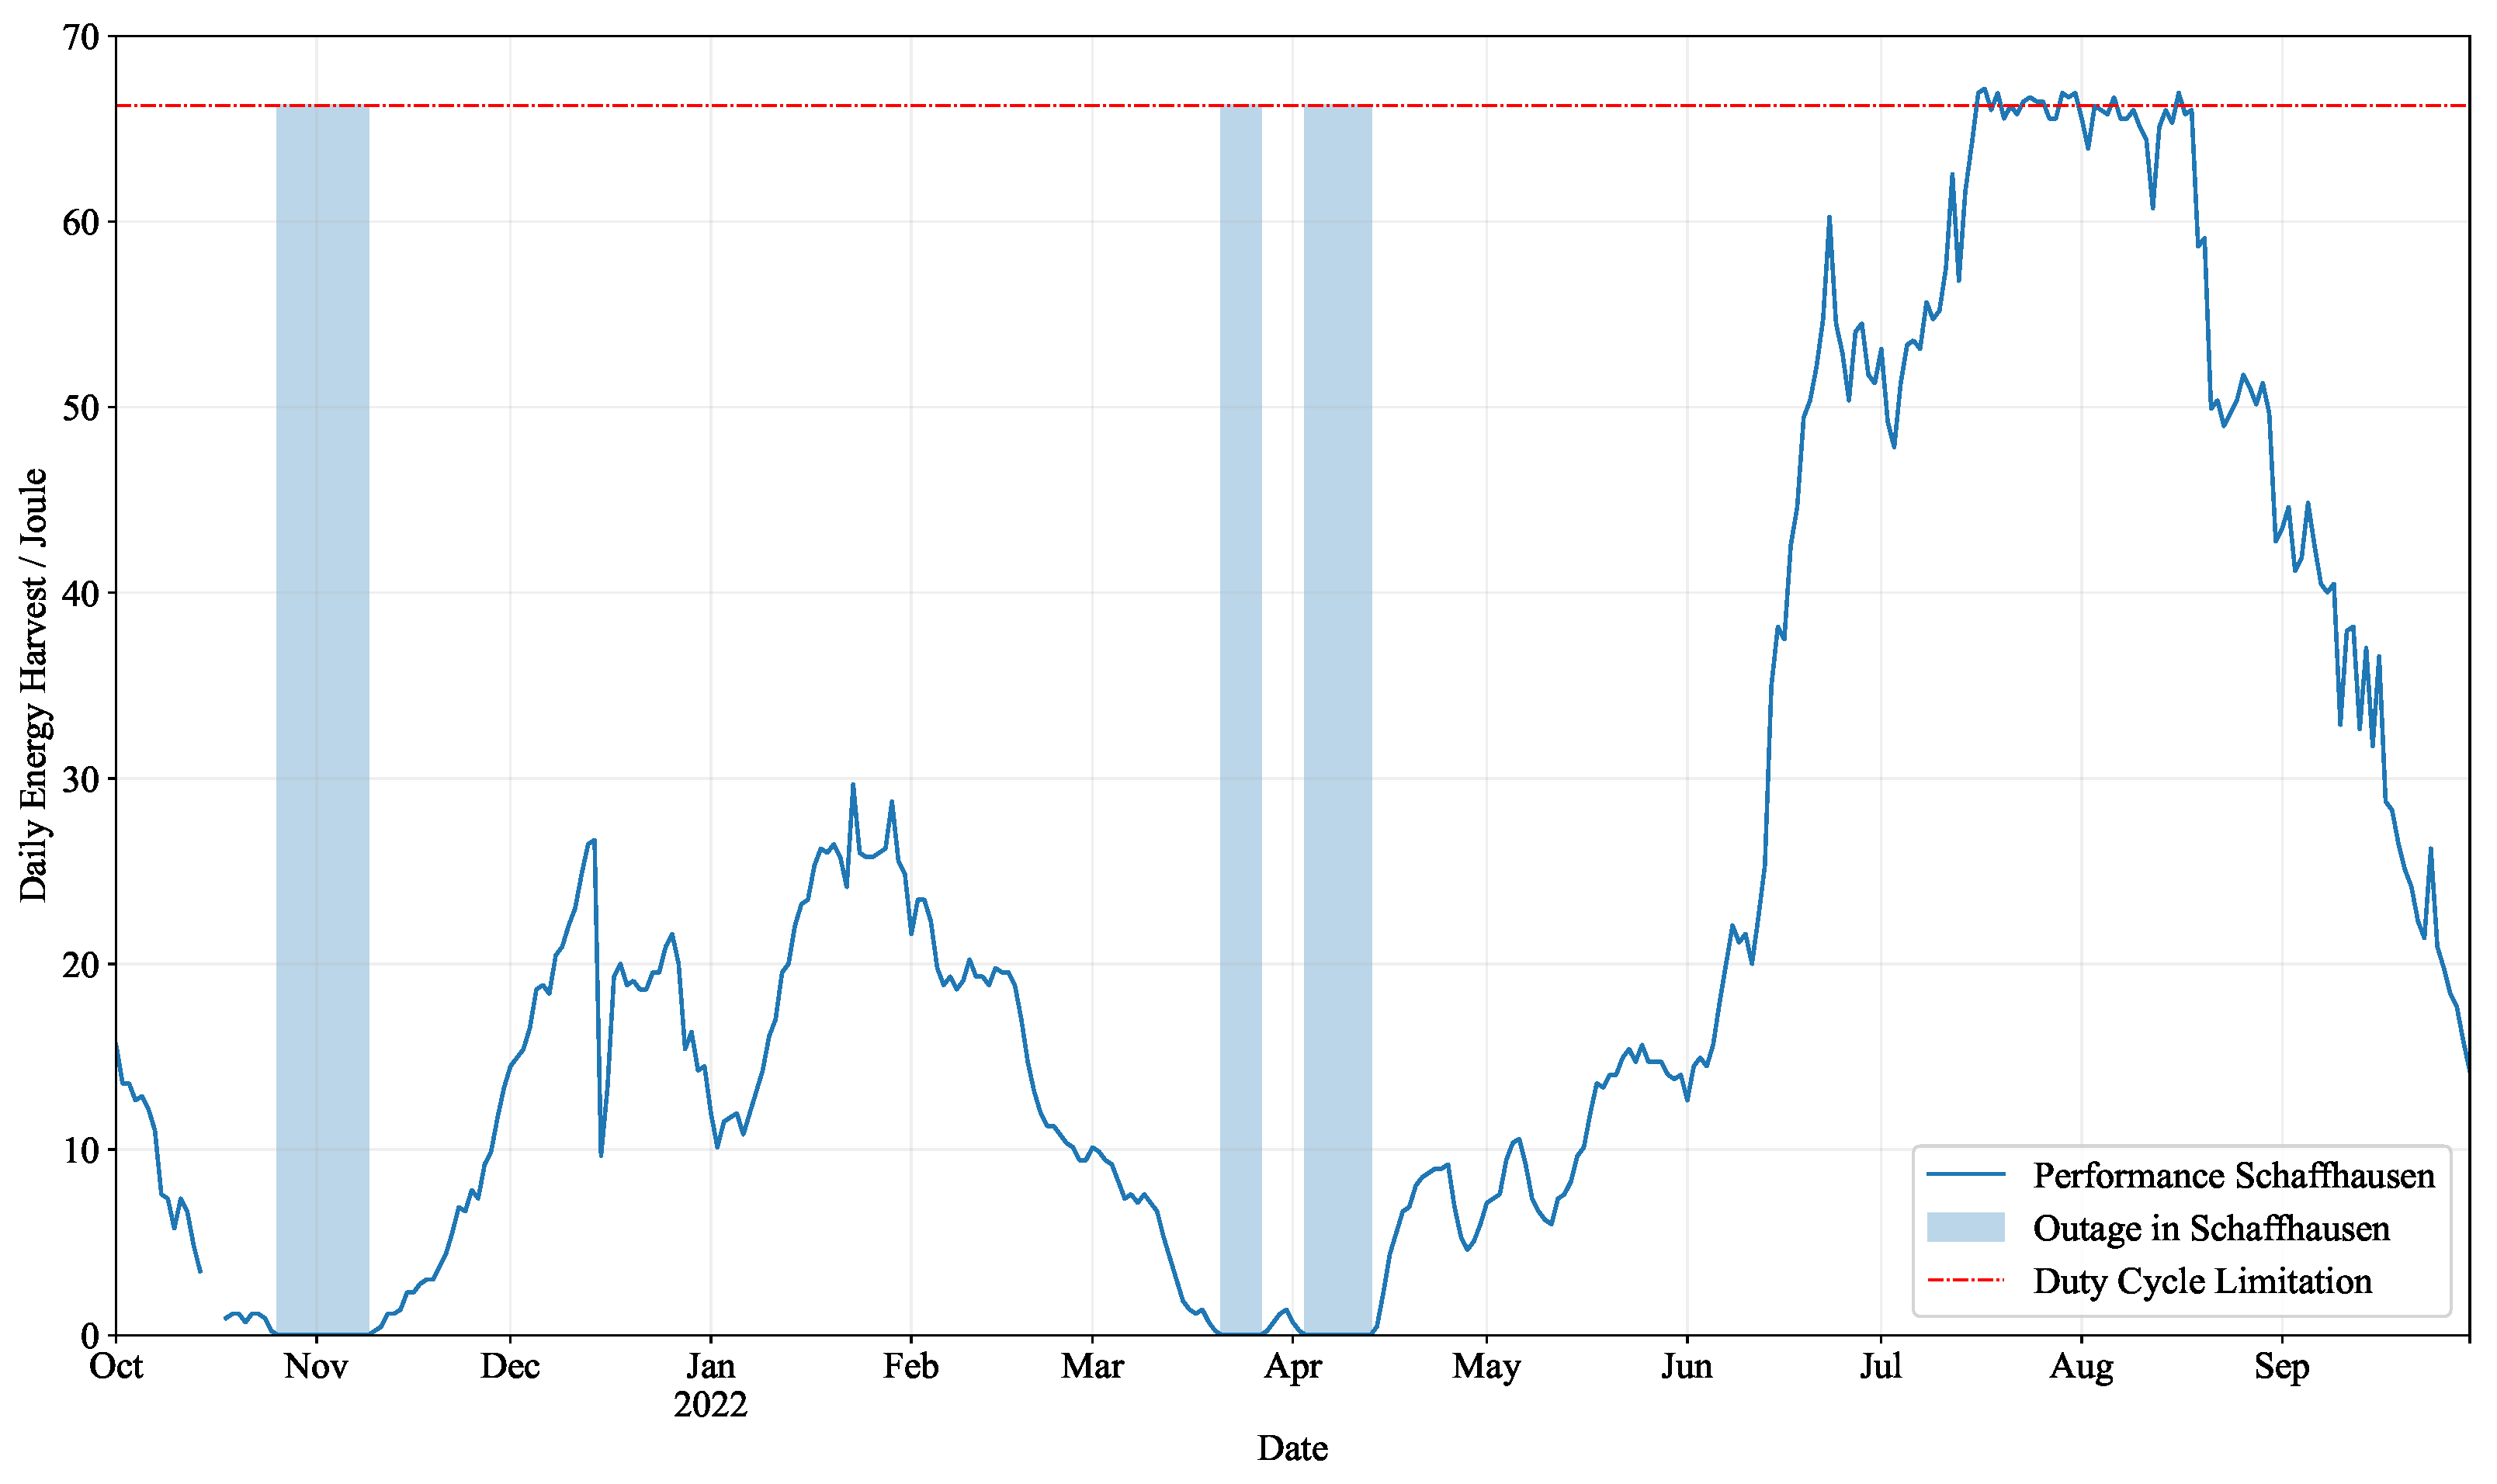
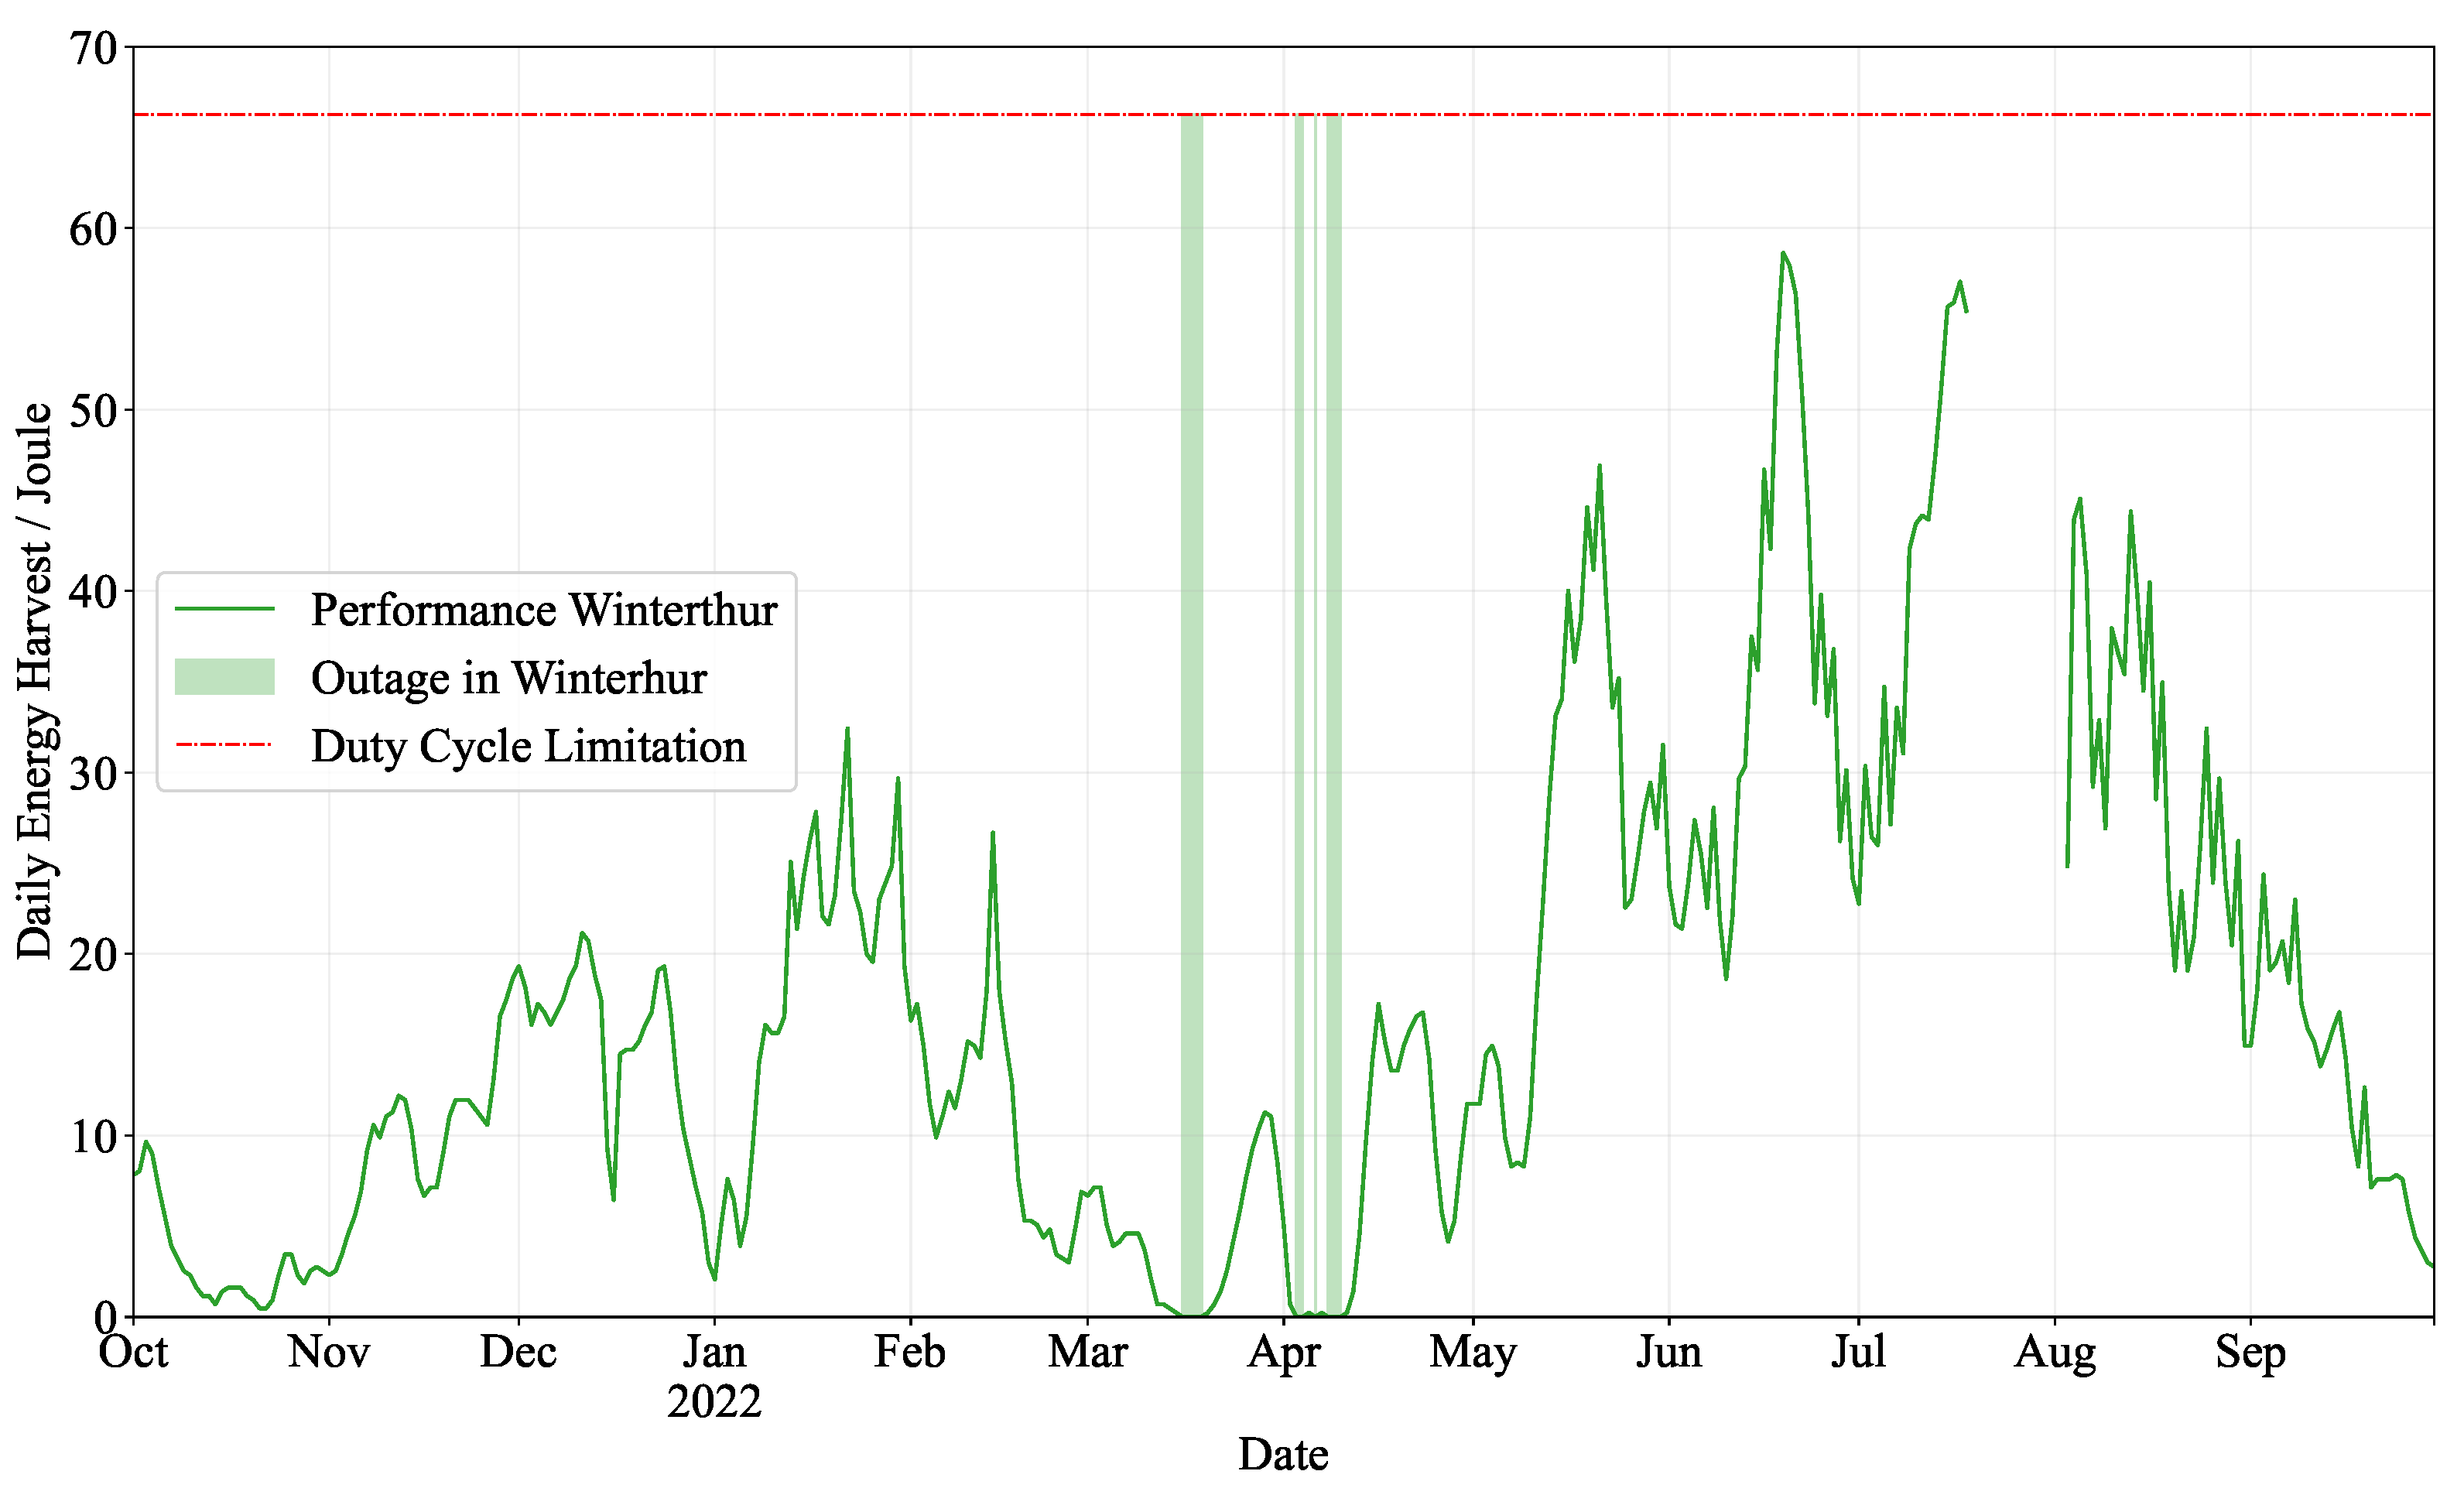
Figure 12 shows the daily energy harvest of the harvesting device in the period from 1 October 2021 to 30 September 2022.
Exemplary performance was observed throughout the year, with the device harvesting 21 J per day on average. There were three periods when the device had too little energy to collect and transmit data. There were outages totalling 14 days in November, 7 days in March and 11 days in April. In the summer, there are periods of excess energy during July and August. The device limits the number of uplinks to around 290 packets per day due to duty cycle constraints.
3.1.1. Impact of Temperature Difference on Performance
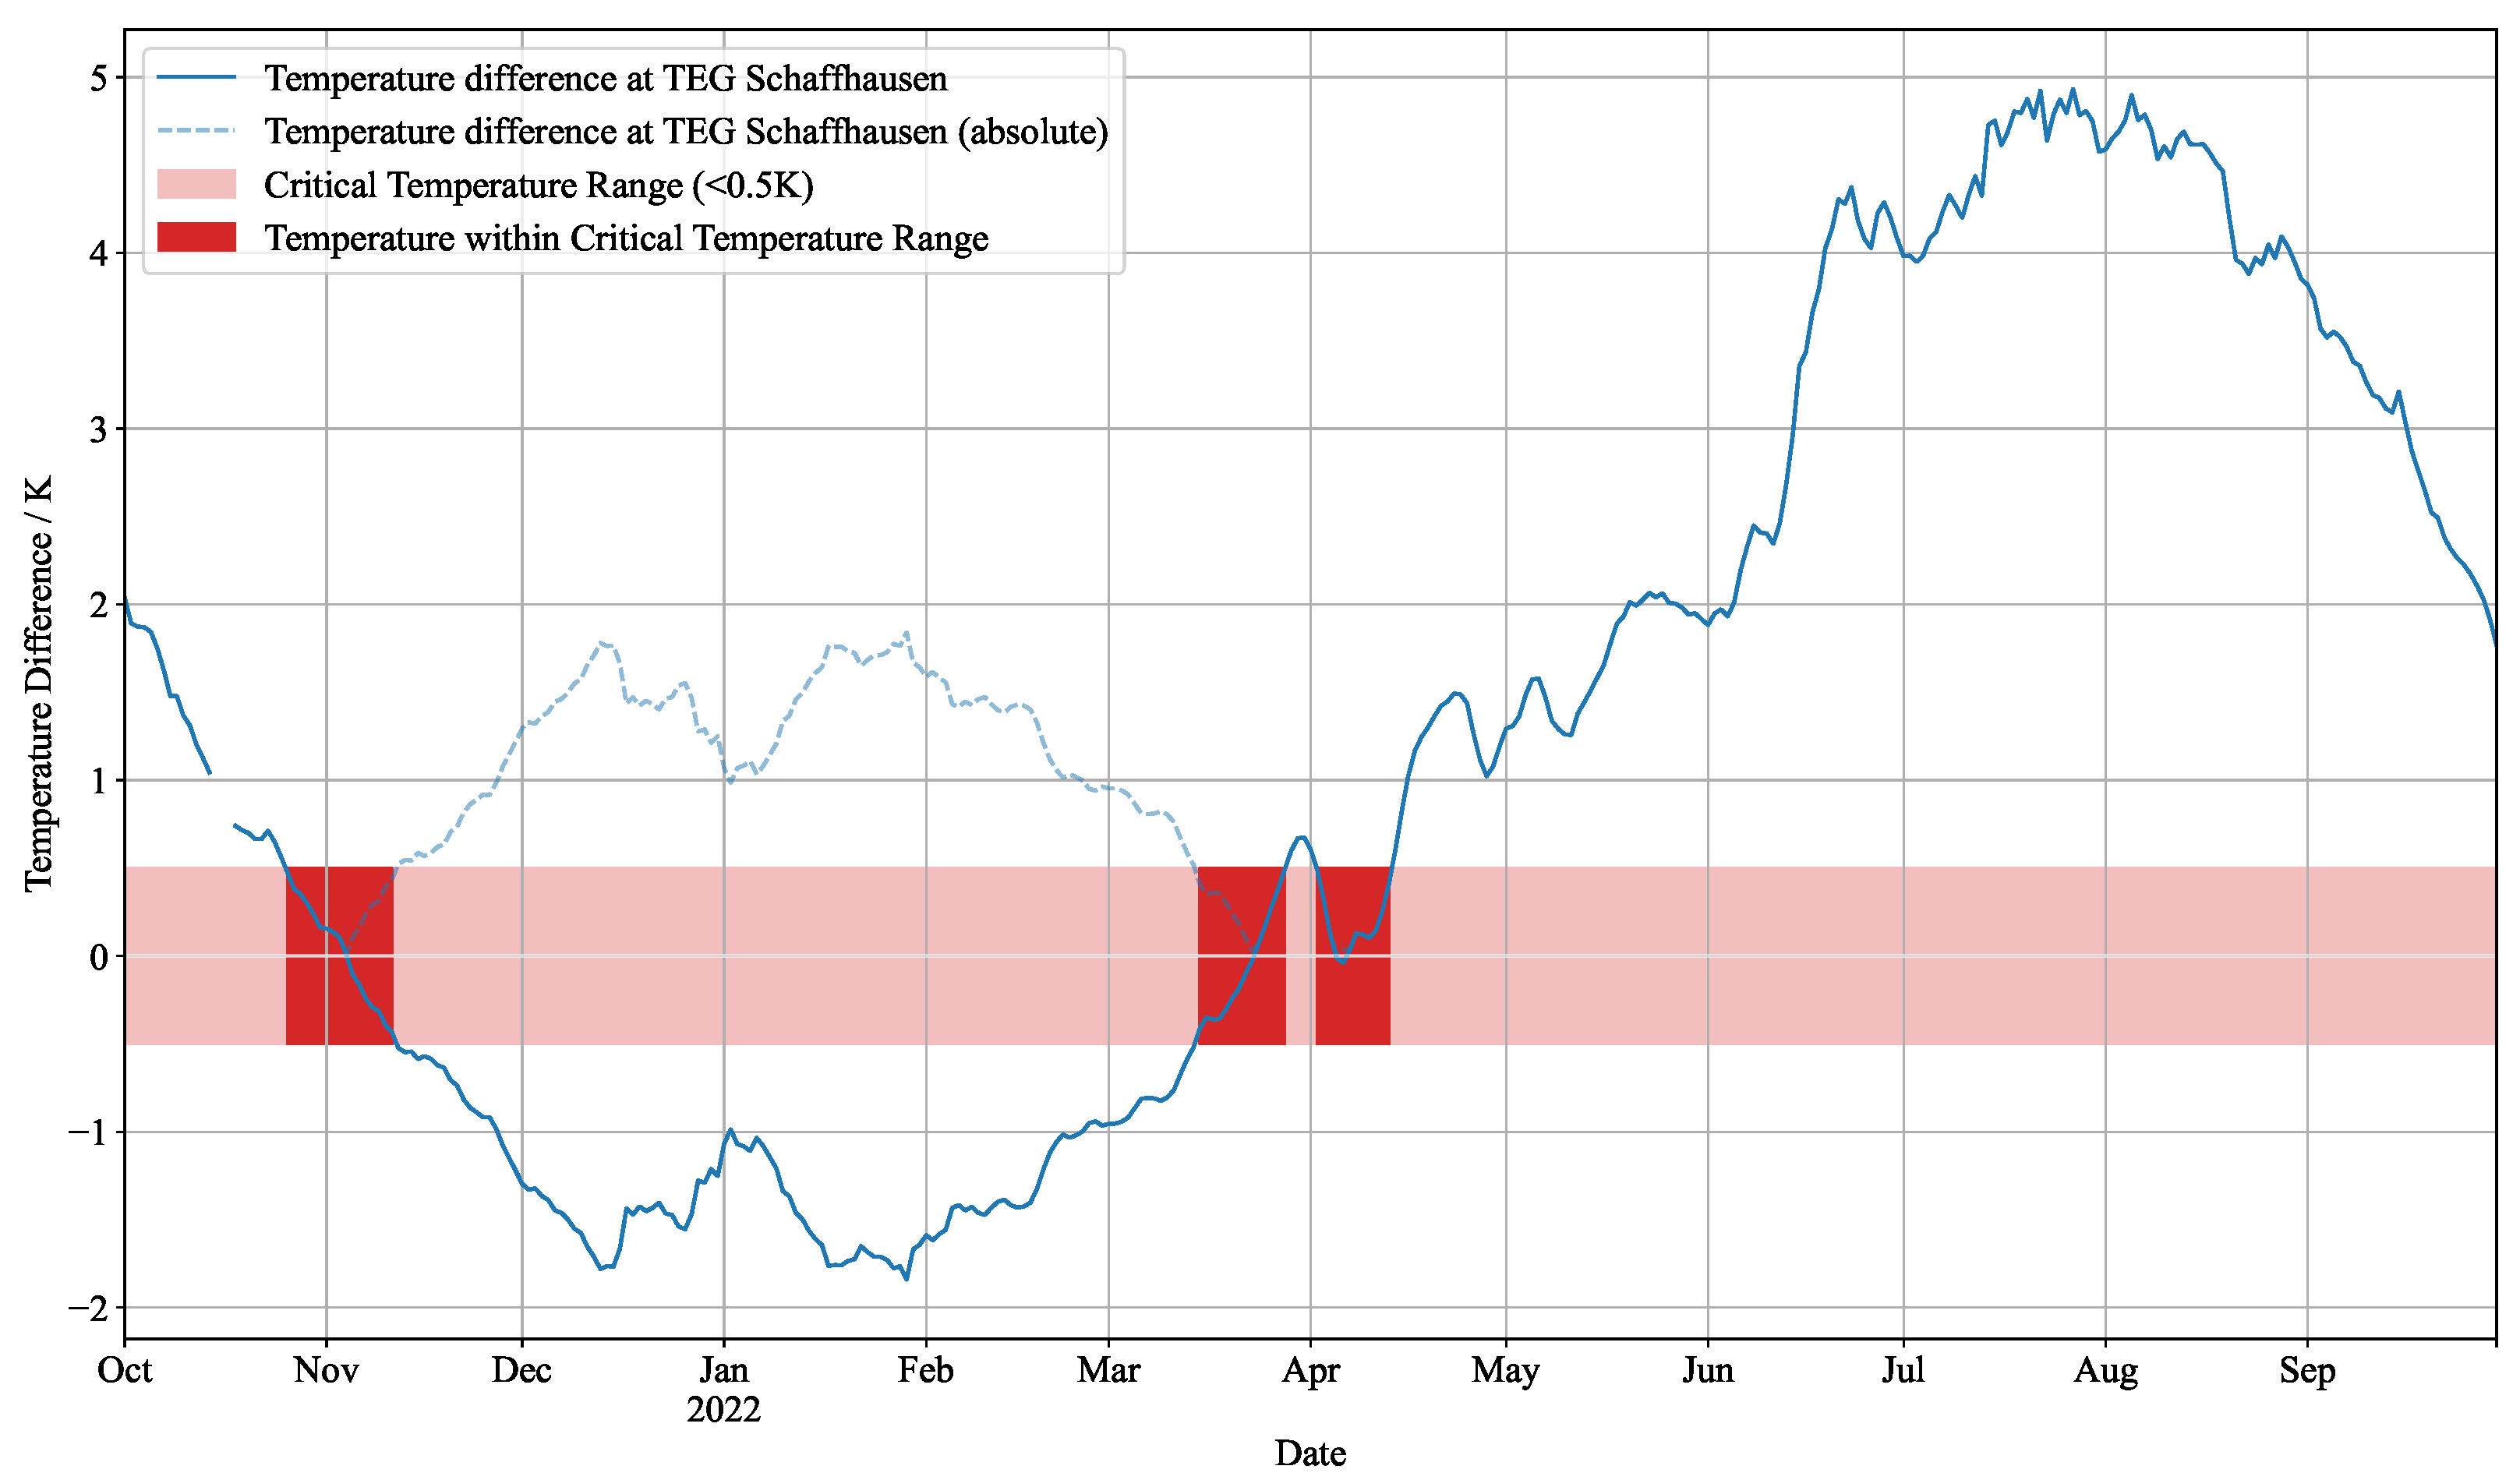
The theory presented in
Section 2.1.2 shows that harvesting becomes difficult when only a small temperature difference exists. This is particularly the case in spring and autumn when the soil temperature approaches that of the water.
Figure 13 shows the temperature difference at the TEG, which is thermally connected to the water pipe on one side and the soil on the other. The temperature difference exceeds 0 K in November, March and April. During these times, the harvest yield would also have to fail, and this is precisely what the data in
Figure 12 confirm. At these times, the device did not send a frame for a few days, meaning that too little energy was available to take measurements and transmit data.
Figure 14 shows the correlation between the measured temperature difference at the TEG and the daily energy harvest of the harvesting device in Schaffhausen.
The Pearson coefficient of 0.96 shows that the temperature difference correlates strongly with the harvested energy. This is not surprising, as this is exactly the principle on which energy harvesting with a TEG works, as described in
Section 2.1.2.
3.1.2. Impact of Environment Parameters on Temperature Difference
The temperature difference at the TEG determines the energy available, meaning it is crucial to determine which parameters influence this temperature difference. This section therefore describes the correlation between the temperature difference and several environmental variables.
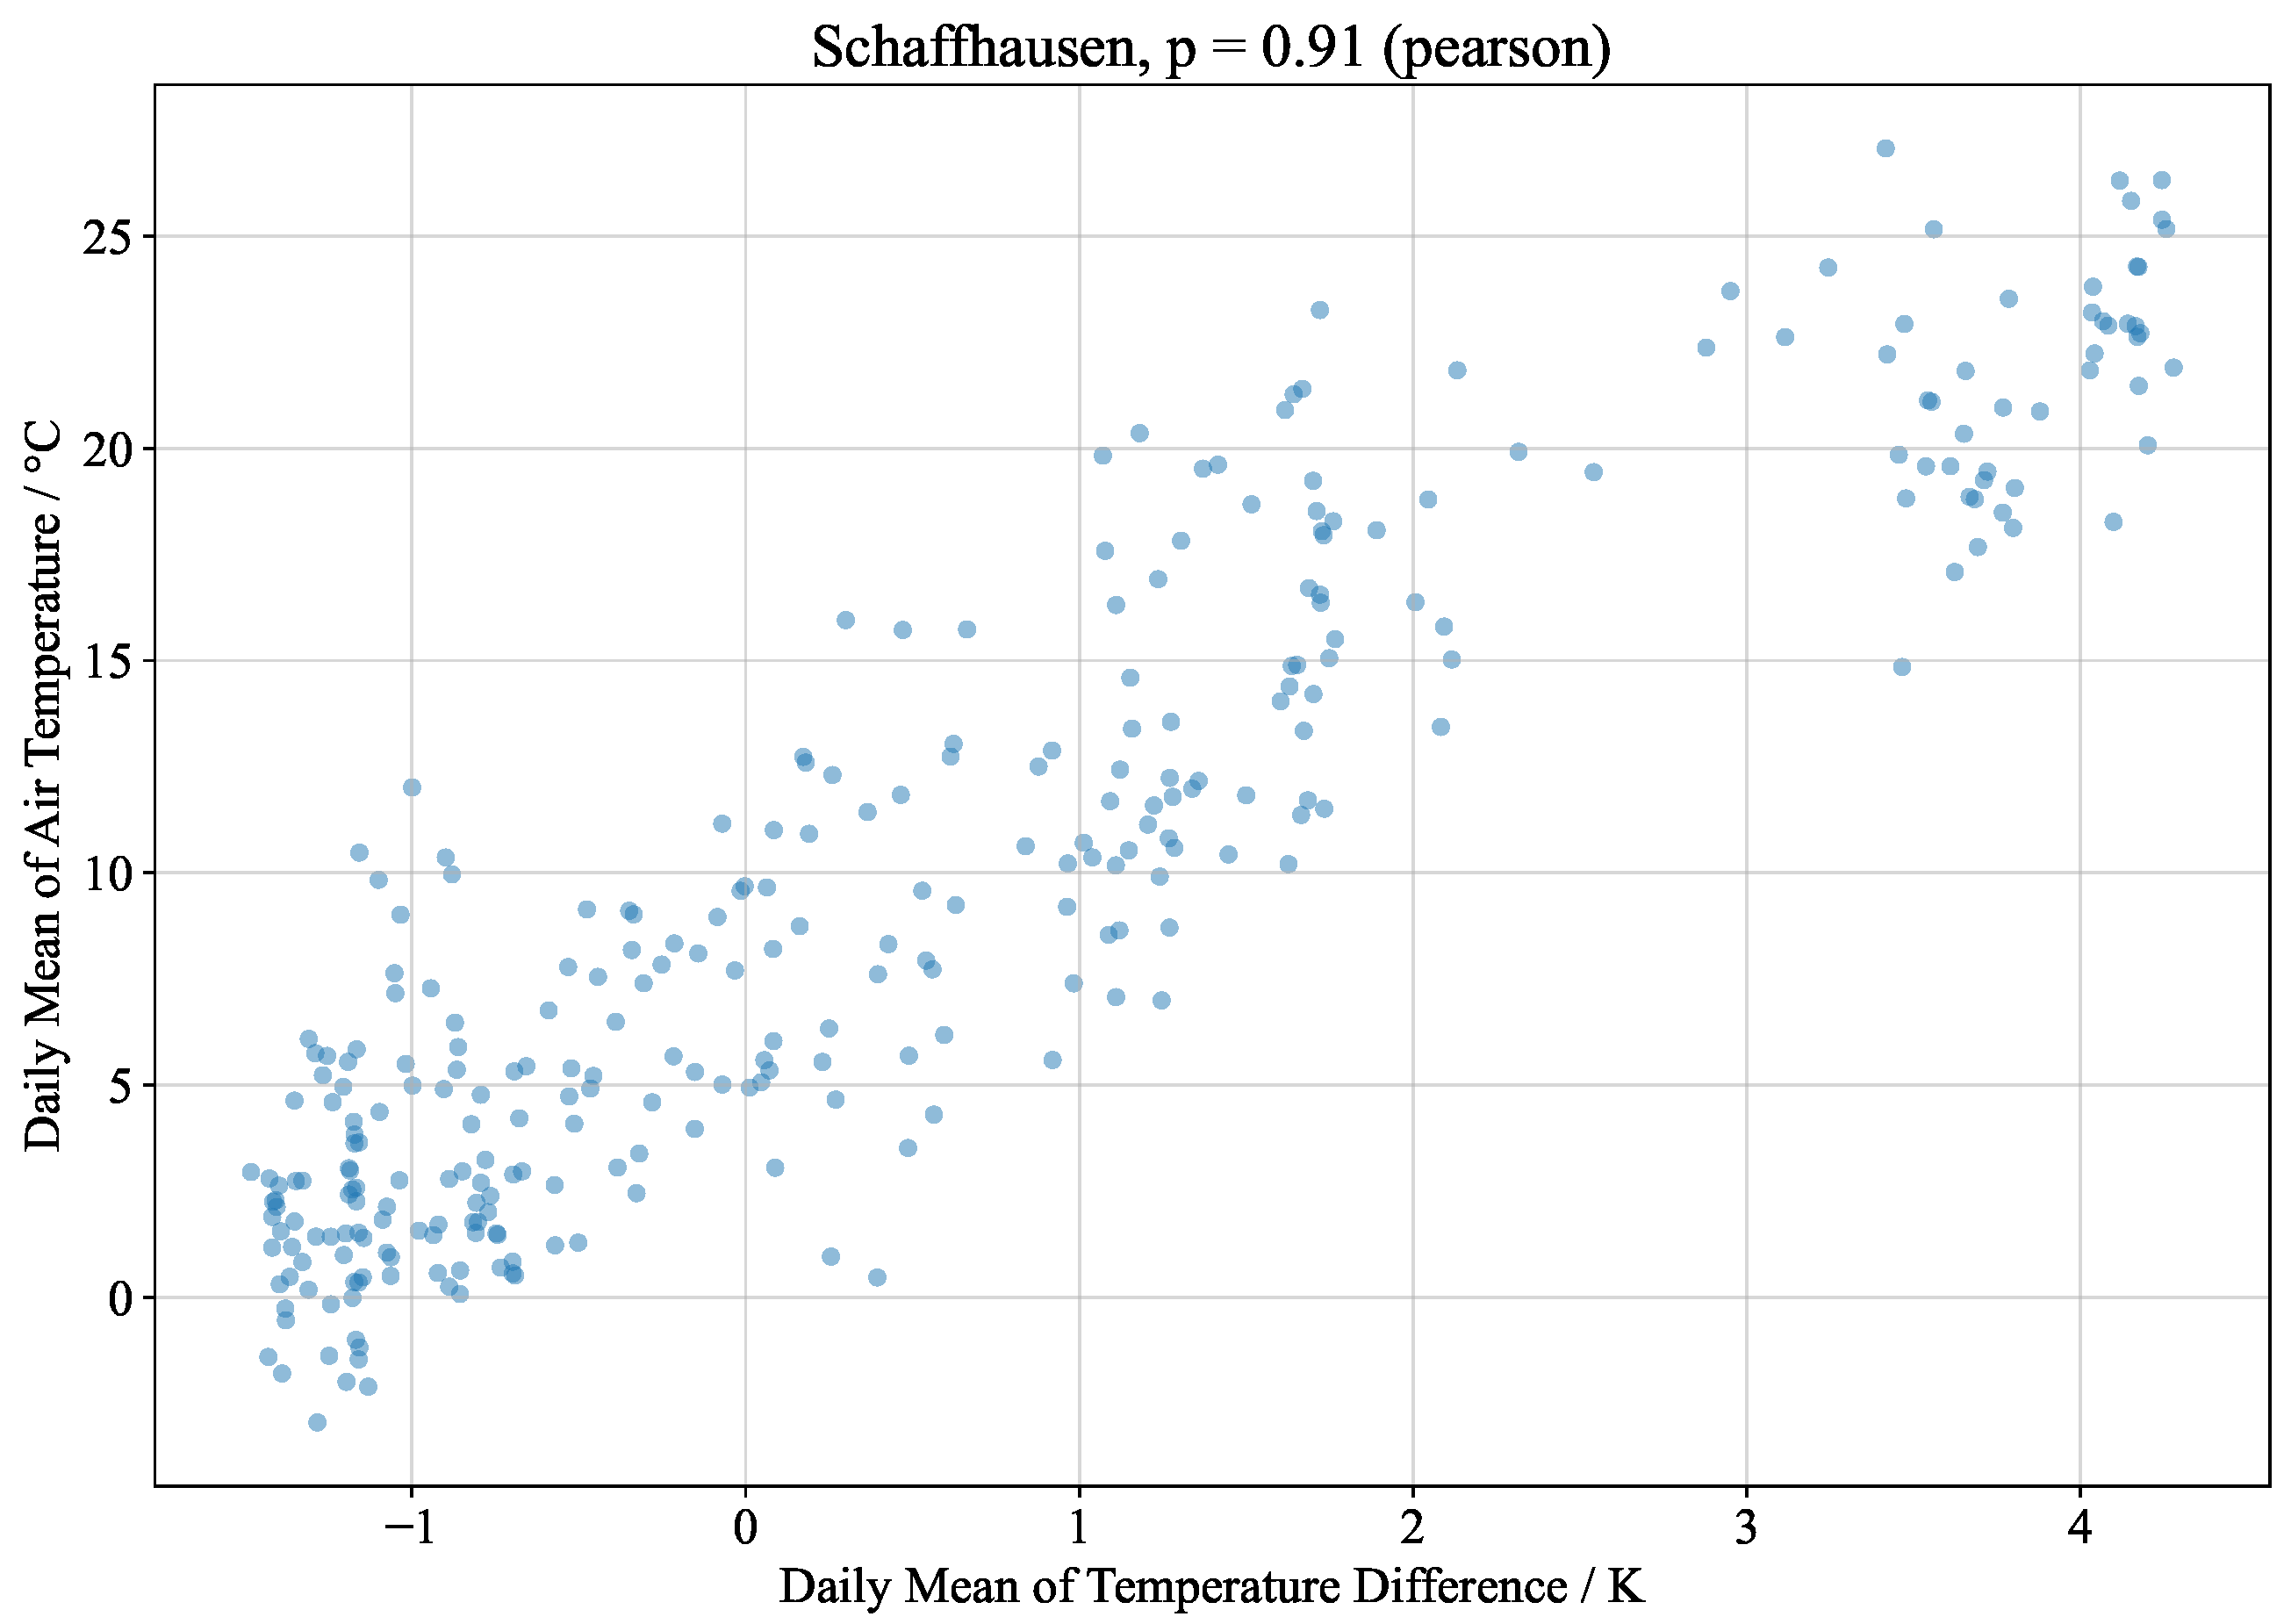
Figure 15 shows the relationship between the daily mean temperature difference measured at the TEG and the daily mean air temperature. There is a strong correlation with a Pearson coefficient of 0.91. Since the water temperature does not vary significantly throughout the year, it is mainly the soil temperature that determines the temperature difference at the TEG. In addition, the air temperature significantly influences the soil temperature and thus also the temperature difference at the TEG.
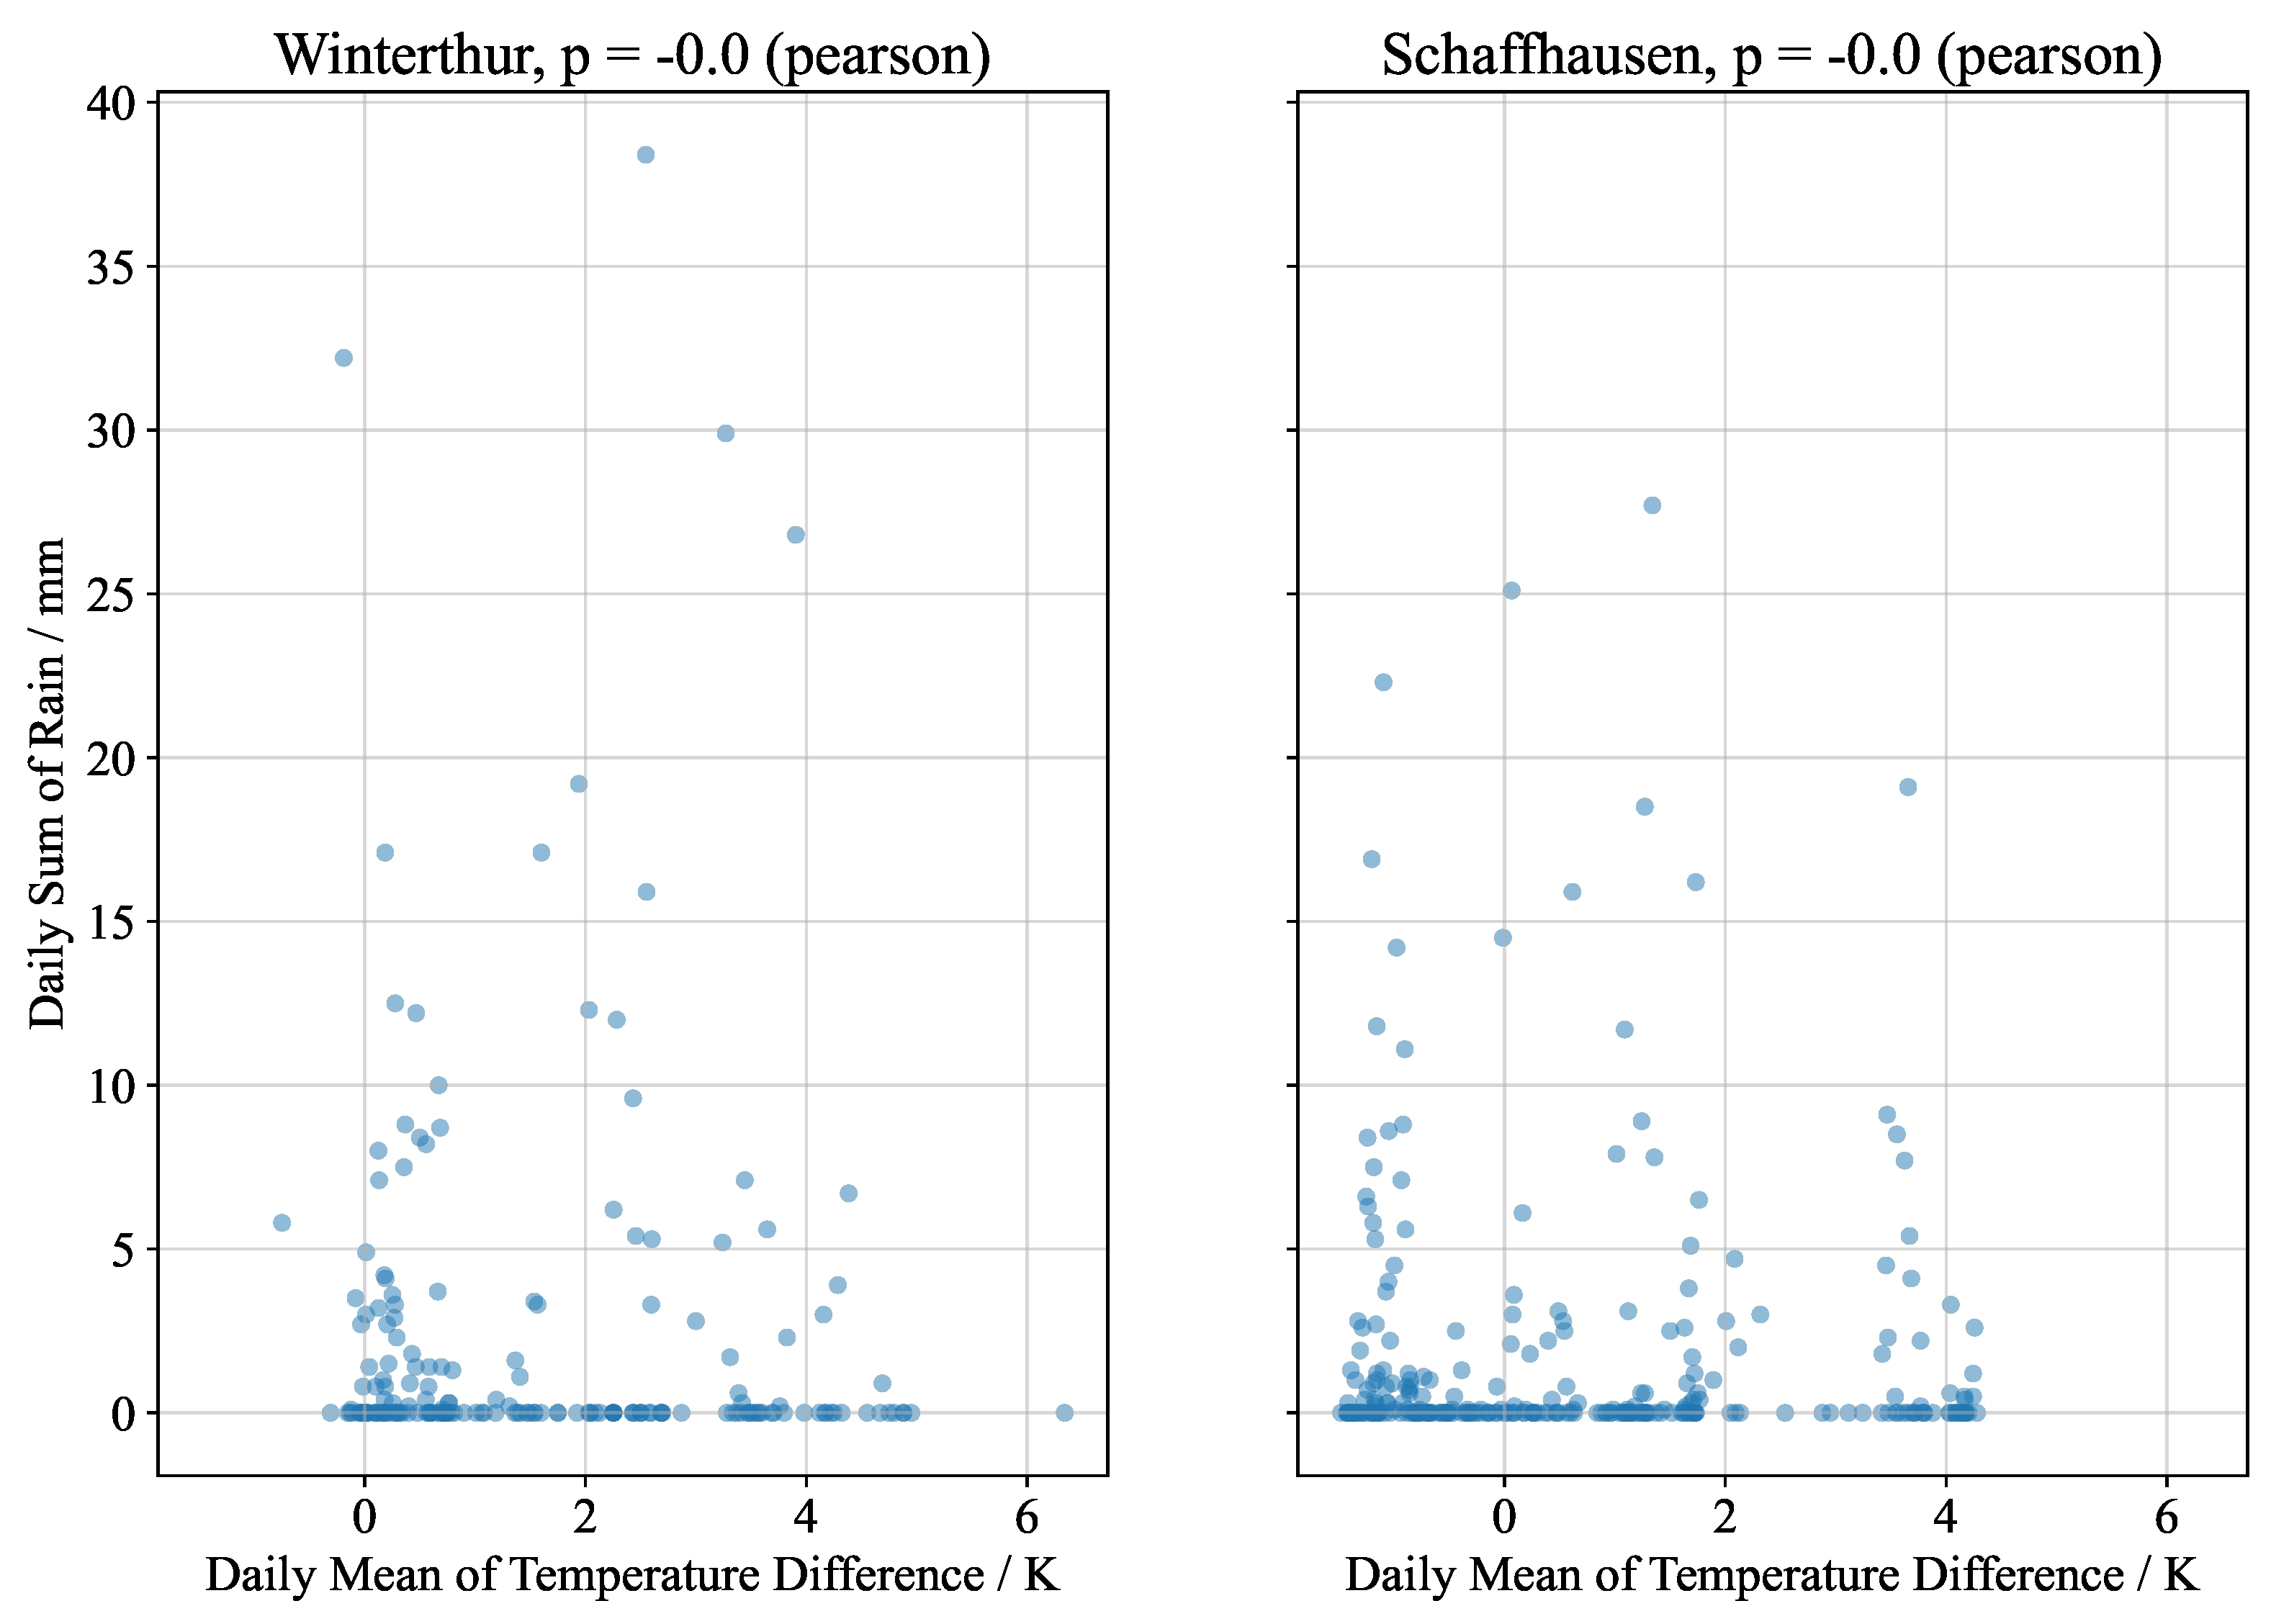
On the other hand, there is no correlation between rain and the temperature difference at the TEG, with a correlation coefficient p of 0.0 for the device in Schaffhausen (corresponding figure in
Appendix A.2). This could be because the installed devices are located under the road, meaning that rainwater does not directly affect the soil there.
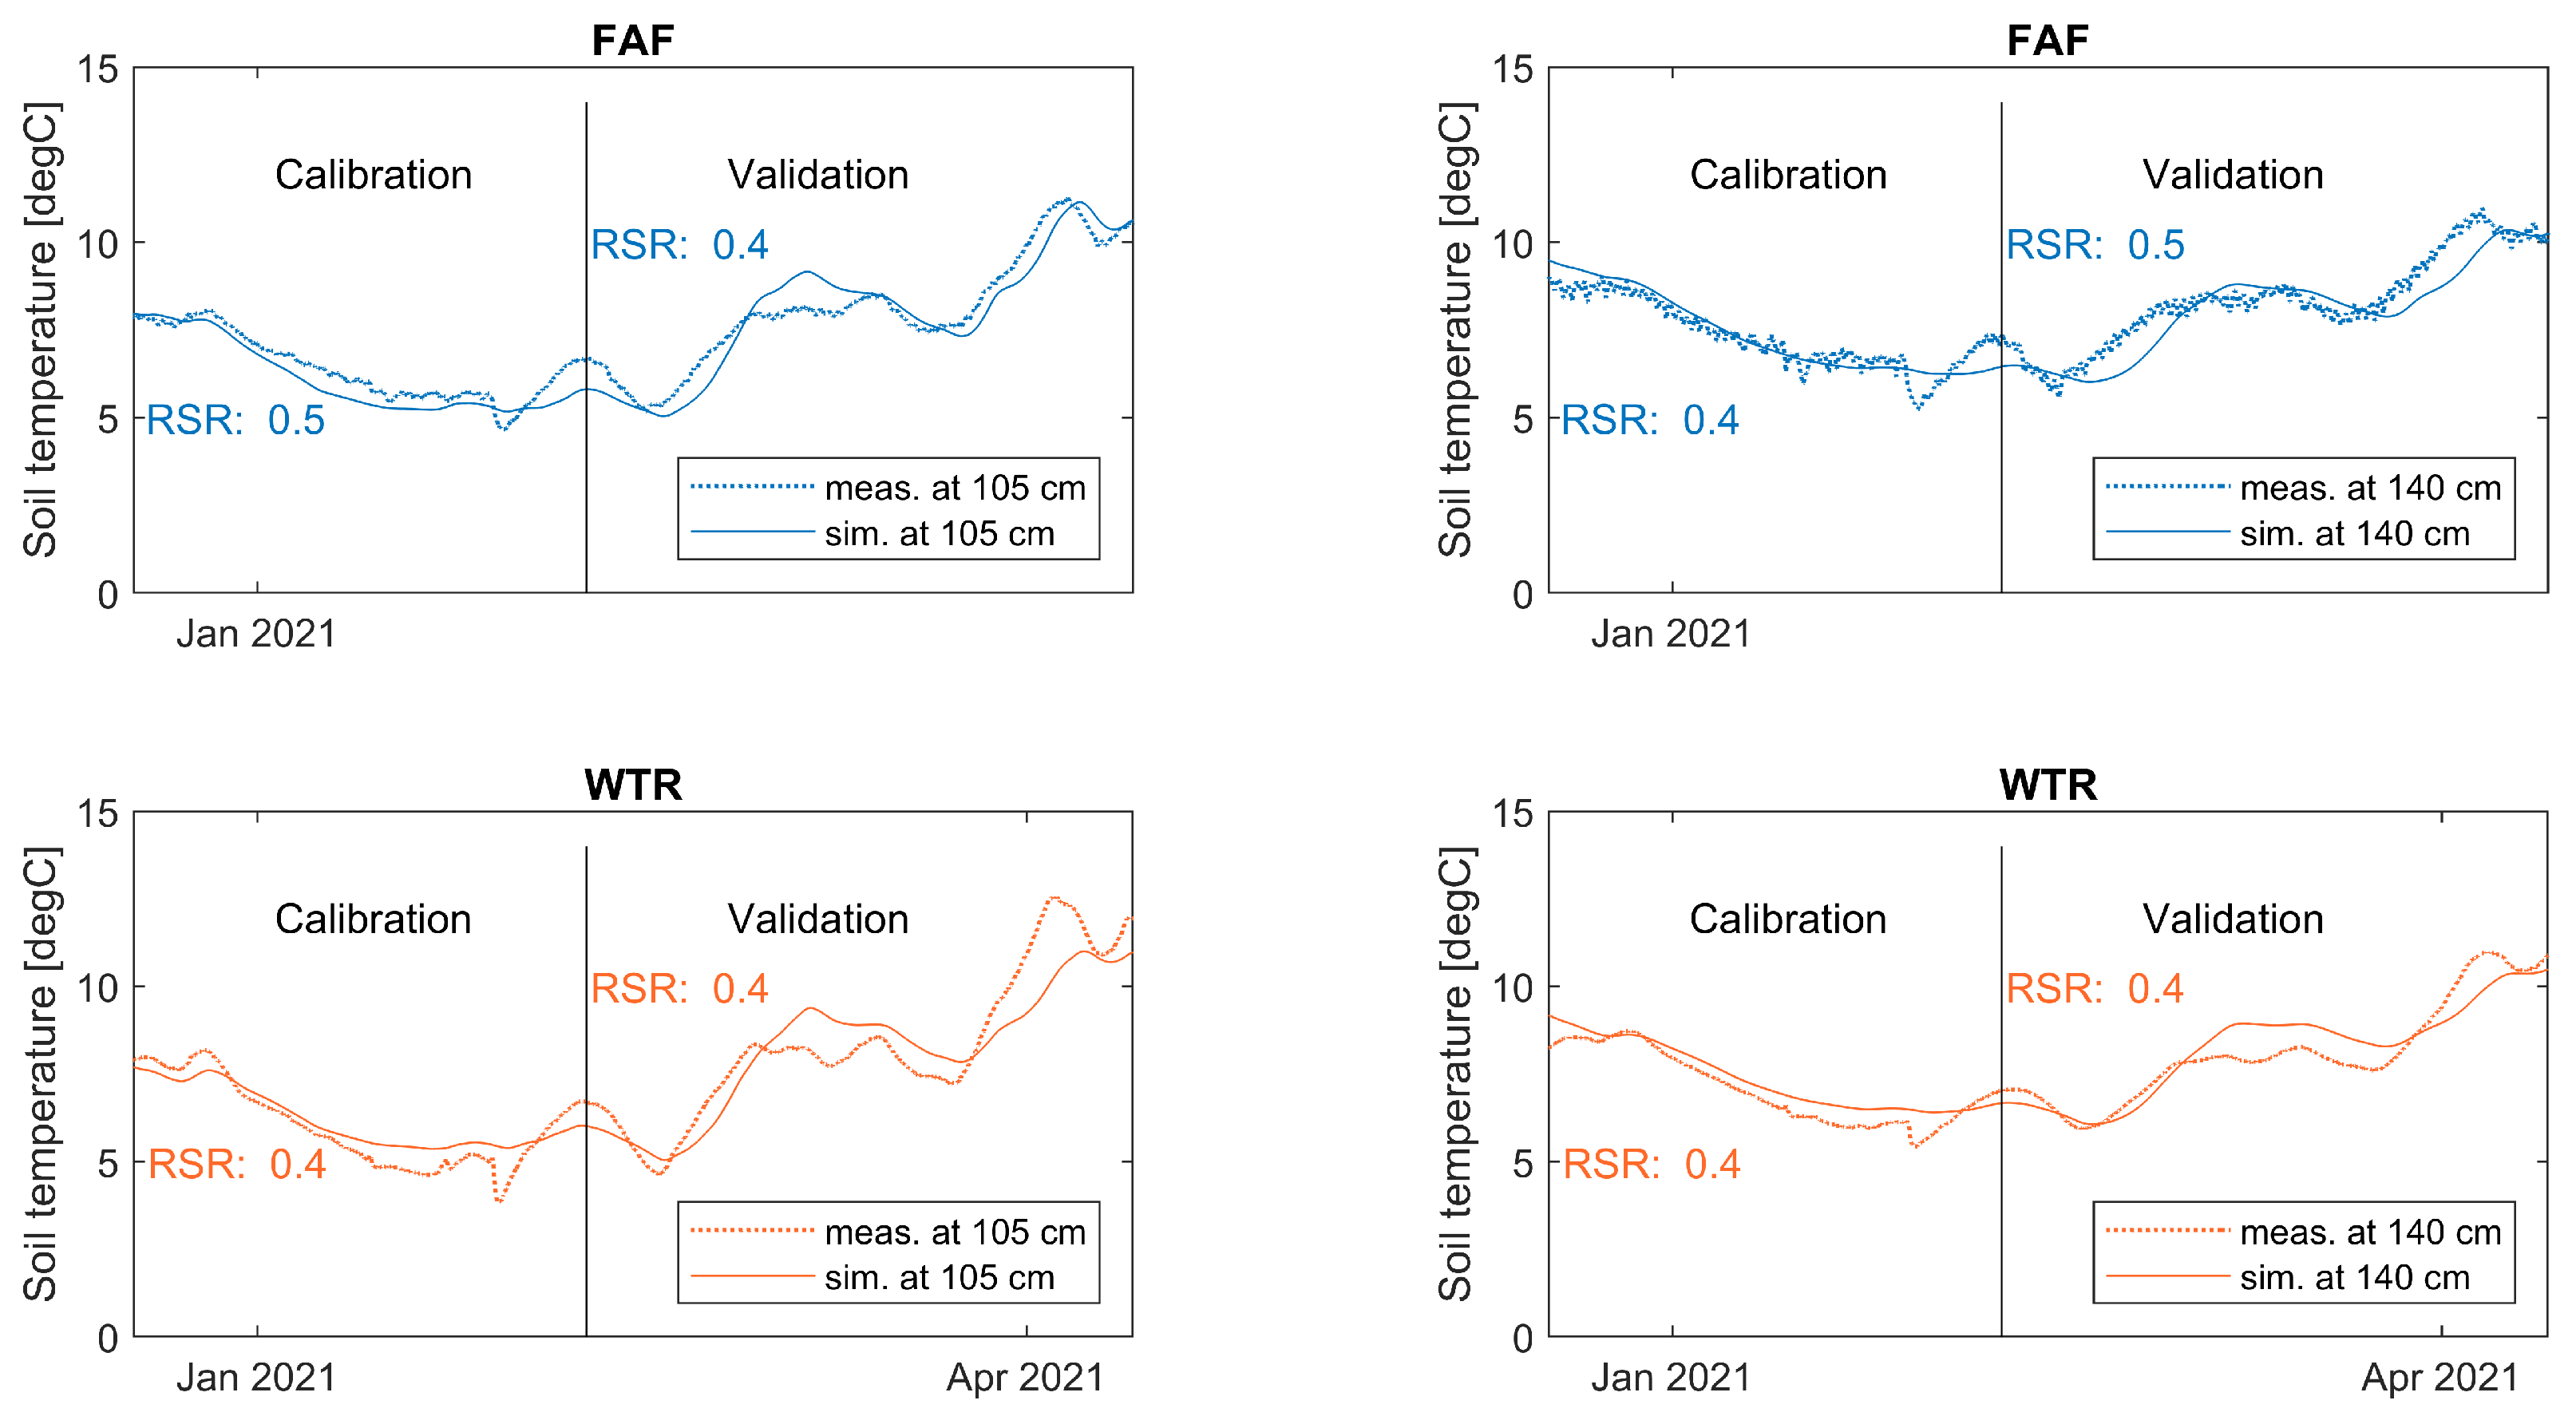
3.2. Validation of the Soil Temperature Model
In order to reliably assess the potential of soil-to-soil energy harvesting at the test sites and beyond, i.e., at any geographical location, the soil temperature model (see
Section 2.2) was validated with data from various field measurements. The validation results show that the model can adequately reproduce soil temperature dynamics (i) for eleven locations covering different climatic regions, soil types and altitudes in Switzerland (permeable land cover; validation results are discussed in
Appendix A.3) and (ii) for two specific sites under roads in the northern part of Switzerland.
Figure 16 exemplarily illustrates the model fit for two independent sites underneath roads in Winterthur (WTR) and Fehraltorf (FAF).
The two independent validation studies convincingly show that the physically based model can be applied to different climatic regions in Switzerland for different soil types and permeable and impermeable ground cover. We also conclude that the model can be used to assess the potential for energy harvesting beneath roads.
3.3. Results from the Practical Work
Since the devices comprise many individual mechanical and electronic components (heat aggregators and heat transfer blocks made of aluminium, PE sheathing, insulation, TEGs, electronics and antenna), many manual steps were required to prepare them for installation. Each device took one to two days to assemble and test. In addition, four people were required on site to install the devices on the water pipe and carry out final functional tests before the trenches were filled with earth.
Figure 17 shows the installation on the site in different stages.
The study did not aim to fully industrialise the harvesting device, meaning that there are still some points that need to be improved for a potential product:
Miniaturisation;
Automated production;
Simplified installation.
It is worth noting, however, that the prototypes installed in the ground have been running for more than 18 months and are still functioning flawlessly. This shows that the prototypes are robust despite the many manual production steps. Improving based on the above points would result in a more efficient and even more robust system that could be integrated into pipe sections and therefore does not take up much time during installation. Moreover, the encouraging data collected within this work show that it is possible to use such a device for years. Through optimisation and industrialisation, this time could even be extended to decades.
The total cost of the electronic components used in a harvesting device is approximately USD 300. A list with the prices of the main components is given in
Appendix A.1.
4. Summary and Conclusions
There is a clear need for a monitoring system for water pipes, given that a large proportion of fresh water gets lost through leaks. Besides leak detection, other metrics can also be of interest for water utilities to ensure good water quality. Traditional methods of detecting leaks and measuring other parameters still involve a lot of manual work and require having monitoring devices at specific locations (e.g., in maintenance holes). Using traditional concepts, spatially differentiated monitoring remains unrealistic, with very limited data available in real time.
This project envisages maintenance-free measurements at various underground infrastructure locations. This vision is to be made possible by the battery-free operation of sensor technology facilitated by thermoelectric energy harvesting and reliable low-power wireless communication from underground. This project introduces a new harvesting device for underground environments that allows for the seamless monitoring of processes in and at buried infrastructure situated at almost any location. A TEG harvests energy by utilising a temperature difference between the water pipes and the surrounding soil. Despite the low efficiency of the TEG at temperature differences of around 2 K, the device harvests enough energy to power highly constrained sensor devices and wirelessly transmit data. This is made possible by a sophisticated power management system. It disconnects all loads from the energy storage, resulting in extremely low shutdown energy consumption. During this time, it recharges the energy storage with the harvested energy. As soon as enough energy is available, it supplies the electronics for a few seconds to collect sensor measurements and transmit data via LoRaWAN.
A total of 16 of the developed devices are currently in operation at four locations in Switzerland. This publication shows the results of a one-year field test using the example of two selected devices of one specific harvesting setup. During this time, the two devices had sufficient energy to measure and transmit sensor data on average on more than 94% of the days. The average energy output per day is 21 joules.
The validated soil temperature model can predict soil temperature conditions, i.e., thermal gradients below the surface. The model can be applied to assess the energy harvesting potential in different climatic regions of Switzerland, for different soil types, and differentiated for permeable and impermeable ground covers. This means that the model can quantify the potential for energy harvesting beneath roads.
This study is expected to contribute to further lowering the technical barriers standing in the way of the development of fully self-sufficient sensor devices for the monitoring of underground infrastructure.
Future work includes devices equipped with a more efficient long-term storage element. These could collect excessive energy in summer and winter and redistribute it during periods when harvesting energy becomes difficult. Such a long-term storage element should have a much larger capacity than the supercapacitors used in the current prototypes. In addition, the leakage current of the new components must be lower in order to store energy for months at a time. Cycling and ageing are other characteristics that should support a lifetime of decades. A more intelligent power management system needs to be implemented. The energy available in the various storage elements should be tracked and this information used to evenly distribute power throughout the year. Another aspect to evaluate is the effect of road traffic and soil settlement on the installed components. So far, the analysis of the data from the last two years shows no evidence of negative impacts.
Author Contributions
Conceptualisation, M.B. and F.F.; methodology, M.B., F.F. and F.B.; software, M.B. and F.F.; validation, M.B. and F.F.; formal analysis, M.B. and F.F.; investigation, M.B. and F.F.; data curation, M.B. and F.F.; writing—original draft preparation, M.B., F.F. and F.B.; writing—review and editing, M.B., F.F., F.B., C.E., M.L.M. and A.R.; visualisation, M.B. and F.F.; supervision, M.L.M., F.B. and A.R.; project administration, A.R.; funding acquisition, M.L.M. and A.R. All authors have read and agreed to the published version of the manuscript.
Funding
This research was funded by Innosuisse—Swiss Innovation Agency grant number 41747.1 IP-ENG.
Data Availability Statement
The processed data presented in this study are available in the
Appendix A attached to this article. Please contact the authors directly to request access to the raw measurement data.
Acknowledgments
We would like to thank Georg Fischer Piping Systems Ltd., Stadtwerk Winterthur and SH Power for their generous support during the project. Furthermore, we want to thank Eleonora Sprenger for her work on the CoupModel and the modelling studies, as well as Christian Ebi and Simon Bloem for their work with the device prototypes and their help in the installation process.
Conflicts of Interest
The authors declare that they have no conflict of interest.
Abbreviations
The following abbreviations are used in this manuscript:
| GSM | global system for mobile communication(s) |
| LoRa | long range |
| LTS | long-term storage |
| MEMS | micro electro mechanical systems |
| MHD | magnetohydrodynamic |
| PCB | printed circuit board |
| PE | polyethylene |
| RSR | RMSE-observations standard deviation ratio |
| RMSE | root mean square error |
| RSSI | received signal strength indication |
| SNR | signal-to-noise ratio |
| STS | short-term storage |
| TEG | thermoelectric generator |
| VKR | Verband Kunststoff-Rohre und -Rohrleitungsteile |
| | (Swiss Plastic Pipes and Fitting Association) |
| WAN | wide area network |
Appendix A
Appendix A.1. Electronics
Table A1 provides an overview of the electronic components presented according to the component types introduced in
Section 2.1.2. The energy storage is divided into short-term storage (STS) and long-term storage (LTS). The listed costs are approximate prices in USD at the time of publication for a very small quantity (one item).
Table A1.
Overview of electronic components.
Table A1.
Overview of electronic components.
| Component Type | Product Number | Manufacturer | Value | Costs |
|---|
| TEG | TG12-8-01LS | Marlow | 40.1 × 40.1 × 3.5 mm | $42 |
| Booster | EM8900 | EM Microelectronics | | $2 |
| Power Management | EM8502 | EM Microelectronics | | $2 |
| Energy Storage (STS) | GS203 N1H1C2 | Cap-XX | 270 mF, 5 V | $15 |
| Energy Storage (LTS) | DGH255Q5R5 | Cornell Dubilier | 2.5 F, 5.5 V | $4 |
| DCDC Converter | MCP16415 | Microchip | 2.0 V | $1 |
| Microcontroller | nRF52840 | Nordic | | $18 |
| Sensor | BME280 | Bosch | | $7 |
| Radio | SX1261 | Semtech | 868 MHz | $33 |
Appendix A.2. Additional Results and Figures about Field Test Performance
The following figures show the data from the field test of the device in Winterthur.
Figure A1.
Daily energy harvest of the buried device during the field test in Winterthur: The daily energy harvest equals the number of daily uplinks multiplied by the energy required for a single uplink. On average, the device harvested 18 J per day. The red line shows the limitation due to duty cycle restrictions bound to LoRaWAN with SF12. Coloured areas show outage days, i.e., days without uplinks from the harvesting device. In total, outages resulted in 11 days without wireless uplink. Technical issues with the LoRaWAN gateways accounted for the missing data points.
Figure A2.
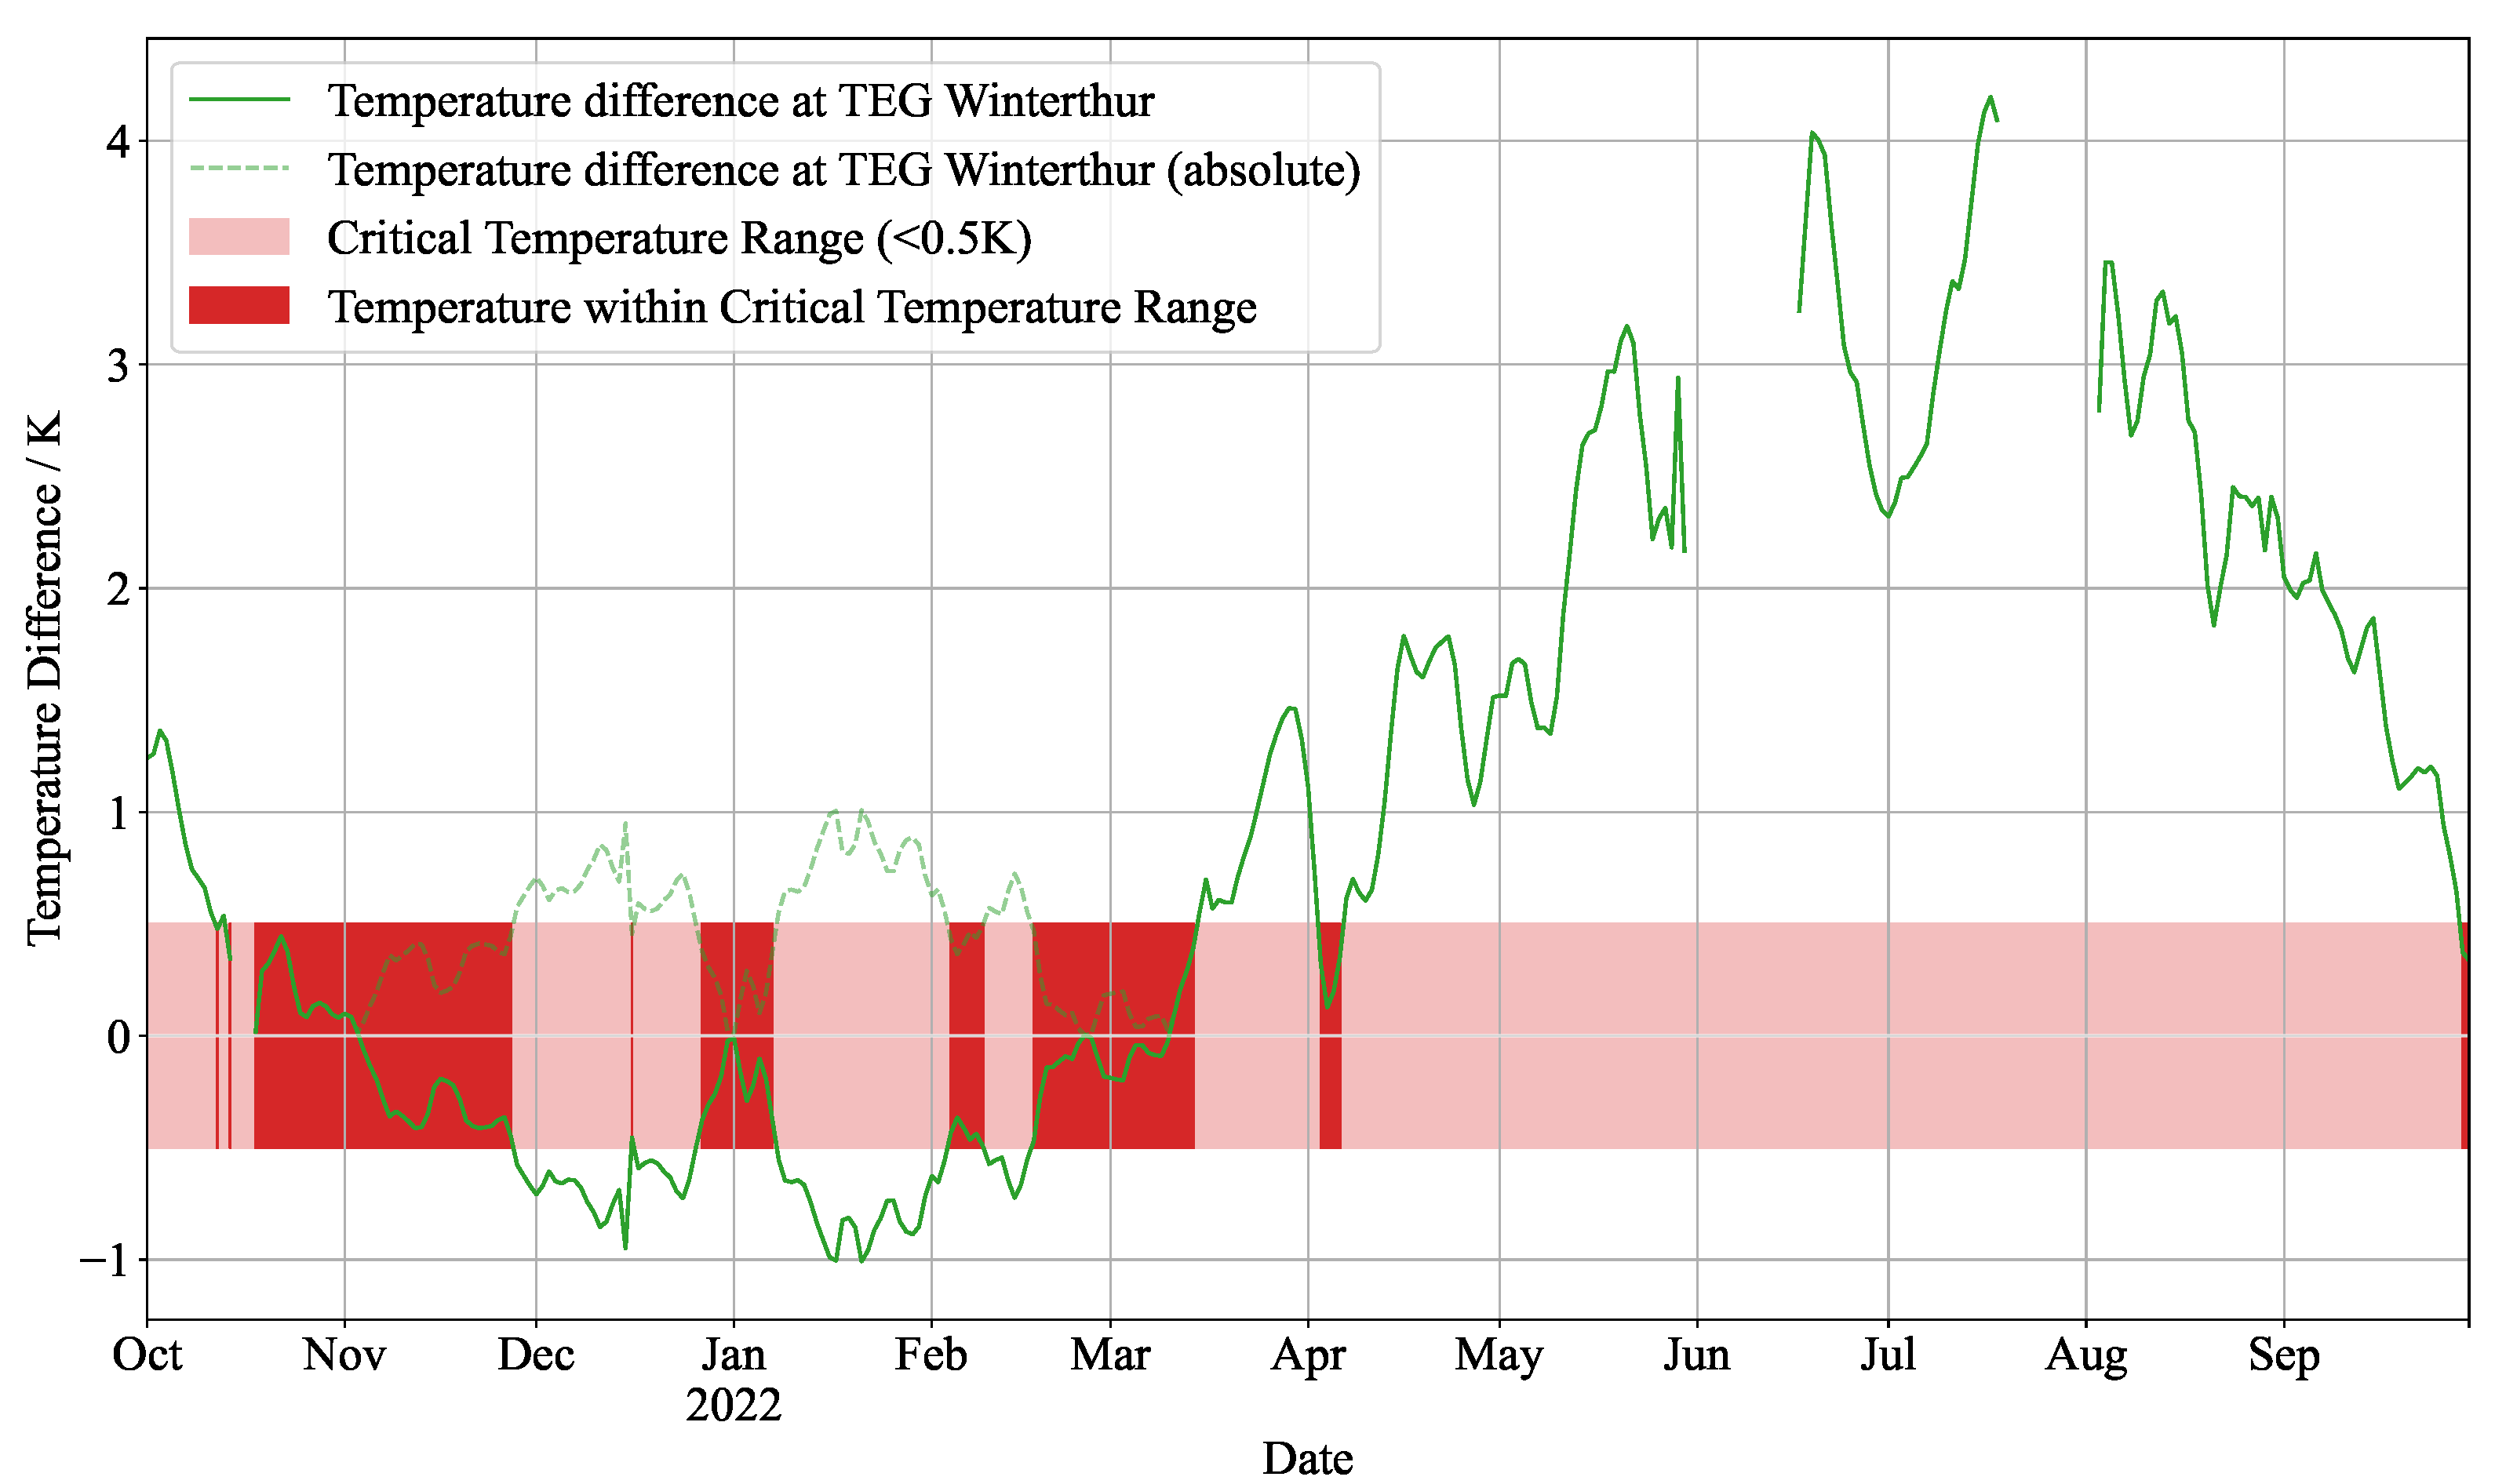
Temperature difference on TEG of buried devices during the field test in Winterthur: Temperature differences of less than 0.5 K are critical, as the power output from the TEG becomes too small to generate enough energy. Many of these times are already bridged at the device in Winterthur by existing energy storage. However, there are still a few outage days that an additional long-term energy storage device could bridge.
Figure A2.
Temperature difference on TEG of buried devices during the field test in Winterthur: Temperature differences of less than 0.5 K are critical, as the power output from the TEG becomes too small to generate enough energy. Many of these times are already bridged at the device in Winterthur by existing energy storage. However, there are still a few outage days that an additional long-term energy storage device could bridge.
Figure A3.
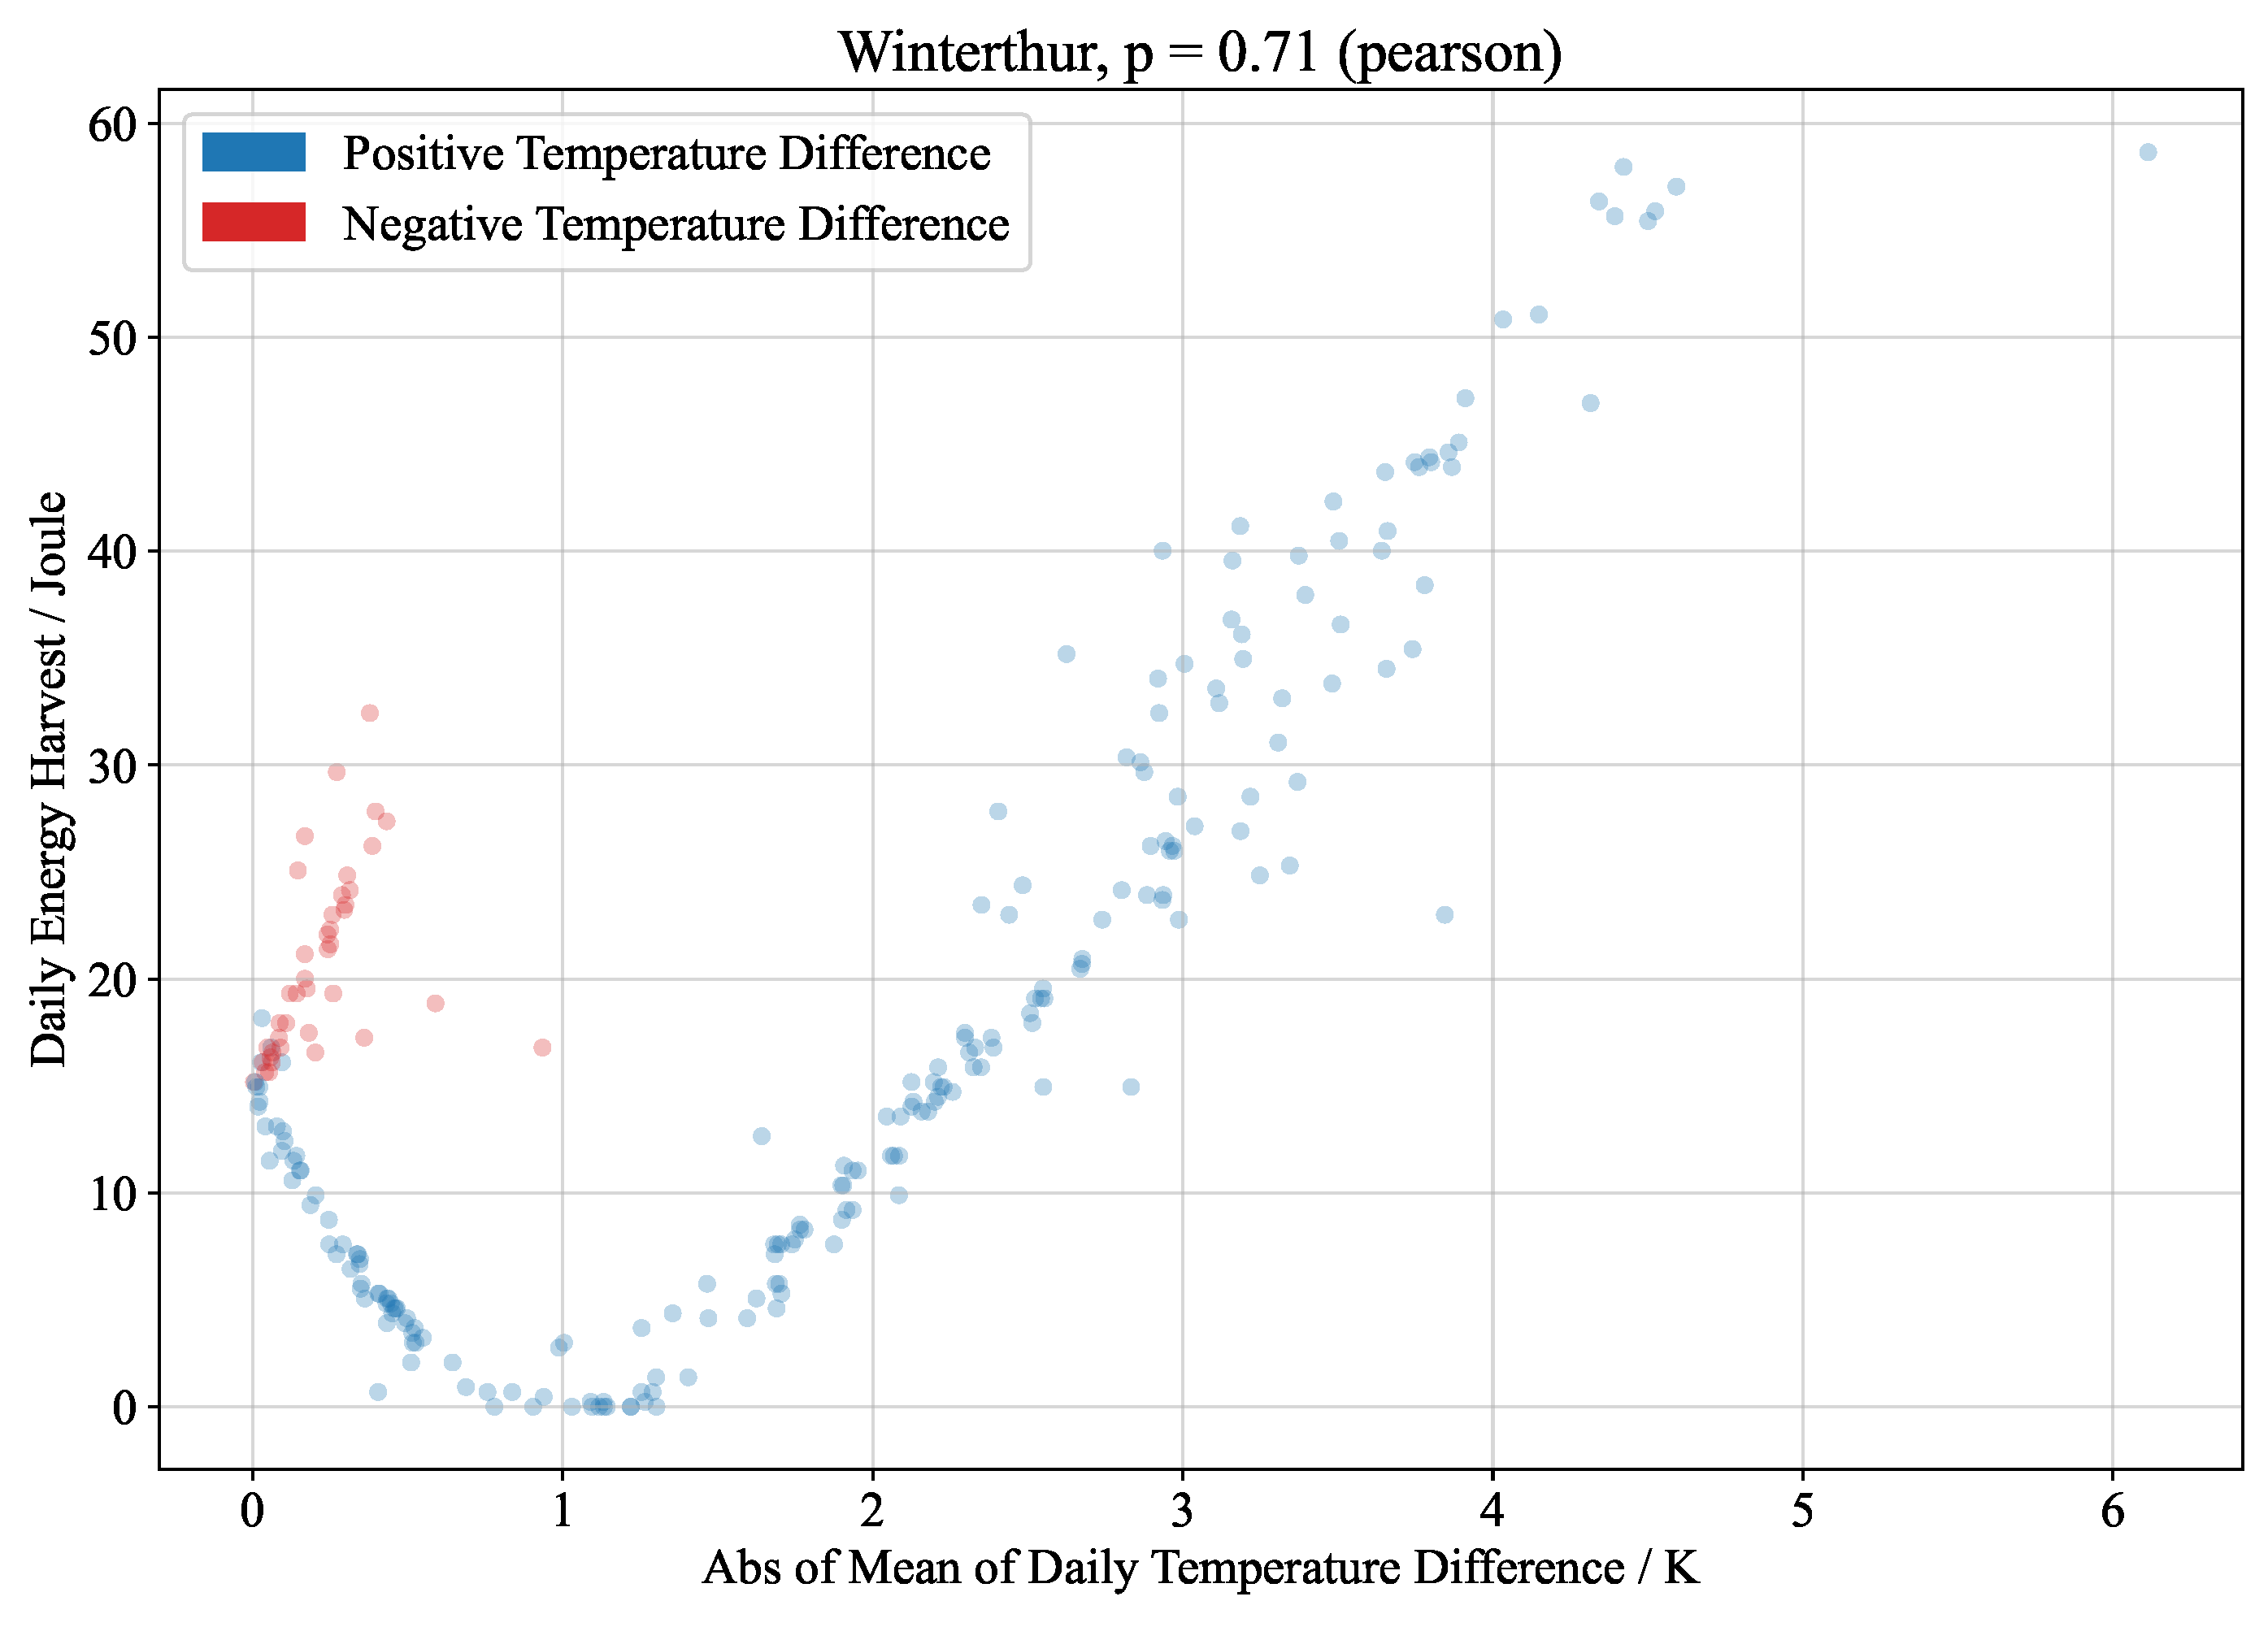
Daily energy harvest of the buried device vs. absolute mean of daily temperature difference at the TEG: results during the field test in Winterthur. There are two gradients because one results from positive (blue) temperature differences and the other from negative (red) temperature differences. It appears that the measurements have an offset error of about 0.9 K. However, other parameters (such as the powering of the consumer from energy storage devices) may also be responsible for this.
Figure A3.
Daily energy harvest of the buried device vs. absolute mean of daily temperature difference at the TEG: results during the field test in Winterthur. There are two gradients because one results from positive (blue) temperature differences and the other from negative (red) temperature differences. It appears that the measurements have an offset error of about 0.9 K. However, other parameters (such as the powering of the consumer from energy storage devices) may also be responsible for this.
Figure A4.
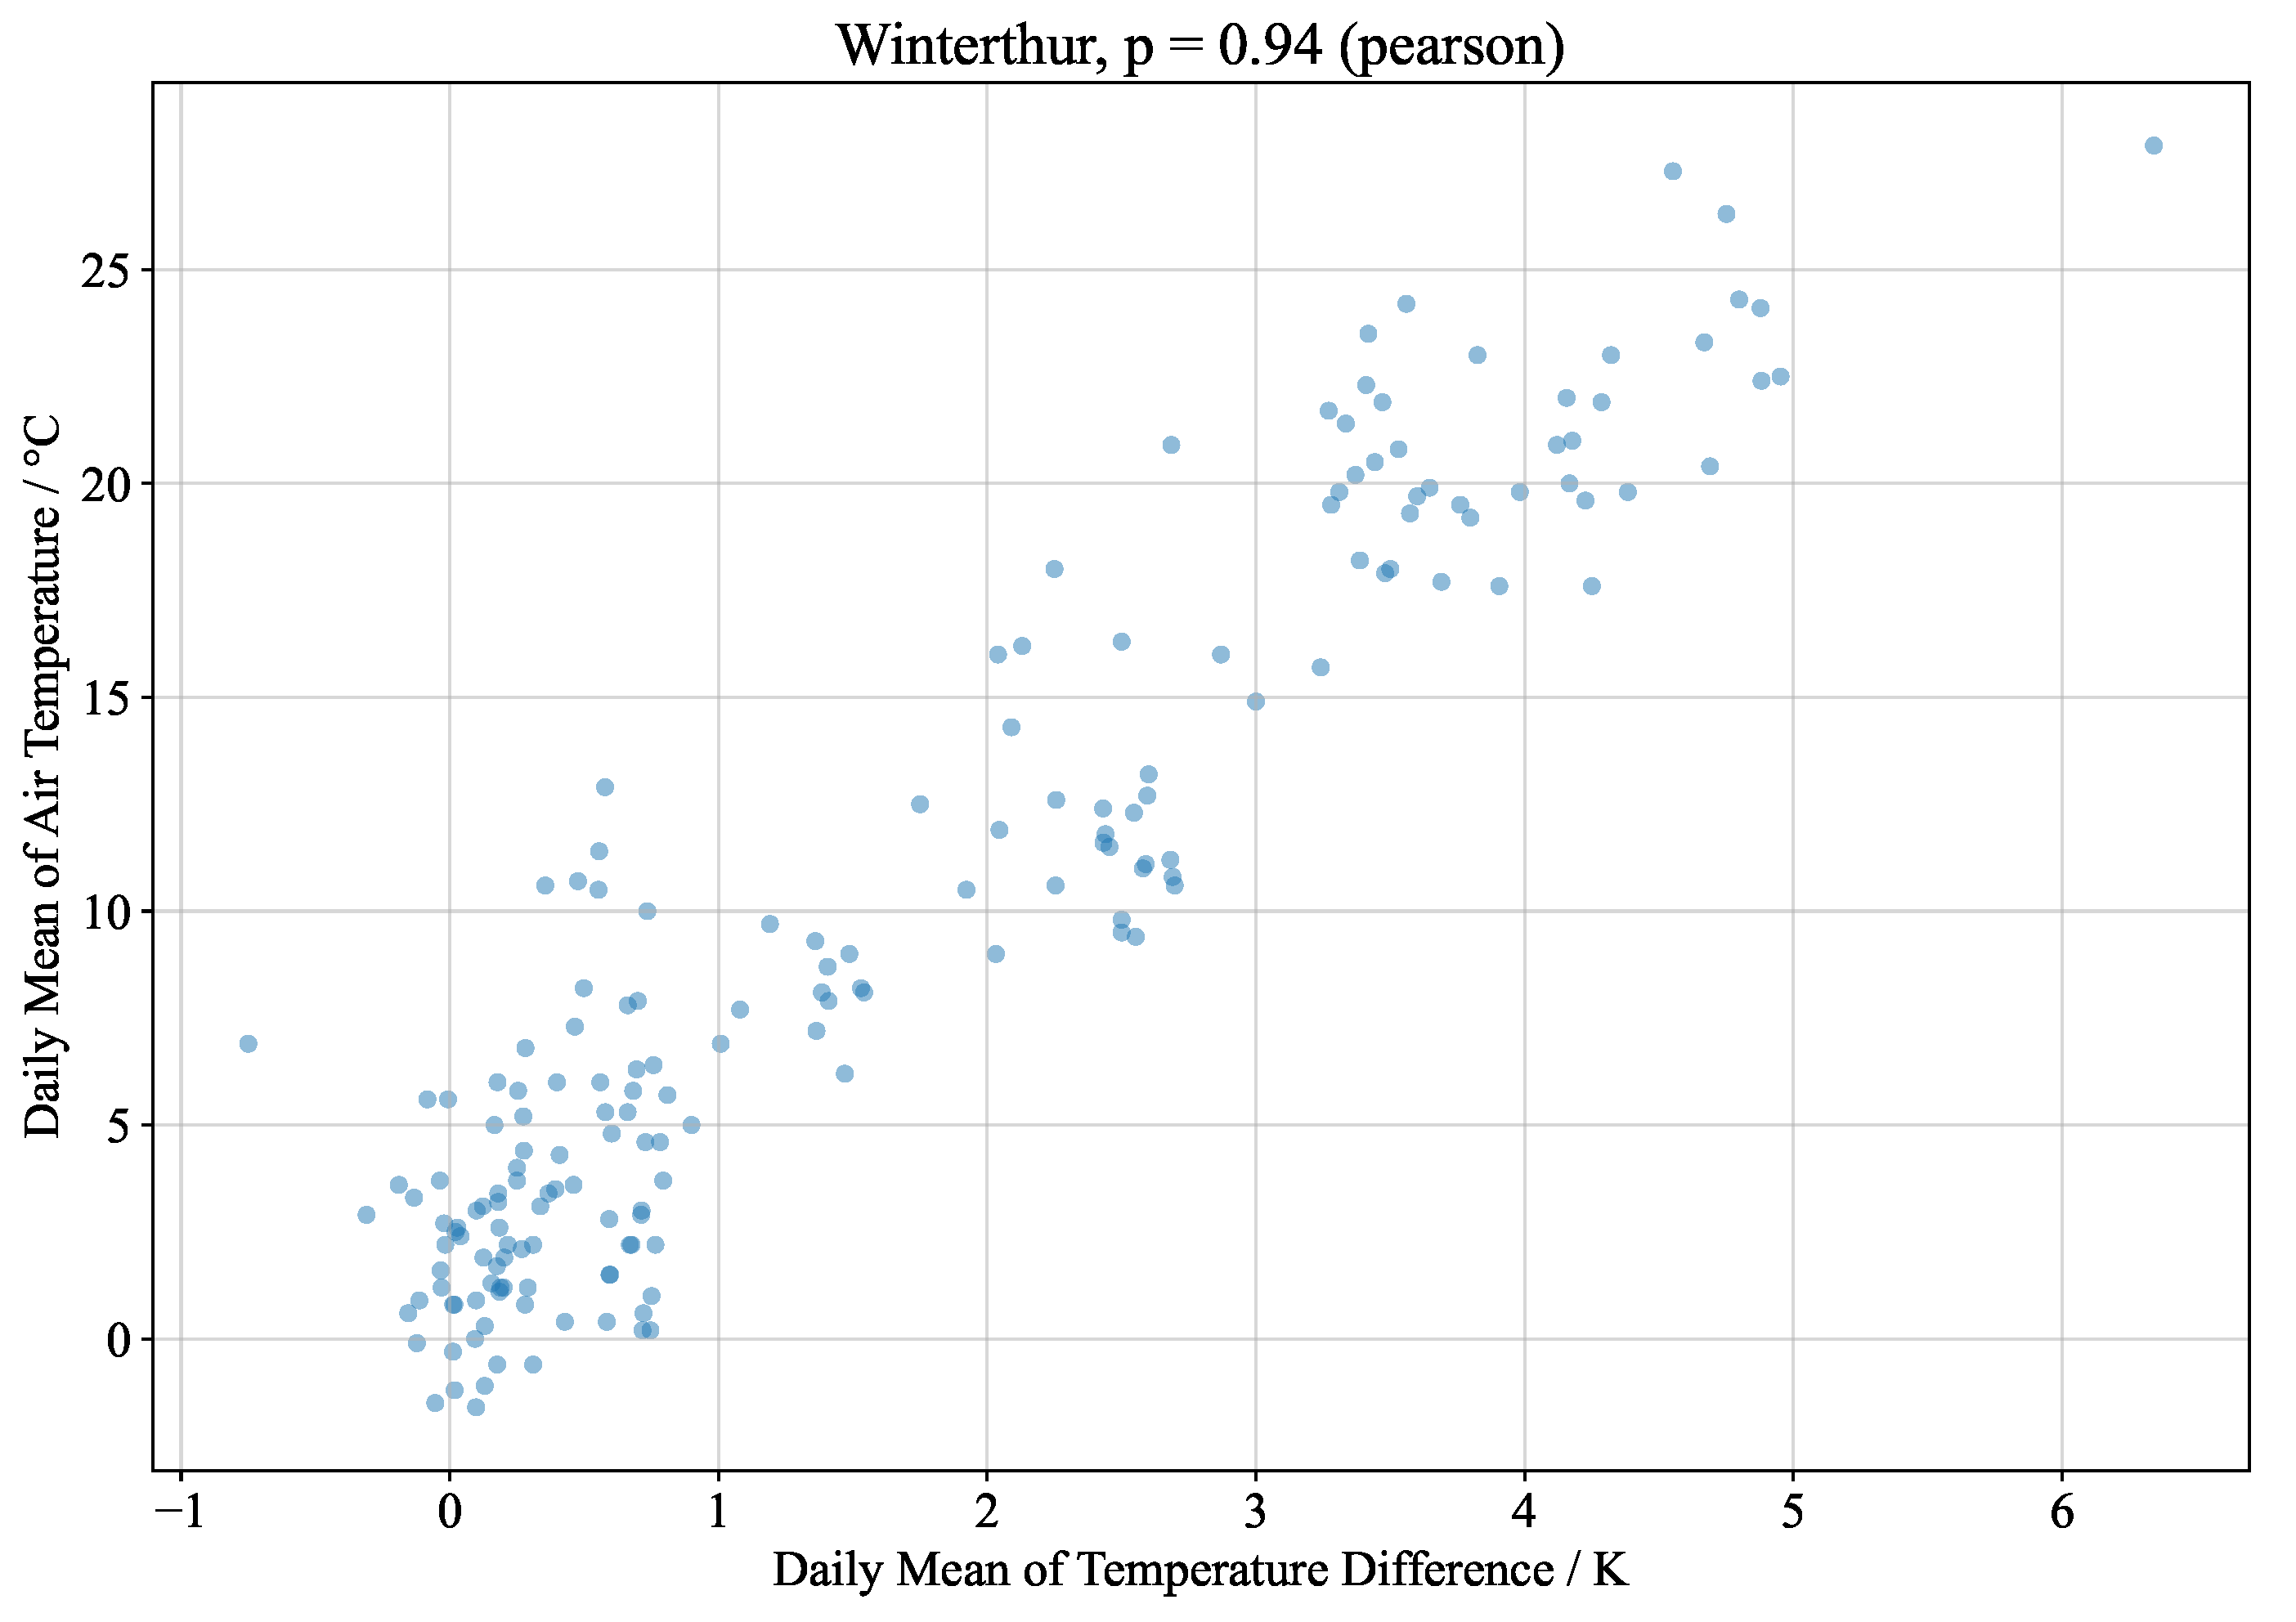
Correlation between the daily mean of temperature difference at the TEG and the daily mean of air temperature: results during the field test in Winterthur.
Figure A4.
Correlation between the daily mean of temperature difference at the TEG and the daily mean of air temperature: results during the field test in Winterthur.
The following figure shows no correlation between the daily sum of rain and the temperature difference at the TEG.
Figure A5.
Correlation between the mean of daily temperature difference at the TEG and the daily sum of rain.
Figure A5.
Correlation between the mean of daily temperature difference at the TEG and the daily sum of rain.
Appendix A.3. Additional Results and Figure about Temperature Soil Model
The model has been validated for simulating thermal gradients in soil bodies with a natural ground cover. To cover a reasonable degree of spatial and natural variability, we apply the model for various locations in different climatic regions in Switzerland and compare simulations with historical soil temperature measurements (reference data) under a grass surface at a depth of 1 m (see
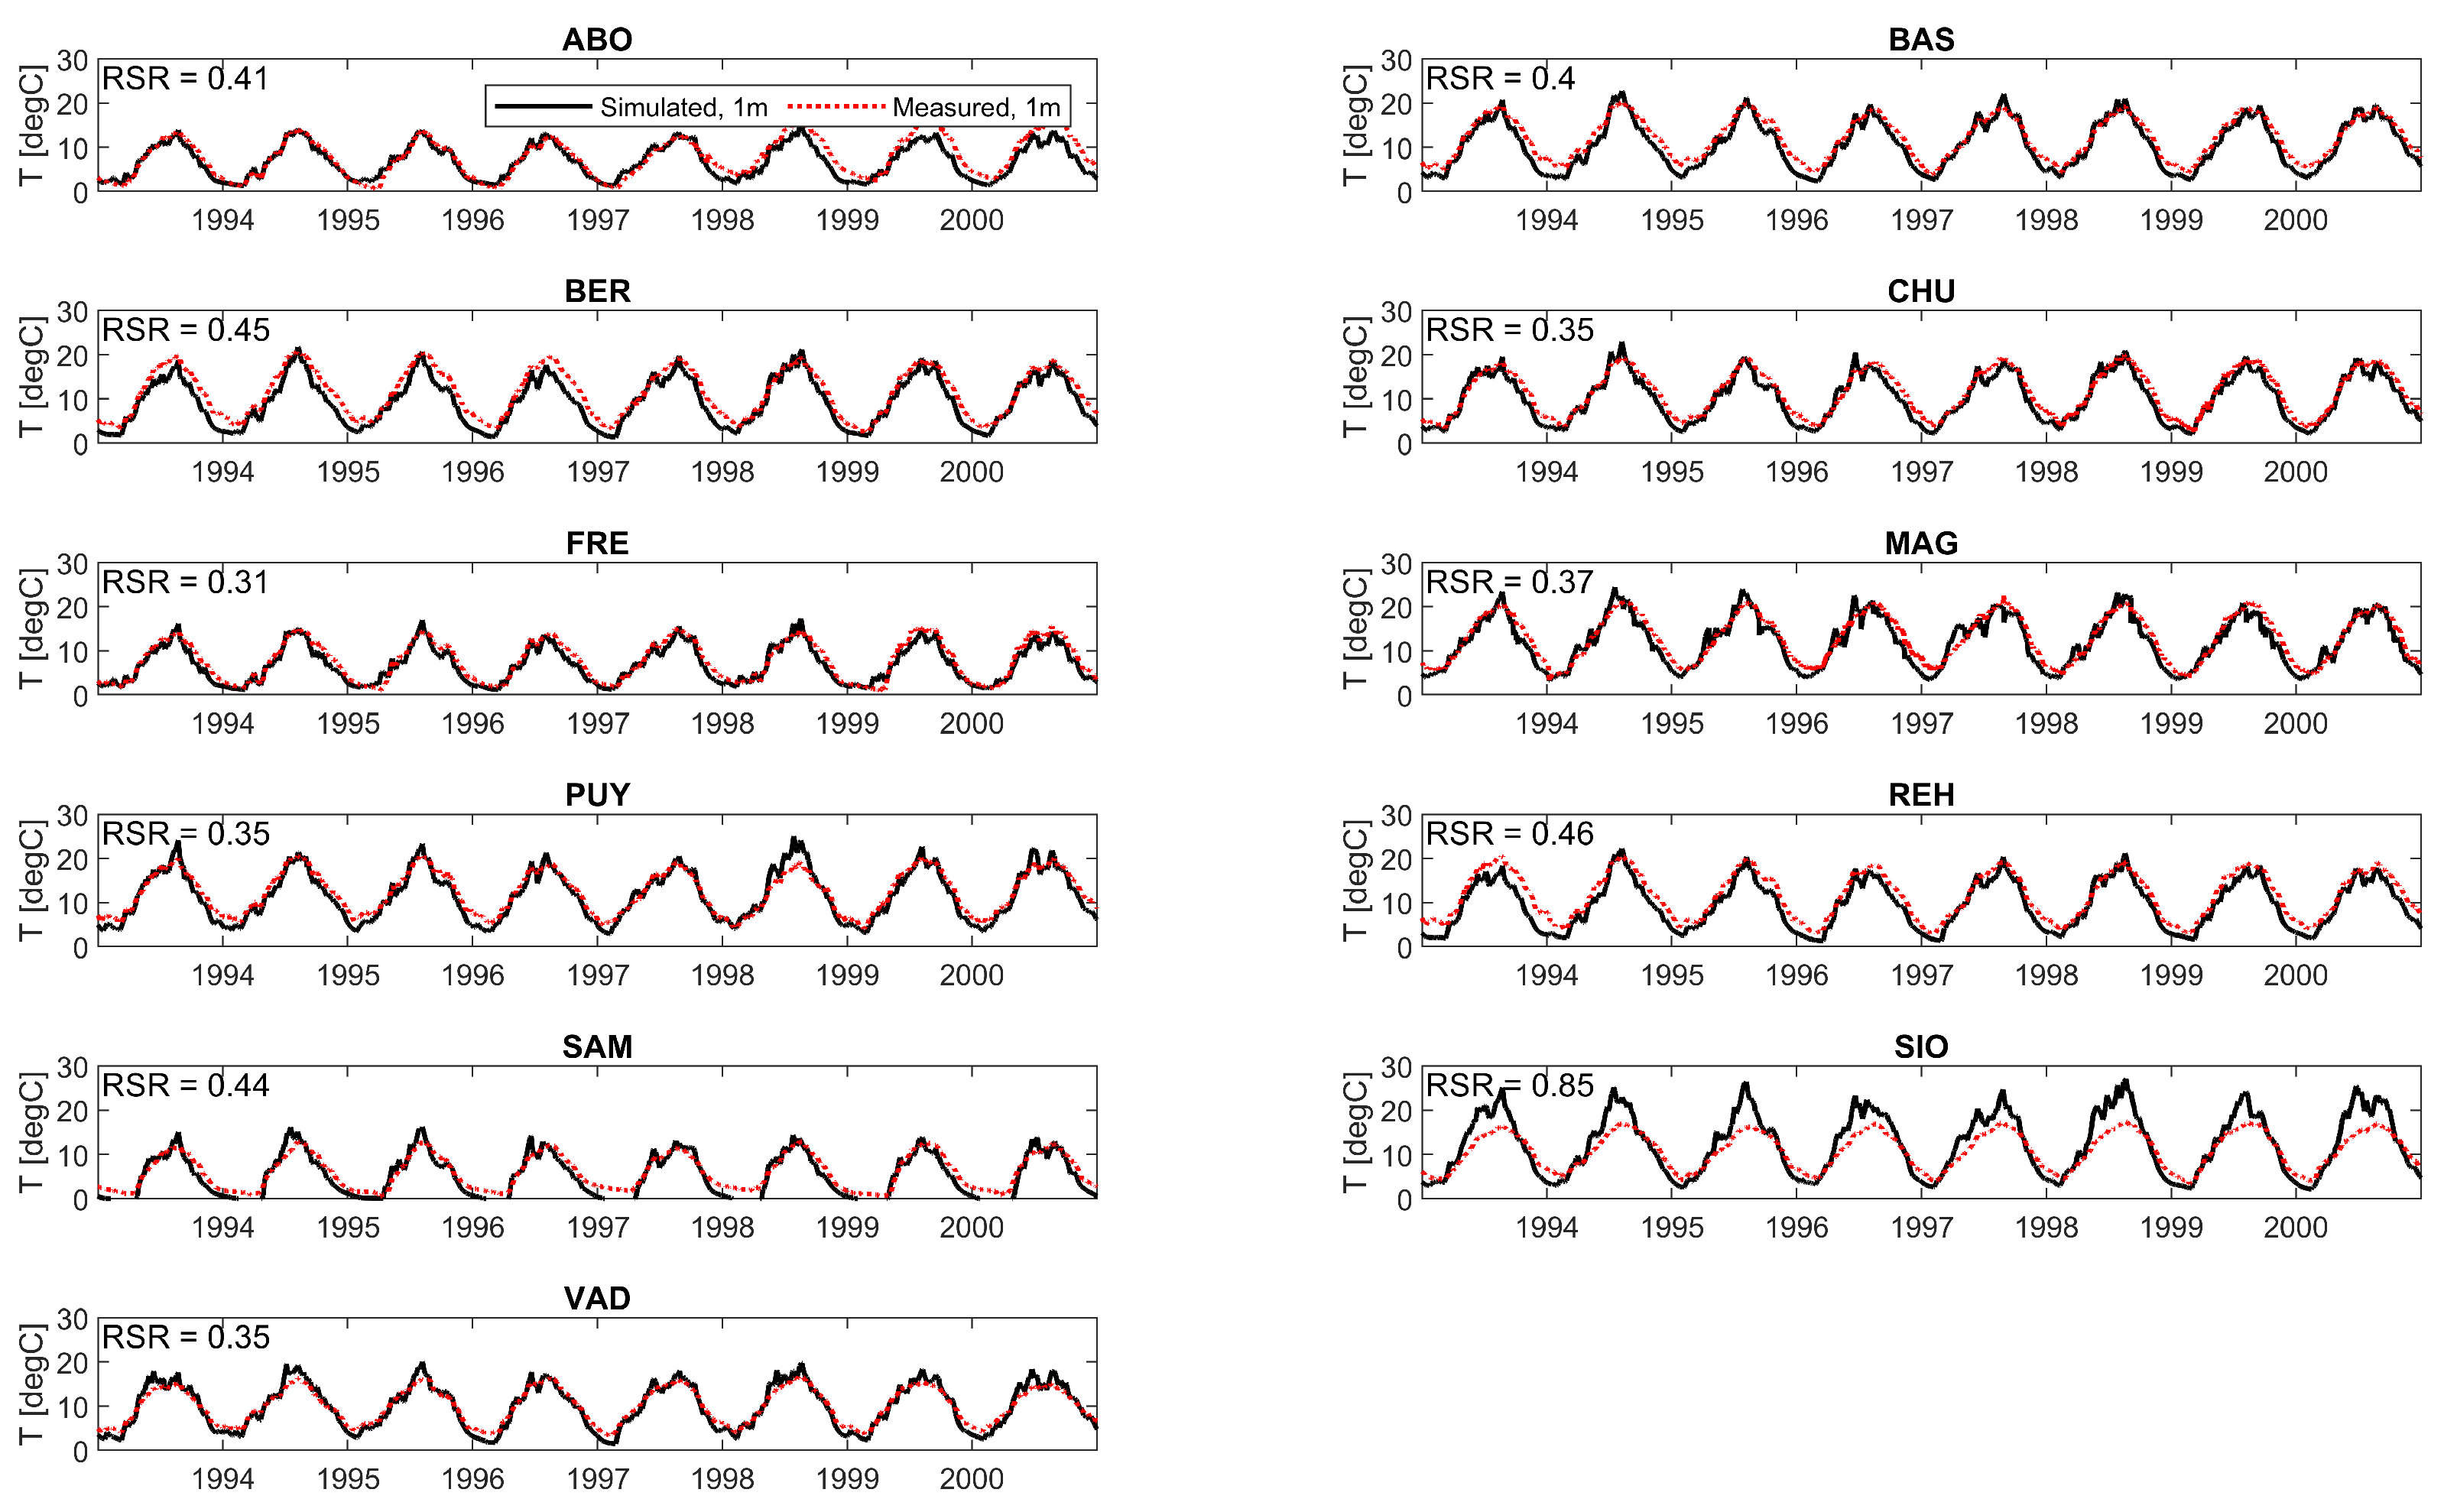
Figure A6). The model performance, expressed as RSR, is in a very good range for almost all locations (0.31 for FRE to 0.46 for REH), except for Sion-SIO (0.85), for which a mediocre performance is observed. While the model generally tends to overestimate the temperature drop in autumn, it reproduces the increase in spring quite well. For SIO, especially the summer peak temperatures are overestimated by a maximum of 10 °C. The main reason for this deficiency is seen in the fact that SIO is the only station for which a soil type “clay” is assumed, i.e., the soil moisture content is particularly unique. In addition, the temperature during frost periods in SAM is less well reproduced. In this case, the model overestimates the “warming” due to snow cover. The model adequately simulates seasonal dynamics within a year for almost all locations. Given the limited available input data, especially regarding the soil types, this result can be considered satisfactory.
Figure A6.
Validation of the model with data of eleven locations: simulated without the street cover for the years 1993–2001, indicated is the RSR for all simulations.
Figure A6.
Validation of the model with data of eleven locations: simulated without the street cover for the years 1993–2001, indicated is the RSR for all simulations.
References
- UN Environment Programme. Half the World to Face Severe Water Stress by 2030 unless Water Use is “Decoupled” from Economic Growth, Says International Resource Panel. Available online: https://www.unep.org/news-and-stories/press-release/half-world-face-severe-water-stress-2030-unless-water-use-decoupled (accessed on 30 March 2023).
- Liemberger, R.; Wyatt, A. Quantifying the Global Non-Revenue Water Problem. Water Supply 2019, 9, 831–837. [Google Scholar] [CrossRef]
- Ahmad Fuad, Z.; Eddy, H.S.; Badronnisa, Y.; Syazwani, I. Water leak detection method in water distribution network. IOP Conf. Ser. Earth Environ. Sci. 2019, 357. [Google Scholar] [CrossRef]
- WATERFLUX 3070. Available online: https://krohne.com/en/products/flow-measurement/flowmeters/electromagnetic-flowmeters/waterflux-3070/ (accessed on 30 March 2023).
- Pozo, B.; Garate, J.I.; Araujo, J.Á.; Ferreiro, S. Energy Harvesting Technologies and Equivalent Electronic Structural Models—Review. Electronics 2019, 8, 486. [Google Scholar] [CrossRef] [Green Version]
- Casini, M. Harvesting energy from in-pipe hydro systems at urban and building scale. Int. J. Smart Grid Clean Energy 2015, 4, 316–327. [Google Scholar] [CrossRef] [Green Version]
- Huicong, L.; Jiankang, Z.; Qiongfengh, S.; Tianyiyi, H.; Tao, C.; Lining, S.; Jan, A.D.; Chengkuo, L. Development of a Thermoelectric and Electromagnetic Hybrid Energy Harvester from Water Flow in an Irrigation System. Micromachines 2018, 9, 395. [Google Scholar]
- Zhang, X.; Youcef-Toumi, K. Magnetohydrodynamic Energy Harvester for Low-Power Pipe Instrumentation. IEEE/ASME Trans. Mechatron. 2022, 27, 4718–4728. [Google Scholar] [CrossRef]
- Ye, G.; Soga, K. Energy Harvesting from Water Distribution Systems. J. Power Eng. Am. Soc. Civ. Eng. 2012, 138, 7–17. [Google Scholar] [CrossRef]
- Datta, U.; Dessouky, S.; Papagiannakis, A.T. Thermal Energy Harvesting from Asphalt Roadway Pavement. In Advancement in the Design and Performance of Sustainable Asphalt Pavements; Mohammad, L., Ed.; Sustainable Civil Infrastructures; Springer International Publishing: Berlin/Heidelberg, Germany, 2018; pp. 272–286. Available online: https://link.springer.com/chapter/10.1007/978-3-319-61908-8_20 (accessed on 30 March 2023).
- Guo, L.; Lu, Q. Potentials of piezoelectric and thermoelectric technologies for harvesting energy from pavements. Renew. Sustain. Energy Rev. 2017, 72, 761–773. [Google Scholar] [CrossRef]
- Jiang, W.; Yuan, D.; Xu, S.; Hu, H.; Xiao, J.; Sha, A.; Huang, Y. Energy harvesting from asphalt pavement using thermoelectric technology. Appl. Energy 2017, 205, 941–950. [Google Scholar] [CrossRef]
- Pullwitt, S.; Kulau, U.; Hartung, R.; Wolf, L.C. A Feasibility Study on Energy Harvesting from Soil Temperature Differences. In Proceedings of the 7th International Workshop on Real-World Embedded Wireless Systems and Networks, Shezen, China, 4 November 2018. [Google Scholar] [CrossRef]
- Carvalhaes-Dias, P.; Cabot, A.; Siqueira Dias, J.A. Evaluation of the Thermoelectric Energy Harvesting Potential at Different Latitudes Using Solar Flat Panels Systems with Buried Heat Sink. Appl. Sci. 2018, 8, 2641. [Google Scholar] [CrossRef] [Green Version]
- Gao, M.; Su, C.; Cong, J.; Yang, F.; Wang, Y.; Wang, P. Harvesting thermoelectric energy from railway track. Energy 2019, 180, 315–329. [Google Scholar] [CrossRef]
- Meli, M.; Hegetschweiler, L. Harvesting energy from trees in order to power LPWAN IoT nodes. In Proceedings of the Wireless Congress 2018, Munich, Germany, 21–22 March 2018. [Google Scholar] [CrossRef]
- Meli, M.; Maij, B. Energy autonomous LPWAN node for walls and bridges: 4 seasons results. In Proceedings of the Wireless Congress 2022, Munich, Germany, 16–17 November 2022. [Google Scholar] [CrossRef]
- Sadeghioon, A.M.; Metje, N.; Chapman, D.N.; Anthony, C.J. SmartPipes: Smart Wireless Sensor Networks for Leak Detection in Water Pipelines. J. Sens. Actuator Netw. 2014, 3, 64–78. [Google Scholar] [CrossRef] [Green Version]
- Martini, A.; Troncossi, M.; Rivola, A. Automatic Leak Detection in Buried Plastic Pipes of Water Supply Networks by Means of Vibration Measurements. Shock Vib. 2015, 2015, 165304. [Google Scholar] [CrossRef] [Green Version]
- Nwalozie Gerald, C.; Azubogu, A.C.O. Design and Implementation of Pipeline Monitoring System Using Acceleration-Based Wireless Sensor Network. Int. J. Eng. Sci. 2014, 3, 49–58. [Google Scholar]
- Paul, K.I.; Polglase, P.J.; Smethurst, P.J.; O’Connell, A.M.; Carlyle, C.J.; Khanna, P.K. Soil temperature under forests: A simple model for predicting soil temperature under a range of forest types. Agric. For. Meteorol. 2004, 121, 167–182. [Google Scholar] [CrossRef]
- Mair, M.; Zischg, J.; Rauch, W.; Sitzenfrei, R. Where to Find Water Pipes and Sewers? — On the Correlation of Infrastructure Networks in the Urban Environment. Water 2017, 9, 146. [Google Scholar] [CrossRef] [Green Version]
- VKR, Verband Kunststoff-Rohre und—Rohrleitungsteile: Richtlinie/Leitfaden für erdverlegte PE-Druckrohrleitungen in der Gas-und Wasserversorgung. Available online: https://vkr.ch/Fachinformationen/Wasser-und-Gas (accessed on 30 March 2023).
- Sigrist, L.; Stricker, N.; Bernath, D.; Beutel, J.; Thiele, L. Thermoelectric Energy Harvesting From Gradients in the Earth Surface. IEEE Trans. Ind. Electron. 2020, 67, 9460–9470. [Google Scholar] [CrossRef] [Green Version]
- Jeffrey Snyder, G. Thermoelectric Energy Harvesting. In Energy Harvesting Technolologies; Springer: Boston, MA, USA, 2009. [Google Scholar] [CrossRef]
- da Silva, A.R.; Moghaddam, M.; Liu, M. The Future of Wireless Underground Sensing Networks Considering Physical Layer Aspects. In The Art of Wireless Sensor Networks; Ammari, H., Ed.; Signals and Communication Technology; Springer: Berlin/Heidelberg, Germany, 2014. [Google Scholar] [CrossRef]
- Banaseka, F.K.; Katsriku, F.; Abdulai, J.D.; Adu-Manu, K.S.; Engmann, F.N.A. Signal Propagation Models in Soil Medium for the Study of Wireless Underground Sensor Networks: A Review of Current Trends. Wirel. Commun. Mob. Comput. 2021, 2021, 8836426. [Google Scholar] [CrossRef]
- Moiroux-Arvis, L.; Cariou, C.; Chanet, J. Evaluation of LoRa technology in 433-MHz and 868-MHz for underground to aboveground data transmission. Comput. Electron. Agric. 2022, 194, 106770. [Google Scholar] [CrossRef]
- Lei, S.; Daniels, J.L.; Bian, Z.; Wainaina, N. Improved soil temperature modeling. Environ. Earth Sci. 2011, 62, 1123–1130. [Google Scholar] [CrossRef]
- Kusuda, T.; Achenbach, P.R. Earth Temperature and Thermal Diffusivity at Selected Stations in the United States; National Bureau of Standards Gaithersburg MD: Washington, DC, USA, 1965. [Google Scholar]
- CoupModel. Available online: www.coupmodel.com (accessed on 30 March 2023).
- Basic Description of Platform. Available online: www.coupmodel.com/basic-description-of-platform (accessed on 30 March 2023).
- Jansson, C.; Almkvist, E.; Jansson, P.-E. Heat balance of an asphalt surface: Observations and physically-based simulations. Meteorol. Appl. 2006, 13, 203–212. [Google Scholar] [CrossRef]
- Zhang, Y.; Schaap, M.G. Weighted recalibration of the Rosetta pedotransfer model with improved estimates of hydraulic parameter distributions and summary statistics (Rosetta3). J. Hydrol. 2017, 547, 39–53. [Google Scholar] [CrossRef] [Green Version]
- Schweizer Eidgenossenschaft-Eidgenössisches Departement des Inneren EDI. Anmelden bei IDAWEB. Available online: https://gate.meteoswiss.ch/idaweb (accessed on 30 March 2023).
- Soil Grids. Available online: https://www.soilgrids.org/ (accessed on 30 March 2023).
- Urban Water-Sensornetz. Available online: www.uwo-opendata.eawag.ch (accessed on 30 March 2023).
| Disclaimer/Publisher’s Note: The statements, opinions and data contained in all publications are solely those of the individual author(s) and contributor(s) and not of MDPI and/or the editor(s). MDPI and/or the editor(s) disclaim responsibility for any injury to people or property resulting from any ideas, methods, instructions or products referred to in the content. |
© 2023 by the authors. Licensee MDPI, Basel, Switzerland. This article is an open access article distributed under the terms and conditions of the Creative Commons Attribution (CC BY) license (https://creativecommons.org/licenses/by/4.0/).


 ,
, 


