Article

FPGA-Based Decision Support System for ECG Analysis

Dipartimento di Ingegneria Elettrica e dell’Informazione, Politecnico di Bari, via E. Orabona 4, 70125 Bari, Italy
*
Author to whom correspondence should be addressed.
J. Low Power Electron. Appl. 2023, 13(1), 6; https://doi.org/10.3390/jlpea13010006
Submission received: 16 November 2022 / Revised: 31 December 2022 / Accepted: 4 January 2023 / Published: 7 January 2023

Abstract

:
The high mortality rate associated with cardiac abnormalities highlights the need of accurately detecting heart disorders in the early stage so to avoid severe health consequence for patients. Health trackers have become popular in the form of wearable devices. They are aimed to perform cardiac monitoring outside of medical clinics during peoples’ daily lives. Our paper proposes a new diagnostic algorithm and its implementation adopting a FPGA-based design. The conceived system automatically detects the most common arrhythmias and is also able to evaluate QT-segment lengthening and pulmonary embolism risk often caused by myocarditis. Debug and simulations have been carried out firstly in Matlab environment and then in Quartus IDE by Intel. The hardware implementation of the embedded system and the test for the functional accuracy verification have been performed adopting the DE1_SoC development board by Terasic, which is equipped with the Cyclone V 5CSEMA5F31C6 FPGA by Intel. Properly modified real ECG signals corrupted by a mixture of muscle noise, electrode movement artifacts, and baseline wander are used as a test bench. A value of 99.20% accuracy is achieved by taking into account 0.02 mV for the root mean square value of noise voltage. The implemented low-power circuit is suitable as a wearable decision support device.

1. Introduction

The most recent practice in the design of miniaturized circuits and systems for digital signal processing purposes is strongly oriented towards the use of programmable logic devices (PLD) and embedded systems designed using field-programmable gate arrays (FPGAs). FPGA circuits are preferred because of their specific purpose circuits, low-cost, reconfigurable characteristics, architectural flexibility, and fast time of development when new functionalities are added. Compared with a standard microcontroller, FPGAs have the capability of parallel and/or pipelined execution of multiple tasks and thus they minimize power consumption by using a slower system clock [1].
A great deal of FPGA-based wearable devices for the capture and analysis of bio-signals are available on the market according to recent trends in health-monitoring devices [2,3]. The study of bio-signals allows us to control and assess the functionality of the organ that generated it. For instance, the shape of the electrocardiogram signal (ECG) is considered by cardiologists to be representative of cardiac physiology. Diagnosis of heart conditions by means of ECG is the basic procedure to prevent and control cardiovascular pathologies, which are the main cause of death worldwide [4,5].
ECG tracing of each heartbeat is characterized by three signal features, which are one P-wave representing the atrial depolarization process, one QRS complex linked to the ventricular depolarization process, and one T-wave related to the ventricular repolarization. A normal cardiac cycle is featured by the sequence of P-wave, QRS complex, and T-wave interspersed with sections known as segments (Figure 1) [6,7]. Damage to the heart or nerves can produce alterations to the heart’s electrical activity, which corresponds to changes in ECG signal shape.
QRS complexes and related R peaks are the most used parameters for a basic evaluation of the health status of the heart. In fact, heart rate and other parameters can be evaluated to prevent the onset of some diseases, such as ischemia, after the QRS identification [8]. The analysis of RR-interval lengths (that is the time between two consecutive R peaks) makes the heart-rate variability (HRV) study possible. HRV measurement provides significant information regarding cardiac irregularities or injuries. The activity of the autonomous nervous system is also depicted by the HRV analysis, and it is used as a quantitative indicator of stress [9,10].
Cardiac arrhythmia is a common heart disease that could be defined as a disorder or an abnormality in the normal activation sequence of the myocardium, giving rise to an irregular heartbeat or abnormal rhythm [11]. Arrhythmia can take place in a healthy heart with minimal consequences; however, it may also indicate a serious problem, which can lead to stroke, sudden cardiac death, scarring of heart tissue, changes in heart structure, or premature beats due to blood flow failure in the body [12]. Analysis of RR intervals can be used to determine the heart rhythm because an abnormal heart rhythm causes characteristic variations in RR-interval lengths.
The Association for the Advancement of Medical Instrumentation (AAMI) recommendations indicate five more general classes of arrhythmia, although various classes of arrhythmia characterized by distinctive manifestations are indicated in the literature [13,14,15,16,17,18]. These classes are normal sinus rhythm (N), ventricular ectopic beats (V), supraventricular ectopic beats (S), fusion beats (F), and unclassified beats (Q) [19,20]. Bradycardia, tachycardia, atrial fibrillation, and ventricular tachycardia are the main heart rhythm disturbances. In case of regular hearth rhythm, bradycardia and tachycardia occur if the hearth rate is below 40–50 beats per minute (bpm) and above 120–140 bpm, respectively. Examples of heart rhythm conditions are shown in Figure 2 [21]. Although a great deal of research in the literature have focused on R-peak detection and RR-interval length evaluation to asses cardiac disorders [22,23,24], the lengthening of the QT interval has gained high significance as an arrhythmia risk predictor [25,26], and the prolongation of RS time has been considered both a useful index for diagnosing acute pulmonary embolism and a predictive index for short-term mortality in patients with acute pulmonary embolism [27,28].
Analysis of ECG patterns by physicians may have to be carried out over several hours, with a high probability of missing vital information owing to the unpredictability of arrhythmia onset. The adoption of a computer-aided diagnosis (CAD) system that implements an automatic signal processing classification procedure is advisable [29,30]. These decision support systems typically operate as automated “second opinion” systems that can indicate the onset of disturbances and/or type of abnormalities [31]. Technological innovation in CAD systems is not just limited to the development of software classification methods but involves the hardware implementation of real-time solutions [32,33,34].
In this paper, we design a real-time and low-power architecture for the diagnosis of the health status of the heart. We have developed an accurate software-based medical diagnostic approach able to detect the most common types of arrhythmias to refer the HRV with the related pathologies and to perform other unique tasks, such as an evaluation of the QT-segment lengthening and pulmonary embolism (PE) risk assessment. The conceived algorithm is optimized for real-time application and is implemented in the Matlab® environment. To provide a continuous monitoring of cardiac activity, we have also designed a hardware implementation of the aforementioned system based on an FPGA device. In summary, the main contributions of our paper are:
  • The development of an automatic classifier, which should be suitable as a decision support system;
  • The soft real-time implementation of the classifier on FPGA for a low-cost/low-power device;
  • The evaluation of CAD (software) and hardware performance;
  • Comparative benchmarking for assessing the method validity
The rest of the paper is organized as follows: In Section 2 of our paper, the conceived procedure is described, while Section 3 deals with the design of the FPGA-based embedded system. The functional test carried out, discussions, conclusions, and future developments complete the paper.

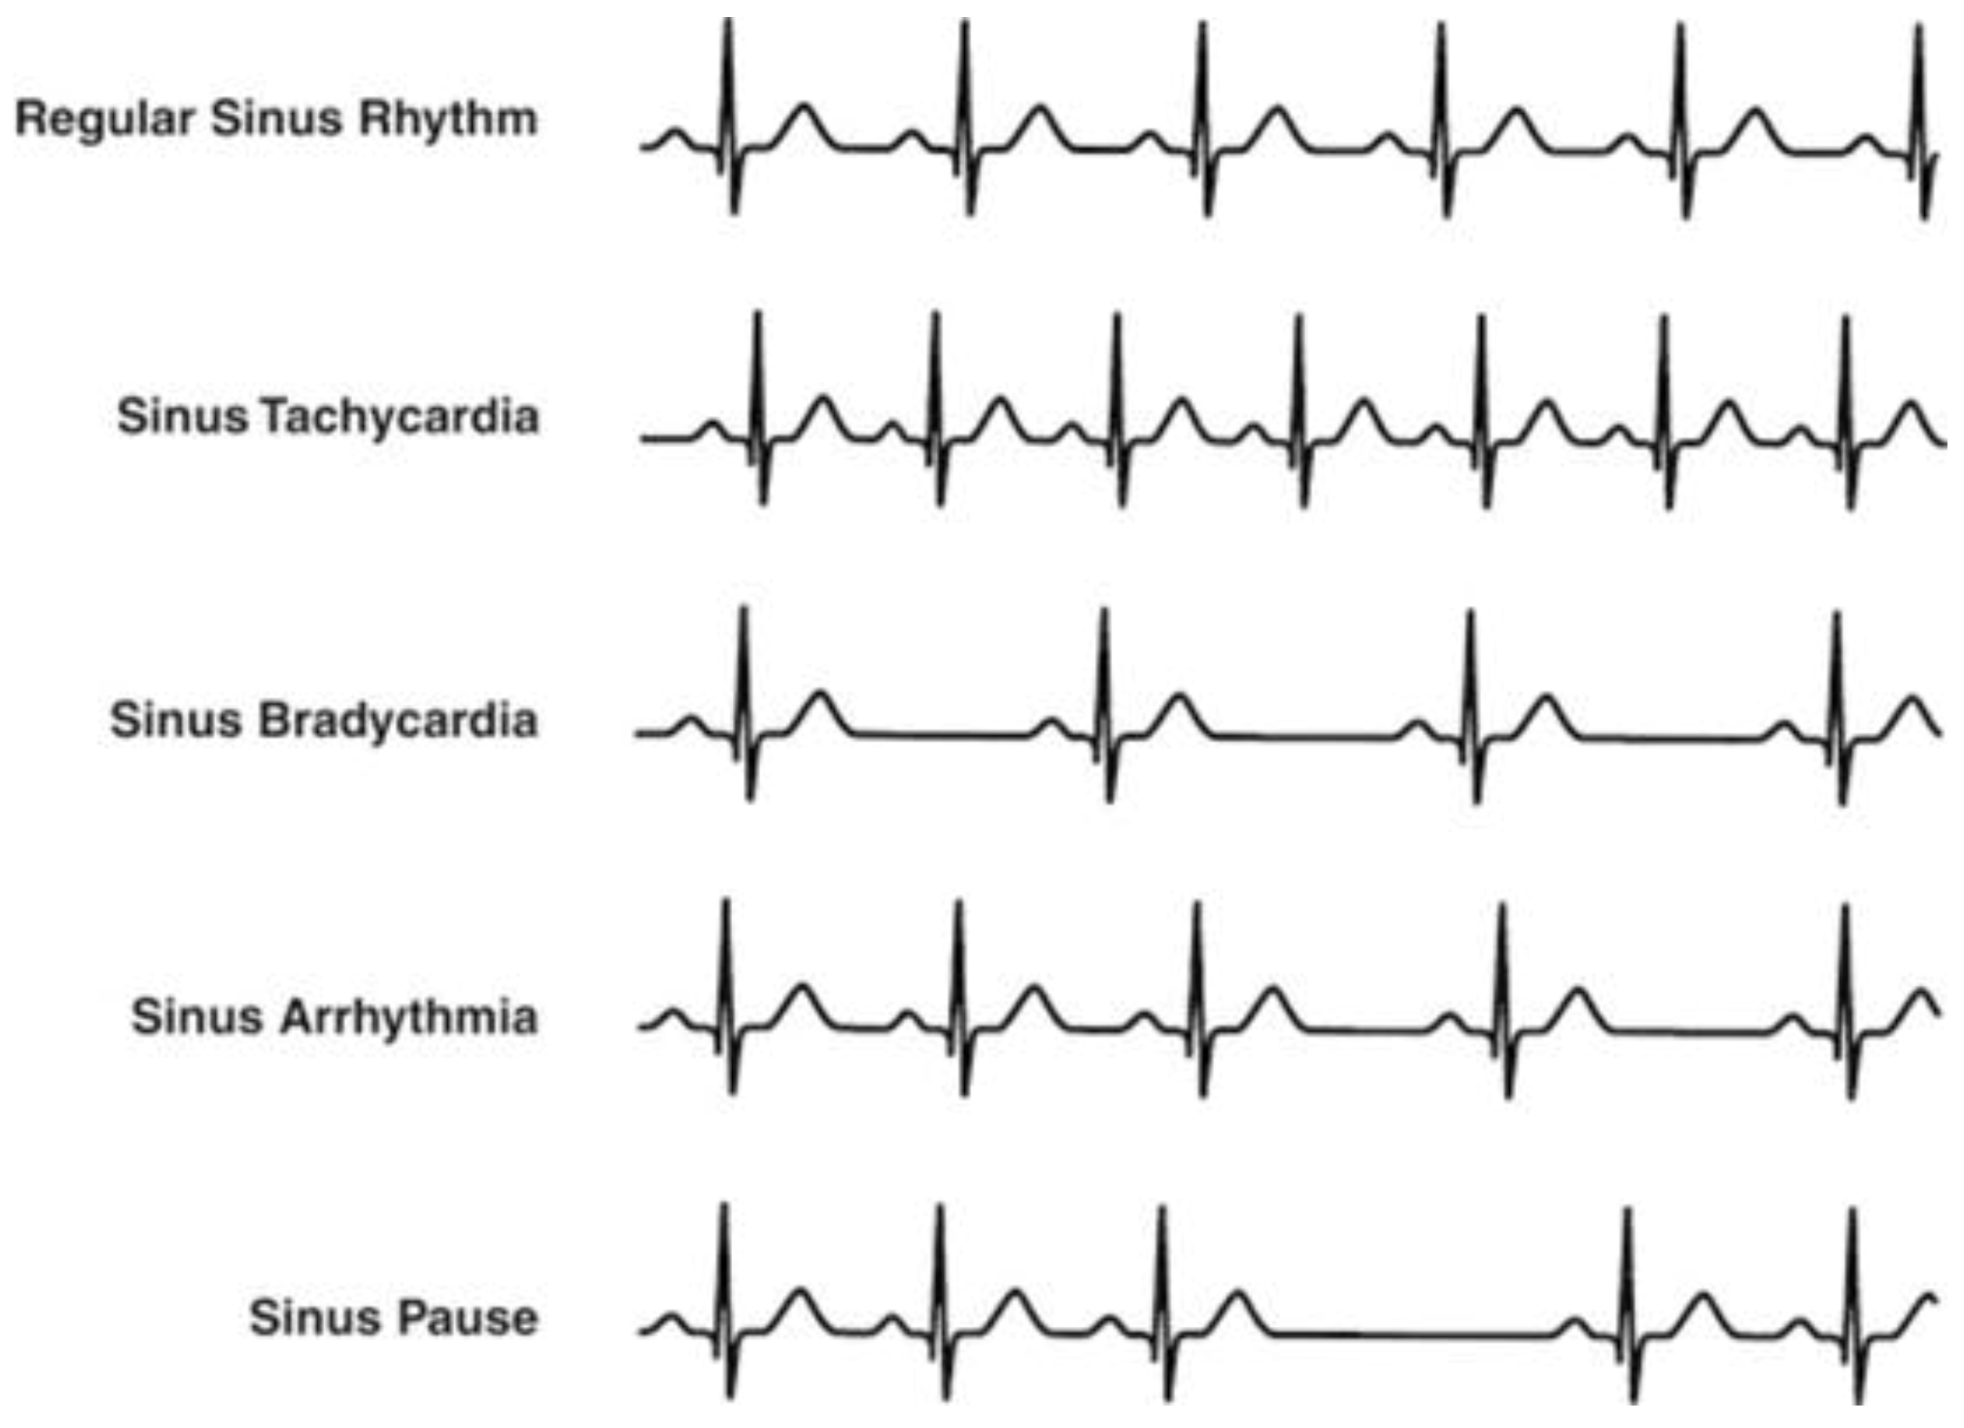
2. Implemented Diagnostic Procedure

The aim of the implemented tool is the development of a framework able to detect the occurrence of:
  • Arrhythmias;
  • Tachycardia;
  • Bradycardia;
  • Arrhythmias in presence of tachycardia;
  • Arrhythmias in presence of bradycardia;
  • Irregular heartbeat, followed by tachycardia/bradycardia, succeeded by normal cardiac rhythm;
  • Pulmonary embolism risk;
  • Variations (lengthening) of the QT segment.
The sequential pipeline of our decision support system is detailed below.

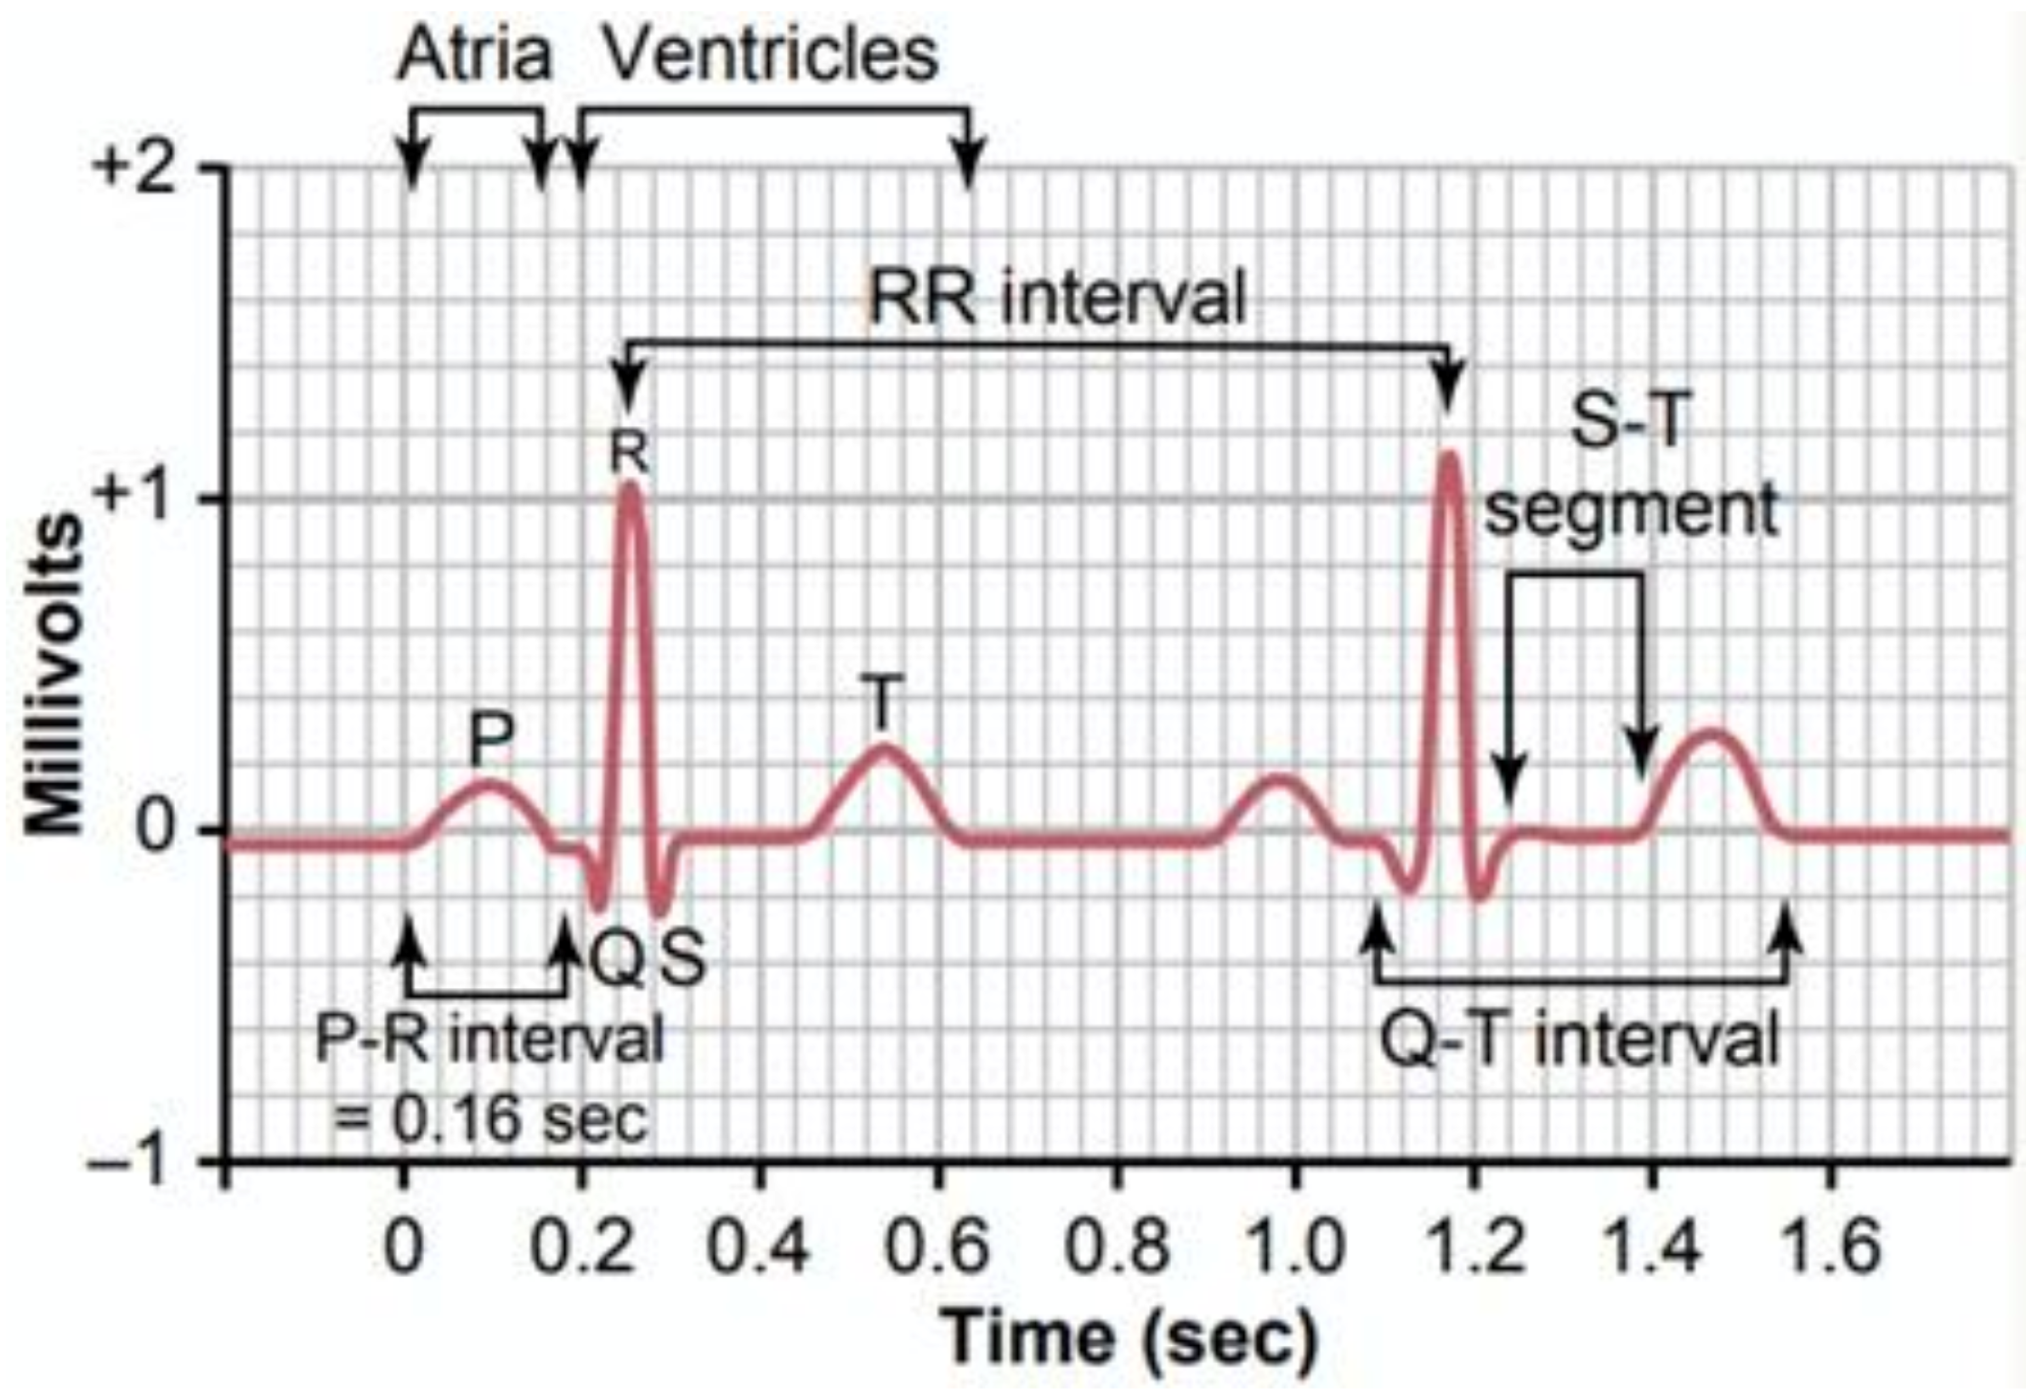
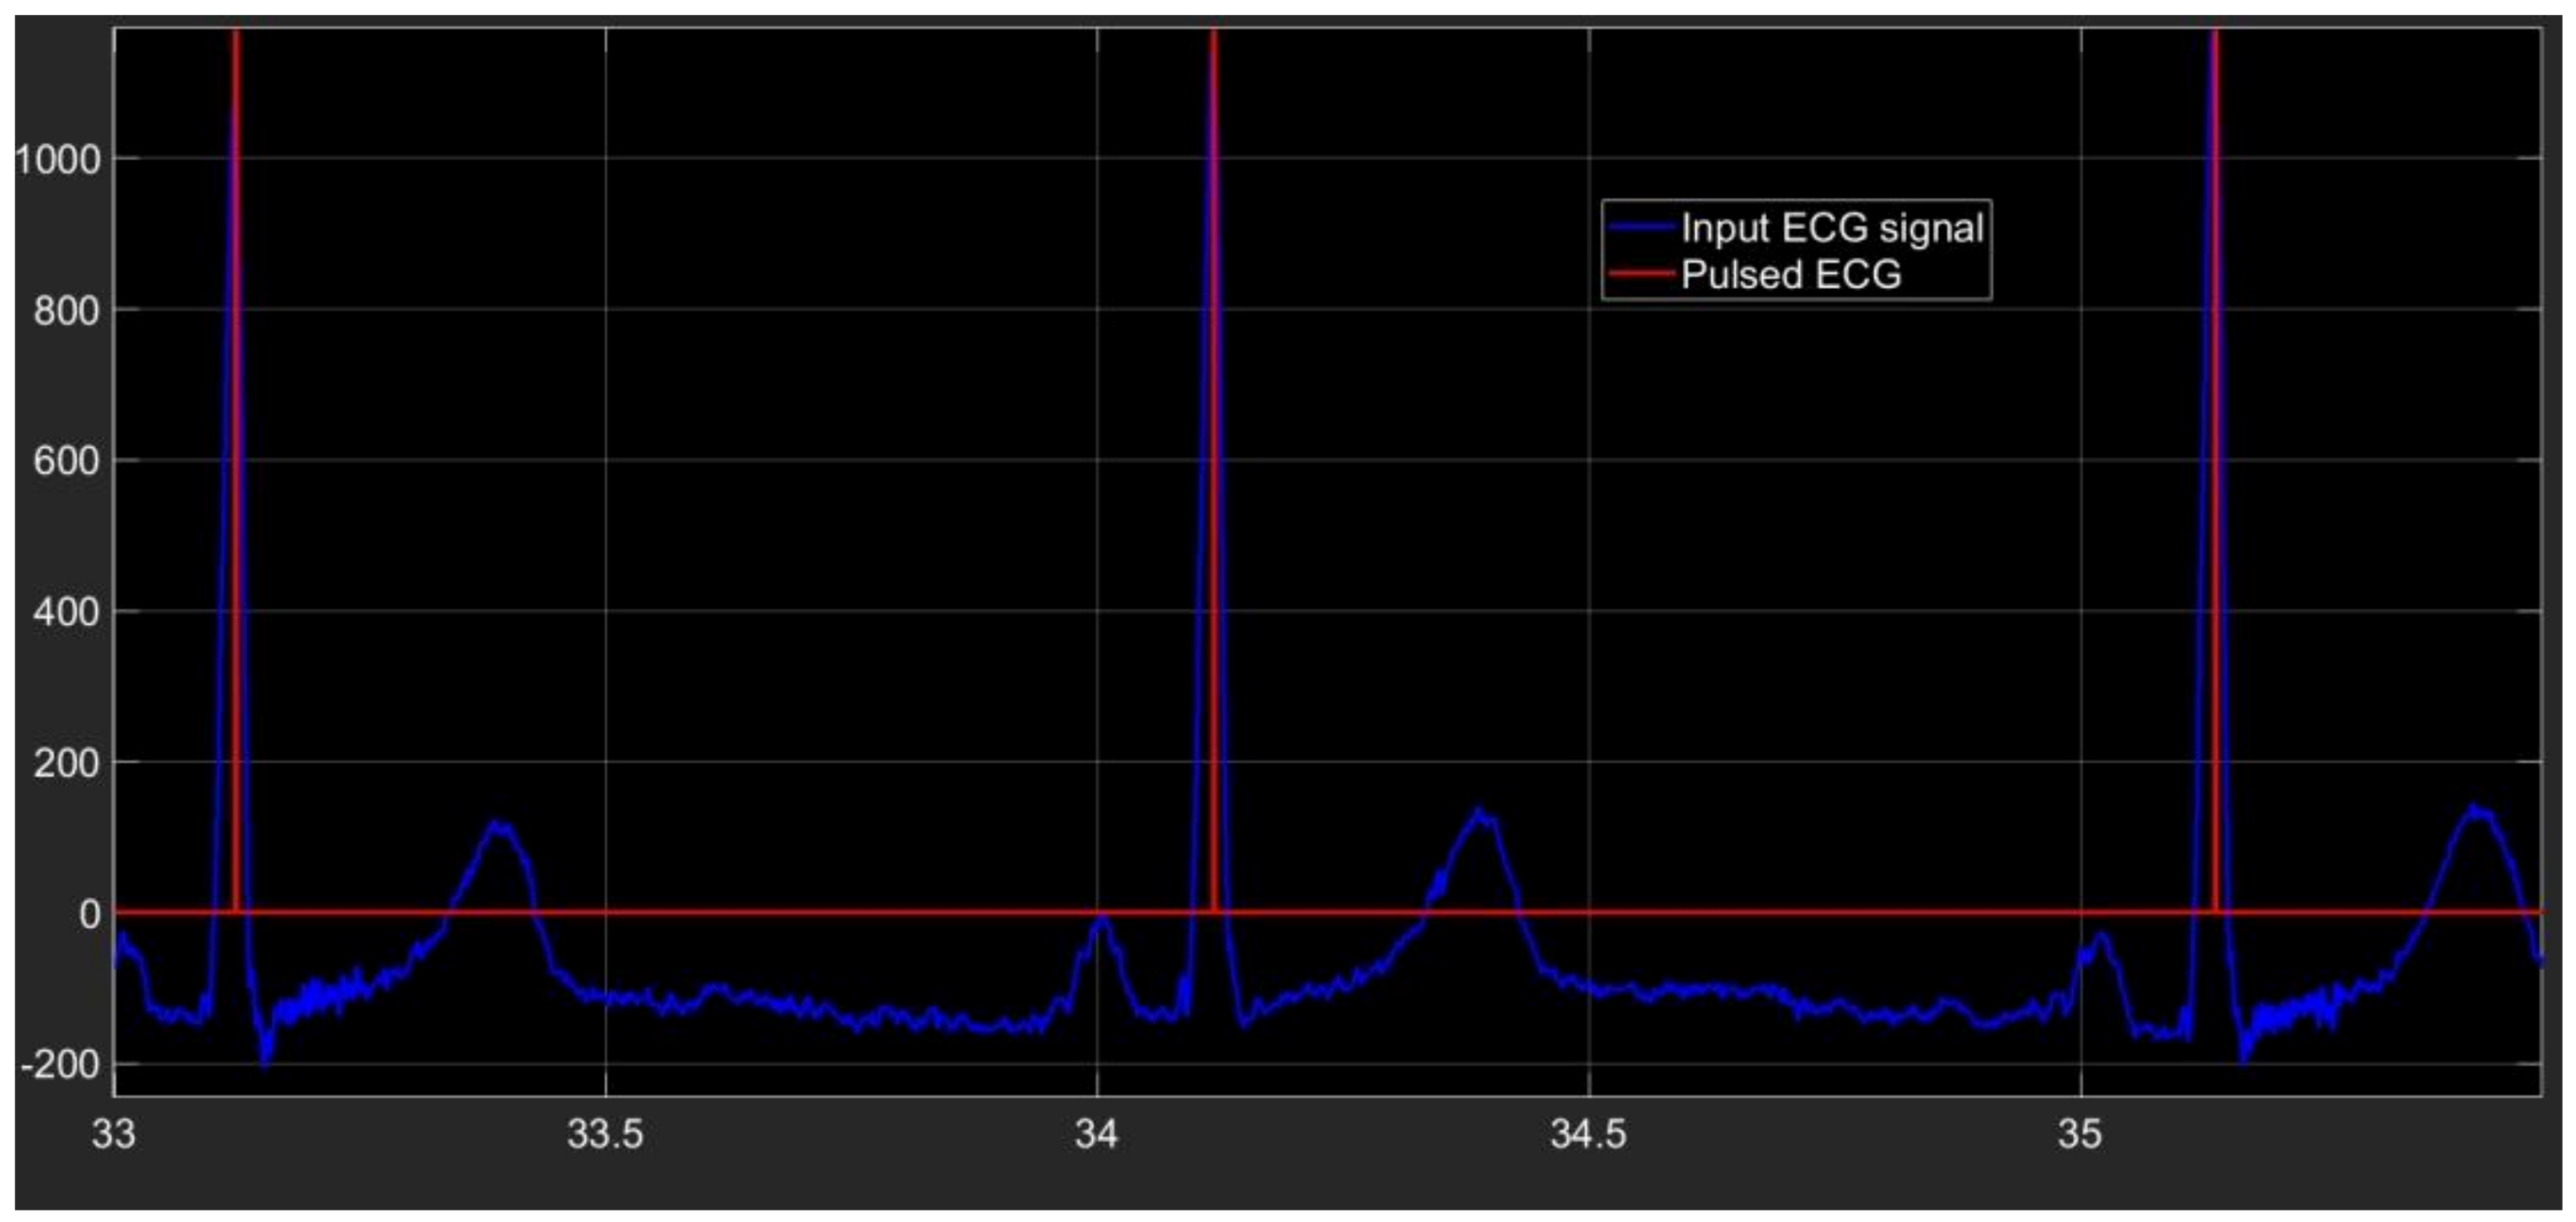
2.1. Preprocessing Phase
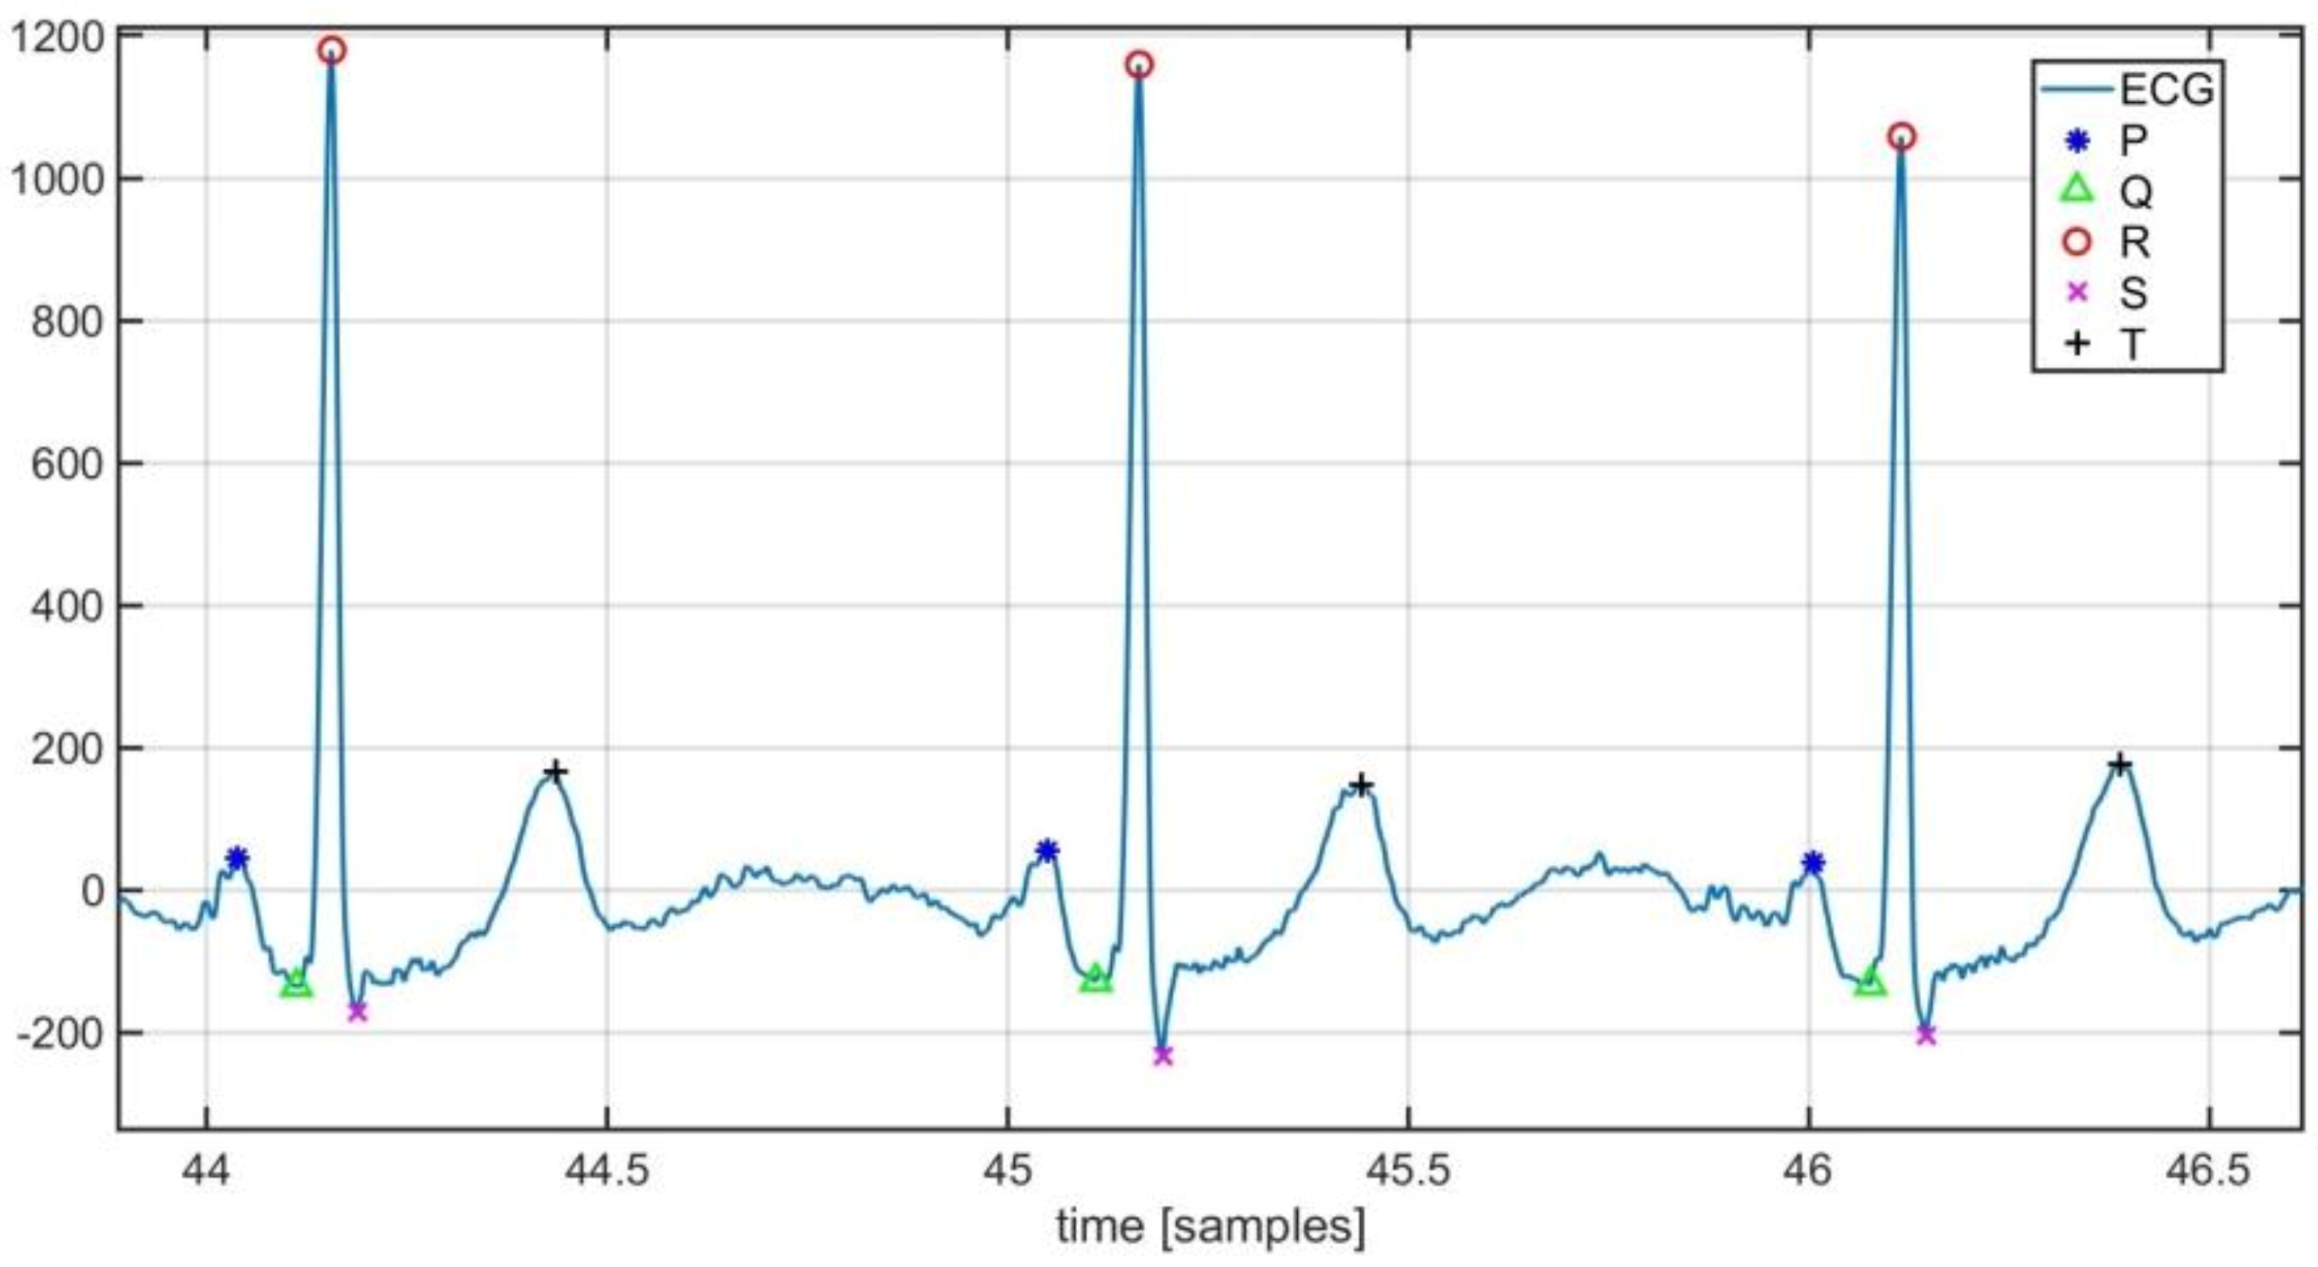
The aim of the signal preprocessing phase is baseband filtering and noise level reduction.
Baseline alignment by means of the Daubechies-6 wavelet transform was performed and then a tenth-order bandpass FIR filter with cutoff frequencies at 0.2 and 40 Hz was used. Wavelet transform was adopted for signal denoising because it has been shown to be an appropriate technique for the study of non-stationary signals [35]. The wavelet of orthogonal families was considered so as to ensure the absence of information redundancy represented by wavelet coefficients [36]. Coiflet5 wavelet was selected and three decomposition levels were used after validation procedure tests.

2.2. Segmentation

This phase performed the localization of the P, Q, R, S, and T points on each heartbeat of the ECG signal under test. Our procedure is designed to be used both for real-time applications and for FPGA implementation. The developed tool focuses on the width of the ECG signal for the detection of characteristic points. Some other QRS wave parameters were not considered, such as slope and duration. As a result, we avoided the introduction of high frequency noise components and the need for a large amount of RAM memory.
R points were firstly localized by setting an adequate threshold value. The following formula was adopted for the threshold value (UTH) setting according to [37]:
U T H = A 2 + N A ln ( P 0 P 1 )
in which P1 and P0 are the probability of having and not having a QRS complex, respectively, A is the amplitude of the signal, and N represents the noise variance. A threshold value approximately equal to 70% of the maximum signal amplitude is obtained assuming characteristic figures compliant with the AAMI standard for the ECG signal (such as a typical pulse of 72 bmp, a QRS wave duration of 180 ms, and a noise power of 0.04 W) [37].
The preprocessed ECG signal is fed into a switch block whose output is 0 if the signal width is below the evaluated threshold value, otherwise it is equal to the input (Figure 3).
The waveform of the output signal from the processing section composed of comparator–switch–delay is indicated in Figure 4. The section output is a replica of the input if the signal is above the selected threshold value, and it is an increasing function with time. The output retains the last increasing value as soon as the input signal decreases.
A maximum search section is then implemented using both a MAX block, which processes two samples at once, and a block which produces a delay of two samples. Assuming a non-constant signal, a maximum value occurs when the outputs of the aforementioned blocks are equal, that is when the output from the subtractor block is zero (Figure 3). Denoting with xi and xi+1 two generic input samples of the MAX block occurring at time ti e ti+1, respectively (with 1≤ i ≤ s−1 and s equal to the number of samples in a single heart-beat), the detected R peak is located in correspondence of sample xi if the output of the subtractor is equal to zero at time ti+1.
The last section of our algorithm is conceived to produce a pulse in correspondence of every time at which an R peak is located. In Figure 5 the pulsed ECG signal is shown.
Our procedure looks for the other ECG characteristic points for each cardiac cycle after all the R peaks have been localized. The generic ith cardiac cycle is considered, which corresponds to the part of the ECG signal between the ith R and the (I + 1)th R peaks. Our procedure detects:
The S-wave by examining the ECG signal ranged between the ith R point and the middle of the ith cardiac cycle, looking for the minimum point. The following pseudo-code is used:
for ii = 1:(length(peakRLocend)−1)
[peakSMagend(ii)peakSLocend(ii)] = min ecg(peakRLocend(ii):(peakRLocend(ii) + (peakRLocend(ii + 1)-peakRLocend(ii))/2)));
peakSLocend(ii) = peakRLocend(ii) + peakSLocend(ii);
end
The T-wave by considering the ECG signal ranged between the ith S point and the middle of the ith cardiac cycle, looking for the maximum point. The following pseudo-code is used:
for ii = 1:(length(peakRLocend)−1)
[peakTMagend(ii)peakTLocend(ii)] = max (ecg(peakSLocend(ii):(peakRLocend(ii) + (peakRLocend(ii + 1)-peakRLocend(ii))/2)));
peakTLocend(ii) = peakSLocend(ii) + peakTLocend(ii);
end
The Q-wave by taking into account the portion of the ECG within the middle of the ith cardiac cycle and the (i + 1)th R peak according to the following pseudo-code
for ii = 1:(length(peakRLocend)−1)
[peakQMagend(ii)peakQLocend(ii)] = min (ecg((peakRLocend(ii) + (peakRLocend(ii + 1)-peakRLocend(ii))/2):(peakRLocend(ii + 1))));
peakQLocend(ii) = peakRLocend(ii) + (peakRLocend(ii + 1)-
peakRLocend(ii))/2 + peakQLocend(ii);
end
The P-wave by seeking the maximum point in the ECG part ranged between the middle of the ith cardiac cycle and the Q-wave belonging to the ith cardiac cycle. The following pseudo-code is used:
for ii = 1:length(peakQLocend)
a = round((peakRLocend(ii + 1)-peakRLocend(ii))*2/3);
[peakPMagend(ii)peakPLocend(ii)] = max (ecg((peakRLocend(ii) + a):(peakQLocend(ii))));
peakPLocend(ii) = peakRLocend(ii) + a+peakPLocend(ii);
end
Characteristic points detected by the implemented tool are highlighted in Figure 6.

2.3. Classification Phase

The pulsed ECG signal was analyzed for assessing the health status of the heart and the diagnosis of cardiac diseases. Three pulses at a time were analyzed to make the procedure particularly suitable for real-time analysis and easily deployed by FPGA devices. A time window three pulses long was defined for the classification process. Denoting with pji the generic ith pulse of the jth time window and with n the number of detected R peaks, the jth time window is composed of pji−1, pji and pji+1 pulses (2≤ i≤ n – 1, for 1≤ j ≤ n − 2). The time window was shifted one pulse right for the analysis of the whole pulsed ECG. Therefore, it follows that the time window always consists of three pulses. Our procedure evaluated the time difference between pji and pji−1 (djpi−1,pi), between pji and pji+1 (djpi,pi+1), and between pji−1 and pji+1 (djpi−1,pi+1) for each time window (that is for 1≤ j ≤n − 2).
According to the most widespread medical practice, a diagnosis of cardiac arrhythmia is suggested by the implemented procedure if [38]:
d p i 1 , p i j < 0.4   d p i 1 , p i + 1 j
Moreover, the pji pulse is also classified as tachycardic or bradycardic if djpi−1,pi or djpi,pi+1 is above 140 bpm or below 40 bpm, respectively.
Pulmonary embolism risk assessment is possible by evaluating the RS distance for each heartbeat. Additionally, average HR, HRV, and QT intervals are measured after the analyzing process of the whole ECG is finished. The following expressions are used [12,39]:
H R = 60 1 n i = 1 n d p i , p i + 1
H R V = H R m a x H R m i n
Q T c i = Q T i d p i ,   p i + 1   1 i n 1
where QTc, known as corrected QT, takes into account the QT dependence on heart rate, sex, and time of the day.
In Figure 7 and Figure 8 the operating procedure of the classification phase is better detailed. These figures show the results in ModelSim, which is an environment for the simulation of hardware description languages in Quartus. As soon as the first QRS complex is locked, a time window with a duration equal to three pulses (triplet) is defined, onto which a reference clock signal is superimposed (Figure 7). After the first triplet has been analyzed, the system automatically moves to the second one (Figure 8) and so on in a way that any arrhythmias are detected.

2.4. Adopted Database

Real signals and properly modified real signals were used as our system test bench. Real signals were retrieved from the PTB diagnostic ECG database, which is provided by the National Metrology Institute of Germany, named Physikalisch-Technische Bundesanstalt (PTB). The collection of the ECG signals was obtained using a non-commercial, PTB prototype recorder, and they are from healthy volunteers and patients with different heart diseases. Each record includes 15 simultaneously measured signals, which are the conventional 12 leads together with the 3 Frank leads. The ECGs are characterized by a 1 kHz sample rate, 16-bit resolution with 0.5 microvolts/LSB, and last about 2 min [40,41]. In the ECG signal header, a detailed clinical summary is provided, which includes age, gender, diagnosis, etc.
Properly modified real signals were generated by using the model recently provided for free by Physionet [42]. This software enables the generation of datasets containing realistic simulated ECG and PPG signals with arrhythmia episodes and, consequently, simplifies the development and testing of arrhythmia detectors. ECG signals with atrial fibrillation, extreme bradycardia, and ventricular tachycardia were generated. The simulator makes it possible to control the properties of generated signals, such as the number of arrhythmic beats, the amount and amplitude of noise, and artifacts. Such flexibility allows a comprehensive investigation of arrhythmia detectors under different circumstances.
For testing the implemented DSS, the first 70 records of the PTB database and the properly modified real ECG signals in [43] were considered.

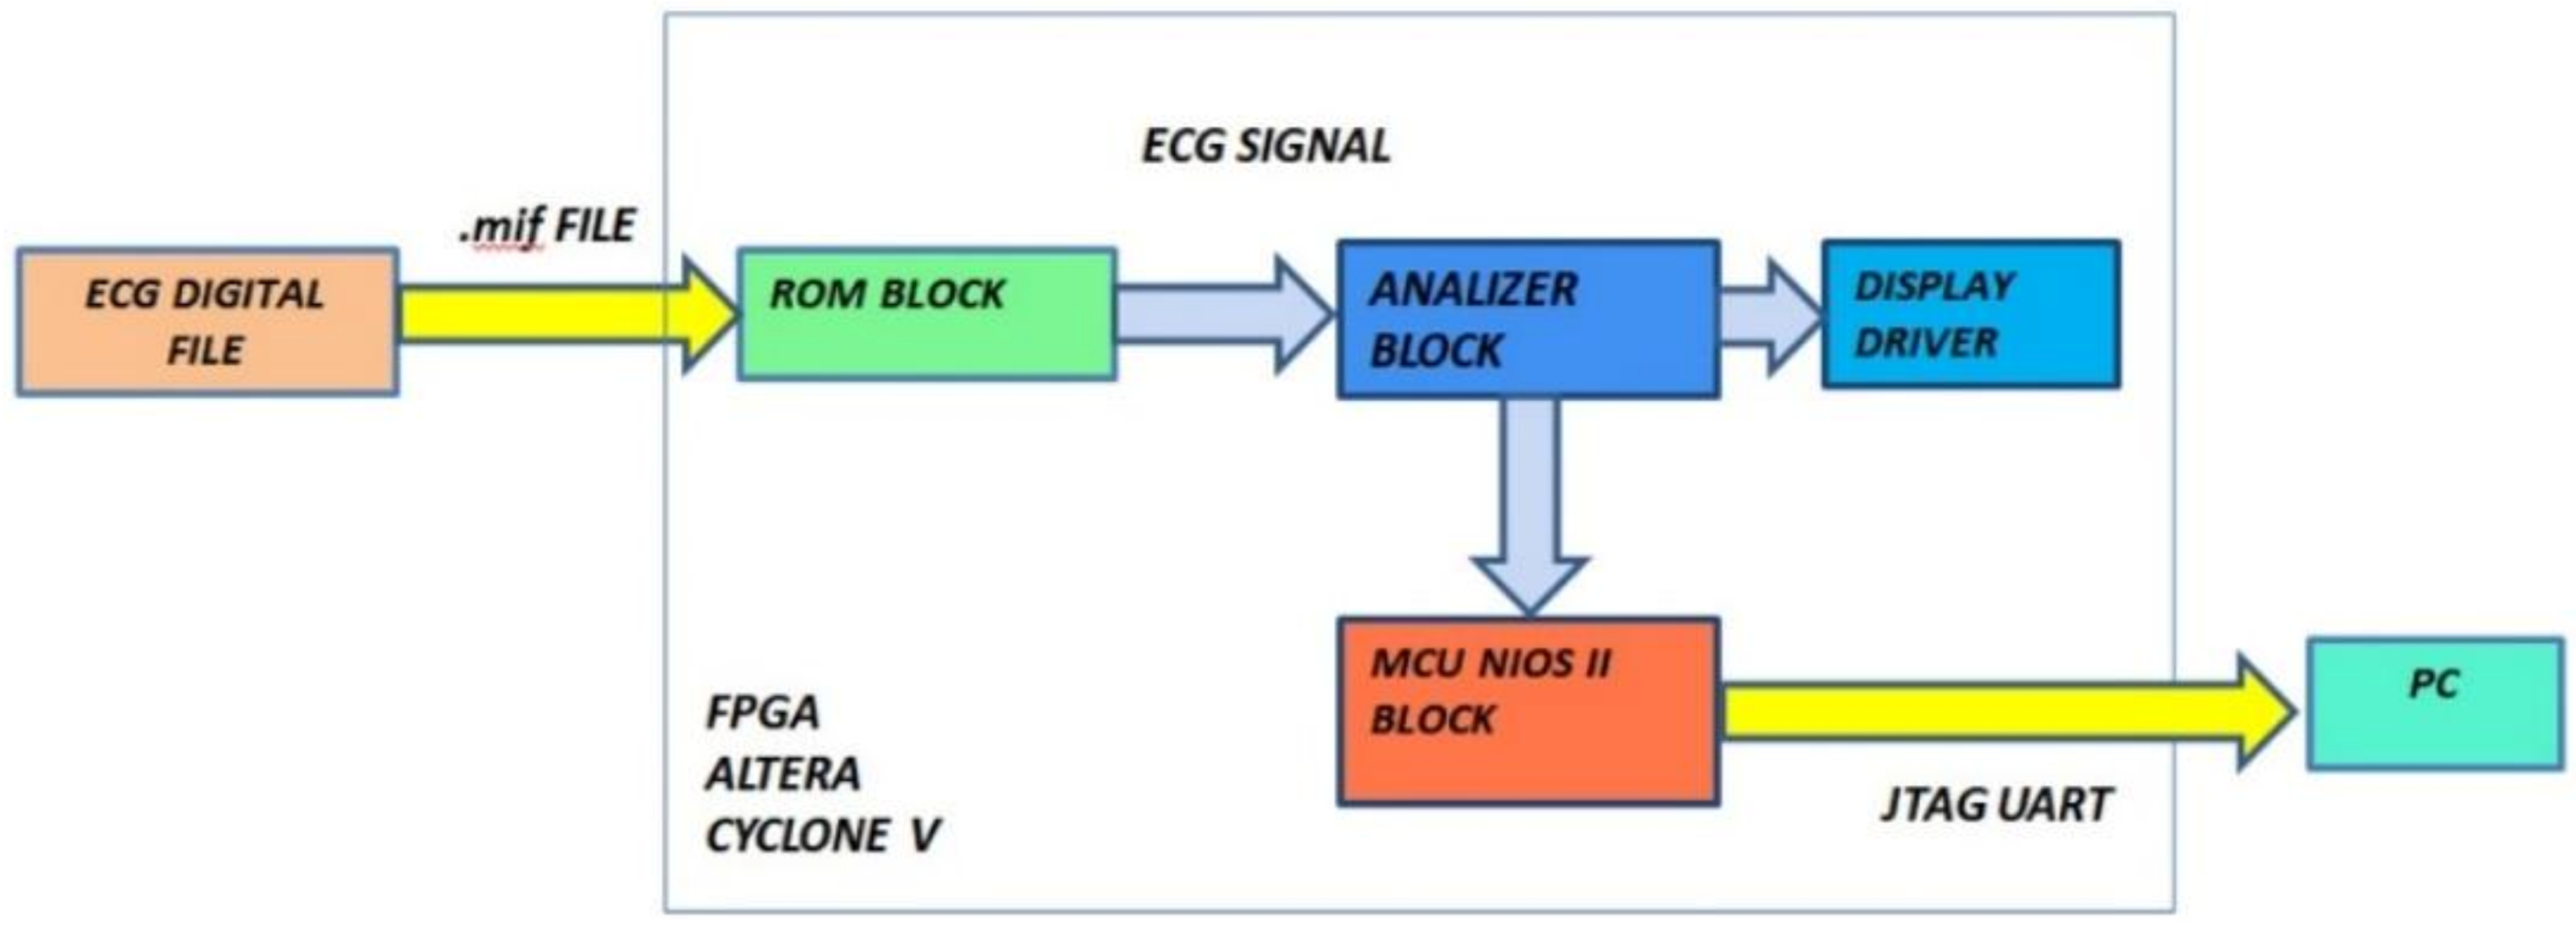
3. Hardware Architecture of the FPGA-Based Embedded System
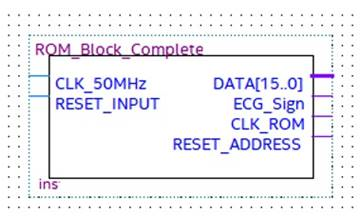
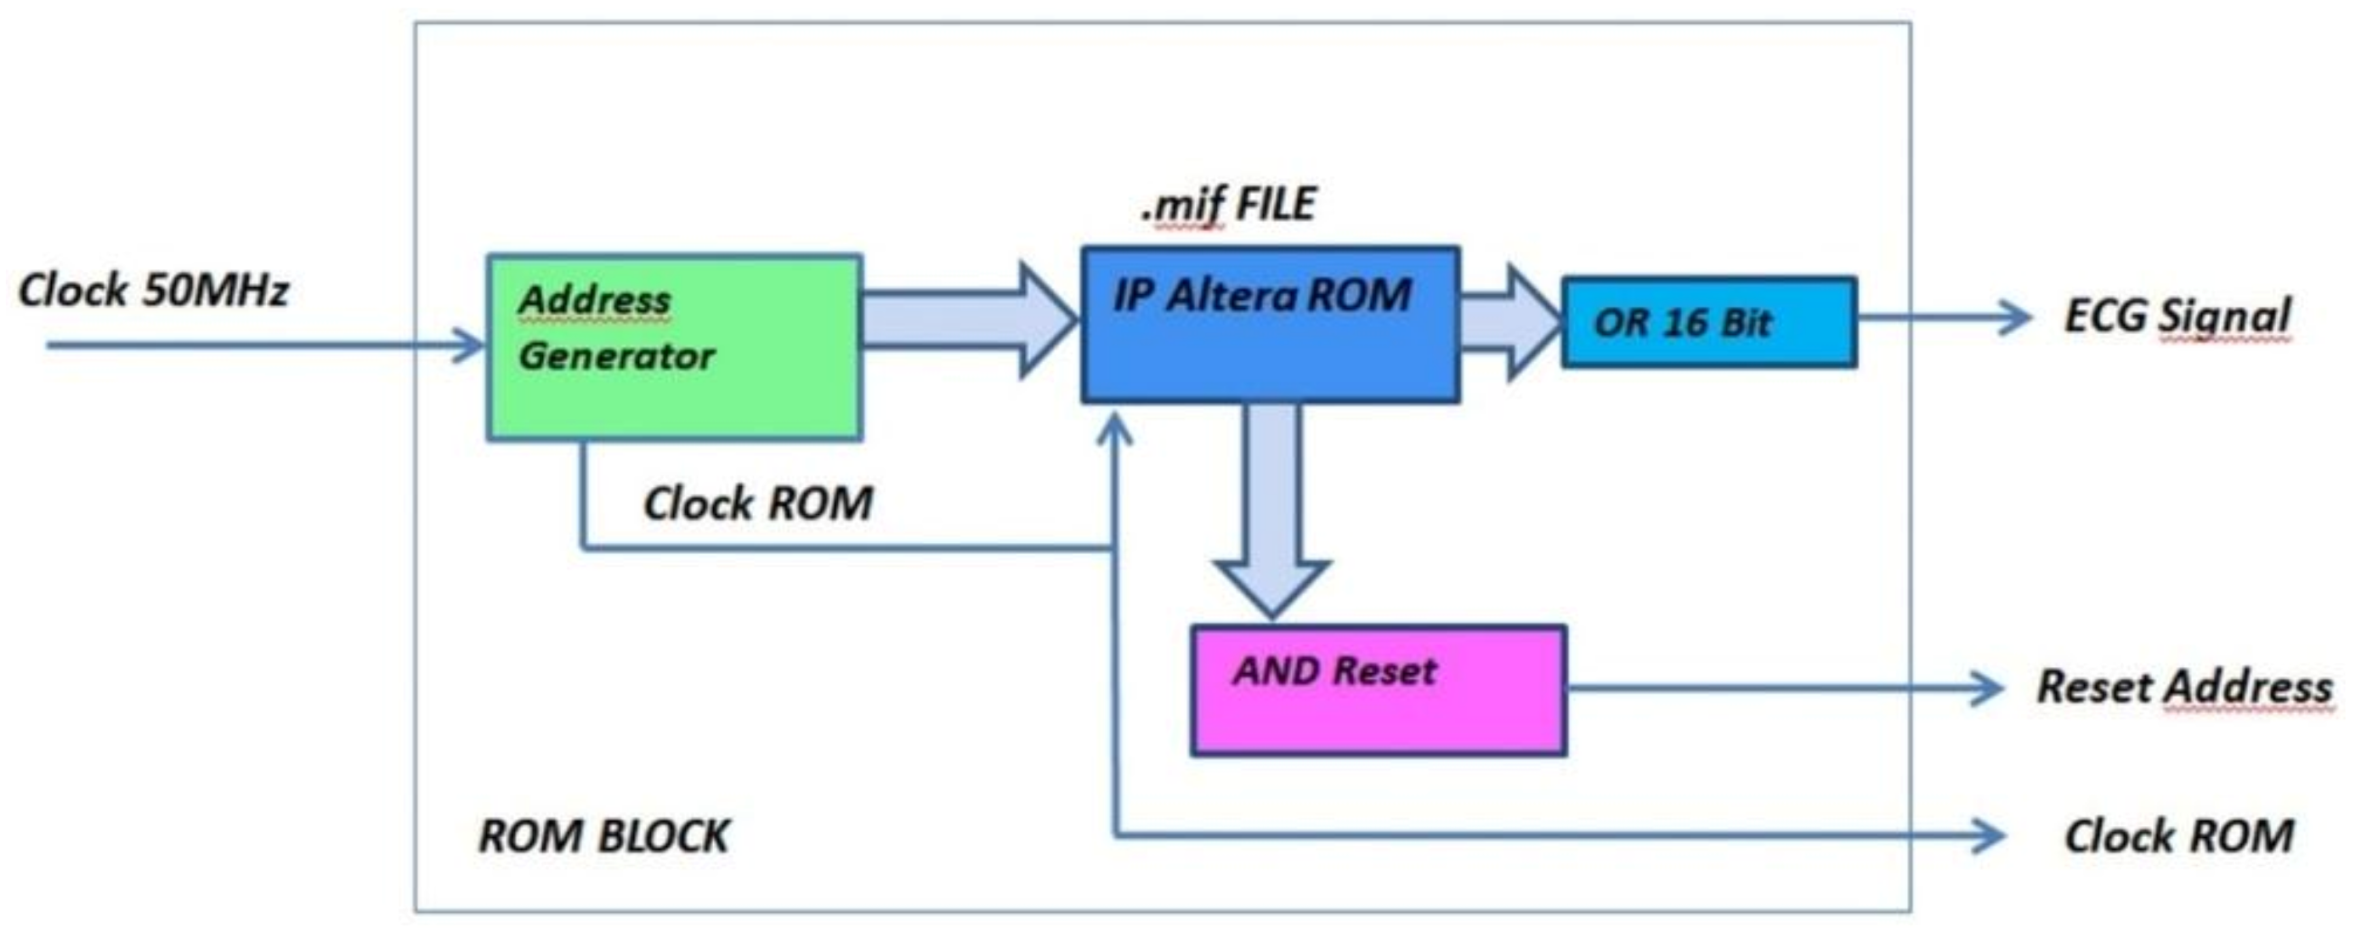
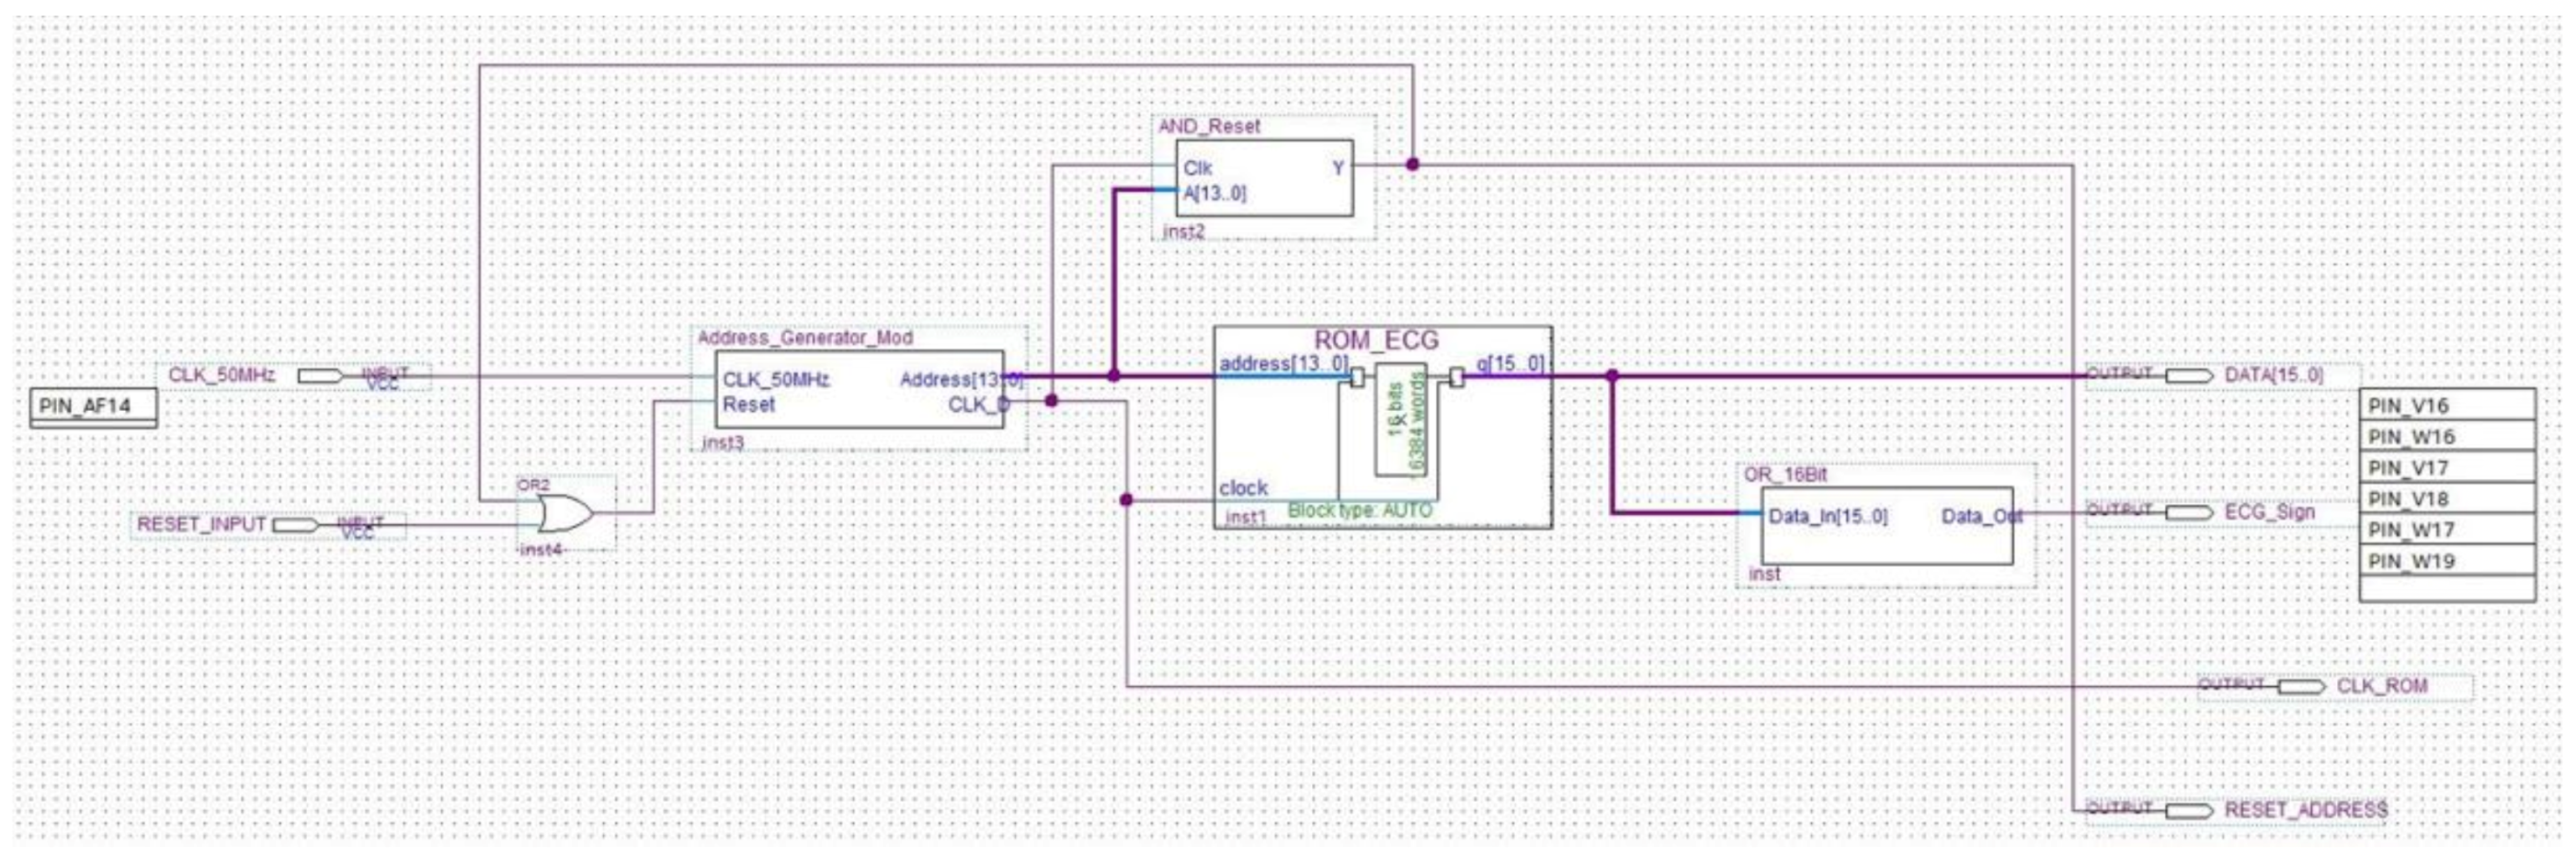
The aim of this design was a compact hardware implementation suitable for wearable devices. A solution characterized by low power consumption and minimum hardware resource requirements was conceived.
Preprocessing filters and our R-peak detection algorithm were translated into HDL language by using the HDL Coder tool. This Matlab tool makes the custom block-wise design easier. A code optimized to run in FPGA devices was generated [44,45].
Fixed-point arithmetic was adopted for signal processing. The implemented procedure operates thus in real time without requiring an excessive power computing. The amplitude of the pulse-transformed ECG signal was converted to a 16-bit fixed-point format.
The block diagram of our diagnostic device is indicated in Figure 9. It is composed of three functional modules: the ROM block, the analyzer block, and the MCU block. The input of the system is the vector of ECG data and the outputs are the number of QRS waves detected, the number of bradycardic heartbeats, the number of tachycardic heartbeats, and the number of arrhythmias detected. Diagnoses relating to the PE and QT were analyzed by the MCU block and can be notified by a message on the display or by flashing LEDs.

3.1. ROM Module

This block stores the pulse-transformed ECG (Figure 10). In particular, a string of 16 bits set to 1 represents the detection of an R peak, while a string of 16 bits set to 0 indicates the R peak absence. For debug purposes, the ROM block is not necessary because the designed hardware processes the real-time ECG signal.
The two inputs of the ROM module, named CLK_50 MHz and Reset_Input, are the operating clock provided by the selected development board and the input for the ROM address reset, respectively. The four outputs are:
-
DATA [15…0], which is a 16-bit word pointed to by the address counter, which tests and checks the block operations;
-
ECG_Signal, which is the pulsed transformed ECG signal under test;
-
CLK_ROM, which is the timing signal of the ROM address counter;
-
Reset_Address, which is the reset signal generated after the whole ROM has analyzed, which stops the process.
The ROM unit consists of the below modules/circuits, which perform the following functions (Figure 11 and Figure 12):
  • Address Generator: generates both the clock signal to accurately reproduce the ECG signal acquisition frequency and the 16-bit address for driving the ROM memory bank. The number of bits composing the address is equal to the bits forming the binary representation of the ECG sample amplitude;
  • AND Reset: generates a reset signal as soon as the Address Generator counter has reached the binary value 1111111111111111. In such a situation, the analysis can be stopped because the ROM has been completely read and the whole signal has been processed;
  • OR_16Bit: makes the logical sum on each of the 16-bit words stored into the ROM. According to the Boolean algebra, OR gate output is set at logical value 1 if at least one input is equal to 1, while a 0 output happens if all inputs are set at logical value 0. A logic 1 output occurs when a pulse (R peak) is recorded into the ROM block (being the OR inputs equal to 1111111111111111), and a logic 0 output takes place when no R peak is stored in the ROM (since the OR inputs are 0000000000000000). The analysis is so restricted to a single bit, which is the OR output instead of 16 bits, because only the moment at which the pulse occurs is relevant for diagnosis purpose. Pulse amplitude has no diagnostic relevance in this instance.

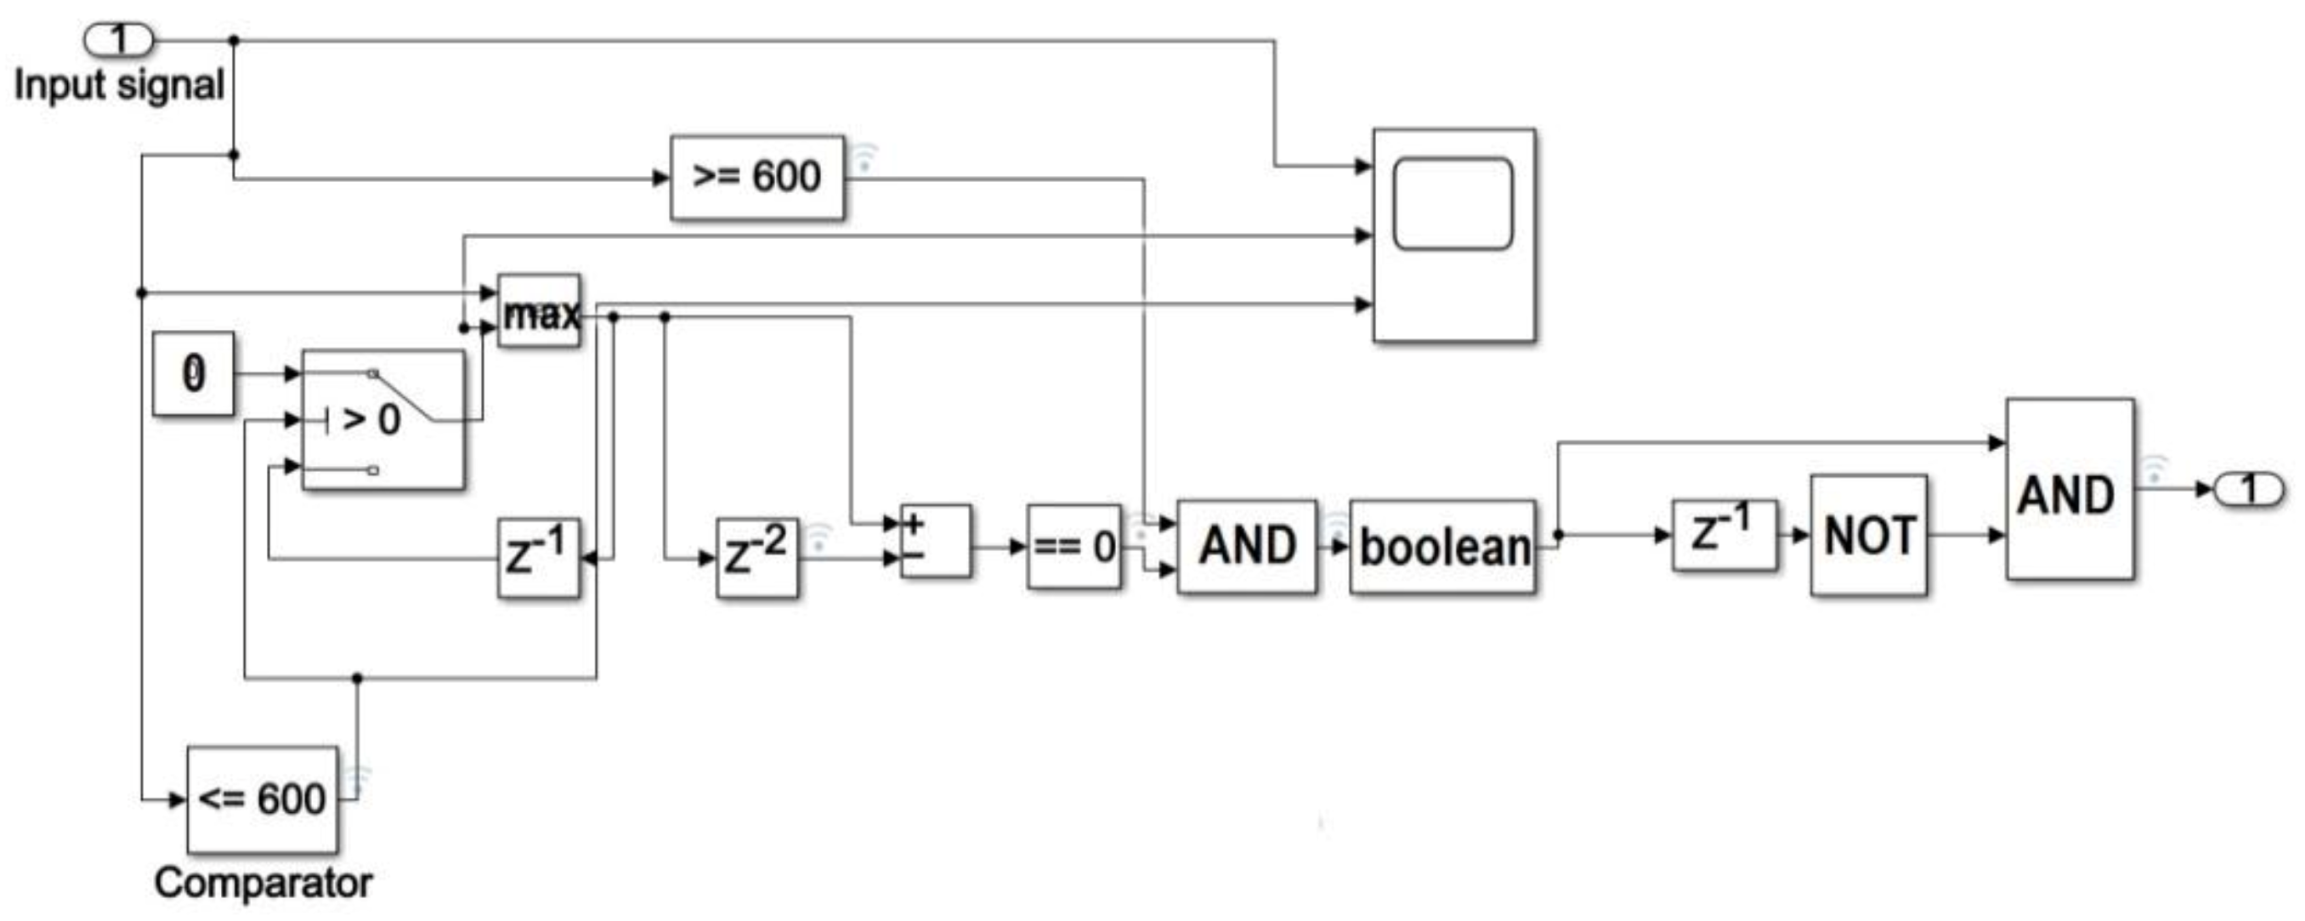
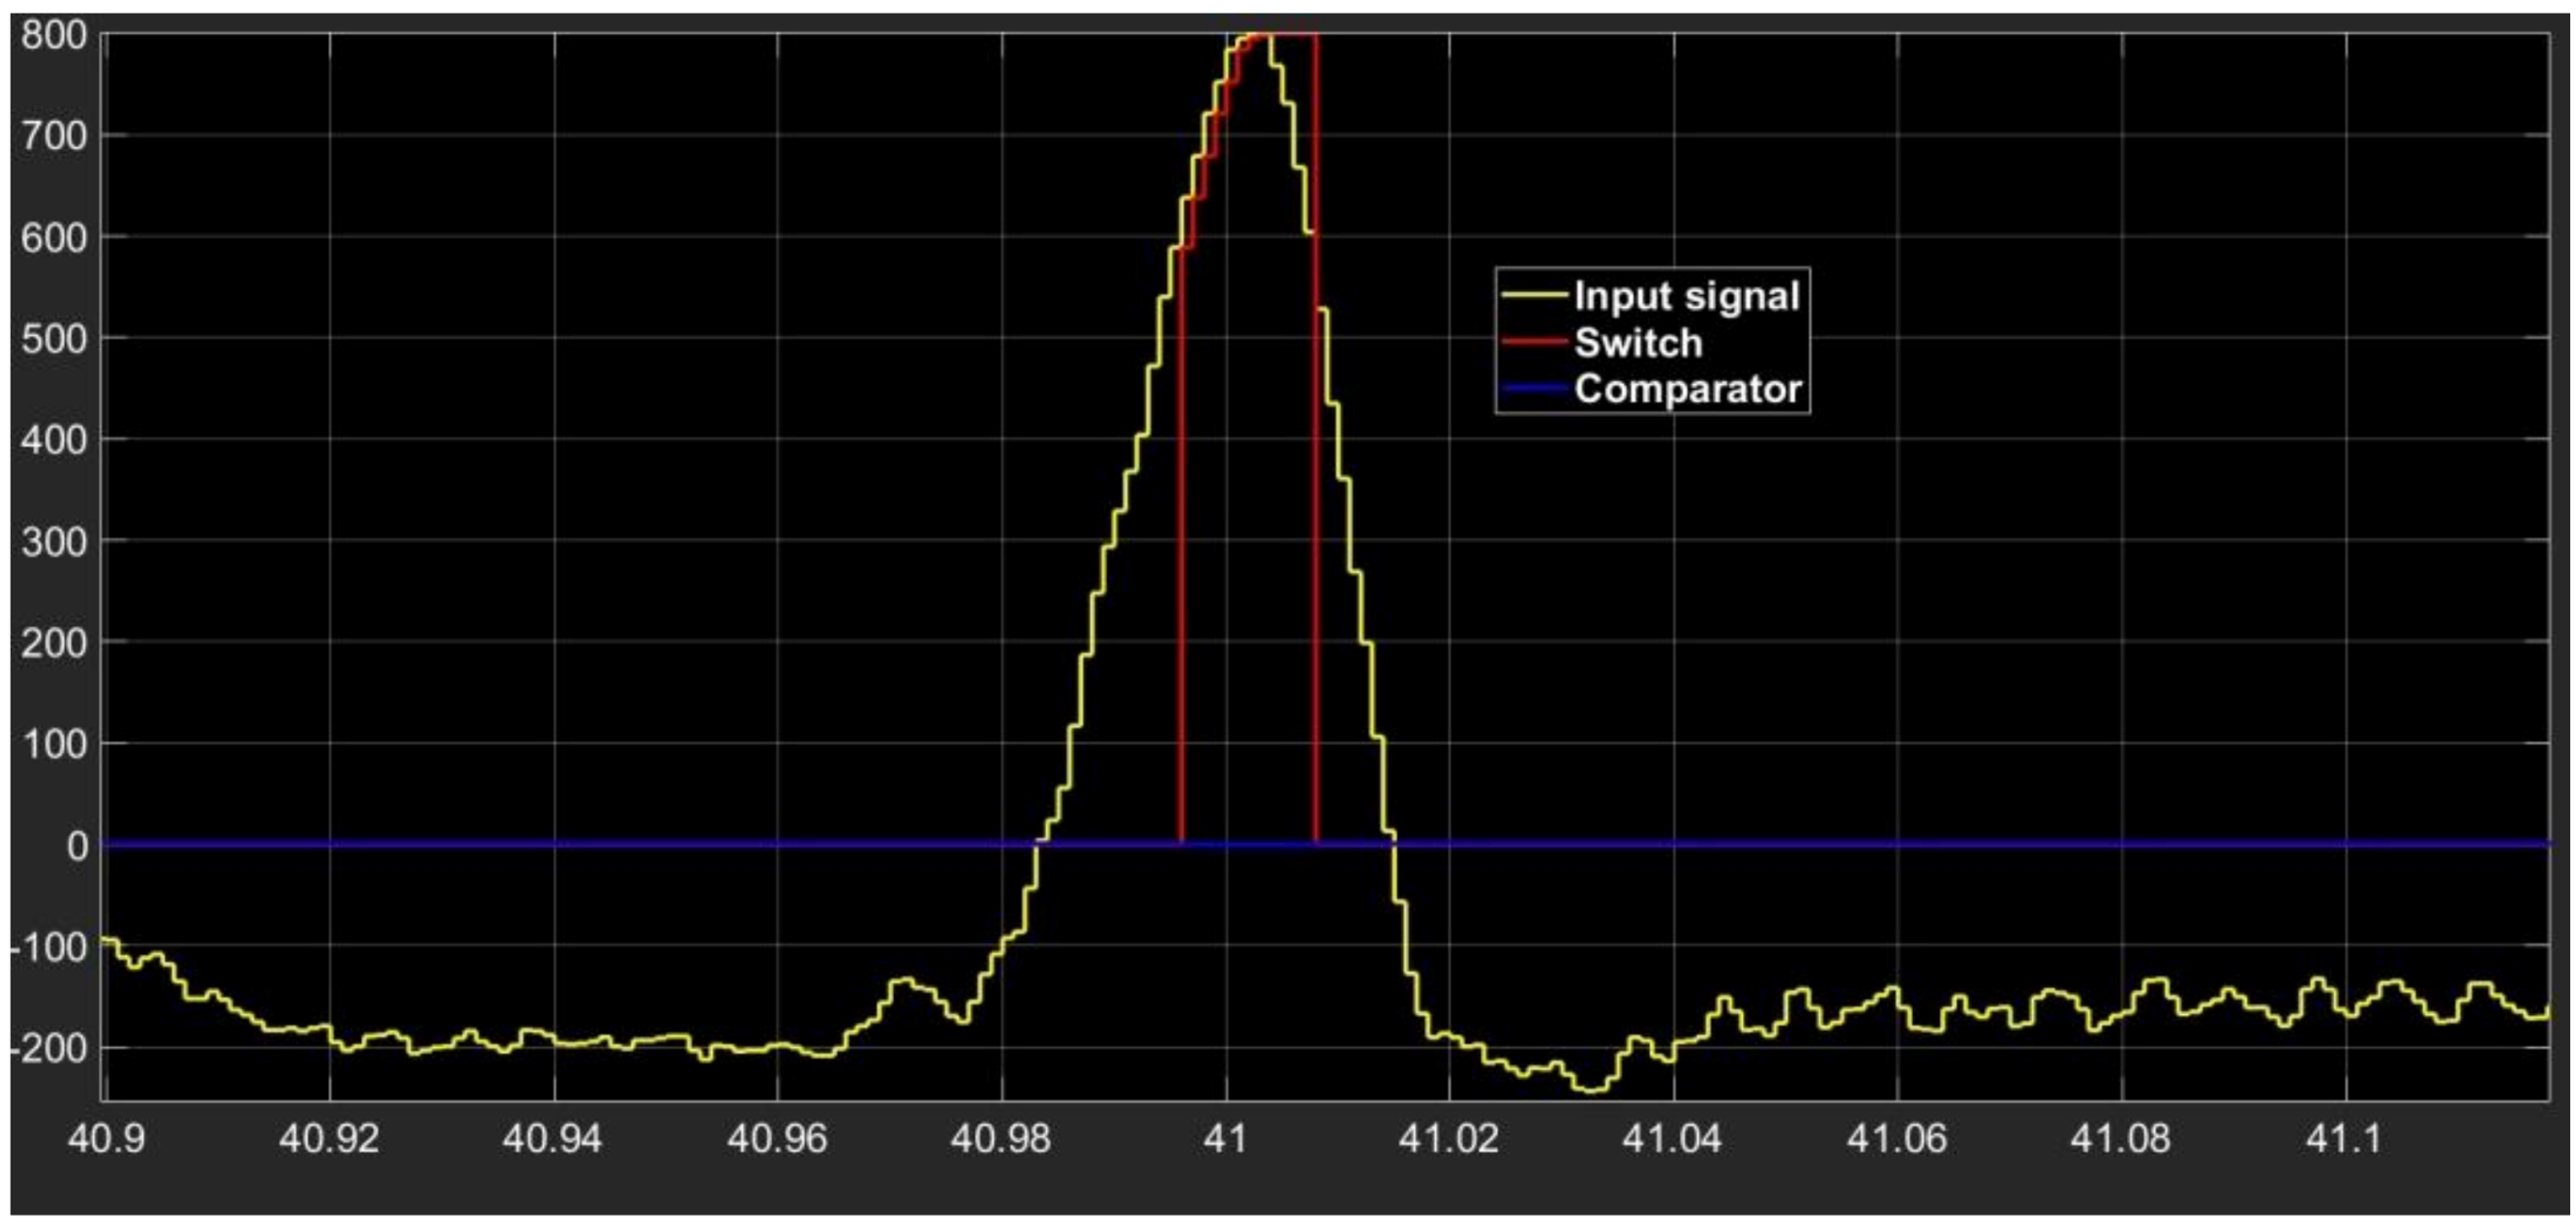
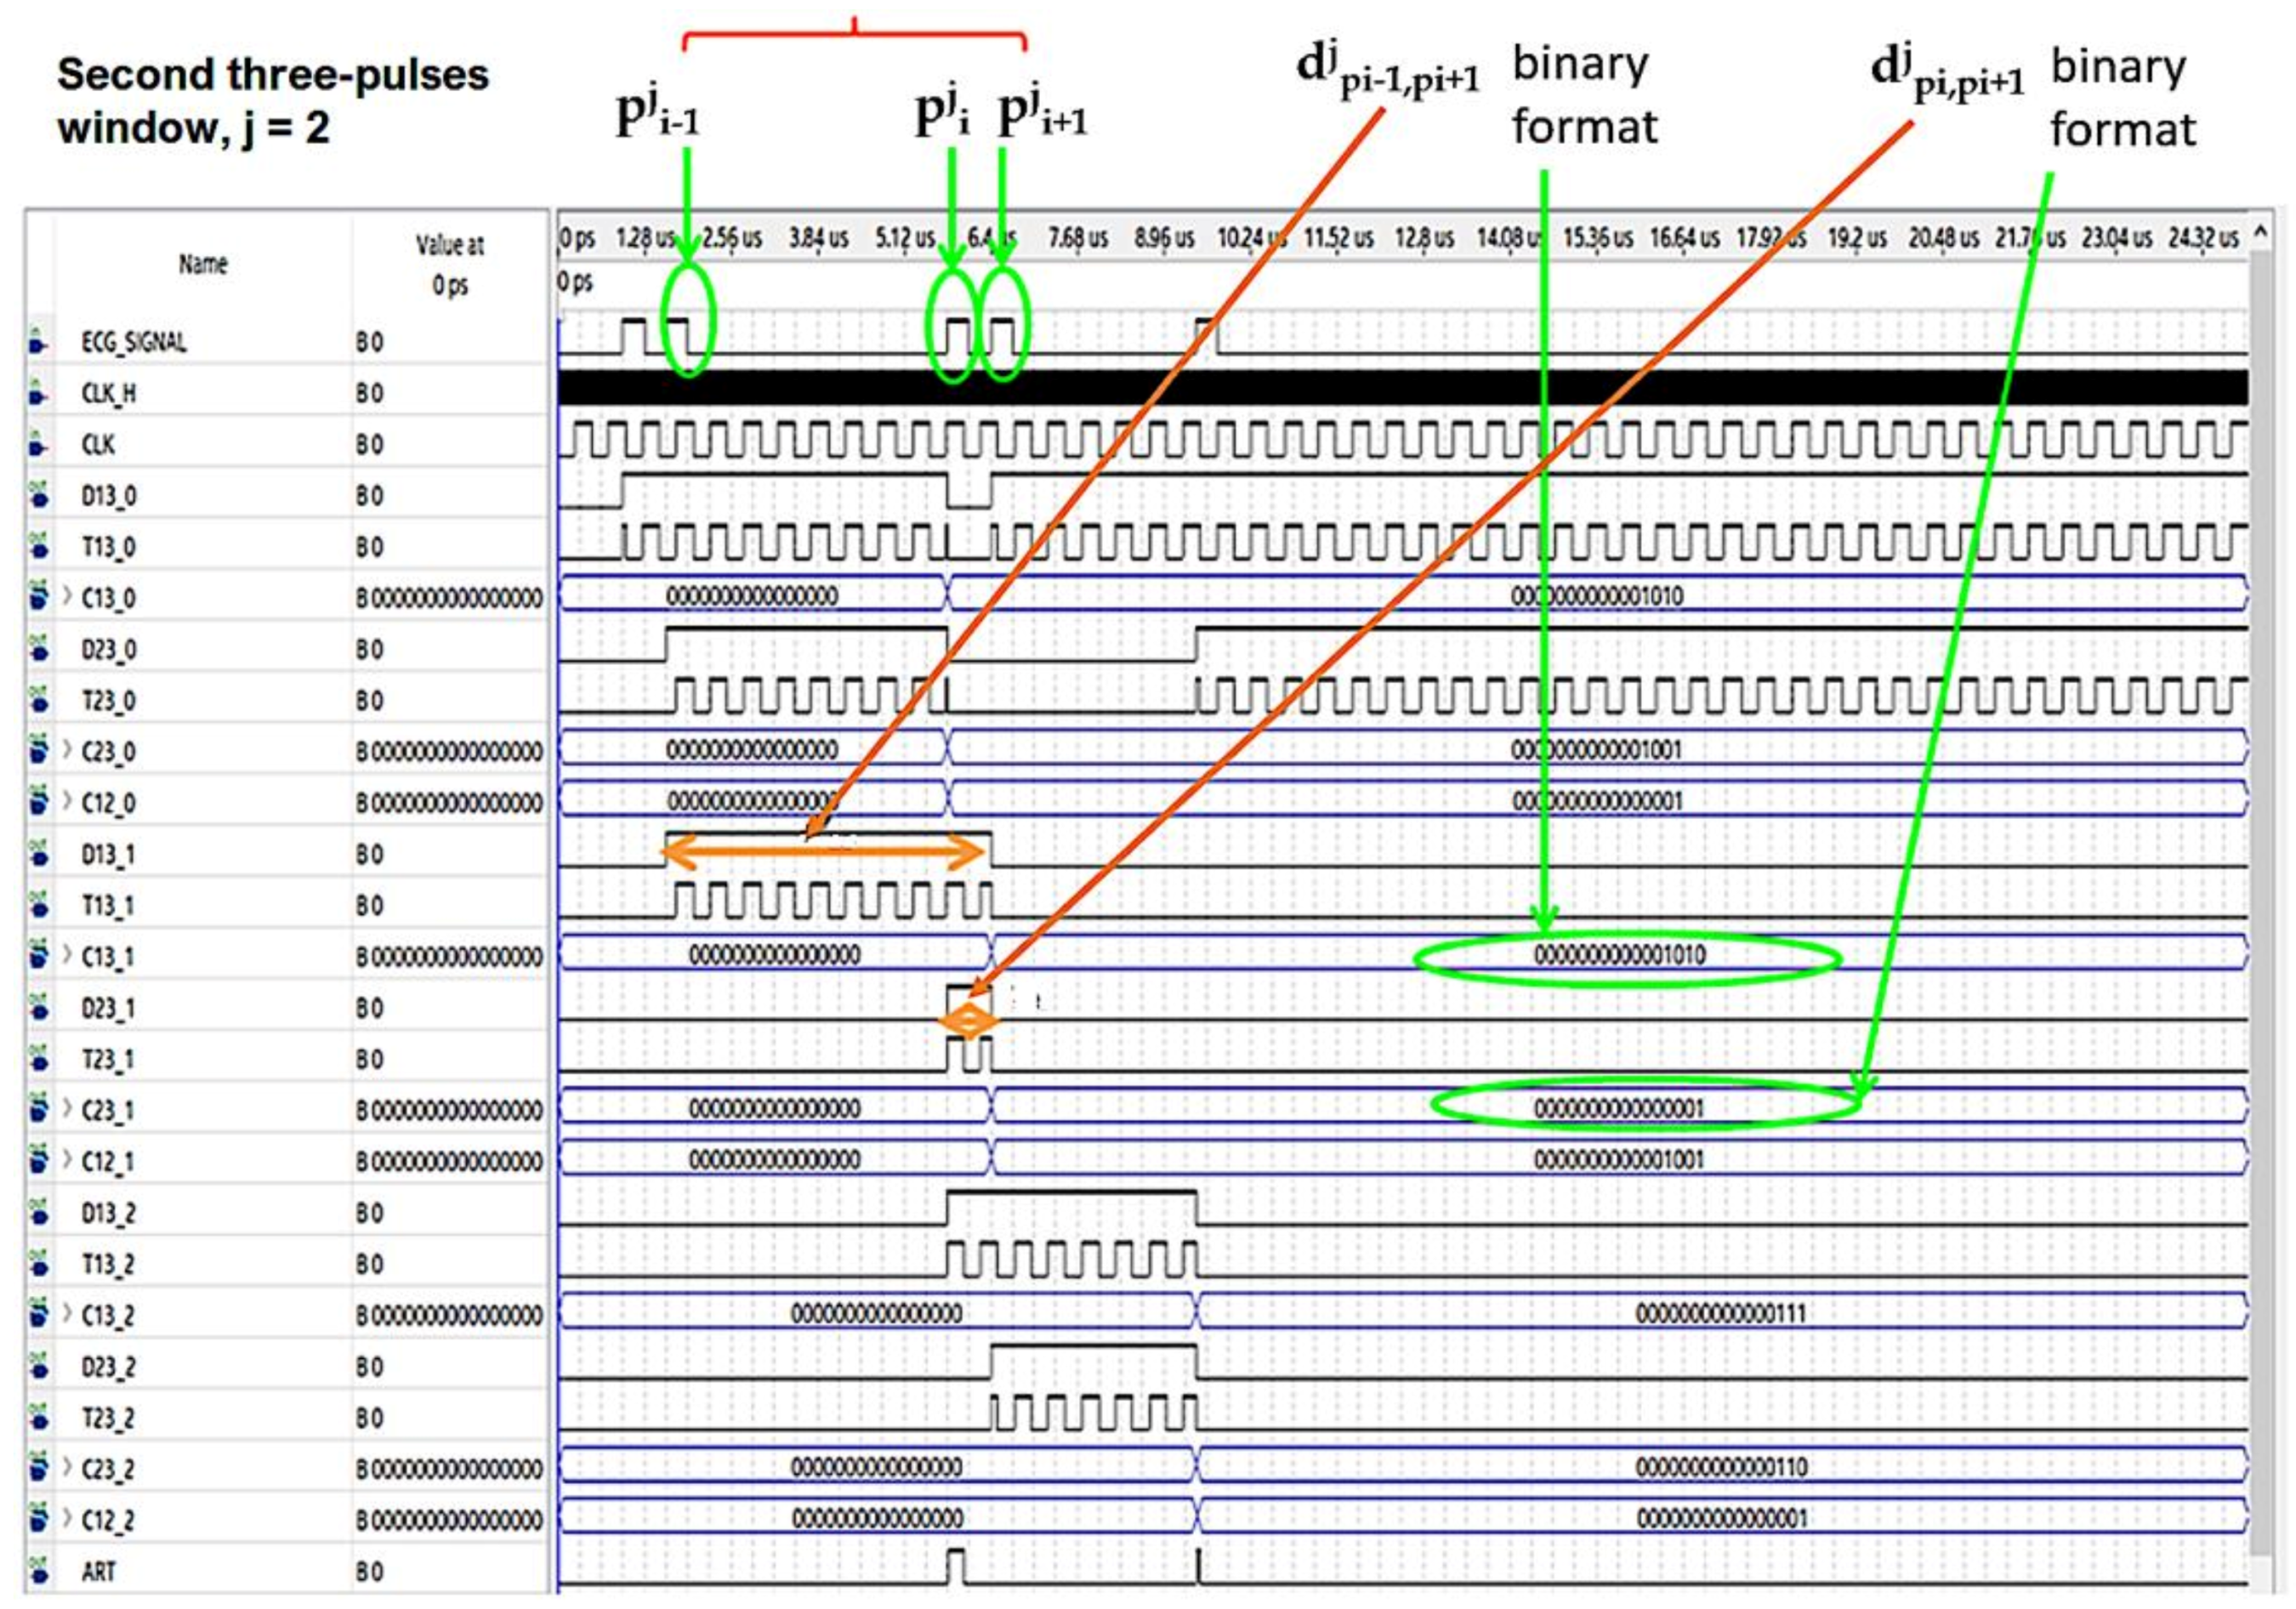
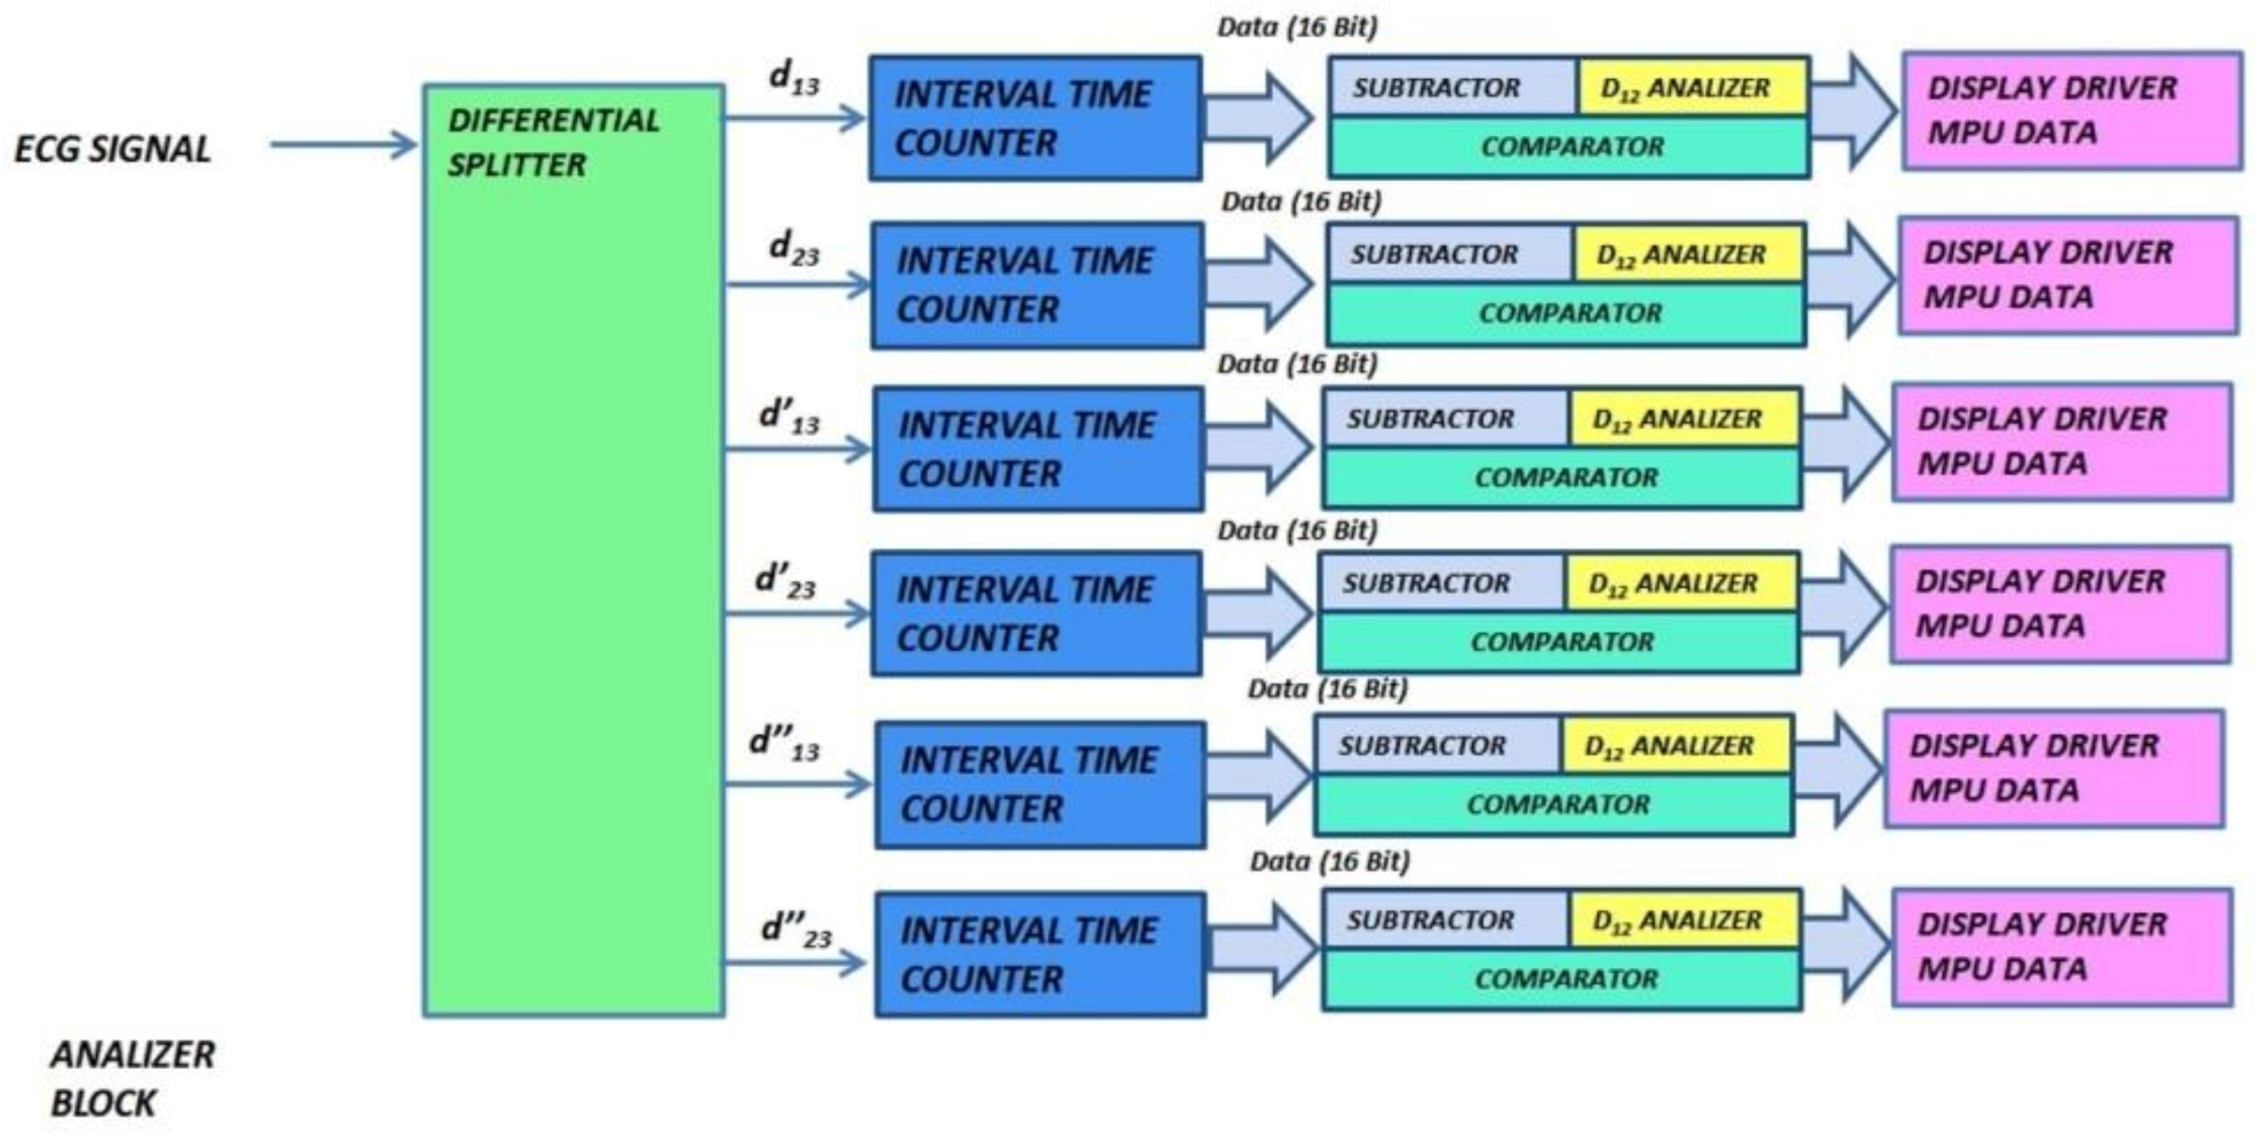
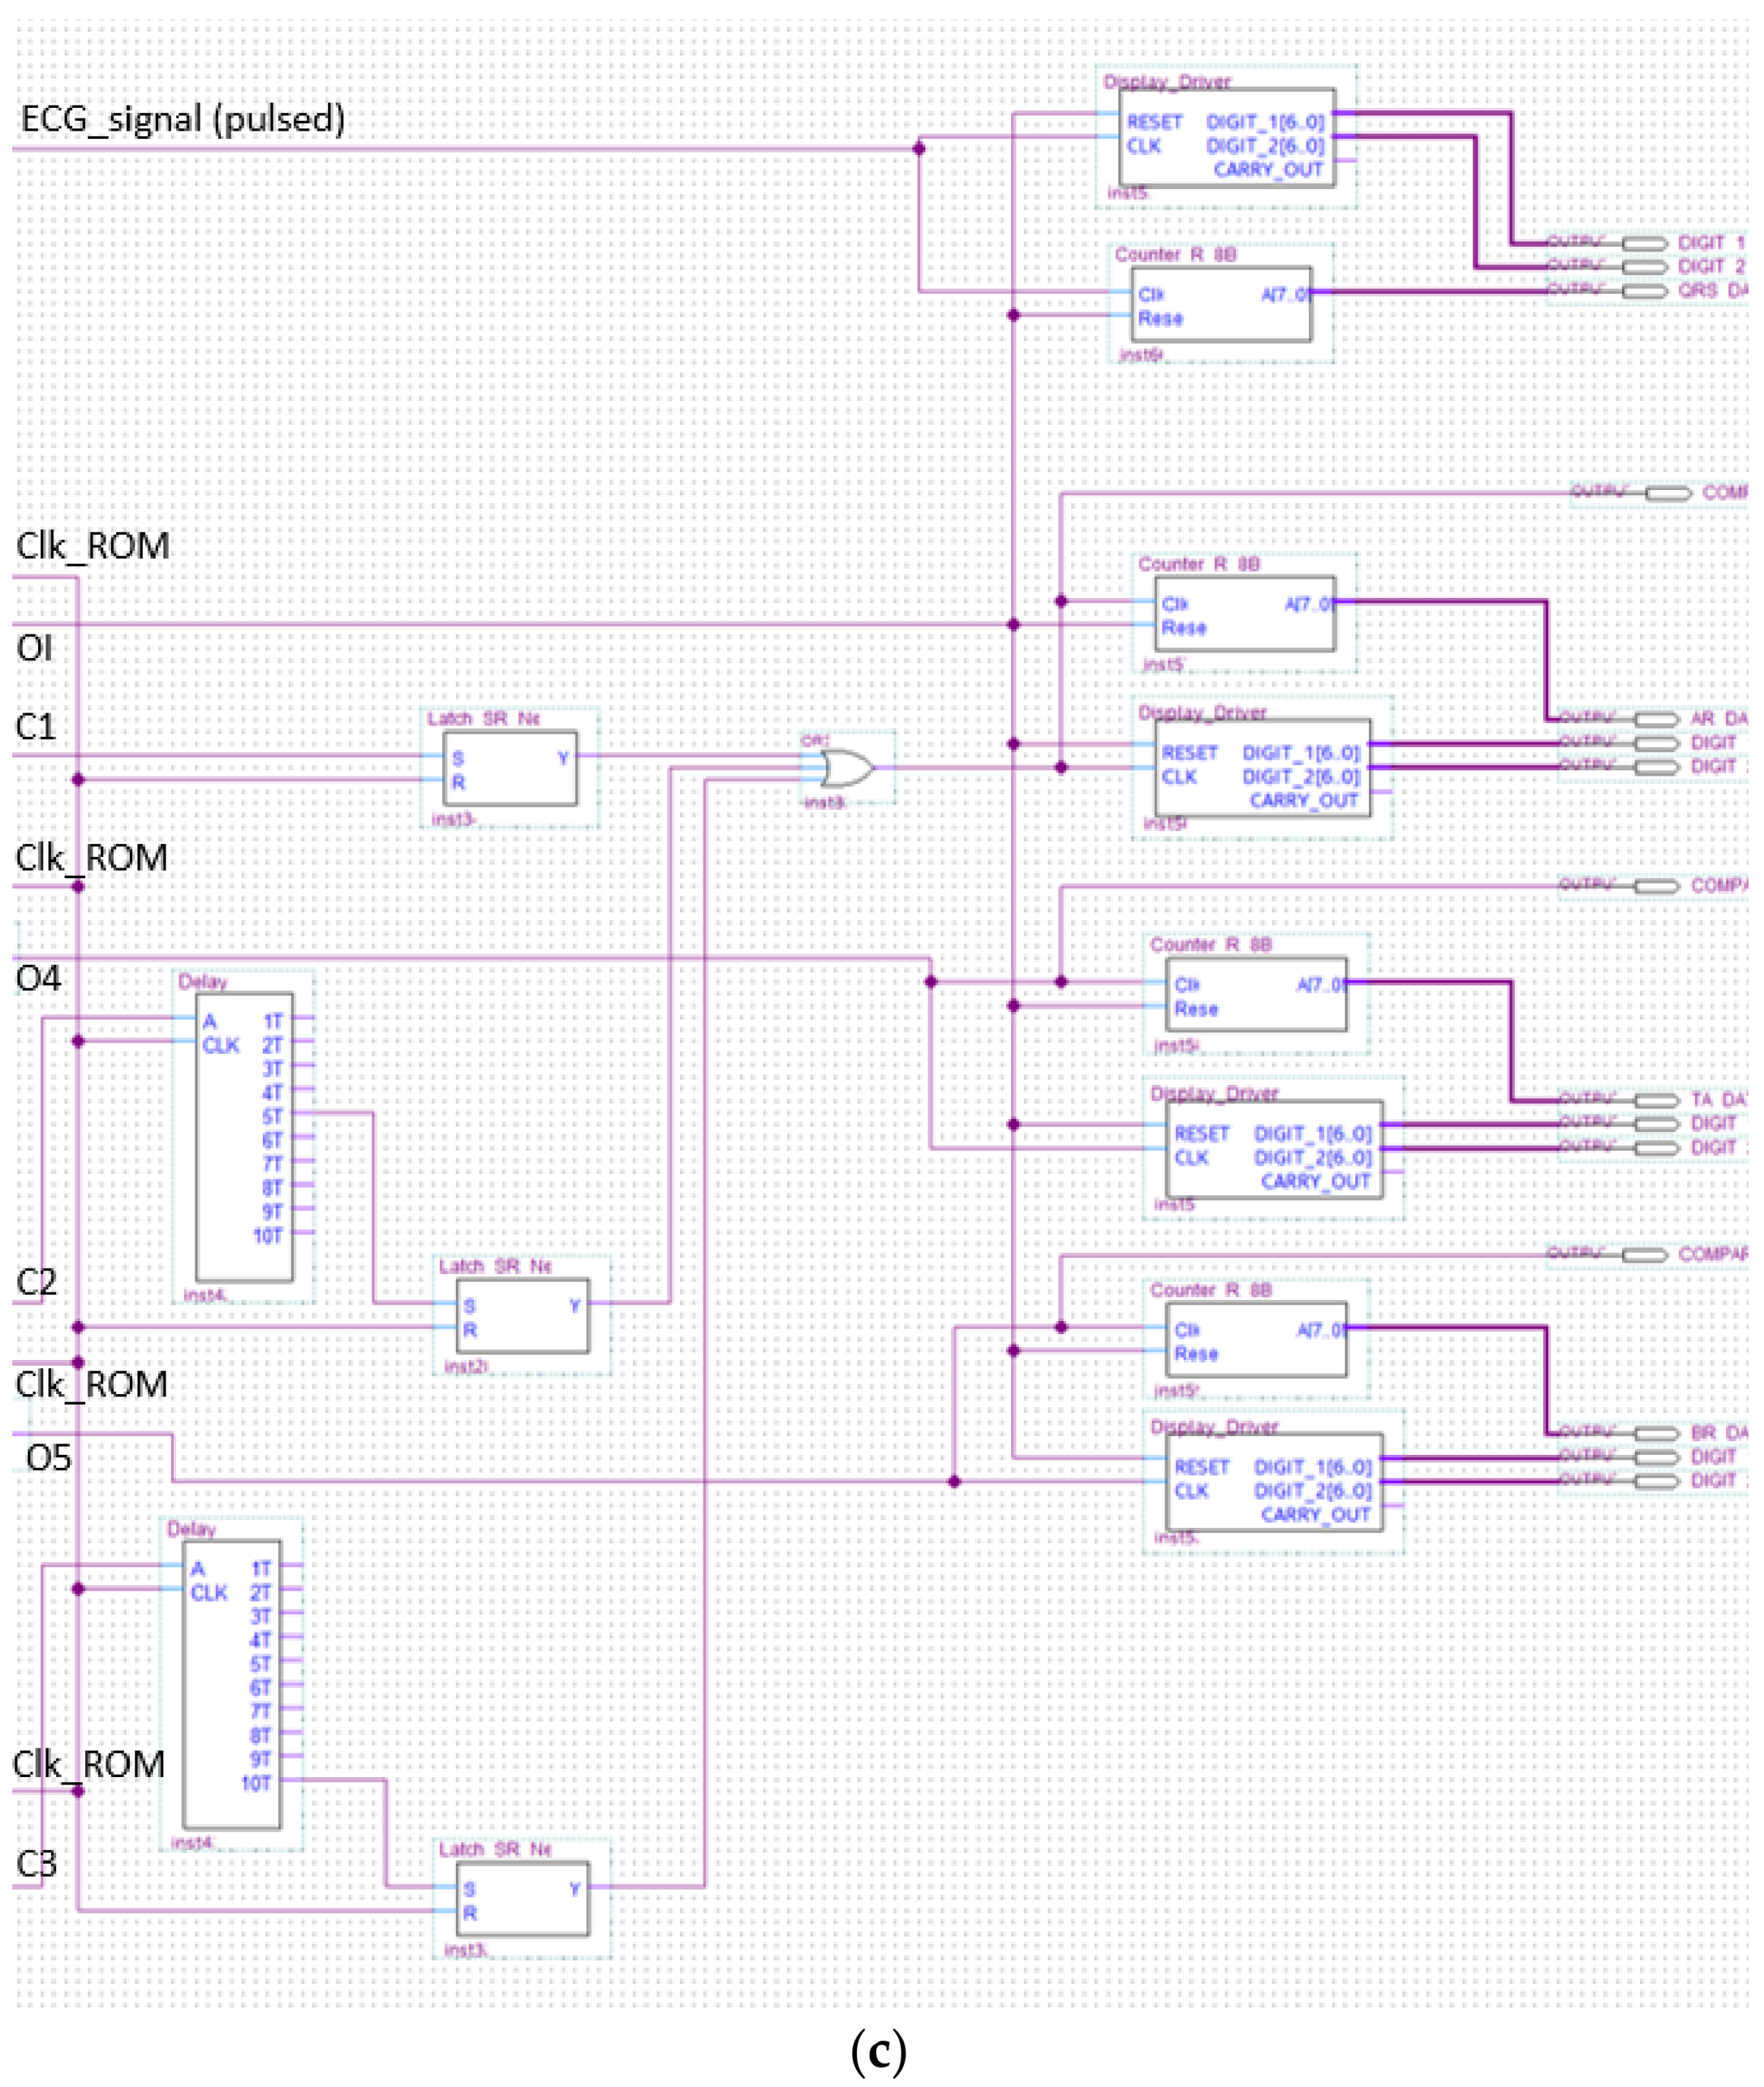
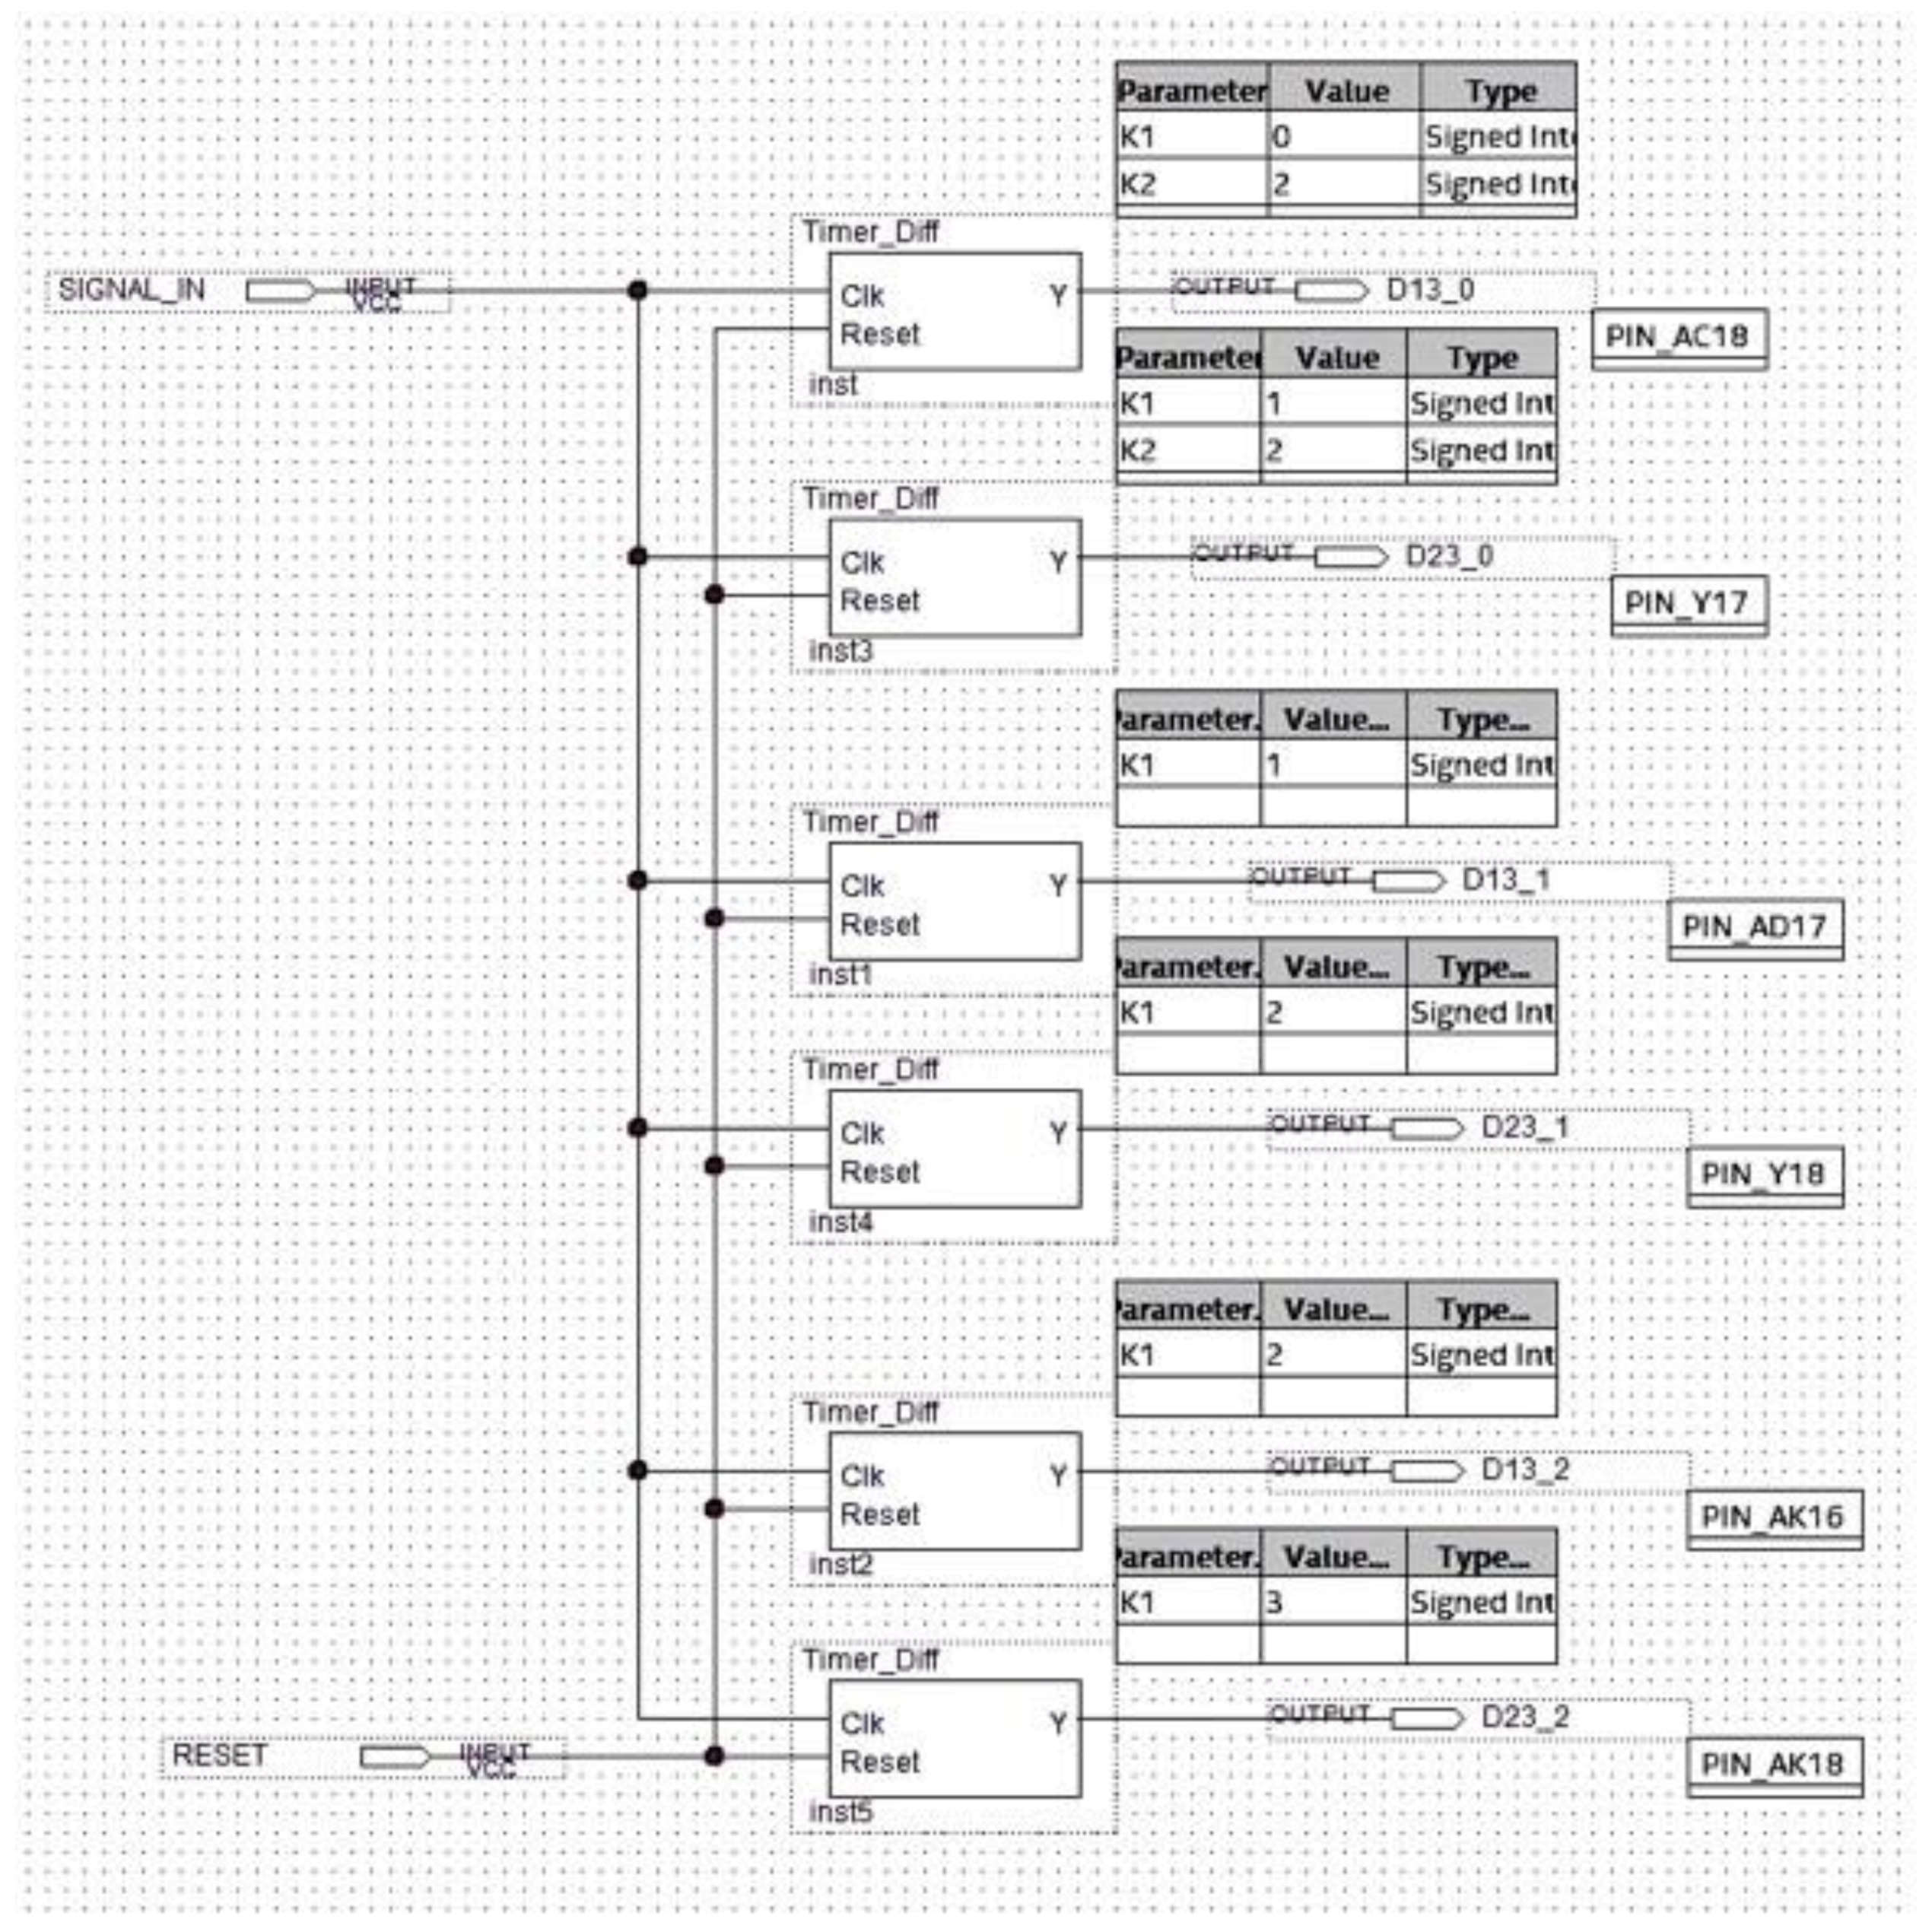
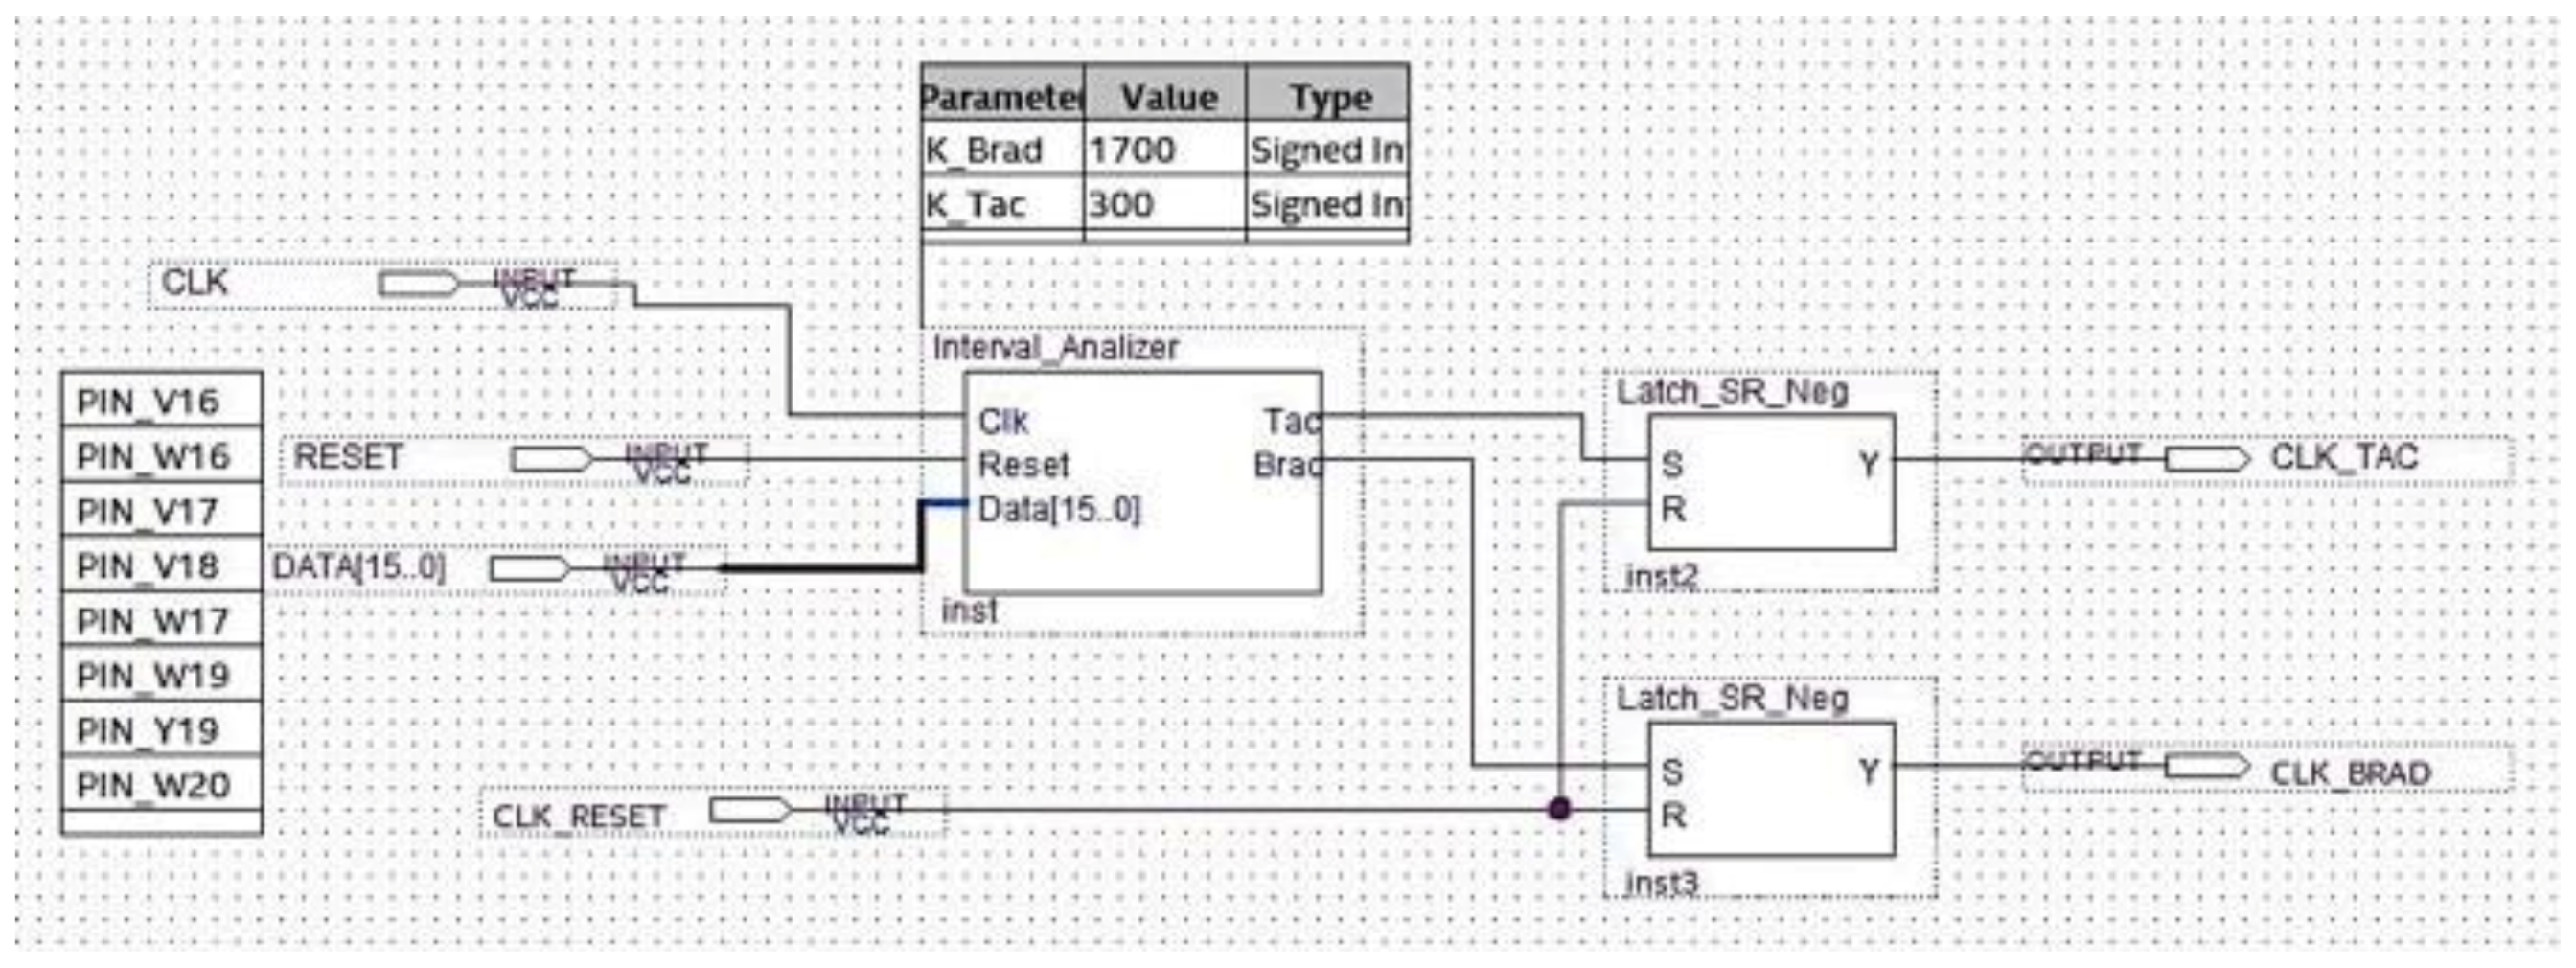
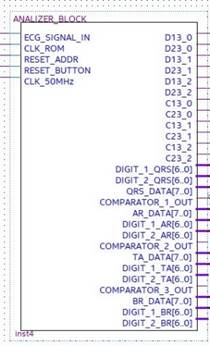
3.2. Analyzer Block Module

The analyzer block module windows the pulsed ECG with a time frame three pulses long and implements the procedure previously indicated in the classification section. Figure 13 and Figure 14 show elements comprising the analyzer module and its schematic, respectively. Figure 14 has been split, in lexicographical order, into three parts for the sake of visualization.
The aim of the differential splitter is both the splitting of the pulsed ECG signal into time frames composed of three consecutive pulses and the definition of the time window, which operates as stated in Section 2.3. The component at issue automatically locks the first pulse and maintains the link with the signal until the ROM locations have been completely scanned (Figure 15).
A reference clock signal at a stable and known frequency was superimposed by means of the Interval_Time_Counter. Distance between pulses was evaluated in terms of the number of clock periods occurring between them. The temporal distance between two ECG pulses was determined by counting the number of the clock periods between the two pulses. The signal generated by the differential splitter was fed into a 2-input AND gate with a reference clock signal (Figure 16). The Interval_Time_Counter counts the pulses of the clock signal obtained with the AND operation. The count result is a distance that is expressed in seconds, converted to a 16-bit binary number, and sent to the subsequent processing blocks.
The logic block making the classification of the detected arrhythmia in bradycardia or tachycardia is implemented and shown in Figure 17. One of the two outputs of the circuit in Figure 17 was set at a high logic value based on the subtractor output.
The schematic of the last block comprising the analyzer is indicated in Figure 18.
The analyzer symbol is indicated in Figure 19 with input and output signals. In particular:
  • ECG_SIGNAL_IN is the pulses-transformed ECG signal coming from the ROM Block in debug mode, otherwise coming from the preprocessing and R-peak detection block in real-time operating mode;
  • CLK_ROM is the input to which the clock generated by the ROM memory block is applied for the system synchronization;
  • Reset_Address is the reset signal provided by the ROM block;
  • Reset_Button is the reset signal sent to the FPGA through a switch of the development board for functional check;
  • CLK_50MHz is the reference signal clock generated by the development board.
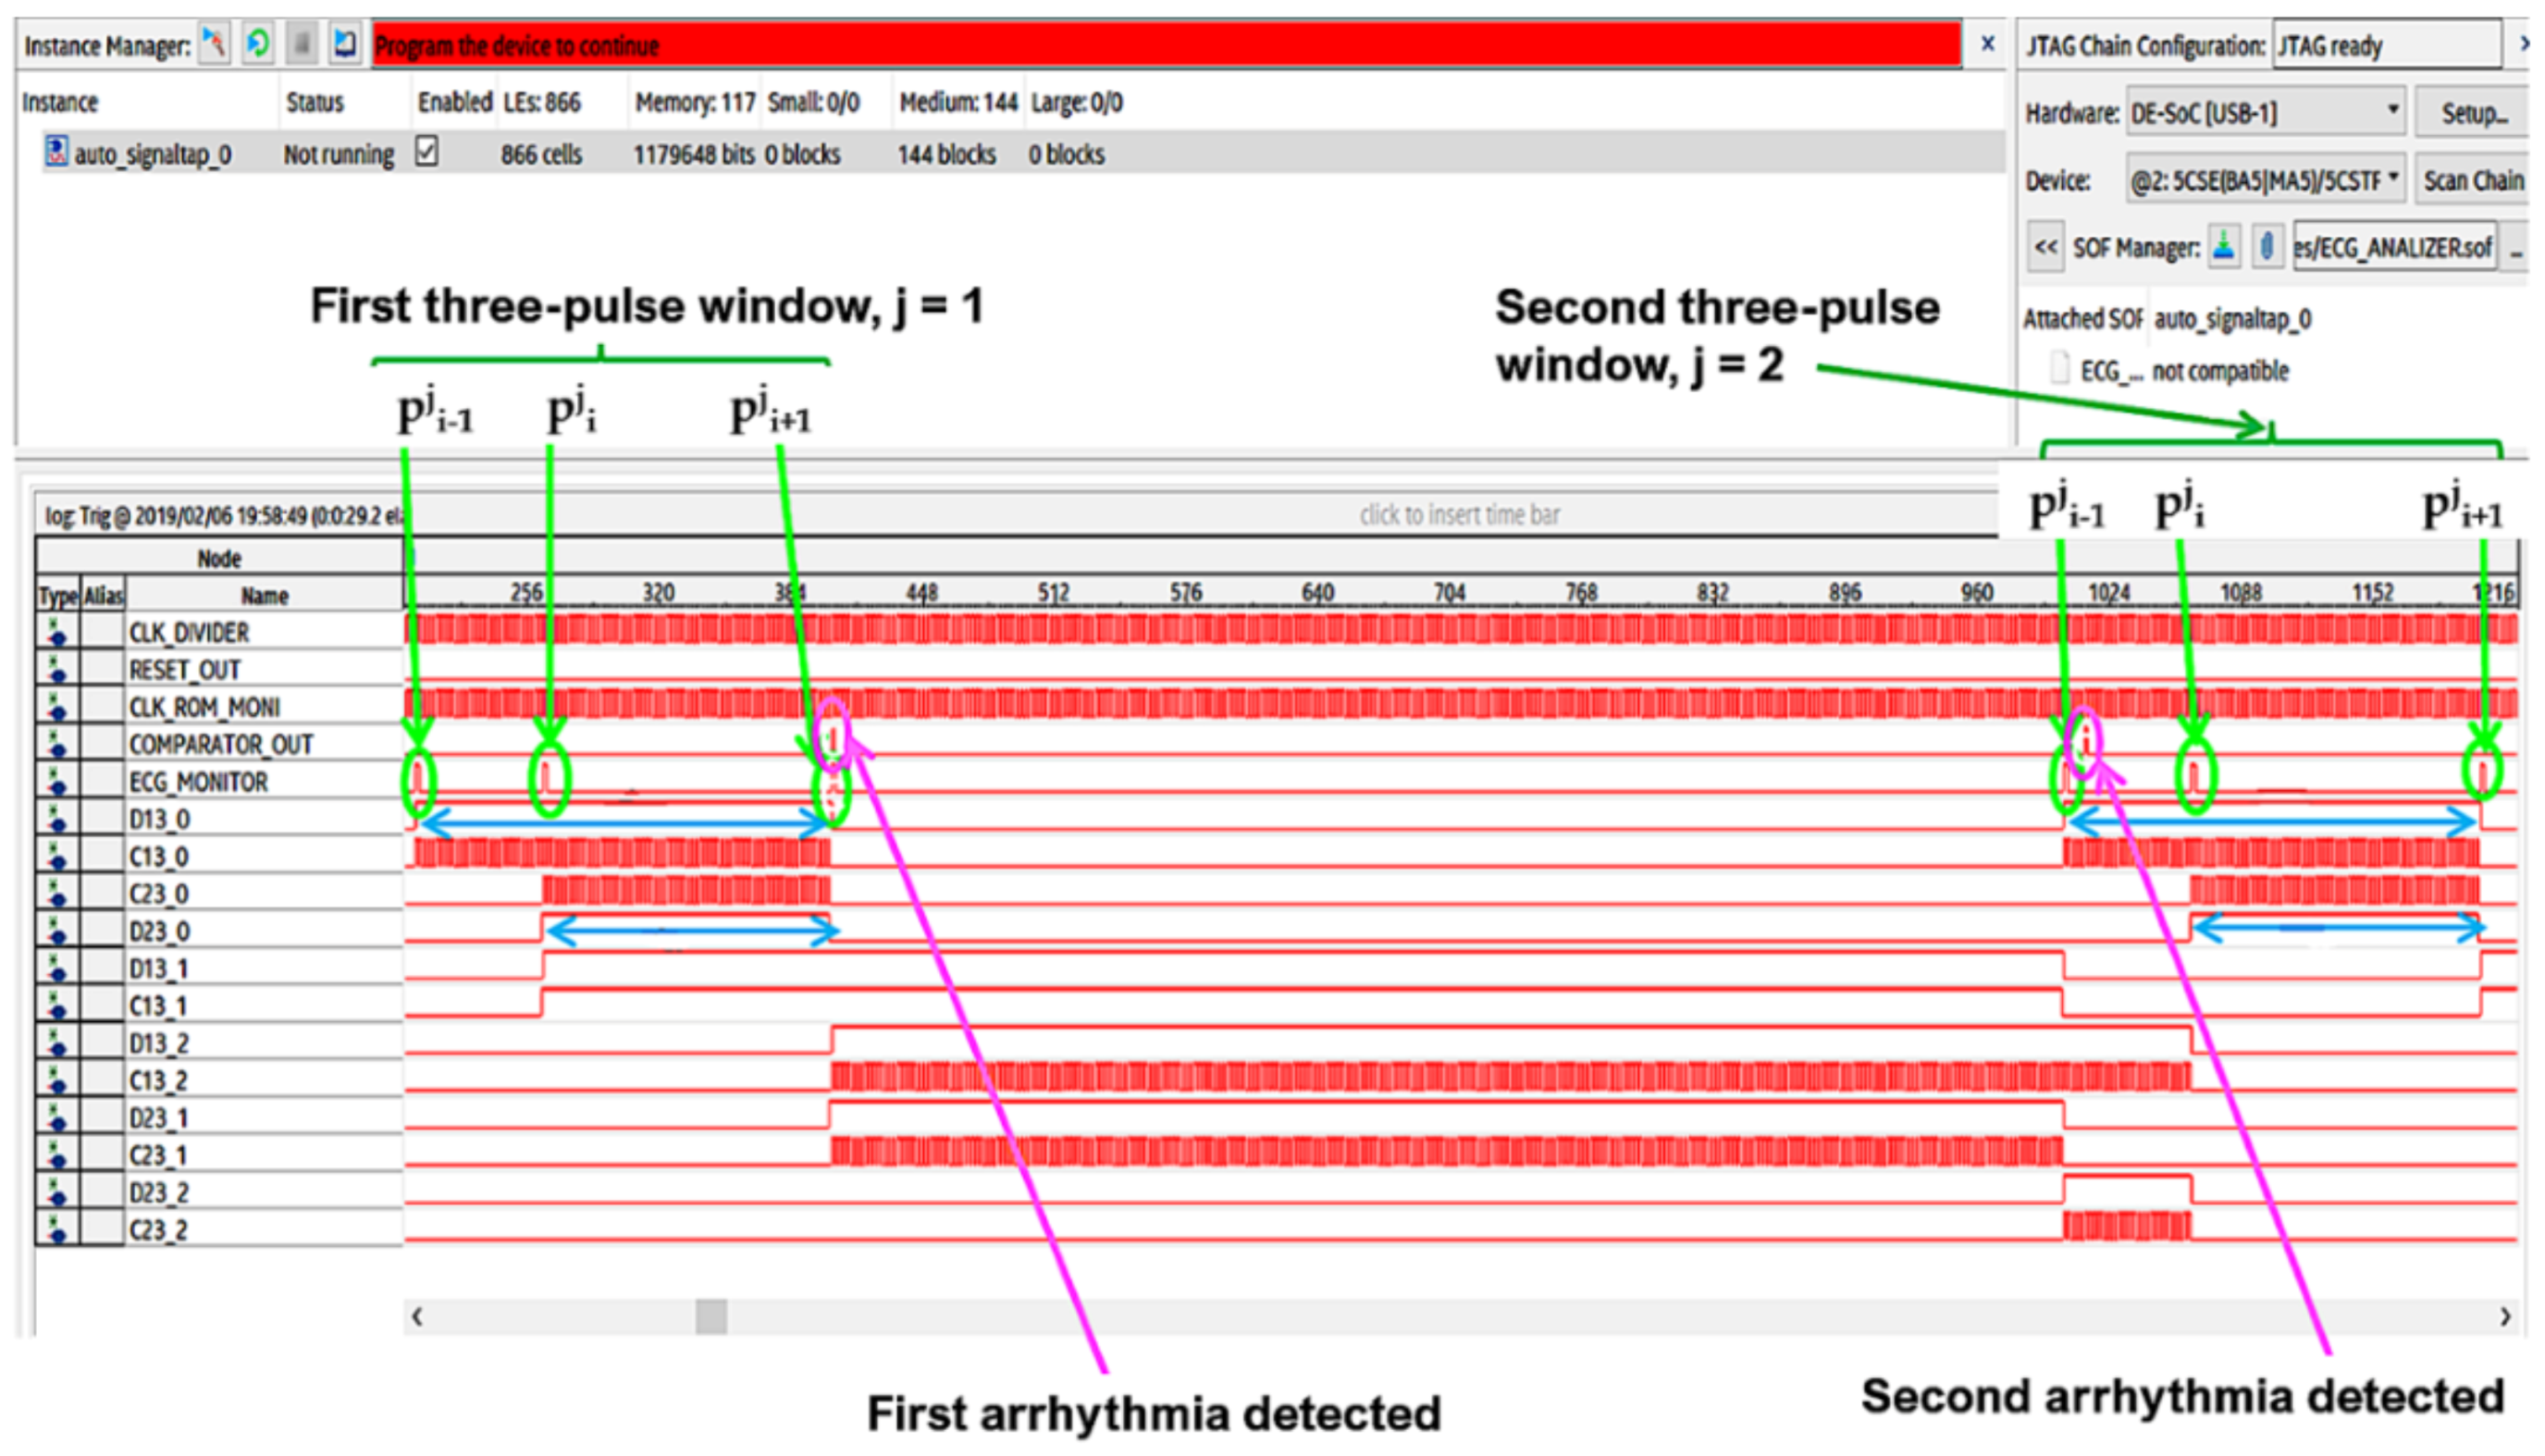
  • D13_0, D13_1, and D13_2 are the signals generated by the differential splitter representing the distances djpi−1,pi+1, dj+1pi−1,pi+1, and dj+2pi−1,pi+1, respectively;
  • D23_0, D23_1, and D23_2 are the signals generated by the differential splitter and representing the djpi,pi+1, dj+1pi,pi+1, and dj+2pi,pi+1, respectively;
  • C13_0, C13_1, and C13_2 are the control signals for instrumental test of the system. They are generated by the Interval_Time_Counter and are expressed in 16-bit format. These signals represent the number of reference clock pulses counted in each window, which are D13_0, D13_1, and D13_2, respectively (that is the clock pulses counted by placing each of the signals D13_0, D13_1, and D13_2 in logic AND with the reference clock);
  • C23_0, C23_1, and C23_2 are also control signals for the instrumental test of the system. They are generated by the Interval_Time_Counter and are expressed in 16-bit format. They represent the number of reference clock pulses counted in each window D23_0, D23_1, and D23_2, respectively (that is the clock pulses counted by placing each of the signals D23_0, D23_1, and D23_2 in logic AND with the reference clock);
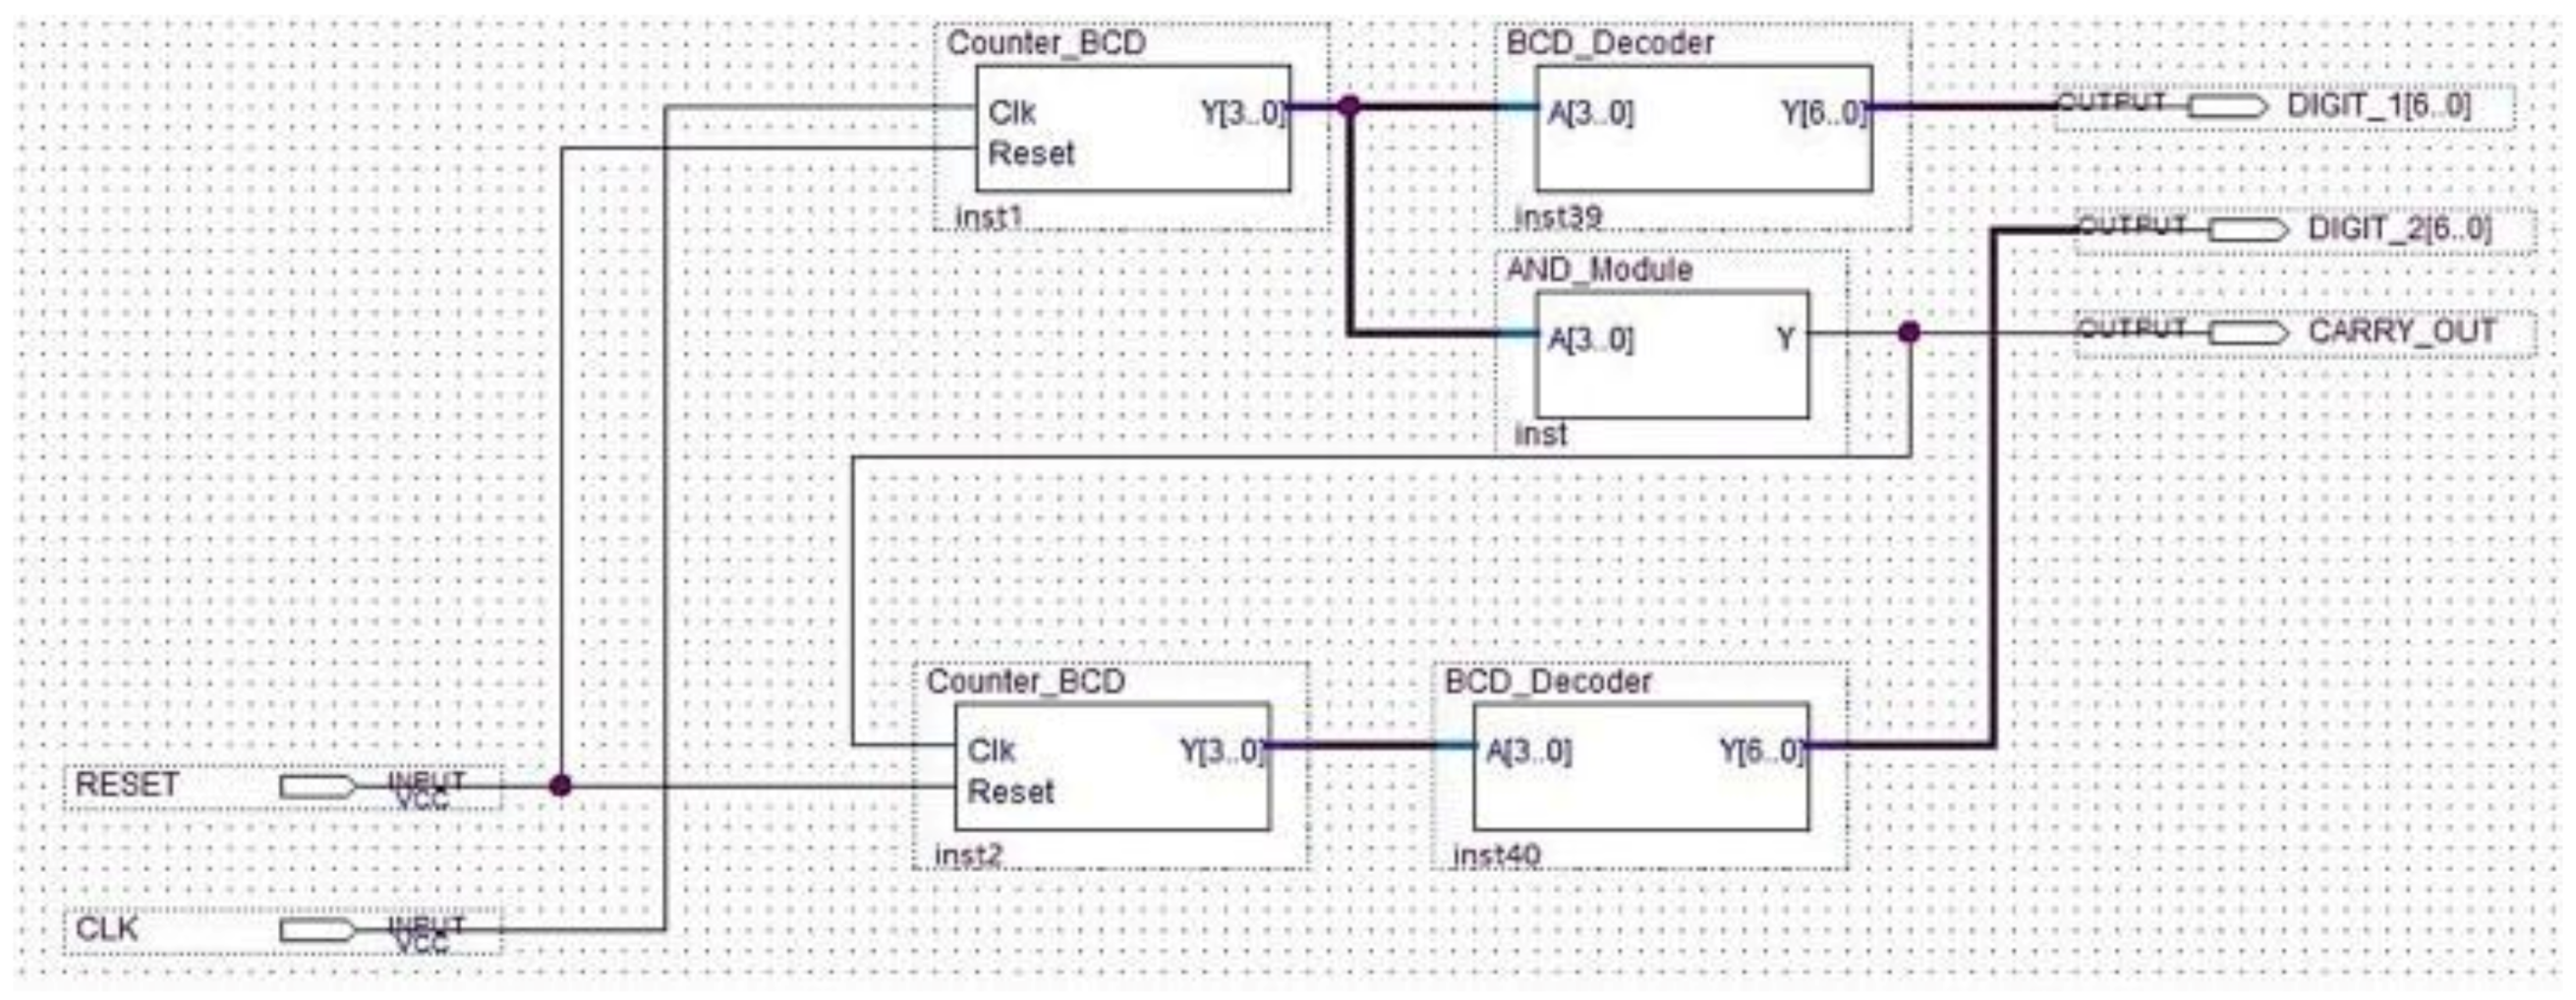
  • DIGIT_1_QRS [6..0] and DIGIT_2_QRS [6..0], DIGIT_1_AR [6..0] and DIGIT_2_AR [6..0], DIGIT_1_TA [6..0] and DIGIT_2_TA [6..0], and DIGIT_1_BR [6..0] and DIGIT_2_BR [6..0] indicate the number of QRS, of arrhythmic, of tachycardic, and of bradycardic heartbeats detected, respectively. They are coded in binary-coded decimal (BCD) and visualized on the seven-segment display of the development board;
  • QRS_DATA [7..0], AR_DATA [7..0], TA_DATA [7..0], and BR_DATA [7..0] are the 8-bit digital outputs that transmit the number of detected QRS, of arrhythmic, of tachycardic, and of bradycardic heartbeats to the data logger created with the FPGA-embedded processor;
  • COMPARATOR OUT 1, 2, 3 are the output signals of the comparator inside the analyzer block, which are used as functional test outputs.

3.3. MCU Block

The microcontroller unit (MCU) data logger implemented inside the designed hardware is a functional block based on the selected FPGA soft or hard embedded processor. It performs calculations for diagnosis purposes (i.e., the PE risk, the QTc, and the QTc lengthening) and communicates with external peripherals, such as a personal computer displaying messages for debug purposes (for example log messages, arrhythmias warnings, number of pathological events counted, auto diagnosis results, etc.) [46]. Toward this aim, the MCU block is equipped with some PIOs (pin input/output). An adoption of interrupts is also avoided for real-time operation because the involved signals are slowly varying

4. Implementation of the FPGA-Based Embedded System

The FPGA CYCLONE V 5CSEMA5F31C6 by INTEL was adopted for system development [47]. The design was deployed on a DE1_SoC development board by TERASIC for test and debug purposes [48]. Our design environment was Quartus Prime by Intel/Altera [49]; however, it was portable on any FPGA foundry and development environment. The tool Platform Designer integrated in Quartus IDE was used for the MCU block implementation, while the Eclipse environment was selected for NIOS II firmware development. The PIOs were read by using the “altera_avalon_pio_regs.h” library and were sent to the NIOSII console in string format through the JTAG UART.
For debug purposes, the system input was the ECG signal preprocessed and made impulsive by positioning a unit pulse in correspondence of each detected R peak. The signal was loaded in the ROM memory block. The 50 MHz operating clock provided by the DE1_SoC evaluation board was selected.

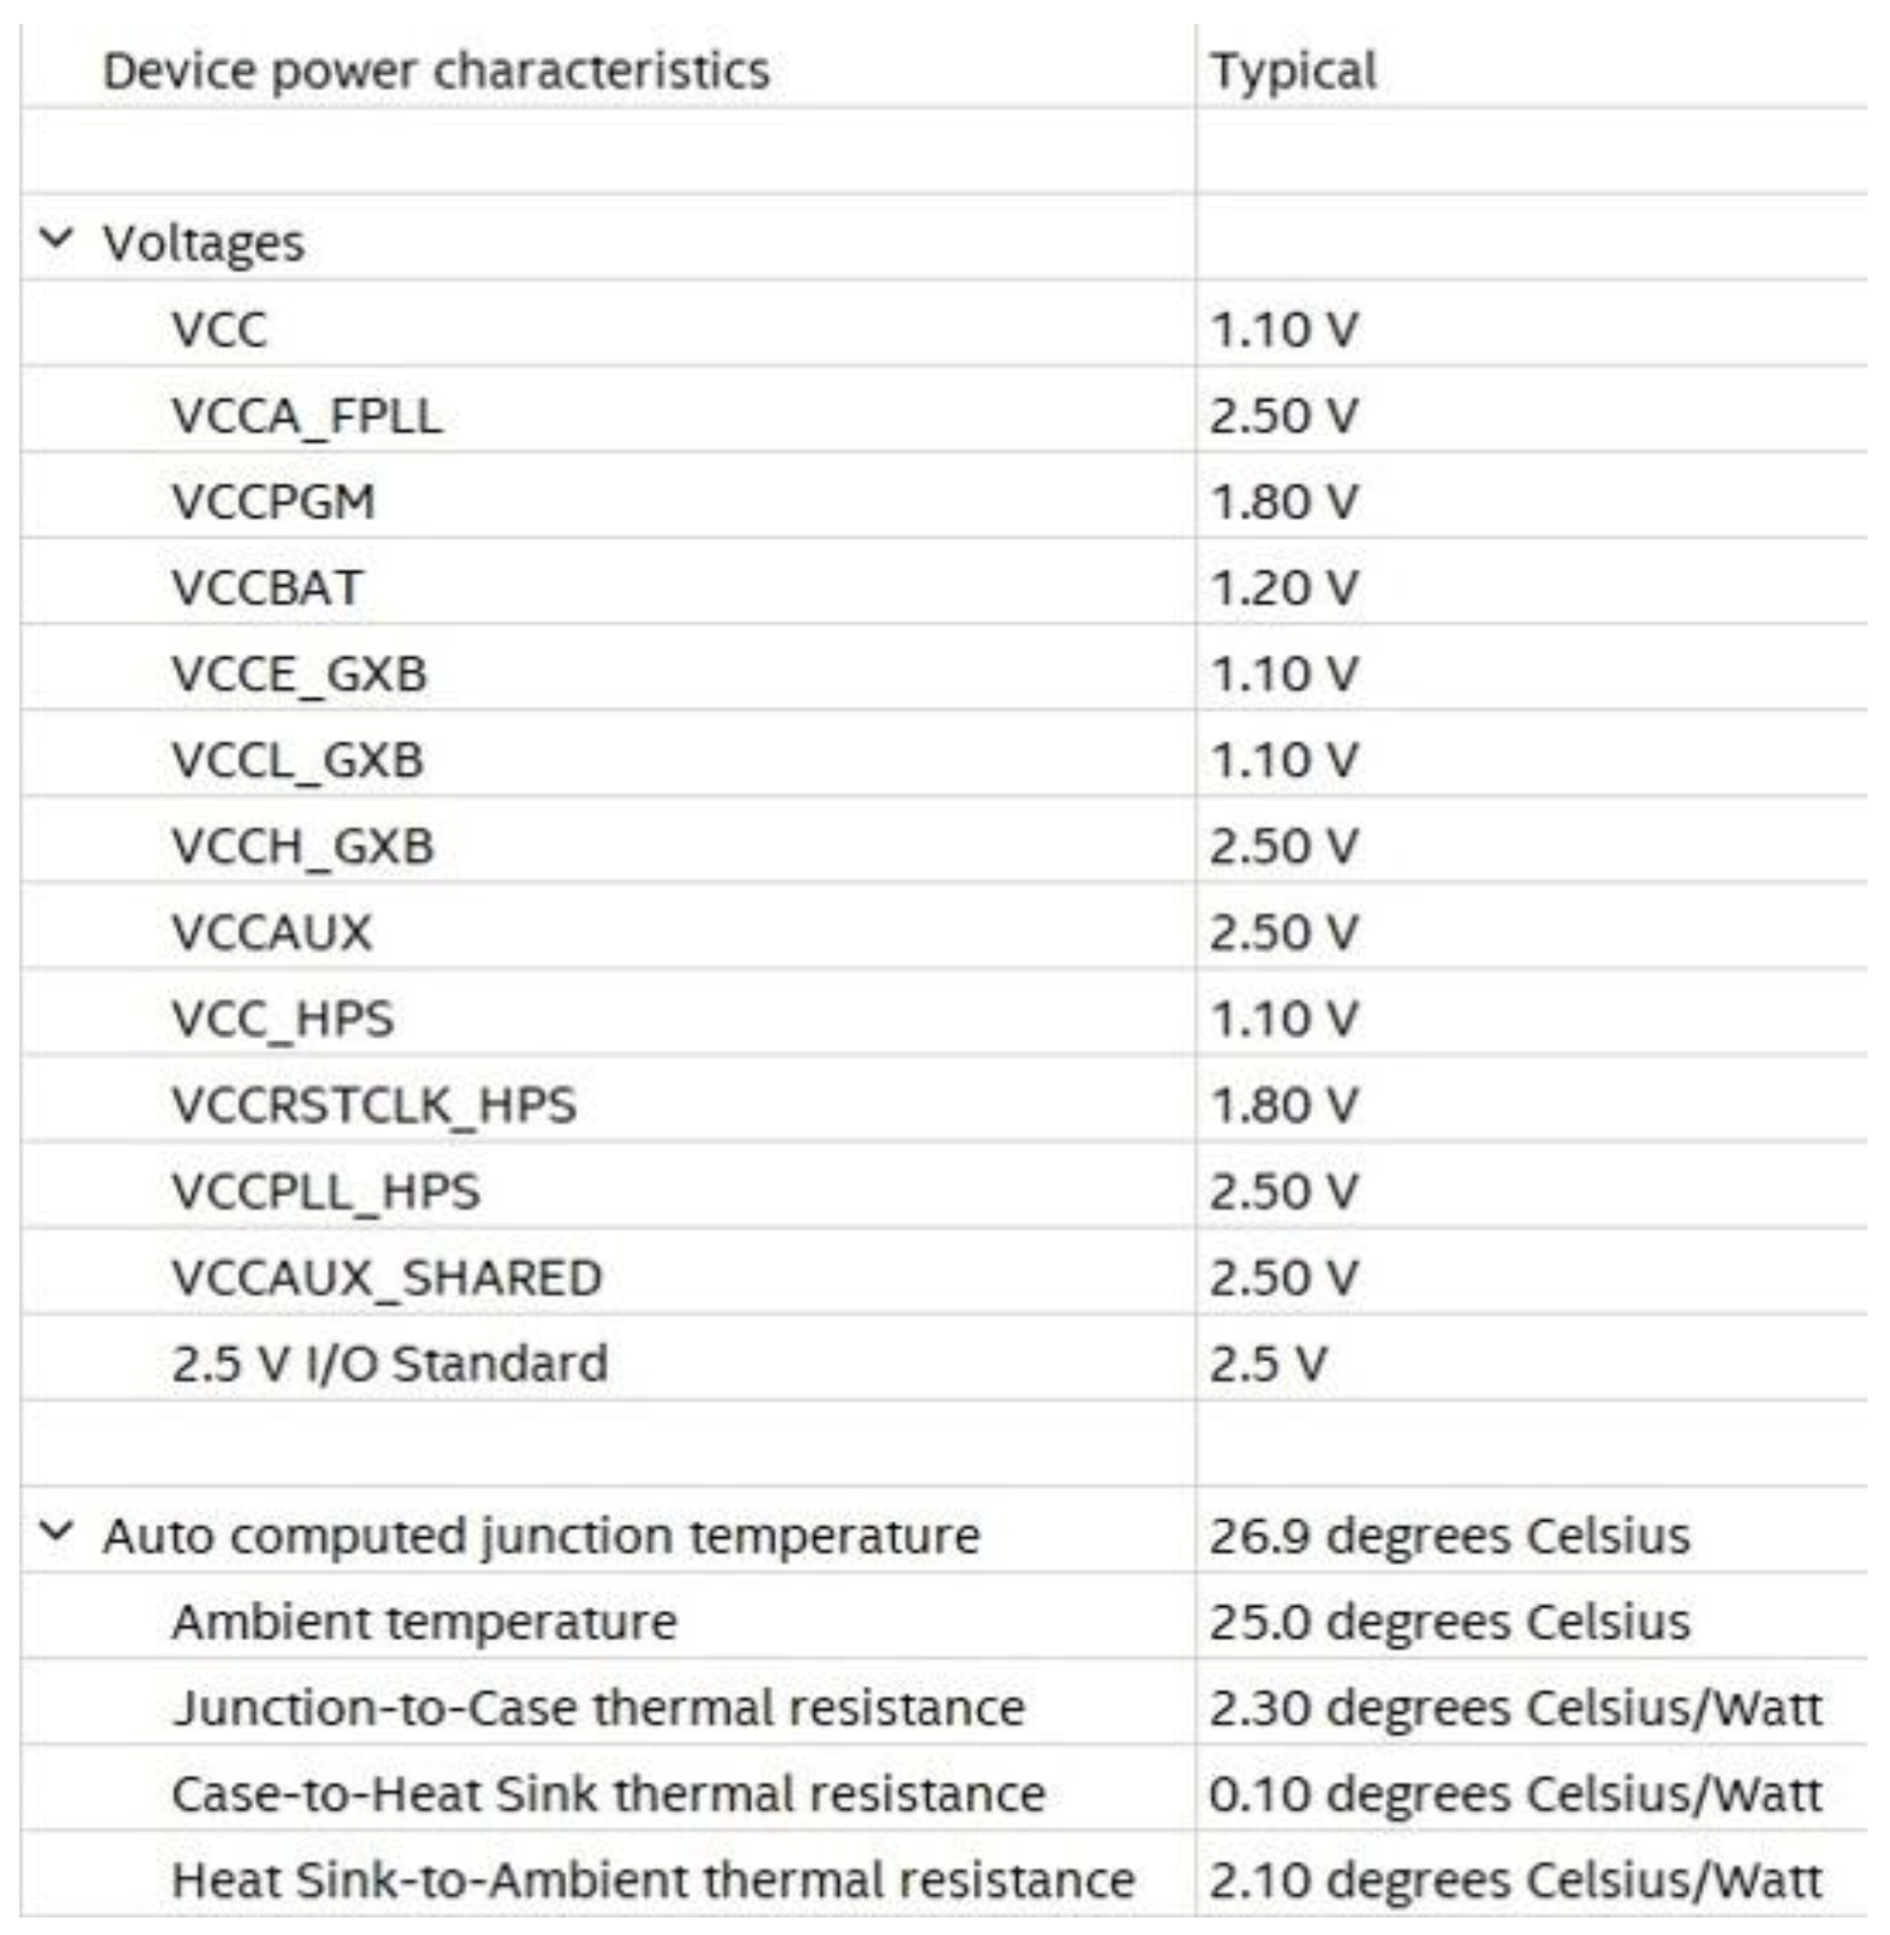
Efficiency of HW Design

For the designed FPGA-based system, the HW efficiency was quantified in terms of:
Area occupancy and or amount of used hardware resources;
Operating speed;
Power consumption due to the system processing activity.
The implemented system occupies about 6% of the FPGA ALMs resources of the selected chip. Therefore, a good efficiency in terms of area consumption was achieved.
The timing performance was evaluated by the Timequest Timing Analyzer tool embedded in Quartus environment. The maximum operating frequency of the system clock is 1 GHz, which is far higher than the ECG signal processing needs. In fact, the sampling frequency of 1 kHz characterizes the ECG. Moreover, a positive slack was obtained, which ensures the fulfilment of timing requirements.
For power consumption and thermal power dissipation statistic evaluation, the power analyzer tool operating in post-fitting mode was adopted. This tool is powered by INTEL in the Quartus environment. Operating settings and conditions in terms of voltage and temperature are shown in Figure 20.
Adopting a power supply of 1.1 V, dynamic and static currents equal to 5.21 mA and 51.56 mA were drawn, respectively, resulting in 5.70 mW and 413.65 mW of FPGA dynamic and static power dissipation, respectively.

5. Results

5.1. Evaluation Parameters

The performance of our decision support system is evaluated by accuracy. In particular, the following expression is used [50]:
A c c u r a c y   ( A C ) = T P + T N T P + F P + T N + F N
where TP (true positive) is the number of positives that are correctly identified as such (for example the number of arrhythmic ECG signals correctly classified). FN (false negative) is the number of positives that are classified as negatives (for example the number of arrhythmic ECG signals incorrectly classified as normal). FP (false positive) is the number of negatives classified as positives (such as the number of healthy ECGs classified as arrhythmic signals). TN (true negative) is the number of negatives that are correctly identified as such (for example the number of healthy ECGs correctly classified)

5.2. Results of Matlab Simulations and FPGA Classifier Performance

Simulations were performed by processing both real and properly modified real ECG signals with the proposed CAD system.
The implemented procedure detects all the R peaks of the tested signals. Properly modified real ECG signals corrupted by different noise values were used as a test bench to improve realism and the mimic signals acquired in free-living conditions. A mixture of muscle noise, electrode movement artifacts, and baseline wander was added to the ECG under test. Taking into account input ECG signals characterized by a signal to noise ratio (SNR) equal to 20 dB, the precision in identifying the correct R peak position is corrupted by a systematic error having an average value equal to 2 ms. The error standard deviation is 1.1 ms. It depends on residual noise superimposed on ECG signals after the preprocessing phase.
Figure 21 shows the obtained results of the simulation carried out in Matlab using record 11 of the database. The diagnosis in terms of arrhythmias, QT lengthening, and PE embolism risk is also shown. The graphical user interface (GUI) in Figure 21 has also been developed in the Matlab environment.
The Signal Tap II Logic Analyzer (embedded in Quartus prime IDE) and the Zeroplus lab-c (an external USB logic analyzer) were also used for the system debug. Results of these analyses reflect specifications and simulations of the sequential machine performed by using the waveform editor tool of the Quartus IDE. In Figure 22 and Figure 23, the results of the instrumental analysis are shown. After the accurate detection of R peaks, the time distance between two consecutive R peaks of the pulses-transformed ECG signal was evaluated and compared according to the conceived procedure. The detection of an arrhythmic event is indicated by the comparator by the generation of a clock signal, which enables a counter.
The high performance of the proposed system, which adopts the NIOS II architecture, led us to consider that it was unessential to use the hard macro ARM core (HPS hard processor), which is in the equipped Cyclone V FPGA.
Successful results are also achieved by our CAD system in detecting arrhythmic disorders in stressed conditions. A value of 99.20% accuracy is achieved by taking into account 0.02 mV for the root mean square value of noise voltage (Nrms). The selected Nrms is referred to as typical value in the Physionet software, which is used for the dataset generation. Different Nrms values are also considered to test our system in stressed conditions. The performance reached by our method for each noise value added to the ECG signal is detailed in Table 1.
In order to evaluate the classification capacities of the algorithm implemented with the FPGA device, the same ECG records used for the procedure assessment are considered. Proper instrumental checks have been performed and pathologies have been detected once the Quartus project has been compiled and the FPGA has been programmed by using the Quartus programmer. The obtained performance results are not substantially different from the values obtained with the procedure developed in the Matlab environment.

6. Discussions

Development of new technologies has changed the approach with which physicians treat, prevent, and monitor cardiac illnesses. Decision support systems, which make it possible for the automatic processing and classification of ECG signals, are receiving clinical attention given that an early detection of cardiac disorders avoids severe health consequence for patients. Capturing ECG signals for arrhythmia detection is time consuming as ECG symptoms might need to be captured or monitored over several hours. For this reason, various research efforts are indicated in the literature to develop computer-aided detection and diagnosis systems for the automatic processing and real-time monitoring of ECG signals [51]. The implementation of new methods is not limited to software approaches, it also involves hardware design in order to optimize the system performance in terms of power consumption, area occupancy, and computational cost. FPGA-based chips are mostly considered to develop arrhythmia detectors. In [52], hardware and software implementations for heart-rate estimation are indicated, which are based on the RR interval evaluation. The ECG signal under test is enhanced and denoised using the empirical mode decomposition method. Automatic detection of noisy intrinsic mode functions is performed using spectral flatness measure and a threshold methodology is adopted for R peak localization. Xilinx Spartan 3E FPGA board using Verilog language is used for the design implementation.
Neural networks are also adopted as classifiers for arrhythmias recognition. Multilayer preceptors [53], probabilistic neural networks [54] and artificial neural networks [55], [56] are adopted in FPGA-based systems to discriminate the particular arrhythmia classes. Hermite functions are used in [57] to design and implement a hardware architecture that is able to characterize heartbeats in real time. Hermite fitting makes it possible to find the approximation of the QRS complex with the best minimum mean square error. The first stage of the conceived signal chain performs signal filtering and QRS peak detection, while the second stage evaluates a best Hermite–polynomial fit for the identified beat.
To reduce QRS complexity and artifacts, a peak envelope extraction algorithm is proposed in [58], which implements a Shannon energy envelope and Hilbert transform. In particular, the Shannon energy envelope employs peak detection, false noise, and false positive R-wave identification, while precise R-wave localization is reached through real-value fast Fourier transform and imaginary-value fast Fourier transform. A multiplier is used to detect various cardiac dysrhythmias.
An automated heartbeat classifier for wearable devices able to perform a real-time monitoring of cardiac activity is designed in [59]. The presented procedure is based on the well-known Pan–Tompkins algorithm [60]; however, it uses a different classifier. In fact, the implemented method adopts only one set of adaptive threshold computations and IIR filters instead of FIR filters.
In order to assess the performance of our DSS, a comparison was performed with the aforementioned systems, which are some of the most popular FPGA-based methods indicated in the literature in the last seven years. It has been seen from Table 2 that the proposed system has significant performance. In fact, our system is characterized by less area occupancy for the hardware implementation, high accuracy value, and reduced power dissipation compared with the other reported methods. The reduced hardware used for our system development provides the possibility to upgrade/enrich the designed circuit with new features in the future using the same chip. In addition, our system allows us to evaluate the QT-segment lengthening and the pulmonary embolism (PE) risk assessment.

7. Conclusions

Automatic ECG signal analysis is projected to play a greater role in patient monitoring and diagnosis. The application of computer-aided equipment is especially promising in supporting physicians in clinical practices. In this paper, we present a novel, dedicated implementation of the ECG signal processing chain for arrhythmia detection, QT-segment lengthening evaluation, and assessing pulmonary embolism risk. The method was first developed in Matlab® environment for debug purposes before the hardware implementation was validated on an FPGA device. We designed the conceived system using an algorithm-to-hardware compiler tool chain and characterized the hardware using the DE1_SoC development board by Terasic. Cost effectiveness and low power consumption characterize the system, which can be considered a home-based heart-monitoring or heart-screening device. The implemented procedure is suitable to be embedded in smartwatch sensors for ECG recording. In fact, as a consequence of multi-core chips and larger-memory adoption, improvements in the computation power and storage capacity of smartphones/smartwatches have established the popularity of sensor systems for the measuring and monitoring of environmental and health-care parameters. In this way, several anomalies can be detected in real time [61]. In addition, the designed system could be equipped with an IoT interface to transmit information and share data with medical specialists for consultations in real time. The transmission of patient diagnostic data and/or patient biological signals between hospitals and different administrative organizations have become a common practice for many reasons, such as diagnosis, treatment, distance learning, training purposes, teleconferences between clinicians, and medical consultation between physicians and radiologists. For enhancing data interoperability and integrity regarding electronic health record sharing, Blockchain-based framework methods can be proposed to facilitate communication between medical providers, who store medical data in the cloud and share the electronic health data of patients [62]. Our system has not been synthetized to detect all heart-related diseases, which are detectable by physicians analyzing ECG signals. However, the designed method is a versatile system that allows making changes in each section in an independent way. Upgrades/improvements concerning cardiac illnesses and disorders that indirectly affect the heart can also be developed in the future.

Author Contributions

Conceptualization, A.G., M.R., and C.G.; methodology, A.G., M.R., and C.G.; software, A.G.; validation, A.G., M.R., and C.G.; formal analysis, A.G., M.R., and C.G.; data curation, A.G., M.R., and C.G.; writing—original draft preparation, M.R. and C.G.; writing—review and editing, M.R., C.G., and A.G. All authors have read and agreed to the published version of the manuscript.

Funding

This research received no external funding.

Conflicts of Interest

The authors declare no conflict of interest.

References

  1. Gon, A.; Mukherjee, A. FPGA-Based Low-Cost Architecture for R-Peak Detection and Heart-Rate Calculation Using Lifting-Based Discrete Wavelet Transform. Circuits Syst. Signal Process 2023, 42, 580–600. [Google Scholar] [CrossRef]
  2. Rizzi, M.; D’Aloia, M. Computer aided system for breast cancer diagnosis. Biomed. Eng.-Appl. Basis Commun. 2014, 26, 1450033. [Google Scholar] [CrossRef]
  3. Karataş, F.; Koyuncu, İ.; Tuna, M.; Alçın, M.; Avcioglu, E.; Akgul, A. Design and implementation of arrhythmic ECG signals for biomedical engineering applications on FPGA. Eur. Phys. J. Spec. Top. 2022, 231, 869–884. [Google Scholar] [CrossRef]
  4. Guaragnella, C.; Rizzi, M.; Giorgio, A. Marginal Component Analysis of ECG Signals for Beat-to-Beat Detection of Ventricular Late Potentials. Electronics 2019, 8, 1000. [Google Scholar] [CrossRef] [Green Version]
  5. Lutfi, M.F. Ventricular late potential in cardiac syndrome X compared to coronary artery disease. BMC Cardiovasc. Disord. 2017, 17, 35–40. [Google Scholar] [CrossRef] [Green Version]
  6. Al-Ani, M.S. ECG waveform classification based on P-QRS-t wave recognition, UHD. J. Sci. Technol. 2018, 2, 7–14. [Google Scholar] [CrossRef]
  7. Characteristics of the Normal Electrocardiogram. Available online: https://www.brainkart.com/article/Characteristics-of-the-Normal-Electrocardiogram_19237/ (accessed on 2 November 2022).
  8. Bsoul, A.A.R.; Ji, S.-Y.; Ward, K.; Najarian, K. Detection of P, QRS, and T Components of ECG using wavelet transformation. In Proceedings of the 2009 ICME International Conference on Complex Medical Engineering, Tempe, AZ, USA, 9–11 April 2009; pp. 1–6. [Google Scholar] [CrossRef]
  9. Rogers, B.; Schaffarczyk, M.; Clauß, M.; Mourot, L.; Gronwald, T. The Movesense Medical Sensor Chest Belt Device as Single Channel ECG for RR Interval Detection and HRV Analysis during Resting State and Incremental Exercise: A Cross-Sectional Validation Study. Sensors 2022, 22, 2032. [Google Scholar] [CrossRef]
  10. Esgalhado, F.; Batista, A.; Vassilenko, V.; Russo, S.; Ortigueira, M. Peak Detection and HRV Feature Evaluation on ECG and PPG Signals. Symmetry 2022, 14, 1139. [Google Scholar] [CrossRef]
  11. Liaqat, S.; Dashtipour, K.; Zahid, A.; Assaleh, K.; Arshad, K.; Ramzan, N. Detection of Atrial Fibrillation Using a Machine Learning Approach. Information 2020, 11, 549. [Google Scholar] [CrossRef]
  12. Mayapur, P. A Review on Detection and Performance Analysis on R-R Interval Methods for ECG. Int. J. Innov. Res. Sci. Eng. Technol. 2018, 7, 11019–11025. [Google Scholar] [CrossRef]
  13. Bin Obadi, A.; Soh, P.J.; Aldayel, O.; Al-Doori, M.H.; Mercuri, M.; Schreurs, D. A survey on vital signs detection using radar techniques and processing with FPGA implementation. IEEE Circuits Syst. Mag. 2021, 21, 41–74. [Google Scholar] [CrossRef]
  14. Tyagi, D.; Kumar, R. Rhythm Identification and Classification for Electrocardiogram Signals using Feature Cluster Framework Classifier. Int. J. Adv. Res. Eng. Technol. 2021, 12, 199–208. [Google Scholar] [CrossRef]
  15. Gowri Shankar, M.; Ganesh Babu, C. An Exploration of ECG Signal Feature Selection and Classification using Machine Learning Techniques. Int. J. Innov. Technol. Explor. Eng. 2020, 9, 797–804. [Google Scholar] [CrossRef]
  16. Arvanaghi, R.; Daneshvar, S.; Seyedarabi, H.; Goshvarpour, A. Fusion of ECG and ABP Signals Based on Wavelet Transform for Cardiac Arrhythmias Classification. Comput. Methods Programs Biomed. 2017, 151, 71–78. [Google Scholar] [CrossRef] [PubMed]
  17. Mayapur, P. Classification of Arrhythmia from ECG Signals using MATLAB. Int. J. Eng. Manag. Res. 2018, 8, 115–129. [Google Scholar] [CrossRef]
  18. Gajowniczek, K.; Grzegorczyk, I.; Ząbkowski, T.; Bajaj, C. Weighted Random Forests to Improve Arrhythmia Classification. Electronics 2020, 9, 99. [Google Scholar] [CrossRef] [PubMed] [Green Version]
  19. AAMI ECAR:1987. Recommended Practice for Testing and Reporting Performance Results of Ventricular Arrhythmia Detection Algorithms; Association for the Advancement of Medical Instrumentation: Arlington, VA, USA, 1987. [Google Scholar]
  20. ANSI/AAMI EC57:2012. Testing and reporting performance results of cardiac rhythm and ST segment measurement algorithms. Association for the Advancement of Medical Instrumentation: Arlington, VA, USA, 2012. [Google Scholar]
  21. Cardiac Arrhythmias. Available online: https://thoracickey.com/cardiac-arrhythmias-3/ (accessed on 2 November 2022).
  22. Saxena, S.; Vijay, R.; Saxena, G.; Pahadiya, P. Classification of Cardiac Signals with Automated R-Peak Detection Using Wavelet Transform Method. Wirel. Pers. Commun. 2022, 123, 655–669. [Google Scholar] [CrossRef]
  23. Maghfiroh, A.M.; Musvika, S.D.; Wakidi, L.F.; Amidi, L.; Sumber, S.; Mak’ruf, M.R.; Pudji, A.; Titisari, D. State-of-the-Art Method to Detect R-Peak on Electrocardiogram Signal: A Review. In Proceedings of the 1st International Conference on Electronics, Biomedical Engineering, and Health Informatics. Lecture Notes in Electrical Engineering; Triwiyanto, Nugroho, H.A., Rizal, A., Caesarendra, W., Eds.; Springer: Singapore, 2021; Volume 746. [Google Scholar] [CrossRef]
  24. Sabherwal, P.; Agrawal, M.; Singh, L. Automatic detection of the R peaks in single-lead ECG signal. Circuits Syst. Signal Process. 2017, 36, 4637–4652. [Google Scholar] [CrossRef]
  25. TerBekke, R.M.A.; Haugaa, K.H.; van den Wijngaard, A.; Bos, J.M.; Ackerman, M.J.; Edvardsen, T.; Volders, P.G.A. Electromechanical window negativity in genotyped long-QT syndrome patients: relation to arrhythmia risk. Eur. Heart J. 2015, 36, 179–186. [Google Scholar] [CrossRef] [Green Version]
  26. Munshi, F.; Fontaine, J.M. Application of Electromechanical Window Negativity as an Arrhythmia Risk Correlate in Acquired Long QT Syndrome. JACC Case Rep. 2021, 15, 1427–1433. [Google Scholar] [CrossRef] [PubMed]
  27. Rencuzogullari, I.; Çağdaş, M.; Karabağ, Y.; Karakoyun, S.; Çiftçi, H.; Gürsoy, M.O.; Karayol, S.; Çinar, T.; Tanik, O.; Hamideyin, S. A novel ECG parameter for diagnosis of acute pulmonary embolism: RS time RS time in acute pulmonary embolism. Am. J. Emerg. Med. 2019, 37, 1230–1236. [Google Scholar] [CrossRef]
  28. Gümüşdağ, A.; Burak, C.; Süleymanoğlu, M.; Yesin, M.; Tanık, V.O.; Karabağ, Y.; Çağdaş, M.; Rencüzoğulları, I. The predictive value of RS time for short term mortality in patients with acute pulmonary embolism. J. Electrocardiol. 2020, 62, 94–99. [Google Scholar] [CrossRef] [PubMed]
  29. Giorgio, A.; Guaragnella, C.; Rizzi, M. An Effective CAD System for Heart Sound Abnormality Detection. Circuits Syst. Signal Process. 2022, 41, 2845–2870. [Google Scholar] [CrossRef]
  30. Mirza, A.H.; Nurmaini, S.; Partan, R.U. Automatic Classification of 15 Leads ECG Signal of Myocardial Infarction Using One Dimension Convolutional Neural Network. Appl. Sci. 2022, 12, 5603. [Google Scholar] [CrossRef]
  31. Rizzi, M.; Guaragnella, C. Skin Lesion Segmentation Using Image Bit-Plane Multilayer Approach. Appl. Sci. 2020, 10, 3045. [Google Scholar] [CrossRef]
  32. Talukder, S.; Singh, R.; Bora, S.; Paily, R. An Efficient Architecture for QRS Detection in FPGA Using Integer Haar Wavelet Transform. Circuits Syst. Signal Process. 2020, 39, 3610–3625. [Google Scholar] [CrossRef]
  33. Liu, Y.; Dong, L.; Zhang, B.; Xin, Y.; Geng, L. Real Time ECG Classification System Based on DWT and SVM. In Proceedings of the 2020 IEEE International Conference on Integrated Circuits, Technologies and Applications, Nanjing, China, 23–25 November 2020; pp. 155–156. [Google Scholar] [CrossRef]
  34. Rizzi, M.; Guaragnella, C. A Decision Support System for Melanoma Diagnosis from Dermoscopic Images. Appl. Sci. 2022, 12, 7007. [Google Scholar] [CrossRef]
  35. Aqil, M.; Jbari, A.; Bourouhou, A. ECG Signal Denoising by Discrete Wavelet Transform. Int. J. Online Biomed. Eng. 2017, 13, 51–68. [Google Scholar] [CrossRef]
  36. Rizzi, M.; D’Aloia, M.; Castagnolo, B. A fully automatic system for detection of breast microcalcification clusters. J. Med. Biol. Eng. 2010, 30, 181–188. [Google Scholar]
  37. Ruha, A.; Sallinen, S.; Nissila, S. A real time microprocessor QRS detector system with a 1ms timing accuracy for the measurement of ambulatory HRV. IEEE Trans. Biomed. Eng. 1997, 44, 159–167. [Google Scholar] [CrossRef]
  38. Aritmie. Available online: http://www.medicinaurgenza.it/aritmie.html (accessed on 2 November 2022).
  39. Dahlberg, P.; Diamant, U.B.; Gilljam, T.; Rydberg, A.; Bergfeldt, L. QT correction using Bazett’s formula remains preferable in long QT syndrome type 1 and 2. Ann. Noninvasive Electrocardiol. 2021, 26, e12804. [Google Scholar] [CrossRef] [PubMed]
  40. Bousseljot, R.; Kreiseler, D.; Schnabel, A. Nutzung der EKG-Signaldatenbank CARDIODAT der PTB über das Internet. Biomed. Eng. 1995, 40, 317–318. [Google Scholar] [CrossRef]
  41. Goldberger, A.L.; Amaral, L.A.N.; Glass, L.; Hausdorff, J.M.; Ivanov, P.C.; Mark, R.G.; Mietus, J.E.; Moody, G.B.; Peng, C.K.; Stanley, H.E. PhysioBank, PhysioToolkit, and PhysioNet: Components of a new research resource for complex physiologic signals. Circulation 2000, 101, e215–e220. [Google Scholar] [CrossRef] [PubMed] [Green Version]
  42. Sološenko, A.; Petrėnas, A.; Paliakaitė, B.; Marozas, V.; Sörnmo, L. Model for Simulating ECG and PPG Signals with Arrhythmia Episodes (version 1.3.1). PhysioNet 2022. [Google Scholar] [CrossRef]
  43. DatabaseECG_Arrhythmia. Available online: https://drive.google.com/file/d/19DaROtBXEzpc2uZxSPaGQ2VkGPIq0YkU/view?usp=share_link(accessed on 2 November 2022).
  44. HDL Coder. Available online: https://www.mathworks.com/products/hdl-coder.html(accessed on 2 November 2022).
  45. FPGA designs with Verilog and SystemVerilog. Available online: https://www.academia.edu/42857396/FPGA_designs_with_Verilog_and_SystemVerilog?email_work_card=title (accessed on 2 November 2022).
  46. Video Intel® FPGA Rapidi. Available online: https://www.intel.it/content/www/it/it/programmable/support/training/demonstrations/online/embedded-processor.html?wapkw=nios%20II (accessed on 2 November 2022).
  47. FPGA ed FPGA SoC Intel®. Available online: https://www.intel.it/content/www/it/it/products/details/fpga.html(accessed on 2 November 2022).
  48. DE1-SoC Board. Available online: https://www.terasic.com.tw/cgi-bin/page/archive.pl?Language=English&CategoryNo=165&No=836#contents (accessed on 2 November 2022).
  49. Software Intel® Quartus® Prime. Available online: https://www.intel.it/content/www/it/it/software/programmable/quartus-prime/overview.html (accessed on 2 November 2022).
  50. Baratloo, A.; Hosseini, M.; Negida, A.; El Ashal, G. Part 1: Simple Definition and Calculation of Accuracy, Sensitivity and Specificity. Emergency 2015, 3, 48–49. [Google Scholar]
  51. Dinakarrao, S.M.P.; Jantsch, A.; Shafique, M. Computer-aided Arrhythmia Diagnosis with Bio-signal Processing: A Survey of Trends and Techniques. ACM Comput. Surv. 2020, 52, 1–37. [Google Scholar] [CrossRef]
  52. Rajani Kumaria, L.V.; Padma Saib, Y.; Balajic, N.; Viswada, K. FPGA Based Arrhythmia Detection. Procedia Comput. Sci. 2015, 57, 970–979. [Google Scholar] [CrossRef] [Green Version]
  53. Zairi, H.; Kedir Talha, M.; Meddah, K.; Ould Slimane, S. FPGA-based system for artificial neural network arrhythmia classification. Neural Comput. Appl. 2020, 32, 4105–4120. [Google Scholar] [CrossRef]
  54. Srivastava, R.; Kumar, B.; Alenezi, F.; Alhudhaif, A.; Althubiti, S.A.; Polat, K. Automatic Arrhythmia Detection Based on the Probabilistic Neural Network with FPGA Implementation. Math. Probl. Eng. 2022, 7564036. [Google Scholar] [CrossRef]
  55. Lim, H.W.; Hau, Y.W.; Othman, M.A.; Lim, C.W. Embedded system-on-chip design of atrial fibrillation classifier. In Proceedings of the 2017 International SoC Design Conference (ISOCC), Seoul, Republic of Korea, 5–8 November 2017; pp. 90–91. [Google Scholar] [CrossRef]
  56. Vinaykumar, S.; Thilagavathy, R. FPGA Implementation of Artificial Neural Network (ANN) for ECG Signal Classification. In Proceedings of the 2022 IEEE International IOT, Electronics and Mechatronics Conference (IEMTRONICS), Toronto, ON, Canada, 1–4 June 2022; pp. 1–6. [Google Scholar] [CrossRef]
  57. Desai, M.P.; Caffarena, G.; Jevtic, R.; Márquez, D.G.; Otero, A. A Low-Latency, Low-Power FPGA Implementation of ECG Signal Characterization Using Hermite Polynomials. Electronics 2021, 10, 2324. [Google Scholar] [CrossRef]
  58. Kripa, S.; Jebastine, J. Efficient FPGA-Based Design for Detecting Cardiac Dysrhythmias. In Intelligent Computing in Engineering. Advances in Intelligent Systems and Computing; Solanki, V., Hoang, M., Lu, Z., Pattnaik, P., Eds.; Springer: Singapore, 2020; Volume 1125. [Google Scholar] [CrossRef]
  59. Ghosh, R.; Tamil, L.S. Computation-efficient and compact FPGA design for a real-time wearable arrhythmia-detector. Biomed. Eng. Adv. 2021, 2, 100019. [Google Scholar] [CrossRef]
  60. Pan, J.; Tompkins, W.J. A Real-Time QRS Detection Algorithm. IEEE Trans. Biomed. Eng. 1985, BME-32, 230–236. [Google Scholar] [CrossRef] [PubMed]
  61. Krichen, M. Anomalies Detection Through Smartphone Sensors: A Review. IEEE Sens. J. 2021, 21, 7207–7217. [Google Scholar] [CrossRef]
  62. Jabbar, R.; Fetais, N.; Krichen, M.; Barkaoui, K. Blockchain technology for healthcare: Enhancing shared electronic health record interoperability and integrity. Proceeding of the 2020 IEEE International Conference on Informatics, IoT, and Enabling Technologies (ICIoT), Doha, Qatar, 2–5 February 2020; pp. 310–317. [Google Scholar] [CrossRef]
Figure 1. ECG typical waveform [7].
Jlpea 13 00006 g001
Figure 2. Main heart rhythm conditions [21].
Jlpea 13 00006 g002
Figure 3. Block diagram of the procedure for R peak localization in Simulink environment.
Jlpea 13 00006 g003
Figure 4. Waveform shape of input signal (yellow signal) and of outputs from comparator (blue signal) and switch (red signal).
Jlpea 13 00006 g004
Figure 5. Pulsed ECG signal (red signal) and database ECG signal (light-blue signal).
Jlpea 13 00006 g005
Figure 6. Localization of ECG characteristic points.
Jlpea 13 00006 g006
Figure 7. Analysis of the first time window during the classification phase.
Jlpea 13 00006 g007
Figure 8. Analysis of the second time window during the classification phase.
Jlpea 13 00006 g008
Figure 9. Functional block diagram of the designed hardware.
Jlpea 13 00006 g009
Figure 10. ROM block with input and output signals.
Jlpea 13 00006 g010
Figure 11. Functional and logical diagram of the ROM module.
Jlpea 13 00006 g011
Figure 12. Schematic implementation of the ROM module.
Jlpea 13 00006 g012
Figure 13. Functional and logic diagram of the analyzer.
Jlpea 13 00006 g013
Figure 14. The analyzer schematic. It is composed of three cascade blocks: (a) is the first block, (b) the second and (c) represents the last stage.
Jlpea 13 00006 g014aJlpea 13 00006 g014bJlpea 13 00006 g014c
Figure 15. Schematic design of the differential splitter.
Jlpea 13 00006 g015
Figure 16. Schematic design of the Interval_Time_Counter.
Jlpea 13 00006 g016
Figure 17. Schematic design of the logic block performing the analysis.
Jlpea 13 00006 g017
Figure 18. Schematic design of the display driver.
Jlpea 13 00006 g018
Figure 19. Black box representing the analyzer with the relevant input and output signals.
Jlpea 13 00006 g019
Figure 20. Operating settings and conditions for voltage and temperature.
Jlpea 13 00006 g020
Figure 21. Results of Matlab simulation on record 11: (a) filtered ECG signal, (b) segmented signal, (c) diagnosis in terms of arrhythmias, QT lengthening, and PE risk evaluation.
Jlpea 13 00006 g021
Figure 22. Arrhythmias detection by instrumental analysis performed using the Signal Tap II Logic Analyzer.
Jlpea 13 00006 g022
Figure 23. Arrhythmias detection by instrumental analysis performed using Zeroplus lab-c.
Jlpea 13 00006 g023
Table 1. Obtained performance with different root mean square values of noise voltage.
Nrms (mV)Accuracy (%)
0.0299.20
0.0499.20
0.0699.20
0.0899.20
0.198.80
0.497.60
Table 2. Comparative analysis with some FPGA-based arrhythmias detectors.
HW UsedPower SupplyPower DissipationArea OccupancyAccuracy (%)
Ref. [52]Xilinx Spartan XC3S500NANA38%94.76
Ref. [53]Artix-7 NANANA98.3
Ref. [54]Artix-7 NANANA98.27
Ref. [55]Altera DE2-115NANANA95.3
Ref. [56]Artix-7 NANANA86
Ref. [57]Artix-7 5 V28 mWNANA
Ref. [58]Xilinx Spartan 3NA280 mWNA93.6
Ref. [59]Xilinx Spartan 6 NA0.48 mW32%99.65
Our systemIntel Cyclone V1.1 V5.70 mW6%99.20
Disclaimer/Publisher’s Note: The statements, opinions and data contained in all publications are solely those of the individual author(s) and contributor(s) and not of MDPI and/or the editor(s). MDPI and/or the editor(s) disclaim responsibility for any injury to people or property resulting from any ideas, methods, instructions or products referred to in the content.

