Article

Can Companies Reduce Carbon Emission Intensity to Enhance Sustainability?

College of Business, Gachon University, Seongnam 13120, Republic of Korea
*
Author to whom correspondence should be addressed.
Systems 2023, 11(5), 249; https://doi.org/10.3390/systems11050249
Submission received: 13 April 2023 / Revised: 11 May 2023 / Accepted: 12 May 2023 / Published: 15 May 2023

Abstract

:
With the rapid development of global industrialization and modernization, carbon emissions have brought about serious climate warming and environmental pollution problems. Chinese enterprises, as the major players in carbon emissions, are important in terms of promoting the green transformation of the economy. It is particularly important to investigate the relationship and mechanism of action between carbon emission reduction and corporate sustainable development in Chinese enterprises. This study aims to determine whether reducing the intensity of carbon emissions can make businesses more sustainable and to analyze the moderating influences of government environmental subsidies, media monitoring, and executives’ green opinions on the link between the two variables. The study sample consists of Shanghai and Shenzhen A-shares data from 2015 to 2020, and a fixed-effects model is employed for analysis. Data were obtained from the China Stock Market & Accounting Research database, the Financial News Database of Listed Companies, and enterprise financial statement notes, etc. Stata17.0 was used to clean and analyze the data. The results indicate that businesses can greatly improve their long-term viability by lowering their carbon emissions. Additionally, government environmental subsidies, media monitoring, and executives’ green perceptions all enhance the correlation between corporate sustainability and reduce carbon emission intensity. This study not only enriches the relationship between environmental governance and sustainable development from a theoretical perspective, but also further expands the stakeholder theory. It also finds the mechanism of the role of the government and media on corporate carbon emissions for sustainable development in practice, which provides effective guidance to accelerate the promotion of carbon emission reduction and, thus, the sustainable development of Chinese enterprises.

1. Introduction

The high rate of global industrialization has caused serious carbon emission problems. Concentrations of greenhouse gases (GHGs) are currently very high, far greater than those at the beginning of the industrial age. A survey conducted in 2019 found that the atmospheric concentration of CO2 had hit 409.8 ppm (parts per million), making it the highest in at least 800,000 years [1]. CO2 emissions not only threaten biodiversity but also pose a significant threat to sustainability [2]. The negative impacts of climate change on the economy and society have prompted nations to look for the causes of environmental degradation and novel ways to lessen the effects of global warming and reduce carbon dioxide (CO2) emissions [3,4,5].
Reducing greenhouse gas emissions is crucial to the sustainable development of the world economy [6]. The issue of carbon emission reduction has started to receive high levels of attention globally. In 2015, numerous countries joined the Paris Agreement [7] in a collaborative effort to reduce emissions of GHGs. The European Union (EU) has similar objectives for combatting climate change and creating a cleaner environment. Many scholars have begun to explore the factors influencing carbon emissions, such as Mardani et al., who considered economic growth a major driver of carbon emissions [8]. Zafar et al. also noted that Asia-Pacific industrialization increased carbon emissions [9].
As the most populous developing nation in the world, China consumes a large amount of fossil fuels to power its rapid industrialization and urbanization [10], the result of which is significant pollution and CO2 emissions. As a major carbon-emitting country [11], China has proposed the development goal of “carbon peaking and carbon neutrality”. Compliance with sustainable development goals is also a top priority for the business community [12]. According to the eighth Sustainable Development Goal (SDG) outlined in the United Nations’ 2030 Agenda, governments must cut emissions, increase energy consumption, decarbonize energy systems, and ensure sustainable energy [13]. SDG 9 aims to prevent environmental degradation, actively safeguard biodiversity, and maintain ecosystems that foster equitable human and economic development. Enterprises, as the main source of carbon emissions, are also the main participants in economic activities. This study focuses on sustainability at the firm level, i.e., achieving corporate sustainability. Elkington’s triple bottom line approach argues that the long-term prosperity of a company depends on a focus on three dimensions of sustainability: social, environmental and economic [14]. Companies need to equally balance the needs of the company with these three dimensions when developing a sustainability strategy [6]. The American financier Robert C. Higgins proposed a sustainable growth model in 1977 for the corporate SGR problem that better reflects the sustainability of a firm [15]. In 2000, James C. Van Horne developed a steady-state equilibrium and dynamic nonequilibrium sustainable growth model based on this model to better reflect the business ability and competitiveness of a firm [15].
However, in the study of carbon emission reduction in China, current scholars focus their research areas on the influencing factors of carbon emission reduction and the methods to reduce carbon emissions. For example, Li et al. argued that the digital economy is an important factor influencing carbon emission reduction, and they concluded that there is a U-shaped relationship between the level of digital economy development and carbon emission [16]. Ming et al. constructed a spatial panel Durbin model and a mediating effects model to demonstrate that the digital economy directly and indirectly reduces carbon emissions [17]. These studies all provide theoretical support for the implementation of a digital economy to mitigate carbon emissions in China. Due to the significant macro-regulatory role of the Chinese government, many scholars have also explored the effect of carbon trading-related policies on carbon emission reduction from the perspective of carbon trading. For example, Shi et al. found that carbon trading pilot projects, especially carbon allowances and prices, reduced regional carbon emissions and per capita CO2 emissions [15]. Huo et al. studied the low-carbon city pilot policy and found that this policy can reduce carbon emissions by changing industrial structure and promoting enterprises to develop low-carbon technologies [18]. Li et al. used difference-in-differences (DID) and spatial Durbin models to demonstrate that the spatial spillover effect of carbon emissions trading significantly reduced carbon intensity [19]. These studies also provide a theoretical basis for the government to test the effects of carbon trading policies and provide confidence for Chinese enterprises to reduce carbon emissions. However, the study of the influencing factors in carbon emission reduction ultimately aims to promote the effective carbon emission reduction and sustainable development of enterprises through green transformation. This is also the core issue of this study.
Although some scholars have studied carbon emissions and sustainable development, most have focused on macroeconomic and environmental sustainability. For instance, Erdoğan et al. suggested that well-planned emission reduction plans have few adverse effects on sustainable economic growth [20]. Yang et al. found that the reduction in carbon emissions in the COVID-19 era improved environmental performance [21]. Additionally, micro-level studies have focused on carbon emissions, financial performance, and short-term corporate performance. Palea’s study showed that a low-carbon orientation can reduce enterprises’ environmental regulatory risk and environmental management costs [22]. Liu et al. employed the DID technique to evaluate enterprises’ micro-level financial performance and found that carbon emissions trading enhanced non-operating income [23]. Desai disagreed with the conclusion that corporate carbon emission reduction promotes financial performance [24]. This study shows that although there are opposing views on exploring the micro-level aspects of corporate carbon emission reduction enhancing corporate financial performance, most of the findings indicate that carbon emission reduction has a significant impact on financial performance, especially by reducing systemic risk. Although this study selects micro-level data, it is not limited to studying the impact of corporate carbon emission reduction on corporate financial performance and environmental performance. This study considers corporate sustainability in terms of corporate profitability and competitiveness, and explores the role of carbon emission reduction in corporate sustainability.
In addition, the government, media, and corporate executives play critical roles in decreasing carbon output and promoting sustainable business practices. Many scholars have studied the relationship between government subsidies and media coverage as independent variables with corporate carbon emissions or with corporate sustainability. For example, Yunus et al. argued that the environmental pressure exerted on firms by stakeholders such as regulators, the media, and creditors is conducive to the adoption of proactive carbon management strategies [25]. Raghunandan used empirical data to suggest that institutional investors favor the selection of stocks for socially responsible companies. Additionally, it is more beneficial to promote the sustainable development of such enterprises [26]. In examining the government’s drive to reduce corporate carbon emissions, some scholars argue that environmental regulation techniques, such as a hybrid of control and market incentive-based approaches, can be useful for encouraging greater carbon efficiency in businesses [27]. However, some scholars contend that environmental regulation has a “green paradox” [28] and may discourage firms from increasing their environmental investments, effectively discouraging economic activities that damage the environment [29]. From an executive perspective, executives with more environmentally conscious world views have constructive effects on their companies’ carbon-efficient management and green financial success [30]. This study chooses to further investigate the mechanism of the role of corporate carbon emission reduction in enhancing corporate sustainability from the stakeholder perspective so as to fill this gap. It also provides a theoretical basis for the government and media in promoting carbon emission reduction in enterprises.
This study also has many innovative points. Firstly, the subject of this study is relatively new. This study creatively selects two topical issues of current world concern—carbon emission reduction and sustainable development capacity—as research objectives, and takes Chinese enterprises with large carbon emissions as research samples. Secondly, this study is more innovative in its measurement of variables. In the context of the digital age, the media plays an increasingly important role in guiding the green transformation of companies. While most of the literature uses the total number of news reports in the news media as a measure of media attention, this study uses the J-F coefficient (Janis and Fadner, 1965) to measure the propensity of media coverage and as a more objective measure of media monitoring. The executive perspective, on the other hand, uses word frequency to select executives’ green perceptions as a moderating variable. This variable captures the internal motivation that drives executives to make green transition decisions. Lastly, this study is more innovative in terms of research methodology. As we know, the difficulty of studying corporate carbon emission reduction from a micro perspective lies in the acquisition of corporate carbon emission data. This study refers to the globally recognized Greenhouse Gas Accounting System (GHGAS) protocol and locates the sources of carbon emissions as direct GHG emissions owned or controlled by the company and indirect GHG emissions caused by commercial energy and thermal energy procurement. Carbon emissions directly disclosed by companies are obtained directly from their annual reports and social responsibility reports, while those not disclosed are calculated with reference to the Intergovernmental Panel on Climate Change (IPCC) Guidelines for National Greenhouse Gas Inventories. Various indicators are used to measure carbon emissions to ensure the robustness of the study results and to better reflect the micro-level findings.
This study provides a theoretical framework for furthering the paradigm of studies that focus on corporations’ carbon emissions. It also serves as a guide that enriches the literature on enterprise carbon emission reduction and sustainable development and assists businesses in achieving their sustainability objectives. Specifically, it identifies the critical mechanism of the role of enterprise carbon intensity reduction in influencing firms’ sustainable growth from the standpoint of three stakeholders. This study further enriches the research on environmental governance theory and sustainable development based on corporate carbon emissions and offers theoretical help for businesses to actively reduce carbon emissions and carry out ecological remediation.

2. Theoretical Background and Assumptions

2.1. Enterprise Carbon Emission Intensity Reduction and Enterprise Sustainable Development Capability

Rapid economic expansion has resulted in serious ecological issues [12]. The theory of environmental economics posits that economic and ecological developments are complementary [31]. People should ensure harmonious symbiosis between the two to satisfy growing material needs, promote harmony between humans and the natural world, and maintain an ecological balance as the basis for business expansion [31]. Therefore, the environment can be better protected by reducing carbon emissions and any efforts toward a world with stricter carbon limits would be greatly appreciated. From 1970 to 2011, non-renewable energy (e.g., burning fossil fuels) and industrial activities were the primary sources of GHG emissions [32], making businesses the primary producers and environmental polluters. According to corporate social responsibility theory, companies should be proactive in undertaking environmental social responsibility, protect the environment, and use resources wisely, such as taking measures to save energy and reduce carbon emissions, all of which contribute to long-term positive corporate development [33]. According to Ferrat’s extensive research, while reducing carbon emissions may negatively impact business performance in the short term, it will favorably influence business performance in the long run [34]. Low-carbon business behavior is also important for boosting firms’ low-carbon competitiveness [35].
Since the Paris Agreement, countries have also started to target sustainable development technologies in an attempt to achieve environmental and sustainable development goals by reducing environmental degradation and CO2 emissions, respectively [36]. Corporate sustainability is measured in three dimensions: economic, social, and environmental; that is, it is not possible to trade off social and environmental benefits to increase economic efficiency [37]. Products manufactured sustainably save energy and natural resources, ensure the safety of workers, communities, and the environment, and reduce negative effects on the environment. The long-term success of these businesses also comes from maintaining a balance among their financial, social, and environmental well-being [14]. An increasing number of producers are realizing the economic and environmental benefits of sustainability [38]. In addition, according to signaling theory, carbon reduction behavior is an important manifestation of companies’ adherence to the concept of low-carbon environmental protection and social responsibility [39]. Increasing the intensity of carbon emission reduction also conveys the concept of low-carbon enterprise development to the outside world and establishes a good green image for enterprise managers. Doing so can improve an enterprise’s reputation, attract the attention of stakeholders, and play a positive role in the accumulation of resources. Simultaneously, it also communicates a sustainable development strategic target through the non-financial indicator of corporate social responsibility (CSR) and reduces the degree of information asymmetry within and outside the enterprise, which helps reduce costs and improve its long-term performance. The following hypothesis was derived from the analysis presented above:
Hypothesis 1 (H1).
The reduction in carbon emission intensity by enterprises can effectively enhance their sustainability.

2.2. The Regulatory Function of Environmental Subsidies

The government is a visible force in market regulation, which is crucial for the green transformation of businesses. Porter’s hypothesis [39,40] suggests that incentive-based environmental regulations (e.g., environmental subsidies) can generate innovation compensation effects and motivate firms to increase R&D expenditure. Enterprises may improve their profitability through green transformation and technological upgrades to reduce the high costs of governmental environmental regulations. According to Yuan et al. [41], government subsidies positively impact supply chain participants’ marketing and carbon reduction efforts, which can boost chain profits and improve society’s overall well-being. Stakeholder theory argues that companies should not only focus on financial performance, but also integrate and balance the interests of other stakeholders and consider enhancing their social benefits. According to signaling theory, government environmental subsidies are positive signals that convey the government’s green governance. In addition, resource dependence theory suggests that enterprises, as economic agents, are inseparable from the government in their production and operation. Thus, enterprises should accept and actively respond to signals from stakeholders, such as the government, to conduct low-carbon and environmentally friendly production and operations. They should also match the government’s demand for green transformation with the goal of sustainable development to obtain more government resources and achieve long-term growth. Wu et al. [42] found that green growth-oriented government energy subsidies positively affect the carbon efficiency of firms in low-carbon industries, such as clean energy. According to Zhao et al., environmental regulations in China contribute to the reduction in CO2 emissions [43]. Government environmental subsidies can also promote upgrades of industrial structures and technological progress in businesses. Both measures are beneficial in terms of reducing carbon emissions [44]. Based on the preceding analysis, we propose the following:
Hypothesis 2 (H2).
The government’s environmental subsidies amplify the sustainability-improving effect of reducing businesses’ carbon emission intensity.

2.3. The Moderating Role of Media Monitoring

With the advent of the digital age, the media, as a fourth power independent of legislation, administration, and the judiciary, has become increasingly essential for both information transmission and economic governance. Just as agenda-setting theory argues that the content of media reports is more compelling to the public, the tone of media coverage of listed businesses can directly influence company reputation and value [45].
According to signaling theory [46], the media, as publishers of information, transmits corporate information to the market after collecting, verifying, and collating information, which can ensure the efficiency of information transmission, reduce information asymmetry, and alleviate information friction among capital markets. Starting from reputation theory, many scholars have found that the media can exert public opinion and action pressure on enterprises by exposing their environmental pollution scandals, forcing them to take the initiative to reduce pollutant emissions to maintain their image [47,48]. Positive media reports improve corporate image and reputation [49] by signaling consistency. Companies engage in environmental management efforts, such as energy savings and emission reduction, to build stakeholders’ confidence and recognition of corporate development [50], which can improve corporate reputation and form a brand’s efficacy. The “corporate governance hypothesis” contends that the media plays an important role in monitoring governance. Using a random effects model, scholars such as Guo have empirically demonstrated that media monitoring has a corporate governance function and significantly affects a company’s environmental performance; specifically, the higher the media attention, the stronger the company’s regulations and the better the environmental performance [51]. Media monitoring allows companies to actively address the air pollution problem caused by carbon emissions and adopt green governance tools [46]. From the perspective of evolutionary game theory, the media can assist government departments in increasing pollutant regulation. Because government resources are limited, enterprises must cover up their violations to avoid government penalties, making it difficult for violations to be detected. Media monitoring has a wide range of characteristics, high event sensitivity, and fast dissemination, which helps focus on enterprises with excessive pollutants or high carbon emissions [52], forcing enterprises to reduce their corporate pollutant emissions. Considering this analysis, we propose the following:
Hypothesis 3 (H3).
Media monitoring further increases the positive effect of reducing enterprises’ carbon emission intensity to enhance their sustainability.

2.4. Moderating Role of Green Perception of Executives

Cognitive theory proposes that social structures and the external environment interact to shape human behavior [53]. Companies comprise individuals with specific social characteristics, and their green behavior is equally impacted by a range of variables. As key strategic decision-makers inside an organization, corporate leaders’ personal characteristics play a key role in shaping an organization’s strategic decisions. In 1997, Ocasio [54], based on the attentional perspective (ABV), proposed that both the cognitive and organizational structures of executives limit and influence what they focus on and the perspective through which decisions are made [55,56]. Previous works have also highlighted the intrinsic significance of leadership in organizations, with some authors arguing that administrators’ subjective awareness directly affects corporations’ low-carbon policies through its impact on making choices and developing strategies [57]. Managers’ internalization of information about the external environment is also a factor in strategic cognitive theory [58]. Rather than passively responding to environmental pressure [59], environmentally conscious executives subjectively drive green behaviors, such as corporate eco-innovation [60]. Theories at the highest levels of an organization state that the top management team is crucial for making and executing strategic decisions. Executive low-carbon cognition is a key driver of corporate low-carbon performance [30], and senior management environmental consciousness and dual green innovation are strongly and positively associated with a firm’s green competitive advantage [61]. Companies with more environmentally conscious executives are more likely to invest in green technology, which, in turn, leads to greater energy savings and reduced emissions, as predicted by corporate behavior theory [62]. According to reputation theory, executives who damage the environment to achieve short-term corporate performance end up hurting not only their corporate image but also their compensation, career, and reputation in the industry. Thus, environmentally conscious executives tend to make low-carbon and environmentally friendly decisions for reputational reasons, thereby increasing the green behavior of the firm. Based on this study, we propose the following:
Hypothesis 4 (H4).
Executives’ green perceptions further increase the positive effect of reducing enterprises’ carbon emission intensity to enhance their sustainability.
Figure 1 is the study model. H1 in the figure is to verify the influence of the independent variable carbon emission intensity on the dependent variable sustainability. H2-H4 are to investigate whether the influence of corporate carbon emission intensity on corporate sustainability is disturbed by the three moderating variables: government environmental protection subsidy (H2), media monitoring (H3), and executive green perception (H4), respectively.

3. Research Methodology and Design

3.1. Data and Sample

In 2015, many nations joined the Paris Agreement, and the world began to intensively investigate new energy conservation and carbon reduction strategies. In 2015, the new Environmental Protection Law passed by China was considered the most stringent in the world. It filled all the gaps in previous laws related to management and oversight, preservation of the environment, prevention of pollution, disclosure of data, and citizen involvement. Additionally, it clarifies the legal liability of businesses contaminating the environment as well as the significant expense of pollution control. While we consider that the carbon emission reduction actions of Chinese enterprises will increase significantly in the current domestic and international situation, owing to insufficient access to carbon emission reduction data for enterprises before 2015, we set the sample period as 2015–2020.
The Shanghai and Shenzhen A-share market is one of the largest domestic stock markets in China, with a very large market scale that reflects the overall situation of China’s domestic economy, the operation of industrial policies, etc. Moreover, the Shanghai Stock Exchange and Shenzhen Stock Exchange have been issuing social responsibility guidelines since 2006, requiring listed companies to disclose environmental information. The listed companies in Shanghai and Shenzhen A-shares were chosen as they are more representative and the data are more available.
We used the China Stock Market & Accounting Research (CSMAR) database to choose all A-share market companies listed from 2015 to 2020 on the Shanghai and Shenzhen stock exchanges. Special treatment, special treatment*, and special transfer status enterprises were omitted from the sample. The sample data for the finance industry, which is not a high-carbon industry, were also eliminated, as were samples with significant gaps in essential information. The variables were winsorized at the upper and lower 1% levels to reduce outliers (excluding dummy variables). Furthermore, we treated continuous variables logarithmically to eliminate heteroscedasticity interference. Following screening, a valid sample size of 11,822 was obtained. Stata 17.0 was used to clean and analyze the data and to generate statistical analysis findings.
The majority of Chinese businesses’ carbon emissions information is disclosed in their social responsibility, sustainability, and environmental reports. In this study, the carbon emissions data of Chinese listed companies were manually collected using crawler technology through the above-mentioned channels. Data on government environmental protection subsidies were obtained manually using web crawlers from annual company reports, social responsibility reports, company websites, and environmental department websites. Media monitoring-related data were obtained from the reported data in the CFND, a financial news database of Chinese listed companies. Data on the green perceptions of executives were obtained primarily from annual company reports. Finally, data on corporate financial indicators and other related variables were derived primarily from the CSMAR database.

3.2. Definition and Measurement of Variables

3.2.1. Explained Variables

Corporate sustainability is the independent variable in this study because it describes a company’s capacity to accomplish its strategic goals and protect its market position for long-term survival and perpetual growth, which allow a company to remain dominant, maintain profitability, and grow robustly in highly competitive fields. This study uses the Van Horne static model cited by Wu et al. [63,64] to measure a firm’s profitability and competitiveness sustainability. Namely,
S G R = N e t   s a l e s   i n t e r e s t   r a t e × t o t a l   a s s e t   t u r n o v e r × i n c o m e   r e t e n t i o n   r a t e × e q u i t y   m u l t i p l i e r ( 1 n e t   s a l e s   i n t e r e s t   r a t e × t o t a l   a s s e t   t u r n o v e r × i n c o m e   r e t e n t i o n   r a t e × e q u i t y   m u l t i p l i e r )

3.2.2. Explanatory Variables

Carbon intensity, defined as greenhouse gas emissions per unit of revenue, is a credible statistic that can supplement climate risk metrics. To make the indication easier to read, it was multiplied by 100 based on the formula used by Chapple et al. [65] to determine the carbon intensity.
E n t e r p r i s e   c a r b o n   i n t e n s i t y = E n t e r p r i s e   c a r b o n   e m i s s i o n s E n t e r p r i s e   m a i n   b u s i n e s s   i n c o m e × 100
According to Zhang et al. [66], firms accounting for GHGs must utilize the globally recognized Greenhouse Gas Accounting System (GHGAS) protocol. The calculation technique released by the National Development and Reform Commission (NDRC) is the same as that described above. The GHG accounting method divides enterprise carbon emissions into three categories. Companies must report Scope 1 and Scope 2 carbon emissions under GHG accounting. Scope 3 includes all indirect emissions from non-company sources. This research focuses on Scope 1 and Scope 2, owing to data availability and reliability. Scope 1 comprises direct GHG emissions from sources owned by the company or under the company’s control, such as combustion emissions from boilers, furnaces, cars, etc., and process equipment emissions from chemical manufacturing. Scope 2 covers the indirect GHG emissions caused by commercial energy and heat purchases.
We found that businesses’ carbon emissions can be divided into two distinct categories. The first is carbon emissions that are stated directly in enterprises’ annual and social responsibility reports. In the second category, enterprises do not directly disclose their carbon emissions but calculate and reveal different types of fossil energy, electricity, and heat consumption. We separate Scope 1 and Scope 2 emissions and sum them according to the “Guidelines on Enterprise Greenhouse Gas Emissions Accounting Methods and Reporting” (hereinafter referred to as “Guidelines”) issued by the NDRC for different industries. The final summation of the two types of carbon emissions is used as the scope of the independent variables in this study.
The specific calculation technique for businesses that declared only fossil energy, electricity c, and heat consumption is as follows. According to the Intergovernmental Panel on Climate Change (IPCC) Guidelines for National Greenhouse Gas Inventories (2006), one fuel’s carbon emissions are determined as follows:
E i = A D i E F i
where AD is the activity-level data for the consumption of this fossil fuel, which is the product of the consumption of this fuel and the average low-level heat content, and EF is the emission factor of this fossil fuel. Fuel consumption was obtained from the data disclosed by the enterprises, and the default values of the average low-level heat content and the emission factor of the fossil fuel were obtained from the guide issued by the NDRC, which provides the commonly used official parameters.
The calculation method for electricity consumption is the same as that for fossil fuel energy consumption: AD is the power purchased by the enterprise and EF is the average emission factor of the power grid in the region where the enterprise is located. Climate change data were obtained from the National Center for Strategic Research and International Cooperation.
For thermal power consumption, the emissions factor determined by the national uniform regulations needs to be 0.11 t   C O 2 / G J .
The total carbon emissions in this study were obtained from both direct and indirect sources.

3.2.3. Moderating Variables

Information on government environmental subsidies was gathered manually from annual firm reports, social responsibility reports, company websites, and environmental department websites. There is mention of study [67], in which government environmental subsidies were measured by adjusting the relative levels of government environmental subsidies for adequate scaling.
The Financial News Database (CFND) coverage data from the Chinese Research Data Services (CNRDS) database were used to collect media monitoring data, which can be categorized into positive, neutral, and negative reports based on the emotion trends in media coverage. Considering that the tendency of all reports can more comprehensively reflect the indicator of media pressure and the degree of media monitoring, this study refers to Clarkson’s [68] method and uses the Janis–Fadner (JF) coefficient, which integrates the sentiments of positive and negative media reports. To measure the tendency of media reports and treat the indicator positively for the sake of understanding, the larger the index, the more companies are under greater media pressure and scrutiny. Therefore, media coverage is defined as follows:
J a n i s F a d n e r J F c o e f f i c i e n t = e c c 2 t 2 , e < c e 2 e c t 2 , e > c 0 , e = c
where e represents negative media reports, c represents positive media reports, and t is the sum of e and c. In addition, the Janis–Fadner coefficient has a value range of [–1,1]. The closer it is to 1, the more negative the media coverage of the company, indicating that public pressure is higher and the company is under tighter supervision; the closer it is to −1, the more positive the media coverage of the company, indicating less public pressure and less supervision.
There are three main dimensions of executive green cognition: the perception of green competitive advantage, awareness of social responsibility, and perception of external pressure. Executive green cognition is defined as corporate executives’ knowledge of and psychological experiences regarding resources and environmental issues. Reyes-Menendez et al. demonstrated that longitudinal data could be obtained using text analysis [69]. We chose textual analysis to obtain longitudinal data to effectively measure executives’ environmental perceptions. We also referred to Zhang et al.’s study [70] to select a series of keywords based on the above three dimensions using Python and measured executives’ green perceptions by the rate of occurrence with which these terms appeared in listed corporations’ annual reports from 2015 to 2020.

3.2.4. Control Variables

Referring to the studies of Gallego-Álvarez et al. [71] and Chen et al. [72], we selected firm size (Size), gearing (Lev), return on assets (Roa), firm growth (Growth), cash flow ratio (Cashflow), net asset turnover (Ato), market value (Tobin-Q), equity nature (Soe), and firm age (Age) as control variables in this study. Additionally, we created a year effect (Year) and an industry effect (Industry) to make dummy variables equal to 1 if they fell within the appropriate year and industry, respectively, and 0 otherwise. Changes in the macroenvironment and government policies can cause firms’ efforts to reduce carbon emissions to vary from industry to industry and from year to year because industrial policies and macroeconomic environments change over time. Table 1 presents all of the study variables and their explanations.

3.3. Model Design

3.3.1. Benchmark Model

To test Hypothesis 1, we constructed the following model with reference to Busch et al. [73] to investigate the relationship between carbon intensity and corporate sustainability.
S G R i t = α 0 + α 1 C e s i t + Σ C o n t r o l i t + µ i + γ t + ε i t .
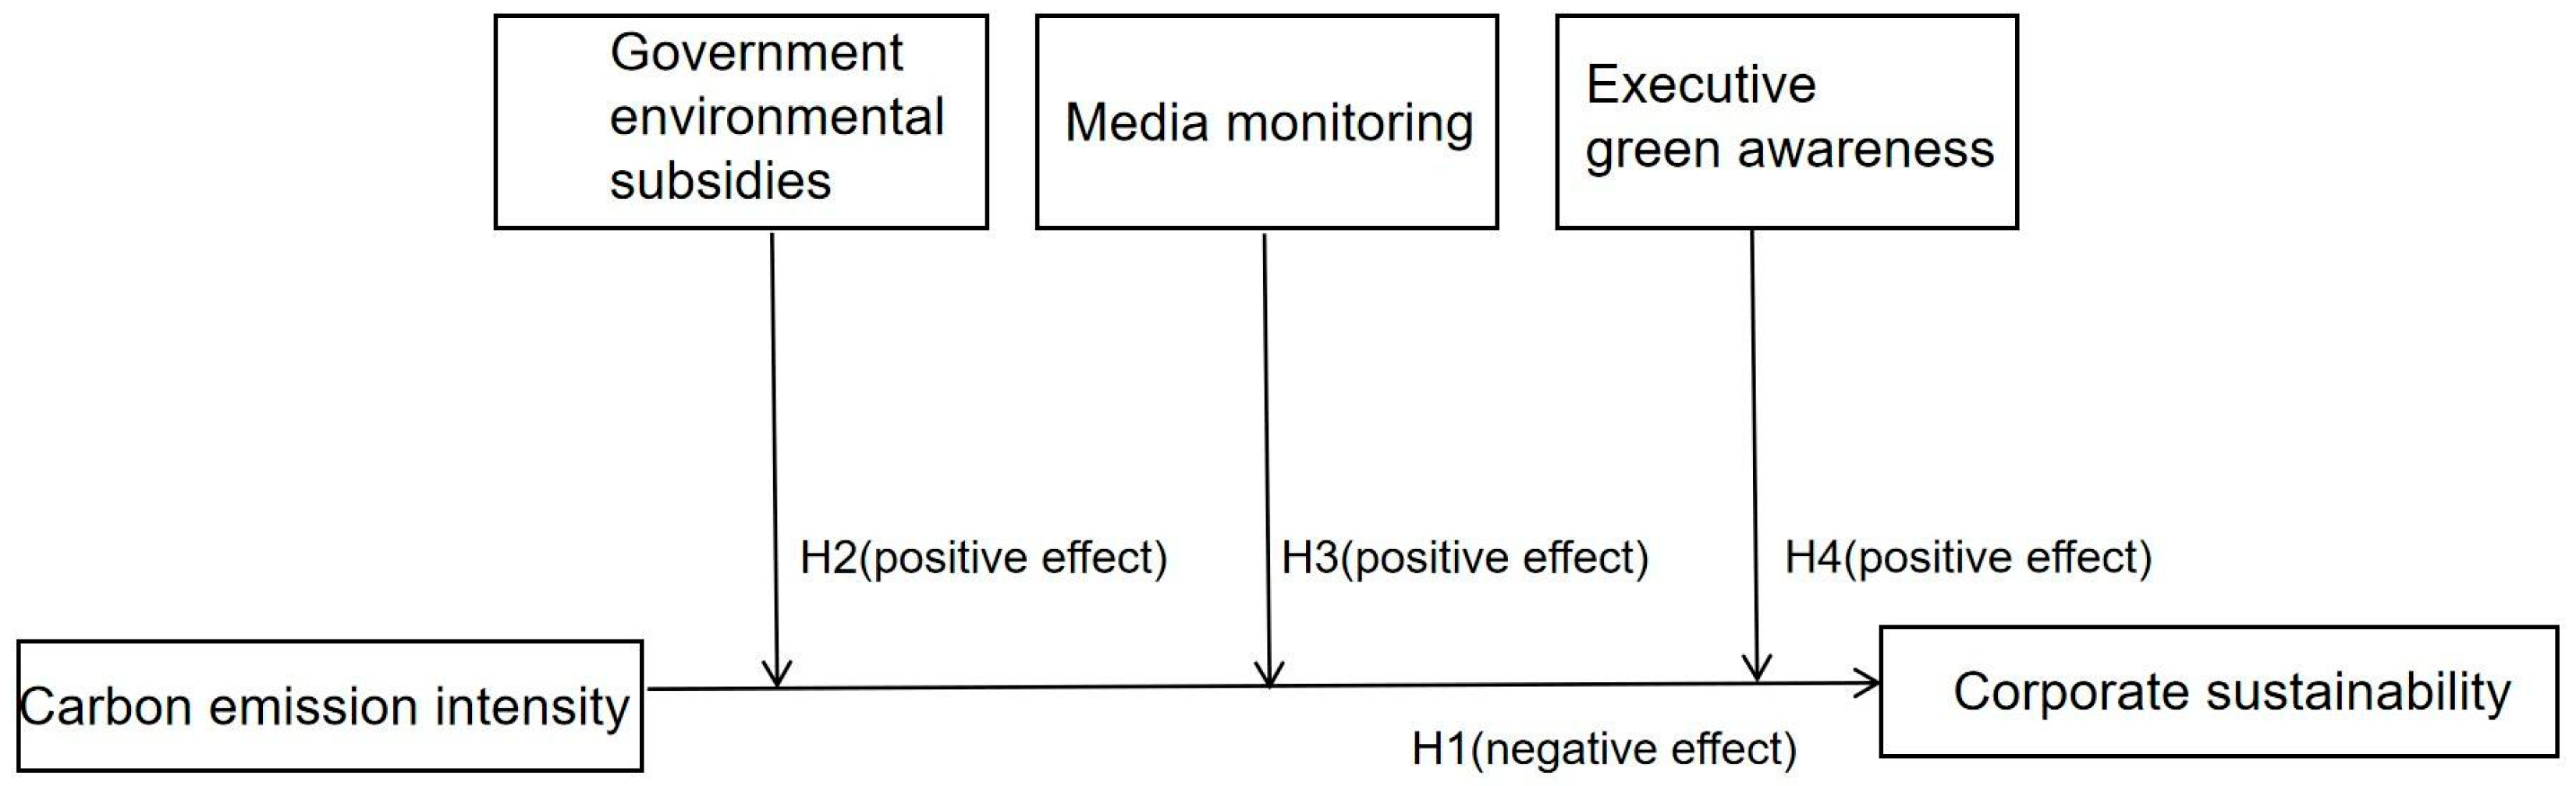
In the baseline regression model in Equation (5), the subscripts I and γ t denote individual companies and years, respectively. The explanatory variable is a firm’s ability to sustain itself (SGR). The carbon intensity of the enterprise is the explanatory variable (Ces). The control variables influence a firm’s ability to sustain itself. This study adds industry fixed effects to individual effects and year fixed effects t to lessen the effects of person heterogeneity and year features on firm sustainability, where ε i t is the random error term of the model. Robust standard error regressions were employed to address potential heteroscedasticity concerns. If α 1 is less than zero, this indicates that reducing enterprises’ carbon emission intensity has a positive impact on corporate sustainability, confirming Hypothesis 1.

3.3.2. Moderating Effect Model

We added the interaction terms of the moderating variables with corporate carbon emission intensity to the baseline regression model to investigate how they reduce carbon emission intensity and improve corporate sustainability [74]. Hayes [75] regenerated the transaction multiplier term after centering the variables to make the regression equation coefficients more explanatory and regressed the three sets of moderating variables with robust standard errors to account for heteroscedasticity. The model is shown below.
S G R i t = β 0 + β 1 C e s i t + β 2 E n v s u b i t + β 3 C e s i t E n v s u b + Σ C o n t r o l i t + µ i + γ t + ε i t .
Model (2) modifies Model (1) by adding government environmental subsidies and their interplay with enterprise carbon emission intensity. Model (2) predicts that government environmental subsidies (Envsub) have a beneficial effect on lowering firms’ carbon emission intensities, leading to more sustainable growth if the coefficient of the interaction term has a statistically significant negative value.
S G R i t = γ 0 + γ 1 C e s i t + γ 2 M e d i a i t + γ 3 C e s i t M e d i a + Σ C o n t r o l i t + µ i + γ t + ε i t
Model (3) builds on Model (1) by including the moderating variable of media monitoring and its interaction term with firms’ CE intensity. Model (3) predicts that media monitoring (Media) can further attenuate the positive effect of firms’ reduction in carbon emission intensity on improving enterprise sustainability if the interaction term’s coefficient is negative and can pass the significance test.
S G R i t = θ 0 + θ 1 C e s i t + θ 2 E g a i t + θ 3 C e s i t E g a + Σ C o n t r o l i t + µ i + γ t + ε i t .
Model (4) incorporates the independent variable of carbon emission intensity of the firm as well as the moderating variable of executive green perception and their interaction term, all of which is based on Model (1). With a negative coefficient for the interaction term in Model (4), executive green perception (Ega) would be expected to have a beneficial influence on enhancing enterprise sustainability by decreasing the intensity of carbon emissions.

4. Results of the Empirical Analysis

4.1. Descriptive Statistics and Correlation Analysis

Table 2’s descriptive statistics show that Chinese businesses generally have a low level of sustainability capability, with a mean value of 0.0317 for the sustainability capability indicator (SGR) and a median value below the average of 0.0081, which indicates that over half of Chinese businesses have a low level of sustainability capability. There is also a wide range in sustainability capabilities across the sample businesses, as indicated by the standard deviation of 0.0792, which ranges from −0.0658 to 0.5668. The independent variable carbon emission intensity (Ces) index in the sample enterprises has a mean value of 0.0047 and a standard deviation of 0.0018, suggesting that the index follows a normal distribution. Its median value is 0.0044, which is closer to the mean value of 0.0047, suggesting that roughly half of the carbon emission intensities of the sample enterprises are located in the middle level. Its minimum value is 0.0015 and the maximum value is 0.0180, suggesting that the distribution spans from very low to very high and that there are high-carbon enterprises. Nearly half of the businesses are eligible to receive government subsidies, and the range is wide: government environmental subsidies (Envsub) have a mean value of 0.003 and a standard deviation of 0.002. The minimum value is 0, the median value is 0.0002, and the maximum value is 0.0015. There is a wide range in the extent to which businesses receive media monitoring, with the median and mean indicators for media monitoring (Media) showing that less than half of all businesses receive media monitoring, with values ranging from −0.7959 to 0.7959. Half of all executives are environmentally conscious, according to the Executive Green Awareness Index (Ega), yet there is a wide range of scores on this metric. In conclusion, it is clear that the sample companies display a wide range of individual traits. In addition, the variables were selected from a fair range, and there were no major outliers or indicators that were inconsistent with the regression premise. More importantly, the sample we chose corresponds to the needs of this investigation.
As shown in Table 3, before analyzing the effect of corporate carbon intensity on corporate sustainability, a correlation test was performed to test for multicollinearity and to understand the correlation between the variables. Pearson correlation coefficients were obtained. The table demonstrates a substantial relationship between the carbon intensity of a firm (Ces) and its sustainability capabilities (SGR), with a coefficient of −0.0833, thus confirming Hypothesis 1. Based on the data presented in the table of correlation coefficients, it appears that all the variables in this study are independent of one another and that multicollinearity is not a major issue. In addition, the variance inflation factor (VIF) value test showed that no variables had VIF values greater than 3; therefore, we can disregard any confounding caused by multicollinearity in the primary results.

4.2. Analysis of Empirical Results

4.2.1. Corporate Carbon Emission Intensity and Corporate Sustainability

Before selecting the model, a Hausman test was performed, yielding a p-value of 0.000. This study employed a fixed-effects regression model that simultaneously adjusts for year, industry, and person effects. Table 4 shows the results of the regressions between carbon emission intensity and corporate sustainability. After controlling for several variables, the regression coefficients of enterprise carbon intensity (Ces) and enterprise sustainability capabilities (SGR) are negative at the 1% significance level, establishing a negative link between the two. In other words, the lower the enterprise’s carbon emission intensity, the better its sustainability. Hence, H1 is supported.

4.2.2. The Moderating Role of Government Environmental Subsidies on the Carbon Emission Intensity and Sustainability of Enterprises

Government environmental subsidies strengthen the relationship between the intensity of a company’s carbon emissions and its sustainability. After controlling for several control variables, the corporate carbon emission intensity coefficient (Ces) in Model (2) is −2.5756, and the coefficient of its cross-product term with the government environmental protection subsidy (Ces*Envsub) is −0.0015. Both outcomes are significant at the 1% level. According to the regression analysis, firms’ sustainable development potential increases with lower carbon emission intensity. This positive effect is further bolstered when government environmental subsidies increase. The adjusted-R2 for Model (2) increased significantly from 0.210 to 0.230 in Model (1). Thus, H2 is supported.

4.2.3. The Moderating Effect of Media Monitoring on Corporate Carbon Emission Intensity and Corporate Sustainability

Media monitoring moderates the association between corporate carbon emission intensity and company sustainability. As shown in column (3) of Table 4, the coefficient of the independent variable corporate carbon intensity (Ces) in Model (3) is −4.4094, and the coefficient of its cross-product term with media supervision (Ces*Media) is −0.0088, both of which are significant at the 1% level. This demonstrates that media monitoring has a negative moderating effect on the relationship between an enterprise’s carbon emission intensity and its sustainability. In other words, the closer the value of media monitoring is to 1, the more negative the media coverage, the more media pressure enterprises face, the stronger the supervision they receive, and the greater the effect of enterprises reducing their carbon emission intensity on improving their sustainability. Media monitoring further strengthens the relationship between enterprises’ carbon emission intensity and sustainability. However, the change in media pressure is limited and its value range is [−1,1], indicating that media pressure alone is not sufficient to reduce corporate carbon emissions on a large scale. The adjusted R 2 for Model (2) increased significantly from 0.210 in Model (1) to 0.244. Therefore, H3 is supported.

4.2.4. The Moderating Effect of Executives’ Green Perceptions on Carbon Emission Intensity and Corporate Sustainability

The green perceptions of executives moderate the association between carbon intensity and firm sustainability. The coefficient of the independent variable corporate carbon emission intensity (Ces) in Model (4) is −4.4198, and the coefficient of its cross-product term (Ces*Ega) with executive green perception is −0.0113, both of which are statistically significant at the 1% level, as shown in column (4) of Table 4. This suggests that CEOs’ green perception negatively moderates the association between carbon emission intensity and business sustainability. In other words, the greener the executives’ perspective, the greater the benefit of reducing the carbon emission intensity of businesses to boost their capacity for sustainable development. The adjusted-R2 for Model (2) increased significantly from 0.210 to 0.253. Hence, H4 is supported.

4.3. Robustness Tests

Four methods were adopted for robustness testing. In addition to removing the sample of the pandemic year and rerunning the regression analysis after adjusting for the statistical methods of the independent variables, considering the large sample size of this study, the total sample was regressed by grouping the top and bottom 20% of the extreme samples according to the enterprise size to test the reliability of the results. To further validate these findings, two-stage least squares (2SLS) regression was performed to investigate the robustness of the main effects regression.

4.3.1. Removing Samples during the 2020 Pandemic Year for Robustness Testing

As we all know, in late 2019 and early 2020, the COVID-19 pandemic overtook the globe. In response, all countries adopted blockade and quarantine policies. During the COVID-19 blockade, many businesses ceased production, and travel activities were restricted, leading to significant changes in carbon and other GHG emissions worldwide. According to the Global Energy Review: CO2 Emissions 2020 report issued by the International Energy Agency, worldwide energy-related CO2 emissions decreased by 5.8% as a result of COVID-19, marking the highest annual fall since World War II. Owing to decreased energy demand, worldwide energy-related CO2 emissions in 2020 were approximately 2 billion tons lower than those in the previous year. Of these, CO2 emissions from the transportation sector owing to oil use alone were reduced by 1.1 billion tons.
To ensure the accuracy of the results, the researchers decided to remove the sample from 2020, a year with a sudden force majeure event, and rerun the regression test. The results, displayed in Table 5, show that the regression coefficient of the independent variable enterprise carbon emission intensity on the sustainability of enterprises shown in column (1) of Table 5 is −6.5335 and is at the 1% significance level, which agrees with the outcomes of the prior regression analysis and suggests that a reduction in enterprise carbon emission intensities can improve sustainability. After incorporating the moderating variables in columns (2)–(4), the three interaction term coefficients are −0.0016, −0.0091, and −0.0126, respectively, and are all significant at the 1% level. By adding moderating variables to the model, the corrected values significantly increased. These findings match those of the regression analysis in this study. The intensity of a company’s carbon emissions is positively correlated with green sentiment among executives, media scrutiny, and government environmental incentives. That is, with the involvement of the above-mentioned moderating variables, the promotional effect of corporate carbon emission intensity reduction on improving corporate sustainable development is further enhanced.

4.3.2. Adjusting the Statistical Methods of Independent Variables for Robustness Testing

To ensure the validity of the research results, this study adjusts the statistical methods of the independent variables and reruns the regression analysis because of the difficulty in obtaining carbon emission indicators for publicly traded companies. The accounting of the carbon intensity of businesses continues to use the method of Chapple et al. [65]. The statistical method of carbon emissions is related to the study of Xu et al. [76], which is roughly based on the industry’s total energy consumption in million tons of CO2. The specific accounting equation is given in Equation (9).
E n t e r p r i s e   c a r b o n   e m i s s i o n s = E n t e r p r i s e   m a i n   o p e r a t i n g   c o s t s I n d u s t r y   m a i n   c o s t × Total   energy   consumption   of   the   industry × CO 2   conversion   factor
The CO2 conversion factor for one ton of standard coal, as suggested by the National Development and Reform Commission, is 2.4567. Based on Equation (9), the carbon emissions of enterprises were first counted and then introduced into Equation (10) to obtain the carbon emission intensity of enterprises (Ces2) in kg/CNY. We examined the China Energy Statistics Yearbook and China Industrial Economic Statistical Yearbook to determine the industry’s total energy use and main costs, respectively.
E n t e r p r i s e   c a r b o n   i n t e n s i t y = E n t e r p r i s e   c a r b o n   e m i s s i o n s E n t e r p r i s e   m a i n   b u s i n e s s   i n c o m e
Table 6 presents the regression results. After controlling for a series of variables affecting enterprise sustainability, the regression coefficient of the independent variable of enterprise carbon emission intensity on enterprise sustainability, shown in column (1) of Table 6, is −0.0257 and significant at the 1% level, which matches the results of the previous regression analysis. This indicates that for each unit reduction in enterprise carbon emission intensity, enterprise sustainability increases by 2.57%. After incorporating the moderating variables in columns (2)–(4), the three interaction term coefficients are −0.0028, −0.0069, and −0.0075, respectively, all of which are statistically significant at the 1% level. In the model in which the moderating variables were included, the adjusted R2 increased considerably. This finding supports the regression analysis results of this study. The results reveal that government environmental incentives, media monitoring, and executives’ green perceptions all improve the correlation between carbon emission intensity and firm sustainability. That is, with the involvement of the above-mentioned moderating variables, the contribution of corporate carbon emission intensity reduction to enhancing corporate sustainable development is further enhanced.

4.3.3. Robustness Test by Taking the Top and Bottom 20% of the Total Sample for the Mechanism Sample

Considering that we have a sufficient sample size, we divided the total sample according to the size of enterprises and took the upper and lower 20% quartiles of the total sample as two extreme value groups for group regression to validate the results. According to the regression results in Table 7, the coefficients between carbon emission intensity and enterprise sustainability in the two extreme value groups are −10.4756 and −4.6701, respectively, and are significant at the 1% level. This confirms the previous regression results, further verifying the stability of the regression results.

4.3.4. Robustness Test Based on the Two-Stage Least Squares Method

Baseline regressions may encounter endogeneity issues when analyzing the effect of corporate carbon emission intensity on company sustainability because of the study’s varied selection of control factors, as well as missing and causality variables. According to the findings, businesses that reduce their carbon emissions can have a major impact on corporate sustainability, but improvements in sustainability may have the opposite effect. Thus, additional endogeneity tests on the model are required to reinforce the validity of the results. Referring to relevant studies on carbon emissions by previous scholars, we draw on the research of Liu et al. [77] and Yang et al. [78] and select the independent variable lagged one-period data (lCes) as the instrumental variable for the intensity of corporate carbon emissions, which is tested using a two-stage estimation method. In the 2SLS regression, the same tests were employed to determine the existence of weak instrumental factors and identify instrumental variables.
Table 8 presents the results of the 2SLS analysis. The regression coefficient of the independent variable corporate carbon intensity (Ces) on corporate sustainability (SGR) is −14.4760, which is significant at the 1% level, and increases significantly after addressing the endogeneity of the variable. This finding suggests that reducing the intensity of a company’s carbon emissions has a beneficial effect on sustainability. Consistent with the findings of previous studies, the regression results incorporating instrumental variables further verified the robustness of this investigation. Moreover, according to Table 8, the model’s Kleibergen–Paap rk LM statistic is 99.520, which equates to a p-value of zero, suggesting that the instrumental variables are identifiable. Additionally, the Cragg–Donald Wald F statistic value of 273.224 is significantly greater than the 10% judgment threshold of the crucial value of 16.38 for the Stock–Yogo weak ID test; consequently, there is no concern with respect to weak instrumental variables.

5. Study Results

This study empirically examines the influence of corporate carbon emission intensity on corporate sustainability using a fixed-effects model with a sample of non-financial listed companies in Shanghai and Shenzhen A-shares in China from 2015 to 2020. It verifies the mechanisms of action through the participation of three moderating variables: government environmental subsidies, media monitoring, and executives’ green perceptions. The results indicate that a reduction in the intensity of carbon emissions plays an essential role in fostering the sustainable growth of corporations. Every unit increase in carbon intensity of a company reduces the sustainability of the company by 0.0649 units, thus validating Hypothesis 1. Moreover, the coefficients of the cross-product terms of the three moderating variables and the independent variable are −0.0015, −0.0088, and −0.0113, respectively, and they are significant at the 5%, 1%, and 1% confidence levels, respectively. This indicates that government environmental subsidies, media monitoring, and executives’ green perceptions all strengthen the positive effect between corporate carbon emission reduction and corporate sustainable development, thus validating Hypotheses 2–4.

6. Discussion and Conclusions

6.1. Discussion

This study focuses on two hot topics that are currently of global concern—carbon emissions and sustainable development. It also cleverly argues that there is a significant negative relationship between the intensity of corporate carbon emissions and corporate sustainability at the firm level. Although it has been confirmed in previous studies that carbon emissions are crucial to the sustainable development of the world economy [6], this study further argues for a correlation between the two from the perspective of Chinese enterprises. This has practical implications for the Chinese government to formulate energy conservation and emission reduction policies according to local conditions.
Moreover, Chinese companies are very conscious of their relationship with the government due to resource dependence, and the Chinese government even has a strong influence on competition between companies [79]. In order to conform to the government’s green orientation or to obtain government subsidies, enterprises often passively choose to increase green investments and reduce carbon emissions. As several scholars, such as Zhang et al. [80] and Li et al. [81], have used empirical analysis to demonstrate, governmental low-carbon pilot city policies help firms reduce carbon emissions. Additionally, this policy is essential for enterprises to improve their environmental performance and achieve sustainable development. This study demonstrates that reducing carbon emissions can effectively enhance the sustainability of enterprises at the enterprise level. This will help Chinese enterprises to strengthen their determination to save energy and reduce emissions.
Of course, many scholars have already stated from the financial performance and environmental performance that enterprises are concerned, and argued for the impact of corporate carbon emissions on them. Additionally, different conclusions have been obtained. For instance, Yu et al. [39] thought that corporate carbon intensity significantly improved corporate financial performance, while Laskar et al. [82] hold the opposing view. This study does not select the financial indicators that measure the short-term performance of enterprises as the research object, but focuses more on the growth and competitiveness of enterprises. This study uses corporate sustainability as the dependent variable and explores the impact of corporate carbon emission reduction on it, which is more in line with the long-term goals of enterprises.
In addition, this study selects moderating variables from the stakeholder perspective in addition to arguing that corporate carbon emission reduction can effectively enhance corporate sustainability. Further exploring the mechanism of the role of enterprise carbon emission reduction and enterprise sustainable development makes this paper richer and enables it to provide practical guidance. Previous studies have mostly used government environmental subsidies [83], media monitoring [46], and executives’ environmental perceptions [62] as independent variables to explore their effects on corporate carbon emissions. Some studies argue that the government provides the best subsidies for corporate green technology investments, stimulating companies to reduce their carbon emissions. In addition, media monitoring can determine whether companies want to obtain positive media coverage for reputational reasons or are afraid of the risk of public opinion due to negative coverage. Corporate executives’ low-carbon awareness plays an important and positive role in the low-carbon transition process. Instead of focusing on their relationship with business decisions, this study focuses on whether it can enhance the positive relationship between corporate carbon reduction and sustainable development. Additionally, the hypotheses are confirmed by the empirical results.
Furthermore, this research expands the stakeholder analysis of the relevance of corporate carbon intensity in achieving development goals, which is helpful in clarifying the important role of government, media, and corporate executives in promoting corporate sustainable development. It assists regulators in formulating policies according to local conditions, encouraging enterprises to raise awareness of low-carbon and environmental protection, practicing green governance of energy saving and emission reduction, achieving green and sustainable development, and realizing China’s double carbon goal.
In this study, four methods were used for testing to ensure the robustness of the firm-level findings. This study first took the statistical approach of re-running the regression analysis after removing the sample from the pandemic year and replacing the carbon emission intensity of the firms. The 2SLS approach was also utilized for endogeneity testing. In addition, considering a more adequate sample size, this study also conducted regression analysis by dividing two extreme value groups according to the upper and lower 20% quartiles of enterprise size, and reliable research results were obtained.

6.2. Conclusions

6.2.1. Conclusion of the Study

Advance studies have been conducted to show that about 15% of companies achieved the sustainability paradigm in 2018–2019. Carbon-efficient companies are the majority of those that achieve sustainability. Even carbon-efficient firms have economic advantages over environmental advantages and are better able to achieve high-quality economic growth [84]. The adoption of new energy materials and innovations in low-carbon technologies by companies can improve the efficiency and sustainability of energy systems [85,86]. This is in line with the sustainable development goals proposed by the United Nations. At the same time, it can motivate firms concerned about financial performance to take the initiative to save energy and reduce emissions and improve carbon efficiency. The results of the previous study further support the hypothesis proposed in this study that the reduction in carbon emission intensity by firms is beneficial to enhance corporate sustainability. This study also argues for a significant relationship between the two after empirical analysis. It provides confidence for enterprises to carry out carbon emission reduction on their own and follow the green and sustainable development path.
Government subsidies have received much scholarly attention as a common means for governments to achieve economic and social goals. Prior studies have argued that firms increase their environmental expenditures [87] and mitigate carbon emissions [88] in order to obtain government support. Additionally, these behaviors promote the sustainable development of enterprises [88]. In addition, government subsidies can also positively moderate the positive effect between corporate green investment and sustainable development [89]. In this study, this variable was chosen as the moderating variable and the regression analysis proved that it can positively promote the positive effect of carbon reduction and sustainable development of enterprises. The findings of this study are consistent with the results of previous studies. In addition, it has also been shown in the literature that media monitoring can promote companies to actively adopt green tools for energy saving and emission reduction [46]. Additionally, environmentally conscious executives make green investment decisions and use green technologies to improve corporate carbon efficiency [62,86]. Positive stakeholders may drive companies toward more sustainable business practices [90], such as media engagement and green management behaviors of executives. This provides the necessary prior research support for this study. The results of this study also demonstrate that media monitoring and executives’ green perceptions can enhance the contribution of corporate carbon reduction to sustainable development.

6.2.2. Implication of the Study

This study explores the theoretical and practical significance of reducing businesses’ carbon emission intensity and supporting the implementation of development goals.
1. At the theoretical level, owing to the difficulty in obtaining carbon emissions data at the enterprise level in China, the entry points of existing studies are mostly carbon policy-related studies using provincial panel data. This study further enriches the research on enterprise carbon emissions and broadens the relevant theory of environmental governance. Simultaneously, it establishes a link between corporate carbon emission intensity and corporate sustainability from a micro-level corporate perspective. This study has important theoretical implications for firms’ green transformation and the effect of corporate carbon emission intensity reduction on sustainable corporate development.
2. At the practical level, this study is useful from three perspectives. (1) The corporate perspective: The results of this study provide effective support for addressing the shortsightedness of companies that focus only on financial performance and raises awareness of sustainable development. This provides confidence that enterprises can take the initiative to reduce carbon emissions, undertake green transformations, and achieve environmental social responsibility. (2) Government perspective: The government should assist regulators in drafting environmental policies that consider environmental sensitivity and optimize and adopt flexible environmental regulation strategies. The government can subsidize finances, tax concessions, and technology subsidies for businesses that participate in cleaner production, energy conservation, and emission reduction projects to encourage them to invest in emission reduction technologies and reduce their carbon footprint. (3) Stakeholder perspective: The results of this study also demonstrate the importance of media monitoring for enterprise carbon emission reduction. To ensure carbon peaking and neutrality, the media should be encouraged to actively participate in social supervision and enhance the coverage, accuracy, and timeliness of news reports. Through the media, we can further strengthen the environmental constraints on enterprises to increase their enthusiasm and incentives to participate in environmental management and consider environmental benefits while focusing on economic benefits. This study enhances executives’ understanding of the economic impacts of carbon emissions. Moreover, it increases awareness of the role of executives’ green perceptions and environmental awareness in guiding companies’ green transformations. To promote enterprise development in the direction of low-carbon and environmental protection, the government should incentivize senior management talents with green awareness to take up positions in enterprises, particularly high-carbon enterprises, by providing salaries, housing, and welfare subsidies. Meanwhile, management can also be motivated to make autonomous strategic decisions regarding energy savings and green transformation.

6.2.3. Limitations of the Study and Future Research Directions

The independent variable in this study only adopts the indicator of enterprises’ carbon-emission intensity. Future research can study multiple measurement dimensions, such as carbon emission efficiency, low-carbon input, and carbon management levels, to enhance the precision and depth of this study.
This study includes all industries, except the financial sector, which lacks focus and is not targeted in terms of guidance for subsequent policy formulation. The 2010 National Economic and Social Development Statistics Bulletin lists six industries that utilize large amounts of energy. These industries can be used as examples of high-carbon businesses. Examples of high-carbon industries include making chemical raw materials and products, smelting and rolling metals, smelting and rolling non-ferrous metals, making non-metallic mineral products, processing and coking oil, making nuclear fuel, and generating and supplying electricity and heat.
No additional heterogeneity analysis was conducted in this study. However, the differences in carbon emission intensity and its impact on the sustainability of enterprises can be explored further from the perspective of enterprise equity natures and life cycles to obtain more robust conclusions.

Author Contributions

Data curation and draft, S.Z.; methodology, review, and editing, S.J. All authors have read and agreed to the published version of the manuscript.

Funding

This research received no external funding.

Data Availability Statement

Not applicable.

Conflicts of Interest

The authors declare no conflict of interest.

References

  1. Ahmed, F.; Ali, I.; Kousar, S.; Ahmed, S. The Environmental Impact of Industrialization and Foreign Direct Investment: Empirical Evidence from Asia- Pacific Region. Environ. Sci. Pollut. Res. 2022, 29, 29778–29792. [Google Scholar] [CrossRef]
  2. Nathaniel, S.P. Modelling Urbanization, Trade Flow, Economic Growth and Energy Consumption with Regards to the Envi-ronment in Nigeria. GeoJournal 2020, 85, 1499–1513. [Google Scholar] [CrossRef]
  3. Cheal, A.J.; MacNeil, M.A.; Emslie, M.J.; Sweatman, H. The Threat to Coral Reefs from More Intense Cyclones under Climate Change. Glob. Chang. Biol. 2017, 23, 1511–1524. [Google Scholar] [CrossRef]
  4. Pauw, W.P.; Klein, R.J.T.; Mbeva, K.; Dzebo, A.; Cassanmagnago, D.; Rudloff, A. Beyond Headline Mitigation Numbers: We Need More Transparent and Comparable NDCs to Achieve the Paris Agreement on Climate Change. Clim. Chang. 2018, 147, 23–29. [Google Scholar] [CrossRef]
  5. Opoku, E.E.O.; Boachie, M.K. The Environmental Impact of Industrialization and Foreign Direct Investment. Energy Policy 2020, 137, 111178. [Google Scholar] [CrossRef]
  6. Xu, L.; Fan, M.; Yang, L.; Shao, S. Heterogeneous Green Innovations and Carbon Emission Performance: Evidence at China’s City Level. Energy Econ. 2021, 99, 105269. [Google Scholar] [CrossRef]
  7. Sun, J.; Dong, F. Decomposition of Carbon Emission Reduction Efficiency and Potential for Clean Energy Power: Evidence from 58 Countries. J. Clean. Prod. 2022, 363, 132312. [Google Scholar] [CrossRef]
  8. Mardani, A.; Streimikiene, D.; Cavallaro, F.; Loganathan, N.; Khoshnoudi, M. Carbon Dioxide (CO2) Emissions and Economic Growth: A Systematic Review of Two Decades of Research from 1995 to 2017. Sci. Total Environ. 2019, 649, 31–49. [Google Scholar] [CrossRef]
  9. Zafar, A.; Ullah, S.; Majeed, M.T.; Yasmeen, R. Environmental Pollution in Asian Economies: Does the Industrialisation Matter? OPEC Energy Rev. 2020, 44, 227–248. [Google Scholar] [CrossRef]
  10. Kellogg, W.W.; Schware, R. Climate Change and Society: Consequences of Increasing Atmospheric Carbon Dioxide, 1st ed.; Routledge: Oxfordshire, UK, 2019. [Google Scholar] [CrossRef]
  11. Shi, B.; Wu, L.; Kang, R. Clean Development, Energy Substitution, and Carbon Emissions: Evidence from Clean Development Mechanism (CDM) Project Implementation in China. Sustainability 2021, 13, 860. [Google Scholar] [CrossRef]
  12. Tsalis, T.A.; Malamateniou, K.E.; Koulouriotis, D.; Nikolaou, I.E. New Challenges for Corporate Sustainability Reporting: United Nations’ 2030 Agenda for Sustainable Development and the Sustainable Development Goals. Corp. Soc. Responsib. Environ. Manag. 2020, 27, 1617–1629. [Google Scholar] [CrossRef]
  13. Nathaniel, S.P.; Adeleye, N. Environmental Preservation amidst Carbon Emissions, Energy Consumption, and Urbanization in Selected African Countries: Implication for Sustainability. J. Clean. Prod. 2021, 285, 125409. [Google Scholar] [CrossRef]
  14. Zahoor, Z.; Khan, I.; Hou, F. Clean Energy Investment and Financial Development as Determinants of Environment and Sustainable Economic Growth: Evidence from China. Environ. Sci. Pollut. Res. 2022, 29, 16006–16016. [Google Scholar] [CrossRef] [PubMed]
  15. Zhang, J.; Wang, Y. How to Improve the Corporate Sustainable Development?—The Importance of the Intellectual Capital and the Role of the Investor Confidence. Sustainability 2022, 14, 3749. [Google Scholar] [CrossRef]
  16. Li, Z.; Wang, J. The Dynamic Impact of Digital Economy on Carbon Emission Reduction: Evidence City-Level Empirical Data in China. J. Clean. Prod. 2022, 351, 131570. [Google Scholar] [CrossRef]
  17. Yi, M.; Liu, Y.; Sheng, M.S.; Wen, L. Effects of Digital Economy on Carbon Emission Reduction: New Evidence from China. Energy Policy 2022, 171, 113271. [Google Scholar] [CrossRef]
  18. Huo, W.; Qi, J.; Yang, T.; Liu, J.; Liu, M.; Zhou, Z. Effects of China’s Pilot Low-Carbon City Policy on Carbon Emission Reduction: A Quasi- Natural Experiment Based on Satellite Data. Technol. Forecast. Soc. Chang. 2022, 175, 121422. [Google Scholar] [CrossRef]
  19. Li, Z.; Wang, J. Spatial Spillover Effect of Carbon Emission Trading on Carbon Emission Reduction: Empirical Data from Pilot Regions in China. Energy 2022, 251, 123906. [Google Scholar] [CrossRef]
  20. Erdoğan, S.; Onifade, S.T.; Altuntaş, M.; Bekun, F.V. Synthesizing Urbanization and Carbon Emissions in Africa: How Viable Is Environmental Sustainability amid the Quest for Economic Growth in a Globalized World? Environ. Sci. Pollut. Res. 2022, 29, 24348–24361. [Google Scholar] [CrossRef]
  21. Yang, M.; Chen, L.; Msigwa, G.; Tang, K.H.D.; Yap, P.-S. Implications of COVID-19 on Global Environmental Pollution and Carbon Emissions with Strategies for Sustainability in the COVID-19 Era. Sci. Total Environ. 2022, 809, 151657. [Google Scholar] [CrossRef]
  22. Palea, V.; Drogo, F. Carbon Emissions and the Cost of Debt in the Eurozone: The Role of Public Policies, Climate-related Disclosure and Corporate Governance. Bus. Strategy Environ. 2020, 29, 2953–2972. [Google Scholar] [CrossRef]
  23. Liu, M.; Zhou, C.; Lu, F.; Hu, X. Impact of the Implementation of Carbon Emission Trading on Corporate Financial Performance: Evidence from Listed Companies in China. PLoS ONE 2021, 16, e0253460. [Google Scholar] [CrossRef] [PubMed]
  24. Desai, R.; Raval, A.; Baser, N.; Desai, J. Impact of Carbon Emission on Financial Performance: Empirical Evidence from India. South Asian J. Bus. Stud. 2021, 11, 450–470. [Google Scholar] [CrossRef]
  25. Yunus, S.; Elijido-Ten, E.O.; Abhayawansa, S. Impact of Stakeholder Pressure on the Adoption of Carbon Management Strategies: Evidence from Australia. Sustain. Account. Manag. Policy J. 2020, 11, 1189–1212. [Google Scholar] [CrossRef]
  26. Raghunandan, A.; Rajgopal, S. Do ESG Funds Make Stakeholder-Friendly Investments? Rev. Account. Stud. 2022, 27, 822–863. [Google Scholar] [CrossRef]
  27. Liu, L.; Li, M.; Gong, X.; Jiang, P.; Jin, R.; Zhang, Y. Influence Mechanism of Different Environmental Regulations on Carbon Emission Efficiency. Int. J. Environ. Res. Public. Health 2022, 19, 13385. [Google Scholar] [CrossRef] [PubMed]
  28. He, Q.; Deng, X.; Li, C.; Yan, Z.; Kong, F.; Qi, Y. The Green Paradox Puzzle: Fiscal Decentralisation, Environmental Regulation, and Agricultural Carbon Intensity in China. Environ. Sci. Pollut. Res. 2022, 29, 78009–78028. [Google Scholar] [CrossRef]
  29. Dogan, E.; Hodžić, S.; Šikić, T.F. A Way Forward in Reducing Carbon Emissions in Environmentally Friendly Countries: The Role of Green Growth and Environmental Taxes. Econ. Res.-Ekon. Istraživanja 2022, 35, 5879–5894. [Google Scholar] [CrossRef]
  30. Jiang, Y.; Hu, Y.; Asante, D.; Mintah Ampaw, E.; Asante, B. The Effects of Executives’ Low-Carbon Cognition on Corporate Low-Carbon Performance: A Study of Managerial Discretion in China. J. Clean. Prod. 2022, 357, 132015. [Google Scholar] [CrossRef]
  31. Felício, J.A.; Rodrigues, R.; Caldeirinha, V. Green Shipping Effect on Sustainable Economy and Environmental Performance. Sustainability 2021, 13, 4256. [Google Scholar] [CrossRef]
  32. Bilal; Khan, I.; Tan, D.; Azam, W.; Tauseef Hassan, S. Alternate Energy Sources and Environmental Quality: The Impact of Inflation Dynamics. Gondwana Res. 2022, 106, 51–63. [Google Scholar] [CrossRef]
  33. Naseem, T.; Shahzad, F.; Asim, G.A.; Rehman, I.U.; Nawaz, F. Corporate Social Responsibility Engagement and Firm Performance in Asia Pacific: The Role of Enterprise Risk Management. of Enterprise Risk Management. Corp. Soc. Responsib. Environ. Manag. 2020, 27, 501–513. [Google Scholar] [CrossRef]
  34. Ferrat, Y. Carbon Emissions and Firm Performance: A Matter of Horizon, Materiality and Regional Specificities. J. Clean. Prod. 2021, 329, 129743. [Google Scholar] [CrossRef]
  35. Kang, K.; Zhao, Y.; Zhang, J.; Qiang, C. Evolutionary Game Theoretic Analysis on Low-Carbon Strategy for Supply Chain Enterprises. J. Clean. Prod. 2019, 230, 981–994. [Google Scholar] [CrossRef]
  36. Hussain, M.; Mir, G.M.; Usman, M.; Ye, C.; Mansoor, S. Analysing the Role of Environment-Related Technologies and Carbon Emissions in Emerging Economies: A Step towards Sustainable Development. Environ. Technol. 2022, 43, 367–375. [Google Scholar] [CrossRef]
  37. Ahi, P.; Searcy, C.; Jaber, M.Y. A Quantitative Approach for Assessing Sustainability Performance of Corporations. Ecol. Econ. 2018, 152, 336–346. [Google Scholar] [CrossRef]
  38. Arslan, H.M.; Khan, I.; Latif, M.I.; Komal, B.; Chen, S. Understanding the Dynamics of Natural Resources Rents, Environmental Sustainability, and Sustainable Economic Growth: New Insights from China. Environ. Sci. Pollut. Res. 2022, 29, 58746–58761. [Google Scholar] [CrossRef]
  39. Yu, P.; Hao, R.; Cai, Z.; Sun, Y.; Zhang, X. Does Emission Trading System Achieve the Win-Win of Carbon Emission Reduction and Financial Performance Improvement? Improvement? -Evidence from Chinese A-Share Listed Firms in Industrial Sector. J. Clean. Prod. 2022, 333, 130121. [Google Scholar] [CrossRef]
  40. Song, M.-L.; Cao, S.-P.; Wang, S.-H. The Impact of Knowledge Trade on Sustainable Development and Environment-Biased Technical Progress. Technol. Forecast. Soc. Chang. 2019, 144, 512–523. [Google Scholar] [CrossRef]
  41. Yuan, S.; Li, J.; Su, X. Impact of Government Subsidy Strategies on Supply Chains Considering Carbon Emission Reduction and Marketing Efforts. Sustainability 2022, 14, 3111. [Google Scholar] [CrossRef]
  42. Wu, W.; Li, X.; Lu, Z.; Gozgor, G.; Wu, K. Energy Subsidies and Carbon Emission Efficiency in Chinese Regions: The Role of the FDI Competition in Local Governments. Energy Sources Part B Econ. Plan. Policy 2022, 17, 2094035. [Google Scholar] [CrossRef]
  43. Zhao, J.; Jiang, Q.; Dong, X.; Dong, K. Would Environmental Regulation Improve the Greenhouse Gas Benefits of Natural Gas Use? A Chinese Case Study. Energy Econ. 2020, 87, 104712. [Google Scholar] [CrossRef]
  44. Yin, K.; Liu, L.; Gu, H. Green Paradox or Forced Emission Reduction-The Dual Effects of Environmental Regulation on Carbon Emissions. Int. J. Environ. Res. Public. Health 2022, 19, 11058. [Google Scholar] [CrossRef] [PubMed]
  45. Schmierbach, M.; McCombs, M.; Valenzuela, S.; Dearing, J.W.; Guo, L.; Iyengar, S.; Kiousis, S.; Kosicki, G.M.; Meraz, S.; Scheufele, D.A.; et al. Reflections on a Legacy: Thoughts from Scholars about Agenda-Setting Past and Future. Mass Commun. Soc. 2022, 25, 500–527. [Google Scholar] [CrossRef]
  46. Su, W.; Guo, C.; Song, X. Media Coverage, Environment Protection Law and Environmental Research and Development: Evidence from the Chinese-Listed Firms. Environ. Dev. Sustain. 2022, 24, 6953–6983. [Google Scholar] [CrossRef]
  47. Wang, K.; Zhang, X. The Effect of Media Coverage on Disciplining Firms’ Pollution Behaviors: Evidence from Chinese Heavy Polluting Listed Companies. J. Clean. Prod. 2021, 280, 123035. [Google Scholar] [CrossRef]
  48. Bailey, I. Media Coverage, Attention Cycles and the Governance of Plastics Pollution. Environ. Policy Gov. 2022, 32, 377–389. [Google Scholar] [CrossRef]
  49. Xue, J.; He, Y.; Liu, M.; Tang, Y.; Xu, H. Incentives for Corporate Environmental Information Disclosure in China: Public Media Pressure, Local Government Supervision and Interactive Effects. Sustainability 2021, 13, 10016. [Google Scholar] [CrossRef]
  50. Zhao, Z.; Liu, L.; Zhang, F.; Yang, G. Does Air Pollution Prompt Corporations to Implement Green Management? Evidence from China. Environ. Sci. Pollut. Res. 2022, 29, 8933–8946. [Google Scholar] [CrossRef]
  51. Guo, Z.; Lu, C. Corporate Environmental Performance in China: The Moderating Effects of the Media versus the Approach of Local Governments. Int. J. Environ. Environ. Res. Public. Health 2021, 18, 150. [Google Scholar] [CrossRef]
  52. Wang, X.; Wu, G.; Xiang, Z.; Zhang, J. Air Pollution and Media Slant: Evidence from Chinese Corporate News. Emerg. Mark. Financ. Trade 2022, 58, 2880–2894. [Google Scholar] [CrossRef]
  53. Darvishmotevali, M.; Altinay, L. Green HRM, Environmental Awareness and Green Behaviors: The Moderating Role of Servant Leadership. Tour. Manag. 2022, 88, 104401. [Google Scholar] [CrossRef]
  54. Ocasio, W. Towards an Attention-Based View of the Firm. Strateg. Manag. J. 1997, 18, 187–206. [Google Scholar] [CrossRef]
  55. Kleinknecht, R.; Haq, H.U.; Muller, A.R.; Kraan, K.O. An Attention-Based View of Short-Termism: The Effects of Organizational Structure. Eur. Manag. J. 2020, 38, 244–254. [Google Scholar] [CrossRef]
  56. Samimi, M.; Cortes, A.F.; Anderson, M.H.; Herrmann, P. What Is Strategic Leadership? Developing a Framework for Future Research. Leadersh. Q. 2022, 33, 101353. [Google Scholar] [CrossRef]
  57. Jiang, Y.; Asante, D.; Zhang, J.; Cao, M. The Effects of Environmental Factors on Low-Carbon Innovation Strategy: A Study of the Executive Environmental Leadership in China. Leadership in China. J. Clean. Prod. 2020, 266, 121998. [Google Scholar] [CrossRef]
  58. Chen, S.; Jiang, W.; Li, X.; Gao, H. Effect of Employees’ Perceived Green HRM on Their Workplace Green Behaviors in Oil and Mining Industries: Based on Cognitive-Affective System Theory. Int. J. Environ. Res. Public. Health 2021, 18, 4056. [Google Scholar] [CrossRef] [PubMed]
  59. Dowell, G.W.S.; Muthulingam, S. Will Firms Go Green If It Pays? The Impact of Disruption, Cost, and External Factors on the Adoption of Environmental Initiatives. Strateg. Manag. J. 2017, 38, 1287–1304. [Google Scholar] [CrossRef]
  60. Sun, Y.; Sun, H. Executives’ Environmental Awareness and Eco-Innovation: An Attention-Based View. Sustainability 2021, 13, 4421. [Google Scholar] [CrossRef]
  61. Cao, C.; Tong, X.; Chen, Y.; Zhang, Y. How Top Management’s Environmental Awareness Affect Corporate Green Competitive Advantage: Evidence from China. Kybernetes 2021, 51, 1250–1279. [Google Scholar] [CrossRef]
  62. Peng, R.; Xu, M.; Guo, Y.; Li, X.; Tang, D. A Study on the Impact of Corporate Low Carbon Awareness on the Quality of Carbon Information Disclosure—Based on the Mediating Effects of Green Technology Innovation. Highlights Sci. Eng. Technol. 2022, 25, 334–347. [Google Scholar] [CrossRef]
  63. Wu, L.; Qing, C.; Jin, S. Environmental Protection and Sustainable Development of Enterprises in China: The Moderating Role of Media Attention. Front. Environ. Sci. 2022, 10, 966479. [Google Scholar] [CrossRef]
  64. Liao, Y.; Qiu, X.; Wu, A.; Sun, Q.; Shen, H.; Li, P. Assessing the Impact of Green Innovation on Corporate Sustainable Development. Front. Energy Res. 2022, 9, 1005. [Google Scholar] [CrossRef]
  65. Chapple, L.; Clarkson, P.M.; Gold, D.L. The Cost of Carbon: Capital Market Effects of the Proposed Emission Trading Scheme (ETS). Abacus 2013, 49, 1–33. [Google Scholar] [CrossRef]
  66. Zhang, L.; Yan, Y.; Xu, W.; Sun, J.; Zhang, Y. Carbon Emission Calculation and Influencing Factor Analysis Based on Industrial Big Data in the “Double Carbon” Era. Comput. Intell. Neurosci. 2022, 2022, 2815940. [Google Scholar] [CrossRef]
  67. Dang, D. Can Environmental Subsidies Promote the Green Investment of Enterprises? Mod. Econ. 2020, 11, 109–125. [Google Scholar] [CrossRef]
  68. Clarkson, P.M.; Li, Y.; Richardson, G.D.; Vasvari, F.P. Revisiting the Relation between Environmental Performance and Environmental Disclosure: An Empirical Analysis. Account. Organ. Soc. 2008, 33, 303–327. [Google Scholar] [CrossRef]
  69. Reyes-Menendez, A.; Saura, J.R.; Alvarez-Alonso, C. Understanding #WorldEnvironmentDay User Opinions in Twitter: A Topic-Based Sentiment Analysis Approach. Int. J. Environ. Res. Public. Health 2018, 15, 2537. [Google Scholar] [CrossRef]
  70. Zhang, Y.; Zhang, J.; Cheng, Z. Stock Market Liberalization and Corporate Green Innovation: Evidence from China. Int. J. Environ. Res. Public. Health 2021, 18, 3412. [Google Scholar] [CrossRef]
  71. Gallego-Álvarez, I.; Segura, L.; Martínez-Ferrero, J. Carbon Emission Reduction: The Impact on the Financial and Operational Performance of International Companies. J. Clean. Prod. 2015, 103, 149–159. [Google Scholar] [CrossRef]
  72. Chen, S.; Mao, H.; Sun, J. Low-Carbon City Construction and Corporate Carbon Reduction Performance: Evidence from a Quasi-Natural Experiment in China. J. Bus. Ethics 2022, 180, 125–143. [Google Scholar] [CrossRef]
  73. Busch, T.; Bassen, A.; Lewandowski, S.; Sump, F. Corporate Carbon and Financial Performance Revisited. Organ. Environ. 2022, 35, 154–171. [Google Scholar] [CrossRef]
  74. Liang, T.; Zhang, Y.-J.; Qiang, W. Does Technological Innovation Benefit Energy Firms’ Environmental Performance? Effect of Government Subsidies and Media Coverage. Technol. Forecast. Soc. Chang. 2022, 180, 121728. [Google Scholar] [CrossRef]
  75. Hayes, A.F. Review of Introduction to Mediation, Moderation, and Conditional Process Analysis: A Regression-Based Approach. J. Educ. Meas. 2014, 51, 335–337. [Google Scholar]
  76. Xu, G.; Schwarz, P.; Yang, H. Adjusting Energy Consumption Structure to Achieve China’s CO2 Emissions Peak. Renew. Sustain. Energy Rev. 2020, 122, 109737. [Google Scholar] [CrossRef]
  77. Liu, L.; Wu, H.; Hafeez, M.; Albaity, M.S.A.; Ullah, S. Carbon Neutrality through Supply Chain Performance: Does Green Innovation Matter in Asia? Res.-Ekon. Istraživanja 2022, 36, 2149588. [Google Scholar] [CrossRef]
  78. Yang, Z.; Gao, W.; Han, Q.; Qi, L.; Cui, Y.; Chen, Y. Digitalization and Carbon Emissions: How Does Digital City Construction Affect China’s Carbon Emission Reduction? Sustain. Cities Soc. 2022, 87, 104201. [Google Scholar] [CrossRef]
  79. Li, Z.; Li, P.; Zhao, X.; Tu, Z. Business Strategy and Environmental Information Disclosure Quality: Empirical Evidence from Chinese Heavy Pollution Listed Firms. Int. J. Environ. Res. Public. Health 2022, 19, 8325. [Google Scholar] [CrossRef]
  80. Zhang, H.; Feng, C.; Zhou, X. Going Carbon-Neutral in China: Does the Low-Carbon City Pilot Policy Improve Carbon Emission Efficiency? Sustain. Prod. Consum. 2022, 33, 312–329. [Google Scholar] [CrossRef]
  81. Li, J.; Fang, L.; Chen, S.; Mao, H. Can Low-Carbon Pilot Policy Improve Atmospheric Environmental Performance in China? A Quasi-Natural Experiment Approach. Environ. Impact Assess. Rev. 2022, 96, 106807. [Google Scholar] [CrossRef]
  82. Laskar, N.; Kulshrestha, N.; Bahuguna, P.C.; Adichwal, N.K. Carbon Emission Intensity and Firm Performance: An Empirical Investigation in Indian Context. J. Stat. Manag. Syst. 2022, 25, 1073–1081. [Google Scholar] [CrossRef]
  83. Hussain, J.; Lee, C.-C.; Chen, Y. Optimal Green Technology Investment and Emission Reduction in Emissions Generating Companies under the Support of Green Bond and Subsidy. Technol. Forecast. Soc. Chang. 2022, 183, 121952. [Google Scholar] [CrossRef]
  84. Zhang, J.; Zhang, N.; Bai, S. Assessing the Carbon Emission Changing for Sustainability and High-Quality Economic Development. Environ. Technol. Innov. 2021, 22, 101464. [Google Scholar] [CrossRef]
  85. Chong, C.T.; Fan, Y.V.; Lee, C.T.; Klemeš, J.J. Post COVID-19 ENERGY Sustainability and Carbon Emissions Neutrality. Energy 2022, 241, 122801. [Google Scholar] [CrossRef] [PubMed]
  86. Borowski, P.F.; Karlikowska, B. Clean Hydrogen Is a Challenge for Enterprises in the Era of Low-Emission and Zero-Emission Economy. Energies 2023, 16, 1171. [Google Scholar] [CrossRef]
  87. Wang, Y.; Zhang, Y. Do State Subsidies Increase Corporate Environmental Spending? Int. Rev. Financ. Anal. 2020, 72, 101592. [Google Scholar] [CrossRef]
  88. Danish; Ulucak, R.; Khan, S.U.-D.; Baloch, M.A.; Li, N. Mitigation Pathways toward Sustainable Development: Is There Any Trade-off between Environmental Regulation and Carbon Emissions Reduction? Sustain. Dev. 2020, 28, 813–822. [Google Scholar] [CrossRef]
  89. Ren, S.; Hao, Y.; Wu, H. How Does Green Investment Affect Environmental Pollution? Evidence from China. Environ. Resour. Econ. 2022, 81, 25–51. [Google Scholar] [CrossRef]
  90. Manning, B.; Braam, G.; Reimsbach, D. Corporate governance and sustainable business conduct—Effects of board monitoring effectiveness and stakeholder engagement on corporate sustainability performance and disclosure choices. Corp. Soc. Responsib. Environ. Manag. 2019, 26, 351–366. [Google Scholar] [CrossRef]
Figure 1. The study model.
Systems 11 00249 g001
Table 1. Variable Names and Definitions.
VariableSymbolNameDefinition
Explained variableSGRSustainable developmentNet sales interest rate × total asset turnover × income retention rate × equity multiplier/(1 − net sales interest rate × total asset turnover × income retention rate × equity multiplier)
Explanatory variableCesCarbon emission intensityEnterprise carbon intensity = enterprise carbon emissions/enterprise main business income
Moderating variableEnvsubGovernment environmental subsidiesGovernment environmental subsidies/total assets
MediaMedia monitoringJF coefficient constructed using total media network coverage
EgaGreen awareness for executivesFrequency of keywords in the green perception measurement dimension of executives in the annual reports of listed companies
Controlled variableSizeEnterprise sizeNatural logarithm of total assets for the year
LevGearing ratioTotal liabilities/total assets
RoaReturn on assetsNet income/average balance of total assets
GrowthBusiness growthMain business income of this period/main business income of period − 1
CashflowCash flow ratioNet cash flow from operating activities/total assets
AtoNet asset turnover ratioSales revenue/average of total net assets at the beginning and end of the period
Tobin-QTobin’s Q(Outstanding market value + non-marketable par value/total assets − net intangible assets − net goodwill)
SoeNature of shareholdingState-controlled = 1; otherwise = 0
AgeBusiness ageln (year of observation − year of registration + 1)
YearYearTime dummy variable, belonging to the corresponding year = 1, otherwise = 0
IndustryIndustryIndustry dummy variable, belonging to the corresponding year = 1, otherwise = 0
Table 2. Descriptive statistics.
VariableNMeanSDMinp50Max
SGR11,8220.0317 0.0792 −0.0658 0.0081 0.5668
Ces11,8220.0047 0.0018 0.0015 0.0044 0.0180
Envsub11,8220.0003 0.0002 0.0000 0.0002 0.0015
Media11,8220.0032 0.3470 −0.7959 0.0000 0.7959
Ega11,82222.3531 7.8991 5.0000 22.0000 40.0000
Size11,82222.3930 1.3357 19.9588 22.2045 26.3656
Lev11,8220.4106 0.1929 0.0595 0.4032 0.8754
Roa11,8220.0550 0.0452 0.0000 0.0433 0.2280
Growth11,8220.1855 0.3930 −0.5200 0.1109 2.5015
Cflow11,8220.0578 0.0649 −0.1372 0.0559 0.2461
Ato11,8221.2317 0.9701 0.1318 0.9647 5.9038
Tobin-Q11,8222.0435 1.3171 0.8472 1.6196 8.5233
Soe11,8220.3455 0.4756 0.0000 0.0000 1.0000
Age11,8222.9493 0.2894 2.0794 2.9957 3.5264
Table 3. Correlation matrix.
SGRCesEnvsubMediaEgaSizeLevRoaGrowthCflowAtoTobin-QSoeAge
SGR1
Ces−0.0833 ***1
Envsub−0.1981 ***0.3414 ***1
Media−0.1953 ***0.0775 ***0.2878 ***1
Ega−0.1910 ***0.0722 ***0.2774 ***0.2818 ***1
Size0.0735 ***0.0354 ***−0.0445 ***−0.0603 ***−0.0702 ***1
Lev0.0734 ***0.1058 ***0.0664 ***−0.0152 *−0.0310 ***0.5698 ***1
Roa0.2520 ***−0.1416 ***0.0237 ***−0.0921 ***−0.0960 ***−0.1331 ***−0.3965 ***1
Growth0.3396 ***0.0842 ***0.0905 ***−0.0605 ***−0.0845 ***0.0172 *0.0846 ***0.1540 ***1
Cflow−0.0345 ***−0.0580 ***0.0695 ***0.01050.01460.0336 ***−0.1722 ***0.4759 ***−0.0200 **1
Ato−0.0498 ***0.00830.4155 ***0.0249 ***0.01340.2628 ***0.5189 ***−0.0308 ***0.1186 ***0.0362 ***1
Tobin-Q0.0524 ***−0.0221 **0.0027−0.00740.007−0.3964 ***−0.3310 ***0.3337 ***0.0308 ***0.1321 ***−0.1187 ***1
Soe−0.0643 ***0.0860 ***0.01340.0111−0.00140.4199 ***0.3021 ***−0.2173 ***−0.0692 ***−0.0457 ***0.1488 ***−0.1657 ***1
Age−0.0346 ***0.0820 ***0.0269 ***0.0208 **−0.00150.1571 ***0.1468 ***−0.0736 ***−0.0528 ***0.0090.0637 ***−0.0944 ***0.2539 ***1
Note: ***, **, and * indicate significance at 0.01, 0.05, and 0.1 levels of significance, respectively.
Table 4. Results of the regression analysis.
(1)(2)(3)(4)
SGRSGRSGRSGR
Ces−6.4946 ***−2.5756 ***−4.4094 ***−4.4198 ***
(−7.714)(−2.634)(−5.260)(−5.635)
Envsub −67.7245 ***
(−6.447)
Ces*Envsub −0.0015 **
(−2.406)
Media −0.0201 ***
(−8.448)
Ces*Media −0.0088 ***
(−7.819)
Ega −0.0006 ***
(−6.181)
Ces*Ega −0.0113 ***
(−10.949)
Size0.0260 ***0.0228 ***0.0243 ***0.0246 ***
(4.733)(4.263)(4.625)(4.698)
Lev0.1349 ***0.1260 ***0.1263 ***0.1235 ***
(7.479)(6.994)(7.138)(6.993)
Roa0.7394 ***0.7327 ***0.7085 ***0.7146 ***
(15.275)(15.439)(15.336)(15.591)
Growth0.0474 ***0.0492 ***0.0453 ***0.0449 ***
(10.426)(10.882)(10.262)(10.298)
Cflow−0.1129 ***−0.1087 ***−0.1006 ***−0.1010 ***
(−6.194)(−6.220)(−5.806)(−5.947)
Ato−0.0257 ***−0.0200 ***−0.0238 ***−0.0246 ***
(−7.043)(−5.756)(−6.793)(−7.093)
Tobin-Q−0.0036 ***−0.0034 ***−0.0034 ***−0.0035 ***
(−3.130)(−3.062)(−3.015)(−3.149)
Soe−0.0181 ***−0.0154 **−0.0147 **−0.0138 **
(−2.775)(−2.444)(−2.249)(−2.156)
Age−0.0474 *−0.0447−0.0456 *−0.0485 *
(−1.660)(−1.602)(−1.658)(−1.792)
_cons−0.4133 ***−0.3554 ***−0.3914 ***−0.3713 ***
(−3.087)(−2.729)(−3.018)(−2.893)
IndustryYesYesYesYes
FirmYesYesYesYes
YearYesYesYesYes
N11822118221182211822
R20.2110.2310.2450.254
adj. R20.2100.2300.2440.253
F45.857242.541644.319846.8087
Note: t statistics are in parentheses; * p < 0.1, ** p < 0.05, *** p < 0.01.
Table 5. Robustness test: removing the 2020 sample.
(1)(2)(3)(4)
SGRSGRSGRSGR
Ces−6.5335 ***−2.0284 *−4.1178 ***−3.7575 ***
(−6.652)(−1.773)(−4.174)(−4.080)
Envsub −77.8017 ***
(−6.312)
Ces*Envsub −0.0016 **
(−2.290)
Media −0.0228 ***
(−8.114)
Ces*Media −0.0091 ***
(−7.209)
Ega −0.0008 ***
(−6.346)
Ces*Ega −0.0126 ***
(−10.327)
Size0.0278 ***0.0246 ***0.0273 ***0.0274 ***
(3.629)(3.338)(3.819)(3.838)
Lev0.1556 ***0.1439 ***0.1411 ***0.1401 ***
(7.025)(6.602)(6.584)(6.652)
Roa0.7653 ***0.7606 ***0.7272 ***0.7321 ***
(13.366)(13.690)(13.432)(13.688)
Growth0.0472 ***0.0494 ***0.0457 ***0.0450 ***
(9.090)(9.617)(8.979)(9.167)
Cflow−0.1114 ***−0.1048 ***−0.0955 ***−0.0954 ***
(−5.204)(−5.134)(−4.733)(−4.862)
Ato−0.0269 ***−0.0205 ***−0.0252 ***−0.0264 ***
(−5.648)(−4.622)(−5.611)(−5.909)
Tobin-Q−0.0038 ***−0.0036 ***−0.0036 ***−0.0036 ***
(−2.821)(−2.641)(−2.701)(−2.754)
Soe−0.0174 *−0.0150 *−0.0152−0.0151
(−1.839)(−1.669)(−1.607)(−1.616)
Age−0.0851 **−0.0711 *−0.0703 *−0.0721 **
(−2.265)(−1.926)(−1.955)(−2.049)
_cons−0.3559 **−0.3289 *−0.3934 **−0.3730 **
(−1.994)(−1.911)(−2.309)(−2.201)
IndustryYesYesYesYes
FirmYesYesYesYes
YearYesYesYesYes
N9474947494749474
R20.2040.2280.2420.256
adj. R20.2020.2270.2410.255
F40.350737.147839.101040.7685
Note: t statistics are in parentheses; * p < 0.1, ** p < 0.05, *** p < 0.01.
Table 6. Robustness test: adjustment of independent variable statistics.
(1)(2)(3)(4)
SGRSGRSGRSGR
Ces2−0.0257 ***−0.0074 **−0.0162 ***−0.0158 ***
(−8.002)(−2.577)(−6.978)(−6.079)
Envsub −63.5031 ***
(−7.334)
Ces2*Envsub −0.0028 ***
(−5.241)
Media −0.0204 ***
(−8.339)
Ces2*Media −0.0069 ***
(−7.648)
Ega −0.0007 ***
(−6.402)
Ces2*Ega −0.0075 ***
(−8.417)
Size0.0284 ***0.0244 ***0.0265 ***0.0266 ***
(5.225)(4.631)(5.038)(4.979)
Lev0.1357 ***0.1275 ***0.1326 ***0.1343 ***
(7.481)(7.083)(7.379)(7.430)
Roa0.7765 ***0.7518 ***0.7563 ***0.7627 ***
(16.085)(15.959)(16.170)(16.273)
Growth0.0463 ***0.0493 ***0.0461 ***0.0457 ***
(10.153)(10.848)(10.353)(10.245)
Cflow−0.1172 ***−0.1108 ***−0.1113 ***−0.1128 ***
(−6.443)(−6.330)(−6.366)(−6.478)
Ato−0.0247 ***−0.0201 ***−0.0239 ***−0.0252 ***
(−6.828)(−5.864)(−6.874)(−7.078)
Tobin−Q−0.0034 ***−0.0035 ***−0.0036 ***−0.0036 ***
(−2.980)(−3.092)(−3.143)(−3.168)
Soe−0.0172 ***−0.0141 **−0.0146 **−0.0159 **
(−2.661)(−2.255)(−2.314)(−2.500)
Age−0.0422−0.0435−0.0449−0.0483 *
(−1.480)(−1.566)(−1.623)(−1.747)
_cons−0.5129 ***−0.4083 ***−0.4632 ***−0.4392 ***
(−3.901)(−3.159)(−3.590)(−3.366)
IndustryYesYesYesYes
FirmYesYesYesYes
YearYesYesYesYes
N11822118221182211822
R20.2100.2370.2370.235
adj. R20.2090.2360.2360.234
F43.006542.588941.811141.5637
Note: t statistics are in parentheses; * p < 0.1, ** p < 0.05, *** p < 0.01.
Table 7. Robustness test: upper and lower 20% quantile group regression.
(1)(2)
SGRSGR
Ces−10.4756 ***−4.6701 **
(−5.819)(−2.161)
Size0.02310.0232
(1.300)(1.600)
Lev0.2650 ***0.1449 ***
(4.178)(3.565)
Roa0.9957 ***0.5813 ***
(8.016)(5.224)
Growth0.0414 ***0.0325 ***
(3.680)(3.154)
Cflow−0.2545 ***0.0304
(−4.860)(0.975)
Ato−0.0312 ***−0.0106
(−4.628)(−0.830)
Tobin-Q−0.0099 *−0.0032
(−1.900)(−1.398)
Soe−0.0067−0.0113
(−0.503)(−0.571)
Age0.1092 *−0.2470 ***
(1.876)(−3.145)
_cons−0.8921 **0.2044
(−2.003)(0.554)
IndustryYesYes
FirmYesYes
YearYesYes
N23602367
R20.2080.204
adj. R20.2030.199
F13.74308.0429
Note: t statistics are in parentheses; * p < 0.1, ** p < 0.05, *** p < 0.01.
Table 8. Heterogeneity test: two-stage least squares regression results.
Stage1Stage2
CesSGR
Ces −14.4760 ***
(−3.398)
lCes−0.1917 ***
(−11.007)
Size−0.00020.0309 ***
(−1.240)(3.807)
Lev−0.00080.1292 ***
(−1.548)(5.528)
Roa−0.0065 ***0.6648 ***
(−5.725)(9.857)
Growth0.0004 ***0.0500 ***
(3.663)(7.862)
Cflow0.0011 **−0.0890 ***
(2.127)(−4.100)
Ato0.0002 *−0.0320 ***
(1.794)(−6.604)
Tobin-Q−0.0000−0.0044 ***
(−0.079)(−3.319)
Soe−0.0002−0.0103
(−0.933)(−1.608)
Age0.0013−0.0152
(1.335)(−0.368)
Constant0.0075
(1.460)
Industry YESYES
FirmYESYES
Year YESYES
Observations85848371
R-squared0.05930.1926
Number of id24372224
F13.941026.7657
Kleibergen-Paap rk LM99.520(Chi-sq(1)P-val = 0.0000)
statistic
Cragg-Donald F273.224
statistic
Kleibergen-Paap rk121.152
Wald F statistic
10% maximal IV size16.38
Note: Robust t-statistics in parentheses; *** p < 0.01, ** p < 0.05, * p < 0.1.
Disclaimer/Publisher’s Note: The statements, opinions and data contained in all publications are solely those of the individual author(s) and contributor(s) and not of MDPI and/or the editor(s). MDPI and/or the editor(s) disclaim responsibility for any injury to people or property resulting from any ideas, methods, instructions or products referred to in the content.

