Article

The Impact of Intellectual Property Rights City Policy on Firm Green Innovation: A Quasi-Natural Experiment Based on a Staggered DID Model

School of Public Policy and Administration, Xi’an Jiaotong University, Xi’an 710049, China
*
Author to whom correspondence should be addressed.
Systems 2023, 11(4), 209; https://doi.org/10.3390/systems11040209
Submission received: 3 March 2023 / Revised: 16 April 2023 / Accepted: 17 April 2023 / Published: 20 April 2023

Abstract

:
Green innovation is considered an important way to promote low-carbon society formation and the sustainable development of environmental engineering. However, few quantitative studies have focused on the impact of intellectual property rights (IPR) on firm green innovation (FGI). This paper constructs a quasi-natural experiment based on the IPR pilot city policy in China. We empirically investigated the influence of IPR policy on FGI using a staggered difference-in-differences (DID) model and Chinese listed company data from 2007 to 2020. The findings of this research are as follows: (1) IPR policy significantly promotes FGI, and its effectiveness is confirmed by a variety of robustness tests. (2) The IPR policy supports both green product and green process innovation, with a stronger effect on green product innovation. (3) The IPR policy encourages green independent R&D but has little influence on green joint R&D. (4) The IPR policy promotes FGI with a high knowledge intensity, state-owned enterprises, and firms in key city groups. (5) The IPR policy supports FGI primarily via two institutional channels: increasing R&D investment and easing financing constraints. This paper broadens the study of green innovation city policy and FGI development, offering new perspectives for achieving social and environmental sustainability.

1. Introduction

With the establishment of explicit sustainable development targets on the 2030 Agenda for Sustainable Development (UN2030) and the COP 26 UN Climate Change Conference (COP26), it has become more necessary to achieve economic growth while ensuring environmental sustainability. China, as the world’s second-largest economy, with a rapid growth rate, holds significant influence in the global environment administration. However, environmental issues such as resource restrictions, energy shortages, and waste emissions are increasingly appearing as a result of rapid economic expansion. Yale University’s Global Environmental Performance Index 2022 research states that China ranks 160th out of 180 nations with an EPI score of 28.4, indicating that China’s environmental governance is not promising [1]. Industry and academia agree that green innovation is crucial in addressing the challenge of balancing economic growth with environmental preservation in the context of global integrated development. Green innovation refers to innovation activities that are favorable to enhancing environmental performance, such as green products and green process, which may result in a “win-win” scenario for economic growth and environmental management [2,3].
From the standpoint of policy supply, intellectual property right (IPR) policy is seen as a highly significant element influencing green innovation. An effective IPR policy may not only encourage businesses to improve their R&D spending and innovative vibrancy [4] but also alleviate their financing constraints [5,6], reduce their innovation costs [7], and enhance their willingness to protect the environment and engage in green innovation [8].
In order to enhance IPR protection and encourage innovation among market players, as well as promote the transformation of the economy towards high-quality and environmentally-friendly development, China has implemented IPR pilot policies in various cities since 2012. The core requirement of the IPR pilot city policy is to strengthen IPR protection for market players and enhance the green innovation capability of market players [9]. The policy should have an important impact on firms, which are the core elements of market players. Once the IPR pilot city policy has achieved good results, the successful experience will be extended to other cities and contribute to innovation-driven development. However, how effective is the IPR pilot city policy? Is it having an impact on firm green innovation? Through what mechanism of action does it have an impact? This research will utilize the DID model to evaluate this policy shock experimentally and address the problems posed above. The linked literature focuses on the influence of intellectual property rights (IPR) on green innovation and the assessment of green innovation city strategies. Moreover, there are two primary viewpoints on the influence of IPR to green innovation. The main methods for achieving impact include enhancing the value of the product, generating market signals, establishing organizational agreements, and overcoming technological barriers [10,11,12]. However, the second strand of literature argues that IPR can motivate firms to engage in green innovation as a competitive resource and strategic advantage. Specifically, IPR can enhance brand competitiveness, strengthen organizational absorptive capacity, influence corporate reputation, and monopolize excess profits, resulting in a profitable engagement in green innovation [13,14,15].
There is a wealth of research on the evaluation of city policies related to green innovation. In terms of the types of city policies, the studies include smart city policy [16,17], innovative city policy [18], water resource policy, low-carbon city policy, digital economy city policy etc. In terms of research content, it includes practice paths [19], action mechanisms [20], influence factors [21], efficiency evaluation [22], indicator construction [23], and implementation effects [24,25]. In terms of research methods, it includes DID, OLS regression, systematic GMM, event study method, etc. [25]. In terms of research perspectives, it mainly includes industry level, intercity level, regional network level, etc. [26].
The current literature offers excellent resources for the investigation of the effect of IPR strategy on green innovation in businesses, but there are still limitations in the following areas: ① Studies have been conducted to confirm the effect of IPR on green innovation activities, but most of them are based on theoretical constructs and questionnaire data, lacking micro-level data on large samples of firms and observations from the perspective of empirical interventions in IPR policy for testing. ② There has been a wealth of research on green innovation city policies, but there has been little research on IPR city policy: notably, empirical examination of IPR policy on features of green innovation in the firm sector. ③ What processes govern the relevance of intellectual property rights for green innovation? What specific empirical evidence exists? Few studies have addressed this.
In response to the limitations of existing studies, the following are the key marginal contributions of this article: ① For the first time, we utilized the staggered DID model to experimentally explore how IPR city policy affects FGI, using data from 198 Chinese prefecture-level cities and 2047 listed companies from 2007 to 2020 in China. It offers a broad sample of data on the influence of IPR on FGI and supports quantitative studies on IPR policy assessment. ② Using the DDD model, we analyzed and validated the mechanism of the role of IPR policy in inducing FGI from two perspectives: promoting R&D input and alleviating corporate financing constraints. Then, we investigated the pathways via which the pilot policy operates in order to offer micro-level empirical data for the study of the mechanism behind the influence of IPR on FGI. ③ A heterogeneity study of the impact of the IPR pilot city policy was undertaken with regard to the following five dimensions: patent heterogeneity, R&D approach heterogeneity, knowledge intensity heterogeneity, property rights heterogeneity, and firm location heterogeneity, which provides useful suggestions for identifying the primary element of green innovation and policy action direction.
The remainder of this work is structured as follows: Section 2 covers the theoretical examination and development of hypotheses. The third section presents the research design. The empirical outcomes of the benchmark study are examined in Section 4. Section 5 evaluates the reliability of the benchmark analysis’s outcomes. Section 6 is an examination of heterogeneity. The seventh section discusses the mechanism of the IPR pilot city policy for fostering green innovation in firms. followed by a conclusion and policy implications section.

2. Theoretical Analysis and Hypothesis Proposed

2.1. IPR Pilot City Policy and FGI

According to externality theory, there are positive externalities of innovation activities and outputs, which will lead to the free-riding behavior of innovation subjects [27,28]. It is difficult for enterprises to prevent other competitors from imitating and copying their innovations and improving the level of IPR protection can restrain other innovation subjects from copying and spreading the enterprise’s innovations and weakening the positive externalities of innovation [29]. When an enterprise lacks IPR protection, or when IPR protection is limited and the fight against infringement is insufficient, the innovative activities and outputs of green technology innovation subjects cannot be effectively protected [30,31]. On the one hand, competitors will soon imitate the innovation, leading to a decrease in the profit of the innovation subject [32] and making enterprises’ and other innovation players’ willingness to carry out FGI activities decrease continuously [33]. On the other hand, the patent protection for inventions applied by the innovation subject not only cannot be effectively protected but also easily allows the patented technology to leak to competitors. The stronger the IPR protection of an enterprise, the more it can increase the imitation cost of imitators, and the frequency of infringement will decrease. The improvement of the intensity of IPR protection can increase the commercialization revenue of innovation subjects, provide dynamic incentives for innovation subjects to carry out innovation activities, create a favorable innovation environment, and stimulate the vitality of green innovation in enterprises [34,35]. Green innovation subjects are also more willing to apply for patent protection, which enhances the output quantity of green patents.
According to the theory of property rights systems, a rational design of property rights includes incentive restrictions, internalization of spillover, and allocating resource mechanisms, and the property rights system impacts economic performance through influencing resource use choices [36,37,38]. The protection of intellectual property rights promotes green innovation by reducing the uncertainty of R&D returns and internalizing externalities in order to ensure a sensible distribution of R&D supplies. In other words, when organizations can hold and dispose of their innovation outcomes in a consistent manner, they will enhance their innovation investment and, hence, boost their innovation performance. Meanwhile, the internalization of positive externalities minimizes the spillover of R&D results, resulting in a performance boost for R&D. On the other hand, the internalization of negative externalities increases the cost of firms and encourages them to reduce undesirable output [39] and pay higher attention to green innovation.
The level of protection provided by intellectual property rights (IPR) has a direct impact on the extent to which firms can benefit from monopolies, which in turn affects their ability to innovate in green technologies. Furthermore, the effectiveness of the IPR system is a crucial factor in determining firms’ willingness to invest in green innovation, leading to a reallocation of resources towards enhancing their green innovation capabilities. Most studies suggest that intellectual property rights (IPR) protection can aid in the advancement of green innovation within firms. However, there are scholars who contend that excessive IPR protection can impede the spread of green knowledge, resulting in a hindrance to green innovation. Additionally, there may be an optimal range of time for which IP protection should be enforced. The impact of IPR protection on green innovation, whether positive or negative, is dependent on the institutional environment. Factors such as the administrative approval process, patent application accessibility, and enforcement fairness all play a role in determining whether there is a ‘spillover’ or ‘crowding-out’ effect. The IPR pilot policy proposes a range of services aimed at promoting IPR protection, increasing efforts to combat IPR infringement, simplifying the IPR application process, and enhancing IPR education, publicity, and training. These supporting IPR policies will not only protect corporate innovation benefits but also reduce corporate innovation costs while enhancing corporate willingness to participate in green innovation. Hence, we propose:
H1. 
IPR pilot policy has a positive impact on FGI.

2.2. Increasing R&D Input and FGI

The endogenous economic growth theory assumes that scientific and technological innovation can drive the economic growth of society and achieve social progress [40,41,42]. Additionally, R&D input, as the primary metric for measuring and promoting technological innovation activities, is a critical indicator of technological progress and economic growth. Generally, R&D inputs consist of R&D human capital and R&D physical capital inputs [43,44,45]. R&D expenditure and corporate green innovation have been analyzed by a variety of scholars. Some researchers have researched R&D effort and FGI from the standpoint that innovation efficiency as well as capital and institutional variables have a substantial impact on the enhancement of FGI capacities [46,47]. Some scholars have also examined investment in R&D and green innovativeness from the industry’s perspective and found that R&D expenditure boosts green innovation via the “compensation effect” and “induced impact” [48]. As the most influential factor on green innovation, R&D expenditure, particularly green R&D investment, has a significant positive influence on green innovation. In addition, several researchers have confirmed the effect of R&D expenditures on the green innovation of businesses from the viewpoints of patents, environmental legislation, and spatial planning.
The implementation of the IPR pilot city policy indicates that the government now has higher standards and expectations for businesses’ IPR competencies. This, in turn, encourages enterprises to prioritize and invest in their own IPR capabilities. Therefore, they must increase their R&D capital investment and human capital accumulation to enhance their own R&D capability. In contrast, the IPR pilot city strategy facilitates the entrance and growth of innovative talent and capital, enhancing the supply of knowledge elements for innovation activities, and attracting R&D resources to enterprises. Therefore, enterprises can improve their original technology accumulation through “learning by doing”, “learning by using”, and innovation spillover, thus providing sufficient R&D guarantee for green innovation. Hence, we propose:
H2. 
IPR pilot city policy promotes FGI through boosting R&D investment.

2.3. Easing Financing Constraints and FGI

According to the Schumpeter innovation theory, the accessibility of capital is crucial to technical innovation. Due to the unpredictability of returns, the information asymmetry of the innovation process, and the greater regulatory expenses, innovation activities are susceptible to significant external funding limitations, which hinder enterprises’ innovation efforts [49,50,51]. Green technology innovation is characterized by a substantial initial capital investment, a lengthy profit cycle, a high chance of failure, and an uncertain return. Therefore, environmental externalities, route dependence, and market-based asymmetry are examples of market failure concerns that must be addressed for green technology developments to be effective. It means that greater resources must be devoted to the development of green innovations for direction-altering innovation, and thus, firms may be more likely to face financing constraints when conducting green technology innovation.
The IPR pilot city policy proposes several financial policies aimed at enhancing intellectual property rights, such as creating special funds, providing subsidies for enterprise patent applications, promoting IPR pledge financing, and implementing protection and risk warning mechanisms for key industries and product R&D. These financial policies may support firm green innovation by fulfilling the role of capital allocation, decreasing the R&D expenditures of firms involved in green innovation activities, and easing their potential financing limitations. Thus, we propose:
H3. 
IPR pilot city policy promotes FGI by easing financing constraints.

3. Research Design

3.1. Model Development

To investigate the policy effect of the IPR pilot city policy upon that influence of FGI, this article employs the DID method for causal analysis based on the State Intellectual Property Office’s list of IPR pilot cities for 2012, 2013, 2015, 2016, 2018, and 2019. The experimental group consists of the firms in the 60 designated IPR pilot cities, whereas the control group consists of the companies in the other cities. By comparing the two groups, the net effect of policy on the impact of the IPR pilot city policy on FGI was identified. Since there are differences in the time points at which different cities received the title of IPR pilot city, this work utilized the staggered DID model to assess and determine the policy impacts by referencing Beck et al. (2010) and Lin et al. (2022). Meanwhile, to mitigate the impact of time trend changes and eliminate any potential bias resulting from differences in firms and cities, our study employed a fixed effect model with fixed time, firm, and city effects. The type of model is shown in Equation (1).
G r e e n P a t i , s , t = α 0 + α 1 d i d i , s , t + α 2 C t r l i , s , t + β i + γ s + δ t + ε i , s , t
In the model, the i denotes the city, s denotes the firm, and t denotes time. G r e e n P a t denotes the capacity of FGI. The explanatory variable d i d is the DID estimator. C t r l denotes the control variables. β i are city fixed effects. γ s are firm fixed effects. δ t are the time fixed effects. ε denotes the random disturbance term. Coefficient α 1 denotes the policy implementation effect of IPR pilot cities on the impact of firm green innovation, and if α 1 is greater than 0, it means that the policy of IPR pilot city can promote firm green innovation.

3.2. Variable Description

Explained variable. This article’s explanatory variable is “firm green innovation.” To measure firm green innovation (GreenPat), the sum of the number of green invention patents granted and the number of green utility model patents granted by listed companies was utilized based on existing studies. Additionally, to account for the delay in patent grants, we included both green invention patent applications and green utility model patent applications from listed companies as a measure of firm green innovation (GreenPat2) in our robustness test.
Explanatory variable. The core explanatory variable in this paper is the IPR pilot city policy effect ( d i d ). If the city i to which firm s belongs is selected as a pilot city for IPR at time t , then assign a value of 1 to d i d , otherwise assign a value of 0.
Control variables. Considering that some factors at the firm level and city level can affect firm green innovation, we selected the following set of factors reflecting the economic characteristics of firms and city-level influences as control variables. Firm-level control variables: ① Firm size (lnAsset) is expressed using the natural logarithm of the firm’s total assets [52]. ② Firm age (lnAge) is expressed using the natural logarithm of the number of years a firm has been listed [53]. ③ Firm value (lnTobinQ) is expressed as the logarithm of assets using the market value of the firm divided by total assets [54]. ④ Staff intensity (Staff) is expressed as a ratio of the number of employees at the end of the year to the company’s operating revenue for the year [30]. ⑤ The ratio of independent directors (Indirector) is expressed as the ratio of the number of independent directors to the size of the board of directors [55]. ⑥ The current ratio (Current) is expressed as the ratio of current assets to current liabilities [49]. ⑦ The liability-to-assets ratio (LOAR) is expressed using total liabilities divided by total assets [50]. City-level control variables: ① Urban environmental regulation level (Environment) is expressed using the natural logarithm of urban industrial SO2 emissions [56]. ② The level of urban economic development (Economic) is expressed using the natural logarithm of urban GDP per capita [57]. ③ Urban industrial structure (Industry) is expressed using the share of the value added of the urban secondary sector in the GDP [58].

3.3. Data Sources

Data for listed companies and prefecture-level cities in China for the period 2007–2020 were used. The data on control variables for listed companies were obtained from the China Stock Market and Accounting Research Database (CSMAR). The data for city-level control variables were obtained from the China City Statistical Yearbook. Additionally, the data on green patents for listed companies was obtained from the Chinese Research Data Services (CNRDS) database. All continuous variables were winsorized at the 1% level to eliminate the influence of extreme values, and finally, we obtained unbalanced panel data for 198 Chinese prefecture-level cities, 2047 listed companies, and 9577 observations. The descriptive statistics for the primary variables in this article are provided in Table 1.

4. Benchmark Analysis

The findings of the benchmark regression tests evaluating the effect of the IPR policy on FGI are shown in Table 2. All three models adjust for city, time, and firm fixed effects. Moreover, Model (2) is based on Model (1) with the addition of firm-level control variables. Model (3) adds firm-level and city-level control variables.
As shown in Table 2, the coefficients of DID terms in models (1), (2), and (3) are all positive and pass the significance test at a minimum level of 5%, showing that the IPR policy has a catalytic impact on FGI in the pilot area. When firm-level control variables and city-level control variables are all included in models (2) and (3), the magnitudes of the coefficients shift, demonstrating that additional firm-level and regional factors indeed impact firm green innovation. Therefore, it is vital to include firm-level as well as city-level control variables in this paper’s baseline model to more accurately reflect the net effect generated by policy implementation. Model (3) shows that the adoption of the IPR pilot policy can encourage FGI, and after removing any possible confounding factors, the policy has resulted in a 133% increase in the number of green patents awarded to firms listed in the pilot area. Hence, hypothesis 1 has been verified.

5. Robustness Tests

5.1. Parallel Trend Test

To use the DID approach, the benchmark regression model must meet the parallel trend assumption. In other words, there were no substantial differences in FGI between enterprises in IPR pilot cities and those in non-IPR pilot cities prior to the introduction of the legislation. Figure 1 illustrates the parallel trend test for the IPR policy, which is based on the methodology of Beck et al. [59] and Mbanyele et al. [60].
As shown in Figure 1, the horizontal coordinate is the relative time of IPR pilot city policy implementation. We designated the year before policy implementation as the policy base period, and 2012, the year of policy implementation, is represented by the number 0. The vertical coordinate represents the policy impact coefficient of IPR pilot cities. The coefficients for each policy time point in this figure have a significance level of 90%.
Figure 1 demonstrates that the coefficient of the policy impact of the IPR pilot city policy on FGI was not statistically significant before the policy’s implementation but passed the significance test after the policy’s implementation. In other words, before the introduction of this policy, there was no significant difference between FGI belonging to IPR pilot cities and those belonging to non-IPR pilot cities, demonstrating that the IPR policy had a favorable influence on FGI. Hence, the basic model is consistent with the parallel trend concept.

5.2. Placebo Test

To eliminate the possibility of attributing the baseline regression findings to random chance, we conducted a placebo test. In this paper, the policy placebo test was performed by randomly selecting the experimental group and estimating the model 500 times for the above random simulation process. Figure 2 plots the placebo test based on the simulation process described above. The horizontal coordinates represent the estimated coefficients of the policy impacts, while the vertical coordinates represent the kernel density values and p-values, correspondingly, of the calculated coefficients. As shown in Figure 2, the mean value of the calculated coefficients is 0, and most of the p-values are greater than 0.1. Meanwhile, the actual estimated coefficients of the IPR pilot city policy effects are within the range of the small probability events of the above placebo test plots. In other words, the effect of IPR pilot city policy on FGI is not a random chance event, and the findings of the benchmark regression are robust and reliable.

5.3. PSM-DID

While the IPR pilot cities have successfully addressed the endogeneity problem by introducing an exogenous policy shock event, it is worth noting that the pilot city areas may not have been selected through a completely random sampling. Additionally, regional differences and enterprise heterogeneity across cities may introduce some degree of “noise” to the policy evaluation results presented in this paper. Therefore, we used the propensity score matching approach to identify the control group firms that are most comparable to each experimental group firm, and then used the matched sample for model estimation. Specifically, this study matched propensity scores to sample data based on company characteristic factors and city characteristic variables using a logit model. Moreover, we used K-nearest neighbor matching, radius matching, and kernel matching to assure the accuracy of our matching findings. Meanwhile, considering that this paper uses the staggered DID model, a year-by-year matching method was used to screen the control group of firms.
Table 3 reports the model regression estimation results using the PSM-DID method. The model estimation results for the three PSM-DID matching techniques of k-nearest neighbor, radius matching, and kernel matching are shown in lines (1), (2), and (3) of Table 3. Table 3 shows that the policy impacts’ coefficient values are statistically positive at the 1% significance level for all approaches. In other words, after eliminating the differences in firm characteristics and city characteristics, the IPR pilot city policy has a substantial promoting influence on FGI. Consequently, the estimate results of PSM-DID validate the robustness of this paper’s conclusions.

5.4. Lag Variable Model

The potential delay in innovation activities is believed to affect the accuracy of findings and minimize the possibility of endogeneity between variables and IPR pilot city regressions. Hence, we estimated the model with one and two lags of the explanatory variables. The regression findings for the explanatory variables delayed by one and two periods are presented in Columns (1) and (2) of Table 4. The findings indicate that the policy impact coefficient is considerably positive. Hence, the estimation results of our baseline model are robust.

5.5. Substitution of Explanatory Variables

The time lag in granting green patents may introduce bias to the model estimation. However, the application of green patents can significantly mitigate this bias. Hence, to avoid the influence of discrepancies in the measurement of the explanatory variables on the model estimate outcomes, we utilized the number of green patent applications rather than the number of green patents issued for model estimation. Column (3) of Table 4 displays the model estimate results after the explanatory variables have been replaced. The findings indicate that the significance and direction of the estimated coefficients of the model do not change. After controlling for explanatory factors, the impact of the IPR pilot city policy on boosting FGI remains consistent and stable.

6. Heterogeneity Analysis

6.1. Patent-Type Heterogeneity

The measure of heterogeneity in patents often reflects various types of corporate innovation activities. To investigate whether the impact of IPR policies on FGI varies depending on the stage of innovation, we analyzed the type of patent heterogeneity. Patents are classified as innovation patents, utility model patents, and external design patents by the State Intellectual Property Office. Typically, invention patents are seen as a reflection of upstream patents in the innovation chain, which emphasize process R&D and process innovation. Whereas utility model patents and design patents are regarded as representing downstream patents in the chain of innovation activities, which concentrate more on product R&D and product innovation, utility patents and design patents are thought to reflect upstream patents. Due to the low quality of exterior design patents and the availability of data, this study does not contain an examination of external design patents. In this research, green patents representing company green innovation activities were separated into green invention patents (GIP) and green utility model patents (GUP), with GIP used to describe firm green process innovation and GUP used to characterize firm green product innovation. Table 5 displays the specific outcomes.
As can be seen from Table 5, the IPR pilot city strategy has encouraged both green innovation patents and green utility model patents for companies; however, the impact on green utility model patents is substantially bigger than on green invention patents. In other words, the national IPR pilot city strategy enhances both green process innovation and green product innovation among firms. However, the growth impact of green product innovation is greater than that of green process innovation.

6.2. Heterogeneity of R&D Approaches

In order to analyze whether the green-inducing effect of IPR policy changes depending on the R&D approach of firms, we investigated the heterogeneity of R&D approaches. In this paper, we classified firm green patents into independent R&D green patents and joint R&D green patents according to the different R&D approaches of enterprises. The regression findings for the sample of firm green patents with different R&D methodologies are shown in Table 6. The results show that the calculated coefficients for the DID term for green patents of independent firm R&D are significantly positive, indicating that the IPR pilot city policy has a significant impact on promoting FGI of independent R&D. However, the estimated coefficients for green patents of joint firm R&D are not significant, suggesting that the policy does not have a significant effect on enhancing FGI of joint R&D. The possible reason is that the IPR pilot city policy strengthens firm green IPR protection, which makes firms focus more on independent green R&D capability and concentrate more on independent R&D rather than joint R&D.

6.3. Knowledge Intensity Heterogeneity

The innovation capacity and R&D capability of a firm are often reflected by its knowledge density, ultimately influencing its green innovation. To better understand this relationship, we analyzed the heterogeneity of firm knowledge density. Firms are classified into two groups based on their level of knowledge intensity: low knowledge intensity groups and high knowledge intensity groups. Firm R&D personnel are the main producers of firm knowledge disseminators, and their number represents a firm’s knowledge intensity. Therefore, we defined firms with less than 50% R&D personnel as the low knowledge intensity group and those with more than 50% as the high knowledge intensity group.
Table 7 displays the model findings for the IPR pilot city policy on FGI with different knowledge intensities. The findings indicate that the coefficients of the DID term are not notable for firms in the group with low knowledge intensity, whereas the estimated coefficient is notably positive for firms in the group with high knowledge intensity. The IPR policy primarily encourages FGI of high knowledge intensity, while having little to no impact on FGI of low knowledge intensity. The possible reason for this is that high-knowledge-intensity firms have more advantages in knowledge accumulation and their absorption capacity is stronger. Because of IPR policy’s influence on FGI, high knowledge intensity firms have stronger R&D capabilities than low knowledge intensity firms, resulting in more firm green patents.

6.4. Heterogeneity of Firm Property Rights

The ownership attributes of firms usually reflect different corporate management and incentive patterns, which have an impact on FGI. Therefore, this paper analyzed the heterogeneity of corporate property rights. Enterprises are categorized into state-owned enterprises (SOEs) and non-SOEs on the basis of their property rights (non-SOEs). We defined state-controlled enterprises as SOEs and other enterprises as non-SOEs. Table 8 reports the regression results of the IPR pilot city policy on FGI with different natures of property rights. The estimated coefficients of the DID term for SOEs are considerably positive, but the estimated coefficients for non-SOEs are not significant (Table 8). This suggests that the IPR policy has a significant influence on FGI for SOEs while having a negligible impact on non-SOEs. One possible explanation for this is that state-owned enterprises (SOEs) have dual responsibilities of maintaining profitability and fulfilling corporate social responsibilities, which sets them apart from non-SOEs. As a result, SOEs have more motivation for social responsibility and policy incentives to enhance FGI than non-SOEs.

6.5. Heterogeneity of Firm Location

The development of FGI is influenced by the varying resource and policy environments that firms encounter in different cities. As a result, we aimed to explore the heterogeneity of firm locations in our investigation. The cities to which the sample firms belonged were split into key city groups and ordinary city groups based on the locations of the companies. The provincial capital cities are defined as the key city group, and the ordinary prefecture-level cities are defined as the ordinary city group. Table 9 reports the findings of IPR policy on green innovation in urban enterprises in different regions. The results show that the estimated coefficients of the DID term for firms in the key city group are significantly positive, while the estimated coefficients for firms in the ordinary city group are not significant. This suggests that the IPR policy has a strong influence on FGI in the key city group, whereas it is not significant for firms in the ordinary city group. The possible reason for this is that key cities have certain comparative advantages in terms of innovation resources, institutional environments, and economic development levels compared to non-key cities. Enterprises in key cities are more likely to gather green innovation resources, and their transaction costs are lower and more market-oriented, so they are more likely to receive positive feedback on IPR policy incentives. As a result, firm green innovation in key cities is more likely to be enhanced.

7. Mechanism Testing

According to the theoretical analysis in the previous content, the IPR policy mainly promotes FGI through two action paths: increasing R&D investment and alleviating financing constraints. Additionally, we constructed a DDD model based on model (1) by adding R&D input mechanism variables and financing constraint mechanism variables, respectively, as shown in Equation (2).
G r e e n P a t i , s , t = α 0 + α 1 d i d i , s , t × M + α 2 d i d i , s , t + α 3 C t r l i , s , t + β i + γ s + δ t + ε i , s , t
In the above equation, M is the mechanism variable. The mechanism variables of R&D investment in this paper are represented by the ratios of R&D personnel to operating revenue (RD1) and R&D investment to operating revenue (RD2). Consequently, the mechanism variables of financing constraints in this paper are characterized by the FC index [41] and the WW index [61]. Table 10 displays the results of the respective mechanism testing.
Mechanism test of increasing R&D investment. Table 10 (Columns 1 and 2) demonstrates the outcomes of the R&D investment mechanism of the IPR policy on FGI. Moreover, the findings indicate that the DDD term coefficient did*RD1 is notably positive at the 10% level and the DDD term coefficient did*RD2 is notably positive at the 5% level. In other words, the IPR policy, indeed, enhances FGI by promoting R&D investment. Therefore, hypothesis 2 is verified.
Mechanism test of easing financing constraints. Table 10 (Columns 3 and 4) demonstrates the findings of the model estimation for testing the financing constraint mechanism of the IPR policy on FGI. The results show that the DDD term coefficients (did*FC index and did*WW index) are both significantly negative at the 1% level. Hence, the IPR policy enhances firm green innovation by alleviating financing constraints. Thus, hypothesis 3 is verified.

8. Conclusions and Policy Implications

8.1. Conclusions

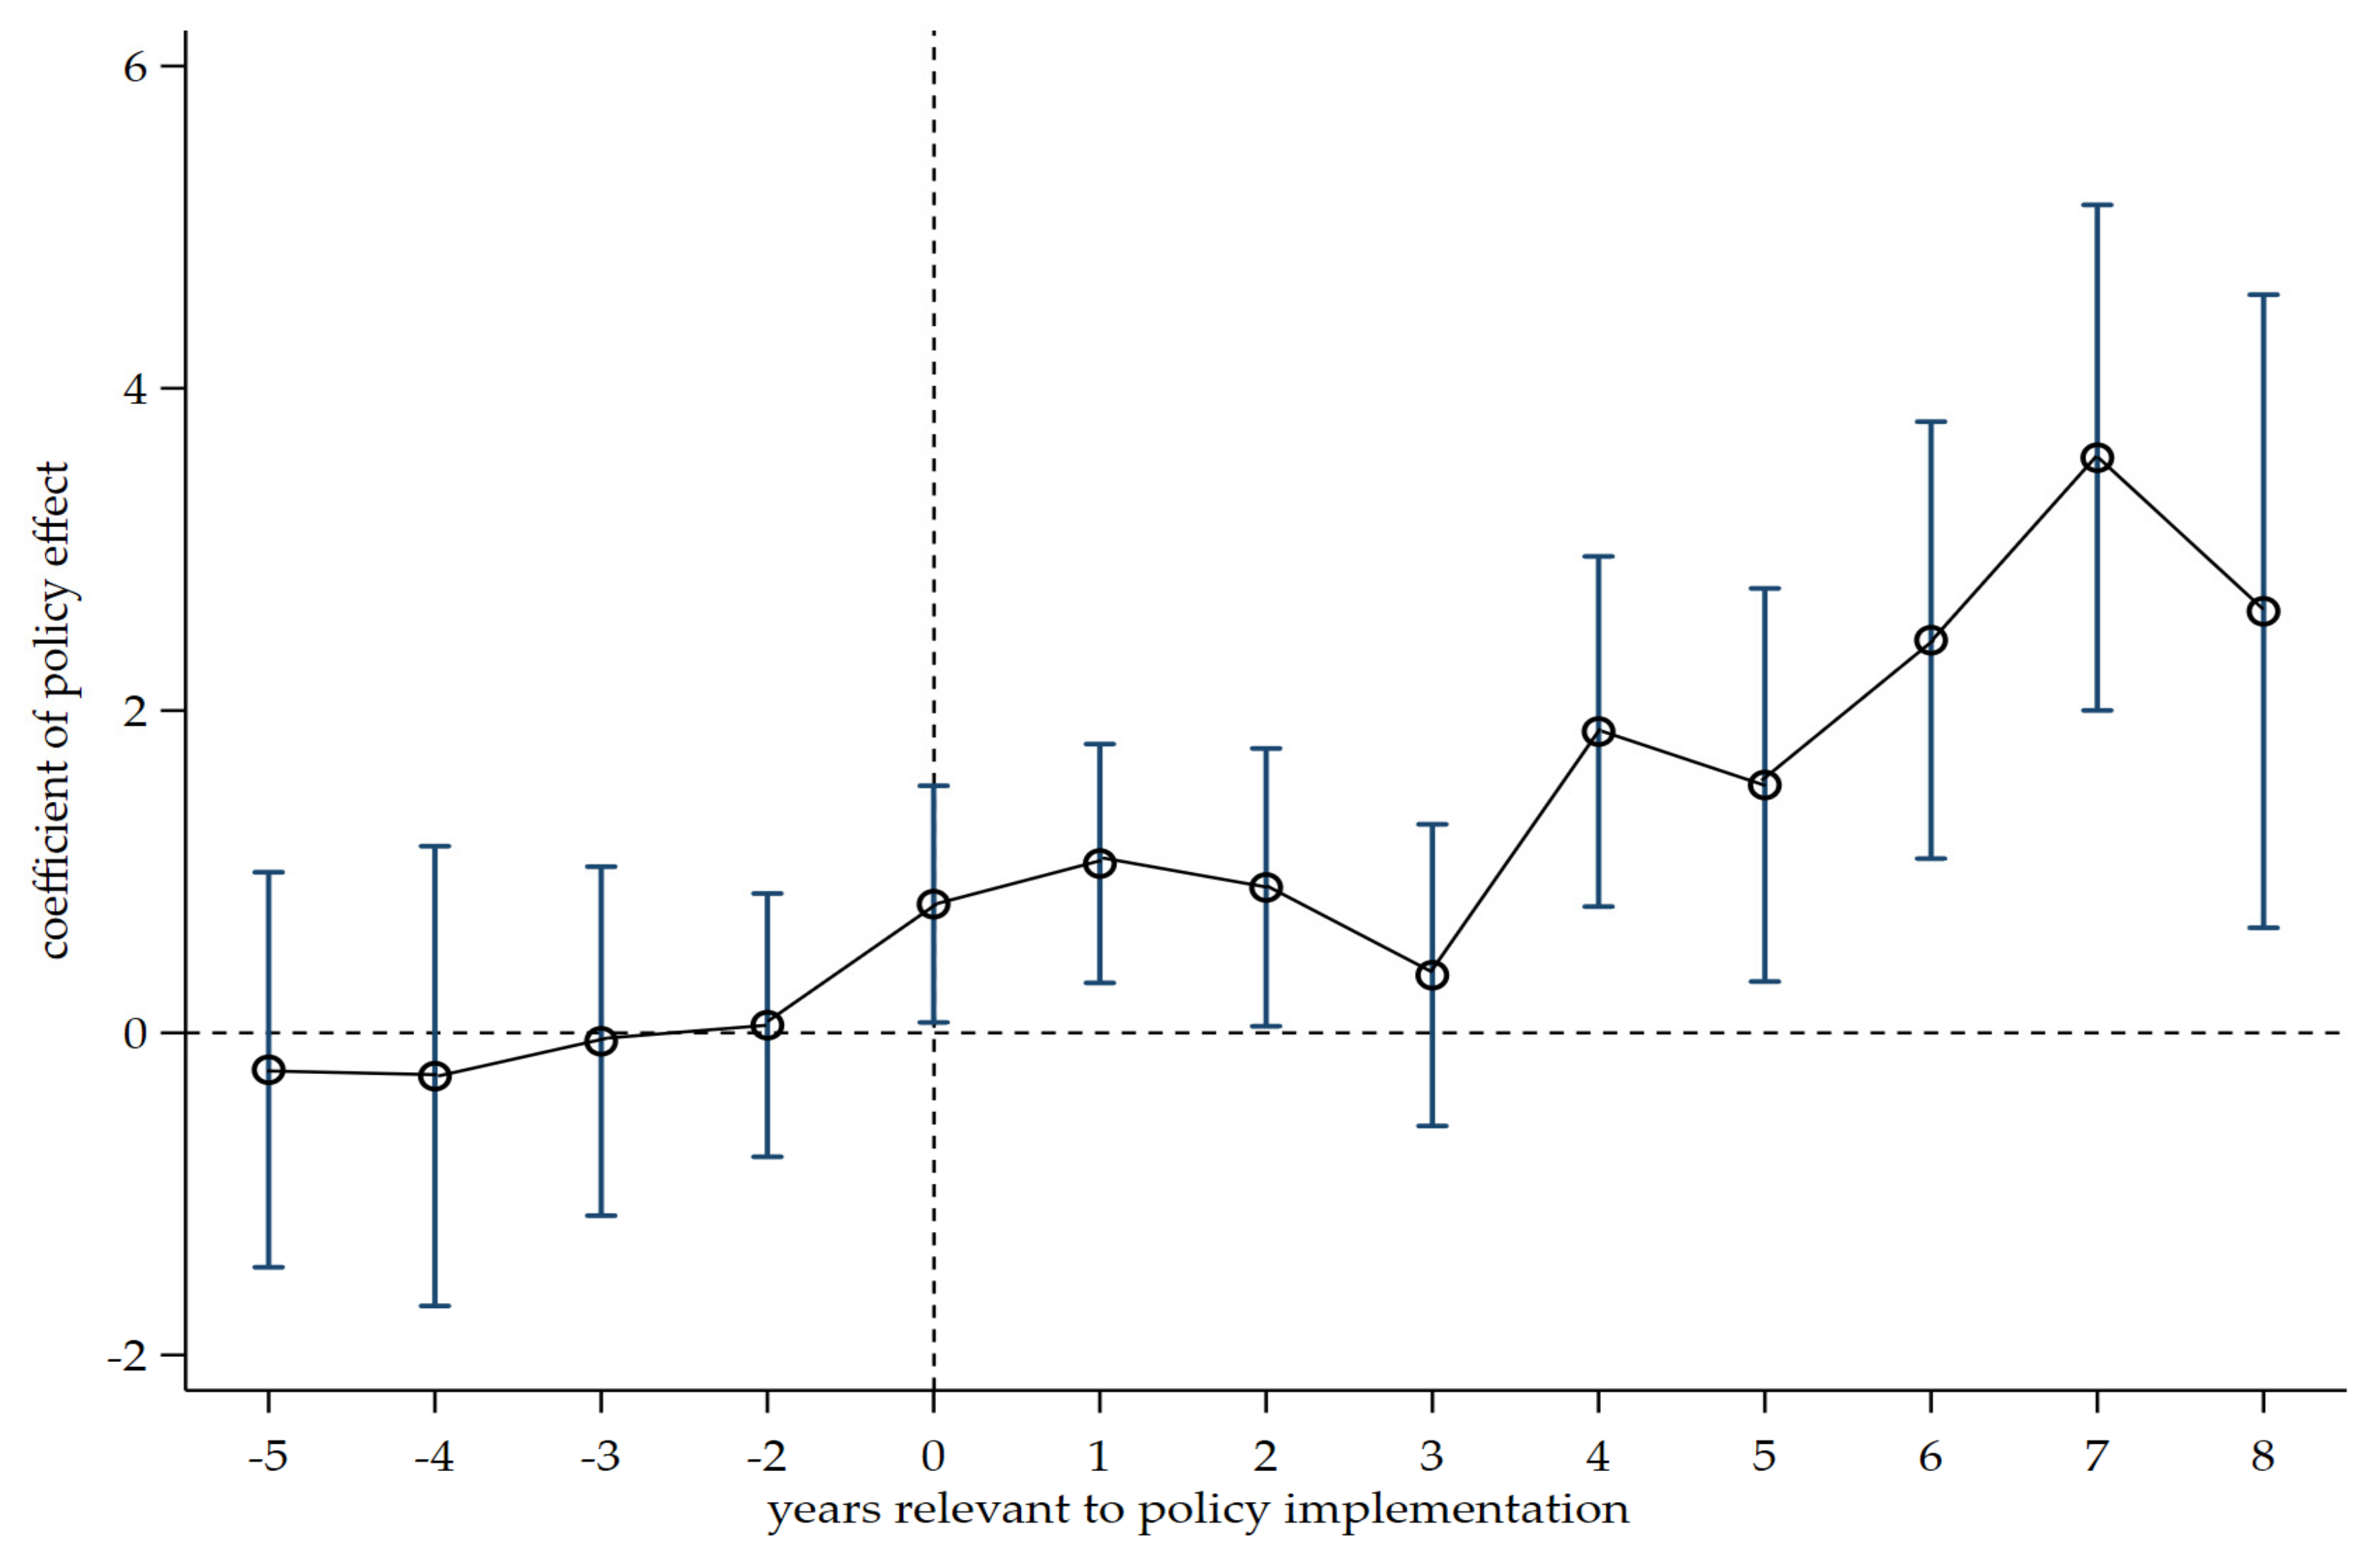
First, this article empirically examined the effect of IPR pilot city policies on FGI using a quasi-natural experiment of IPR policy and the data of Chinese listed companies from 2007 to 2020. We utilized a staggered difference-in-differences (DID) model to examine the impact of IPR policy on FGI. After controlling for variables at both the city and firm levels, the baseline model produced an estimated coefficient value of 1.334 for the policy effect, which was found to be statistically significant at the 1% level. Hence, the IPR policy significantly promotes FGI. Numerous robustness tests, including the parallel trend test, placebo test, PSM-DID test, lag variable model test, and substitution of explanatory factors, all confirm this result.
Second, we examined the heterogeneity of the benchmark model. The heterogeneity results based on GIP and GUP show that the IPR policy has a higher enhancing effect on firm green product innovation than green process innovation. Moreover, the heterogeneity findings based on independent R&D and joint R&D indicate that the IPR policy promotes FGI independent R&D while having no influence on FGI joint R&D. The regression analysis of enterprise knowledge intensity-based heterogeneity shows that the IPR policies encourage FGI with high knowledge intensity but has no effect on firms with low knowledge intensity. In addition, the findings based on the heterogeneity of firm property rights indicate that the IPR policy promotes FGI significantly in SOEs while having no significant effect on non-SOEs. The results based on enterprise location heterogeneity indicate that the IPR pilot city policy significantly promotes FGI in key cities but fails the significance level test for promoting FGI in ordinary cities.
In addition, this paper used the DDD method to empirically test the mechanism of the effect of IPR policy on FGI, based on a theoretical analysis. The findings of the empirical test based on the mechanism of R&D investment show that IPR policy enhances FGI by promoting their R&D investment. The results of the empirical test based on the financing constraint mechanism show that the IPR policy promotes FGI by alleviating the financing constraint for enterprises. Furthermore, the effect of the IPR policy on alleviating financing constraints is more obvious than the effect of the mechanism of increasing investment in R&D.

8.2. Policy Implications

Firstly, the implementation of the IPR pilot city policy can serve as a catalyst for promoting FGI. In order to effectively promote the green transformation of these enterprises and achieve sustainable economic and environmental development, it is imperative to strengthen the institutional design and arrangement of the IPR policy leading to FGI.
Secondly, enhancing FGI is heavily reliant on increasing R&D investment and alleviating corporate financing constraints. To achieve this, IPR policy must be arranged in a way that stimulates enterprises to increase R&D investment. Additionally, it is essential to provide tax incentives and financial subsidies to alleviate enterprise financing constraints, enabling enterprises to allocate more resources towards green innovation.
Lastly, the impact of IPR policies on FGI displays heterogeneity. The policies’ effects on firm green product innovation, firm independent R&D, high knowledge intensity enterprises, state-owned enterprises, and key city firms require policy makers to increase investment continuously to leverage the promotion effect of IPR policies on FGI. Additionally, promoting IPR cities in a categorized and orderly manner based on the city’s economic scale, enterprise types, and production processes is necessary.

8.3. Limitations and Directions for Further Research

This article examines the green innovation effect of IPR pilot city policies, not only expanding the practice of IPR pilot city policy evaluation but also providing empirical evidence of the effect of IPR on green innovation. Future researchers can expand their research in the following aspects: The first is to expand the indicators for measuring FGI with a view to obtaining more accurate green innovation measurement results. The second is to expand the sample scope of urban policy practices. The subject of this paper is urban areas in China, while the applicability of the findings to other developing and developed countries remains to be further verified. The third is that the sample objects of the enterprises studied in this paper are listed companies, and there is no detailed division of enterprise categories. Subsequently, researchers can undertake policy studies on companies to obtain more precise research findings.

Author Contributions

Conceptualization, X.X. and S.Z.; methodology, X.X.; software, X.X.; validation, X.X., T.H. and S.Z.; formal analysis, X.X.; investigation, X.X. and T.H.; resources, S.Z.; data curation, X.X.; writing—original draft preparation, X.X.; writing—review and editing, X.X. and T.H.; visualization, X.X. and T.H.; supervision, S.Z.; project administration, S.Z.; funding acquisition, S.Z. All authors have read and agreed to the published version of the manuscript.

Funding

This research received no external funding.

Data Availability Statement

The datasets are available from X.X. on reasonable request.

Conflicts of Interest

The authors declare no conflict of interest.

References

  1. Wolf, M.J.; Emerson, J.W.; Esty, D.C.; de Sherbinin, A.; Wendling, Z.A. 2022 Environmental Performance Index; Yale Center for Environmental Law & Policy: New Haven, CT, USA, 2022. [Google Scholar]
  2. Khanra, S.; Kaur, P.; Joseph, R.P.; Malik, A.; Dhir, A. A resource-based view of green innovation as a strategic firm resource: Present status and future directions. Bus. Strategy Environ. 2022, 31, 1395–1413. [Google Scholar] [CrossRef]
  3. Yuan, B.; Li, C.; Yin, H.; Zeng, M. Green innovation and China’s CO2 emissions—The moderating effect of institutional quality. J. Environ. Plan. Manag. 2022, 65, 877–906. [Google Scholar] [CrossRef]
  4. Wan, Q.; Yuan, L.; Yao, Z.; Xu, Y. Impact of intellectual property protection on the innovation efficiency in China’s hi-tech industry. Technol. Anal. Strateg. Manag. 2023, 35, 107–122. [Google Scholar] [CrossRef]
  5. Dong, B.; Guo, Y.; Hu, X. Intellectual property rights protection and export product quality: Evidence from China. Int. Rev. Econ. Financ. 2022, 77, 143–158. [Google Scholar] [CrossRef]
  6. Uyar, A.; Bani-Mustafa, A.; Nimer, K.; Schneider, F.; Hasnaoui, A. Does innovation capacity reduce tax evasion? Moderating effect of intellectual property rights. Technol. Forecast. Soc. Change 2021, 173, 121125. [Google Scholar] [CrossRef]
  7. Lerner, J. The empirical impact of intellectual property rights on innovation: Puzzles and clues. Am. Econ. Rev. 2009, 99, 343–348. [Google Scholar] [CrossRef]
  8. Eppinger, E.; Jain, A.; Vimalnath, P.; Gurtoo, A.; Tietze, F.; Chea, R.H. Sustainability transitions in manufacturing: The role of intellectual property. Curr. Opin. Environ. Sustain. 2021, 49, 118–126. [Google Scholar] [CrossRef]
  9. CNIPA. National Intellectual Property Pilot and Demonstration Cities (Urban Areas) Assessment and Management Policies. Available online: https://www.cnipa.gov.cn/art/2014/6/13/art_548_146100.html (accessed on 22 April 2022).
  10. Chu, J.M. Developing and diffusing green technologies: The impact of intellectual property rights and their justification. Wash. Lee J. Energy Clim. Environ. 2012, 4, 53. [Google Scholar]
  11. Reichman, J.H.; Rai, A.K.; Newell, R.G.; Wiener, J.B. Intellectual property and alternatives: Strategies for green innovation. Intellect. Prop. Rights Leg. Econ. Chall. Dev. 2014, 356–391. [Google Scholar]
  12. Goeschl, T.; Perino, G. The climate policy hold-up: Green technologies, intellectual property rights, and the abatement incentives of international agreements. Scand. J. Econ. 2017, 119, 709–732. [Google Scholar] [CrossRef]
  13. Khurshid, A.; Rauf, A.; Calin, A.C.; Qayyum, S.; Mian, A.H.; Fatima, T. Technological innovations for environmental protection: Role of intellectual property rights in the carbon mitigation efforts. Evidence from western and southern Europe. Int. J. Environ. Sci. Technol. 2022, 19, 3919–3934. [Google Scholar] [CrossRef]
  14. Roh, T.; Lee, K.; Yang, J.Y. How do intellectual property rights and government support drive a firm’s green innovation? The mediating role of open innovation. J. Clean. Prod. 2021, 317, 128422. [Google Scholar] [CrossRef]
  15. Yi, Y.; Wei, Z.; Fu, C. An optimal combination of emissions tax and green innovation subsidies for polluting oligopolies. J. Clean. Prod. 2021, 284, 124693. [Google Scholar] [CrossRef]
  16. Chu, Z.; Cheng, M.; Yu, N.N. A smart city is a less polluted city. Technol. Forecast. Soc. Change 2021, 172, 121037. [Google Scholar] [CrossRef]
  17. Wang, L.; Xie, Q.; Xue, F.; Li, Z. Does smart city construction reduce haze pollution? Int. J. Environ. Res. Public Health 2022, 19, 16421. [Google Scholar] [CrossRef] [PubMed]
  18. Zhang, M.; Hong, Y.; Zhu, B. Does national innovative city pilot policy promote green technology progress? Evidence from China. J. Clean. Prod. 2022, 363, 132461. [Google Scholar] [CrossRef]
  19. Appio, F.P.; Lima, M.; Paroutis, S. Understanding Smart Cities: Innovation ecosystems, technological advancements, and societal challenges. Technol. Forecast. Soc. Change 2019, 142, 1–14. [Google Scholar] [CrossRef]
  20. Linde, L.; Sjödin, D.; Parida, V.; Wincent, J. Dynamic capabilities for ecosystem orchestration A capability-based framework for smart city innovation initiatives. Technol. Forecast. Soc. Change 2021, 166, 120614. [Google Scholar] [CrossRef]
  21. Liu, K.; Xue, Y.; Chen, Z.; Miao, Y. The spatiotemporal evolution and influencing factors of urban green innovation in China. Sci. Total Environ. 2023, 857, 159426. [Google Scholar] [CrossRef]
  22. Zeng, J.; Škare, M.; Lafont, J. The co-integration identification of green innovation efficiency in Yangtze River Delta region. J. Bus. Res. 2021, 134, 252–262. [Google Scholar] [CrossRef]
  23. Lowe, M.; Adlakha, D.; Sallis, J.F.; Salvo, D.; Cerin, E.; Moudon, A.V.; Higgs, C.; Hinckson, E.; Arundel, J.; Boeing, G. City planning policies to support health and sustainability: An international comparison of policy indicators for 25 cities. Lancet Glob. Health 2022, 10, e882–e894. [Google Scholar] [CrossRef] [PubMed]
  24. Caragliu, A.; Del Bo, C.F. Smart innovative cities: The impact of Smart City policies on urban innovation. Technol. Forecast. Soc. Change 2019, 142, 373–383. [Google Scholar] [CrossRef]
  25. Li, Q.; Liu, S.; Yang, M.; Xu, F. The effects of China’s sustainable development policy for resource-based cities on local industrial transformation. Resour. Policy 2021, 71, 101940. [Google Scholar] [CrossRef]
  26. Zhu, B.; Pain, K.; Taylor, P.J.; Derudder, B. Exploring external urban relational processes: Inter-city financial flows complementing global city-regions. Reg. Stud. 2022, 56, 737–750. [Google Scholar] [CrossRef]
  27. Yu, F.; Jiang, D.; Wang, T. The impact of green innovation on manufacturing small and medium enterprises corporate social responsibility fulfillment: The moderating role of regional environmental regulation. Corp. Soc. Responsib. Environ. Manag. 2022, 29, 712–727. [Google Scholar] [CrossRef]
  28. Xiang, X.; Liu, C.; Yang, M. Who is financing corporate green innovation? Int. Rev. Econ. Financ. 2022, 78, 321–337. [Google Scholar] [CrossRef]
  29. Wang, Y.; Yu, L. Can the current environmental tax rate promote green technology innovation? Evidence from China’s resource-based industries. J. Clean. Prod. 2021, 278, 123443. [Google Scholar] [CrossRef]
  30. Sánchez-Sellero, P.; Bataineh, M.J. How R&D cooperation, R&D expenditures, public funds and R&D intensity affect green innovation? Technol. Anal. Strateg. Manag. 2022, 34, 1095–1108. [Google Scholar]
  31. Tolliver, C.; Fujii, H.; Keeley, A.R.; Managi, S. Green innovation and finance in Asia. Asian Econ. Policy Rev. 2021, 16, 67–87. [Google Scholar] [CrossRef]
  32. Lian, G.; Xu, A.; Zhu, Y. Substantive green innovation or symbolic green innovation? The impact of ER on enterprise green innovation based on the dual moderating effects. J. Innov. Knowl. 2022, 7, 100203. [Google Scholar] [CrossRef]
  33. Xie, R.; Teo, T.S. Green technology innovation, environmental externality, and the cleaner upgrading of industrial structure in China—Considering the moderating effect of environmental regulation. Technol. Forecast. Soc. Change 2022, 184, 122020. [Google Scholar] [CrossRef]
  34. Wang, W.; Liu, Y. Industrial funding and university technology transfer: The moderating role of intellectual property rights enforcement. J. Technol. Transf. 2022, 47, 1549–1572. [Google Scholar] [CrossRef]
  35. Hu, D.; Qiu, L.; She, M.; Wang, Y. Sustaining the sustainable development: How do firms turn government green subsidies into financial performance through green innovation? Bus. Strategy Environ. 2021, 30, 2271–2292. [Google Scholar] [CrossRef]
  36. Zhu, Z.; Tan, Y. Can green industrial policy promote green innovation in heavily polluting enterprises? Evidence from China. Econ. Anal. Policy 2022, 74, 59–75. [Google Scholar] [CrossRef]
  37. Peng, H.; Shen, N.; Ying, H.; Wang, Q. Can environmental regulation directly promote green innovation behavior?—Based on situation of industrial agglomeration. J. Clean. Prod. 2021, 314, 128044. [Google Scholar] [CrossRef]
  38. Zhao, J.; Ni, J. A dynamic analysis of corporate investments and emission tax policy in an oligopoly market with network externality. Oper. Res. Lett. 2021, 49, 81–83. [Google Scholar] [CrossRef]
  39. Tang, C.; Guan, M.; Dou, J. Understanding the impact of high speed railway on urban innovation performance from the perspective of agglomeration externalities and network externalities. Technol. Soc. 2021, 67, 101760. [Google Scholar] [CrossRef]
  40. Shen, C.; Li, S.; Wang, X.; Liao, Z. The effect of environmental policy tools on regional green innovation: Evidence from China. J. Clean. Prod. 2020, 254, 120122. [Google Scholar] [CrossRef]
  41. Zhai, Y.; Cai, Z.; Lin, H.; Yuan, M.; Mao, Y.; Yu, M. Does better environmental, social, and governance induce better corporate green innovation: The mediating role of financing constraints. Corp. Soc. Responsib. Environ. Manag. 2022, 29, 1513–1526. [Google Scholar] [CrossRef]
  42. Nie, P.Y.; Wen, H.X.; Wang, C. Cooperative green innovation. Environ. Sci. Pollut. Res. 2022, 29, 30150–30158. [Google Scholar] [CrossRef]
  43. Yang, N.; Liu, Q.; Wang, X. How does industrial coagglomeration affect regional green innovation? Evidence from Chinese cities. Technol. Anal. Strateg. Manag. 2022, 34, 1–14. [Google Scholar] [CrossRef]
  44. Cui, R.; Wang, J. Shaping sustainable development: External environmental pressure, exploratory green learning, and radical green innovation. Corp. Soc. Responsib. Environ. Manag. 2022, 29, 481–495. [Google Scholar] [CrossRef]
  45. Xia, L.; Gao, S.; Wei, J.; Ding, Q. Government subsidy and corporate green innovation-Does board governance play a role? Energy Policy 2022, 161, 112720. [Google Scholar] [CrossRef]
  46. Luo, X.; Zhang, W. Green innovation efficiency: A threshold effect of research and development. Clean Technol. Environ. Policy 2021, 23, 285–298. [Google Scholar] [CrossRef]
  47. Yang, Y.; Wang, Y. Research on the impact of environmental regulations on the green innovation efficiency of Chinese industrial enterprises. Pol. J. Environ. Stud. 2021, 30, 1433–1445. [Google Scholar]
  48. Zhao, X.; Nakonieczny, J.; Jabeen, F.; Shahzad, U.; Jia, W. Does green innovation induce green total factor productivity? Novel findings from Chinese city level data. Technol. Forecast. Soc. Change 2022, 185, 122021. [Google Scholar] [CrossRef]
  49. Yu, C.H.; Wu, X.; Zhang, D.; Chen, S.; Zhao, J. Demand for green finance: Resolving financing constraints on green innovation in China. Energy Policy 2021, 153, 112255. [Google Scholar] [CrossRef]
  50. Hu, G.; Wang, X.; Wang, Y. Can the green credit policy stimulate green innovation in heavily polluting enterprises? Evidence from a quasi-natural experiment in China. Energy Econ. 2021, 98, 105134. [Google Scholar] [CrossRef]
  51. García-Quevedo, J.; Segarra-Blasco, A.; Teruel, M. Financial constraints and the failure of innovation projects. Technol. Forecast. Soc. Change 2018, 127, 127–140. [Google Scholar] [CrossRef]
  52. Tan, Y.; Zhu, Z. The effect of ESG rating events on corporate green innovation in China: The mediating role of financial constraints and managers’ environmental awareness. Technol. Soc. 2022, 68, 101906. [Google Scholar] [CrossRef]
  53. Roxas, B. Eco-innovations of firms: A longitudinal analysis of the roles of industry norms and proactive environmental strategy. Bus. Strategy Environ. 2022, 31, 515–531. [Google Scholar] [CrossRef]
  54. Lu, H.; Wang, S. Can China’s national Five-Year Plan for environmental protection induce corporate green innovations? Environ. Sci. Pollut. Res. 2022, 29, 34437–34451. [Google Scholar] [CrossRef] [PubMed]
  55. He, K.; Chen, W.; Zhang, L. Senior management’s academic experience and corporate green innovation. Technol. Forecast. Soc. Change 2021, 166, 120664. [Google Scholar] [CrossRef]
  56. Li, J.; Du, Y. Spatial effect of environmental regulation on green innovation efficiency: Evidence from prefectural-level cities in China. J. Clean. Prod. 2021, 286, 125032. [Google Scholar]
  57. Lin, B.; Ma, R. Green technology innovations, urban innovation environment and CO2 emission reduction in China: Fresh evidence from a partially linear functional-coefficient panel model. Technol. Forecast. Soc. Change 2022, 176, 121434. [Google Scholar] [CrossRef]
  58. Peng, W.; Yin, Y.; Kuang, C.; Wen, Z.; Kuang, J. Spatial spillover effect of green innovation on economic development quality in China: Evidence from a panel data of 270 prefecture-level and above cities. Sustain. Cities Soc. 2021, 69, 102863. [Google Scholar] [CrossRef]
  59. Beck, T.; Levine, R.; Levkov, A. Big bad banks? The winners and losers from bank deregulation in the United States. J. Financ. 2010, 65, 1637–1667. [Google Scholar] [CrossRef]
  60. Mbanyele, W.; Huang, H.; Li, Y.; Muchenje, L.T.; Wang, F. Corporate social responsibility and green innovation: Evidence from mandatory CSR disclosure laws. Econ. Lett. 2022, 212, 110322. [Google Scholar] [CrossRef]
  61. Liu, J.; Jiang, Y.; Gan, S.; He, L.; Zhang, Q. Can digital finance promote corporate green innovation? Environ. Sci. Pollut. Res. 2022, 29, 35828–35840. [Google Scholar] [CrossRef]
Figure 1. Time trend for IPR cites and non-IPR cities.
Systems 11 00209 g001
Figure 2. IPR pilot city policy placebo test.
Systems 11 00209 g002
Table 1. Descriptive statistics.
VariablesNMeanSdMinMax
GreenPat95775.14513.27087
Greenpat295779.11824.970174
lnAsset957722.271.33619.9126.36
lnAge95772.0700.7530.6933.219
lnTobinQ95770.6140.489−0.1392.118
Staff95771.3951.0620.09655.639
Current95772.2632.1630.33214.35
LOAR95770.4390.2050.05930.922
Indirector957737.445.38133.3357.14
Economic957711.340.5259.71312.19
Industry957739.9012.5216.2065.19
Environment957710.191.4226.65512.81
FC index95770.4410.2810.002190.928
WW index8741−1.0210.0759−1.242−0.857
RD 1520216.3114.120.31067.34
RD 284474.5234.7300.030026.79
GIP95771.4394.499030
GUP95773.5388.939056
Notes: N = numbers of observations; Mean = mean value; Sd = standard deviation; Min = minimum value; Max = maximum value.
Table 2. The regression estimates of the benchmark analysis.
Variables(1)(2)(3)
did1.063 **1.163 ***1.334 ***
(2.534)(2.799)(3.232)
lnAge −1.267 **−1.246 **
(−2.475)(−2.433)
lnTobinQ −0.767 **−0.746 **
(−2.294)(−2.227)
lnAsset 2.575 ***2.578 ***
(7.470)(7.458)
Current 0.118 **0.122 **
(2.114)(2.175)
LOAR 2.312 **2.315 **
(2.353)(2.355)
Indirector −0.0442−0.0443
(−1.539)(−1.547)
Staff 0.610 ***0.610 ***
(4.440)(4.419)
Industry 0.0191
(0.434)
Economic 0.508
(0.693)
Environment −0.531 ***
(−3.723)
R-squared0.7870.7930.793
Firm FEYESYESYES
Year FEYESYESYES
City FEYESYESYES
Observations904690469046
Notes: ** p < 0.05, *** p < 0.01. Firm FE = fix firm effect. Year FE = fix year effect. City FE = fix city effect.
Table 3. PSM-DID test for IPR pilot city policy.
Variables(1)(2)(3)
K-nearest neighbor matchingradius matchingkernel matching
did2.852 ***1.262 ***1.334 ***
(4.220)(2.985)(3.232)
R-squared0.7200.7920.793
Control variablesYESYESYES
Firm FEYESYESYES
Year FEYESYESYES
City FEYESYESYES
Observations337385039046
Notes: *** p < 0.01. Control variables = firm level and city level control variables.
Table 4. Robustness test of lag variable and substitution variable.
Variables(1)(2)(3)
Variables lag one periodVariables lag two periodVariables substitution
did1.877 ***1.544 ***2.434 ***
(3.675)(2.717)(3.057)
R-squared0.8240.8460.790
Control variablesYESYESYES
Firm FEYESYESYES
Year FEYESYESYES
City FEYESYESYES
Observations648151919046
Notes: *** p < 0.01.
Table 5. Heterogeneity analysis in different patents.
Variables(1)(2)
GIPGUP
did0.458 ***0.822 ***
(2.774)(2.886)
R-squared0.7270.763
Control variablesYESYES
Firm FEYESYES
Year FEYESYES
City FEYESYES
Observations90469046
Note: *** p < 0.01.
Table 6. Heterogeneity analysis in different R&D approaches.
Variables(1)(2)
Independent R&D green patentsJoint R&D green patents
did1.274 ***−0.0373
(3.849)(−0.388)
R-squared0.7540.785
Firm FEYESYES
Year FEYESYES
City FEYESYES
Observations90469046
Notes: *** p < 0.01.
Table 7. Heterogeneity analysis in different knowledge intensity.
Variables(1)(2)
low knowledge intensityhigh knowledge intensity
did−0.3111.331 ***
(−0.317)(3.111)
R-squared0.8890.856
Firm FEYESYES
Year FEYESYES
City FEYESYES
Observations44014441
Notes: *** p < 0.01.
Table 8. Heterogeneity analysis in different enterprises.
Variables(1)(2)
SOEsnon-SOEs
did0.3253.868 ***
(0.932)(4.495)
R-squared0.6810.840
Firm FEYESYES
Year FEYESYES
City FEYESYES
Observations51673701
Notes: *** p < 0.01.
Table 9. Heterogeneity analysis in different locations.
Variables(1)(2)
Ordinary city groupskey city groups
did0.3252.180 **
(0.772)(2.488)
R-squared0.8250.668
Firm FEYESYES
Year FEYESYES
City FEYESYES
Observations66002436
Note: ** p < 0.05.
Table 10. Mechanism testing for R&D investment and financing constraints.
Variables(1)(2)(3)(4)
did*RD10.0633 *
(1.854)
did*RD2 0.115 **
(2.442)
did*FC index −6.493 ***
(−6.260)
did*WW index −24.37 ***
(−5.438)
R-squared0.8870.8150.7950.798
Firm FEYESYESYESYES
Year FEYESYESYESYES
City FEYESYESYESYES
Observations4647793790468311
Note: * p < 0.1, ** p < 0.05, *** p < 0.01.
Disclaimer/Publisher’s Note: The statements, opinions and data contained in all publications are solely those of the individual author(s) and contributor(s) and not of MDPI and/or the editor(s). MDPI and/or the editor(s) disclaim responsibility for any injury to people or property resulting from any ideas, methods, instructions or products referred to in the content.

