Article

Can the Greening of Financial Markets Be Transmitted to the Real Economy as Desired in China?

1
School of Finance and Economics, Jiangsu University, Zhenjiang 212013, China
2
Industrial Economics Research Institute, Jiangsu University, Zhenjiang 212013, China
*
Author to whom correspondence should be addressed.
Systems 2023, 11(3), 161; https://doi.org/10.3390/systems11030161
Submission received: 22 January 2023 / Revised: 16 March 2023 / Accepted: 17 March 2023 / Published: 21 March 2023

Abstract

:
The greening of financial markets can effectively guide the flow of capital to green and environmental industries, prompt the upgrading and transformation of the green industry, and help China achieve its dual carbon goals. This paper adopts China’s inter-provincial panel data from 2011 to 2020, measures the development level of the real economy in terms of innovation, coordination, green, openness, and sharing using principal component analysis, and selects core indicators such as green credit, green insurance, green investment, and financial market size. In addition, the fixed panel model and differences-in-differences model are used to carry out the research. The results show that: 1. China’s high-quality green development shows an upward trend in general, the real economy tends to be green, and the development in the east, middle, and west is gradually balanced; 2. Green credit and green insurance have a significant inhibitory effect on the development of the real economy, and this inhibitory effect is more evident in the middle and western regions; green investment has a significant positive promotion effect on promoting the development of the real economy; 3. The promulgation and implementation of policies such as the Guidance on Building a Green Financial System can significantly promote the greening of the financial market to the real economy and promote sustainable development. It should continue to promote the greening of the financial market, improve the green financial service system, smooth the transformation path of green finance to the real economy, strengthen the green guidance of the government on the development of the virtual and real economy, promote the green synergistic development of the financial market in the east and west, and promote the high-quality green sustainable development of the region.

1. Introduction

The Chinese government states that lucid waters and lush mountains are invaluable assets, so we need to heighten the harmonious coexistence of man and nature in planning development. China’s economy is transitioning from rapid growth to high-quality development. The traditional scale expansion type of crude economic growth has caused a large amount of energy waste and environmental pollution in China, making it difficult to support the high-quality development of the economy [1]. According to the China Environment Bulletin in 2011, 35.7% of air quality in 339 prefecture-level and above cities nationwide exceeds the standard; 13% of water quality in large rivers, key lakes, and reservoirs falls into the pollution category, and the total area of soil erosion nationwide is 2,692,700 square kilometers, accounting for 31.1% of the total area covered by the census [2]. Population explosion, resource depletion, energy shortage, environmental pollution, and ecological imbalance have become increasingly serious nationwide problems. The dysfunctional relationship between human society and the natural environment has become an essential socio-political issue. Compared with other industries, the six highly polluting industries, such as the chemical industry and mining industry, have more advantages in collateral in the development of enterprises. In modern financial marketization, commercial banks are more inclined to invest in such enterprises. However, environmental protection enterprises with high production cost and long investment cycles are more prone to credit discrimination in raising funds. As a result, the financial service for the green development of the real economy is inefficient and unbalanced [3]. Under the combined influence of multiple factors, such as intensifying competition among great powers, the fading of China’s demographic dividend, and restrictions on the development of real economy imposed by COVID-19 [4], balancing the relationship between economic growth and environmental friendliness and effectively promoting the greening of the real economy is necessary for China to achieve the goal of carbon peak and carbon neutrality. It is also the only way for China to achieve high-quality, sustainable, and green economic development. The gradual improvement of the financial market’s greening process will further promote green sustainable development as an indispensable way to sustainable development [5].
On a global scale, green growth represents the essence of a green economy [6]. The role of economic greening in reducing environmental pressure, promoting sustainable economic development, and improving social welfare cannot be ignored [7]. At present, the academia has not formed a unified measurement standard for the measurement of the greening of the real economy, but it has reached a consensus on some principles and methods. For example, Huang measured the greening of the real economy from the four dimensions of development scale, market environment, economic benefits and growth potential, and based on this, carried out the mechanism analysis of China’s economic structure [8]. Liu calculated the efficiency of green development in Henan Province of China based on DEA-SBM model of non-expected output, and analyzed its spatio-temporal evolution based on this [9]. Based on the connotation of high-quality economic development, Li et al. constructed a green development indicator system for the real economy consisting of five primary and 27 secondary indicators: economic vitality, green development, innovation efficiency, social harmony, and people’s lives [10]. Based on the background of China’s supply side structural reform, Meng constructed an index system of high-quality economic development with five dimensions: economic development, innovation development, green development, coordinated development, and people’s livelihood development [11]. Vukovic adopted scientific analysis, comparison and synthesis methods, fuzzy theory, and fuzzy modeling, and combined the status quo and dynamics of green economy to put forward the main principles and methods of regional green economy standard evaluation [12]. The above construction of the green indicators and the system of the real economy reflects that the research on the evaluation index system is developing gradually. However, issues such as scientifically selecting measurement indicators to enhance the indicator system’s stability and flexibility require further research on the influencing factors of the greening of the real economy. Khan argues that the development of logistics supply chains reduces the efficiency of green economy development by consuming non-renewable resources such as energy and fossil fuels [13]. Hu pointed out that the promotional effect of high-tech industry agglomeration on the green economy development efficiency showed a significant “U” curve relationship. The specialized agglomeration of the high-tech industry inhibited the development of greening of the real economy to a certain extent [14]. Zhang proposed that, with the help of fuzzy set qualitative comparative analysis method, the differentiated configuration path of high-quality development in Chinese provinces was analyzed, and two configuration paths of high-quality development were obtained [15]. The results of Xie’s study show that green credit has a significant role in promoting the development of the green economy in the real economy. The improvement of the marketization degree and decentralization of finance are also conducive to further developing the green economy [16].
The healthy development of green finance is of great significance for promoting the real economy’s high-quality development and helping the realization of the “double carbon” goal. Green finance can alleviate the environmental pressure brought by economic development through various financial instruments such as green insurance, green investment, green securities, green credit, and carbon finance [17]. It is now widely believed that the development of green finance can effectively promote carbon emission reduction, thus leading to high-quality economic development [18]. By analyzing the allocation differences of green funds in various industries, Jin found that green funds can promote the green technology innovation of the industry, improve the green technology level of small and medium-sized enterprises, and play a huge role in supporting the adjustment and upgrading of China’s industrial structure [19]. Schoenmaker proposed a green credit policy to examine the carbon intensity of assets and collateral of the European Central Bank’s quantitative easing policy. The result showed that if the ECB purchased low-carbon assets, the carbon emissions of these assets could be reduced by 55% [20]. Lee et al. used a spatial dynamic panel model and found that the development of green finance not only reduces local carbon emissions but also helps to reduce carbon emissions in neighboring regions all the time [21]. For micro-entities, green finance can support enterprises to carry out environmental protection, combat climate change, and save resources, thus promoting low-carbon development and green innovation projects. Zhuge found that the green finance reform and innovation pilot zone established in China in 2017 can effectively alleviate the financing constraints of industrial enterprises. The green finance reform and innovation pilot zone can increase the scale of green credit in the pilot zone, thus promoting green innovation of environmental protection industrial enterprises [22]. Wang believes that with the further development and widespread application of fintech, green finance can play a positive regulating role in the green innovation performance of the manufacturing industry [23]. Chai used the PSM-DID model and found that with the continuous improvement of green finance policies, the debt financing behavior of heavily polluting enterprises with poor liquidity decreases significantly. Moreover, the financing methods of liquid debt and commercial credit increase significantly instead, thus accelerating the technological upgrading and transformation of enterprises [24]. J Jiang adopted the intermediary effect model and the moderating effect model and found that with the improvement of regional intellectual property protection, green finance encourages enterprises to improve the level of green technology innovation by easing the financing constraints of enterprises, and this incentive effect is more obvious for state-owned enterprises, enterprises with good internal control quality and enterprises that are in their growth stage [25].
According to the current research results, the article finds that: 1. There is no unified indicator system for measuring the green development of the real economy; 2. The development of green finance is also not mature enough; 3. The research on green finance and the greening of the real economy is still in the initial stage; 4. At present, the academic community is more concerned with the research on the role of green credit in the green innovation of micro-enterprises. However, there needs to be more research on the role of green finance and the greening of the real national economy at the macro level. Moreover, there needs to be more research on the role of relevant national policies.
Therefore, based on the above literature analysis, this paper will explore the role relationship between green finance and the high-quality green development of the real economy, and study whether the greening of financial markets, such as green credit, green insurance and green investment, can be effectively transmitted to the real economy and promote the green development of the real economy, which has important theoretical and practical significance. In this paper, the index system of the greening of the real economy will be constructed, and the fixed-effect model and the difference–difference model will be established to study the effect of green finance on the greening of the real economy and the incentivizing effect of relevant policies.

2. Model Construction

2.1. Principal Component Analysis Method

Principal component analysis (PCA) is a multivariate statistical method that uses the idea of dimensionality reduction and converts multiple indicators into several comprehensive indicators on the premise of losing little information. The transformed composite indicators are called principal components. Each principal component is a linear combination of the original variables, and each principal component is uncorrelated from each other, making the principal components have superior performance compared to the original variables. Compared to other methods of index system construction, such as hierarchical analysis, entropy value method, and factor analysis, the principal component analysis method has unique advantages. In this method, by constructing the covariance matrix of variables and analyzing the characteristic roots and eigenvectors of the matrix, the variables with irrelevant information are eliminated, the relevant information variables are retained to determine the principal component, and the weight is determined according to the information retained by the principal component. At present, some expert academics have also adopted the PCA method to construct the greening index system of the real economy to carry out relevant research. Chen et al. consider that principal component analysis can reduce the dimensional and order-of-magnitude differences among indicators, thus more accurately measuring the level of green and high-quality development of the Chinese economy and providing a new possible path for China’s economic transformation [26].
One principal component is insufficient to represent the original p variables, so a second or even a third or fourth principal component needs to be found, and the second principal component should no longer contain the information of the first principal component. The statistical description is to let the covariance of these two principal components be zero. Geometrically described is the directional orthogonality of these two principal components. The specific method for determining each principal component is as follows.
The paper sets Equation (1). In Equation (1), z i denotes the ith principal component, and i = 1,2,...,p. There are a i 1 2 + a i 2 2 + + a i p 2 = 1 .
{ z 1 = a 11 x 1 + a 12 x 1 + + a 1 p x p z 1 = a 21 x 1 + a 22 x 2 + + a 2 p x p z k = a k 1 x 1 + a k 2 x 2 + + a k p x p
The raw data were first standardized to eliminate the influence of the magnitude. Assume that there are m indicator variables for principal component analysis: x1,x2,...,xm. There are n evaluation objects, and the jth indicator of the ith evaluation object takes the value of xij. Convert each indicator value xij into a standardized indicator x i j ˜ . x i j ˜ = x i j x i j ¯ s j , (i = 1,2,...,n; j = 1,2,...,m). x j ¯ = 1 n i = 1 n x i j , and s j = 1 n 1 ( x i j x j ¯ ) 2 , (j = 1,2,...,m), i.e., x j ¯ , s j are the sample mean and sample standard deviation of the jth indicator. Correspondingly, x i ˜ = x i x i ¯ s i , (i = 1,2,...,m), is the standardized indicator variable.
Establish the correlation coefficient matrix R between the variables, the correlation coefficient matrices R = ( r i j ) m × m , r i j = k = 1 n x k i ˜ · x k j ˜ n 1 , (i,j = 1,2,...,m). rii = 1, rij = rji, and rij are the correlation coefficients of the ith indicator with the jth indicator.
Calculate the eigenvalues ( λ 1 λ 2 λ m 0 ) of the correlation coefficient matrix R and the corresponding eigenvectors u1, u2,...,um. u j = ( u 1 j , u 2 j , , u n j ) T . m new indicator variables are formed from the eigenvectors, as shown in Equation (2), where y1 is the first principal component, y2 is the second principal component,..., ym is the mth principal component.
{ y 1 = u 11 x ˜ 1 + u 21 x ˜ 2 + + u n 1 x ˜ n y 2 = u 12 x ˜ 1 + u 22 x ˜ 2 + + u n 2 x ˜ n y m = u 1 m x ˜ 1 + u 2 m x ˜ 2 + + u n m x ˜ n
Finally, the principal components are calculated and the composite score is calculated. Calculate the eigenvalues λ j   ( j = 1 , 2 , , m ) of information contribution and cumulative contribution; b j = λ j k = 1 m λ k ( j = 1 , 2 , , m ) is the information contribution rate of the principal component yj, α p = k = 1 p λ k k = 1 m λ k is the cumulative contribution rate of the principal component y,y12,...,yp. When ap is close to 1 (ap = 0.85,0.90,0.95), the first p indicator variables y1,y2,...,yp are selected as the p principal components instead of the original m indicator variables, so that the p principal components can be analyzed synthetically. Calculate the composite score Z = j = 1 p b j y j , where bj is the information contribution of the jth principal component.

2.2. Panel Regression Model

Panel data track the same individuals over time, with a cross-sectional n-individual dimension and a temporal T-period. For the study of panel data, academics usually use fixed-effects models, random-effects models, and mixed-effects models for their studies. One strategy is to perform mixed regressions as cross-sectional data, requiring each sampled individual to have the same regression equation. However, this ignores the unobservable or missed heterogeneity among individuals. The heterogeneity may be correlated with the explanatory variables, thus leading to inconsistent estimates. Another strategy is to estimate a separate regression equation for each individual, which ignores the commonality among individuals and may need a larger sample size. Considering the shortcomings of both strategies, a compromise estimation strategy can be used to capture heterogeneity by assuming that the regression equations of individuals have the same slope and different intercept terms. The underlying assumption of mixed effects is that there are no individual effects. Individual effects can be divided into two forms, fixed effects and random effects, while fixed effects are divided into individual-fixed effects and time-solid effects. The individual-fixed effect is a form of deviation from the mixed-effects model minus its averaging over time (see Equation (4)). The time-fixed effect can solve the omitted variables that do not vary with individuals but with time (see Equation (5)). The random-effects model treats the regression coefficient as a variable estimated by feasible generalized least squares (see Equation (6)). Suppose it is further assumed that the perturbation terms obey a normal distribution. In that case, the log-likelihood function of the sample can be written, and then the maximum likelihood estimation can be performed.
y i t = α + x i t β + z i δ + u i + ε i t      
y i t y ¯ i = ( x i t x ¯ i ) β + ( ε i t ε ¯ i )      
y i t = x i t β + z i δ + λ t ε i t + ε i t  
y i t θ ^ y ¯ = ( x i t θ ^ x i ¯ ) β + ( 1 θ ^ ) z i δ + [ ( 1 θ ^ ) u i + ( ε i t θ ^ ε i ¯ ) ]      
In Equation (3), the y i t are the explained variables, the x i t is the explanatory variable, z i is the individual characteristic that does not change with time, and ε i t is the perturbation term that changes with individual and time, and it is assumed that { ε i t } is independently and identically distributed and uncorrelated with u i uncorrelated. If u i is correlated with an explanatory variable, it is further referred to as a fixed-effects model. In Equation (4), the u i is eliminated, so that whenever ε ¯ i t is correlated with x ¯ i t , then OLS can be used to consistently estimate β ,   i . e . , the fixed-effects estimator. In Equation (5), the λ t is an intercept term unique to period t, which is interpreted as the effect of “period t” on the explanatory variable y of the explanatory variables. In Equation (6), the u i with the explanatory variable x i t and z i are not correlated, so OLS is consistent, but the specific model used in the study needs to be further tested.

2.3. Differences-in-Differences Model

Compared to the traditional method of assessing policy effects, the differences-in-differences model (DID) is more scientific and mainly sets a dummy variable for whether the regression of policy occurrence exists or not. The model can estimate the policy effects more accurately and avoid the endogeneity problem to a large extent without the problem of reverse causality. As one of the most common non-experimental methods for policy evaluation, DID treats a new policy as a “natural experiment” and sets up an experimental group and a control group to compare the effects of the new policy. In this paper, the differential method is combined with the panel data. At this time, the bidirectional fixed-effect model is mostly used, so the differential method model is expressed as Formula (7), where Y i t is the result variable, D i is the police grouping dummy variable, T t is the police time dummy variable, D i × T t is the interaction term between them, δ ,   and   β are the coefficients before each term, ε i t is the random error term, μ i and γ t are individual-fixed effect and time-fixed effect, respectively. After taking the conditional expectation of the above equation, the estimated effect can be obtained as shown in Table 1, where β represents the causal effect that this paper pays more attention to. Difference–difference methods usually involve two groups of people and two groups of periods. One group received no treatment in the first period, but received intervention or treatment in the second period; the other group received no treatment at either time. Individual i is defined as D i t = 1 for receiving processing in period t, and D i t = 0 for not receiving processing. Generally, the period before the processing group receives processing is denoted T = 0, and the period after processing is denoted T = 1. Among them, D i 1 = 1 is used for all individuals in the treatment group, D i 1 = 0 is used for all individuals in the control group, and D i 0 = 0 is used for all individuals i. The individual-fixed effect and time-fixed effect can be controlled by adding the individual dummy variable and the time dummy variable in the regression, while adding the treatment group dummy variable at this time will bring about strict multicollinearity. μ i and γ t are the controls on the individual level and the time of each period, which are more detailed and contain more information than the policy grouping dummy variables D i and policy time dummy variables T t in the original model.
Y i t = α + β ( D i × T t ) + μ i + γ t + ε i t

2.4. Variable Selection

2.4.1. Explained Variables

This paper follows the principles of scientificity to construct the evaluation system of the greening development of the real economy. Based on the research of Chen et al. [27], we use principal component analysis to construct a comprehensive evaluation system of the greening of the real economy containing 15 specific indicators from five dimensions of innovation, coordination, green, openness, and sharing. The specific indicators are selected as shown in Table 1. “+” represents the positive indicators and “−” represents the negative indicators. The data sources of each specific indicator are the China Statistical Yearbook, the China Energy Statistical Yearbook, and the National Bureau of Statistics.

2.4.2. Core Explanatory Variables

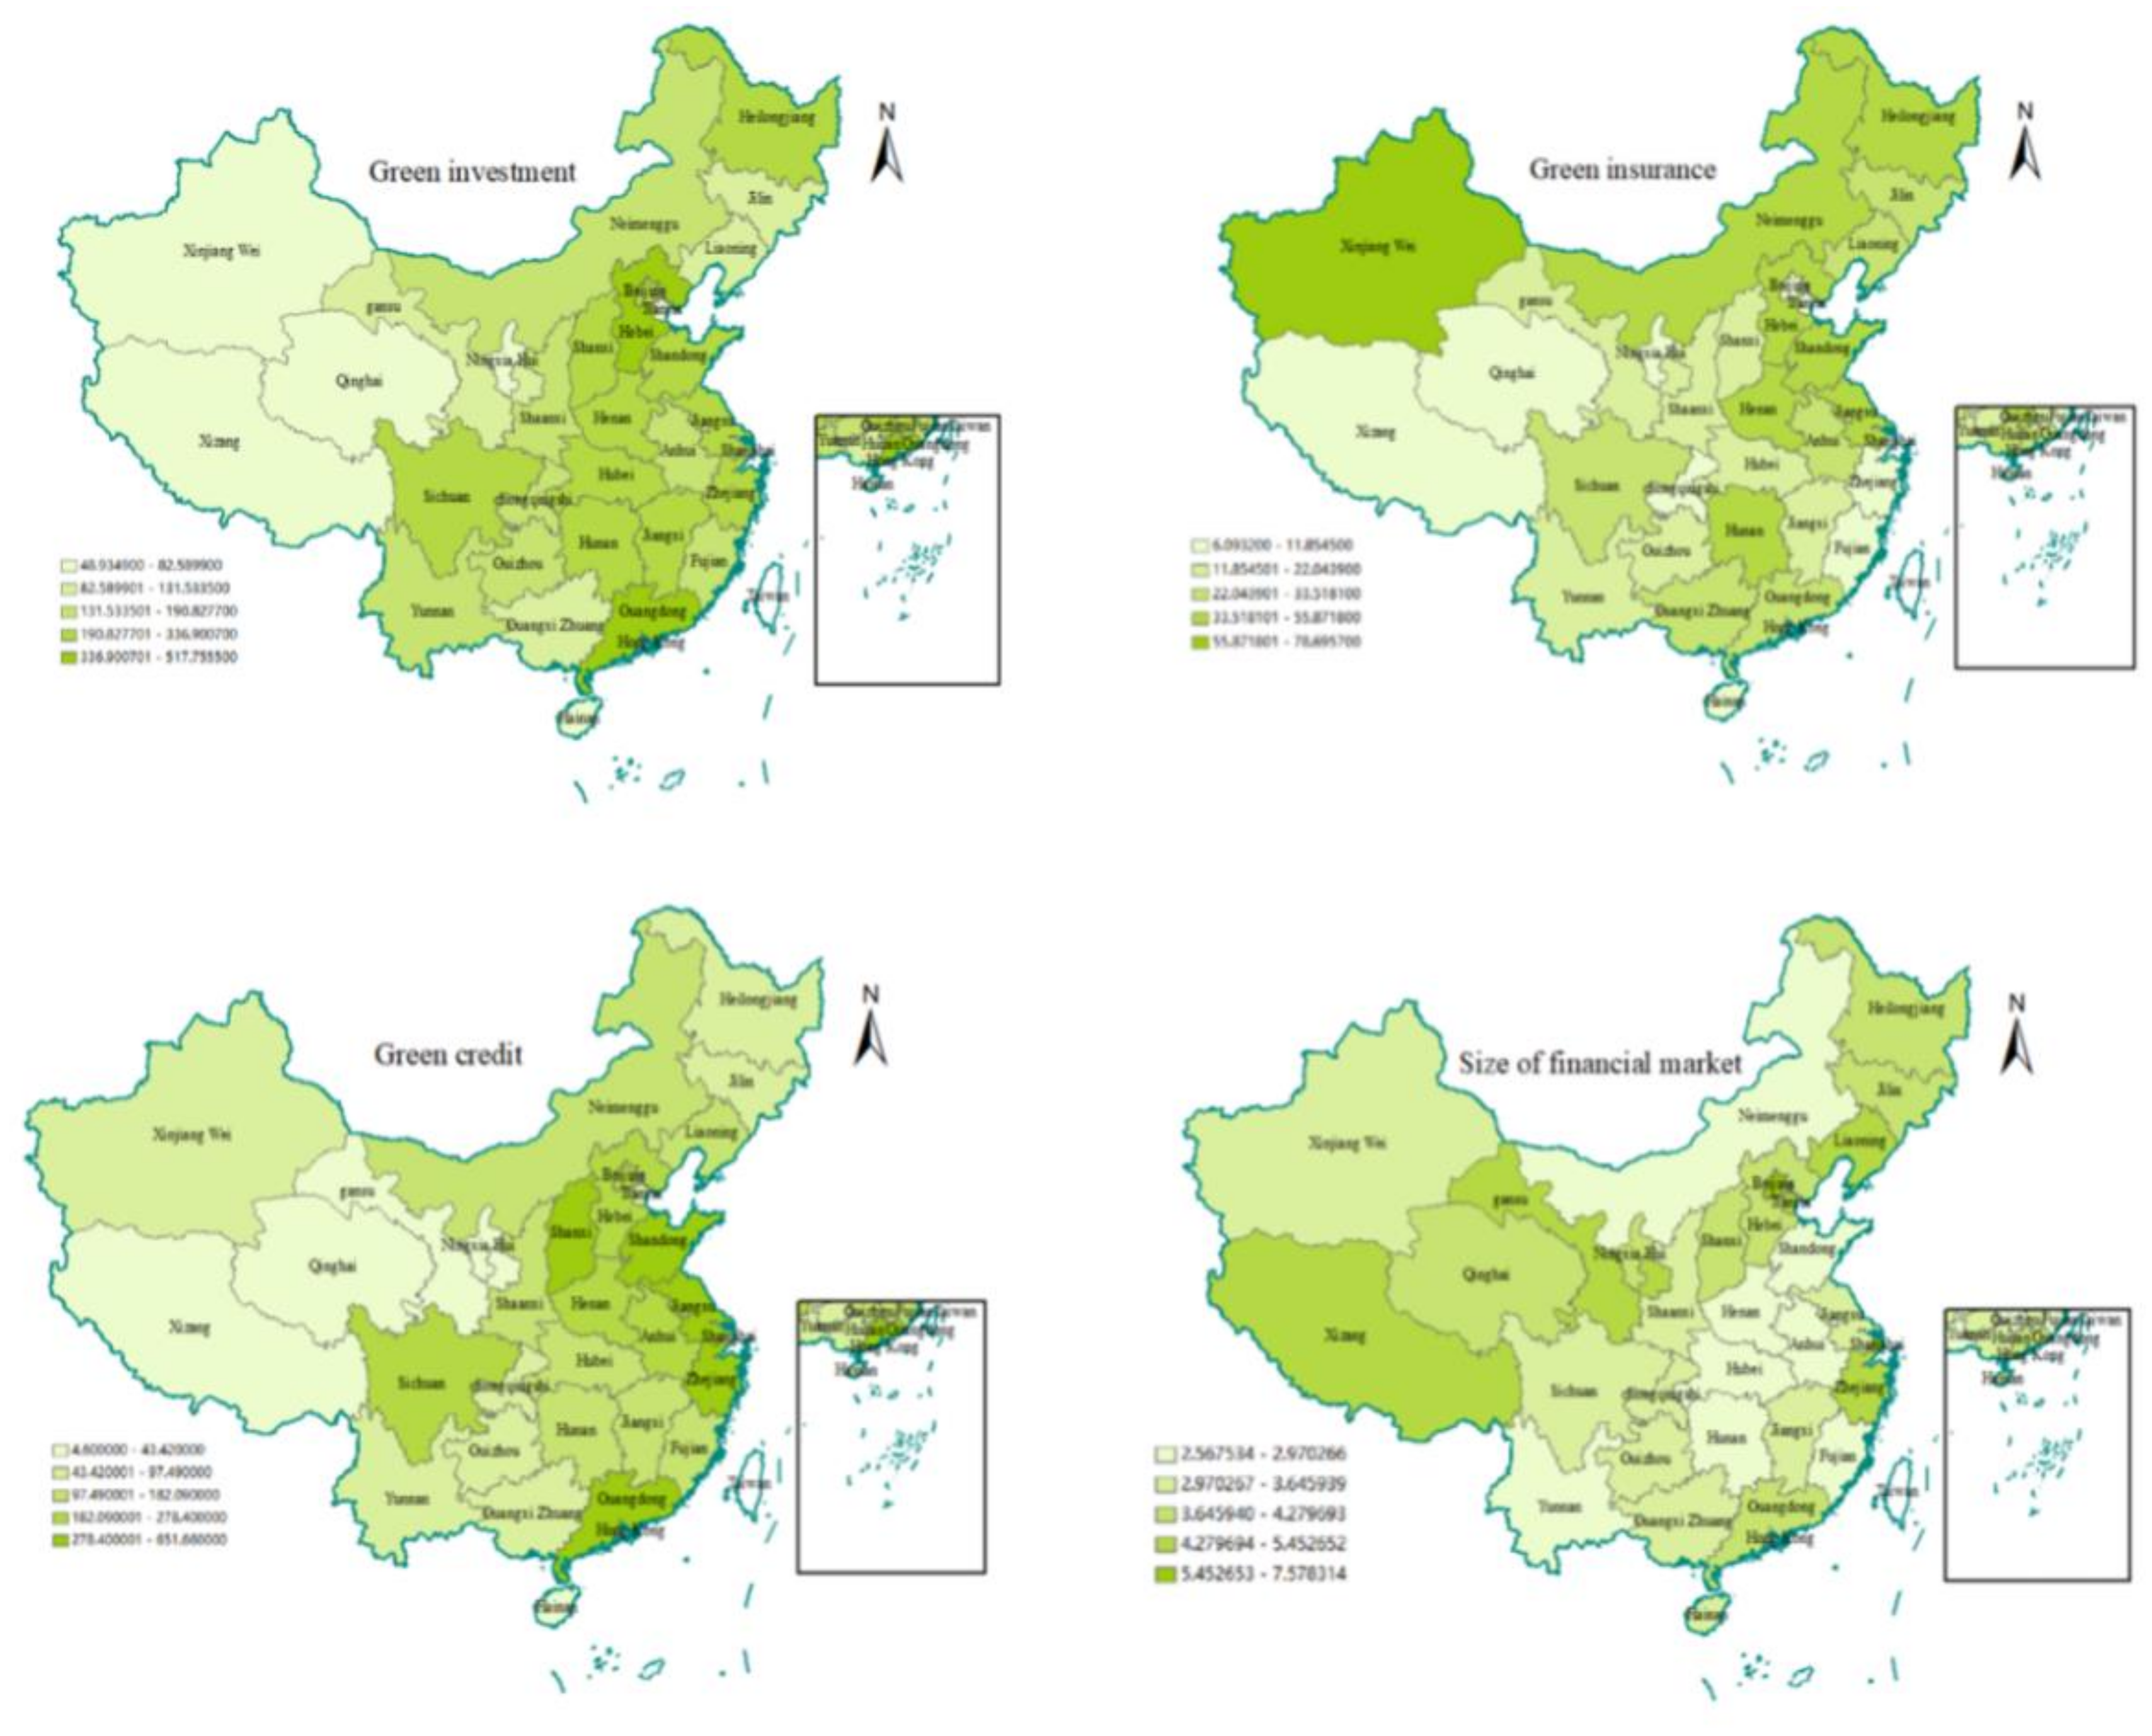
According to the existing studies, this paper divides the greening of the financial market into four aspects: green credit, green insurance, green investment, and financial market scale [28,29,30]. Currently, green credit (loan) can be measured by the ratio of green credit of commercial banks and the ratio of interest expenditure of six high-energy industries to the total interest expenditure of industrial industries as reverse indicators. Due to the inconsistency and the lack of completeness of the green credit data of various banks, the total interest disbursements of the high-energy industries that are not with the six discussed earlier are selected for expression. Due to the constraints of the availability of relevant data, green insurance (insurance) refers to the general practice of the existing literature and it is represented by the indemnity and payment of agricultural insurance. The government’s public budget expenditure on energy conservation and environmental protection represents green investment (investment). The sum of deposits and loans as a percentage of GDP represents the financial market size (fin). The data for each item are obtained from the EPS China data, China Industrial Statistical Yearbook, China Statistical Yearbook, Guotaian database, etc.

2.4.3. Control Variables

With reference to existing studies, the following four control variables are selected: the level of financial technology development (tech), which is derived from the report “Peking University Digital Financial Inclusive Finance Index (2011–2020)” [31]; the employment rate (bus), which is measured using the proportion of employment to the total population; the level of transportation infrastructure (way), which is measured using the number of road miles in each region; and the industrial structure (chan), which is measured by the ratio of the output value of the tertiary industry to that of the secondary industry. The data of each control variable were obtained from the China Statistical Yearbook and the statistical yearbooks of each region.

3. Empirical Regression Results

3.1. The Level of Green Development of the Real Economy

Considering that the principal component analysis method forms independent principal components after transforming the index variables of the original data, which can better eliminate the correlation influences among the evaluation indicators, this paper adopts the principal component analysis method to construct the measurement index of the green development level of the real economy of China’s provinces during 2011 to 2020. To further analyze the spatial divergence of the multi-year changes in the greening development of the real economy, four time points in 2011, 2015, 2019, and 2020 were selected, and the provincial level was taken as the boundary unit. The paper used Arc GIS to draw the spatial differentiation of the greening development level of the real economy (see Figure 1). Figure 1 shows that the real economy’s overall level of green development in China’s provinces is low, and the overall trend is rising. However, the rate of improvement is slow, and the development of each region needs to be coordinated. Due to the impact of the global new crown epidemic, many enterprises face difficulties resuming production, broken capital chains, or even closure in the face of the extensive quarantine and blockade and other preventive and control measures [32]. These conditions make the social unemployment rate rise, the consumption level decrease, the opening up to the outside world and the ability to bring in foreign capital decrease. Therefore, the real economy’s green development level peaked in 2019 and then declined in 2020. Figure 1 shows that although the level of green development of China’s real economy continues to improve, the development of East, Central, and Western China is not coordinated due to the inconsistency of the economic base, development stage, and industrial structure. The distribution pattern shows that the development in East China is higher than in Central China and in Central China, it is higher than in the West. The development level of the real economy in the eastern coastal areas is especially prominent. However, thanks to the application of China’s advanced technologies, such as big data, artificial intelligence and 5G in industrial industries, as well as other heavy pollution fields in recent years, the difference in the development levels of the greening of China’s real economy between East, Central, and West China in 2020 have been significantly reduced, and the level of regional green and high-quality development is more balanced than in previous years.

3.2. Greening of Financial Markets

In order to study the current situation of the greening development of China’s financial market, the study selected green credit, green insurance, green investment, and financial market scale in China in 2020. Based on ArcGIS, the paper used the natural breakpoint method to classify the greening development of the financial market in 31 provinces of China into five levels. As can be seen in Figure 2, the greening level of financial markets in Eastern and Central China is significantly better than that in Western China. It is inextricably related to the fact that the provinces selected for the first batch of the green financial reform pilot zones established by the state in 2017 are mainly in Eastern and Central China, and it is also consistent with the fact that China’s economic development level is higher in the east and lower in the west. In terms of the scale of financial market development, the overall development of China is more balanced. However, the development of the central region is weak. The possible reason is that China’s central region is not conducive to the large-scale production of relevant commodity and the demand for green development of enterprises due to the treacherous geographical environment. The smaller enterprise scale output value has created a smaller regional financial market scale. In terms of green investment, the development of Eastern and Central China is more coordinated, but there is a big difference with that of Western China. The main reason is that green investment is mainly dominated by local governments, and the government supports related enterprises to carry out green transformation through funds and policies. Therefore, there are high requirements on the financial strength of local governments. The economic development level of the Eastern and Central China provinces is better than that of Western China, so the local governments have more sufficient funds to carry out green investment behavior. In terms of green insurance, China’s northern and central provinces are better developed than the southeast coastal coast and western regions. The reason is that China’s traditional energy-intensive industries are mainly in the northeast and need green insurance to protect their industrial structure for greening and to upgrade more than the coastal high-tech industries. In contrast to green insurance, green credit is mainly for encouraging the green and sustainable development of non-energy-consuming and high-tech enterprises with preferential interest rates. Thus, the level of green credit development in the eastern and southeastern coastal provinces is significantly better than in the central, western, and northeastern regions.

3.3. Analysis of Baseline Regression Results

The paper uses panel data, and the cross-sectional dimension is larger than the time dimension. Thus, the mixed-estimation model, fixed-effects model, and random-effects model are often appropriate for processing such panel data. In the research process, this paper uses the above three models for empirical evidence. The results show that the F-test rejects the original hypothesis of using mixed regression at the 1% level. Moreover, the paper performs the Hausman test, and the p-value is 0.0000, indicating that the fixed-effects model is better than the random-effects model. Before regression analysis, a multicollinearity test was conducted on each variable, and this paper performs LLC, IPS, Fisher-ADF, and FisherPP unit root tests for the stationarity of each panel sequence. The results show that the green development level of the real economy of the explained variables is a first-order single integer, and the variables are all first-order single integers. White test was used to verify whether there is a heteroscedasticity problem. The test result showed there is no heteroscedasticity problem. In order to further consider the co-integration relationship between variables, the Kao and Pedroni co-integration test was carried out, which showed that there was a separate integration relationship between the development level of the green real economy and the relevant independent variables, so regression analysis could be carried out. Therefore, this paper uses a fixed-effects model for the study.
In Table 2, ***, ** and * respectively indicate that the coefficients are significant at the level of 1%, 5%, and 10%, and the brackets are a robust standard error. Table 3 is the same. In Table 2, Models 1, 2, and 3 are fixed-effects models. Province- and year-fixed effects are not included in Model 1. No control variables are included in Model 2. Both control variables and fixed effects are added in Model 3. In the case of choosing the fixed-effects model, except for green insurance, the coefficients of the other three measures of financial market greening selected, green credit, green investment, and financial market size, have the same sign, only differing in the significance level. When considering the control variables, the coefficient of green credit is −0.00062 and significant at the 1% level. The result indicates that the development of green credit inhibits the greening of the real economy. The possible reason is that the national emphasis on pollution prevention and control makes it difficult for many energy-intensive industrial enterprises to obtain bank funding in the case of violations or significant risks. Even if these enterprises can obtain credit support, banks’ differential interest rate pricing will also increase the financing cost. The high cost of financing inhibits the expansion of production and slows the growth of output. The result is consistent with the study of Zhang and Yang et al. [33,34]. The coefficient of green insurance is −0.00033, but the regression result is insignificant. The state’s implementation of green insurance can reduce the business risk of enterprises to encourage them to conduct green production. However, it can not directly improve innovation and expect enterprises to profit. Thus, it has less impact on the greening of the real economy, as confirmed by Wang et al. [35]. The coefficient of green investment is 0.00118 and significant at the 1% level. Green investment, as a highly praised investment method in China today, has rich ecological value. The government, through relevant policies, increases investors’ preference for green investment and provides financial support for green enterprises, thus enhancing their innovation capacity, improving their economic efficiency, and promoting the green and high-quality development of the real economy [36,37]. The size of the financial market can reflect the size of green finance to some extent, and the regression results show that the coefficient of financial market size on the high-quality development of the real economy is −0.17067 and significant at the 5% level, which is in line with the study of Shahbaz et al. [38]. The development of China’s finance in recent years has stimulated economic growth, which in turn has increased energy consumption; thus, it was detrimental to the real economy’s green development, which also confirms the environmental Kuznets curve hypothesis.
For the control variables, the effects of the level of transportation facilities and industrial structure are both significantly positive. A superior level of transportation facilities can effectively improve the location advantage of the regional economic system, thus increasing the attractiveness of investment and promoting the development of advantageous regional resources, thus contributing to the green and high-quality development of the economy. A balanced industrial structure is conducive to optimizing resource allocation, improving resource utilization efficiency, and building an environmentally friendly industrial structure. Thus, the balanced industrial structure can enhance the industry’s sustainability and drive the real economy’s green development, which also confirms the views of scholars such as Wang [39]. The employment rate and the level of financial technology significantly inhibit the high-quality green development of the real economy. This is likely because the increase in employment rate does not significantly promote the improvement of employment quality and the professional skills of workers, leading to the inefficiency of serving the green transformation of enterprises and the green development of the real economy. The fintech platforms built based on blockchain, big data, and other related technologies have helped relevant financial institutions improve their work efficiency [40]. However, they are in a rapid development stage, and the related products in the market are of different quality, thus, not conducive to enhancing their ability to serve the green development of the real economy.

4. Heterogeneity Test

Considering the different environment of the economy, market, and industrial structures among different regions, the greening effect of the financial market on the greening effect of the real economy is bound to be different. Therefore, in order to further understand this difference, the sample is further divided into two groups in eastern and central and western regions, and the heterogeneity of the greening of financial markets on the greening of real economy is investigated. The results are shown in Table 3. Model 4 is the fixed-effect regression for the eastern region, and Model 5 is the fixed-effect regression for the central and western region. It can be seen from the analysis results that the coefficient signs and significance of the core explanatory variables are not significantly different from those of Model 3 principal regression. However, in terms of green credit, the inhibitory effect of green credit on the greening of the real economy in Eastern China is weaker than that in Central and Western China. The main reason is that economic growth in Eastern China mainly depends on high-tech industries. However, the central and western regions mainly rely on industries with high energy consumption and high emissions to drive the economy, so it is easier for green credit to support the industrial development of Eastern China, and its differentiated interest rate pricing will increase the debt burden of the high-energy industries in the central and western regions, which is not conducive to the transformation of the real economy to green in the central and western regions. The impact of green insurance on the greening of the real economy is still not significant. In terms of green investment, as the economy of the eastern region is more developed and the degree of marketization is higher compared to the central and western regions, the government intervenes less in the direction of economic development and relies on the market to upgrade the green industrial structure, thus driving the green transformation of the economy. In terms of the size of the financial market, the financial markets in Eastern China are more developed and the transactions are more active than those in the central and western regions, which is also consistent with the analysis above, which states that although the development of finance will drive economic growth, it also increases energy consumption and is not conducive to the greening of the real economy.

5. Robustness Test

5.1. Exclusion of Municipalities

The four municipalities in the sample, Beijing, Shanghai, Tianjin, and Chongqing, have special political status and economic functions, and they may differ significantly from other provinces in terms of financial market greening and real economic development [41]. Therefore, this paper excludes the four municipalities in the sample for robustness testing. The results are shown in Model 6 in Table 3. The result is highly consistent with Model 5 in Table 2 of the regression results, which indicates that the main regression results are robust. The comparison of the regression coefficients reveals that the inhibitory effect of green credit on the greening development of the real economy is enhanced, and the promoting effect of green investment on the greening development of the real economy is weakened after excluding the municipalities directly under the central government. These results suggest that the municipalities directly under the central government have sufficient locational advantages in terms of the efficiency of the financial market greening on the real economy’s high-quality green development. Through their special economic and political status and geographical advantages, municipalities attract high-tech industries to gather and promote the green transformation of enterprises with strong financial strength and policy convenience to realize the green and high-quality development of the real economy.

5.2. Differences-in-Differences Method

In July 2016, the People’s Bank of China, the Ministry of Finance, and seven other ministries and commissions jointly issued the Guidance on Building a Green Financial System. The guidance specifies that China’s green financial system is an institutional arrangement that supports the transformation of the economy to green through financial instruments and related policies such as green credit, green bonds, green stock indices, related products, and green insurance. For the first time, China’s green finance was clearly defined and the connotations of the green financial system were enriched [42]. Therefore, in this paper, concerning the approach of Gao et al. [43], considering the lack of policies, the eastern and central regions of China need the support of green finance more than the western regions in order to carry out industrial green upgrading and transformation. The following model is set: treat is the policy dummy variable if the province is in the eastern or central regions of China, treat equals 1, otherwise, it equals 0; time is the time dummy variable, but in 2017 and later, it equals 1, otherwise, it equals 0.
Figure 3 shows the parallel trend of the greening of the real economy. Before the implementation of the “Opinions” in 2017, the greening level of the real economy in the eastern, central, and western regions of China showed a downward trend, and the mean difference was small, which met the requirements of parallel trend. The green level of the real economy began to decline in 2016, which may be related to the “Ecological Environmental Protection Plan” issued by the Chinese government in 2016, which reduced the impact of high-polluting enterprises on the environment to a certain extent. It can be clearly seen that after the implementation of the policy in 2017, the real economy greening level of the experimental group increased significantly compared to the control group, indicating the existence of treatment effect. The decline in the greening of the real economy in 2020 May be attributed to the decline in the level of the real economy due to the impact of the epidemic and the lack of production in the real economy.
The double-difference regression results are shown in Model 7 (Table 4). did is the interaction term coefficient of treat × time, and the results show that the coefficient of did is positive and significant at 1% when controlling for the time effect and individual effect, indicating that the green development of the real economy in the experimental group is significantly enhanced by the policy shock of building a green financial system, i.e., the green and high-quality development of the real economy in the place will be promoted by building a green financial system.

6. Research Conclusions and Recommendations

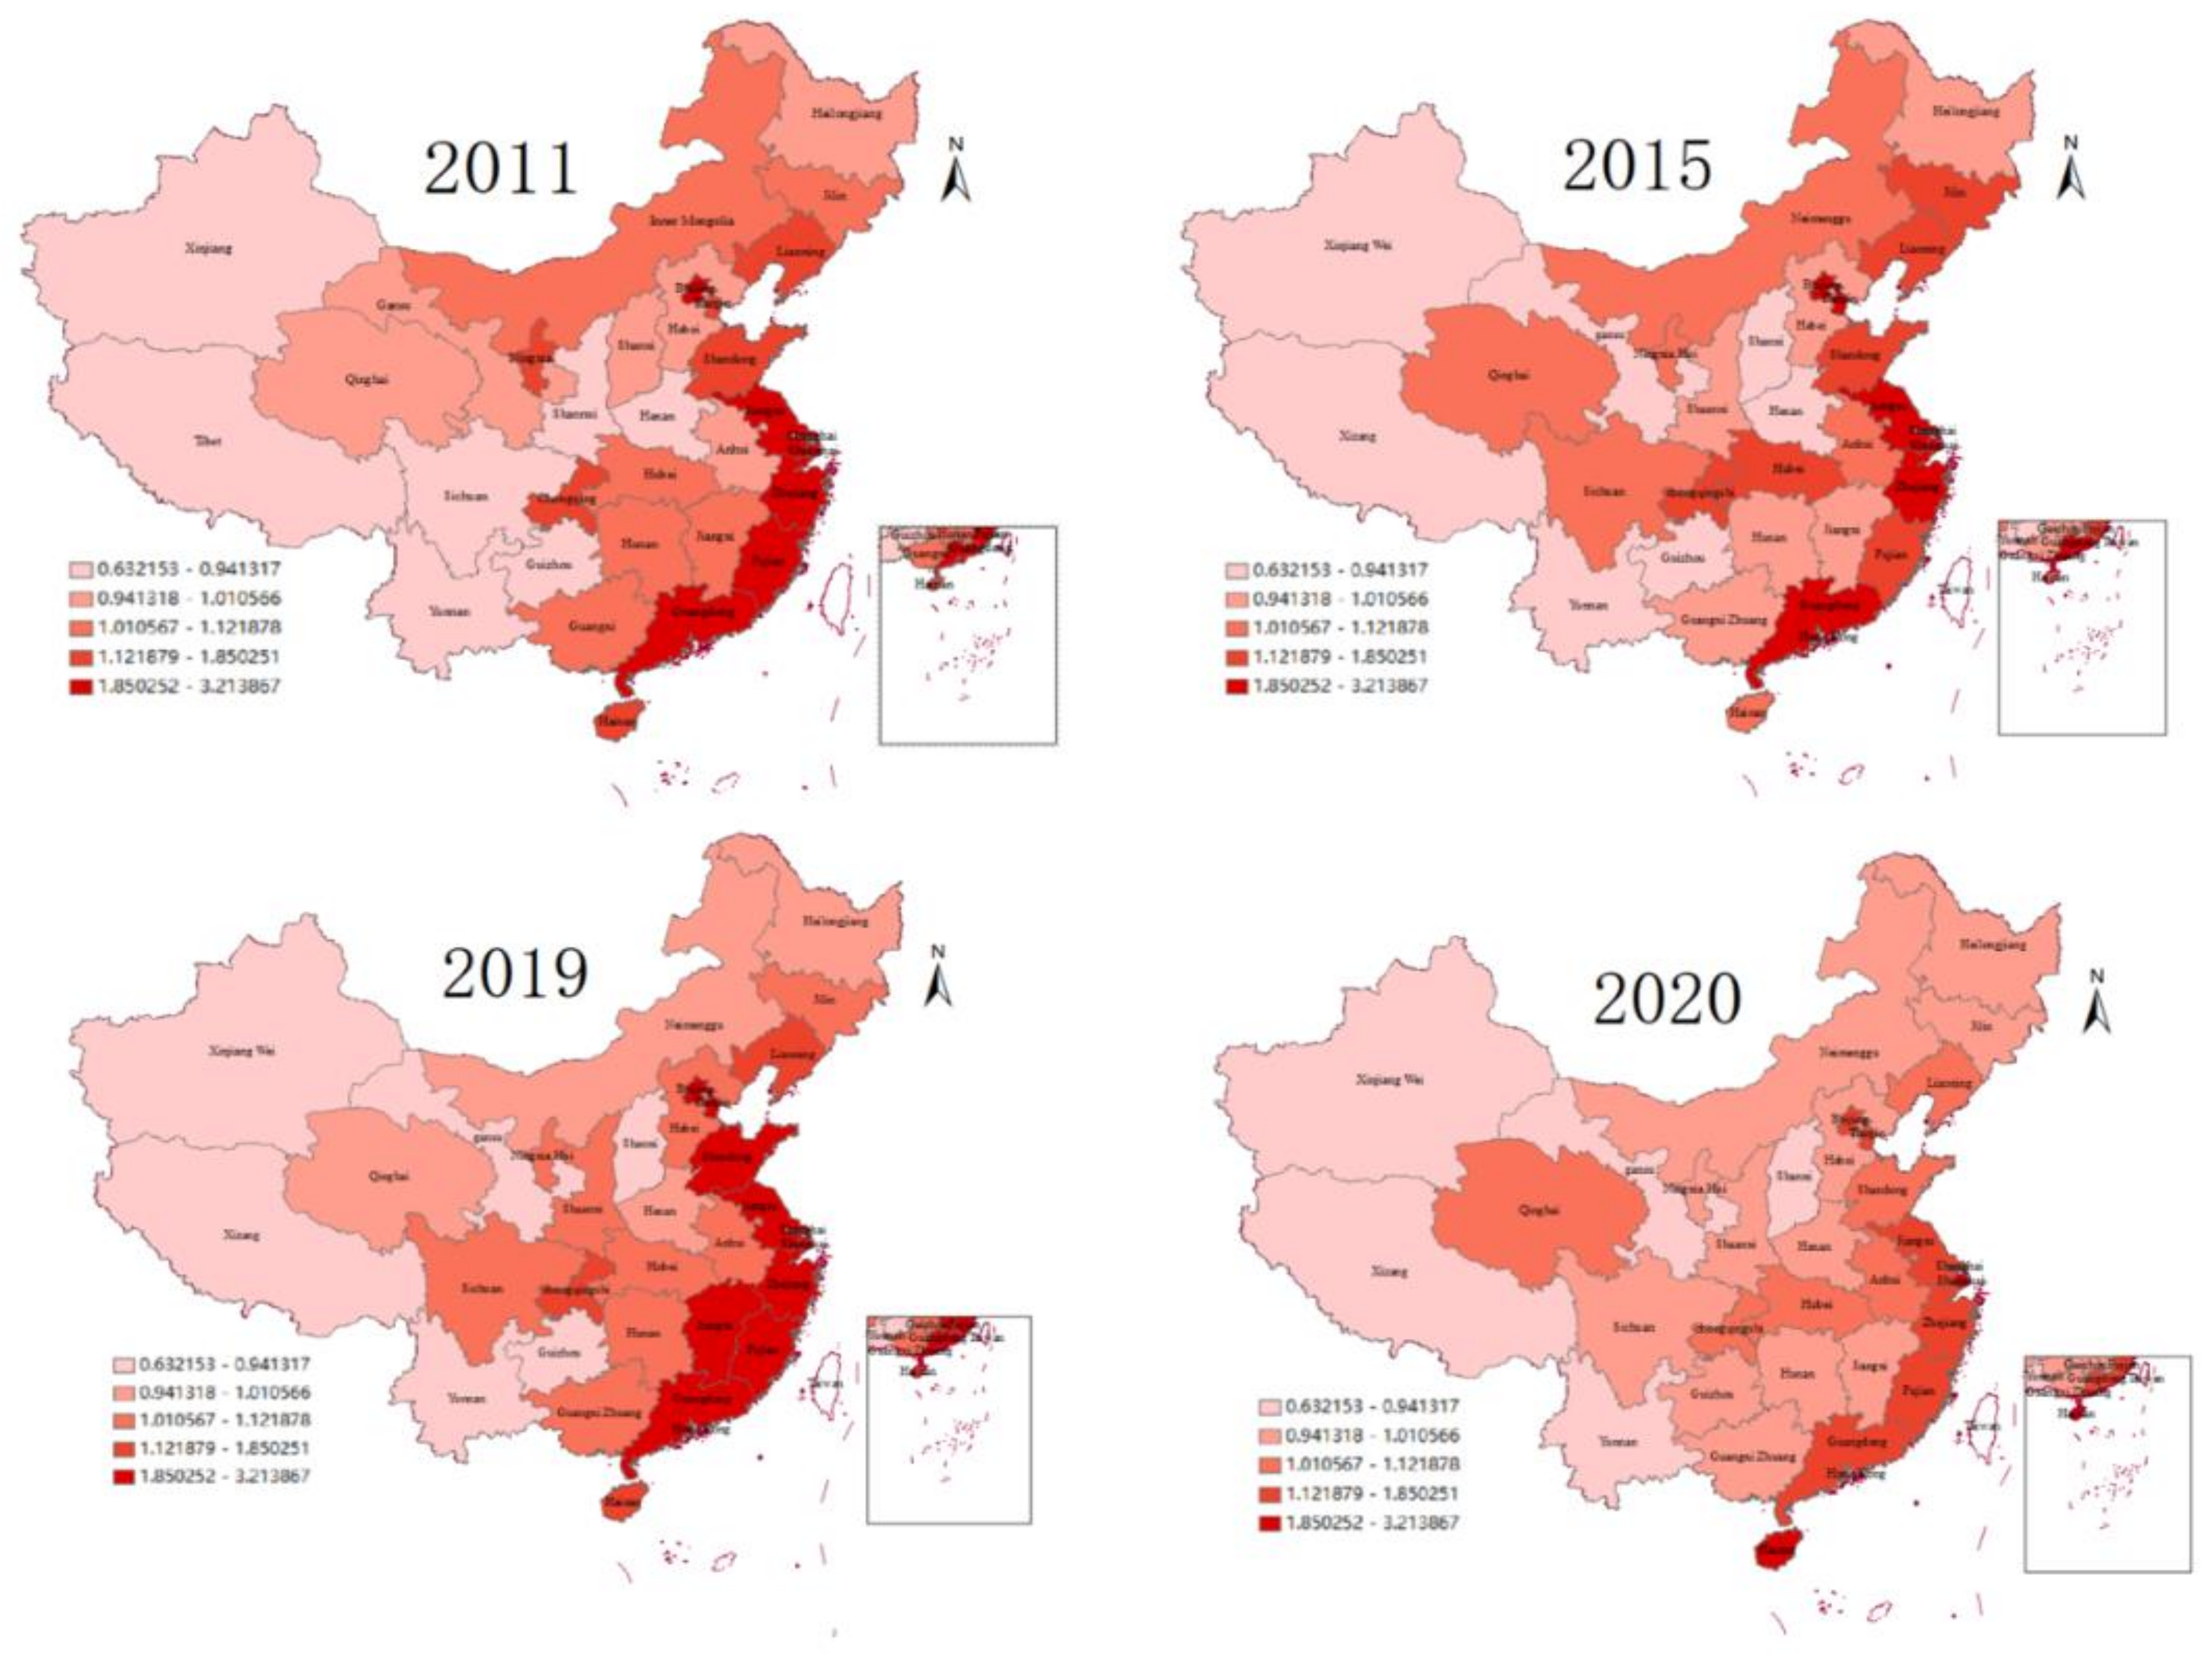
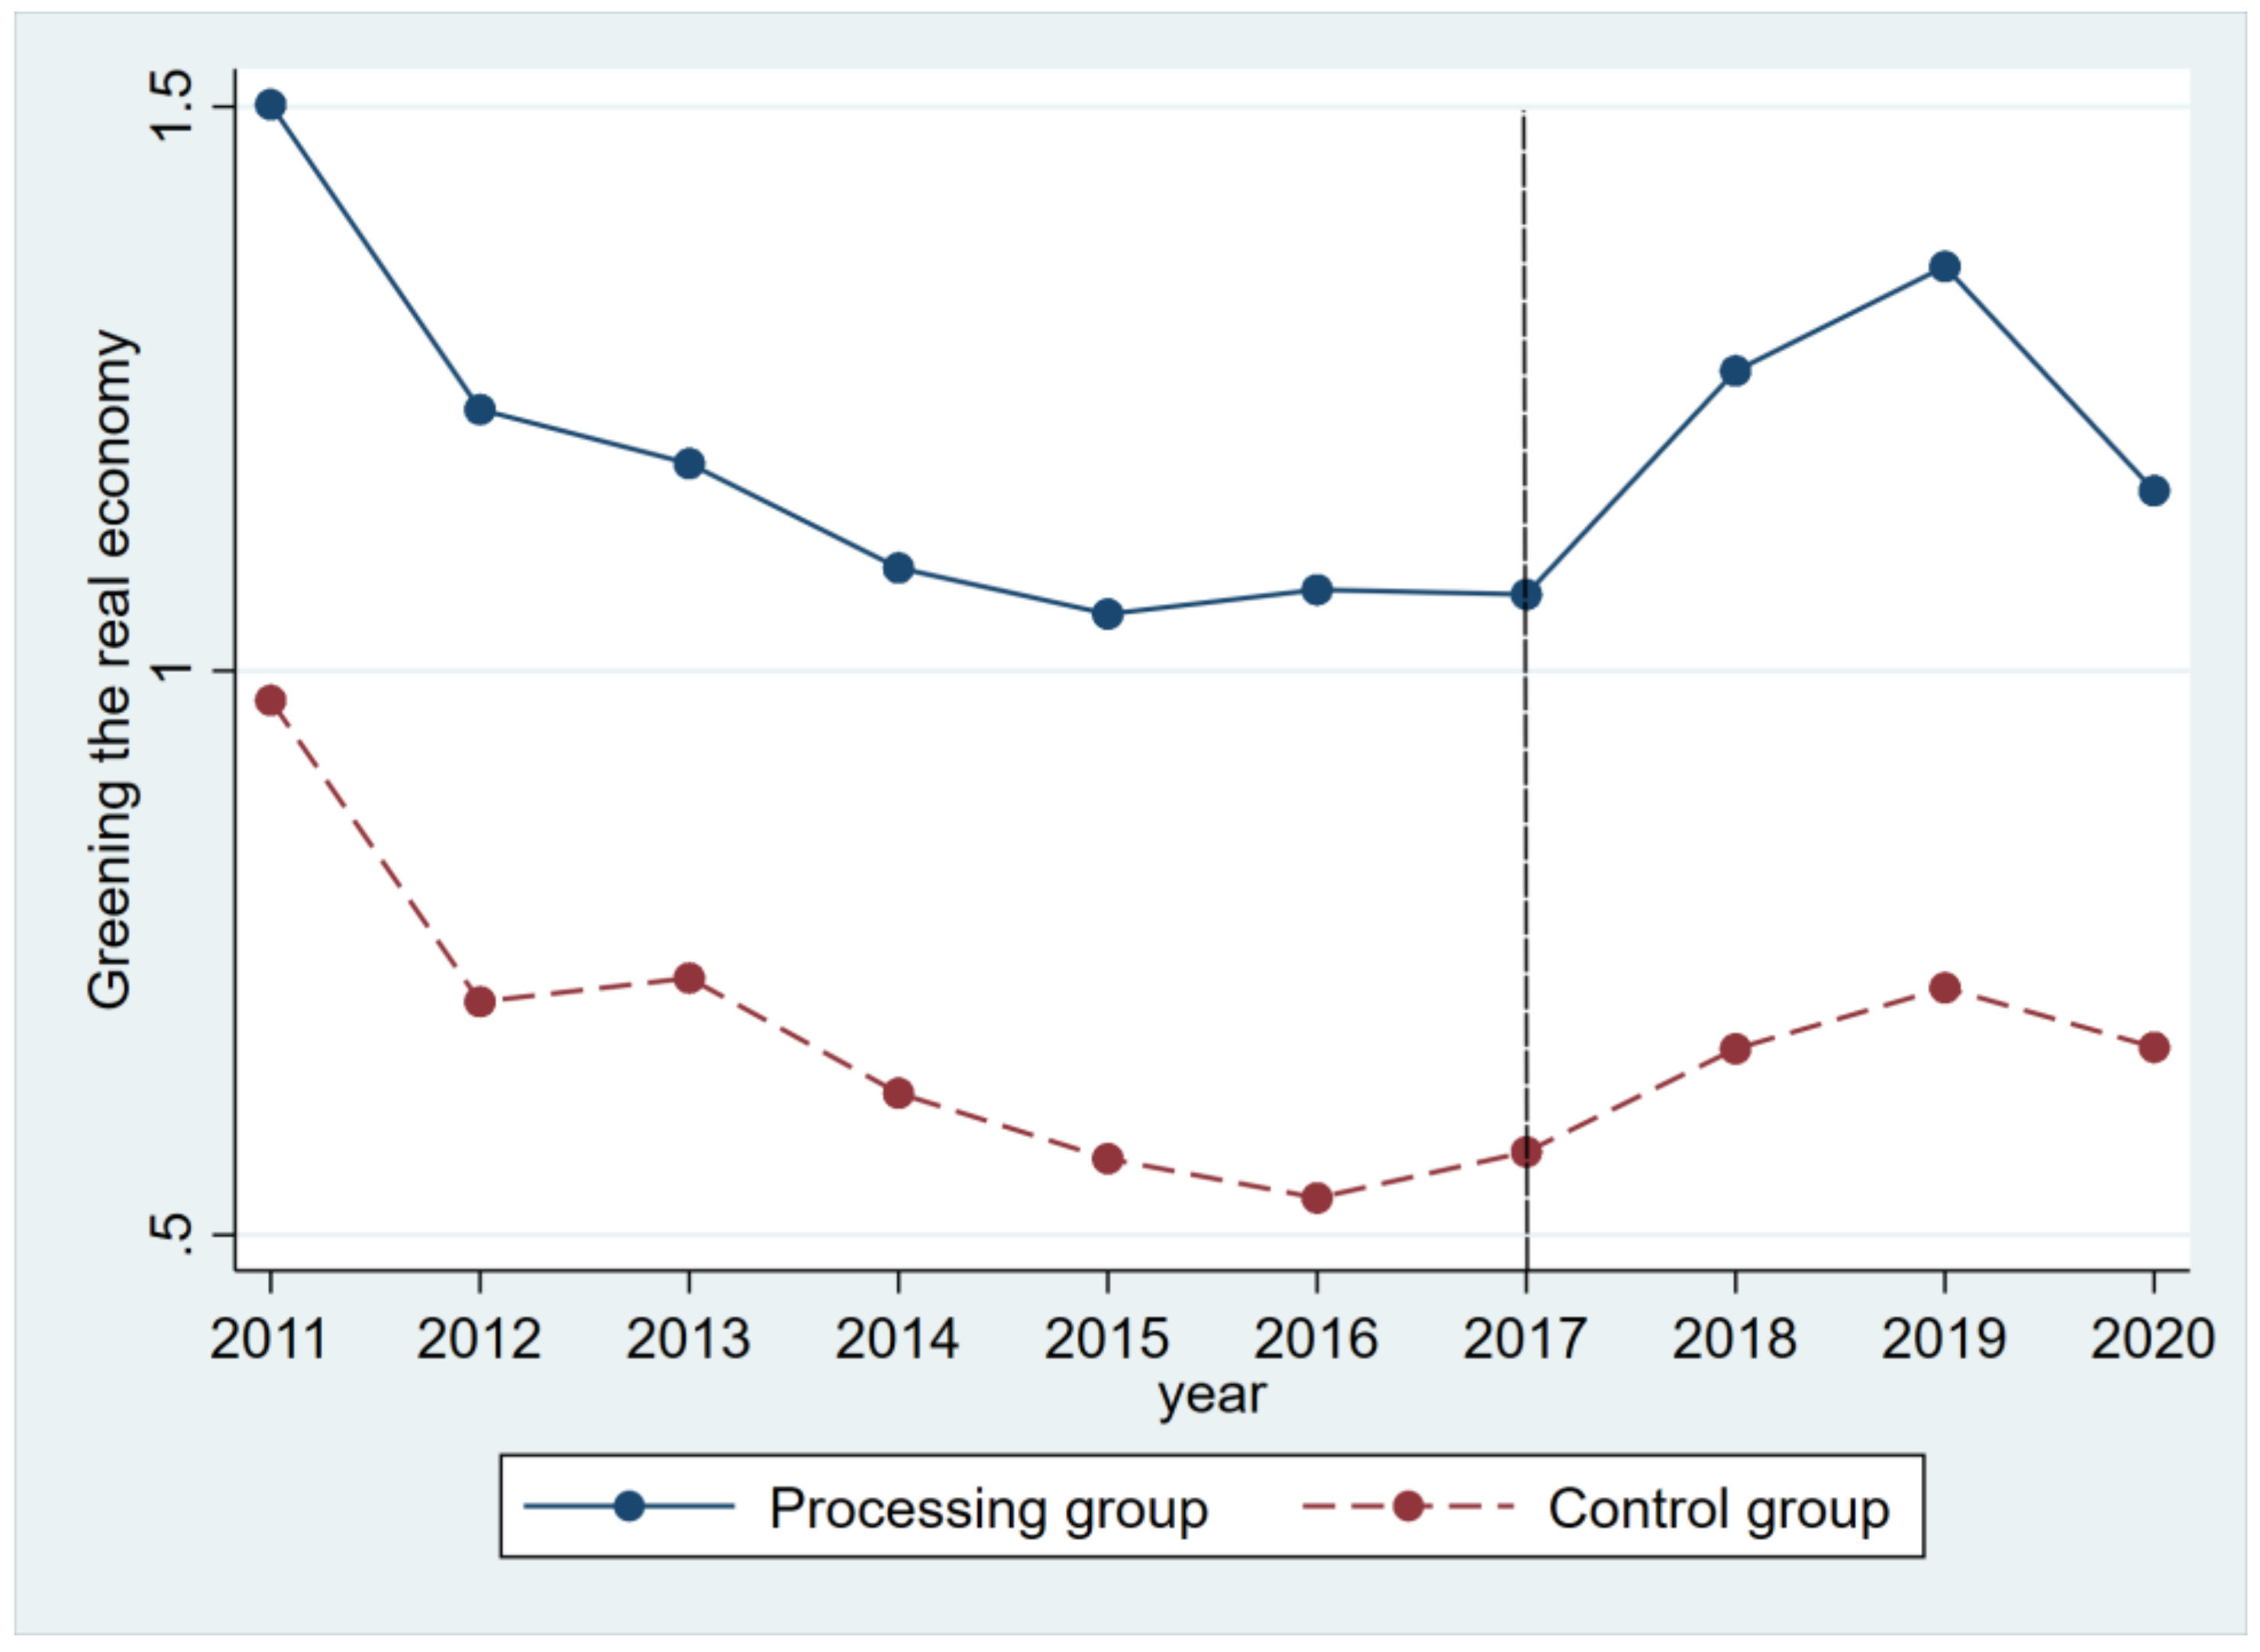
To help achieve China’s double carbon goal and promote the high-quality green development of the real economy, it is of great urgency and theoretical and practical significance to enhance the ability of the financial market to green the real economy. Based on the principal component analysis, this paper measured the development level of the real economy in 31 provinces in China from 2011 to 2020. It uses green credit, green insurance, green investment, and financial market size as the core explanatory variables to conduct regression analysis on the financial market’s greening and the real economy’s green development using the fixed-effects model. Moreover, it fully considers the impact of municipalities and the promulgation of relevant policies. The results show that: 1. Since 2011, the green development of China’s real economy has shown an overall upward trend, although there have been shocks in some years. Spatially, there is a significant difference in the green development level of the real economy in the eastern, the central and western regions. The real economy’s green development level in the east is always higher than in the middle and west. However, the gap gradually narrows as time advances; 2. The regression results show that green investment has a significant positive relationship with the green development of the real economy. In contrast, the green credit, green insurance, and financial market scale show an inverse relationship with the greening of the real economy; 3. The robustness test shows that the proposal and implementation of national macro policies can regulate and guide the healthy development of the greening of the financial market, thus enhancing its efficiency in serving the greening of the real economy and providing a sustainable green, and high-quality development for the real economy escort.
In order to promote the efficiency of the greening of the financial market to serve the green development of the real economy, the paper proposes the following recommendations: 1. Continuously promote the greening of the financial market, improve the green financial service system, strengthen the innovation and management of green financial products and the content of activities, broaden the application scenarios of green financial products, strengthen the role of green finance in guiding the flow of funds, promote the agglomeration of green industries through efficient allocation of funds, reduce carbon emissions, and promote the greening of the real economy; 2. Smooth the transformation path of green finance to the real economy, strengthen the government’s green guidance for the development of the virtual and real economy, continuously strengthen green supervision, focus on solving the problems of insufficient investment in the enterprise innovation funds and mismatch of green resources, and strictly prevent the generation of the “floating green” behavior; 3. Promote the synergistic development of the financial market in the east and west, realize the high-quality green sustainable development of the region, actively promote the scope of the green financial reform pilot, give full play to the role of the pilot to drive the province, increase regional coordination and cooperation, take the greening of the regional economy as a grip, and promote the overall high-quality green economic development; 4. Further improve green finance regulatory policies, introduce green-finance-related business standards, improve the quality of environmental information disclosure by enterprises, reduce the information asymmetry between financial institutions and enterprises, and maintain the continuity and stability of green finance policies.
By constructing an index evaluation system for the greening of the real economy, this paper studies whether the greening of the financial market can be effectively transmitted to the field of the real economy by using the fixed-effect panel model and the differential method, and focuses on the influence of various dimensions of green finance on the greening of the real economy. The research shows that the efficiency of the financial market transmission to the real economy needs to be improved. However, due to my limited knowledge level, energy, and access to data resources, this study still has many shortcomings. For example, there is a lack of research on the mechanism of the transmission of the green financial market to the real economy. The data are mostly macro data, and the lack of detailed data reflecting the specific development situation affects the depth of the analysis. In future study and work, the author will continue to carry out more research on the relationship between the greening of the financial market and the greening of the real economy.

Author Contributions

Conceptualization, J.Z.; methodology, X.D.; software, J.Z.; validation, Y.Z., J.Z. and X.D; formal analysis, J.Z.; investigation, L.B.; resources, J.Z. and L.B.; data curation, Y.Z.; writing—original draft preparation, J.Z. and X.D.; writing—review and editing, L.B.; visualization, J.Z. and Y.Z.; supervision, X.D.; project administration, J.Z. and X.D.; funding acquisition, X.D. All authors have read and agreed to the published version of the manuscript.

Funding

This research was funded by National Natural Science Foundation of China (72204099), the Humanities and Social Sciences Foundation of the Ministry of Education (21YJC790021), Jiangsu Province University Philosophy and Social Sciences Excellent Innovation Team Building Project (SJSZ2020-20).

Data Availability Statement

Not applicable.

Conflicts of Interest

The authors declare no conflict of interest.

References

  1. Fang, Z.; Razzaq, A.; Mohsin, M.; Irfan, M. Spatial spillovers and threshold effects of internet development and entrepreneurship on green innovation efficiency in China. Technol. Soc. 2022, 68, 101844. [Google Scholar] [CrossRef]
  2. Ministry of Ecology and Environment of the People’s Republic of China. Ecological environment status bulletin 2021 (Excerpt). Environ. Prot. 2022, 50, 61–74. [Google Scholar]
  3. Wang, Z.H.; Hou, D.D. Digital finance, financial resource misallocation and environmental pollution. China For. Econ. 2022, 5, 112–118. [Google Scholar]
  4. Zhang, J.; Yang, X.; Xing, X. Does minimum wage standard induce enterprise financialization? an empirical study from A-share listed. Mod. Financ. Econ. -J. Tianjin Univ. Financ. Econ. 2022, 42, 59–75. [Google Scholar]
  5. Yin, X.; Xu, Z. An empirical analysis of the coupling and coordinative development of China’s green finance and economic growth. Resour. Policy 2022, 75, 102476. [Google Scholar] [CrossRef]
  6. Batrancea, L.; Pop, M.C.; Rathnaswamy, M.M.; Batrancea, I.; Rus, M.-I. An empirical investigation on the transition process toward a green economy. Sustainability 2021, 13, 13151. [Google Scholar] [CrossRef]
  7. Lyytimäki, J.; Antikainen, R.; Hokkanen, J.; Koskela, S.; Kurppa, S.; Känkänen, R.; Seppälä, J. Developing Key Indicators of Green Growth. Sustain. Sustain. Dev. 2018, 26, 51–64. [Google Scholar] [CrossRef]
  8. Huang, Q.H. On the development of China’s real economy at the new stage. China Ind. Econ. 2017, 9, 5–24. [Google Scholar]
  9. Liu, Q.; Xia, C.; Zhang, M. Research on the Calculation and Influencing Factors of Industrial Green Development Efficiency in Henan Province. J. Xinyang Norm. Univ. 2021, 34, 94–400. [Google Scholar]
  10. Li, J.C.; Shi, L.M.; Xu, A.T. Probe into the assessment indicator system on high-quality development. Stat. Res. 2019, 36, 4–14. [Google Scholar]
  11. Meng, X.L.; Xing, M.Y. Research on the HuBei high-quality development comprehensive evaluation under the background of supply side structural reform based on the weighted factor analysis. J. Appl. Stat. Manag. 2019, 38, 675–687. [Google Scholar]
  12. Vukovic, N.; Pobedinsky, V.; Mityagin, S.; Drozhzhin, A.; Mingaleva, Z. A study on green economy indicators and modeling: Russian context. Sustainability 2019, 11, 4629. [Google Scholar] [CrossRef] [Green Version]
  13. Khan, S.A.R.; Zhang, Y.; Anees, M.; Golpîra, H.; Lahmar, A.; Qianli, D. Green supply chain management, economic growth and environment: A GMM based evidence. J. Clean. Prod. 2018, 185, 588–599. [Google Scholar] [CrossRef]
  14. Hu, A.J.; Guo, A.J.; Zhong, F.L.; Wang, X.B. Can the high-tech industrial agglomeration improve the green economic efficiency of the region? China Popul. Resour. Environ. 2018, 28, 93–101. [Google Scholar]
  15. Zhang, Y.; Wang, X.; Zhao, J. Study on the Path of Digital Economy Driving China’s High-Quality Development. J. Xinyang Norm. Univ. 2023, 43, 28–34. [Google Scholar]
  16. Xie, T.T.; Liu, J.H. How does green credit affect China’s green economy growth? China Popul. Resour. Environ. 2019, 29, 83–90. [Google Scholar]
  17. Wang, X.; Wang, Q. Research on the impact of green finance on the upgrading of China's regional industrial structure from the perspective of sustainable development. Resour. Policy 2021, 74, 102436. [Google Scholar] [CrossRef]
  18. Du, J.Y.; Cao, W.Q. Research on the impact of green finance development on carbon emission under the “Double Carbon”. Target Trib. Study 2022, 6, 114–118. [Google Scholar]
  19. Jin, J.; Han, L. Assessment of Chinese green funds: Performance and industry allocation. J. Clean. Prod. 2018, 171, 1084–1093. [Google Scholar] [CrossRef]
  20. Schoenmaker, D. Greening monetary policy. Clim. Policy 2021, 21, 581–592. [Google Scholar] [CrossRef]
  21. Lee, C.C.; Lee, C.C. How does green finance affect green total factor productivity? Evidence from China. Energy Econ. 2022, 107, 105863. [Google Scholar] [CrossRef]
  22. Zhuge, R.Y.; Cai, W.W. Research on the impact of green finance on green innovation of industrial enterprises: A quasi-natural experiment based on the green finance reform and innovation pilot zone. Financ. Theory Pract. 2022, 11, 49–61. [Google Scholar]
  23. Wang, X. Research on the impact mechanism of green finance on the green innovation performance of China’s manufacturing industry. Manag. Decis. Econ. 2022, 43, 2678–2703. [Google Scholar] [CrossRef]
  24. Chai, S.; Zhang, K.; Wei, W.; Abedin, M.Z. The impact of green credit policy on enterprises’ financing behavior: Evidence from Chinese heavily-polluting listed companies. J. Clean. Prod. 2022, 363, 132458. [Google Scholar] [CrossRef]
  25. Jiang, S.; Liu, X.; Liu, Z.; Shi, H.; Xu, H. Does green finance promote enterprises’ green technology innovation in China? Front. Environ. Sci. 2022, 10, 981013. [Google Scholar] [CrossRef]
  26. Chen, L.M.; Huo, C.J. The measurement and influencing factors of high-quality economic development in China. Sustainability 2022, 14, 9293. [Google Scholar] [CrossRef]
  27. Chen, C.J. The level measurement and the promotion strategy of Jiangsu high-quality development. J. Nantong Univ. (Soc. Sci. Ed.) 2019, 35, 35–42. [Google Scholar]
  28. Jiang, H.L.; Wang, W.D.; Wang, L. The Effects of the carbon emission reduction of China’s green finance—An analysis based on green credit and green venture investment. Financ. Forum 2020, 25, 39–48. [Google Scholar]
  29. Liu, F.; Huang, P.; Tang, D. The carbon emission reduction effect of green finance development and its impact pathways. Financ. Econ. Researc 2022, 6, 144–158. [Google Scholar]
  30. Zhang, G.H.; Xing, L. Research on the impact of green finance on the high-quality development of tourism industry in china——Spatial econometric analysis based on provincial panel data. Inq. Into Econ. Issues 2022, 12, 52–68. [Google Scholar]
  31. Wang, S.J.; Huo, S.Y. County Digital Inclusive Finance Contributes To Rural Revitalization:Causes and Empirical Research——Use 30 countries of Four Cities in Western Shandong as Case. Price:Theory and Practice. 2022, 12, 192–195. [Google Scholar]
  32. Xu, A.; Qian, F.; Pai, C.; Yu, N.; Zhou, P. The Impact of COVID19 Epidemic on the Development of the Digital Economy of China Based on the Data of 31 Provinces in China. Front. Public Health 2022, 9, 778671. [Google Scholar]
  33. Zhang, X.; Hu, J.Y. Does green credit policy inhibit investment of the heavily polluting enterprises? Shandong Soc. Sci. 2022, 8, 138–146. [Google Scholar] [CrossRef]
  34. Yang, Y.; Zhang, Y. The impact of the green credit policy on the short-term and long-term debt financing of heavily polluting enterprises: Based on PSM-DID method. Int. J. Environ. Res. Public Health 2022, 19, 11287. [Google Scholar] [CrossRef]
  35. Wang, C.; Nie, P.; Peng, D.-H.; Li, Z.-H. Green insurance subsidy for promoting clean production innovation. J. Clean. Prod. 2017, 148, 111–117. [Google Scholar] [CrossRef]
  36. Su, X. Can green investment win the favor of investors in China? Evidence from the return performance of green investment stocks. Emerg. Mark. Financ. Trade 2021, 57, 3120–3138. [Google Scholar] [CrossRef]
  37. Yang, W.-E.; Lai, P.-W.; Han, Z.-Q.; Tang, Z.-P. Do government policies drive institutional preferences on green investment? Evidence from China. Environ. Sci. Pollut. Res. 2022, 30, 8297–8316. [Google Scholar] [CrossRef]
  38. Shahbaz, M.; Lean, H.H. Does financial development increase energy consumption? The role of industrialization and urbanization in Tunisia. Energy Policy 2012, 40, 473–479. [Google Scholar] [CrossRef] [Green Version]
  39. Wang, X.W.; Chen, M.Y.; Chen, N.Y. Digital economy, green technology innovation and industrial structure upgrading. Econ. Probl. 2023, 1, 19–28. [Google Scholar]
  40. Yu, B.; Fan, C.L. Green finance, technical innovation and high-quality economic development. Nanjing J. Soc. Sci. 2022, 9, 31–43. [Google Scholar]
  41. Chen, F.X.; Zhou, H.H.; Li, N. Impact of provincial fiscal rxpenditure shock on real effective exchange rate in china. Stat. Decis. 2022, 24, 123–128. [Google Scholar]
  42. Tao, R. Research on the mechanism, practice and optimization of green technology innovation driven by green finance: From the perspective of coordinated development of “government, enterprise, university and finance”. Financ. Theory Pract. 2021, 12, 62–72. [Google Scholar]
  43. Gao, Y.; Shen, Z.Z. The role of green finance reform policy in carbon reduction. China Environ. Sci. 2022, 42, 4849–4859. [Google Scholar]
Figure 1. Spatial variation of the level of development of the real economy.
Systems 11 00161 g001
Figure 2. Greening of China’s financial markets in 2020.
Systems 11 00161 g002
Figure 3. Parallel trend test.
Systems 11 00161 g003
Table 1. Indicator system of the level of green development of the real economy.
Tier 1 IndicatorsInnovationCoordinationGreenOpenShare
Secondary indicatorsNumber of effective invention patents per 10,000 people (+)Urban population share
(+)
Industrial wastewater emissions per 10,000 people
(−)
Number of foreign-controlled enterprises as a proportion of the total number of local enterprises
(+)
Number of public toilets per 10,000 people
(+)
Share of tertiary sector in GDP
(+)
Consumer price index (+)Sulfur dioxide emissions per 10,000 people
(−)
Total foreign direct investment as a share of GDP
(+)
Public library collections per capita
(+)
R&D expenditure as a percentage of GDP (+)Urban–rural Engel coefficient ratio
(+)
Green coverage (+)Total imports and exports as a share of GDP (+)Average number of students enrolled in colleges and universities per 100,000 population (+)
Table 2. Greening of financial markets and greening of the real economy.
Variable NameModel 1
Fixed Effects
Model 2
Fixed Effects
Model 3
Fixed Effects
loan−0.00015
(0.0002)
−0.00080 ***
(0.0002)
−0.00062 ***
(0.0001)
insurance−0.00144
(0.0021)
0.00034
(0.0018)
−0.00033
(0.0017)
investment0.00136 ***
(0.0002)
0.00099 ***
(0.0002)
0.00118 ***
(0.0002)
fin−0.09280 **
(0.0378)
−0.22683 ***
(0.0425)
−0.17067 **
(0.0699)
tech−0.00116 ***
(0.0003)
−0.00142 ***
(0.0003)
bus0.02095
(0.0254)
−0.06421 **
(0.0232)
way−1.93 × 10⁻⁶ ***
(0.0000)
4.11 × 10⁻⁶ ***
(0.0000)
chan0.23924 ***
(0.0567)
0.24630 **
(0.1130)
Province-fixed effectsNOYESYES
Year-fixed effectsNOYESYES
Annotation: * p < 0.1, ** p < 0.05, *** p < 0.01.
Table 3. The greening of financial market and the heterogeneity test of the greening of real economy.
Variable NameModel 4
Eastern Region
Model 5
Central and Western Regions
loan−0.00050 **
(0.0002)
−0.00106 ***
(0.0002)
insurance−0.00146
(0.0039)
−0.00138
(0.0017)
investment0.00099 ***
(0.0002)
0.00179 ***
(0.0004)
fin−0.44946 ***
(0.1273)
−0.06478 *
(0.0464)
tech−0.00157 **
(0.0005)
−0.00162 ***
(0.0004)
bus0.13160 ***
(0.0315)
−0.01049 *
(0.0114)
way−6.99 × 10⁻⁶
(0.0000)
3.67 × 10⁻⁶ **
(0.0000)
chan0.49617 **
(0.2086)
0.11712 *
(0.0803)
Province fixed effectsYESYES
Year fixed effectsYESYES
Annotation: * p < 0.1, ** p < 0.05, *** p < 0.01.
Table 4. Robustness tests.
Variable NameModel 6Model 7
Coefficientp-ValueStandard ErrorCoefficientp-ValueStandard Error
did 0.200790.0000.033
loan−0.000720.0000.0002
insurance−0.002270.2240.0018
investment0.001380.0000.0002
fin−0.160170.0540.0794
tech−0.001310.0000.0003−0.002150.0000.0003
bus−0.030840.1600.0213−0.62300.0140.0239
way3.01 × 10−60.0651.56 × 10−65.60 × 10−60.0001.17 × 10−6
chan0.281420.0980.16410.910070.0020.27333
Province-fixed effectsYESYES
Year-fixed effectsYESYES
Disclaimer/Publisher’s Note: The statements, opinions and data contained in all publications are solely those of the individual author(s) and contributor(s) and not of MDPI and/or the editor(s). MDPI and/or the editor(s) disclaim responsibility for any injury to people or property resulting from any ideas, methods, instructions or products referred to in the content.

